school elections campaign financing: an update
TRANSCRIPT

1
WHITE PAPER NO. 21
SCHOOL ELECTIONS CAMPAIGN FINANCING:
AN UPDATE
December, 2010
New Jersey Election Law Enforcement Commission
ElectionLaw
EnforcementCommission
LE EC
1973
NE W J E R S
YE

Located at: 28 W. State Street, 13th Floor, Trenton, New Jersey
ACKNOWLEDGEMENT
The Commissioners would like to thank the various staff members involved in this report, which
is the twenty-first white paper released by The New Jersey Election Law Enforcement Commission
(ELEC) over the past 22 years. This series has achieved international recognition and its contents often
have been cited in media reports, the political science literature, and studies issued by sister agencies.
Deputy Director Joseph W. Donohue is the author of White Paper No. 21, School Elections
Campaign Financing: An Update. The general editor of this white paper and the series is Executive
Director Jeffrey M. Brindle. Compliance Director Amy F. Davis also served as a proofreader.
Director of Information Technology Carol Neiman provided necessary data and helped with
proofreading, while Director of Finance and Administration Steven M. Dodson was the paper’s statistical
proofreader. Report coding and research was handled by Research Associate Steven Kimmelman.
Technical Assistant Bettie Michael retrieved several paper reports from ELEC archives. Administrative
Assistant Elbia L. Zeppetelli did her usual extraordinary job with graphics and formatting.
All 21 white papers are available on ELEC’s award-winning website at
http://www.elec.state.nj.us/aboutelec/whitepapers.htm.
Ele c ti on
L awE nfor ce m en tC om m iss ion
L
E EC
197 3
NE
W J E R SY
E
State of New Jersey
ELECTION LAW ENFORCEMENT COMMISSION
Respond to: P.O. Box 185
Trenton, New Jersey 08625-0185
(609) 292-8700 or Toll Free Within NJ 1-888-313-ELEC (3532)
Website: http://www.elec.state.nj.us/
RONALD DEFILIPPIS Chairman
WALTER F. TIMPONE
Vice Chairman
JERRY FITZGERALD ENGLISH Commissioner
AMOS C. SAUNDERS
Commissioner
JEFFREY M. BRINDLE Executive Director
JOSEPH W. DONOHUE
Deputy Director
CAROL L. HOEKJE Legal Director
AMY F. DAVIS
Compliance Director
JAMES P. WYSE Legal Counsel

TABLE OF CONTENTS
NEW JERSEY ELECTION LAW ENFORCEMENT COMMISSION Page i White Paper No. 21
PAGE NO. SUMMARY ............................................................................................................................................. 1 CHAPTER I. INTRODUCTION ........................................................................................................................ 2 CHAPTER II. SCHOOL ELECTION FINANCING: AN OVERVIEW............................................................ 5 CHAPTER III. SCHOOL ELECTION FUNDRAISING...................................................................................... 9 CHAPTER IV. HOW MONEY IS SPENT ON SCHOOL ELECTIONS ............................................................. 12 CHAPTER V. NJEA INVOLVEMENT IN LOCAL SCHOOL ELECTIONS.................................................... 15 CONCLUSION ........................................................................................................................................ 17

TABLE OF CONTENTS
NEW JERSEY ELECTION LAW ENFORCEMENT COMMISSION Page ii White Paper No. 21
TABLES PAGE NO. 1. A Decade Overview of School Election Fundraising and Spending ............................................ 5 2. Rate of Spending Accelerates During Second Half of Decade..................................................... 5 3. Comparison of Two Decades........................................................................................................ 6 4. Dollar Change in Annual Financial Activity between 2001 and 2009 ......................................... 7 5. Sources of Funding to 2009 School Elections .............................................................................. 9 6. A Comparison of Funding Sources to School Elections - 2009 and 1995.................................... 10 7. Comparison of Direct Mail Expenses ........................................................................................... 13 8. Comparison of Newspaper Advertising Expenses........................................................................ 14 9. Amount Provided by NJEA School Elections Committee and NJEA PAC to Local School Campaigns ......................................................................................................... 15

TABLE OF CONTENTS
NEW JERSEY ELECTION LAW ENFORCEMENT COMMISSION Page iii White Paper No. 21
FIGURES PAGE NO. 1. Percentage Change in Annual Financial Activity between 2001 and 2009 .................................. 7 2. Communications Spending as Percent of Combined School Election Spending for Years 2003, 2006 and 2009..................................................................................................... 12 3. Distribution of Communication Expenses .................................................................................... 14

SUMMARY
NEW JERSEY ELECTION LAW ENFORCEMENT COMMISSION Page 1 White Paper No. 21
Overall spending on local school elections during the past decade more than doubled to $9.6
million. It jumped 125 percent from the $4.3 million spent during the 1990s.
Annual spending from 2000 to 2009 averaged nearly $1 million compared to an average of
$427,123 from 1990 through 1999.
Since ELEC began tracking school election spending totals in 1986, the least spending took place
in 1992, when it totaled just $175,912. The most spending occurred in 2009, when $1,365,683
was invested in local school elections.
According to preliminary data, spending in 2010 elections totaled $555,423, the lowest since
1997. New Jersey Education Association, the largest single spender on school elections during
the past decade, so far reported its lowest outlay in at least 15 years- $114,692. At publication
time, the union had not yet issued a final report for its local election political committee, which
had a remaining balance of $792,787. Another factor that may have temporarily caused spending
on local school elections to drop sharply is a major shift in state education policy that could have
diverted away resources. By some accounts, NJEA spent heavily on a statewide ad campaign to
counter massive budget cuts and programmatic changes proposed by newly-elected Governor
Chris Christie. No such expenditures were reported by NJEA PAC, the union’s political action
committee for state elections. If the spending did occur, it could be reported as a communication
or grassroots lobbying expense by the union’s lobbyists in February, when annual lobbying
reports become available.
NJEA, already a powerhouse in state races through its NJEA PAC, also has emerged as a major
contributor to local school elections during the past decade through its NJEA School Elections
Committee. It spent $3.7 million during the decade- 36 percent of all spending on local school
elections.
An analysis of spending in years 2003, 2006 and 2009 found that direct mail remains, by far, the
largest outlay during school elections, followed by outdoor communications and election day
activities.

CHAPTER I
INTRODUCTION
NEW JERSEY ELECTION LAW ENFORCEMENT COMMISSION Page 2 White Paper No. 21
New Jersey school boards rarely have faced greater challenges. The Great Recession of 2008
triggered a series of political, budgetary and programmatic changes that jarred all 604 school districts in
2010. The shockwave is likely to be felt for many years to come.
This period of intense uncertainty has arrived at a time when local school elections already were
taking on increasing importance, at least when measured by the amount of funds being poured into them.
Between 1990 and 2000, total fundraising for school elections increased by 159 percent,
according to a white paper, or issue paper, released by ELEC in April 2002 entitled “School Board
Campaign Financing.” (White Paper 15 is available at http://www.elec.state.nj.us/pdffiles/whitepapers/
white15.pdf.)
This current analysis, which is considered an update to that report, found that total fundraising by
school elections rose 125 percent from 2000 through 2010 (see further analysis below). While that
increase is smaller than the previous decade, it occurred when other political fundraising in the state
actually fell sharply.
The increased interest in school elections is not surprising given the debate involving education.
In 2009, spending on New Jersey’s school system totaled $24.7 billion, according to the
Department of Community Affairs.1 About 35 percent of the latest state budget- $10.3 billion- helps
defray local school expenses. But, the lion’s share- about $12.8 billion- came from local property taxes.
With school spending the largest single item in a state budget that contained significant deficits, it
became the prime target during budget deliberations. The national recession caused a wrenching
reduction in state revenues in 2008 and 2009. That forced an unprecedented $820 million reduction in
state school aid for the fiscal year that began July 1, 2010.2 This reduction followed a mid-year cut of
$475 million announced in February.3

CHAPTER I - INTRODUCTION
NEW JERSEY ELECTION LAW ENFORCEMENT COMMISSION Page 3 White Paper No. 21
The combined budget reductions caused major ripples. Raises in contracts negotiated during
2010 averaged 2.03 percent- the lowest pay increase in more than 30 years, according to the New Jersey
School Boards Association.4 The combined budget reductions led to an estimated 11,000 school
employee early retirements and layoffs.5 A survey by the New Jersey School Boards Association found
that 81 percent of school officials said their districts would reduce teaching staffs.6 While it did not give a
break-down of school district job cuts, the Bureau of Labor Statistics found that the number of state and
local government jobs in the Garden State fell by nearly 26,000- about 4 percent- to 620,300 between
September 2009 and September 2010.7 Nationally, as many as 100,000 to 300,000 education jobs were at
risk across the nation.8
In April 2010, 222 of 538 local school budgets, or 41.3 percent, were approved by voters- the
lowest number since 1976.9
Confronted by harsh economic realities, newly-elected Governor Chris Christie arrived in office
last January intending to seek deep cuts in educational budgets and a massive overhaul of educational
programs. These include an expansion of charter schools, a proposal to tie teacher salaries to
performance, ending tenure for bad teachers, a 2.5 percent cap on property tax levies, cost savings from
health insurance and pension benefits givebacks in school districts, and a possible shift of school board
elections from April to November. At the time of this printing, most of these issues remain unresolved.
Further complicating the outlook for school districts was a lawsuit filed June 8 by the Education
Law Center of Newark to restore the more than $1 billion cut from the 2010 school budgets.
Marie Bilik, executive director of the New Jersey School Boards Association, aptly summed up
the situation that now envelops school districts. “This has been a year unlike any we’ve ever seen
before,’’ she said. 10
With rapid and dramatic changes sweeping through school districts throughout New Jersey, the
4,747 school board members statewide face unprecedented challenges. For that reason alone, school
elections will take on more importance in years to come. And if trends continue, funding of school
elections is likely to keep rising at a steady rate.

NOTES
NEW JERSEY ELECTION LAW ENFORCEMENT COMMISSION Page 4 White Paper No. 21
1. “2009 Property Tax and Statewide Spending Summary”-www.state.nj.us/dca/lgs/taxes/09_data/ 09taxsummary.htm.
2. Fiscal 2011 Budget in Brief, March 16, 2010, p. 71. 3. Governor’s Office press release, February 11, 2010, p. 2. 4. “Teacher Raises Falling to All-Time Low”- New Jersey School Boards Association, August 12,
2010. 5. “Schools Coping, in Spite of Steep Cuts” The Record, September 12, 2010. 6. “Schools to Reopen With Fewer Teachers, Larger Class Sizes”- New Jersey School Boards
Association, August 10, 2010. 7. “Employees on nonfarm payrolls by state and selected industry sector, seasonally adjusted”-
Bureau of Labor Statistics, October 22, 2010. 8. Nick Anderson, Washington Post, May 27, 2010. 9. “Voters Reject Most School Budgets”- New Jersey School Boards Association, April 22, 2010. 10. Rita Giordano, James Osborne and Maya Rao, The Philadelphia Inquirer, April 22, 2010, p. B4.

CHAPTER II
SCHOOL ELECTION FINANCING: AN OVERVIEW
NEW JERSEY ELECTION LAW ENFORCEMENT COMMISSION Page 5 White Paper No. 21
While 2010 was an exception, overall spending on school elections generally climbed during the
past decade. Three of the four highest spending years ever occurred during the past five years.
Table 1
A Decade Overview of School Election Fundraising and Spending
YEAR RAISED % CHANGE SPENT % CHANGE
2010* $ 1,382,774 -7% $ 555,423 -59%
2009 $ 1,481,435 2% $ 1,365,683 10%
2008 $ 1,446,691 1% $ 1,242,057 30%
2007 $ 1,429,301 -10% $ 952,667 -24%
2006 $ 1,594,909 22% $ 1,249,311 38%
2005 $ 1,307,126 -13% $ 906,521 -10%
2004 $ 1,503,464 19% $ 1,011,427 31%
2003 $ 1,265,900 20% $ 771,341 -15%
2002 $ 1,056,692 54% $ 909,700 56%
2001 $ 686,412 -9% $ 584,579 -7%
2000 $ 757,929 -2% $ 630,481 -17%
* Preliminary numbers Source: New Jersey Election Law Enforcement Commission
Spending from 2005 through 2009 averaged nearly $1.1 million- 46 percent higher than the
average for the previous half decade.
Table 2
Rate of Spending Accelerates During Second Half of Decade
PERIOD 5-YEAR AVERAGE DIFFERENCE
2005-2009 $ 1,143,248 46%
2000-2004 $ 781,506
While final numbers for 2010 still are not available, there was less reported spending in 2010 than
any time since 1997. However, the low number could be misleading.

CHAPTER II - SCHOOL ELECTION FINANCING: AN OVERVIEW
NEW JERSEY ELECTION LAW ENFORCEMENT COMMISSION Page 6 White Paper No. 21
New Jersey Education Association, a statewide school employees union and already a major
political powerhouse in state elections through its NJEA PAC, has been the largest single spender in
school elections during the past decade. Using its New Jersey Education Association School Elections
Committee, a political committee set up solely for participation on school elections, it reported spending
less than $115,000 in 2010 after spending a net annual average of nearly $354,402 the previous ten years.
It has been suggested that millions of dollars more have been spent on broadcasting advertising in 2010,
though union leaders maintain this figure is exaggerated. No one will know until the union files its
annual disclosure report on lobbying activities in February. Whatever the amount spent, some might
informally count those outlays in a tally of 2010 school election spending.
The increase in annual financial activity in school elections is even more stark when compared to
the previous decade. Between 2000 and 2009, more than $9.6 million was spent on school elections- 125
percent more than the $4.3 million spent during the previous decade. The decade long average was more
than twice the previous decade- $962,377 versus $427,123.
Table 3
Comparison of Two Decades
PERIOD 10-YEAR TOTAL 10-YEAR AVERAGE
2000-2009 $ 9,623,767 $ 962,377
1990-1999 $ 4,271,225 $ 427,123
It should be noted that compared to fundraising by candidates for such offices as governor,
legislator, or county executive, the financial activity of school board candidates is relatively meager.
However, the rate of increase in spending is fairly dramatic, particularly when compared to other
campaigns. One reason might be that while local boards of education are permitted to enact “pay-to-
play” restrictions for public contractors, only a handful have done so, according to the Department of
State.1
Annual fundraising for school elections was higher in 2010 than in 2005, when new pay-to-play
restrictions began taking effect. But fundraising by state and county political parties, which are subject to
the rules that can cap donations at $300 for many contractors, declined by roughly 30 percent over the
same period.

CHAPTER II - SCHOOL ELECTION FINANCING: AN OVERVIEW
NEW JERSEY ELECTION LAW ENFORCEMENT COMMISSION Page 7 White Paper No. 21
A comparison between 2001 and 2009 fundraising totals further reinforces this point.
Fundraising jumped by 116 percent for school board elections during that period. But fundraising rose
just 1 percent for Assembly candidates, while fundraising fell 78 percent by the Democratic State
Committee and dropped 64 percent for the Republican State Committee.
Table 4
Dollar Change in Annual Financial Activity between 2001 and 2009
School Elections RAISED DIFFERENCE SPENT DIFFERENCE
2009 $ 1,481,435 $ 795,023 $ 1,365,683 $ 780,804 2001 $ 686,412 116% $ 584,879 133%
Assembly 2009 $ 18,043,668 $ 191,154 $ 15,810,133 $ 1,406,901 2001 $ 17,852,514 1% $ 14,403,232 10%
Democratic State Committee 2009 $ 6,094,510 $ (22,094,558) $ 6,107,325 $ (22,510,070) 2001 $ 28,189,068 -78% $ 28,617,395 -79%
Republican State Committee 2009 $ 1,677,211 $ (3,041,897) $ 1,477,299 $ (3,860,681) 2001 $ 4,719,108 -64% $ 5,337,980 -72%
Source: New Jersey Election Law Enforcement Commission
Figure 1
Percentage Change in Annual Financial Activity between 2001 and 2009
-100
-50
0
50
100
150
Raised Spent
School Elections
Assembly
Democratic StateCommittee
Republican StateCommittee
Source: New Jersey Election Law Enforcement Commission

NOTES
NEW JERSEY ELECTION LAW ENFORCEMENT COMMISSION Page 8 White Paper No. 21
1. On 9/12/10, the department’s online list of local pay-to-play ordinances (See
www.state.nj.us/state/secretary/ordinance.html#1) listed only three school boards that had enacted
pay-to-play laws- Riverton, Downe Township and Barnegat Township.

CHAPTER III
SCHOOL ELECTION FUNDRAISING
NEW JERSEY ELECTION LAW ENFORCEMENT COMMISSION Page 9 White Paper No. 21
Sources of Contributions to School Elections
In 2009, the New Jersey Election Law Enforcement Commission, for the first time, began adding
donations to school elections to its online disclosure database. The database can be searched by the
public through its website (www.elec.state.nj.us). The first batch of data included more than $1 million in
donations to 2009 campaigns.
Table 5
Sources of Funding to 2009 School Elections
SOURCE OF FUNDING AMOUNT PERCENT OF TOTAL
Union $ 744,512 70.6% Individual $ 177,238 16.8%
Campaign Fund $ 51,015 4.8% Ideological PAC $ 39,765 3.8%
Business $ 17,116 1.6% Political Party Committee $ 15,562 1.5%
Business PAC $ 5,000 0.5% Miscellaneous $ 2,290 0.2%
Union PAC $ 2,250 0.2%
Grand Total $ 1,054,748 100%
Source: New Jersey Election Law Enforcement Commission
The largest source of funding was the New Jersey Education Association, which used its NJEA
School Elections Committee to funnel money into local elections. The $744,512 spent by the union on
2009 elections was the most ever.
Individuals were the second largest source of funding at $177,238 followed by campaign funds of
non-school elections at $51,015.

CHAPTER III - SCHOOL ELECTION FUNDRAISING
NEW JERSEY ELECTION LAW ENFORCEMENT COMMISSION Page 10 White Paper No. 21
While there is no directly comparable figures from past years, ELEC, in its previous white paper,
did analyze $492,043 from the top 10 school board races in 1995. The following chart compares the
sources of funding for the two years.
Table 6
A Comparison of Funding Sources to School Elections - 2009 and 1995
2009 1995
SOURCE OF FUNDING AMOUNT
PERCENT OF
TOTAL
SOURCE OF FUNDING AMOUNT
PERCENT OF
TOTAL Union $ 744,512 70.6% Union $ 308,050 62.6%
Individual $ 177,238 16.8% Individual $ 68,224 13.9%
Campaign Fund $ 51,015 4.8% Political Party Committee $ 62,815 12.8%
Ideological PAC $ 39,765 3.8% Business $ 38,456 7.7% Business $ 17,116 1.6% Campaign Fund $ 13,098 2.7%
Political Party Committee $ 15,562 1.5% Political
Committee $ 1,400 0.3%
Business PAC $ 5,000 0.5% Miscellaneous $ 2,290 0.2%
Union PAC $ 2,250 0.2%
Grand Total* $ 1,054,748 100% $ 492,043 100%
What this shows is the two main sources- unions and individuals- continued to rank one and two,
respectively.
One noticeable shift in fundraising is that political party committees now give significantly less,
both monetarily and on a percentage basis. One of the points made by the previous white paper was the
surge in political party support for school board candidates during the previous decade.
This trend seems to have reversed. Donations dropped from $62,815 (12.8 percent) in 1995, to
$15,562 (1.5 percent) in 2009, most likely due to shrinking coffers related to “pay-to-play” restrictions
now applied to many public contractors. Donations from campaign accounts of non-school board
members to school board candidates did increase from $13,098 in 1995 to $51,015 in 2009. On a
percentage basis, the share grew from 2.7 percent to 4.8 percent. But even if political party and campaign

CHAPTER III - SCHOOL ELECTION FUNDRAISING
NEW JERSEY ELECTION LAW ENFORCEMENT COMMISSION Page 11 White Paper No. 21
funds are lumped together as “partisan” sources of campaign cash, the overall share dropped from 15.5
percent in 1995 to 6.3 percent in 2009.
One caveat should be noted. Ideological political action committees (PACs), with names such as
Committee for Quality Government PAC and Hackensack PAC, have become a new source of
contributions for school board candidates. They gave $39,765 to candidates in 2009- 3.8 percent of their
total. In 1995, they gave nothing.
These types of PACs generally are used to promote ideological positions rather than promote
political party agendas. However, in recent years, ELEC has noticed that some of these PACs appear to
be mere extensions of local parties. The Commission, in a bipartisan vote, has recommended legislation
that would require more people to register when PACs are formed- perhaps as many as nine versus the
current requirement for at least two. The Federal Election Commission uses a similar requirement to
discourage partisan manipulation of special interest PACs.
It is not clear whether any of the ideological PACs who gave in 2009 are affiliated with a local
party. But even if one assumed all the ideological PAC money was controlled by partisan interests,
partisan giving, on a percentage basis, still would be down from 1995- 10.1 percent versus 15.8 percent.
Despite the falloff, partisan giving still remains higher than in 1990, when less than 4 percent came from
partisan coffers.
The comparison of the two years also shows donations by businesses are lower, perhaps because
of the economic downturn. Businesses gave $38,456 in 1995- 7.7 percent of the total. By contrast, they
gave $22,116 in 2009- just 2.1 percent.

CHAPTER IV
HOW MONEY IS SPENT ON SCHOOL ELECTIONS
NEW JERSEY ELECTION LAW ENFORCEMENT COMMISSION Page 12 White Paper No. 21
As mentioned earlier in this white paper, spending on school elections increased dramatically
during the past decade compared to the previous 10-year period. Total spending more than doubled from
$4.3 million from 1990 through 1999 to $9.6 million from 2000 through 2009. The 10-year average also
doubled from $427,123 to $962,377 for each decade, respectively.
For insight into how school board candidates and the NJEA spend their money, a detailed
analysis of expenditures was performed for three years- 2003, 2006 and 2009. The previous research
report, “School Board Campaign Financing,” was limited to data from just the top ten school board
contests in each year. The analysis includes all expenditures for the three years examined closely.
Data from the latest decade shows that despite significantly more spending, one trend has held
firm since the last decade- the cost of communications remains the major area of expense for candidates.
All expenditure data from the three years (2003, 2006 and 2009) was reviewed and combined for
analytical purposes. It shows candidates spent nearly $1.6 million on communications- 70 percent of
their total outlays during those three years. Other expenses totaled $715,161, or 30 percent.
Figure 2Communications Spending as Percent of Combined School
Election Spending for Years 2003, 2006 and 2009
70%
30%
Communications Other

CHAPTER IV - HOW MONEY IS SPENT ON SCHOOL ELECTIONS
NEW JERSEY ELECTION LAW ENFORCEMENT COMMISSION Page 13 White Paper No. 21
Communications include direct mail, outdoor communications, newspaper advertisements, cable
television, internet, radio and network television. Other expenses include election day activities,
fundraising, consultants, administration, polling and entertainment.
In an analysis of combined outlays for 1990, 1995 and 2000, the previous white paper found that
communications comprised 72 percent of total spending. So communications costs have remained
roughly the same throughout the past two decades- 72 percent during the 1990s to 70 percent more
recently.
One interesting trend involves direct mail. Despite dramatic technological advances in media,
direct mail remains the single largest method of communicating to voters for school board candidates. In
fact, it appears to have become more important than in the past.
It represented about 40 percent of all communications expenses, and 29 percent of total expenses
during the previous decade. By comparison, it represented 79 percent of all communications during the
more recent decade, and 55 percent of all expenditures.
Table 7
Comparison of Direct Mail Expenses
COMBINED DIRECT MAIL EXPENSES FOR YEARS:
AMOUNT % OF COMMUNICATIONS
EXPENSES
% OF TOTAL
EXPENSES
1990/1995/2000 $ 304,535 40% 29%
2003/2006/2009 $ 1,292,685 79% 55%
One caveat- the figure for the 1990s was based on only the top ten school board elections, not all
elections. Therefore, a direct comparison may be unreliable.
Another large change was seen in expenditures on newspapers. During the 1990s, before
newspapers began losing a significant portion of their advertising to the Internet, newspaper advertising
was a major component of campaign spending by school board candidates. During the 1990s, it
amounted to 34 percent of all communications expenses, and 25 percent of total expenses.
CHAPTER IV - HOW MONEY IS SPENT ON SCHOOL ELECTIONS
NEW JERSEY ELECTION LAW ENFORCEMENT COMMISSION Page 14 White Paper No. 21
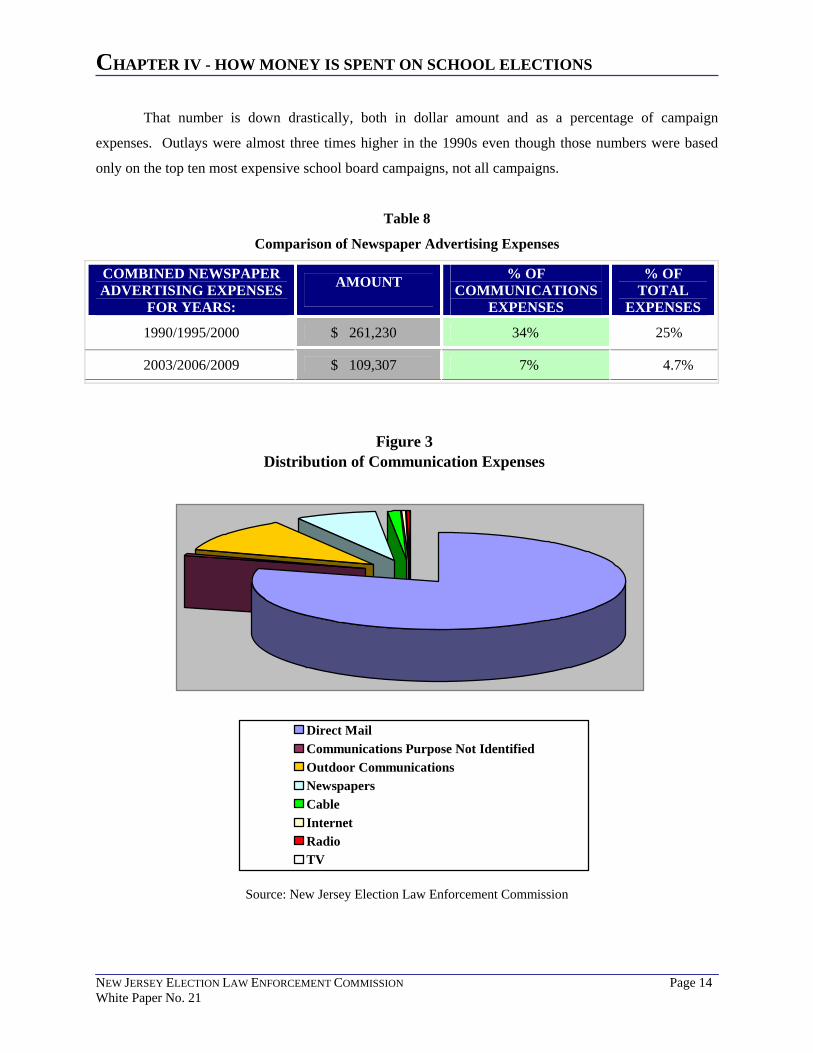
That number is down drastically, both in dollar amount and as a percentage of campaign
expenses. Outlays were almost three times higher in the 1990s even though those numbers were based
only on the top ten most expensive school board campaigns, not all campaigns.
Table 8
Comparison of Newspaper Advertising Expenses
COMBINED NEWSPAPER ADVERTISING EXPENSES
FOR YEARS:
AMOUNT % OF COMMUNICATIONS
EXPENSES
% OF TOTAL
EXPENSES
1990/1995/2000 $ 261,230 34% 25%
2003/2006/2009 $ 109,307 7% 4.7%
Figure 3Distribution of Communication Expenses
Direct MailCommunications Purpose Not IdentifiedOutdoor CommunicationsNewspapersCableInternetRadioTV
Source: New Jersey Election Law Enforcement Commission

CHAPTER V
NJEA INVOLVEMENT IN LOCAL SCHOOL ELECTIONS
NEW JERSEY ELECTION LAW ENFORCEMENT COMMISSION Page 15 White Paper No. 21
If there is one dominant trend during the past decade in terms of school elections, it is the
growing clout of the New Jersey Education Association (NJEA). For decades, NJEA, a statewide union
that represents nearly 204,000 active and retired school employees, has been a potent political force in the
state capitol.
The union participates in state campaigns primarily through its NJEA PAC. In 2009, for instance,
the PAC spent $1.13 million on gubernatorial and legislative elections, according to quarterly reports filed
with ELEC. Only one other group, the NJ State Laborers PAC, spent more.
In addition to the state PAC, the school employees union also spent $744,512 through its NJEA
School Elections Committee. It is a political committee formed to support “passage of school budgets,”
according to identifying forms filed with ELEC. NJEA has operated a local school elections committee
during the entire decade. During that time, the committee funneled $3.6 million to local school elections.
Another $58,194 was channeled through the NJEA PAC to campaigns.
Table 9
Amount Provided by NJEA School Elections Committee
and NJEA PAC to Local School Campaigns
YEAR FUNDS TO LOCAL
SCHOOL ELECTIONS
PERCENT OF TOTAL SPENDING
2010 $ 114,692 21% 2009 $ 744,512 55% 2008 $ 504,798 41% 2007 $ 276,188 29% 2006 $ 378,099 30% 2005 $ 340,364 38% 2004 $ 203,125 20% 2003 $ 228,123 30% 2002 $ 524,414 58% 2001 $ 189,239 32% 2000 $ 155,160 25%
Totals $ 3,658,714 36%

CHAPTER V - NJEA INVOLVEMENT IN LOCAL SCHOOL ELECTIONS
NEW JERSEY ELECTION LAW ENFORCEMENT COMMISSION Page 16 White Paper No. 21
The NJEA committee’s prime purpose is to promote school budgets through various means
typically used in all campaigns, including advertisements and mailers.
It does not make direct donations to school board candidates. Under the New Jersey School
Ethics Act, no school official may “solicit or accept” things of value, including contributions, “given or
offered for the purpose of influencing him, directly or indirectly, in the discharge of his official duties.’’
However, NJEA, acting independently, does endorse school board candidates and urges their
election through phone banks, mailers and other means.
The School Ethics Commission has ruled that if those endorsements occur near negotiations
involving a new collective bargaining agreement, the school board members cannot take part in those
negotiations or vote on the contract.
NJEA accounted for 36 percent of all spending for school elections in the decade, with annual
averages ranging from 20 percent to 58 percent.
The total amount was about triple the estimated amount the union gave in the 1990s. In the
previous decade, the union channeled its financial resources through the NJEA School Elections
Committee in 1999 and through the NJEA School Budgets Committee between 1995 and 1998. For the
five years between 1995 and 1999, the political committee sent more than $1.1 million to local school
campaigns. The author could find no campaign finance reports indicating other major donations before
1995.
The $114,692 reported in spending for 2010 is a major drop-off from recent years and seems
unusual in a year when NJEA was locked in a debate over state budget cuts. However, the number is
preliminary since the union has not yet submitted its final report for 2010 and reported a balance of
$792,787 earlier in the year. Along with the small amount of spending by the NJEA School Elections
Committee in 2010, reports filed with ELEC show NJEA PAC outlays totaling $299,189 during the first
nine months. This amount is not unusual for one of the state’s largest PACs.
These totals may reflect a redeployment of resources by the union for 2010. What may not be
indicated is any communications to its members, or grassroots lobbying done by the union’s lobbyists-
that is, a direct appeal to the public involving legislation or regulations. For instance, if the union did
indeed spend large sums on ads to oppose the governor’s proposed budget bill, its spending would not be
disclosed until the release of NJEA’s annual lobbying reports in February 2011.

CONCLUSION
NEW JERSEY ELECTION LAW ENFORCEMENT COMMISSION Page 17 White Paper No. 21
This report represents an update to a white paper released by ELEC in April 2002 entitled
“School Board Campaign Financing.” (White Paper 15 is available at http://www.elec.state.nj.
us/pdffiles/whitepapers/ white15.pdf.)
The original report was the first-ever analysis of school election financing trends. It found that
while spending on school elections was small dollar-wise compared to other types of campaigns, it was
rising at a much faster rate than other types of elections. Between 1990 and 2000, total fundraising for
school elections increased by 159 percent.
The current report found while the rate of growth in school election spending slowed slightly
(125 percent increase during the past decade compared to 159 percent a decade earlier), it continued to
grow at a rapid pace.
In fact, between decades, overall spending on local school elections more than doubled from $4.3
million to $9.6 million.
The trend is especially impressive given the fact that spending is flat or down in other types of
campaigns in the state. For instance, fundraising by State Assembly candidates in 2009 was 26 percent
below fundraising levels in 2005. State and county parties have experienced an even greater falloff.
Jeff Brindle, ELEC’s Executive Director, believes the decline is attributable to the recession
coupled with pay-to-play restrictions that impose strict limits on donations that public contractors can
make too many fundraising committees.
The initial white paper also found that the trend in the 1990s was driven by increased partisan
interest in school elections. That trend appears to have reversed.
Donations by political party committees dropped from $62,815 (12.8 percent) in 1995 to $15,562
(1.5 percent) in 2009. Even when donations from campaign accounts of non-school board members are
lumped together as “partisan” sources of campaign cash, the overall share from partisan sources dropped
from 15.5 percent in 1995 to 6.3 percent in 2009.

CONCLUSION
NEW JERSEY ELECTION LAW ENFORCEMENT COMMISSION Page 18 White Paper No. 21
At the same time, donations by unions and individuals grew from a combined 76.5 percent in
1995 to 87.4 percent. Unions remained the biggest source of campaign funds, surging from 62.6 percent
15 years ago to 70.6 percent in 2009.
The increase in union funding largely was due to an increase in financial activity by the New
Jersey Education Association. It spent $3.7 million during the past decade- 36 percent of all spending on
local school elections. No other single source of contributions was larger.
One pattern that remained unchanged between the decades- communications still are the single
largest area of expense. Communications, which include direct mail, outdoor communications,
newspaper advertisements, cable television, internet, radio and network television, accounted for 72
percent of outlays in the 1990s versus 70 percent in the last decade.
Among specific categories, direct mail remained the largest type of expense and, in fact, has
become even more so in recent years. It represented 40 percent of all communications expenses in the
1990s, or 29 percent of total expenses. By comparison, during the most recent decade, it totaled 79
percent of all communications expenses, or 55 percent of total expenses.

PREVIOUS WHITE PAPERS
NEW JERSEY ELECTION LAW ENFORCEMENT COMMISSION Page 19 White Paper No. 21
Number One: Contribution Limits and Prohibited Contributions (1988)
Number Two: Trends in Legislative Campaign Financing: 1977-1987 (1989)
Number Three: Legislative Public Financing (1989)
Number Four: Ideas for an Alternate Funding Source (1989)
Number Five: Lobbying Reform (1990)
Number Six: Autonomy and Jurisdiction (1991)
Number Seven: Is There a PAC Plague in New Jersey? (1991)
Number Eight: Technology in The Future: Strengthening Disclosure (1992)
Number Nine: Legislative Candidates: How They Spend their Money (1994)
Number Ten: Nonconnected, Ideological PACs in the Garden State (1995)
Number Eleven: State Parties And Legislative Leadership Committees: An Analysis
1994-1995 (1996)
Number Twelve: Repartyization: The Rebirth of County Organizations (1997)
Number Thirteen: Trends in Legislative Campaign Financing: 1987-1997 2nd
Volume (1999)
Number Fourteen: Local Campaign Financing (2000)
Number Fifteen: School Board Campaign Financing (2002)
Number Sixteen: A Resurgent Party System: Repartyization Takes Hold (2003)
Number Seventeen: Legislative Election 2003: The Rise of Party-Oriented Campaigning (2004)
Number Eighteen: Local Campaign Financing: An Analysis of Trends in Communities Large and
Small (2005)
Number Nineteen: The 2005 Assembly Election: New Trends On The Horizon? (2006)
Number Twenty: Legislative General Elections 2007: An Analysis Of Trends In State Senate And
Assembly Elections (2009)