school district of logan township logan … · families of our community as well as to the school...
TRANSCRIPT

SCHOOL DISTRICT OF LOGAN TOWNSHIP
Logan Township, New JerseyCounty of Gloucester
COMPREHENSIVE ANNUAL FINANCIAL REPORTFOR THE FISCAL YEAR ENDED JUNE 30, 2014
LOGAN BOARD OF EDUCATION

Logan Township Board of EducationBusiness Office
COMPREHENSIVE ANNUAL FINANCIAL REPORT
OF THE
LOGAN TOWNSHIP BOARD OF EDUCATION
LOGAN TOWNSHIP, NEW JERSEY
FOR THE FISCAL YEAR ENDED JUNE 30, 2014
Prepared by

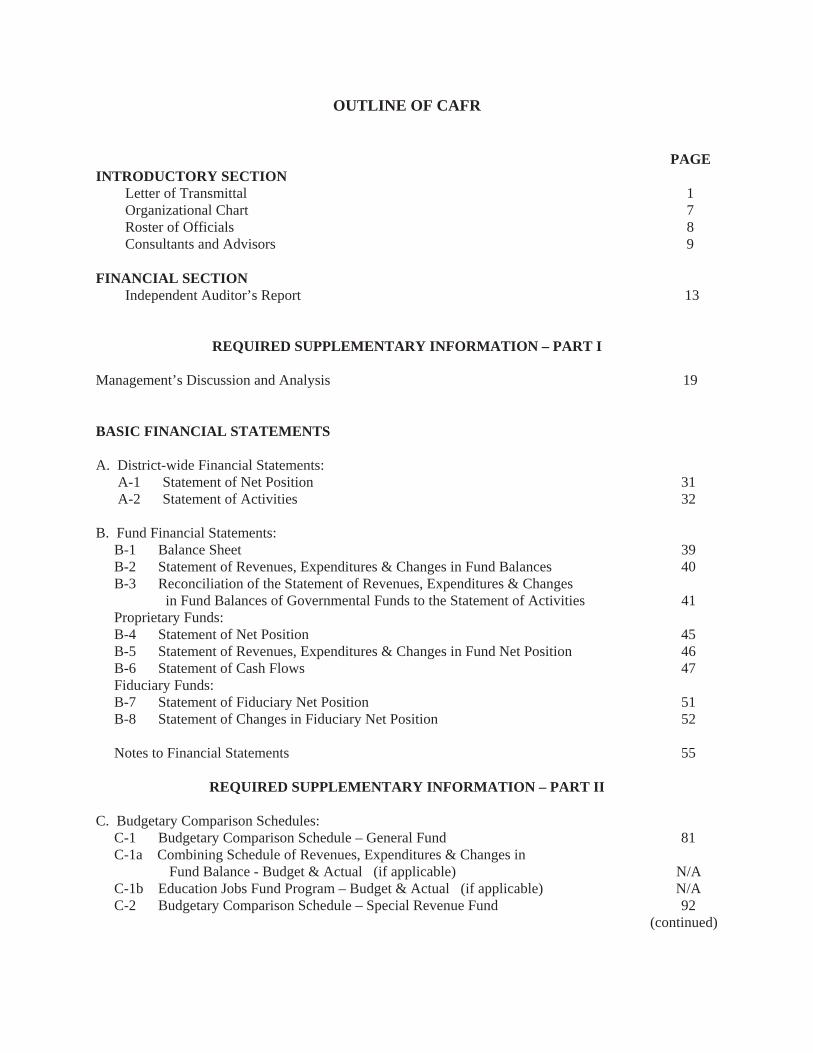
OUTLINE OF CAFR
PAGEINTRODUCTORY SECTION Letter of Transmittal 1 Organizational Chart 7 Roster of Officials 8 Consultants and Advisors 9
FINANCIAL SECTION Independent Auditor’s Report 13
REQUIRED SUPPLEMENTARY INFORMATION – PART I
Management’s Discussion and Analysis 19
BASIC FINANCIAL STATEMENTS
A. District-wide Financial Statements: A-1 Statement of Net Position 31 A-2 Statement of Activities 32
B. Fund Financial Statements: B-1 Balance Sheet 39 B-2 Statement of Revenues, Expenditures & Changes in Fund Balances 40 B-3 Reconciliation of the Statement of Revenues, Expenditures & Changes in Fund Balances of Governmental Funds to the Statement of Activities 41 Proprietary Funds: B-4 Statement of Net Position 45 B-5 Statement of Revenues, Expenditures & Changes in Fund Net Position 46 B-6 Statement of Cash Flows 47 Fiduciary Funds: B-7 Statement of Fiduciary Net Position 51 B-8 Statement of Changes in Fiduciary Net Position 52
Notes to Financial Statements 55
REQUIRED SUPPLEMENTARY INFORMATION – PART II
C. Budgetary Comparison Schedules: C-1 Budgetary Comparison Schedule – General Fund 81 C-1a Combining Schedule of Revenues, Expenditures & Changes in Fund Balance - Budget & Actual (if applicable) N/A C-1b Education Jobs Fund Program – Budget & Actual (if applicable) N/A C-2 Budgetary Comparison Schedule – Special Revenue Fund 92
(continued)

OUTLINE OF CAFR (continued):
PAGENotes to the Required Supplementary Information: C-3 Budget-to-GAAP Reconciliation 95
D. School Based Budget Schedules Fund (if applicable): D-1 Combining Balance Sheet N/A D-2 Blended Resource Fund - Schedule of Expenditures Allocated by Resource Type - Actual N/A D-3 Blended Resource Fund - Schedule of Blended Expenditures - Budget and Actual N/A
E. Special Revenue Fund: E-1 Combining Schedule of Revenues & Expenditures Special Revenue Fund – Budgetary Basis 103 E-2 Preschool Education Aid Schedule(s) of Expenditures - Budgetary Basis 106
F. Capital Projects Fund: F-1 Summary Schedule of Project Expenditures 109 F-2 Summary Schedule of Revenues, Expenditures and Changes in Fund Balance – Budgetary Basis 110 F-2a Schedule of Revenues, Expenditures Project Balance & Project Status – Cooling Tower for HVAC 111
G. Proprietary Funds: Enterprise Fund: G-1 Combining Schedule of Net Position N/A G-2 Combining Schedule of Revenues, Expenses & Changes in in Fund Net Position N/A G-3 Combining Schedule of Cash Flows N/A Internal Service Fund – G-4 Combining Schedule of Net Position N/A G-5 Combining Schedule of Revenues, Expenses & Changes in Fund Net Position N/A G-6 Combining Schedule of Cash Flows N/A
H. Fiduciary Funds: H-1 Combining Statement of Fiduciary Net Position 121 H-2 Combining Statement of Changes in Fiduciary Net Position 122 H-3 Student Activity Agency Fund Schedule of Receipts & Disbursements 123 H-4 Payroll Agency Fund Schedule of Receipts & Disbursements 123
I. Long-Term Debt: I-1 Schedule of Serial Bonds 127 I-2 Schedule of Obligations Under Capital Leases 128 I-3 Debt Service Fund Budgetary Comparison Statement 129 (continued)

OUTLINE OF CAFR (continued):
STATISTICAL SECTION (unaudited) PAGE
Financial Trends: J-1 Net Position by Component 133 J-2 Changes in Net Position 134 J-3 Fund Balances – Governmental Funds 137 J-4 Changes in Fund Balances – Governmental Funds 138 J-5 General Fund Other Local Revenue by Source 140
Revenue Capacity: J-6 Assessed Value & Estimated Actual Value of Taxable Property 141 J-7 Direct & Overlapping Property Tax Rates 142 J-8 Principal Property Taxpayers 143 J-9 Property Tax Levies & Collections 144
Debt Capacity: J-10 Ratios of Outstanding Debt by Type 145 J-11 Ratios of General Bonded Debt Outstanding 146 J-12 Direct & Overlapping Governmental Activities Debt 146 J-13 Legal Debt Margin Information 147
Demographic & Economic Information: J-14 Demographic & Economic Statistics 148 J-15 Principal Employers 149
Operating Information: J-16 Full-Time Equivalent District Employees by Function/Program 150 J-17 Operating Statistics 151 J-18 School Building Information 152 J-19 Schedule of Required Maintenance 153 J-20 Insurance Schedule 154
K SINGLE AUDIT SECTION
K-1 Independent Auditor’s Report on Compliance and on Internal Control Over Financial Reporting Based on an Audit of Financial Statements Performed in Accordance With Government Auditing Standards 157 K-2 Independent Auditor’s Report on Compliance with Requirements Applicable to Each Major Program and on Internal Control Over Compliance in Accordance with OMB Circular A-133 and New Jersey OMB Circular Letter 04-04 159 K-3 Schedule of Expenditures of Federal Awards, Schedule A (See Additional Information) K-4 Schedule of Expenditures of State Financial Assistance, Schedule B 163 K-5 Notes to Schedules of Awards and Financial Assistance 165 K-6 Schedule of Findings and Questioned Costs 167 K-7 Summary Schedule of Prior Audit Findings 169
(concluded)

This page intentionally left blank

INTRODUCTORY SECTION

This page intentionally left blank.

Logan Township School District
110 School Lane Logan Township, NJ 08085
Patricia L. Haney Janine M. Wechter, CPA Superintendent School Business Administrator [email protected] [email protected](856) 467-5133, Ext. 510 (856) 467-5133, Ext. 307 (856) 467-9012 Fax (856) 241-1426 Fax
November 17, 2014
Honorable President and Members of the Board of Education Logan Township School District County of Gloucester Logan Township, New Jersey
Dear Board Members:
The comprehensive annual financial report of the Logan Township School District (District) for fiscal year ending June 30, 2014, is hereby submitted. Responsibility for both the accuracy of the data and the completeness and fairness of the presentation, including all disclosures, rests with the Business Office of the Board of Education (Board). To the best of our knowledge and belief, the data presented in this report are accurate in all material respects and are reported in a manner designed to present fairly the financial position and results of operations of the various funds and account groups of the District. All disclosures necessary to enable the reader to gain an understanding of the District's financial activities have been included.
The comprehensive annual financial report is presented in four sections: introductory, financial, statistical, and single audit. The introductory section includes this transmittal letter, the District's organizational chart, and a list of principal officials. The financial section includes the basic financial statements and schedules, as well as the auditor's report thereon. The statistical section includes selected financial and demographic information, generally presented on a multi-year basis. The District is required to undergo an annual single audit in conformity with the provisions of the Single Audit Act of 1984 as amended in 1996 and the U.S. Office of Management and Budget Circular A-133, "Audits of State and Local Governments", and the state Treasury Circular Letter 04-04, "Single Audit Policy for Recipients of Federal Grants, State Grants, and State Aid Payments". Information related to this single audit, including the auditor's report on the internal control structure and compliance with applicable laws and regulations and findings and recommendations, are included in the single audit section of this report.
1. Reporting Entity and Its Services
Logan Township School District is an independent reporting entity within the criteria adopted by the GASB as established by GASB Statement No. 14. All funds and account groups of the District are included in this report. The Logan Township School District is a Pre-K - 12 School District operating 2 school buildings (an Early Childhood Educational Center serving grades Pre-Kindergarten to 1; an Elementary School serving grades 2 to 5 and a Middle School serving grades 6 to 8) while maintaining a sending relationship with the near-by Kingsway Regional High School District to accept students grades 9 to 12 on a tuition basis. Each school has its own school principal who serves as an instructional leader to staff and students.

The District provides a full range of educational services appropriate to grade levels Pre-K through 8. These services include regular, as well as special education for gifted and handicapped students. The District completed the 2013-2014 fiscal year with an enrollment of 838.9 in-house elementary students. Continuation of the expanded preschool program in the future has been dependent on parent tuition and the District investment. Each year, we have been thankful that the Board of Education has continued to partially support the Pre-Kindergarten program which allows more at-risk Pre-Kindergarten students to be educated in an inclusive environment. The following details the changes in the student enrollment of the District over the last five years. Average Daily Enrollment
Fiscal Year Student Enrollment Percent Change 2013-14 838.9 0.08% 2012-13 838.2 (4.66%) 2011-12 879.0 0.56% 2010-11 874.1 (3.23%)
2009-10 903.3 0.40% In summary, student enrollment seems to be holding steady for the past two academic years, after a larger-than average eighth grade class graduated in 2012.
2. Economic Condition and Outlook
Three large industrial parks are located in Logan Township. The Logistic Center at Logan comprises 1,100 acres and the Pureland Industrial Complex covers 3,000 acres. The third industrial park, the Commodore Business Center, is located along the Rt. 322 industrial corridor partially in Logan Township and partially in adjacent Woolwich Township. Pureland Industrial Park is the largest industrial park in the state and has been hailed as the top "ultra-successful" business park in the U.S. according to Site Selection magazine. The Logan Township population has increased from 3,078 in 1980 to 6,013 in 2014. However, the staggering fiscal woes in the State of New Jersey coupled with the recession plaguing the country since 2008 has led to decreasing state aid as well as contracting property values and tax ratables. Increasing unemployment, property taxes, and the cost of living correlate to a higher burden on school districts to provide the accustomed services with diminishing resources and increases number of students who qualify for free or reduced lunch. These combined forces are applying increased pressure on the District to practice fiscal discipline while maintaining a quality education to more at-risk students.
For the 2013-14 school year, a re-valuation of the Township’s property was completed and is reflected below. It is important to note that while the ratables increase, the tax rate drops due the fact that the amount the municipality must raise is not changing. The new assessments are simply a foundation used to apportion the tax burden among taxpayers. Therefore, while a revaluation usually means an increase in each assessment, it does mean that taxes will increase for each individual taxpayer.
2010 - $618,309,615 2011 - $614,511,988 2012 - $614,301,549 2013 - $1,048,993,089 2014 - $1,045,919,769
It is important to note here that the increasing unemployment correlates an increase on the burden to the families of our community as well as to the school district which is reflected by the 188% increase of low-income students over the past nine years. (See chart below)

Percentage of Population Fiscal Year Total Free & Reduced Which is Free & Reduced 2014-15 167 19.9% 2013-14 178 21.0% 2012-13 172 20.5% 2011-12 177 20.5% 2010-11 153 17.6%
2009-10 141 15.6% 2008-09 127 14.1% 2007-08 116 13.2% 2006-07 99 10.6%
3. Major Initiatives
Logan Township is an innovative school district which places a priority on excellence. To this end, technology tools are used to enhance student learning. Our District has a one-on-one laptop initiative for our 5th to 8th grade students. In addition to this, the number of computers in the district exceeds the number of students in our District. (This is due to the fact that all secretaries and Administrators have computers and the district houses two computer labs.) All students in grades 1 to 7 have regular World Language (Spanish and Italian) instruction. Eighth grade students have the option to take a full year of Spanish I or Italian I, if they meet certain academic criteria. Eighth grade students who meet district criteria in math may study Algebra I. Technology Education (S.T.E.M./Science, Technology, Engineering and Mathematics) is provided for all students in grades 3 to 8. A pre-engineering class is offered before school to seventh and eighth grade students who meet district criteria. After school programs and clubs provide opportunities to participate in drama, gardening, athletics, and many other extra-curricular areas. Performing Arts activities provide opportunities for students to share their particular talent. As our schools are centered in a culturally diverse community, our faculty is dedicated to providing programs that feature a variety of world cultures and concepts.
The District strives to remain on the cutting edge in the area of technology in order that our students have the proper technological skills that are required in the 21st century workplace environment. The Three-Year Technology Plan for 2013 to 2016 has a strong emphasis on using technology for innovation, integration and data-driven academic interventions. Logan Township School District is committed to providing an infrastructure which can support the ever-growing use of and need for technology to increase effectiveness and efficiency.
The District continues to be a leader in pre-school education. A State grant has been used over the past eight years to serve the at-risk population. Several years ago, the District was able to utilize ARRA Federal Stimulus Funds to expand the pre-school program to provide a more inclusive educational environment. Continuation of the pre-school program in the future continues to be dependent on the on-going commitment of the Board of Education, on State pre-school aid and or tuition from parents.
The District continues to be proactive in addressing building maintenance issues. Many components of the Five-Year Facility Maintenance Plan have been addressed. These include upgrades to the security cameras to include new placements in corridors and additional placements around the exterior of the Logan Schools building and Center Square School. Energy-cost savings initiatives including changes to the lighting in several large group areas and in the halls have been completed. The District was successful in their application for four R.O.D. (Regular Operating District) Grants which, include replacing Logan School’s cooling tower (completed in the Fall 2014) in anticipation of adding an HVAC cooling system to the gym and replacing the boiler and exterior doors at the Logan Schools building.
District curricula are once again being re-aligned to the latest state’s Core Curriculum Content Standards and to the Common Core Standards for ELA and Mathematics. A continuous upgrading of instructional resources and teacher training, provided the Supervisor of Curriculum and the three principals, help focus the teaching and learning on the State’s Core Curriculum Standards. The district’s staff worked closely with administration to ensure they are meeting state deadlines for curriculum alignment in all areas and are

increasing the rigor of each curriculum in order to meet the demands from the Common Core Standards. Focus continues to be on implementing the Marzano Causal Framework for Teaching and Learning which is the foundation of the Marzano Teacher and Principal Evaluation Systems. Training in the Marzano evaluation model has been the focus of professional development for the district and will continue to be the focus for many years to come. Focus on continued professional learning in the always changing technology area is also a high priority.
Professional development is carefully planned and executed. A professional development plan for each school is prepared and followed annually in accordance with state regulations. In addition, a comprehensive mentor plan outlines services and support provided to teachers new to the profession. Both of these plans have been created with input from each school’s SCIP (School Improvement Panel).
4. Internal Accounting Controls
The District Business Administrator is responsible for establishing and maintaining an internal control structure designed to ensure that the assets of the District are protected from loss, theft or misuse, and to ensure that adequate accounting data are compiled to allow for the preparation of financialstatements in conformity with generally accepted accounting principles (GAAP). The internal control structure is designed to provide reasonable, but not absolute, assurance that these objectives are met. The concept of reasonable assurance recognizes that: (1) the cost of a control should not exceed the benefits likely to be derived; and (2) the valuation of costs and benefits requires estimates and judgments by management.
As a recipient of federal and state financial assistance, the District also is responsible for ensuring that an adequate internal control structure is in place to ensure compliance with applicable laws and regulations related to those programs. This internal control structure is also subject to periodic evaluation by the District management.
As part of the District's single audit, described earlier, tests are made to determine the adequacy of the internal control structure, including that portion related to federal and state financial assistance programs, as well as to determine that the District has complied with applicable laws and regulations.
5. Budgetary Controls
In addition to internal accounting controls, the District maintains budgetary controls. The objective of these budgetary controls is to ensure compliance with legal provisions embodied in the annual appropriated budget approved by the Board. Annual appropriated budgets are adopted for the general fund, the special revenue fund, and the debt service fund. Project-length budgets are approved for the capital improvements accounted for in the capital projects fund. The final budget amount as amended for the fiscal year is reflected in the financial section.
An encumbrance accounting system is used to record outstanding purchase commitments on a line item basis. Open encumbrances at year-end are either canceled or are included as reappropriations of fund balance in the subsequent year. Those amounts to be reappropriated are reported as reservations of fund balance at June 30, 2014.
6. Accounting System and Reports
The District's accounting records reflect generally accepted accounting principles, as promulgated by the Governmental Accounting Standards Board (GASB). The accounting system of the District is organized on the basis of funds and account groups. These funds and account groups are explained in "Notes to the Financial Statements", Note 1.

7. Financial Information at Fiscal Year-End
As demonstrated by the various statements and schedules included in the financial section of this report, the District continues to meet its responsibility for sound financial management. The following schedule presents a summary of the general fund, special revenue fund, capital projects fund and debt service fund revenues for the fiscal year ended June 30, 2014, and the amount and percentage of increases and decreases in relation to the prior year's revenues:
Increase Percent of Percent of (Decrease) Increase Revenues Amount Total From 2012 (Decrease)
Local sources $ 12,487,122 62.92 $ 193,181 1.57 State sources 6,986,360 35.21 (123,949) (1.74) Federal sources 371,007 1.87 22,430 6.43
Total $ 19,844,489 100.00 $91,662 0.46
The following schedule presents a summary of general fund, special revenue fund, capital projects fund and debt service fund expenditures for the fiscal year ended June 30, 2014, and the amount and percentage of increases and decreases in relation to the prior year's expenditures: Increase Percent of Percent of (Decrease) Increase Expenditures Amount Total From 2013 (Decrease)
Current expense: Instruction $ 5,892,690 29.74 $ 35,480 0.61 Undistributed expenditures 11,806,686 59.60 481,760 4.25 Capital outlay 321,004 1.62 11,823 3.82 Special revenue: Federal 371,850 1.88 21,687 6.43 State 50,457 0.25 9,743 23.93 Capital Projects: 77,758 0.39 77,758 100.00 Debt service: Principal 1,160,000 5.86 (5,000) (0.43) Interest 130,678 0.66 (50,526) (27.88)
Total $ 19,811,123 100.00 $ 582,725 3.03
8. Debt Administration
The district took advantage of low interest rates in April 2005 and refinanced the callable bonds from July 1999. On April 28, 2005, the District sold $4,840,000 of general obligation bonds dated April 28, 2005, which have annual maturities to July 15, 2018. Of these bonds, $2,675,000 was outstanding at June 30, 2014.
The District also took advantage of the current low interest rate and refinanced the October, 1992 bonds. Bonds in the amount of $7,630,000 are dated April 15, 2002, and having maturities from July 15, 2004 through July 15, 2013. These bonds were paid off during the 2013-2014 fiscal year.

9. Cash Management
The investment policy of the District is guided in large part by state statute as detailed in "Notes to the Financial Statements", Note 2. The District has adopted a cash management plan which requires it to deposit public funds in public depositories protected from loss under the provisions of the Governmental Unit Deposit Protection Act ("GUDPA"). GUDPA was enacted in 1970 to protect Governmental Units from a loss of funds on deposit with a failed banking institution in New Jersey. The law requires governmental units to deposit public funds only in public depositories located in New Jersey, where the funds are secured in accordance with the Act.
10. Risk Management
The Board carries various forms of insurance, including but not limited to, general liability, automobile liability and comprehensive/collision, hazard, and theft insurance on property and contents, fidelity Bonds and Student/Volunteer Accident Insurance.
11. Other Information
A. Independent Audit
State statutes require an annual audit by independent certified public accountants or registered municipal accountants. The accounting firm of Holman Frenia Allison, PC, was selected by the Board of Education. In addition to meeting the requirements set forth in state statutes, the audit also was designed to meet the requirements of the Single Audit Act of 1984 as amended in 1996 and the related OMB Circular A-133 and state Treasury Circular Letter 04-04. The auditor's report on the basic financial statements and the combining and individual fund statements and schedules is included in the financial section of this report. The auditor's reports related specifically to the single audit are included in the single audit section of this report.
We would like to express our appreciation to the members of the Logan Township School Board for their concern in providing fiscal accountability to the citizens and taxpayers of the School District and thereby contributing their full support to the development and maintenance of our financial operation. The preparation of this report could not have been accomplished without the efficient and dedicated services of our financial and accounting staff.
Respectfully submitted,
Patricia L. Haney Janine M. Wechter Superintendent School Business Administrator
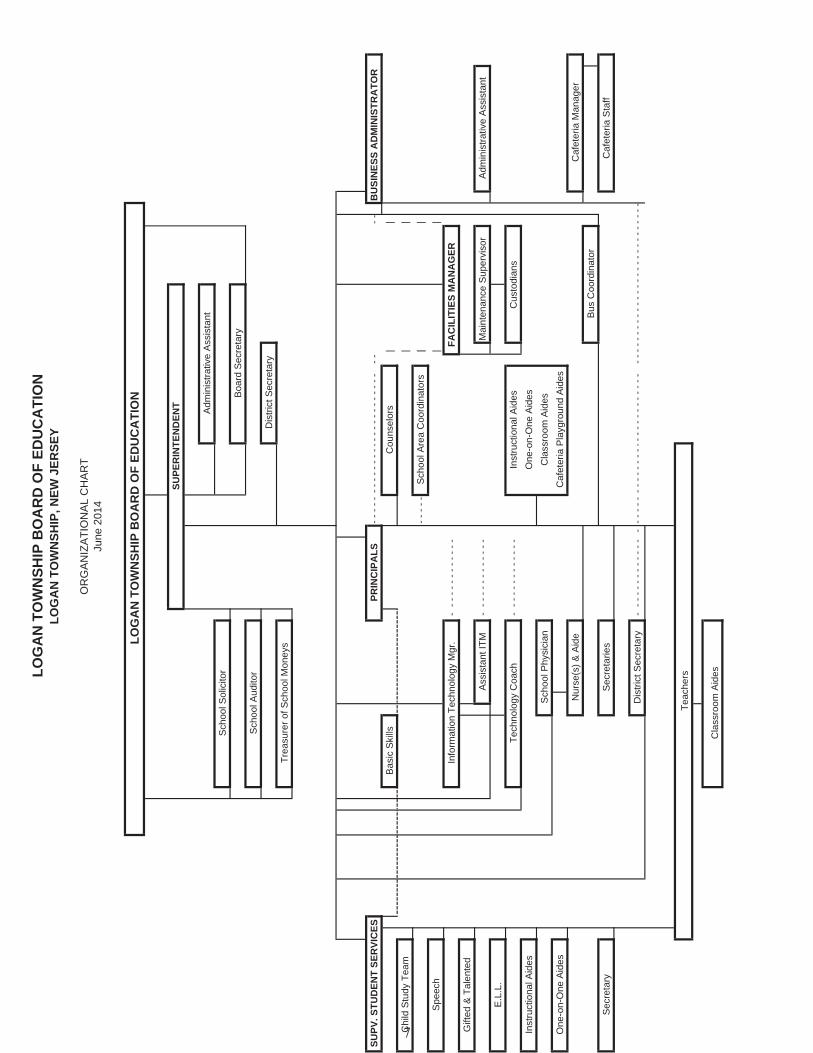
LOG
AN
TO
WN
SHIP
BO
AR
D O
F ED
UC
ATI
ON
LOG
AN
TO
WN
SHIP
, NEW
JER
SEY
OR
GA
NIZ
ATI
ON
AL
CH
AR
TJu
ne 2
014
SUPE
RIN
TEN
DEN
T Adm
inis
trativ
e A
ssis
tant
Sch
ool S
olic
itor
Sch
ool A
udito
r
Trea
sure
r of S
choo
l Mon
eys
PRIN
CIP
ALS
- - -
- - -
- - -
- - -
- --
- - -
- - -
- - -
- -
- -- -
Bas
ic S
kills
||
Chi
ld S
tudy
Tea
m|
|- -
- - -
|
|S
peec
h|
|In
form
atio
n Te
chno
logy
Mgr
. -
- - -
- - -
- - -
- - -
FA
CIL
ITIE
S M
AN
AG
ERG
ifted
& T
alen
ted
-- -
- - -
- - -
- - -
-
Mai
nten
ance
Sup
ervi
sor
Adm
inis
trativ
e A
ssis
tant
E.L
.L.
Tech
nolo
gy C
oach
-- -
- - -
- - -
- - -
-
C
usto
dian
sIn
stru
ctio
nal A
ides
S
choo
l Phy
sici
anO
ne-o
n-O
ne A
ides
N
urse
(s) &
Aid
eC
afet
eria
Man
ager
Sec
reta
ry
S
ecre
tarie
s
Caf
eter
ia S
taff
-- -
- - -
- - -
- - -
--
- - -
- - -
- - -
- - -
- --
- - -
- - -
- - -
- -
- -- -
- - -
- - -
- - -
- - -
- - -
- - -
- - -
-- -
Teac
hers
Boa
rd S
ecre
tary
LOG
AN
TO
WN
SHIP
BO
AR
D O
F ED
UC
ATI
ON
Cla
ssro
om A
ides
Inst
ruct
iona
l Aid
esO
ne-o
n-O
ne A
ides
Cla
ssro
om A
ides
Caf
eter
ia P
layg
roun
d A
ides
Bus
Coo
rdin
ator
SUPV
. STU
DEN
T SE
RVI
CES
Dis
trict
Sec
reta
ry
Sch
ool A
rea
Coo
rdin
ator
s
Dis
trict
Sec
reta
ry
Cou
nsel
ors
BU
SIN
ESS
AD
MIN
ISTR
ATO
R
Ass
ista
nt IT
M

MEMBERS OF THE BOARD OF EDUCATION TERM EXPIRES
Francis E. Donnelly, Preseident 2015
Amy Warlin-Mulholland, Vice President 2014
Brian Bowen 2014
John Russell 2016
Carolyn W. Kegler 2015
Kelley Mason 2016
Shawn Donnelly 2014
LynNae Hill 2016
Kelly Lombardo 2015
OTHER OFFICIALS
Patricia L. Haney, Superintendent
Janine M. Wechter, Business Administrator
Lisa Toff, Board Secretary
Robert L. Best, Treasurer
Alan R. Schmoll, Esq., Solicitor
LOGAN TOWNSHIP BOARD OF EDUCATION110 School Lane
Logan Township, New Jersey 08085
ROSTER OF OFFICIALS
June 30, 2014

618 Stokes RoadMedford, New Jersey 08055
ATTORNEY
US Bank
Capehart & Scatchard
P.O. Box 5054
FISCAL AGENT
Alan R. Schmoll, Esq
Mount Laurel, New Jersey 08054-1539
FINANCIAL ADVISOR
St. Paul, Minnesota 55107
LOGAN TOWNSHIP BOARD OF EDUCATIONLOGAN TOWNSHIP, NEW JERSEY
CONSULTANTS AND ADVISORS
AUDIT FIRM
Holman Frenia Allison, P.C.Rodney R. Haines, CPA, PSA
Corporate Trust Services
9000 Midlantic Drive, Suite 300
Capital Financial Advisors, Inc.
8000 Midlantic Drive, Suite 110SMt. Laurel, New Jersey 08054
EP-MN-WS3W60 Livington Avenue
Robbi Acampora
OFFICIAL DEPOSITORY
Fulton Bank of NJ22 Village Center Drive
Swedesboro, New Jersey 0805

This page intentionally left blank

FINANCIAL SECTION

This page intentionally left blank.

INDEPENDENT AUDITOR’S REPORT
Honorable President and Members of the Board of Education Logan Township School District County of Gloucester Swedesboro, New Jersey 08085
Report on the Financial Statements
We have audited the accompanying financial statements of the governmental activities, the business-type activities, each major fund and the aggregate remaining fund information of the Logan Township Board of Education, County of Gloucester, State of New Jersey, as of and for the fiscal year ended June 30, 2014, and the related notes to the financial statements, which collectively comprise the District’s basic financial statements as listed in the table of contents.
Management’s Responsibility for the Financial Statements
Management is responsible for the preparation and fair presentation of these financial statements in accordance with accounting principles generally accepted in the United States of America; this includes the design, implementation, and maintenance of internal control relevant to the preparation and fair presentation of financial statements that are free from material misstatement, whether due to fraud or error.
Auditor’s Responsibility
Our responsibility is to express opinions on these financial statements based on our audit. We conducted our audit in accordance with auditing standards generally accepted in the United States of America; and the standards applicable to financial audits contained in Governmental Auditing Standards, issued by the Comptroller General of the United States; and audit requirements as prescribed by the Office of School Finance, Department of Education, State of New Jersey. Those standards require that we plan and perform the audit to obtain reasonable assurance about whether the financial statements are free from material misstatement.
An audit involves performing procedures to obtain audit evidence about the amounts and disclosures in the financial statements. The procedures selected depend on the auditor’s judgment, including the assessment of the risks of material misstatement of the financial statements, whether due to fraud or error. In making those risk assessments, the auditor considers internal control relevant to the entity’s preparation and fair presentation of the financial statements in order to design audit procedures that are appropriate in the circumstances, but not for the purpose of expressing an opinion on the effectiveness of the entity’s internal control. Accordingly, we express no such opinion. An audit also includes evaluating the appropriateness of accounting policies used and the reasonableness of significant accounting estimates made by management, as well as evaluating the overall presentation of the financial statements.
We believe that the audit evidence we have obtained is sufficient and appropriate to provide a basis for our audit opinions.
Opinions
In our opinion, the financial statements referred to above present fairly, in all material respects, the respective financial position of the governmental activities, the business-type activities, each major fund, and the aggregate remaining fund information of the Logan Township Board of Education,, County of Gloucester, State of New Jersey, as of June 30, 2014, and the respective changes in financial position and, where applicable, cash flows thereof for the year then ended in accordance with accounting principles generally accepted in the United States of America.
Other Matters
Required Supplementary Information
Accounting principles generally accepted in the United States of America require that the management’s discussion and analysis and budgetary comparison information on pages 19 through 26 and 81 through 92 be presented to supplement the basic financial statements. Such information, although not a part of the basic financial statements, is required by the Governmental Accounting Standards Board who considers it to be an essential part of financial reporting for placing the basic financial statements in an appropriate operational, economic, or historical context. We have applied certain limited procedures to the required supplementary information in accordance with auditing standards generally accepted in the United States of America, which consisted of inquiries of management about the methods of preparing the information and comparing the information for consistency with management’s responses to our inquiries, the basic financial statements, and other knowledge we obtained during our audit of the basic financial statements. We do not express an opinion or provide any assurance on the information because the limited procedures do not provide us with sufficient evidence to express an opinion or provide any assurance.
Other Information
Our audit was conducted for the purpose of forming opinions on the financial statements that collectively comprise the Logan Township Board of Education’s basic financial statements. The accompanying introductory section, comparative totals for June 30, 2013, and other supplementary information such as the combining and individual fund financial statements, long-term debt schedules and statistical information are presented for purposes of additional analysis and are not a required part of the financial statements. The accompanying schedule of expenditures of federal and state financial assistance are presented for purposes of additional analysis as required by U.S. Office of Management and Budget Circular A-133, Audits of States, Local Governments, and Non-Profit Organizations and New Jersey OMB’s Circular 04-04, Single Audit Policy for Recipients of Federal Grants, State Grants and State Aidrespectively, and is also not a required part of the financial statements.
The combining and individual fund financial statements, long-term debt schedules and the accompanying schedule of expenditures of federal and state financial assistance is the responsibility of management and was derived from and relates directly to the underlying accounting and other records used to prepare the basic financial statements. Such information has been subjected to the auditing procedures applied in the audit of the basic financial statements and certain additional procedures, including comparing and reconciling such information directly to the underlying accounting other records used to prepare the basic financial statements or to the basic financial statements themselves, and other additional procedures in accordance with auditing standards generally accepted in the United States of America. In our opinion, the combining and individual fund financial statements, long-term debt schedules and the accompanying schedule of expenditures of federal and state financial assistance are fairly stated in all material respects in relation to the basic financial statements taken as a whole.

The introductory section, comparative totals for June 30, 2013, and statistical information have not been subjected to the auditing procedures applied in the audit of the basic financial statements and, accordingly, we express no opinion on them.
Other Reporting Required by Government Auditing Standards
In accordance with Government Auditing Standards, we have also issued our report dated November 17, 2013 on our consideration of the Logan Township Board of Education’s internal control over financial reporting and on our tests of its compliance with certain provisions of laws, regulations, contracts, and grant agreements and other matters. The purpose of that report is to describe the scope of our testing of internal control over financial reporting and compliance and the results of that testing, and not to provide an opinion on internal control over financial reporting or on compliance. That report is an integral part of an audit performed in accordance with Government Auditing Standards in considering Logan Township Board of Education’s internal control over financial reporting and compliance
Respectfully Submitted,
HOLMAN FRENIA ALLISON, P.C.
Rodney R. Haines Certified Public Accountant Public School Accountant No. 2198
Medford, New Jersey November 17, 2014

This page intentionally left blank

REQUIRED SUPPLEMENTARY INFORMATION - PART I

This page intentionally left blank.

LOGAN TOWNSHIP BOARD OF EDUCATION
MANAGEMENT’S DISCUSSION AND ANALYSIS For the Fiscal Year ended June 30, 2014
UNAUDITED
The discussion and analysis of Logan Township Board of Education annual financial performance provides an overall review of the School District’s financial activities for the fiscal year ended June 30, 2014. The intent of this discussion and analysis is to look at the School District’s financial performance as a whole; readers should also review the notes to the basic financial statements and financial statement to enhance their understanding of the School District’s financial performance.
The Management’s Discussion and Analysis (MD&A) is an element of Required Supplementary Information specified in the Governmental Accounting Standard Board’s (GASB) Statement No. 34 - Basic Financial Statements- and Management’s Discussion and Analysis – for State and Local Governments issued in June 1999. Certain comparative information between the current year (2013-2014) and the prior year (2012-2013) is required to be presented in the MD&A.
Financial Highlights
Key financial highlights for the 2013-2014 fiscal year include the following:
General revenues accounted for $19,422,182 of all revenues. Specific revenues in the form of charges for services, operating grants & contributions accounted for $728,110 to total revenues of $20,150,292.
Total net position of governmental activities was $10,855,330. Net Assets increase by $1,105,018 from July 1, 2013 to June 30, 2014.
The General Fund fund balance at June 30, 2014 is $3,505,921, a decrease of $186,665 when compared with the beginning balance at July 1, 2013 of $3,692,586.
Using this Comprehensive Annual Financial Report (CAFR)
This annual report consists of a series of financial statements and notes to those statements. These statements are organized so the reader can understand Logan Township School District as a financial whole, an entire operating entity. The statements then proceed to provide an increasingly detailed look at specific financial activities.
Government-wide financial statements. The government-wide financial statements are designed to provide readers with a broad overview of the District’s finances, in a manner similar to a private-sector business.
The statement of net position presents information on all of the assets and liabilities of the District, with the difference between the two reported as net position. Over time, increases or decreases in net position may serve as a useful indicator of whether the financial position of the District is improving or deteriorating.

The statement of activities presents information showing how the net assets of the District changed during the most recent fiscal year. All changes in net position are reported as soon as the underlying event giving rise to the change occurs, regardless of the timing of related cash flows. Thus, revenues and expenses are reported in this statement for some items that will only result in cash flows in future fiscal periods (e.g. earned but unused sick leave).
Fund financial statements. A fund is a group of related accounts that is used to maintain control over resources that have been segregated for specific activities or objectives. The District, like other state and local governments, uses fund accounting to ensure and demonstrate compliance with finance-related legal requirements. All of the funds of the District can be divided into three categories: governmental funds, proprietary funds, and fiduciary funds.
Governmental funds. Governmental funds are used to account for essentially the same functions reported as governmental activities in the government-wide financial statements. However, unlike the government-wide financial statements, governmental fund financial statements focus on near-term inflows and outflows of spendable resources, as well as on balances of spendable resources available at the end of the fiscal year. Such information may be useful in evaluating the government’s near-term financing requirements.
Because the focus of governmental funds is narrower than that of the government-wide financial statements, it is useful to compare the information presented for governmental funds with similar information presented for governmental activities in the government-wide financial statements. By doing so, readers may better understand the long-term impact of the government’s near-term financing decisions. Both the governmental fund balance sheet and the governmental fund statement of revenues, expenditures, and changes in fund balances provide a reconciliation to facilitate this comparison between governmental funds and governmental activities.
The District maintains four individual governmental funds. Information is presented separately in the governmental fund balance sheet and in the governmental fund statement of revenues, expenditures, and changes in fund balances for the general fund, the special revenue fund, the debt service fund, and the capital projects fund, each of which are considered to be major funds.
The District adopts an annual appropriated budget for its general fund. A budgetary comparison statement has been provided for the general fund to demonstrate compliance with this budget.
Proprietary funds. The District maintains one proprietary fund type. The food service fund hashistorically operated as an enterprise fund using the same basis of accounting as business-type activities; therefore, these statements will essentially match the information provided in the statements for the district as a whole.
Fiduciary funds. Fiduciary funds are used to account for resources held for the benefit of parties outside the governmental entity. Fiduciary funds are not reflected in the government-wide financial statement because the District cannot use these funds to finance its operations.
The District uses an agency fund to account for resources held for student activities and groups.
Notes to the financial statements. The notes provide additional information that is essential for a full understanding of the data provided in the government-wide and fund financial statements.
Other information. The combining statements referred to earlier in connection with nonmajor governmental funds and internal service funds are presented immediately following the notes to the financial statements.
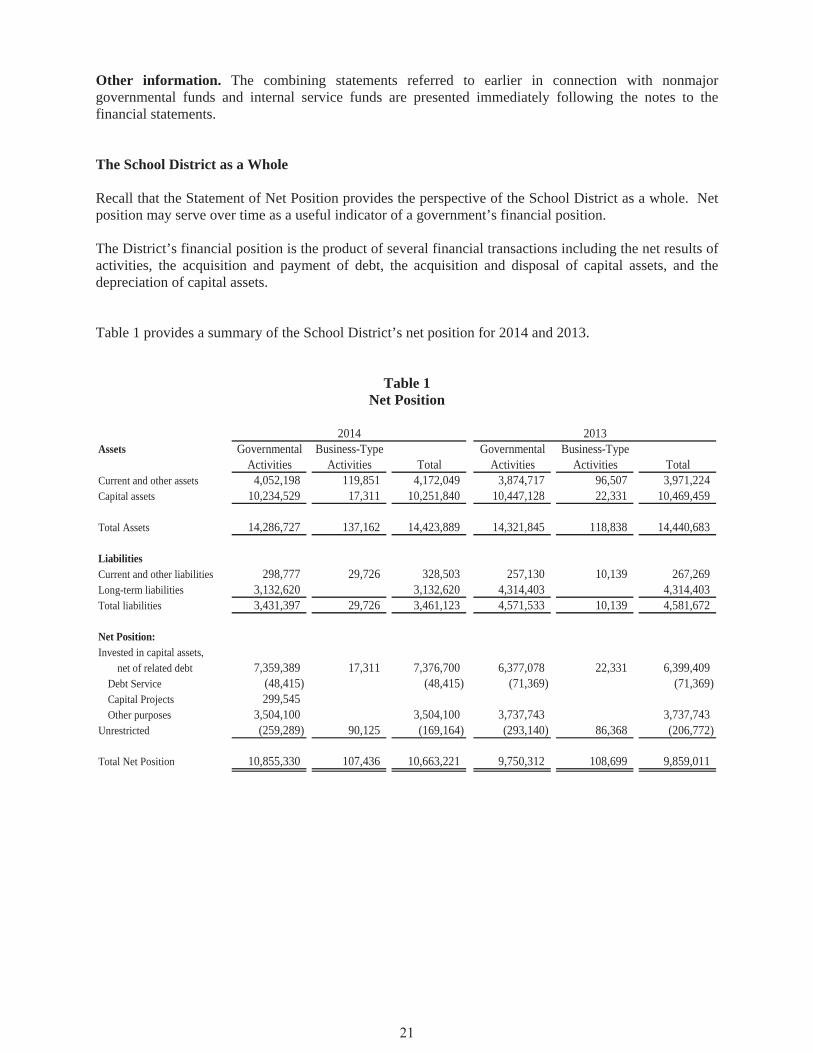
The School District as a Whole
Recall that the Statement of Net Position provides the perspective of the School District as a whole. Net position may serve over time as a useful indicator of a government’s financial position.
The District’s financial position is the product of several financial transactions including the net results of activities, the acquisition and payment of debt, the acquisition and disposal of capital assets, and the depreciation of capital assets.
Table 1 provides a summary of the School District’s net position for 2014 and 2013.
Table 1 Net Position
Assets Governmental Business-Type Governmental Business-TypeActivities Activities Total Activities Activities Total
Current and other assets 4,052,198 119,851 4,172,049 3,874,717 96,507 3,971,224 Capital assets 10,234,529 17,311 10,251,840 10,447,128 22,331 10,469,459
Total Assets 14,286,727 137,162 14,423,889 14,321,845 118,838 14,440,683
LiabilitiesCurrent and other liabilities 298,777 29,726 328,503 257,130 10,139 267,269 Long-term liabilities 3,132,620 3,132,620 4,314,403 4,314,403 Total liabilities 3,431,397 29,726 3,461,123 4,571,533 10,139 4,581,672
Net Position:Invested in capital assets,
net of related debt 7,359,389 17,311 7,376,700 6,377,078 22,331 6,399,409 Debt Service (48,415) (48,415) (71,369) (71,369) Capital Projects 299,545 Other purposes 3,504,100 3,504,100 3,737,743 3,737,743
Unrestricted (259,289) 90,125 (169,164) (293,140) 86,368 (206,772)
Total Net Position 10,855,330 107,436 10,663,221 9,750,312 108,699 9,859,011
20132014
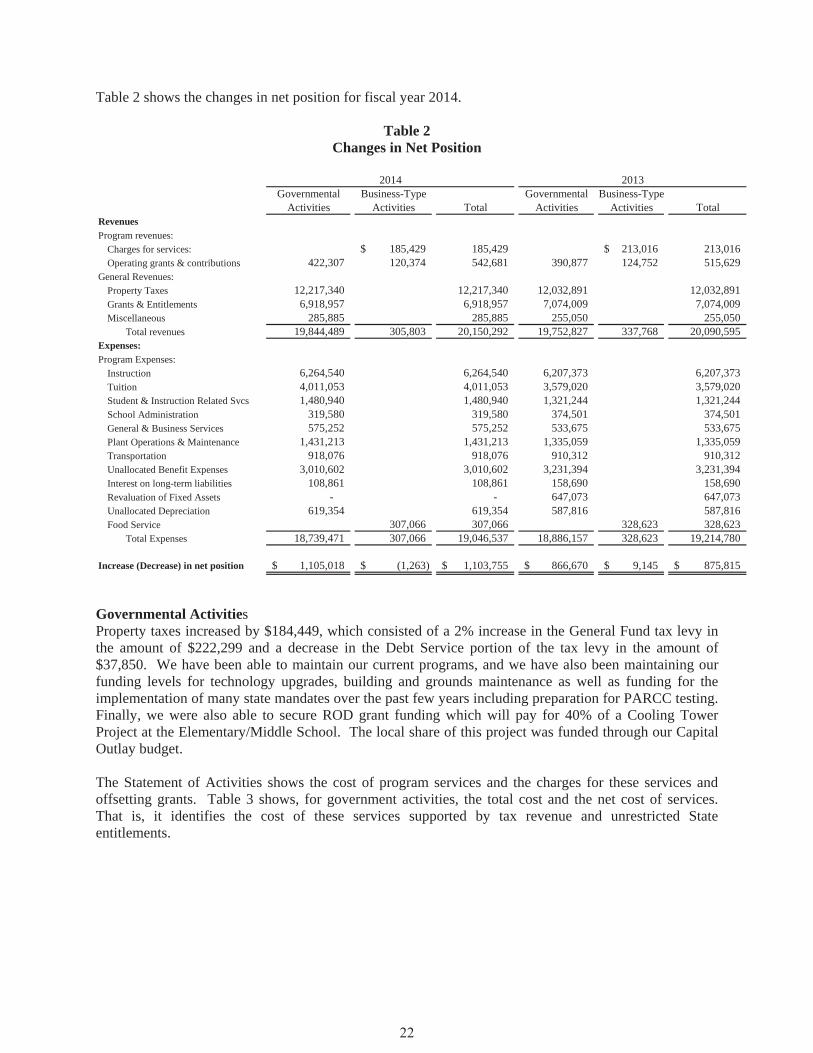
Table 2 shows the changes in net position for fiscal year 2014.
Table 2 Changes in Net Position
Governmental Business-Type Governmental Business-TypeActivities Activities Total Activities Activities Total
RevenuesProgram revenues:
Charges for services: 185,429$ 185,429 213,016$ 213,016 Operating grants & contributions 422,307 120,374 542,681 390,877 124,752 515,629
General Revenues:Property Taxes 12,217,340 12,217,340 12,032,891 12,032,891 Grants & Entitlements 6,918,957 6,918,957 7,074,009 7,074,009 Miscellaneous 285,885 285,885 255,050 255,050
Total revenues 19,844,489 305,803 20,150,292 19,752,827 337,768 20,090,595 Expenses:Program Expenses:
Instruction 6,264,540 6,264,540 6,207,373 6,207,373 Tuition 4,011,053 4,011,053 3,579,020 3,579,020 Student & Instruction Related Svcs 1,480,940 1,480,940 1,321,244 1,321,244 School Administration 319,580 319,580 374,501 374,501 General & Business Services 575,252 575,252 533,675 533,675 Plant Operations & Maintenance 1,431,213 1,431,213 1,335,059 1,335,059 Transportation 918,076 918,076 910,312 910,312 Unallocated Benefit Expenses 3,010,602 3,010,602 3,231,394 3,231,394 Interest on long-term liabilities 108,861 108,861 158,690 158,690 Revaluation of Fixed Assets - - 647,073 647,073 Unallocated Depreciation 619,354 619,354 587,816 587,816 Food Service 307,066 307,066 328,623 328,623
Total Expenses 18,739,471 307,066 19,046,537 18,886,157 328,623 19,214,780
Increase (Decrease) in net position 1,105,018$ (1,263)$ 1,103,755$ 866,670$ 9,145$ 875,815$
2014 2013
Governmental ActivitiesProperty taxes increased by $184,449, which consisted of a 2% increase in the General Fund tax levy in the amount of $222,299 and a decrease in the Debt Service portion of the tax levy in the amount of $37,850. We have been able to maintain our current programs, and we have also been maintaining our funding levels for technology upgrades, building and grounds maintenance as well as funding for the implementation of many state mandates over the past few years including preparation for PARCC testing. Finally, we were also able to secure ROD grant funding which will pay for 40% of a Cooling Tower Project at the Elementary/Middle School. The local share of this project was funded through our Capital Outlay budget.
The Statement of Activities shows the cost of program services and the charges for these services and offsetting grants. Table 3 shows, for government activities, the total cost and the net cost of services. That is, it identifies the cost of these services supported by tax revenue and unrestricted State entitlements.

Table 3 Government Activities
Total Cost of Net Cost of Total Cost of Net Cost ofServices Services Services Services
Instruction 6,264,540$ 5,892,690$ 6,207,373$ 5,857,210$ Tuition 4,011,053 4,011,053 3,579,020 3,579,020 Student & Instruction Related Svcs 1,480,940 1,430,483 1,321,244 1,280,530 School Administration 319,580 319,580 374,501 374,501 General Admin. & Business Svcs 575,252 575,252 533,675 533,675 Plant Operations & Maintenance 1,431,213 1,431,213 1,335,059 1,335,059 Pupil Transportation 918,076 918,076 910,312 910,312 Unallocated Benefit Expenses 3,010,602 3,010,602 3,231,394 3,231,394 Interest on long-term liabilities 108,861 108,861 158,690 158,690 Revaluation of Fixed Assets - - 647,073 647,073 Unallocated Depreciation 619,354 619,354 587,816 587,816
Total Expenses 18,739,471$ 18,317,164$ 18,886,157$ 18,495,280$
2014 2013
Instruction expenses include activities directly dealing with the teaching of pupils and the interaction between teacher and student, including extracurricular activities.
Tuition expenses include the cost of sending the District’s students in grades 9 – 12 to Kingsway Regional High School, and all special education out of district placements.
Student & Instruction Related Services expenses include the activities involved with assisting staff with the content and process of teaching to students, including curriculum and staff development.
General administration, school administration, and business services include expenses associated with the administrative and financial supervision of the District.
Plant Operations and Maintenance expenses involve keeping the school grounds, buildings, and equipment in effective working condition and maintaining the safety of all students and staff while on campus.
Pupil Transportation includes activities involved with the conveyance of students to and from school, as well as to and from school activities, as provided by State Law.
Unallocated benefit expenses include the costs of providing health and welfare insurance programs for the school district staff as well as other fringe benefits.
Interest on long-term liabilities involves the transactions associated with the payment of interest and other related charges to debt of the School District.
Unallocated depreciation is the depreciation expense of the District fixed assets.
The District’s Funds
The District’s governmental funds are accounted for using the modified accrual basis of accounting. All governmental funds had total revenues of $19,845,430 and expenditures of $19,812,064. The net change in fund balance was most significant in the general fund due to the increase of revenue over the prior year by $84,657, while expenditures increased $529,064.

General Fund Budgeting Highlights
The School District’s budget is prepared according to New Jersey law and is based on accounting for certain transactions on a basis of cash receipts, disbursements, and encumbrances. The most significant budgeted fund is the General Fund.
During the course of fiscal 2014 the School District amended its General Fund budget numerous times. Generally these amendments are a reallocation of resources to facilitate changes in spending priorities in the district. The district uses a school-based budgeting system designed to tightly control the total school budget but provide the flexibility for location management.
Capital Assets and Debt Administration
Capital Assets At the end of fiscal 2014, the District had $10,251,840 invested in land, buildings, and equipment; $10,234,529 in governmental activities. Please refer to Note 6 in the Notes to the Financial Statements for additional detail.
Table 4 Capital Assets at June 30, 2014
Governmental Business-Type Governmental Business-TypeActivities Activities Total Activities Activities Total
Land 115,872 115,872 115,872 115,872 Site Improvements 682,249 682,249 649,984 649,984 Construction in Progress 77,758 77,758 Buildings and building improvements 19,338,420 19,338,420 19,262,969 19,262,969 Machinery and Equipment 1,745,556 166,999 1,912,555 1,547,965 166,999 1,714,964 Accumulated Depreciation (11,725,326) (149,688) (11,875,014) (11,129,662) (144,668) (11,274,330)
Total 10,234,529 17,311 10,251,840 10,447,128 22,331 10,469,459
2014 2013
DebtAt June 30, 2014, the District had $3,132,620 in debt outstanding; $632,734 due within one year. Table 5 summarizes debt outstanding. Please refer to Note 7 in the Notes to the Financial Statements for additional detail.
Table 5 Outstanding Debt at June 30, 2014
Governmental GovernmentalActivities Total Activities Total
Refunding of 1992 Bonds for the Construction of Logan Elementary School 2002 School Bonds - - 665,000 665,000 Refunding bond issue 2005 2,675,000 2,675,000 3,170,000 3,170,000 Capital Leases 200,140 200,140 235,050 235,050 Compensated Absences 257,480 257,480 244,353 244,353
Total 3,132,620 3,132,620 4,314,403 4,314,403
2014 2013

On April 15, 2002, the District issued $7,630,000.00 general obligation bonds at 3.00 – 5.00 percent variable rates to refund the 1992 School Bonds. The final maturity of these bonds was July 15, 2013. The District will realized a savings of approximately $901,000 over the life of this refunding.
On April 20, 2005, the District issued $4,840,000.00 general obligation bonds at 3.00-4.00 percent variable rates to refund the final 10 years on the 1999 School Bonds. The final maturity of these bonds is July 15, 2018. The District will realize a savings of approximately $145,000.00 over the life of this refunding.
At June 30, 2014, the District’s overall legal debt margin was $31,926,417. The District maintains an AAA bond rating.
Current Financial Issues and Concerns
The Logan Township School District is financially stable at the present time. The District is proud of its community support of the public schools. The NJ Department of Education released Accountability Regulations in January 2009. These regulations established additional regulatory authority over district budgets by the Executive County Superintendent, established rules and regulations regarding district travel expenses, administrator compensation, budget preparation, excessive spending, district consolidation, etc.
In early 2010, the recently elected Governor Christie declared a Fiscal Crisis in the State of New Jersey, curtailing spending statewide. Shortly after that, the District saw an unprecedented reduction in current state aid funding. Logan Township School District was forced to reduce its budget for the fiscal year 2010 by over $1 million and either laid off or reduced hours and benefits for seventeen staff members. Besides these reductions in staffing and staffing hours, the district was able to achieve savings in tuition and transportation in fiscal year 2011 to help offset these cuts. In fiscal year 2012, the District received an increase in state aid, and was therefore able to bring back some programs and staff that were previously cut, make deposits into capital and maintenance reserves, as well as achieve a slight tax decrease for our taxpayers. In fiscal year 2013, the district received a slight decrease in state aid, but managed to keep the tax increase below the 2% cap by only increasing taxes by 1.47%. In spite of this, the district was still able to deposit $331,000 into our Capital and Maintenance Reserves and fund $165,000 in technology initiatives. There was no reduction in staff, and we were able to continue our commitment to embed technology into instruction, to have Principals be the Instructional Leaders of small school communities, to continue to provide small class sizes and small group instruction as well as continued commitment to professional development. We were also able to hire a Supervisor of Curriculum to assist in writing curriculum and completing teacher observations. During the 13-14 fiscal year, despite relatively flat state aid levels we were still able to increase staff by adding a first grade teacher, a Teacher for the Multiple Disabled Self-contained students; a middle school Math teacher and increase the Middle School Counselor to a full time status. In this budget, the District was able to continue its commitment to embed technology into instruction, to have Principals continue to be the Instructional Leaders of small school communities, to continue to provide small class sizes and small group instruction as well as continued commitment to professional learning.
A three-year labor agreement for teachers, aides, and custodians was unanimously approved by the District Board of Education and by the Logan Teacher Education Association (LTEA) on February 26, 2014. The settlement with a 2.5% increase for each of the next three years is considered a reasonable settlement.
The District routinely monitors the rules and regulations of the ESEA federal legislation to assess and ensure financial compliance.

It is important that the District continues to be able to complete capital improvement projects. It is one of the Board of Education’s goals and a budget priority to continue to upgrade and maintain the physical plants of the district. The Board, through the budget process, has deposited funds into its capital and maintenance reserves during the 11-12 and 12-13 fiscal years. The district consistently uses excess surplus funds to keep a consistent level of funding for capital projects and upgrades, and during the 13-14 fiscal year, we were able to secure ROD grant funding to assist in funding these important capital projects.
The District expects limited growth in enrollment over the next few years. The current schools’ capacity is sufficient to accommodate this growth. There were plans proposed to the township for the development of large parcels of farmland in the Repaupo area of the township. However, the current economic conditions appears to have halted any further planning for this project. It may be years before the economy rebounds sufficiently for this proposal to become economically viable. Nevertheless, it still must be noted that this proposal has the potential to develop into a significant impact upon the district.
In conclusion, the Logan Township School District has committed itself to financial excellence for many years. The School District plans to continue its sound fiscal management to meet the challenges of the future.
Requests for Information This financial report is designed to provide a general overview of the Logan Township School District’s finances for all those with an interest in the government’s finances. Questions concerning any of the information provided in this report or requests for additional financial information should be addressed to the Office of the Business Administrator, Logan Township School District, 110 School Lane, Logan Township, NJ 08085. Please visit our website at www.logan.k12.nj.us.

BASIC FINANCIAL STATEMENTS

This page intentionally left blank.

A. District-Wide Financial Statements

This page intentionally left blank

EXHIBIT A-1
TOTALSBUSINESS-
GOVERNMENTAL TYPE JUNE 30,ASSETS ACTIVITIES ACTIVITIES 2014
Cash & Cash Equivalents 2,750,309$ 101,728$ 2,852,037$ Receivables, Net 276,106 9,347 285,453 Inventory - 8,776 8,776 Restricted Assets: Capital Reserve Account - Cash 1,025,783 - 1,025,783 Capital Assets, Non-Depreciable (Note 5) 115,872 - 115,872 Capital Assets, Depreciable, Net (Note 5) 10,118,657 17,311 10,135,968
Total Assets 14,286,727 137,162 14,423,889
LIABILITIES
Accounts Payable 220,491 23,764 244,255 Accrued Interest on Debt 48,417 - 48,417 Prepaid Lunches - 5,962 5,962 Unearned Revenue 29,869 - 29,869 Noncurrent Liabilities (Note 7): Due Within One Year 632,734 - 632,734 Due Beyond One Year 2,499,886 - 2,499,886
Total Liabilities 3,431,397 29,726 3,461,123
NET POSITION
Net Investments in Capital Assets 7,359,389 17,311 7,376,700 Restricted For: Debt Service (48,415) - (48,415) Capital Projects 299,545 - 299,545 Other Purposes 3,504,100 - 3,504,100 Unrestricted (259,289) 90,125 (169,164)
Total Net Position 10,855,330$ 107,436$ 10,962,766$
LOGAN TOWNSHIP BOARD OF EDUCATIONSTATEMENT OF NET POSITION
JUNE 30, 2014
The accompanying Notes to Financial Statements are an integral part of this statement.

EXH
IBIT
A-2
(Pag
e 1
of 2
)
TOTA
LSC
HA
RG
ESO
PER
ATI
NG
BU
SIN
ESS-
FOR
GR
AN
TS &
GO
VER
NM
ENTA
LTY
PEJU
NE
30,
FUN
CTI
ON
S/PR
OG
RA
MS
EXPE
NSE
SSE
RV
ICES
CO
NTR
IBU
TIO
NS
AC
TIV
ITIE
SA
CTI
VIT
IES
2014
Gov
ernm
enta
l Act
iviti
es:
In
stru
ctio
n:
R
egul
ar5,
297,
351
$ -
$
37
1,85
0$
(4
,925
,501
)$
-$
(4
,925
,501
)$
Spec
ial E
duca
tion
687,
144
-
-
(687
,144
)
-
(687
,144
)
B
asic
Ski
ll/R
emed
ial I
nstru
ctio
n22
2,12
6
-
-
(2
22,1
26)
-
(2
22,1
26)
Oth
er In
stru
ctio
n57
,919
-
-
(5
7,91
9)
-
(5
7,91
9)
Sup
port
Serv
ices
& U
ndis
tribu
ted
Cos
ts:
Tuiti
on4,
011,
053
-
-(4
,011
,053
)-
(4,0
11,0
53)
Stud
ent &
Inst
ruct
ion
Rel
ated
Ser
vice
s1,
480,
940
-
50,4
57(1
,430
,483
)-
(1,4
30,4
83)
Scho
ol A
dmin
istra
tive
Serv
ices
319,
580
-
-
(319
,580
)-
(319
,580
)
G
ener
al &
Bus
ines
s Adm
inis
trativ
e Se
rvic
es57
5,25
2
-
-(5
75,2
52)
-(5
75,2
52)
Plan
t Ope
ratio
ns &
Mai
nten
ance
1,43
1,21
3
-
-
(1,4
31,2
13)
-(1
,431
,213
)
Pu
pil T
rans
porta
tion
918,
076
-
-
(918
,076
)-
(918
,076
)
U
nallo
cate
d B
enef
its3,
010,
602
-
-(3
,010
,602
)-
(3,0
10,6
02)
Inte
rest
ond
Cha
rges
on
Long
-Ter
m D
ebt
108,
861
--
(108
,861
)-
(108
,861
)
U
nallo
cate
d D
epre
ciat
ion
619,
354
--
(619
,354
)-
(619
,354
)
T
otal
Gov
ernm
enta
l Act
iviti
es18
,739
,471
-42
2,30
7(1
8,31
7,16
4)-
(18,
317,
164)
LO
GA
N T
OW
NSH
IP B
OA
RD
OF
ED
UC
AT
ION
STA
TE
ME
NT
OF
AC
TIV
ITIE
SFO
R T
HE
YE
AR
EN
DE
D J
UN
E 3
0, 2
014
PRO
GR
AM
REV
ENU
ESN
ET (E
XPE
NSE
) REV
ENU
E A
ND
CH
AN
GES
IN N
ET P
OSI
TIO
N

EXH
IBIT
A-2
(Pag
e 2
of 2
)
TOTA
LSC
HA
RG
ESO
PER
ATI
NG
BU
SIN
ESS-
FOR
GR
AN
TS &
GO
VER
NM
ENTA
LTY
PEJU
NE
30,
FUN
CTI
ON
S/PR
OG
RA
MS
EXPE
NSE
SSE
RV
ICES
CO
NTR
IBU
TIO
NS
AC
TIV
ITIE
SA
CTI
VIT
IES
2014
Bus
ines
s-Ty
pe A
ctiv
ities
:
Foo
d Se
rvic
e30
7,06
6
18
5,42
912
0,37
4-
(1,2
63)
(1,2
63)
T
otal
Bus
ines
s - T
ype
Act
iviti
es30
7,06
6
18
5,42
912
0,37
4-
(1,2
63)
(1,2
63)
Tota
l Prim
ary
Gov
ernm
ent
19,0
46,5
3718
5,42
9
542,
681
(18,
317,
164)
(1,2
63)
(1
8,31
8,42
7)
Gen
eral
Rev
enue
s:
Tax
es:
Pro
perty
Tax
es, L
evie
d fo
r Gen
eral
Pur
pose
s, N
et11
,337
,254
-
11,3
37,2
54
T
axes
Lev
ied
for D
ebt S
ervi
ce88
0,08
6
-
88
0,08
6
Fed
eral
& S
tate
Aid
Not
Res
trict
ed
6,91
8,95
7
-
6,91
8,95
7
SD
A G
rant
Rev
enue
31,1
03
-
31
,103
T
uitio
n R
ecei
ved
231,
505
-
231,
505
M
isce
llane
ous I
ncom
e23
,277
-
23,2
77
T
otal
Gen
eral
Rev
enue
s & T
rans
fers
19,4
22,1
82
-
19
,422
,182
C
hang
e In
Net
Pos
ition
1,10
5,01
8
(1,2
63)
1,
103,
755
N
et P
ositi
on -
Beg
inni
ng9,
750,
312
10
8,69
9
9,
859,
011
N
et P
ositi
on -
Endi
ng10
,855
,330
$
107,
436
$
10,9
62,7
66$
The
acco
mpa
nyin
g N
otes
to F
inan
cial
Sta
tem
ents
are
an
inte
gral
par
t of t
his s
tate
men
t.
LO
GA
N T
OW
NSH
IP B
OA
RD
OF
ED
UC
AT
ION
STA
TE
ME
NT
OF
AC
TIV
ITIE
SFO
R T
HE
YE
AR
EN
DE
D J
UN
E 3
0, 2
014
PRO
GR
AM
REV
ENU
ESN
ET (E
XPE
NSE
) REV
ENU
E A
ND
CH
AN
GES
IN N
ET P
OSI
TIO
N

This page intentionally left blank
B. Fund Financial Statements

This page intentionally left blank

Governmental Funds

This page intentionally left blank

EXHIBIT B-1
SPECIAL CAPITAL DEBT (MEMORANDUM ONLY)GENERAL REVENUE PROJECTS SERVICE JUNE 30, JUNE 30,
FUND FUND FUND FUND 2014 2013Assets: Cash & Cash Equivalents 2,563,573$ -$ 311,196$ 2$ 2,874,771$ 2,765,197$ Receivables, Net 108,325 136,678 31,103 - 276,106 166,635 Restricted Cash & Cash Equivalents 1,025,783 - - - 1,025,783 1,025,384
Total Assets 3,697,681$ 136,678$ 342,299$ 2$ 4,176,660$ 3,957,216$
Liabilities & Fund Balances: Liabilities: Cash Deficit -$ 124,462$ -$ -$ 124,462$ 82,499$ Accounts Payable 164,206 13,531 42,754 - 220,491 166,815 Unearned Revenue 27,554 2,315 - - 29,869 18,944
Total Liabilities 191,760 140,308 42,754 - 374,822 268,258
Fund Balances: Restricted for: Capital Reserve Account 290,868 - - - 290,868 290,704 Maintenance Reserve 416,142 - - - 416,142 415,907 Tuition Reserve Designated for Subsequent Year's Expenditures 318,773 - - - 318,773 318,773 Excess Surplus 1,318,713 - - - 1,318,713 1,159,604 Excess Surplus Designated for Subsequent Year's Expenditures 1,159,604 - - - 1,159,604 1,552,755 Capital Projects Fund - - 299,545 - 299,545 - Debt Service Fund - - - 2 2 2 Unassigned Fund Balance: General Fund 1,821 - - - 1,821 (45,157) Special Revenue Fund - (3,630) - - (3,630) (3,630)
Total Fund Balances 3,505,921 (3,630) 299,545 2 3,801,838 3,688,958
Total Liabilities & Fund Balances 3,697,681$ 136,678$ 342,299$ 2$
Amounts reported for governmental activities in the statement of net position (A-1) are different because:Capital assets used in governmental activities are not financial resources and therefore are not reported in the funds. The cost of the assets is $21,959,855 and the accumulated depreciationis $11,725,326. 10,234,529 10,447,128Long-term liabilities, including bonds payable, are not due and payable in the current period and therefore are not reported as liabilities in the funds. (3,132,620) (4,314,403)Interest on long-term debt in the statement of activities, are not due and payable in the current period and therefore are not reported as liabilities in the funds. (48,417) (71,371)
Net position of Governmental Activities 10,855,330$ 9,750,312$
The accompanying Notes to Financial Statements are an integral part of this statement.
TOTALS
(With Comparative Totals for June 30, 2013)
LOGAN TOWNSHIP BOARD OF EDUCATION
BALANCE SHEETGOVERNMENTAL FUNDS
JUNE 30, 2014

EXHIBIT B-2
SPECIAL CAPITAL DEBT (MEMORANDUM ONLY)GENERAL REVENUE PROJECTS SERVICE JUNE 30, JUNE 30,
FUND FUND FUND FUND 2014 2013Revenues: Local Sources: Local Tax Levy 11,337,254$ -$ -$ 880,086$ 12,217,340$ 12,032,891$ Tuition Charges 231,505 - - - 231,505 187,404 Miscellaneous 23,277 15,000 - - 38,277 73,646
Total Local Sources 11,592,036 15,000 - 880,086 12,487,122 12,293,941
State Sources 6,508,365 36,300 31,103 410,592 6,986,360 7,110,309 Federal Sources - 371,007 - - 371,007 348,577
Total Revenues 18,100,401 422,307 31,103 1,290,678 19,844,489 19,752,827
Expenditures: Current: Regular Instruction 4,925,501 371,850 - - 5,297,351 5,183,958 Special Education Instruction 687,144 - - - 687,144 573,746 Basic Skills/Remedial - Instruction 222,126 - - - 222,126 386,526 Other Instruction 57,919 - - - 57,919 63,143 Support Services & Undistributed Costs: Tuition 4,011,053 - - - 4,011,053 3,579,020 Student & Instruction Related Services 1,554,037 50,457 - - 1,604,494 1,509,922 School Administrative Services 319,580 - - - 319,580 374,501 General & Business Administrative Services 575,252 - - - 575,252 533,675 Plant Operations & Maintenance 1,431,213 - - - 1,431,213 1,335,059 Pupil Transportation 918,076 - - - 918,076 910,312 Unallocated Benefits 2,997,475 - - - 2,997,475 3,123,151 Capital Outlay 321,004 - 77,758 - 398,762 309,181 Debt Service: Principal - - - 1,160,000 1,160,000 1,165,000 Interest & Other Charges - - - 130,678 130,678 181,204
Total Expenditures 18,020,380 422,307 77,758 1,290,678 19,811,123 19,228,398
Excess/(Deficiency) of Revenues Over/ (Under) Expenditures 80,021 - (46,655) - 33,366 524,429
Other Financing Sources/(Uses): Operating Transfer In - - 346,200 - 346,200 - Operating Transfer Out (346,200) - - - (346,200) - Capital Lease (Nonbudget) 79,514 - - - 79,514 104,129
Total Other Financing Sources & Uses (266,686) - 346,200 - 79,514 104,129
Net Change in Fund Balances (186,665) - 299,545 - 112,880 628,558Fund Balance - July 1 3,692,586 (3,630) - 2 3,688,958 3,060,400
Fund Balance - June 30 3,505,921$ (3,630)$ 299,545$ 2$ 3,801,838$ 3,688,958$
The accompanying Notes to Financial Statements are an integral part of this statement.
TOTALS(With Comparative Totals for June 30, 2013)
LOGAN TOWNSHIP BOARD OF EDUCATION
STATEMENT OF REVENUES, EXPENDITURES,AND CHANGES IN FUND BALANCES
GOVERNMENTAL FUNDS
FOR THE YEAR ENDED JUNE 30, 2014

EXHIBIT B-3
Total Net Change in Fund Balances - Governmental Funds (From B-2) 112,880$
Amounts reported for governmental activities in the statement of activities (A-2)are different as follows:
Capital outlays are reported in governmental funds as expenditures. However, in the statement of activities, the cost of those assets is allocated over their estimated useful lives as depreciation expense. The amount that exceeded capital outlays is as follows:
Depreciation Expense (619,354)$Capital Asset Adjustment 9,130Capital Outlays 397,625 (212,599)
Repayment of bond principal is an expenditure in the governmental funds, but the repayment reduces long-term liabilities in the Statements of Net Position and is not reported in the Statement of Activities.
Serial Bonds 1,160,000Capital Lease Payments 123,554 1,283,554
Proceeds from debt issues are a financing source in the governmental funds. They are not in the revenues in the statement of activities; issuing debt increases long-term liabilities in the statement of net assets.
Capital Lease Proceeds (88,644)
Interest on long-term debt in the statement of activies is accrued, regardless of when due. In the governmental funds, interest is reported when due. The accrued interest is an addition in the reconciliation.
Prior Year 71,371Current Year (48,417) 22,954
In the statement of activities, certain operating expenses, e.g., compensated absences(vacations) are measured by the amounts earned during the year. In the governmentalfunds, however, expenditures for these items are reported in the amount of financialresources used/(paid). When the earned amount exceeds the paid amount, the differenceis a reduction in the reconciliation (-), when the paid amount exceeds the earnedamount the difference is an addition to the reconciliation (+).
Prior Year 244,353Current Year (257,480) (13,127)
Change in Net Position of Governmental Activities 1,105,018$
FOR THE YEAR ENDED JUNE 30, 2014
LOGAN TOWNSHIP BOARD OF EDUCATIONRECONCILIATION OF THE STATEMENT OF REVENUES, EXPENDITURES,
AND CHANGES IN FUND BALANCES OF GOVERNMENTAL FUNDSTO THE STATEMENT OF ACTIVITIES
The accompanying Notes to Financial Statements are an integral part of this statement.

This page intentionally left blank

Proprietary Funds

This page intentionally left blank

EXHIBIT B-4
BUSINESS-TYPEACTIVITIES -
ENTERPRISE FUNDS (MEMORANDUM ONLY)
FOOD JUNE 30, JUNE 30,SERVICE 2014 2013
Current Assets: Cash & Cash Equivalents 101,728$ 101,728$ 72,263$ Accounts Receivable 9,347 9,347 18,548 Inventories 8,776 8,776 5,696
Total Current Assets 119,851 119,851 96,507
Noncurrent Assets: Furniture, Machinery & Equipment 166,999 166,999 166,999 Less: Accumulated Depreciation (149,688) (149,688) (144,668)
Total Noncurrent Assets 17,311 17,311 22,331
Total Assets 137,162 137,162 118,838
Current Liabilities: Accounts Payable 23,764 23,764 3,630 Prepaid Lunches 5,962 5,962 6,509
Total Liabilities 29,726 29,726 10,139
Net Investments in Capital Assets 17,311 17,311 22,331 Unrestricted 90,125 90,125 86,368
Total Net Position 107,436$ 107,436$ 108,699$
The accompanying Notes to Financial Statements are an integral part of this statement.
LOGAN TOWNSHIP BOARD OF EDUCATION
TOTALS
STATEMENT OF NET POSITIONJUNE 30, 2014
(With Comparative Totals for June 30, 2013)
PROPRIETARY FUNDS
NET POSITION
LIABILITIES
ASSETS

EXHIBIT B-5
BUSINESS-TYPEACTIVITIES -
ENTERPRISE FUNDS (MEMORANDUM ONLY)
FOOD JUNE 30, JUNE 30,SERVICE 2014 2013
Operating Revenues: Charges for Services: Daily Sales - Reimbursable Programs 121,056$ 121,056$ 147,952$ Daily Sales - Nonreimbursable Programs 64,373 64,373 65,064
Total Operating Revenues 185,429 185,429 213,016
Operating Expenses: Salaries & Benefits 124,425 124,425 146,739 Supplies & Materials 10,643 10,643 8,088 Cost of Sales 142,418 142,418 152,071 Depreciation 5,020 5,020 5,020 Miscellaneous 24,560 24,560 16,705
Total Operating Expenses 307,066 307,066 328,623
Operating Income/(loss) (121,637) (121,637) (115,607)
Nonoperating Revenues/(Expenses):State Sources: State School Lunch Program 3,447 3,447 3,891Federal Sources: National School Lunch Program 85,027 85,027 87,386 National School Breakfast Program 8,570 8,570 8,305 Food Distribution Program 23,187 23,187 24,954Interest & Investment Revenue 143 143 216
Total Nonoperating Revenues/(Expenses) 120,374 120,374 124,752
Income/(Loss) Before Contributions & Transfers (1,263) (1,263) 9,145
Change in Net Position (1,263) (1,263) 9,145Total Net Position - Beginning 108,699 108,699 99,554
Total Net Position - Ending 107,436$ 107,436$ 108,699$
The accompanying Notes to Financial Statements are an integral part of this statement.
TOTALS
AS OF JUNE 30, 2014(With Comparative Totals for June 30, 2013)
LOGAN TOWNSHIP BOARD OF EDUCATION
COMBINING STATEMENT OF REVENUES, EXPENSES ANDCHANGES IN NET POSITION
PROPRIETARY FUNDS

EXHIBIT B-6
BUSINESS-TYPEACTIVITIES -
ENTERPRISE FUNDS (MEMORANDUM ONLY)FOOD JUNE 30, JUNE 30,
SERVICE 2014 2013
Cash Flows From Operating Activities: Receipts from Customers 211,137$ 211,137$ 207,989$ Payments to Employees (124,425) (124,425) (146,739) Payments to Suppliers (154,434) (154,434) (151,910)
Net Cash Provided/(Used) by Operating Activities (67,722) (67,722) (90,660)
Cash Flows From Noncapital Financing Activities: State & Federal Sources 97,044 97,044 99,582
Net Cash Provided/(Used) by Noncapital Financing Activities 97,044 97,044 99,582
Cash Flows From Investing Activities: Net Cash Provided/(Used) by Investing Activities 143 143 216
Net Cash Provided/(Used) by Investing Activities 143 143 216
Net Increase/(Decrease) in Cash & Cash Equivalents 29,465 29,465 9,138Balances - Beginning of Year 72,263 72,263 63,125
Balances - End of Year 101,728$ 101,728$ 72,263$
Operating Income/(Loss) (121,637)$ (121,637)$ (115,607)$Adjustments to Reconcile Operating Income/(Loss) toNet Cash Provided/(Used) by Operating Activities: Depreciation & Net Amortization 5,020 5,020 5,020 Food Distribution Program 23,187 23,187 24,954 Changes in Assets & Liabilities: (Increase)/Decrease in Accounts Receivable 9,201 9,201 (4,620) (Increase)/Decrease in Inventories (3,080) (3,080) (694) Increase/(Decrease) in Current Liabilities 19,587 19,587 287
Total Adjustments 53,915 53,915 24,947
Net Cash Provided/(Used) by Operating Activities (67,722)$ (67,722)$ (90,660)$
The accompanying Notes to Financial Statements are an integral part of this statement.
Reconciliation of Operating Income/(Loss) to Net Cash Provided/(Used) by Operating Activities:
(With Comparative Totals for June 30, 2013)
LOGAN TOWNSHIP BOARD OF EDUCATIONPROPRIETARY FUNDS
COMBINING STATEMENT OF CASH FLOWSAS OF JUNE 30, 2014
TOTALS

This page intentionally left blank

Fiduciary Fund

This page intentionally left blank

EXHIBIT B-7
UNEMPLOYMENT (MEMORANDUM ONLY)
COMPENSATION STUDENT JUNE 30, JUNE 30,ASSETS TRUST FUND SCHOLARSHIP ACTIVITY PAYROLL 2014 2013
Cash & Cash Equivalents 24,724$ 6,968$ 29,351$ 225,720$ 286,763$ 277,780$ Due from Unemployment - - - 351 351 -
Total Assets 24,724 6,968 29,351 226,071 287,114 277,780
LIABILITIES
Payroll Deductions & Withholdings - - - 214,948 214,948 209,265 Due to Student Groups - - 29,351 - 29,351 31,424 Due to Payroll 351 - - - 351 - Flexible Spending - - - 11,123 11,123 11,367
Total Liabilities 351 - 29,351 226,071 255,773 252,056
NET POSITION
Held in Trust for Unemployment Claims Other Purposes 24,373 - - - 24,373 18,664 Reserved for Scholarships - 6,968 - - 6,968 7,060
Total Net Position 24,373$ 6,968$ -$ -$ 31,341$ 25,724$
The accompanying Notes to Financial Statements are an integral part of this statement.
PRIVATE PURPOSE
(With Comparative Totals for June 30, 2013)
LOGAN TOWNSHIP BOARD OF EDUCATIONFIDUCIARY FUNDS
COMPARATIVE COMBINING STATEMENT OF FIDUCIARY NET POSITIONJUNE 30, 2014
TOTALSAGENCY

EXHIBIT B-8
(MEMORANDUM ONLY)
UNEMPLOYMENT JUNE 30, JUNE 30,ADDITIONS SCHOLARSHIP COMPENSATION 2014 2013
Local Sources: Transfer from Payroll Agency Account -$ 10,602$ 10,602$ 13,227$ Investment Earnings: Interest 8 3 11 18
Total Additions 8 10,605 10,613 13,245
DEDUCTIONS
Quarterly Contributions Reports - 4,896 4,896 1,461 Scholarships Awarded 100 - 100 200
Total Deductions 100 4,896 4,996 1,661
Change in Net Position (92) 5,709 5,617 11,584 Net Position - Beginning of the Year 7,060 18,664 25,724 14,140
Net Position - End of the Year 6,968$ 24,373$ 31,341$ 25,724$
The accompanying Notes to Financial Statements are an integral part of this statement.
(With Comparative Totals for June 30, 2013)
TOTALS
LOGAN TOWNSHIP BOARD OF EDUCATION
STATEMENT OF CHANGES IN FIDUCIARY NET POSITIONFIDUCIARY FUNDS
FOR THE YEAR ENDED JUNE 30, 2014
PRIVATE PURPOSE

LOGAN TOWNSHIP BOARD OF EDUCATION
NOTES TO THE FINANCIAL STATEMENTSJUNE 30, 2014

This page intentionally left blank
LOGAN TOWNSHIP BOARD OF EDUCATION
NOTES TO THE FINANCIAL STATEMENTS FOR THE YEAR ENDED JUNE 30, 2014
Note 1. Summary of Significant Accounting Policies
The accompanying financial statements of the Logan Township Board of Education have been prepared in conformity with generally accepted accounting principles as prescribed by the Governmental Accounting Standards Board (GASB). The following is a summary of more significant accounting policies.
A. Reporting Entity
The Logan Township Board of Education is a Type II district located in the County of Gloucester, State of New Jersey. As a Type II district, the School District functions independently through a Board of Education. The Board is comprised of nine members appointed to three-year terms. The District provides a full range of educational services appropriate to grade levels K through 8. These include regular, vocational, as well as special education for handicapped youngsters. The Logan Township Board of Education has an approximate enrollment at June 30, 2014 of 839 students.
B. Component Units
The primary criterion for including activities within the District’s reporting entity, as set forth in Section 2100 of the GASB Codification of Governmental Accounting and Financial Reporting Standards, is whether:
the organization is legally separate (can sue or be sued in their own name) the District holds the corporate powers of the organization the District appoints a voting majority of the organization’s board the District is able to impose its will on the organization the organization has the potential to impose a financial benefit/burden on the District there is a fiscal dependency by the organization on the District
Based on the aforementioned criteria, the District has no component units.
C. District-Wide and Fund Financial Statements
The district-wide financial statements (the statement of net position and the statement of activities) report information of all of the nonfiduciary activities of the District. For the most part, the effect of interfund activity has been removed from these district-wide statements. District activities, which normally are supported by taxes and intergovernmental revenues, are reported separately from business-type activities, which rely to a significant extent on fees and charges for support.
The statement of activities demonstrates the degree to which the direct expenses of a given function, segment or component unit are offset by program revenues. Direct expenses are those that are clearly identifiable with a specific function, segment, or component unit. Program revenues include charges to customers who purchase, use or directly benefit from goods or services provided by a given function, segment or component unit. Program revenues also include grants and contributions that are restricted to meeting the operational or capital requirements of a particular function, segment, or component unit. Taxes and other items not properly included among program revenues are reported instead as general revenues. The District does not allocate general government (indirect) expenses to other functions.

LOGAN TOWNSHIP BOARD OF EDUCATION
NOTES TO THE FINANCIAL STATEMENTS FOR THE YEAR ENDED JUNE 30, 2014
Note 1. Summary of Significant Accounting Policies (continued):
C. District-Wide and Fund Financial Statements (continued):
Net position is restricted when constraints placed on it are either externally imposed or are imposed by constitutional provisions or enabling legislation. Internally imposed designations of resources are not presented as restricted net assets. When both restricted and unrestricted resources are available for use, generally it is the District’s policy to use restricted resources first, and then unrestricted resources as they are needed.
Separate financial statements are provided for governmental funds, proprietary funds, fiduciary funds and similar component units, and major component units. However, the fiduciary funds are not included in the district-wide statements. Major individual governmental funds and major individual enterprise funds are reported as separate columns in the fund financial statements.
D. Measurement Focus, Basis of Accounting and Financial Statement Presentation
District-Wide Financial Statements – The governmental fund financial statements are reported using the economic resources measurement focus and the accrual basis of accounting. Revenues are recorded when earned and expenses are recorded when a liability is incurred, regardless of the timing of related cash flows. Grants and similar items are recognized as revenue as soon as all eligibility requirements imposed by the provider have been met.
Governmental Fund Financial Statements – The Governmental fund financial statements are reported using the current financial resources measurement focus and the modified accrual basis of accounting. Revenues are recognized as soon as they are both measurable and available. Revenues are considered to be available when they are collectible within the current period or soon enough thereafter to pay liabilities of the current period. For this purpose, the District considers revenues to be available if they are collected within 60 days of the end of the current fiscal year-end. Principal revenue sources considered susceptible to accrual include federal and state grants, interest on investments, tuition and transportation. Other revenues are considered to be measurable and available only when cash is received by the state.
Expenditures generally are recorded when a liability is incurred, as under accrual accounting.
E. Fund Accounting
The accounts of the Logan Township Board of Education are maintained in accordance with the principles of fund accounting to ensure observance of limitations and restrictions on the resources available. The principles of fund accounting require that resources be classified for accounting and reporting purposes into funds or account groups in accordance with activities or objectives specified for the resources. The operations of each fund are accounted for with a separate set of self-balancing accounts that comprise its assets, liabilities, fund equity, revenues and expenditures or expenses, as appropriate. Government resources are allocated to and accounted for in individual funds based upon the purposes for which they are to be spent and the means by which spending activities are controlled. An account group, on the other hand, is a financial reporting device designed to provide accountability for certain assets and liabilities that are not recorded in the funds because they do not directly affect net expendable available financial resources. The various funds and accounts are grouped, in the financial statements in this report, into seven fund types within three broad fund categories and two account groups as follows:

LOGAN TOWNSHIP BOARD OF EDUCATION
NOTES TO THE FINANCIAL STATEMENTS FOR THE YEAR ENDED JUNE 30, 2014
Note 1. Summary of Significant Accounting Policies (continued):
E. Fund Accounting (continued):
Governmental Funds
General Fund - The general fund is the general operating fund of the Logan Township Board of Education and is used to account for all financial resources except those required to be accounted for in another fund. Included are certain expenditures for vehicles and movable instructional or noninstructional equipment which are classified in the Capital Outlay sub-fund.
As required by the New Jersey Department of Education, Logan Township Board of Education includes budgeted Capital Outlay in this fund. Generally accepted accounting principles (GAAP), as they pertain to governmental entities, state that General Fund resources may be used to directly finance capital outlays for long-lived improvements as long as the resources in such cases are derived exclusively from unrestricted revenues.
Resources for budgeted capital outlay purposes are normally derived from State of New Jersey Aid, interest earnings, and appropriated fund balance. Expenditures are those that result in the acquisition of or additions to fixed assets for land, existing buildings, improvements of grounds, construction of buildings, additions to or remodeling of buildings and the purchase of built-in equipment. These resources can be transferred from and to Current Expense by board resolution.
Special Revenue Fund - The Special Revenue Fund is used to account for the proceeds of specific revenue from State and Federal Government, (other than major capital projects, Debt Service or the Enterprise Funds) and local appropriations that are legally restricted to expenditures for specified purposes.
Debt Service Fund - The debt service fund is used to account for the accumulation of resources for, and the payment of principal and interest on bonds issued to finance major property acquisition, construction, and improvement programs.
Proprietary Fund
The focus of Proprietary Fund measurement is upon determination of net income, financial position, and cash flows. The generally accepted accounting principles applicable are those similar to businesses in the private sector. The following is a description of the Proprietary Funds of the District:
Enterprise - The enterprise fund is used to account for the operations that are financed and operated in a manner similar to a private business enterprise. The costs of providing goods or services are financed primarily through user charges; or, where the District has decided that periodic determination of revenues earned, expenses incurred, and/or net income is appropriate for capital maintenance, public policy, management control, accountability or other purposes.
The District’s Enterprise Fund is comprised of the Food Service Fund.

LOGAN TOWNSHIP BOARD OF EDUCATION
NOTES TO THE FINANCIAL STATEMENTS FOR THE YEAR ENDED JUNE 30, 2014
Note 1. Summary of Significant Accounting Policies (continued):
E. Fund Accounting (continued):
All Proprietary funds are accounted for on a cost of services or “capital maintenance” measurement focus. This means that all assets and all liabilities, whether current or noncurrent, associated with their activity are included on their balance sheets. Their reported fund equity (total net position) is segregated into contributed capital and unreserved retained earnings, if applicable. Proprietary fund type operating statements present increases (revenues) and decreases (expenses) in total net position.
Depreciation of all exhaustive fixed assets used by proprietary funds is charged as an expense against their operations. Accumulated depreciation is reported on proprietary fund balance sheets. Depreciation has been provided over the estimated useful lives using the straight-line-method. The estimated useful lives are as follows:
Food Service Fund: Equipment 5-15 Years
Fiduciary Fund
Fiduciary funds are used to account for assets held by a governmental entity for other parties (either as trustee or as an agent) and that cannot be used to finance the governmental entity’s own operating programs which includes private purpose trust funds and agency funds.
Private Purpose Trust Funds are used to account for the principal and income for trust arrangements that benefit individuals, private organizations, or other governments. The District currently maintains an Unemployment Trust Fund and a Scholarship Fund as private purpose trusts.
Agency Funds are assets held by a governmental entity (either as trustee or as an agent) for other parties that cannot be used to finance the governmental entity’s own operating programs. The District currently maintains Payroll funds and Student Activity Funds as Agency Funds.
F. Basis of Accounting
The accounting and financial reporting treatment applied to a fund is determined by its measurement focus. All governmental funds and private purpose trust funds are accounted for using a current financial resources measurement focus. With this measurement focus, only current assets and current liabilities generally are included on the balance sheet. Operating statements of these funds present increases (i.e., revenues and other financing sources) and decreases (i.e., expenditures and other financing uses) in net current assets.
All proprietary funds are accounted for on a flow of economic resources measurement focus. With this measurement focus, all assets and all liabilities associated with the operation of these funds are included on the balance sheet. Fund equity (i.e., total net position) is segregated into contributed capital and retained earnings components. Proprietary fund-type operating statements present increases (i.e., revenues) and decreases (i.e., expenses) in total net position.

LOGAN TOWNSHIP BOARD OF EDUCATION
NOTES TO THE FINANCIAL STATEMENTS FOR THE YEAR ENDED JUNE 30, 2014
Note 1. Summary of Significant Accounting Policies (continued):
F. Basis of Accounting (continued):
The modified accrual basis of accounting is used for measuring financial position and operating results of all governmental fund types, private purpose trust funds and agency funds. Under the modified accrual basis of accounting, revenues are recognized when they become both measurable and available. “Measurable” means the amount of the transaction can be determined and “available” means collectible within the current period or soon enough thereafter to be used to pay liabilities of the current period. State equalization monies are recognized as revenue during the period in which they are appropriated. A one-year availability period is used for revenue recognition for all other governmental fund revenues. Expenditures are recognized in the accounting period in which the fund liability is incurred, except for principal and interest on general long-term debt which are recorded when due.
In its accounting and financial reporting, the Logan Township Board of Education follows the pronouncements of the Governmental Accounting Standards Board (GASB) and the pronouncements of the Financial Accounting Standards Board (FASB) and its predecessor organizations issued on or before November 30, 1989, unless they conflict with or contradict GASB pronouncements. The Logan Township Board of Education’s proprietary funds have elected not to apply the standards issued by FASB after November 30, 1989.
The accrual basis of accounting is used for measuring financial position and operating results of proprietary fund types and private purpose trust funds. Under this method, revenues are recognized in the accounting period in which they are earned and expenses are recognized when they are incurred.
G. Budgets/Budgetary Control
Annual appropriated budgets are prepared in the spring of each year for the general, special revenue and debt service funds. Effective January 17, 2012, P.L.2011 c.202 eliminated the annual voter referendum on budgets which met the statutory tax levy cap limitations and the board of education members are elected at the November general election. Budgets are prepared using the modified accrual basis of accounting. The legal level of budgetary control is established at line item accounts within each fund. Line item accounts are defined as the lowest (most specific) level of detail as established pursuant to the minimum chart of accounts referenced in N.J.A.C.6:20-2A(m)1. All budget amendments must be approved by School Board resolution.
Formal budgetary integration into the accounting system is employed as a management control device during the year. For governmental funds there are no substantial differences between the budgetary basisof accounting and generally accepted accounting principles with the exception of the legally mandated revenue recognition of the last state aid payment for budgetary purposes only and the special revenue fund as noted below. Encumbrance accounting is also employed as an extension of formal budgetary integration in the governmental fund types. Unencumbered appropriations lapse at fiscal year-end.
The accounting records of the special revenue fund are maintained on the grant accounting budgetary basis. The grant accounting budgetary basis differs from GAAP in that the grant accounting budgetary basis recognizes encumbrances as expenditures and also recognizes the related revenues, whereas the GAAP basis does not. Sufficient supplemental records are maintained to allow for the presentation of GAAP basis financial reports.
The budget, as detailed on Exhibit C-1, includes all amendments to the adopted budget, if any.

LOGAN TOWNSHIP BOARD OF EDUCATION
NOTES TO THE FINANCIAL STATEMENTS FOR THE YEAR ENDED JUNE 30, 2014
Note 1. Summary of Significant Accounting Policies (continued):
H. Encumbrances
Under encumbrance accounting purchase orders, contracts, and other commitments for the expenditure of resources are recorded to reserve a portion of the applicable appropriation. Open encumbrances in governmental funds other than the special revenue fund are reported as reservations of fund balances at fiscal year-end as they do not constitute expenditures or liabilities but rather commitments related to unperformed contracts for goods and services.
Open encumbrances in the special revenue fund for which the Logan Township Board of Education has received advances are reflected in the balance sheet as deferred revenues at fiscal year-end. The encumbered appropriation authority carries over into the next fiscal year. An entry will be made at the beginning of the next fiscal year to increase the appropriation reflected in the certified budget by the outstanding encumbrance amount as of the current fiscal year-end.
I. Cash and Cash Equivalents
Cash and Cash equivalents include petty cash, change funds, cash in banks, and all highly liquid investments with a maturity of three months or less at the time of purchase and are stated at cost plus accrued interest. U.S. Treasury and agency obligations and certificates of deposit with maturities of one year or less when purchased are stated at cost.
New Jersey School Districts are limited as to the types of investments and types of financial institutions they may invest in. N.J.S.18A:20-37 provides a list of permissible investments that may be purchased by New Jersey school districts.
Additionally, the District has adopted a cash management plan that requires it to deposit public funds in public depositories protected from loss under the provisions of the Governmental Unit Deposit Protection Act (“GUDPA”). GUDPA was enacted in 1970 to protect Governmental Units from loss of funds on deposit with a failed banking institution in New Jersey.
N.J.S.A.17:9-41 et. Seq. establishes the requirements for the security of deposits of governmental units. The statute requires that no governmental unit shall deposit public funds in a public depository unless such funds are secured in accordance with the Act. Public depositories include Savings and Loan institutions, banks (both state and national banks) and savings banks the deposits of which are federally insured. All public depositories must pledge collateral, having a market value at least equal to five percent of the average daily balance of collected public funds, to secure the deposits of Governmental Units. If a public depository fails, the collateral it has pledged, plus the collateral of all other public depositories, is available to pay the full amount of their deposits to the Governmental Units.
J. Tuition Receivable/Payable
Tuition charges were established by the Board of Education based on estimated costs. The charges are subject to adjustment when the final costs have been determined.
These adjustments are recorded upon certification by the State Board of Education, which is normally three years following the contract year. The cumulative adjustments through June 30, 2014, which have not been recorded, are not determinable.

LOGAN TOWNSHIP BOARD OF EDUCATION
NOTES TO THE FINANCIAL STATEMENTS FOR THE YEAR ENDED JUNE 30, 2014
Note 1. Summary of Significant Accounting Policies (continued):
J. Tuition Receivable/Payable (continued):
The tuition rate adjustments for the years 2011-2012 have been established and the District has billed/paid the school boards that have adjustments.
K. Inventories
Inventories are valued at cost, which approximates market. The costs are determined on a first-in, first-out method.
The cost of inventories in governmental fund types is recorded as expenditures when purchased rather than when consumed.
L. Prepaid Expenses
Prepaid expenses, which benefit future periods, are only recorded in the government-wide financial statements and in the proprietary fund statements. Prepaid expenses in the proprietary fund represent payments made to vendors for services that will benefit periods beyond June 30, 2014. They are recorded as expenditure during the year of purchase.
M. Short-Term Interfund Receivables/Payables
Short-term interfund receivables/payables represent amounts that are owed, other than charges for goods or services rendered to/from a particular fund in the Logan Township Board of Education and that are due within one year.
N. Capital Assets
Capital assets acquired or constructed during the year are reported in the applicable governmental or business-type activities columns in the district-wide financial statements. Capital assets are defined by the District as assets, which have a cost in excess of $2,000 at the date of acquisition and a useful life of one year or more. Donated capital assets are valued at their estimated fair market value on the date received. The general fixed assets acquired or constructed were valued by an independent appraisal company. General fixed assets, such as land and buildings, are valued at the historical cost basis and through estimated procedures performed by an independent appraisal company, respectively.
General fixed assets are reflected as expenditures in the applicable governmental funds. Depreciation expense is recorded in the district-wide financial statements as well as the proprietary fund. Capital assets are depreciated on the straight-line method over the assets’ estimated useful life. There is no depreciation recorded for land and construction in progress. Generally estimated useful lives are as follows:
Buildings 20-50 Years Machinery and Equipment 5-10 Years Other Improvements 10-20 Years
LOGAN TOWNSHIP BOARD OF EDUCATION
NOTES TO THE FINANCIAL STATEMENTS FOR THE YEAR ENDED JUNE 30, 2014
Note 1. Summary of Significant Accounting Policies (continued):
O. Accrued Salaries and Wages
District employees, who provide services to the District over the ten-month academic year and extended eleven-month calendar, do not have the option to have their salaries disbursed during the entire twelve-month year. Therefore, there is no accrual as of June 30, 2014 for such salaries.
P. Compensated Absences
Compensated absences are those absences for which employees will be paid, such as vacation, sick leave and sabbatical leave. A liability for compensated absences that are attributable to services already rendered, and that are not contingent on a specific event that is outside the control of the District and its employees, is accrued as the employees earn the rights to the benefits. Compensated absences that relate to future services, or that are contingent on a specific event that is outside the control of the District and its employees, are accounted for in the period in which such services are rendered or in which such events take place.
In the District-Wide financial statements, under governmental activities, compensated absences are reported as an expenditure and noncurrent liabilities.
Q. Unearned Revenue
Unearned revenue arises when assets are recognized before revenue recognition criteria have been satisfied and is recorded as a liability until the revenue is both measureable and the District is eligible to realize the revenue.
R. Long-Term Obligations
In district-wide financial statements, under governmental activities, long-term debt is recognized as a liability in the general fund as debt is incurred.
S. Fund Balance
In accordance with Government Accounting Standards Board 54, Fund Balance Reporting and Governmental Fund Type Definitions, the Logan Township Board of Education classifies governmental fund balances as follows:
Non-spendable – includes fund balance amounts that cannot be spent either because it is not in spendable form or because legal or contractual constraints. Restricted – includes fund balance amounts that are constrained for specific purposes which are externally imposed by external parties, constitutional provision or enabling legislation. Committed – includes fund balance amounts that are constrained for specific purposes that are internally imposed by the government through formal action of the highest level of decision making authority and does not lapse at year-end. Assigned – includes fund balance amounts that are intended to be used for specific purposes that are neither considered restricted or committed. Fund Balance may be assigned by the Business Administrator.

LOGAN TOWNSHIP BOARD OF EDUCATION
NOTES TO THE FINANCIAL STATEMENTS FOR THE YEAR ENDED JUNE 30, 2014
Note 1. Summary of Significant Accounting Policies (continued):
S. Fund Balance (continued):
Unassigned – includes balance within the General Fund which has not been classified within the above mentioned categories and negative fund balances in other governmental funds
The Logan Township Board of Education uses restricted/committed amounts to be spent first when both restricted and unrestricted fund balance is available, unless prohibited by law or regulation. Additionally, the Logan Township Board of Education would first use committed, then assigned and lastly unassigned amounts of unrestricted fund balance when expenditures are made.
T. Net Position
Net position, represents the difference between summation of assets and deferred outflows of resources, and the summation of liabilities and deferred inflows of resources. Net position is classified in the following three components:
Net Investment in Capital Assets – This component represents capital assets, net of accumulated depreciation, net of outstanding balances of borrowings used for acquisition, construction, or improvement of those assets. Restricted – Net position is reported as restricted when there are limitations imposed on their use either through the enabling legislation adopted by the District or through external restrictions imposed by creditors, grantors or laws or regulations of other governments. Unrestricted – Net position is reported as unrestricted when it does not meet the criteria of the other two components of net position.
U. Impact of Recently Issued Accounting Principles
Recently Issued and Adopted Accounting Pronouncements
In March 2012, the GASB issued Statement 66, Technical Corrections—2012—an amendment of GASB Statements No. 10 and No. 62. GASB 66 improves accounting and financial reporting for a governmental financial reporting entity by resolving conflicting guidance that resulted from the issuance of two pronouncements, Statements No. 54, Fund Balance Reporting and Governmental Fund Type Definitions,and No. 62, Codification of Accounting and Financial Reporting Guidance Contained in Pre-November 30, 1989 FASB and AICPA Pronouncements. This Statement is effective for periods beginning after December 15, 2012 although the District elected to early implement Statement 62 in fiscal year 2012. The adoption of GASB 66 does not have any impact on the District’s financial statements.
In March 2012, the GASB issued Statement 65, Items Previously Reported as Assets and Liabilities.GASB 65 establishes accounting and financial reporting standards that reclassify, as deferred outflows of resources or deferred inflows of resources, certain items that were previously reported as assets and liabilities. This Statement is effective for periods beginning after December 15, 2012.
Recently Issued Accounting Pronouncements
In June 2012, the GASB issued Statement 68, Accounting and Financial Reporting for Pensions—an amendment of GASB Statement 27. GASB 68 improves accounting and financial reporting by state and

LOGAN TOWNSHIP BOARD OF EDUCATION
NOTES TO THE FINANCIAL STATEMENTS FOR THE YEAR ENDED JUNE 30, 2014
Note 1. Summary of Significant Accounting Policies (continued):
local governments for pensions. It also improves information provided by state and local governmental employers about financial support for pensions that is provided by other entities. This Statement results from a comprehensive review of the effectiveness of existing standards of accounting and financial reporting for pensions with regard to providing decision-useful information, supporting assessments of accountability and inter-period equity, and creating additional transparency. This Statement is effective for fiscal years beginning after June 15, 2014. Management is currently evaluating the impact of the adoption of this statement on the District’s financial statements.
V. Subsequent Events
Logan Township Board of Education has evaluated subsequent events occurring after June 30, 2014 through the date of November 17, 2014, which is the date the financial statements were available to be issued.
Note 2. Cash
The District is governed by the deposit and investment limitations of New Jersey state law. The Deposits and investments held at June 30, 2014, and reported at fair value are as follows:
CarryingType Value
DepositsDemand Deposits 4,164,583$
Total Deposits 4,164,583$
CarryingType Value
The District's Cash & Cash Equivalents are Reported as Follows:
Governmental Actvities 3,776,092$ Business-Type Actvities 101,728 Fiduciary Funds 286,763
Total Cash & Cash Equivalents 4,164,583$
Custodial Credit Risk – Custodial credit risk is the risk that, in the event of a bank failure, the Board’s deposits may not be recovered. Although the Board does not have a formal policy regarding custodial credit risk, NJSA 17:9-41 et seq. requires that the governmental units shall deposit public funds in public depositories protected from loss under the provisions of the Governmental Unit Deposit Protection Act (GUDPA). GUDPA is a supplemental insurance program set forth by the New Jersey Legislature to protect the deposits of local governmental agencies. The program is administered by the Commissioner of the New Jersey Department of Banking and Insurance. Under the Act, the first $250,000 of governmental deposits in each insured depository is protected by FDIC. Public fund owned by the Board in excess of FDIC insured amounts are protected by GUDPA.

LOGAN TOWNSHIP BOARD OF EDUCATION
NOTES TO THE FINANCIAL STATEMENTS FOR THE YEAR ENDED JUNE 30, 2014
Note 2. Cash (continued):
However, GUDPA does not protect intermingled trust funds such as salary withholdings, student activity funds or funds that may pass to the Board relative to the happening of a future condition. Such funds are shown as Uninsured and Uncollateralized in the schedule below. As of June 30, 2014, the District’s bank balance of $4,927,080 was exposed to custodial credit risk as follows:
Insured $ 250,000 Uninsured and uncollateralized 434,434 Held with New Jersey Cash Management 707,011 Collateralized in the District’s Name Under GUDPA 3,535,635
Total $ 4,927,080
Note 3. Reserve Accounts
A. Capital Reserve
A capital reserve account was established by the Logan Township Board of Education by inclusion of $150,000 in the original 1995-96 annual capital budget, which was certified for taxes and for the accumulation of funds for use as capital outlay expenditures in subsequent fiscal years. The capital reserve account is maintained in the general fund and its activity is included in the general fund annual budget.
Funds placed in the capital reserve account are restricted to capital projects in the district’s approved Long Range Facilities Plan (LRFP). Upon submission of the LRFP to the department, a district may increase the balance in the capital reserve by appropriating funds in the annual general fund budget certified for taxes or by transfer by Board resolution at year-end of any unanticipated revenue or unexpended line-item appropriation amounts, or both. A district may also appropriated additional amounts when the express approval of the voters has been obtained either by a separate proposal at budget time or by a special question at one of the four special elections authorized pursuant to N.J.S.A.19:60-2. Pursuant to N.J.A.C.6:23A-14.1(g), the balance in the account cannot at any time exceed the local support costs of uncompleted capital projects in its approved LRFP.
The activity of the capital reserve for the July 1, 2013 to June 30, 2014 fiscal year is as follows: Beginning Balance, July 1, 2013 290,704$ Interest Earnings 164 Board Approved Transfer -
Ending Balance, June 30, 2014 290,868$
B. Maintenance Reserve
The District established a Maintenance Reserve Account for the accumulation of Funds for use as maintenance expenditures in subsequent fiscal years. The Maintenance Reserve Account is maintained in the general fund and its activity is included in the general fund annual budget.

LOGAN TOWNSHIP BOARD OF EDUCATION
NOTES TO THE FINANCIAL STATEMENTS FOR THE YEAR ENDED JUNE 30, 2014
Note 3. Reserve Accounts
B. Maintenance Reserve (continued):
Funds placed in the maintenance reserve account are restricted to maintenance projects in the District’s approved Maintenance Plan (M-1). A district may increase the balance in the maintenance reserve by appropriating funds in the annual general fund budget certified for taxes or by transfer by Board resolution at year-end of any unanticipated revenue or unexpended line-item appropriation amounts, or both.
The activity of the maintenance reserve for the July 1, 2013 to June 30, 2014 fiscal year is as follows:
Beginning Balance, July 1, 2013 415,907$
Interest Earnings 235
Board Approved Transfer -
Ending Balance, June 30, 2014 416,142$
C. Tuition Reserve
A tuition reserve account may be established in accordance with N.J.A.C.6A:23-3.1(f) for tuition between two Boards of Education that are in a formal sending/receiving relationship. The maximum amount that may be restricted at year end is 10% of the estimated contract year. Upon certification of tuition rates in the second year following the contract year, full appropriation of the applicable year's reserve must be liquidated and any remaining balance related to that year must be reserved and budgeted for tax relief. The District's tuition reserve account balance of $318,773 as of June 30, and was established during 2012/2013 to be used to pay for any tuition adjustments for the fiscal year ending June 30, 2015.
Note 4. Accounts Receivable
Accounts receivable at June 30, 2014 consisted of accounts and intergovernmental grants. All receivables are considered collectible in full due to the stable condition of state programs and the current fiscal year guarantee of federal funds. Accounts receivable as of fiscal year end for the School District’s individual major and fiduciary funds, in the aggregate, are as follows:
General Special Revenue Capital Projects ProprietaryFund Fund Fund Funds Total
Intergovernmental 108,325$ 136,678$ 31,103$ 9,347$ 285,453$
Total 108,325$ 136,678$ 31,103$ 9,347$ 285,453$

LOGAN TOWNSHIP BOARD OF EDUCATION
NOTES TO THE FINANCIAL STATEMENTS FOR THE YEAR ENDED JUNE 30, 2014
Note 5. Transfers to Capital Outlay
During the year ending June 30, 2014, the District transferred $307,253 to the capital outlay account.
Note 6. Capital Assets
The following schedule is a summarization of the capital assets by source for the fiscal year ended June 30, 2014:
June 30, June 30,2013 Additions Deletions Adjustments 2014
Non-Depreciable AssetsLand 115,872$ -$ -$ -$ 115,872$ Construction in Progress - 77,758 - - 77,758
Total Non-Depreciable Assets 115,872 77,758 - - 193,630
Depreciable AssetsLand Improvments 649,984 32,265 - - 682,249 Buildings 19,262,969 75,451 - - 19,338,420 Machinery & Equipment 1,547,965 212,151 (23,690) 9,130 1,745,556
Subtotal 21,576,790 397,625 (23,690) 9,130 21,959,855
Accumulated DepreciationLand Improvments (553,455) (14,384) - - (567,839) Buildings (9,682,586) (458,278) - - (10,140,864) Machinery & Equipment (893,621) (146,692) 23,690 - (1,016,623)
Total 10,447,128$ (221,729)$ -$ 9,130$ 10,234,529$
The following is a summary of proprietary fund type fixed assets at June 30, 2014:
June 30, June 30,2013 Additions Deletions 2014
Depreciable AssetsEquipmemt 166,999$ -$ -$ 166,999$
Subtotal 166,999 - - 166,999
Accumulated DepreciationEquipment (144,668) (5,020) - (149,688)
Total 22,331$ (5,020)$ -$ 17,311$

LOGAN TOWNSHIP BOARD OF EDUCATION
NOTES TO THE FINANCIAL STATEMENTS FOR THE YEAR ENDED JUNE 30, 2014
Note 7. Long-Term Obligations
During the fiscal year ended June 30, 2014 the following changes occurred in liabilities reported in the long-term debt:
June 30, June 30, Due Within2013 Retired Additions 2014 One Year
General Obligations Bonds 3,835,000$ 1,160,000$ -$ 2,675,000$ 515,000$ Capital Lease 235,050 123,554 88,644 200,140 117,734 Compensated Absences Payable 244,353 - 13,127 257,480 -
Total Long-Term Obligations 4,314,403$ 1,283,554$ 101,771$ 3,132,620$ 632,734$
Bonds and loans payable have been liquidated in the Debt Service Fund compensated absences have been liquidated in the General Fund.
A. Bonds Payable
The voters of the municipality through referendums authorize bonds in accordance with state law. All bonds are retired in serial installments within the statutory period of usefulness. Bonds issued by the District are general obligation bonds.
Principal and interest due on the 2002 Serial Bonds outstanding is as follows:
Year-endingJune 30, Principal Interest Total
2015 515,000$ 95,338$ 610,338$2016 530,000 74,438 604,4382017 545,000 53,619 598,6192018 540,000 32,600 572,6002019 545,000 10,900 555,900
Total 2,675,000$ 266,895$ 2,941,895$
B. Bonds Authorized But Not Issued
As of June 30, 2014, the Board had no authorized but not issued bonds.
C. Capital Lease Payable
As of June 30, 2014, the District had five capital leases outstanding for the acquisition of equipment in the amount of $200,140.

LOGAN TOWNSHIP BOARD OF EDUCATION
NOTES TO THE FINANCIAL STATEMENTS FOR THE YEAR ENDED JUNE 30, 2014
Note 7. Long-Term Obligations (continued):
The following is a schedule of the future minimum lease payments under this lease and present value of the net minimum lease payments at June 30, 2014:
Year-ending June 30, 2015 $131,153 2016 60,923 2017 24,934 2018 3,181
Total Minimum Lease Payments 220,191 Less: Amount Representing Interest (20,051)
Present Value of Net Minimum Lease Payments $200,140
D. Interest Expense
No interest expense was capitalized during the fiscal year ending June 30, 2014. Interest expense totaling $130,678 was paid by the debt service fund for the fiscal year ending June 30, 2014.
Note 8. Pension Plans
Plan Descriptions - All required employees of the District are covered by either the Public Employees’ Retirement System or the Teachers’ Pension and Annuity Fund which have been established by state statute and are administered by the New Jersey Division of Pension and Benefits (Division). According to the State of New Jersey Administrative Code, all obligations of both systems will be assumed by the State of New Jersey should the Systems terminate. The Division issues a publicly available financial report that includes the financial statements and required supplementary information for the Public Employees Retirement System and the Teachers’ Pension and Annuity Fund. These reports may be obtained by writing to the Division of Pensions and Benefits, P.O. Box 295, Trenton, New Jersey, 08625.
Teachers' Pension and Annuity Fund (TPAF) - The Teachers' Pension and Annuity Fund was established in January 1955, under the provisions of N.J.S.A.18A:66 to provide retirement benefits, death, disability and medical benefits to certain qualified members. The Teachers’ Pension and Annuity Fund is considered a cost-sharing multiple-employer plan with a special funding situation, as under current statute, all employer contributions are made by the State of New Jersey on behalf of the District and the system’s other related noncontributing employers. Membership is mandatory for substantially all teachers or members of the professional staff certified by the State Board of Examiners and employees of the Department of Education who have titles that are unclassified, professional and certified.
Public Employees' Retirement System (PERS) - The Public Employees' Retirement System (PERS) was established in January 1955 under the provisions of N.J.S.A.43:15A to provide retirement, death, disability and medical benefits to certain qualified members. The Public Employees’ Retirement System is a cost-sharing multiple-employer plan. Membership is mandatory for substantially all full-time employees of the State of New Jersey or any county, municipality, school district, or public agency,provided the employee is not required to be a member of another state-administered retirement system or other state or local jurisdiction.

LOGAN TOWNSHIP BOARD OF EDUCATION
NOTES TO THE FINANCIAL STATEMENTS FOR THE YEAR ENDED JUNE 30, 2014
Note 8. Pension Plans (continued):
Vesting and Benefit Provisions - The vesting and benefit provisions of PERS are set by N.J.S.A.43:15Aand 43.3B and N.J.S.A.18A:66 for TPAF. All benefits vest after eight to ten years of service, except for medical benefits that vest after 25 years of service. Retirement benefits for age and service are available at age 55 and are generally determined to be 1/55 of the final average salary for each year of service credit, as defined. Final average salary equals the average salary for the final three years of service prior to retirement (or highest three years’ compensation if other than the final three years). Members may seek early retirement after achieving 25 years of service credit or they may elect deferred retirement after achieving eight to ten years of service in which case benefits would begin the first day of the month after the member attains normal retirement age. The TPAF and PERS provides for specified medical benefits for members who retire after achieving 25 years of qualified service, as defined, or under the disability provisions of the System.
Members are always fully vested for their own contributions and, after three years of service credit, become vested for 2% of related interest earned on the contributions. In the case of death before retirement, members’ beneficiaries are entitled to full interest credited to the members’ accounts.
Chapter 78, P.L. 2011 changed this for employees enrolled after June 28, 2011. See Significant Legislation below.
Significant Legislation – During the year ended June 30, 1997, legislation was enacted (Chapter 114, P.L. 1997) authorizing the New Jersey Economic Development Authority to issue bonds, notes or other obligations for the purpose of financing, in full or in part, the State of New Jersey’s portion of the unfunded accrued liability under the State of New Jersey retirement systems. Additional legislation enacted during the year ended June 30, 1997 (Chapter 115, P.L. 1997) changed the asset valuation method from market related value to full-market value. This legislation also contained a provision to reduce the employee contribution rate by ½ of 1% to 4.5% for calendar years 1998 and 1999, and to allow for a reduction in the employee’s rate after calendar year 1999, providing excess valuation assets are available. The legislation also provided that the District’s normal contributions to the Fund may be reduced based on the revaluation of assets. Due to recognition of the bond proceeds and the change in asset valuation method as a result of enactment of Chapters 114 and 115, all unfunded accrued liabilities were eliminated, except for the unfunded liability for local early retirement incentive benefits; accordingly, the pension costs for TPAF and PERS were reduced.
New Legislation signed by the Acting Governor (Chapter 133, Public Laws 2001) changed the formula for calculating retirement benefits for all current and future non-veteran retirees from N/60 to N/55 (a 9.09% increase). This legislation, signed June 29, 2001, provides that all members of the TPAF and the PERS will have their pensions calculated on the basis of years of credit divided by 55. It also provides that all current retirees will have their original pension recalculated under the N/55 formula. Starting February 1, 2002, pension cost of living adjustments will be based on the new original pension.
Effective June 28, 2011, Chapter 78, P.L. 2011 reformed various pension and health benefits provisions. Employees hired after June 28, 2011 and enrolled in PERS will be enrolled in a new tier, Tier 5. Full retirement for Tier 5 PERS members will be age 65 and 30 years of service.
All cost of living adjustments are frozen until the pension fund reaches a “target funded ratio”.

LOGAN TOWNSHIP BOARD OF EDUCATION
NOTES TO THE FINANCIAL STATEMENTS FOR THE YEAR ENDED JUNE 30, 2014
Note 8. Pension Plans (continued):
Chapter 78 also requires all covered employees to contribute a prescribed percentage towards their health costs.
Contribution Requirements – The contribution policy is set by N.J.S.A.43:15A, Chapter 62, P.L. of 1994, Chapter 115, P.L. of 1997 and N.J.S.A.18:66, and requires contributions by active members and contributing employers. Plan member and employer contributions may be amended by State of New Jersey legislation. TPAF and PERS provide for employee contributions of 6.5%, effective October 1, 2011, of employees’ annual compensation, as defined. The rate will increase over the next seven years to 7.5%. Employers are required to contribute at an actuarially determined rate in both TPAF and PERS. The actuarially determined contribution includes funding for both cost-of-living adjustments, noncontributory death benefits and post-retirement medical premiums. Under current statute the District is a noncontributing employer of the TPAF.
Three-Year Trend Information for PERS
Annual Percentage Net Year Pension of APC Pension Funding Cost (APC) Contributed Obligation
6/30/14 $ 99,505 100% $ -0- 6/30/13 98,857 100% -0- 6/30/12 115,174 100% -0-
Three-Year Trend Information for TPAF Pension & Post-Retirement Medical Contributions (Paid on behalf of the District)
Annual Percentage Net Year Pension/Medical of APC Pension Funding Cost (APC) Contributed Obligation
6/30/14 $687,699 100% $ -0- 6/30/13 819,503 100% -0- 6/30/12 594,120 100% -0-
During the year ended June 30, 2014 the State of New Jersey contributed $687,699 to the TPAF for normal post-retirement benefits on behalf of the District. Also in accordance with N.J.S.A.18A:66-66 the State of New Jersey reimbursed the District $435,986 for the year ended June 30, 2014 for the employer's share of social security contributions for TPAF members as calculated on their base salaries. This amount has been included in the basic financial statements, and the combining and individual fund and account group statements and schedules as a revenue and expenditure in accordance with GASB 27.

LOGAN TOWNSHIP BOARD OF EDUCATION
NOTES TO THE FINANCIAL STATEMENTS FOR THE YEAR ENDED JUNE 30, 2014
Note 9. Post-Retirement Benefits
Chapter 384 of Public Laws 1987 and Chapter 6 of Public Laws 1990 required Teachers’ Pensions and Annuity Fund (TPAF) and the Public Employees’ Retirement System (PERS), respectively, to fund post-retirement medical benefits for those State Employees who retire after accumulating 25 years of credited service or on a disability retirement. P.L. 2007, c.103 amended the law to eliminate the funding of post-retirement medical benefits through the TPAF and PERS. It created separate funds outside of the pension plans for the funding and payment of post-retirement medical benefits for retired State employees and retired educational employees. As of June 30, 2013, there were 100,134 retirees receiving post-retirement medical benefits, and the state contributed $1.07 billion on their behalf. The cost of these benefits is funded through contributions by the State in accordance with P.L. 1994, c.62. Funding of post-retirement medical premiums changed from a prefunding basis to a pay-as-you-go basis beginning in Fiscal Year 1994.
The State is also responsible for the cost attributable to P.L. 1992, c.126, which provides employer paid health benefits to members of PERS and the Alternate Benefit Program who retired from a board of education or county college with 25 years of service. The State paid $173.8 million toward Chapter 126 benefits for 17,356 eligible retired members in Fiscal Year 2013.
Note 10. Risk Management
The District is exposed to various risks of loss related to torts; theft of, damage to and destruction of assets; errors and omissions; injuries to employees; and natural disasters.
Property and Liability Insurance – The District maintains commercial insurance coverage for property, liability, student accident and surety bonds. A complete schedule of insurance coverage can be found in the Statistical Section of this Comprehensive Annual Financial Report.
New Jersey Unemployment Compensation Insurance – The District has elected to fund their New Jersey Unemployment Compensation Insurance under the “Benefit Reimbursement Method”. Under this plan the District is required to reimburse the New Jersey Unemployment Trust Fund for benefits paid to its former employees and charged to its account with the State. The District is billed quarterly for amounts due to the State. The following is a summary of School District contributions, employee contributions and reimbursements to the State for benefits paid and the ending balance of the School District’s expendable trust fund for the current and previous two years:
District Employee Amount Ending Fiscal Year Contributions Contributions Reimbursed Balance
2013-2014 $ 3 $10,602 $ 4,896 $24,373 2012-2013 3 13,227 1,461 18,664 2011-2012 2 3,679 3,006 6,895

LOGAN TOWNSHIP BOARD OF EDUCATION
NOTES TO THE FINANCIAL STATEMENTS FOR THE YEAR ENDED JUNE 30, 2014
Note 10. Risk Management (continued):
Joint Insurance Fund – The Township of Logan School District participates in the School Alliance Insurance Fund (SAIF), which was formed in 1996. SAIF is a Joint Insurance Fund organized under New Jersey law and is regulated by the New Jersey Department of Banking and Insurance. The Fund provides its members with the following coverage’s:
Property – Blanket Building and Grounds Boiler and Machinery General and Automobile Liability Workers’ Compensation School Board Legal Liability Crime Coverage Pollution
Note 11. Contingent Liabilities
The District participates in numerous state and federal grant programs, which are governed by various rules and regulations of the grantor agencies; therefore, to the extent that the District has not complied with the rules and regulations governing the grants, refunds of any money received may be required and the collectability of any related receivable at June 30, 2014 may be impaired. In the opinion of the District, there are no significant contingent liabilities relating to compliance with the rules and regulations governing the respective grants; therefore, no provisions have been recorded in the accompanying combined financial statements for such contingencies.
Note 12. Economic Dependency
The District receives a substantial amount of its support from federal and state governments. A significant reduction in the level of support, if this were to occur, could have an effect on the District’s programs and activities.
Note 13. Fund Balance Disclosures
General Fund (Exhibit B-1) – Of the $3,505,921 General Fund balance at June 30, 2014; $318,773 has been restricted for Tuition Reserve and has been appropriated and included as anticipated revenue for the year ending June 30, 2015; $416,142 has been restricted for Maintenance Reserve; $290,868 has been restricted for Capital Reserve; $1,159,604 has been restricted as excess surplus and has been appropriated and included as anticipated revenue for year ending June 30, 2015: $1,318,713has been restricted for excess surplus and $1,821 is unassigned.
Capital Projects Fund (Exhibit B-1) – The fund balance of $299,545 has been restricted for the Capital Projects Fund.
Debt Service Fund (Exhibit B-1) – The fund balance of $2 has been restricted for the Debt Service Fund.

LOGAN TOWNSHIP BOARD OF EDUCATION
NOTES TO THE FINANCIAL STATEMENTS FOR THE YEAR ENDED JUNE 30, 2014
Note 14. Deferred Compensation
The Board offers its employees a choice of the following deferred compensation plans created in accordance with Internal Revenue Code Section 403(b). The plans, which are administered by the entities listed below, permits participants to defer a portion of their salary until future years. Amounts deferred under the plans are not available to employees until termination, retirement, death or unforeseeable emergency. The plan administrators are as follows:
AXA Equitable ING Financial Services
Note 15. Compensated Absences
The District accounts for compensated absences (e.g., unused vacation, sick leave) as directed by Governmental Accounting Standards Board Statement No. 16 (GASB 16), “Accounting for Compensated Absences”. A liability for compensated absences attributable to services already rendered and not contingent on a specific event that is outside the control of the employer and employee is accrued as employees earn the rights to the benefits. District employees are granted vacation and sick leave in varying amounts under the District's personnel policies. In the event of termination, an employee is reimbursed for accumulated vacation. Sick leave benefits provide for ordinary sick pay and begin vesting with the employee after four years of service.
The liability for vested compensated absences of the governmental fund types is recorded in the statement of net assets under governmental activities. The current portion of the compensated absence balance is not considered material to the applicable funds total liabilities, and is therefore not shown separately from the long-term liability balance of compensated absences. The amount at June 30, 2014 is $257,480.
The liability for vested compensated absences of the proprietary fund types is recorded within those funds as the benefits accrue to employees. As of June 30, 2014 no liability existed for compensated absences in the proprietary fund types.
Note 16. Calculation of Excess Surplus
In accordance with N.J.S.A.18A:7F-7, as amended by P.L. 2004, c.73 (S1701), the designation for Restricted Fund Balance – Excess Surplus is a required calculation pursuant to the New Jersey School Funding Reform Act of 2008 (SFRA). New Jersey school districts are required to restrict General Fund fund balance at the fiscal year-end of June 30 if they did not appropriate a required minimum amount as budgeted fund balance in their subsequent years’ budget. The excess fund balance at June 30, 2014 is $1,318,713.

LOGAN TOWNSHIP BOARD OF EDUCATION
NOTES TO THE FINANCIAL STATEMENTS FOR THE YEAR ENDED JUNE 30, 2014
Note 17. Deficit Fund Balance
The District has a deficit fund balance of $3,630 in the Special Revenue Fund as of June 30, 2014 as reported in the fund statements (modified accrual basis). N.J.S.A. 18A:22-44.2 provides that in the event a state school aid payment is not made until the following school budget year, districts must record the delayed one or more June state aid payments as revenue, for budget purposes only, in the current school budget year. The bill provides legal authority for school districts to recognize this revenue in the currentbudget year. For intergovernmental transactions, GASB Statement No. 33 requires that recognition (revenue, expenditure, asset, liability) should be in symmetry, i.e., if one government recognizes an asset, the other government recognizes a liability. Since the State is recording the June state aid payment(s) in the subsequent fiscal year, the school district cannot recognize the June state aid payment(s) (on the GAAP financial statements) until the year the State records the payable. Due to the timing difference of recording the June state aid payment, the Special Revenue Fund balance deficit does not alone indicate that the district is facing financial difficulties.

This page intentionally left blank

REQUIRED SUPPLEMENTARY INFORMATION - PART II

This page intentionally left blank

C. Budgetary Comparison Schedules

This page intentionally left blank

EXH
IBIT
C-1
(Pag
e 1
of 1
1)
VA
RIA
NC
EV
AR
IAN
CE
FIN
AL
TOFI
NA
L TO
AC
TUA
LA
CTU
AL
AC
CO
UN
TO
RIG
INA
LB
UD
GET
FIN
AL
FAV
OR
AB
LE/
OR
IGIN
AL
BU
DG
ETFI
NA
LFA
VO
RA
BLE
/N
UM
BER
SB
UD
GET
TRA
NSF
ERS
BU
DG
ETA
CTU
AL
(UN
FAV
OR
AB
LE)
BU
DG
ETTR
AN
SFER
SB
UD
GET
AC
TUA
L(U
NFA
VO
RA
BLE
)R
even
ues:
L
ocal
Sou
rces
:
L
ocal
Tax
Lev
y10
-121
0-00
0-00
011
,337
,254
$
-$
11
,337
,254
$ 11
,337
,254
$ -
$
11
,114
,955
$ -
$
11
,114
,955
$ 11
,114
,955
$ -
$
T
uitio
n fr
om In
divi
dual
s10
-131
0-00
0-00
075
,000
-
75,0
00
83,0
90
8,09
0
13
1,50
0
-
13
1,50
0
187,
404
(187
,404
)
T
uitio
n fr
om L
EA's
With
in S
tat e
10-1
320-
000-
000
40,0
00
-
40
,000
10
3,85
5
63,8
55
-
-
-
--
Tui
tion
from
Oth
er S
ourc
e s10
-134
0-00
0-00
0-
--
44
,560
44
,560
-
-
--
-
I
nter
est E
arne
d on
Ca p
ital
Res
erve
10-1
000-
000-
000
125
-12
516
540
12
5-
125
79(4
6)
I
nter
est E
arne
d on
Mai
nten
anc e
Res
erve
10-1
000-
000-
000
250
-25
023
6(1
4)
250
-
25
015
6(9
4)
M
isce
llane
ous
10-1
000-
000-
000
10,0
00
-
10
,000
22
,876
12
,876
10
,000
-
10
,000
67,4
11
57
,411
Tot
al L
ocal
Sou
rce s
11,4
62,6
29
-
11
,462
,629
11,5
92,0
3612
9,40
7
11,2
56,8
30
-
11
,256
,830
11
,370
,005
(130
,133
)
Sta
te S
ourc
es:
Extra
ordi
nar y
Aid
10-3
000-
000-
000
--
-
46,3
90
46,3
90
-
-
-
47
,454
47,4
54
O
ther
Sta
te A
i d10
-320
0-00
0-00
0-
--
14
,852
14
,852
-
-
-
16,1
79
16
,179
Cat
e gor
ical
Spe
cial
Edu
catio
n A
id10
-313
2-00
0-00
063
3,95
3
-
633,
953
63
3,95
3
-
63
2,90
8
-
63
2,90
8
632,
908
-
E qua
lizat
ion
Aid
10-3
176-
000-
000
3,99
0,95
0
-
3,
990,
950
3,99
0,95
0
-
4,16
4,08
4
-
4,16
4,08
4
4,
164,
084
-
C
ate g
oric
al S
ecur
ity A
id10
-317
7-00
0-00
010
1,62
1
-
101,
621
10
1,62
1
-
99
,843
-
99
,843
99,8
43
-
Cat
e gor
ical
Tra
nspo
rtatio
n A
id10
-312
1-00
0-00
038
4,54
4
-
384,
544
38
4,54
4
-
37
2,37
9
-
37
2,37
9
372,
379
-
Ad j
ustm
ent A
id10
-317
8-00
0-00
022
0,29
9
-
220,
299
22
0,29
9
-
51
,503
-
51
,503
51,5
03
-
Non
bud g
eted
:
On-
Beh
alf T
PAF
Pens
ion
Con
tribu
tion s
-
-
-
260,
529
26
0,52
9
-
-
38
4,60
8
384,
608
O
n-B
ehal
f TPA
F M
edic
al C
ontri
butio
n s-
-
-
42
7,17
0
427,
170
-
-
434,
895
43
4,89
5
Rei
mbu
rsed
TPA
F So
cial
Con
tribu
tion s
-
-
-
435,
986
43
5,98
6
-
-
43
8,60
4
438,
604
Tot
al S
tate
Sou
rces
5 ,33
1,36
7
-
5,
331,
367
6,51
6,29
4
1,
184,
927
5,32
0,71
7
-
5,32
0,71
7
6,
642,
457
1,32
1,74
0
T
otal
Rev
enue
s16
,793
,996
-
16,7
93,9
9618
,108
,330
1,31
4,33
4
16
,577
,547
-
16,5
77,5
47
18,0
12,4
62
1,19
1,60
7
Expe
nditu
res:
C
urre
nt E
x pen
se:
Ins
truct
ion
- Reg
ular
Pro
gram
s:
Sa
larie
s of T
each
ers:
P
resc
hool
11-1
05-1
00-1
0180
,770
(3,2
41)
77,5
29
76,5
99
930
77
,697
(1,9
17)
75,7
80
75
,343
437
K
inde
r gar
ten
11-1
10-1
00-1
0146
3,20
1
42,1
47
50
5,34
8
498,
817
6,
531
450,
208
(4,5
25)
445,
683
43
7,62
0
8,06
3
Gra
des 1
- 5
11-1
20-1
00-1
012,
020,
928
10,8
68
2,
031,
796
2,01
0,18
9
21
,607
1,
982,
234
17,9
66
2,00
0,20
0
1,
996,
253
3,94
7
Gra
des 6
- 8
11-1
30-1
00-1
011,
666,
110
(104
,535
)1,
561,
575
1,54
2,35
4
19
,221
1,
665,
623
(32,
491)
1,63
3,13
2
1,
628,
844
4,28
8
JUN
E 30
, 201
3JU
NE
30, 2
014
LO
GA
N T
OW
NSH
IP B
OA
RD
OF
ED
UC
AT
ION
BU
DG
ET
AR
Y C
OM
PAR
ISO
N S
CH
ED
UL
EG
EN
ER
AL
FU
ND
FOR
TH
E F
ISC
AL
YE
AR
S E
ND
ED
JU
NE
30,
201
4 A
ND
201
3

EXH
IBIT
C-1
(Pag
e 2
of 1
1)
VA
RIA
NC
EV
AR
IAN
CE
FIN
AL
TOFI
NA
L TO
AC
TUA
LA
CTU
AL
AC
CO
UN
TO
RIG
INA
LB
UD
GET
FIN
AL
FAV
OR
AB
LE/
OR
IGIN
AL
BU
DG
ETFI
NA
LFA
VO
RA
BLE
/N
UM
BER
SB
UD
GET
TRA
NSF
ERS
BU
DG
ETA
CTU
AL
(UN
FAV
OR
AB
LE)
BU
DG
ETTR
AN
SFER
SB
UD
GET
AC
TUA
L(U
NFA
VO
RA
BLE
)
I
nstru
ctio
n - R
egul
ar P
rogr
ams:
Hom
e In
stru
ctio
n:
Sal
arie
s of T
each
ers
11-1
50-1
00-1
014,
000
(1,6
14)
2,38
6
1,
807
579
4,
000
(2,0
21)
1,97
9
1,
979
-
Pur
chas
ed P
rofe
ssio
nal -
Edu
catio
nal S
ervi
ces
11-1
50-1
00-3
202,
500
1,
714
4,
214
4,21
4
-
2,50
0
5,
370
7,87
0
7,
868
2
Oth
er P
urch
ased
Ser
vice
s11
-150
-100
-500
100
(100
)-
-
-
100
(100
)-
--
Reg
ular
Pro
gram
s - U
ndis
tribu
ted
Inst
ruct
ion
Oth
er S
alar
ies f
or In
stru
ctio
n11
-190
-100
-106
84,2
06(9
62)
83,2
44
78,8
40
4,40
4
78
,463
(32,
442)
46,0
21
46
,021
-
Pu
rcha
sed
Prof
essi
onal
-
Edu
catio
nal S
ervi
ces
11-1
90-1
00-3
205,
500
11
1,66
8
117,
168
11
3,26
3
3,90
5
13
,500
(1,0
00)
12,5
00
-
12
,500
Purc
hase
d Te
chni
cal S
ervi
ces
11-1
90-1
00-3
4066
,267
(10,
635)
55,6
32
44,7
11
10,9
21
80,7
90(1
0,00
0)70
,790
68,6
79
2,
111
Oth
er P
urch
ased
Ser
vice
s11
-190
-100
-500
391,
194
-
39
1,19
4
319,
523
71
,671
36
0,29
3
11,2
87
371,
580
36
0,92
5
10,6
55
G
ener
al S
uppl
ies
11-1
90-1
00-6
1024
3,70
5
677
244,
382
19
2,36
7
52,0
15
255,
538
20
,863
27
6,40
1
176,
506
99
,895
Text
book
s11
-190
-100
-640
48,4
30
5,
500
53
,930
35
,302
18
,628
49
,745
4,06
8
53
,813
27,3
19
26
,494
Oth
er O
bjec
ts11
-190
-100
-800
11,0
60
-
11
,060
7,
515
3,54
5
10
,660
(300
)10
,360
6,43
8
3,
922
T
otal
Re g
ular
Pro
gram
s - In
stru
ctio
n5,
087,
971
51,4
87
5,
139,
458
4,92
5,50
1
21
3,95
7
5,03
1,35
1(2
5,24
2)5,
006,
109
4,83
3,79
5
17
2,31
4
S
peci
al E
duca
tion:
Lea
rnin
g &
Lan
guag
e D
isab
ilitie
s
Sa
larie
s of T
each
ers
11-2
04-1
00-1
0112
0,37
9(1
,400
)11
8,97
9
118,
979
-
119,
202
1,
350
120,
552
12
0,31
4
238
Oth
er S
alar
ies f
or In
stru
ctio
n11
-204
-100
-106
700
-70
0-
700
21
,960
(21,
871)
8989
-
Pu
rcha
sed
Prof
essi
onal
-
Edu
catio
nal S
ervi
ces
11-2
04-1
00-3
20-
1,
607
1,
607
1,60
7
-
-
-
-
-
-
Gen
eral
Sup
plie
s11
-204
-100
-610
1,35
0
-
1,35
0
1,
083
267
1,
340
-
1,
340
200
1,
140
Tot
al L
earn
ing
& L
angu
age
Dis
abili
ties
122,
429
20
7
12
2,63
6
121,
669
96
7
142,
502
(20,
521)
121,
981
12
0,60
3
1,37
8
Mul
ti ple
Dis
abili
ties
Sala
ries o
f Tea
cher
s11
-212
-100
-101
82,6
56(1
,360
)81
,296
81
,296
-
85,3
30(4
,782
)80
,548
80,5
48
-
Oth
er S
alar
ies f
or In
stru
ctio
n11
-212
-100
-106
44,2
80(1
3)
44
,267
43
,069
1,
198
21,9
60
21
,196
43
,156
43,1
56
-
Purc
hase
d Pr
ofes
sion
al -
E
duca
tiona
l Ser
vice
s11
-212
-100
-320
-
1,52
2
1,52
2
1,
522
-
-
-
-
-
-
G
ener
al S
uppl
ies
11-2
12-1
00-6
101,
200
-
1,
200
1,08
2
11
8
1,20
0
-
1,20
0
1,
200
-
Tot
al M
ulti p
le D
isab
ilitie
s12
8,13
6
149
128,
285
12
6,96
9
1,31
6
10
8,49
0
16,4
14
124,
904
12
4,90
4
-
Res
ourc
e R
oom
/Res
ourc
e C
ente
r :
Sa
larie
s of T
each
ers
11-2
13-1
00-1
0135
8,41
5
8,59
2
367,
007
36
6,54
4
463
36
6,58
2(1
02,7
04)
263,
878
26
3,82
3
55
O
ther
Sal
arie
s for
Inst
ruct
ion
11-2
13-1
00-1
0622
,590
-
22,5
90
21,3
62
1,22
8
22
,060
(164
)21
,896
21,8
96
-
Purc
hase
d Pr
ofes
sion
al -
E
duca
tiona
l Ser
vice
s11
-213
-100
-320
-
5,00
0
5,00
0
3,
968
1,03
2
-
-
--
-
G
ener
al S
uppl
ies
11-2
13-1
00-6
103,
600
-
3,
600
3,09
1
50
9
3,35
8
-
3,35
8
3,
278
80
Tot
al R
esou
rce
Roo
m/R
esou
rce
Cen
ter
384,
605
13
,592
398,
197
39
4,96
5
3,23
2
39
2,00
0(1
02,8
68)
289,
132
28
8,99
7
135
P
resc
hool
Dis
abili
ties -
Par
t-Tim
e
Sal
arie
s of T
each
ers
11-2
15-1
00-1
0128
,922
(594
)28
,328
28
,328
-
28,1
41(3
34)
27,8
07
27
,807
-
Oth
er S
alar
ies f
or In
stru
ctio
n11
-215
-100
-106
11,5
05
3,
735
15
,240
14
,694
54
6
10,2
01
88
7
11,0
88
11
,088
-
Pu
rcha
sed
Prof
essi
onal
-
Edu
catio
nal S
ervi
ces
11-2
15-1
00-3
20-
497
497
419
78
G
ener
al S
uppl
ies
11-2
15-1
00-6
1035
0-
350
100
250
35
0
-
35
034
73
BU
DG
ET
AR
Y C
OM
PAR
ISO
N S
CH
ED
UL
EFO
R T
HE
FIS
CA
L Y
EA
RS
EN
DE
D J
UN
E 3
0, 2
014
AN
D 2
013
JUN
E 30
, 201
4JU
NE
30, 2
013
LO
GA
N T
OW
NSH
IP B
OA
RD
OF
ED
UC
AT
ION
GE
NE
RA
L F
UN
D

EXH
IBIT
C-1
(Pag
e 3
of 1
1)
VA
RIA
NC
EV
AR
IAN
CE
FIN
AL
TOFI
NA
L TO
AC
TUA
LA
CTU
AL
AC
CO
UN
TO
RIG
INA
LB
UD
GET
FIN
AL
FAV
OR
AB
LE/
OR
IGIN
AL
BU
DG
ETFI
NA
LFA
VO
RA
BLE
/N
UM
BER
SB
UD
GET
TRA
NSF
ERS
BU
DG
ETA
CTU
AL
(UN
FAV
OR
AB
LE)
BU
DG
ETTR
AN
SFER
SB
UD
GET
AC
TUA
L(U
NFA
VO
RA
BLE
)
T
otal
Pre
scho
ol D
isab
ilitie
s - P
art-T
ime
40,7
77
3,
638
44
,415
43
,541
87
4
38,6
92
55
3
39,2
45
39
,242
3
T
otal
Spe
cial
Edu
catio
n67
5,94
7
17,5
86
69
3,53
3
687,
144
6,
389
681,
684
(106
,422
)57
5,26
2
573,
746
1,
516
B
asic
Ski
lls/R
emed
ial :
Sal
arie
s of T
each
ers
11-2
30-1
00-1
0127
8,14
7(9
,926
)26
8,22
1
215,
096
53
,125
27
7,03
0
106,
007
383,
037
38
3,03
7
-
P
urch
ased
Pro
fess
iona
l -
Ed
ucat
iona
l Ser
vice
s11
-230
-100
-320
-
6,08
1
6,08
1
5,
700
381
G
ener
al S
uppl
ies
11-2
30-1
00-6
103,
000
24
8
3,
248
1,33
0
1,
918
4,80
5
-
4,80
5
3,
489
1,31
6
T
otal
Bas
ic S
kills
/Rem
edia
l28
1,14
7(3
,597
)27
7,55
0
222,
126
55
,424
28
1,83
5
106,
007
387,
842
38
6,52
6
1,31
6
B
ilin g
ual E
duca
tion
- Ins
truct
ion
Gen
eral
Sup
plie
s11
-240
-100
-610
300
-30
0-
300
-
-
-
-
-
T
otal
Bili
n gua
l Edu
catio
n - I
nstru
ctio
n30
0
-
30
0
-
300
-
-
-
-
-
S
choo
l Spo
nsor
ed C
ocur
ricul
ar A
ctiv
ities
:
S
alar
ies
11-4
01-1
00-1
0031
,488
-
31,4
88
20,2
97
11,1
91
30,5
00
-
30,5
00
25
,349
5,15
1
P
urch
ased
Ser
vice
s11
-401
-100
-500
--
--
-
4,
097
-
4,
097
601
3,
496
Sup
plie
s and
Mat
eria
ls11
-401
-100
-600
19,7
00
-
19
,700
9,
073
10,6
27
18,3
65
-
18,3
65
7,
871
10,4
94
T
otal
Sch
ool S
pons
ored
Coc
urric
ular
Act
iviti
es51
,188
-
51,1
88
29,3
70
21,8
18
52,9
62
-
52,9
62
33
,821
19,1
41
O
ther
Inst
ruct
iona
l Pro
gram
s - In
stru
ctio
n
S
alar
ies
11-4
03-1
00-1
004,
400
-
4,
400
4,40
0
-
4,40
0
-
4,40
0
4,
400
-
P
urch
ased
Ser
vice
s11
-403
-100
-500
3,30
0
-
3,30
0
3,
300
-
3,
100
200
3,
300
3,30
0
-
Sup
plie
s and
Mat
eria
ls11
-403
-100
-600
2,00
0
-
2,00
0
-
2,
000
2,20
0(2
00)
2,00
0
2,
000
-
T
otal
Oth
er In
stru
ctio
nal P
rogr
ams -
Inst
ruct
ion
9,70
0
-
9,70
0
7,
700
2,00
0
9,
700
-
9,
700
9,70
0
-
B
efor
e/A
fter S
choo
l Pro
gram
s - In
stru
ctio
n:
S
alar
ies
11-4
21-1
00-1
016,
700
-
6,
700
2,39
8
4,
302
6,70
0
-
6,70
0
-
6,
700
Sup
plie
s and
Mat
eria
ls11
-421
-100
-600
1,10
0
-
1,10
0
95
0
150
1,
500
-
1,
500
807
69
3
T
otal
Bef
ore/
Afte
r Sch
ool P
rogr
ams -
Inst
ruct
ion
7,80
0
-
7,80
0
3,
348
4,45
2
8,
200
-
8,
200
807
7,
393
S
umm
er S
choo
l - In
stru
ctio
n :
S
alar
ies
11-4
22-1
00-1
0119
,005
(4,7
72)
14,2
33
6,55
7
7,
676
19,0
05(3
,561
)15
,444
11,7
09
3,
735
Oth
er S
alar
ies o
f Ins
truct
ion
11-4
22-1
00-1
063,
544
4,
772
8,
316
8,31
6
-
3,54
4
3,
562
7,10
6
7,
106
-
T
otal
Sum
mer
Sch
ool -
Inst
ruct
ion
22,5
49
-
22
,549
14
,873
7,
676
22,5
49
1
22,5
50
18
,815
3,73
5
S
umm
er S
choo
l - S
u ppo
rt Se
rvic
es:
Sal
arie
s11
-422
-200
-101
2,70
0
-
2,70
0
2,
628
72
-
-
-
-
-
T
otal
Sum
mer
Sch
ool -
Su p
port
Serv
ices
2,70
0
-
2,70
0
2,
628
72
-
-
-
-
-
Tota
l Ins
truct
ion
6,13
9,30
2
65
,476
6,20
4,77
8
5,
892,
690
312,
088
6,
088,
281
(25,
656)
6,06
2,62
5
5,
857,
210
205,
415
LO
GA
N T
OW
NSH
IP B
OA
RD
OF
ED
UC
AT
ION
GE
NE
RA
L F
UN
DB
UD
GE
TA
RY
CO
MPA
RIS
ON
SC
HE
DU
LE
FOR
TH
E F
ISC
AL
YE
AR
S E
ND
ED
JU
NE
30,
201
4 A
ND
201
3
JUN
E 30
, 201
4JU
NE
30, 2
013

EXH
IBIT
C-1
(Pag
e 4
of 1
1)
VA
RIA
NC
EV
AR
IAN
CE
FIN
AL
TOFI
NA
L TO
AC
TUA
LA
CTU
AL
AC
CO
UN
TO
RIG
INA
LB
UD
GET
FIN
AL
FAV
OR
AB
LE/
OR
IGIN
AL
BU
DG
ETFI
NA
LFA
VO
RA
BLE
/N
UM
BER
SB
UD
GET
TRA
NSF
ERS
BU
DG
ETA
CTU
AL
(UN
FAV
OR
AB
LE)
BU
DG
ETTR
AN
SFER
SB
UD
GET
AC
TUA
L(U
NFA
VO
RA
BLE
)
Und
istri
bute
d Ex
pend
iture
s:
I
nstru
ctio
n:
Tui
tion
to O
ther
LEA
's -S
tate
R
egul
ar11
-000
-100
-561
3,01
8,68
9
-
3,
018,
689
3,01
8,68
9
-
2,73
1,07
6
-
2,73
1,07
6
2,
490,
536
240,
540
T
uitio
n to
Oth
er L
EA's
-Sta
te
Spec
ial
11-0
00-1
00-5
6210
1,04
5(2
0,03
6)81
,009
70
,617
10
,392
18
0,78
5
45,2
65
226,
050
21
4,16
7
11,8
83
Tui
tion
to C
ount
y V
ocat
iona
l
Reg
ular
11-1
00-1
00-5
6310
6,00
0
12,7
56
11
8,75
6
118,
756
-
122,
932
-
122,
932
10
4,00
0
18,9
32
Tui
tion
to C
ount
y V
ocat
iona
l
Spec
ial
11-1
00-1
00-5
6458
,120
(7,3
35)
50,7
85
47,0
42
3,74
3
60
,910
11,9
42
72,8
52
72
,851
1
Tui
tion
to C
ount
y Sp
ecia
l
Serv
ices
& D
ay S
choo
ls11
-000
-100
-565
538,
497
(210
,478
)32
8,01
9
326,
107
1,
912
558,
585
(60,
956)
497,
629
36
0,46
0
137,
169
T
uitio
n to
Priv
ate
Scho
ols f
or
t
he H
andi
capp
ed -
Stat
e11
-100
-100
-566
237,
204
22
5,09
3
462,
297
42
0,84
2
41,4
55
335,
257
1,
749
337,
006
33
7,00
6
-
Tui
tion
to S
tate
Fac
ilitie
s11
-100
-100
-568
9,00
0
-
9,00
0
9,
000
-
T
otal
Und
istri
bute
d Ex
pend
iture
s - In
stru
ctio
n4,
068,
555
-
4,06
8,55
5
4,
011,
053
57,5
02
3,98
9,54
5(2
,000
)3,
987,
545
3,57
9,02
0
40
8,52
5
A
ttend
ance
& S
ocia
l Wor
k Se
rvic
es:
Sal
arie
s of T
each
ers
11-0
00-2
11-1
0021
,333
(263
)21
,070
21
,070
-
20,6
10(7
8)20
,532
20,5
25
7
T
otal
Atte
ndan
ce &
Soc
ial W
ork
Serv
ice s
21,3
33(2
63)
21,0
70
21,0
70
-
20
,610
(78)
20,5
32
20
,525
7
H
ealth
Ser
vice
s :
S
alar
ies
11-0
00-2
13-1
0013
6,97
0
1,94
7
138,
917
13
8,91
7
-
13
2,36
1
78
132,
439
13
2,43
9
-
P
urch
ased
Pro
fess
iona
l &
Te
chni
cal S
ervi
ces
11-0
00-2
13-3
003,
500
(1,1
69)
2,33
1
2,
331
-
3,
500
-
3,
500
3,50
0
-
Oth
er P
urch
ased
Ser
vice
s11
-000
-213
-500
8,21
3(7
99)
7,41
4
6,
492
922
7,
205
(1)
7,20
4
6,
509
695
Sup
plie
s and
Mat
eria
ls11
-000
-213
-600
1,89
0(7
09)
1,18
1
74
0
441
8,
070
(476
)7,
594
4,34
5
3,
249
Oth
er O
bjec
ts11
-000
-213
-800
1,33
7
709
2,04
6
2,
045
1
76
3
476
1,
239
1,21
7
22
T
otal
Hea
lth S
ervi
ces
151,
910
(21)
151,
889
15
0,52
5
1,36
4
15
1,89
9
77
151,
976
14
8,01
0
3,96
6
O
ther
Su p
port
Serv
ices
- St
uden
ts -
Rel
ated
Ser
vice
s
S
alar
ies
11-0
00-2
16-1
0015
8,81
4(1
3,59
7)14
5,21
7
132,
404
12
,813
15
6,10
4
-
15
6,10
4
154,
569
1,
535
Pur
chas
ed P
rofe
ssio
nal -
Educ
atio
nal S
ervi
ces
11-0
00-2
16-3
2084
,254
-
84,2
54
77,3
08
6,94
6
75
,000
3,00
0
78
,000
72,5
31
5,
469
Sup
plie
s and
Mat
eria
ls11
-000
-216
-600
1,35
0
-
1,35
0
1,
237
113
1,
350
-
1,
350
1,30
5
45
Tota
l Oth
er S
u ppo
rt Se
rvic
es -
Stud
ents
- R
elat
ed
Ser
vice
s24
4,41
8(1
3,59
7)23
0,82
1
210,
949
19
,872
23
2,45
4
3,00
0
23
5,45
4
228,
405
7,
049
LO
GA
N T
OW
NSH
IP B
OA
RD
OF
ED
UC
AT
ION
GE
NE
RA
L F
UN
DB
UD
GE
TA
RY
CO
MPA
RIS
ON
SC
HE
DU
LE
FOR
TH
E F
ISC
AL
YE
AR
S E
ND
ED
JU
NE
30,
201
4 A
ND
201
3
JUN
E 30
, 201
4JU
NE
30, 2
013

EXH
IBIT
C-1
(Pag
e 5
of 1
1)
VA
RIA
NC
EV
AR
IAN
CE
FIN
AL
TOFI
NA
L TO
AC
TUA
LA
CTU
AL
AC
CO
UN
TO
RIG
INA
LB
UD
GET
FIN
AL
FAV
OR
AB
LE/
OR
IGIN
AL
BU
DG
ETFI
NA
LFA
VO
RA
BLE
/N
UM
BER
SB
UD
GET
TRA
NSF
ERS
BU
DG
ETA
CTU
AL
(UN
FAV
OR
AB
LE)
BU
DG
ETTR
AN
SFER
SB
UD
GET
AC
TUA
L(U
NFA
VO
RA
BLE
)
Oth
er S
uppo
rt Se
rvic
es -
Spec
ial E
duca
tion
-
Ext
raor
dina
ry S
ervi
ces:
Sal
arie
s11
-000
-217
-100
185,
378
(13,
128)
172,
250
17
2,25
0
-
13
3,03
2
47,6
59
180,
691
18
0,69
1
-
P
urch
ased
Pro
f.- E
du. S
ervi
ces
11-0
00-2
17-3
20-
4,
008
4,
008
4,00
8
-
Tota
l Oth
er S
u ppo
rt Se
rvic
es -
Spec
ial E
duca
tion
-
Ext
raor
dina
ry S
ervi
ces
185,
378
(9,1
20)
176,
258
17
6,25
8
-
13
3,03
2
47,6
59
180,
691
18
0,69
1
-
O
ther
Su p
port
Serv
ices
- St
uden
ts -
Reg
ular
Sal
arie
s of O
ther
Pro
fess
iona
l
St
aff
11-0
00-2
18-1
0410
8,44
8
-
108,
448
10
7,91
3
535
70
,307
7,50
0
77
,807
77,8
07
-
Pur
chas
ed P
rof.-
Edu
. Ser
vice
s11
-000
-218
-320
--
--
-
1,
800
(1,8
00)
--
-
O
ther
Pur
chas
ed P
rofe
ssio
nal
& T
echn
ical
Ser
vice
s11
-000
-218
-390
1,80
0
458
2,25
8
2,
062
196
-
3,
050
3,05
0
2,
047
1,00
3
S
uppl
ies a
nd M
ater
ials
11-0
00-2
18-6
003,
850
-
3,
850
3,22
3
62
7
200
-
200
19
7
3
T
otal
Oth
er S
u ppo
rt Se
rvic
es -
Stud
ents
- Reg
ular
114,
098
45
8
11
4,55
6
113,
198
1,
358
72,3
07
8,
750
81,0
57
80
,051
1,00
6
O
ther
Su p
port
Serv
ices
- St
uden
ts -
Spec
ial S
ervi
ces
Sal
arie
s of O
ther
Prof
essi
onal
Sta
ff11
-000
-219
-104
311,
853
2,
147
31
4,00
0
314,
000
-
289,
541
43
,366
33
2,90
7
332,
907
-
Sal
arie
s of S
ecre
taria
l &
C
leric
al A
ssis
tant
s11
-000
-219
-105
41,0
00
-
41
,000
41
,000
-
41,0
00
-
41,0
00
41
,000
-
P
urch
ased
Pro
fess
iona
l -
Te
chni
cal S
ervi
ces
11-0
00-2
19-3
904,
500
-
4,
500
-
4,50
0
5,
500
(3,0
00)
2,50
0
25
0
2,25
0
O
ther
Pur
chas
ed S
ervi
ces
11-0
00-2
19-5
003,
500
(3,5
00)
-
-
-
M
isce
llane
ous P
urch
ased
Ser
vice
s11
-000
-219
-592
-
3,67
4
3,67
4
2,
713
961
6,
000
(1,0
00)
5,00
0
1,
708
3,29
2
S
uppl
ies a
nd M
ater
ials
11-0
00-2
19-6
001,
500
11
4
1,
614
887
72
7
2,39
0
-
2,39
0
1,
350
1,04
0
T
otal
Oth
er S
u ppo
rt Se
rvic
es -
Stud
ents
Spe
cial
Ser
vice
s36
2,35
3
2,43
5
364,
788
35
8,60
0
6,18
8
34
4,43
1
39,3
66
383,
797
37
7,21
5
6,58
2
Im
prov
emen
t of I
nstru
ctio
n Se
rvic
es/O
ther
Sup
port
S
ervi
ces -
Inst
ruct
ion
Staf
f:
S
alar
ies o
f Sup
ervi
sors
of
Inst
ruct
ion
11-0
00-2
21-1
0220
7,24
7
879
208,
126
20
2,20
5
5,92
1
15
0,27
2(1
2,96
5)13
7,30
7
111,
017
26
,290
Sal
arie
s of S
ecre
taria
l &
Cle
rical
Ass
ista
nts
11-0
00-2
21-1
0534
,844
-
34,8
44
34,2
63
581
25
,113
512
25
,625
25,6
25
-
LO
GA
N T
OW
NSH
IP B
OA
RD
OF
ED
UC
AT
ION
GE
NE
RA
L F
UN
DB
UD
GE
TA
RY
CO
MPA
RIS
ON
SC
HE
DU
LE
FOR
TH
E F
ISC
AL
YE
AR
S E
ND
ED
JU
NE
30,
201
4 A
ND
201
3
JUN
E 30
, 201
4JU
NE
30, 2
013

EXH
IBIT
C-1
(Pag
e 6
of 1
1)
VA
RIA
NC
EV
AR
IAN
CE
FIN
AL
TOFI
NA
L TO
AC
TUA
LA
CTU
AL
AC
CO
UN
TO
RIG
INA
LB
UD
GET
FIN
AL
FAV
OR
AB
LE/
OR
IGIN
AL
BU
DG
ETFI
NA
LFA
VO
RA
BLE
/N
UM
BER
SB
UD
GET
TRA
NSF
ERS
BU
DG
ETA
CTU
AL
(UN
FAV
OR
AB
LE)
BU
DG
ETTR
AN
SFER
SB
UD
GET
AC
TUA
L(U
NFA
VO
RA
BLE
)
Impr
ovem
ent o
f Ins
truct
ion
Serv
ices
/Oth
er S
uppo
rt
Ser
vice
s - In
stru
ctio
n St
aff (
cont
inue
d):
Pur
chas
ed P
rofe
ssio
nal -
E
duca
tiona
l Ser
vice
s11
-000
-221
-320
12,5
00
-
12
,500
4,
953
7,54
7
68
,000
12,0
00
80,0
00
55
,787
24,2
13
O
ther
Pur
chas
ed S
ervi
ces
11-0
00-2
21-5
001,
500
(600
)90
010
479
6
1,00
0
-
1,00
0
-
1,
000
Sup
plie
s and
Mat
eria
ls11
-000
-221
-600
500
600
1,10
0
84
6
254
T
otal
Impr
ovem
ent o
f Ins
truct
ion
Serv
ices
/
O
ther
Sup
port
Serv
ices
Inst
ruct
iona
l Sta
ff25
6,59
1
879
257,
470
24
2,37
1
15,0
99
244,
385
(453
)24
3,93
2
192,
429
51
,503
E
duca
tiona
l Med
ia S
ervi
ces/
Scho
ol L
ibra
r y
S
alar
ies
11-0
00-2
22-1
0011
4,50
0
-
114,
500
11
2,32
1
2,17
9
11
1,48
6(1
,490
)10
9,99
6
109,
996
-
Sal
arie
s of T
echn
olog
y
C
oord
inat
ors
11-0
00-2
22-1
7799
,145
-
99,1
45
99,1
45
-
99
,938
(31,
917)
68,0
21
68
,021
-
P
urch
ased
Pro
fess
iona
l &
Te
chni
cal S
ervi
ces
11-0
00-2
22-3
00-
--
--
2,50
0(1
80)
2,32
0
-
2,
320
Oth
er P
urch
ased
Ser
vice
s11
-000
-222
-500
18,5
00(1
50)
18,3
50
17,4
81
869
20
,500
180
20
,680
16,6
80
4,
000
Sup
plie
s and
Mat
eria
ls11
-000
-222
-600
20,9
00
-
20
,900
20
,410
49
0
21,4
00
-
21,4
00
20
,209
1,19
1
T
otal
Edu
catio
nal M
edia
Ser
vice
s/Li
brar
y25
3,04
5(1
50)
252,
895
24
9,35
7
3,53
8
25
5,82
4(3
3,40
7)22
2,41
7
214,
906
7,
511
In
stru
ctio
nal S
taff
Tra
inin
g Se
rvic
es:
Pur
chas
ed P
rofe
ssio
nal -
E
duca
tiona
l Ser
vice
s11
-000
-223
-320
35,0
00(2
,750
)32
,250
11
,114
21
,136
35
,200
-
35
,200
21,4
52
13
,748
Oth
er P
urch
ased
Ser
vice
s11
-000
-223
-500
26,0
00(5
00)
25,5
00
20,5
95
4,90
5
9,
500
188
9,
688
4,95
1
4,
737
Sup
plie
s & M
ater
ials
11-0
00-2
23-6
0050
025
075
0-
750
60
0
-
60
057
327
Oth
er O
bjec
ts11
-000
-223
-800
--
--
-
50
0
-
50
0-
500
T
otal
Inst
ruct
iona
l Sta
ff T
rain
ing
Serv
ices
61,5
00(3
,000
)58
,500
31
,709
26
,791
45
,800
188
45
,988
26,9
76
19
,012
S
u ppo
rt Se
rvic
es G
ener
al A
dmin
istra
tion
Sal
arie
s11
-000
-230
-100
192,
696
-
19
2,69
6
187,
903
4,
793
187,
450
(5,5
37)
181,
913
18
1,26
7
646
Leg
al S
ervi
ces
11-0
00-2
30-3
3121
,000
5,15
6
26,1
56
25,9
18
238
11
,000
5,60
4
16
,604
16,6
03
1
Aud
it Fe
es11
-000
-230
-332
22,5
79(2
,000
)20
,579
20
,500
79
21
,956
2,50
0
24
,456
24,0
00
45
6
O
ther
Pur
chas
ed
Pr
ofes
sion
al S
ervi
ces
11-0
00-2
30-3
3912
,445
3,32
5
15,7
70
9,57
5
6,
195
7,99
0(9
70)
7,02
0
2,
395
4,62
5
P
urch
ased
Tec
hnic
al S
ervi
ces
11-0
00-2
30-3
408,
770
(2,3
14)
6,45
6
2,
421
4,03
5
10
,000
(2,5
25)
7,47
5
1,
770
5,70
5
C
omm
unic
atio
ns/T
elep
hone
11-0
00-2
30-5
3025
,739
(497
)25
,242
24
,768
47
4
22,6
45
2,
225
24,8
70
20
,713
4,15
7
B
OE
Oth
er P
urch
ased
Ser
vice
s11
-000
-230
-585
4,50
0(1
,339
)3,
161
1,12
4
2,
037
5,72
0(1
,500
)4,
220
999
3,
221
Oth
er P
urch
ased
Ser
vice
s11
-000
-230
-590
24,9
84
2,
626
27
,610
27
,198
41
2
29,4
91
33
1
29,8
22
24
,252
5,57
0
G
ener
al S
uppl
ies
11-0
00-2
30-6
104,
250
2,
751
7,
001
6,10
9
89
2
4,00
0(3
0)3,
970
3,73
6
23
4
LO
GA
N T
OW
NSH
IP B
OA
RD
OF
ED
UC
AT
ION
GE
NE
RA
L F
UN
DB
UD
GE
TA
RY
CO
MPA
RIS
ON
SC
HE
DU
LE
FOR
TH
E F
ISC
AL
YE
AR
S E
ND
ED
JU
NE
30,
201
4 A
ND
201
3
JUN
E 30
, 201
4JU
NE
30, 2
013

EXH
IBIT
C-1
(Pag
e 7
of 1
1)
VA
RIA
NC
EV
AR
IAN
CE
FIN
AL
TOFI
NA
L TO
AC
TUA
LA
CTU
AL
AC
CO
UN
TO
RIG
INA
LB
UD
GET
FIN
AL
FAV
OR
AB
LE/
OR
IGIN
AL
BU
DG
ETFI
NA
LFA
VO
RA
BLE
/N
UM
BER
SB
UD
GET
TRA
NSF
ERS
BU
DG
ETA
CTU
AL
(UN
FAV
OR
AB
LE)
BU
DG
ETTR
AN
SFER
SB
UD
GET
AC
TUA
L(U
NFA
VO
RA
BLE
)
Sup
port
Serv
ices
Gen
eral
Adm
inis
tratio
n (c
ontin
ued)
BO
E In
-Hou
se T
rain
ing/
Mee
ting
Supp
lies
11-0
00-2
30-6
3080
0-
800
800
-
1,
150
-
1,
150
876
27
4
M
isce
llane
ous E
xpen
ditu
res
11-0
00-2
30-8
902,
930
-
2,
930
2,56
8
36
2
2,93
0
-
2,93
0
2,
867
63
B
OE
Mem
bers
hip
Due
s & F
ees
11-0
00-2
30-8
9511
,969
-
11,9
69
9,38
4
2,
585
11,8
53(1
)
11,8
52
9,
496
2,35
6
T
otal
Su p
port
Serv
ices
Gen
eral
Adm
inis
tratio
n33
2,66
2
7,70
8
340,
370
31
8,26
8
22,1
02
316,
185
97
31
6,28
2
288,
974
27
,308
S
u ppo
rt Se
rvic
es S
choo
l Adm
inis
tratio
n:
S
alar
ies o
f Prin
cipa
ls&
Ass
ista
nt P
rinci
pals
11-0
00-2
40-1
0320
1,41
6(3
,025
)19
8,39
1
192,
802
5,
589
229,
696
16
,487
24
6,18
3
246,
183
-
Sal
arie
s of S
ecre
taria
l &-
Cle
rical
Ass
ista
nts
11-0
00-2
40-1
0512
3,41
2(4
77)
122,
935
12
0,79
1
2,14
4
12
2,48
3(1
,060
)12
1,42
3
121,
423
-
Oth
er P
urch
ased
Ser
vice
s11
-000
-240
-500
7,15
0(1
00)
7,05
0
1,
108
5,94
2
8,
850
-
8,
850
3,26
1
5,
589
Sup
plie
s and
Mat
eria
ls11
-000
-240
-600
6,57
5
-
6,57
5
4,
779
1,79
6
9,
805
-
9,
805
3,63
4
6,
171
Oth
er O
bjec
ts11
-000
-240
-800
-10
010
010
0-
--
--
-
T
otal
Su p
port
Serv
ices
Sch
ool A
dmin
istra
tion
338,
553
(3,5
02)
335,
051
31
9,58
0
15,4
71
370,
834
15
,427
38
6,26
1
374,
501
11
,760
C
entra
l Ser
vice
s :
S
alar
ies
11-0
00-2
51-1
0080
,899
-
80,8
99
80,8
96
3
78
,925
-
78
,925
78,9
25
-
Pur
chas
ed P
rofe
ssio
nal S
ervi
ces
11-0
00-2
51-3
308,
440
-
8,
440
8,12
4
31
6
8,84
0
-
8,84
0
7,
857
983
Pur
chas
ed T
echn
ical
Ser
vice
s11
-000
-251
-340
68,3
98
-
68
,398
63
,961
4,
437
59,2
99
1,
006
60,3
05
60
,305
-
M
isce
llane
ous P
urch
ased
-
-
Serv
ices
11-0
00-2
51-5
921,
800
-
1,
800
694
1,
106
4,10
0(3
,423
)67
7
677
-
Sup
plie
s and
Mat
eria
ls11
-000
-251
-600
4,50
0
3,65
0
8,15
0
6,
888
1,26
2
4,
000
2,88
3
6,
883
3,23
3
3,
650
Mis
cella
neou
s Exp
endi
ture
s11
-000
-251
-890
850
-85
065
419
6
850
(342
)50
8
508
-
T
otal
Cen
tral S
ervi
ces
164,
887
3,
650
16
8,53
7
161,
217
7,
320
156,
014
12
4
156,
138
15
1,50
5
4,63
3
A
dmin
istra
tive
Info
rmat
ion
Tech
nolo
gy
S
alar
ies
11-0
00-2
52-1
0065
,870
20
65
,890
64
,576
1,
314
52,0
73
7,
869
59,9
42
59
,942
-
P
urch
ased
Tec
hnic
al S
ervi
ces
11-0
00-2
52-3
4031
,270
6,62
5
37,8
95
31,0
41
6,85
4
40
,155
-
40
,155
33,2
54
6,
901
Oth
er P
urch
ased
Ser
vice
s11
-000
-252
-500
150
150
150
-
-
-
-
--
T
otal
Adm
inis
trativ
e In
form
atio
n Te
chno
logy
97,1
40
6,
795
10
3,93
5
95,7
67
8,16
8
92
,228
7,86
9
10
0,09
7
93,1
96
6,
901
A
llow
able
Mai
nten
ance
for S
choo
l Fac
ilitie
s
S
alar
ies
11-0
00-2
61-1
0074
,289
(1,7
63)
72,5
26
72,4
88
38
74,0
15(8
40)
73,1
75
72
,588
587
Cle
anin
g, R
epai
r&
M
aint
enan
ce S
ervi
ces
11-0
00-2
61-4
2036
,783
20,3
53
57
,136
48
,908
8,
228
58,4
05(3
,103
)55
,302
44,8
77
10
,425
Gen
eral
Sup
plie
s11
-000
-261
-610
39,7
00
7,
682
47
,382
46
,956
42
6
60,2
00(5
,812
)54
,388
50,6
45
3,
743
T
otal
Allo
wab
le M
aint
enan
ce fo
r Sch
ool F
acili
ties
150,
772
26
,272
177,
044
16
8,35
2
8,69
2
19
2,62
0(9
,755
)18
2,86
5
168,
110
14
,755
LO
GA
N T
OW
NSH
IP B
OA
RD
OF
ED
UC
AT
ION
GE
NE
RA
L F
UN
DB
UD
GE
TA
RY
CO
MPA
RIS
ON
SC
HE
DU
LE
FOR
TH
E F
ISC
AL
YE
AR
S E
ND
ED
JU
NE
30,
201
4 A
ND
201
3
JUN
E 30
, 201
3JU
NE
30, 2
014
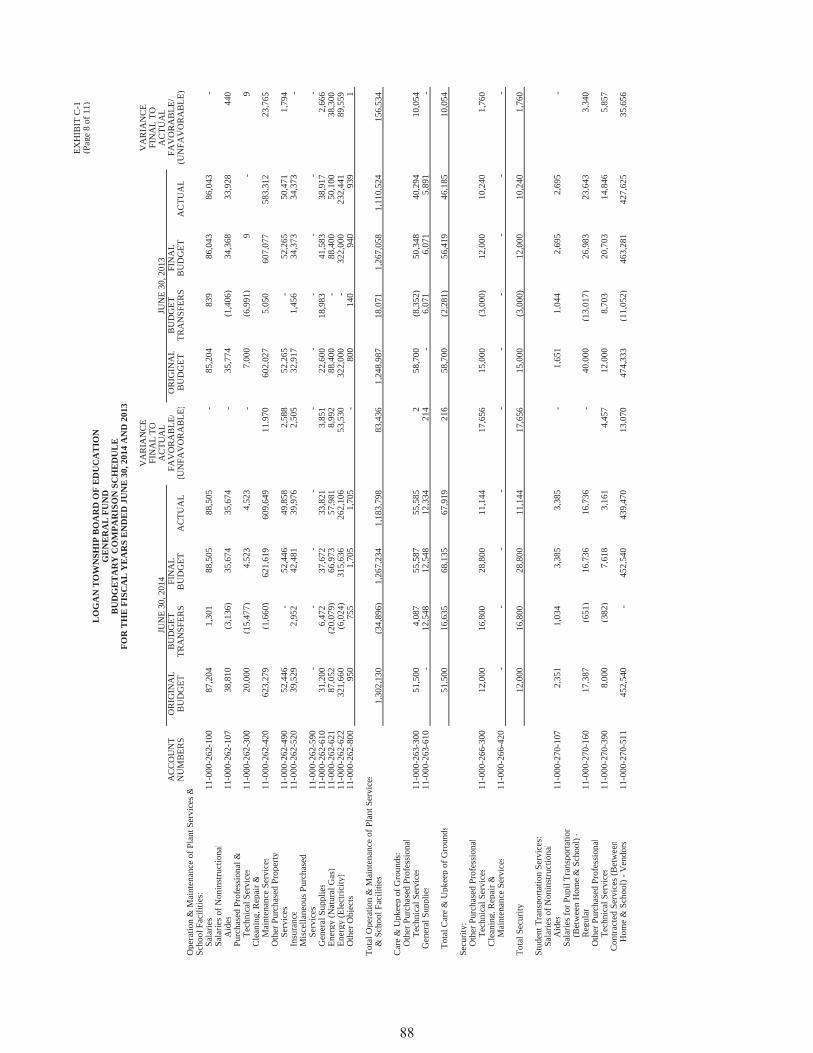
EXH
IBIT
C-1
(Pag
e 8
of 1
1)
VA
RIA
NC
EV
AR
IAN
CE
FIN
AL
TOFI
NA
L TO
AC
TUA
LA
CTU
AL
AC
CO
UN
TO
RIG
INA
LB
UD
GET
FIN
AL
FAV
OR
AB
LE/
OR
IGIN
AL
BU
DG
ETFI
NA
LFA
VO
RA
BLE
/N
UM
BER
SB
UD
GET
TRA
NSF
ERS
BU
DG
ETA
CTU
AL
(UN
FAV
OR
AB
LE)
BU
DG
ETTR
AN
SFER
SB
UD
GET
AC
TUA
L(U
NFA
VO
RA
BLE
)
Ope
ratio
n &
Mai
nten
ance
of P
lant
Ser
vice
s &
Sch
ool F
acili
ties:
Sal
arie
s11
-000
-262
-100
87,2
04
1,
301
88
,505
88
,505
-
85,2
04
83
9
86,0
43
86
,043
-
S
alar
ies o
f Non
inst
ruct
iona
l
A
ides
11-0
00-2
62-1
0738
,810
(3,1
36)
35,6
74
35,6
74
-
35
,774
(1,4
06)
34,3
68
33
,928
440
Pur
chas
ed P
rofe
ssio
nal &
Tech
nica
l Ser
vice
s11
-000
-262
-300
20,0
00(1
5,47
7)4,
523
4,52
3
-
7,00
0(6
,991
)9
-
9
Cle
anin
g, R
epai
r&
M
aint
enan
ce S
ervi
ces
11-0
00-2
62-4
2062
3,27
9(1
,660
)62
1,61
9
609,
649
11
,970
60
2,02
7
5,05
0
60
7,07
7
583,
312
23
,765
Oth
er P
urch
ased
Pro
perty
Serv
ices
11-0
00-2
62-4
9052
,446
-
52,4
46
49,8
58
2,58
8
52
,265
-
52
,265
50,4
71
1,
794
Ins
uran
c e11
-000
-262
-520
39,5
29
2,
952
42
,481
39
,976
2,
505
32,9
17
1,
456
34,3
73
34
,373
-
M
isce
llane
ous P
urch
ase d
Serv
ices
11-0
00-2
62-5
90-
--
--
-
-
-
--
Gen
eral
Su p
plie
s11
-000
-262
-610
31,2
00
6,
472
37
,672
33
,821
3,
851
22,6
00
18
,983
41
,583
38,9
17
2,
666
Ene
r gy
(Nat
ural
Gas
)11
-000
-262
-621
87,0
52(2
0,07
9)66
,973
57
,981
8,
992
88,4
00
-
88,4
00
50
,100
38,3
00
E
ner g
y(E
lect
ricity
)11
-000
-262
-622
321,
660
(6,0
24)
315,
636
26
2,10
6
53,5
30
322,
000
-
322,
000
23
2,44
1
89,5
59
O
ther
Ob j
ects
11-0
00-2
62-8
0095
075
51,
705
1,70
5
-
800
14
0
940
93
9
1
T
otal
Ope
ratio
n &
Mai
nten
ance
of P
lant
Ser
vice
s
&
Sch
ool F
acili
ties
1,30
2,13
0(3
4,89
6)1,
267,
234
1,18
3,79
8
83
,436
1,
248,
987
18,0
71
1,26
7,05
8
1,
110,
524
156,
534
C
are
& U
pkee
p of
Gro
unds
:
O
ther
Pur
chas
ed P
rofe
ssio
nal
Tech
nica
l Ser
vice
s11
-000
-263
-300
51,5
00
4,
087
55
,587
55
,585
2
58,7
00(8
,352
)50
,348
40,2
94
10
,054
Gen
eral
Su p
plie
s11
-000
-263
-610
-
12,5
48
12
,548
12
,334
21
4
-
6,07
1
6,
071
5,89
1
-
Tot
al C
are
& U
pkee
p of
Gro
unds
51,5
00
16
,635
68,1
35
67,9
19
216
58
,700
(2,2
81)
56,4
19
46
,185
10,0
54
S
ecur
it y:
Oth
er P
urch
ased
Pro
fess
iona
l
Te
chni
cal S
ervi
ces
11-0
00-2
66-3
0012
,000
16,8
00
28
,800
11
,144
17
,656
15
,000
(3,0
00)
12,0
00
10
,240
1,76
0
C
lean
ing,
Rep
air&
Mai
nten
ance
Ser
vice
s11
-000
-266
-420
--
--
-
-
-
--
-
T
otal
Sec
urit y
12,0
00
16
,800
28,8
00
11,1
44
17,6
56
15,0
00(3
,000
)12
,000
10,2
40
1,
760
S
tude
nt T
rans
porta
tion
Serv
ices
:
S
alar
ies o
f Non
inst
ruct
iona
l
A
ides
11-0
00-2
70-1
072,
351
1,
034
3,
385
3,38
5
-
1,65
1
1,
044
2,69
5
2,
695
-
S
alar
ies f
or P
u pil
Tran
spor
tatio
n(B
etw
een
Hom
e &
Sch
ool)
-
R
egul
ar11
-000
-270
-160
17,3
87(6
51)
16,7
36
16,7
36
-
40
,000
(13,
017)
26,9
83
23
,643
3,34
0
O
ther
Pur
chas
ed P
rofe
ssio
nal
Tech
nica
l Ser
vice
s11
-000
-270
-390
8,00
0(3
82)
7,61
8
3,
161
4,45
7
12
,000
8,70
3
20
,703
14,8
46
5,
857
Con
tract
ed S
ervi
ces (
Bet
wee
n
Hom
e &
Sch
ool)
- Ven
dors
11-0
00-2
70-5
1145
2,54
0
-
452,
540
43
9,47
0
13,0
70
474,
333
(11,
052)
463,
281
42
7,62
5
35,6
56
LO
GA
N T
OW
NSH
IP B
OA
RD
OF
ED
UC
AT
ION
GE
NE
RA
L F
UN
D
FOR
TH
E F
ISC
AL
YE
AR
S E
ND
ED
JU
NE
30,
201
4 A
ND
201
3
JUN
E 30
, 201
4JU
NE
30, 2
013
BU
DG
ET
AR
Y C
OM
PAR
ISO
N S
CH
ED
UL
E

EXH
IBIT
C-1
(Pag
e 9
of 1
1)
VA
RIA
NC
EV
AR
IAN
CE
FIN
AL
TOFI
NA
L TO
AC
TUA
LA
CTU
AL
AC
CO
UN
TO
RIG
INA
LB
UD
GET
FIN
AL
FAV
OR
AB
LE/
OR
IGIN
AL
BU
DG
ETFI
NA
LFA
VO
RA
BLE
/N
UM
BER
SB
UD
GET
TRA
NSF
ERS
BU
DG
ETA
CTU
AL
(UN
FAV
OR
AB
LE)
BU
DG
ETTR
AN
SFER
SB
UD
GET
AC
TUA
L(U
NFA
VO
RA
BLE
)
Stu
dent
Tra
nspo
rtatio
n Se
rvic
es (c
ontin
ued)
:
C
ontra
cted
Ser
vice
s (O
ther
Tha
n
Bet
wee
n H
ome
& S
choo
l) -
V
endo
rs11
-000
-270
-512
51,0
04
-
51
,004
38
,270
12
,734
39
,090
(1)
39
,089
30,6
54
8,
435
Con
tract
ed S
ervi
ces (
Spec
ial
E
duca
tion
Stud
ents
) - V
endo
rs11
-000
-270
-514
14,2
03
-
14
,203
13
,857
34
6
13,8
24
-
13,8
24
12
,532
1,29
2
C
ontra
cted
Ser
vice
s (B
etw
een
H
ome
& S
choo
l) - J
oint
A
gree
men
ts11
-000
-270
-515
390,
742
1
39
0,74
3
363,
872
26
,871
36
6,91
0
11,0
51
377,
961
35
8,70
2
19,2
59
C
ontra
cted
Ser
vice
- A
id in
L
ieu
of P
aym
ents
11-0
00-2
70-5
0346
,852
-
46,8
52
37,1
57
9,69
5
45
,084
-
45
,084
38,8
13
6,
271
Mis
c. P
urch
ased
Svc
.- Tr
ansp
.11
-000
-270
-593
2,42
5
-
2,42
5
1,
705
720
-
61
7
617
61
7
-
G
ener
al S
uppl
ies
11-0
00-2
70-6
1050
0-
500
442
58
-
377
37
715
362
Mis
cella
neou
s Exp
endi
ture
s11
-000
-270
-800
150
-15
021
129
75
95
170
170
-
Tot
al S
tude
nt T
rans
porta
tion
Serv
ices
986,
154
2
98
6,15
6
918,
076
68
,080
99
2,96
7(2
,183
)99
0,78
4
910,
312
80
,472
U
nallo
cate
d B
enef
its -
Empl
oyee
Ben
efits
Soci
al S
ecur
ity C
ontri
butio
ns11
-000
-291
-220
121,
728
46
2
12
2,19
0
119,
335
2,
855
109,
960
15
,108
12
5,06
8
125,
068
-
Oth
er R
etire
men
t Con
tribu
tion
-
PER
S11
-000
-291
-241
116,
487
(1,8
46)
114,
641
99
,505
15
,136
12
0,00
0(8
,088
)11
1,91
2
98,8
57
13
,055
Oth
er R
etire
men
t Con
tribu
tion
-
Reg
ular
11-0
00-2
91-2
4910
,662
4,24
6
14,9
08
14,9
08
-
9,
000
3,21
1
12
,211
12,2
11
-
Une
mpl
oym
ent C
ompe
nsat
ion
11-0
00-2
91-2
5050
,000
-
50,0
00
651
49
,349
83
,964
(3,1
76)
80,7
88
30
0
80,4
88
W
orkm
en's
Com
pens
atio
n11
-000
-291
-260
54,8
73(2
,219
)52
,654
52
,654
-
49,8
64(1
,457
)48
,407
47,6
72
73
5
H
ealth
Ben
efits
11-0
00-2
91-2
701,
800,
093
(48,
243)
1,75
1,85
0
1,
547,
373
204,
477
1,
763,
873
(42,
343)
1,72
1,53
0
1,
505,
000
216,
530
Tuiti
on R
eim
burs
emen
ts11
-000
-291
-280
35,0
00
-
35
,000
23
,674
11
,326
35
,000
-
35
,000
10,0
80
24
,920
Oth
er E
mpl
oyee
Ben
efits
11-0
00-2
91-2
9034
,015
(1,9
76)
32,0
39
15,6
90
16,3
49
62,6
80
3,
176
65,8
56
65
,856
-
T
otal
Una
lloca
ted
Ben
efits
- Em
ploy
ee B
enef
its2,
222,
858
(49,
576)
2,17
3,28
2
1,
873,
790
299,
492
2,
234,
341
(33,
569)
2,20
0,77
2
1,
865,
044
335,
728
Non
bud g
eted
:
O
n-B
ehal
f TPA
F Pe
nsio
n C
ontri
butio
ns-
-
-
26
0,52
9(2
60,5
29)
--
-
384,
608
(384
,608
)
O
n-B
ehal
f TPA
F M
edic
al C
ontri
butio
ns-
-
-
42
7,17
0(4
27,1
70)
--
-
434,
895
(434
,895
)
R
eim
burs
ed T
PAF
Soci
al S
ecur
ity C
ontri
butio
ns-
-
-
43
5,98
6(4
35,9
86)
--
-
438,
604
(438
,604
)
T
otal
Und
istri
bute
d Ex
pend
iture
s11
,377
,837
(32,
491)
11,3
45,3
4611
,806
,686
(461
,340
)
11
,168
,163
53
,902
11
,222
,065
11
,324
,926
(103
,041
)
Tota
l Ex p
endi
ture
s - C
urre
nt E
xpen
se17
,517
,139
32,9
85
17
,550
,124
17,6
99,3
76(1
49,2
52)
17,2
56,4
44
28,2
46
17,2
84,6
90
17,1
82,1
36
102,
374
Ca p
ital O
utla
y:
Inte
rest
Dep
osit
to C
apita
l Res
erve
10-6
04-0
00-0
0012
5-
125
-12
5
125
-
12
5-
125
In
crea
se in
Cap
ital R
eser
ve10
-604
-000
-000
--
--
-
16
5,50
0
-
16
5,50
0
-
165,
500
In
crea
se in
Mai
nten
ance
Res
erve
10-6
06-0
00-0
00-
--
--
165,
500
-
165,
500
-
16
5,50
0
Inte
rest
Dep
osit
to M
aint
enan
ce
Res
erve
10-6
06-0
00-0
0025
0-
250
-25
0
250
-
25
0-
250
FOR
TH
E F
ISC
AL
YE
AR
S E
ND
ED
JU
NE
30,
201
4 A
ND
201
3
JUN
E 30
, 201
4JU
NE
30, 2
013
LO
GA
N T
OW
NSH
IP B
OA
RD
OF
ED
UC
AT
ION
GE
NE
RA
L F
UN
DB
UD
GE
TA
RY
CO
MPA
RIS
ON
SC
HE
DU
LE

EXH
IBIT
C-1
(Pag
e 10
of 1
1)
VA
RIA
NC
EV
AR
IAN
CE
FIN
AL
TOFI
NA
L TO
AC
TUA
LA
CTU
AL
AC
CO
UN
TO
RIG
INA
LB
UD
GET
FIN
AL
FAV
OR
AB
LE/
OR
IGIN
AL
BU
DG
ETFI
NA
LFA
VO
RA
BLE
/N
UM
BER
SB
UD
GET
TRA
NSF
ERS
BU
DG
ETA
CTU
AL
(UN
FAV
OR
AB
LE)
BU
DG
ETTR
AN
SFER
SB
UD
GET
AC
TUA
L(U
NFA
VO
RA
BLE
)
Equ
ipm
ent:
Und
istri
bute
d Ex
pend
iture
s:
In
stru
ctio
n12
-000
-100
-730
108,
600
27
,752
136,
352
86
,549
49
,803
17
0,00
0(2
6,93
2)14
3,06
8
125,
898
17
,170
Chi
ld S
tud y
Tea
ms
12-0
00-2
19-7
30-
--
--
5,00
0
-
5,00
0
-
5,
000
Mai
nten
ance
of S
choo
l Fac
ilitie
s12
-000
-261
-730
--
--
-
3,
000
(3,0
00)
--
-
C
are
and
Upk
eep
of G
roun
ds12
-000
-263
-730
-
7,20
07,
200
7,10
010
0
Ass
ets A
c qui
red
Und
er C
apita
l
Le
ase
(Non
budg
et) -
Inst
ruct
ion
-
-
-
79,5
14(7
9,51
4)
--
-
104,
129
(104
,129
)
Fac
ilitie
s Ac q
uisi
tion
& C
onst
ruct
ion
Serv
ices
Oth
er P
urch
ased
Pro
fess
iona
l &
C
onst
ruct
ion
Serv
ices
12-0
00-4
00-4
5071
9,50
0(3
42,2
05)
377,
295
146,
704
230,
591
47
,500
35,5
50
83,0
5078
,416
4,63
4
A
sses
smen
t for
Deb
t Ser
vic e
on
SDA
Fun
ding
12-0
00-4
00-8
961,
137
-
1,
137
1,13
7
-
738
-
738
738
-
T
otal
Cap
ital O
utla
y82
9,61
2(3
07,2
53)
522,
359
321,
004
201,
355
55
7,61
35,
618
563,
231
309,
181
254,
050
Tota
l Exp
endi
ture
s18
,346
,751
(274
,268
)18
,072
,483
18,0
20,3
8052
,103
17
,814
,057
33,8
64
17,8
47,9
2117
,491
,317
356,
424
Exce
ss/(D
efic
ienc
y) o
f Rev
enue
s Ove
r/(U
nder
)
Exp
endi
ture
s Bef
ore
Oth
er F
inan
cing
Sou
rces
/(Use
s)(1
,552
,755
)27
4,26
8(1
,278
,487
)87
,950
1,36
6,43
7
(1
,236
,510
)(3
3,86
4)(1
,270
,374
)52
1,14
51,
548,
031
Oth
er F
inan
cing
Sou
rces
/(Use
s):
C
apita
l Lea
se (N
onbu
dget
)-
-
-
79
,514
79
,514
-
-
-
104,
129
104,
129
T
rans
fer t
o C
a pita
l Pro
ject
s12
-000
-400
-932
-(3
46,2
00)
(346
,200
)(3
46,2
00)
-
-
-
-
--
Tota
l Oth
er F
inan
cing
Sou
rces
/(Use
s)-
(346
,200
)(3
46,2
00)
(266
,686
)79
,514
-
-
-
10
4,12
910
4,12
9
GE
NE
RA
L F
UN
DL
OG
AN
TO
WN
SHIP
BO
AR
D O
F E
DU
CA
TIO
N
JUN
E 30
, 201
4JU
NE
30, 2
013
FOR
TH
E F
ISC
AL
YE
AR
S E
ND
ED
JU
NE
30,
201
4 A
ND
201
3B
UD
GE
TA
RY
CO
MPA
RIS
ON
SC
HE
DU
LE

EXH
IBIT
C-1
(Pag
e 11
of 1
1)
VA
RIA
NC
EV
AR
IAN
CE
FIN
AL
TOFI
NA
L TO
AC
TUA
LA
CTU
AL
OR
IGIN
AL
BU
DG
ETFI
NA
LFA
VO
RA
BLE
/O
RIG
INA
LB
UD
GET
FIN
AL
FAV
OR
AB
LE/
BU
DG
ETTR
AN
SFER
SB
UD
GET
AC
TUA
L(U
NFA
VO
RA
BLE
)B
UD
GET
TRA
NSF
ERS
BU
DG
ETA
CTU
AL
(UN
FAV
OR
AB
LE)
Exce
ss/(D
efic
ienc
y) o
f Rev
enue
s Ove
r/(U
nder
)
Exp
endi
ture
s Afte
r Oth
er F
inan
cing
Sou
rces
/(Use
s)(1
,552
,755
)(7
1,93
2)(1
,624
,687
)(1
78,7
36)
1,44
5,95
1
(1
,236
,510
)(3
3,86
4)(1
,270
,374
)62
5,27
41,
652,
160
Fund
Bal
ance
s, Ju
l y1
4,19
5,89
04,
195,
890
4,19
5,89
0
-
3,57
0,61
6
-
3,57
0,61
6
3,
570,
616
-
Fund
Bal
ance
s, Ju
ne 3
02,
643,
135
$(7
1,93
2)$
2,57
1,20
3$
4,01
7,15
4$
1,44
5,95
1$
2,
334,
106
$(3
3,86
4)$
2,30
0,24
2$
4,19
5,89
0$
1,
652,
160
$
Prio
r Yea
r Enc
umbr
ance
s71
,932
$
T
otal
71,9
32$
Res
tric
ted
Fund
Bal
ance
:C
apita
l Res
erve
290,
868
Tuiti
on R
eser
ve -
Des
i gna
ted
for S
ubse
quen
t Yea
r31
8,77
3M
aint
enan
ce R
eser
v e41
6,14
2Ex
cess
Sur
plus
- D
esig
nate
d fo
r Sub
sequ
ent Y
ear
1,15
9,60
4Ex
cess
Sur
plus
1,31
8,71
3A
ssi g
ned
Fund
Bal
ance
:Y
ear E
nd E
ncum
bran
ces
109,
180
Una
ssi g
ned
Fund
Bal
ance
403,
874
S
ubto
tal
4,01
7,15
4
Rec
onci
liatio
n to
Gov
ernm
enta
l Fun
d St
atem
ents
(GA
AP)
L
ast S
tate
Aid
Pay
men
t Not
Rec
ogni
zed
on G
AA
P B
asis
(511
,233
)
Fund
Bal
ance
per
Gov
ernm
enta
l Fun
ds (G
AA
P)3,
505,
921
$
RE
CA
PIT
UL
AT
ION
OF
FUN
D B
AL
AN
CE
RE
CA
PIT
UL
AT
ION
OF
BU
DG
ET
TR
AN
SFE
RS:
BU
DG
ET
AR
Y C
OM
PAR
ISO
N S
CH
ED
UL
EFO
R T
HE
FIS
CA
L Y
EA
RS
EN
DE
D J
UN
E 3
0, 2
014
AN
D 2
013
JUN
E 30
, 201
4JU
NE
30, 2
013
LO
GA
N T
OW
NSH
IP B
OA
RD
OF
ED
UC
AT
ION
GE
NE
RA
L F
UN
D

EXH
IBIT
C-2
VA
RIA
NC
EV
AR
IAN
CE
POSI
TIV
E/PO
SITI
VE/
(NEG
ATI
VE)
(NEG
ATI
VE)
OR
IGIN
AL
BU
DG
ETFI
NA
LFI
NA
L TO
OR
IGIN
AL
BU
DG
ETFI
NA
LFI
NA
L TO
BU
DG
ETTR
AN
SFER
SB
UD
GET
AC
TUA
LA
CTU
AL
BU
DG
ETTR
AN
SFER
SB
UD
GET
AC
TUA
LA
CTU
AL
REV
ENU
ES:
S
tate
Sou
rces
36,3
00$
94
1$
37,2
41$
36
,300
$
(941
)$
36,3
00$
-
$
36,3
00$
36
,300
$
-$
F
eder
al S
ourc
es27
7,42
9
93
,578
37
1,00
7
371,
007
-
31
9,97
8
48,1
43
368,
121
35
2,68
8(1
5,43
3)
Loc
al S
ourc
es6,
000
9,
000
15
,000
15
,000
-
-
6,
000
6,
000
6,00
0
-
T
otal
Rev
enue
s31
9,72
9
10
3,51
9
42
3,24
8
422,
307
(941
)
356,
278
54
,143
41
0,42
1
394,
988
(15,
433)
EXPE
ND
ITU
RES
:In
stru
ctio
n:
Sal
arie
s of T
each
ers
102,
343
26,2
69
128,
612
12
8,61
2
-
89,7
83
29
,621
11
9,40
4
105,
376
14
,028
O
ther
Pur
chas
ed S
ervi
ces
-
254
254
-
25
4
-
-
-
-
-
G
ener
al S
u ppl
ies
2,00
0
-
2,
000
2,00
0
-
31
,300
(16,
565)
14,7
35
13,8
98
837
T
uitio
n19
3,19
5
48
,043
24
1,23
8
241,
238
-
21
1,67
7
23,3
23
235,
000
23
5,00
0
-
Tex
tboo
ks-
68
7
68
7
-
687
-
-
-
-
-
T
otal
Inst
ruct
ion
297,
538
75,2
53
372,
791
37
1,85
0
941
33
2,76
0
36,3
79
369,
139
35
4,27
4
14,8
65
Supp
ort S
ervi
ces:
E
mpl
oyee
Ben
efits
10,1
30
15
,015
25
,145
25
,145
-
-
-
-
-
-
Pur
chas
ed P
rofe
ssio
nal S
ervi
ces
12,0
61
13
,251
25
,312
25
,312
-
18
,518
17,7
64
36,2
82
35,7
14
568
G
ener
al S
u ppl
ies
-
-
-
-
-
5,
000
-
5,
000
5,00
0
-
T
otal
Sup
port
Serv
ices
22,1
91
28
,266
50
,457
50
,457
-
23
,518
17,7
64
41,2
82
40,7
14
568
Tota
l Exp
endi
ture
s31
9,72
9
10
3,51
9
42
3,24
8
422,
307
94
1
356,
278
54
,143
41
0,42
1
394,
988
15
,433
Tota
l Out
flow
s31
9,72
9
10
3,51
9
42
3,24
8
422,
307
94
1
356,
278
54
,143
41
0,42
1
394,
988
15
,433
Exce
ss/(D
efic
ienc
y) o
f Rev
enue
s Ove
r/(U
nder
) E
xpen
ditu
res &
Oth
er F
inan
cing
Sou
rces
/(U
ses)
-$
-
$
-$
-$
-$
-$
-$
-
$
-
$
-
$
JUN
E 30
, 201
4
LO
GA
N T
OW
NSH
IP B
OA
RD
OF
ED
UC
AT
ION
BU
DG
ET
AR
Y C
OM
PAR
ISO
N S
CH
ED
UL
E
SPE
CIA
L R
EV
EN
UE
FU
ND
FOR
FIS
CA
L Y
EA
RS
EN
DE
D J
UN
E 3
0, 2
014
AN
D 2
013
JUN
E 30
, 201
3

NOTES TO REQUIRED SUPPLEMENTARY INFORMATION

This page intentionally left blank

EXHIBIT C-3
SPECIALGENERAL REVENUE
FUND FUNDSources/Inflows of Resources: Actual Amounts (Budgetary Basis) "Revenue" From the Budgetary Comparison Schedule (C-Series) 18,108,330$ 422,307$ Difference - Budget to GAAP: Grant accounting budgetary basis differs from GAAP in that encumbrances are recognized as expenditures, and the related revenue is recognized. State aid payment recognized for GAAP statements in the current year, previously recognized for budgetary purposes 503,304 3,630 State aid payment recognized for budgetary purposes, not recognized for GAAP Statements until the subsequent year (511,233) (3,630)
Total Revenue as reported on the statement of revenues, expenditures and changes in fund balances – governmental funds 18,100,401$ 422,307$
Uses/outflows of resources: Actual amounts (budgetary basis) "total expenditures" from the budgetary comparison schedule 18,020,380$ 422,307$ Differences - budget to GAAP Encumbrances for supplies and equipment ordered but not received is reported in the year the order is placed for
budgetary purposes, but in the year the supplies are received for financial reporting purposes. - -
Total Expenditures as Reported on the Statement of Revenues, Expenditures, and Changes in Fund Balances - Governmental Funds (B-2) 18,020,380$ 422,307$
FOR THE FISCAL YEAR ENDED JUNE 30, 2014
Note A - Explanation of Differences between Budgetary Inflows and Outflows and GAAP Revenues and Expenditures
LOGAN TOWNSHIP BOARD OF EDUCATIONREQUIRED SUPPLEMENTARY INFORMATION
BUDGETARY COMPARISON SCHEDULE NOTE TO RSI

This page intentionally left blank

OTHER SUPPLEMENTARY INFORMATION

This page intentionally left blank
D. School Based Budget Schedules
Not Applicable

This page intentionally left blank

E. Special Revenue Fund

This page intentionally left blank

EXHIBIT E-1(Page 1 of 3)
BASIC BASIC REGULAR PRESCHOOL
REGULAR PROGRAM INCENTIVE PROGRAM CARRYOVER PROGRAM TITLE I
Revenues: Federal Sources 231,485$ 1,405$ 8,977$ 88,277$
Total Revenues 231,485$ 1,405$ 8,977$ 88,277$
Expenditures: Instruction: Salaries of Teachers -$ -$ -$ 65,504$ Tuition 231,485 1,405 8,348 -
Total Instruction 231,485 1,405 8,348 65,504
Support Services: Employee Benefits - - 629 14,298 Purchase Professional & Technical Services - - - 8,475
Total Support Services - - 629 22,773
Total Expenditures 231,485$ 1,405$ 8,977$ 88,277$
AND EXPENDITURES - BUDGETARY BASISFOR THE FISCAL YEAR ENDED JUNE 30, 2014
(With Comparative Totals for June 30, 2013)
I.D.E.A. - PART B
LOGAN TOWNSHIP BOARD OF EDUCATIONSPECIAL REVENUE FUND
COMBINING SCHEDULE OF PROGRAM REVENUES

EXHIBIT E-1(Page 2 of 3)
TITLE I TITLE II ITALIANCARRYOVER PART A TITLE III GRANT
Revenues: Federal Sources 22,788$ 16,837$ 1,238$ -$ Local Sources - - - 15,000
Total Revenues 22,788$ 16,837$ 1,238$ 15,000$
Expenditures: Instruction: Salaries of Teachers 12,658$ -$ 1,150$ 15,000$
Total Instruction 12,658 - 1,150 15,000
Support Services: Employee Benefits 10,130 - 88 - Purchase Professional & Technical Services - 16,837 - -
Total Support Services 10,130 16,837 88 -
Total Expenditures 22,788$ 16,837$ 1,238$ 15,000$
FOR THE FISCAL YEAR ENDED JUNE 30, 2014(With Comparative Totals for June 30, 2013)
LOGAN TOWNSHIP BOARD OF EDUCATIONSPECIAL REVENUE FUND
COMBINING SCHEDULE OF PROGRAM REVENUESAND EXPENDITURES - BUDGETARY BASIS

EXHIBIT E-1(Page 3 of 3)
PRESCHOOLEDUCATION
AID 2014 2013Revenues: Federal Sources -$ 371,007$ 352,688$ State Sources 36,300 36,300 36,300 Local Sources - 15,000 6,000
Total Revenues 36,300 422,307 394,988
Expenditures: Instruction: Salaries of Teachers 34,300$ 128,612$ 105,376$ Tuition - 241,238 235,000 Other Purchased Services - - - General Supplies 2,000 2,000 13,898 Textbooks - - -
Total Instruction 36,300 371,850 354,274
Support Services: Employee Benefits - 25,145 - Purchased Professional Services - 25,312 35,714 General Supplies - - 5,000
Total Support Services - 50,457 40,714
Total Expenditures 36,300$ 422,307$ 394,988$
(With Comparative Totals for June 30, 2013)FOR THE FISCAL YEAR ENDED JUNE 30, 2014
LOGAN TOWNSHIP BOARD OF EDUCATIONSPECIAL REVENUE FUND
COMBINING SCHEDULE OF PROGRAM REVENUESAND EXPENDITURES - BUDGETARY BASIS

EXHIBIT E-2
2014BUDGETED ACTUAL VARIANCE
Expenditures: Instruction: Salaries of Teachers 34,300$ 34,300$ -$ Supplies 2,000 2,000 -
Total Instruction 36,300 36,300 -
Total Expenditures 36,300$ 36,300$ -$
Total Revised 2013-2014 Preschool Education Aid Allocation 36,300$ Add: Actual Preschool Education Aid Carryover June 30, 2013 -
Total Preschool Education Aid Funds Available for 2013-2014 Budget 36,300 Less: 2013-2014 Budgeted Preschool Education Aid (Prior Year Budget Carryover) (36,300)
Available & Unbudgeted Preschool Education Aid Funds June 30, 2014 - Add: June 30, 2014 Unexpended Preschool Education Aid -
Total Actual Preschool Education Aid Carryover -$
2013-2014 Preschool Education Aid Carryover Budgeted in 2014-2015 -$
CALCULATION OF BUDGET AND CARRYOVER
LOGAN BOARD OF EDUCATIONSPECIAL REVENUE FUND
SCHEDULE OF PRESCHOOL EDUCATION AIDSTATEMENT OF EXPENDITURES
BUDGETARY BASISFOR THE FISCAL YEAR ENDED JUNE 30, 2014

F. Capital Projects Fund

This page intentionally left blank

EXH
IBIT
F-1
.
PRO
JEC
TD
ATE
APP
RO
PIR
ATI
ON
PRIO
RC
UR
REN
TU
NEX
PEN
DED
Coo
ling
Tow
er fo
r HV
AC
01/0
6/20
1457
7,00
0$
-$
77
,758
$
499,
242
$
Tota
l-
$
77,7
58$
49
9,24
2$
Rec
onci
liatio
n - U
nexp
ende
d C
apita
l Pro
ject
B
alan
ces t
o Fu
nd B
alan
ce -
June
30,
201
4:
Une
xpen
ded
Proj
ect B
alan
ces J
une
30, 2
014
499,
242
$
Less
:
Une
xpen
ded
Stat
e A
id -
RO
D G
rant
s(1
99,6
97)
Tot
al F
und
Bal
ance
(GA
AP
Bas
is) -
Jun
e 30
, 201
429
9,54
5$
EXPE
ND
ITU
RES
TO
DA
TE
LO
GA
N T
OW
NSH
IP B
OA
RD
OF
ED
UC
AT
ION
CA
PIT
AL
PR
OJE
CT
S FU
ND
SUM
MA
RY
ST
AT
EM
EN
T O
F PR
OJE
CT
EX
PEN
DIT
UR
ES
YE
AR
EN
DE
D J
UN
E 3
0, 2
014

EXHIBIT F-2
Revenues & Other Financing Sources: State Sources 230,800$ Transfer from General Fund 346,200
Total Revenues 577,000
Expenditures & Other Financing Uses: Purchased Professional & Technical Services 36,908 Construction Services 40,850
Total Expenditures 77,758
Excess/(Deficiency) of Revenues Over/(Under) Expenditures 499,242 Fund Balance - Beginning -
Fund Balance - Ending 499,242$
FOR THE YEAR ENDED JUNE 30, 2014
LOGAN TOWNSHIP BOARD OF EDUCATIONCAPITAL PROJECTS FUND
SUMMARY SCHEDULE OF REVENUES, EXPENDITURES AND CHANGES INFUND BALANCE-BUDGETARY BASIS

EXHIBIT F-2a
REVISEDPRIOR CURRENT AUTHORIZED
PERIODS YEAR TOTALS COSTRevenues & Other Financing Sources: State Sources - ROD Grant -$ 230,800$ 230,800$ 230,800$ Transfers - 346,200 346,200 346,200
Total Revenues - 577,000 577,000 577,000
Expenditures & Other Financing Uses: Purchased Professional & Technical Services - 36,908 36,908 54,100 Construction Services - 40,850 40,850 522,900
Total Expenditures - 77,758 77,758 577,000
Excess/(Deficiency) of Revenues Over/ (Under) Expenditures -$ 499,242$ 499,242$ -$
Project Number #2750-040-14-1005-G04Grant Date 01/06/2014Bond Authorization Date N/ABonds Authorized N/ABonds Issued N/AOriginal Authorized Cost $577,000Revised Authorized Cost $577,000Percentage Increase Over Original Authorized Cost 0%
FOR THE YEAR ENDED JUNE 30, 2014
ADDITIONAL PROJECT INFORMATION
LOGAN TOWNSHIP BOARD OF EDUCATIONCAPITAL PROJECTS FUND
SCHEDULE OF REVENUES, EXPENDITURES, PROJECT BALANCE ANDPROJECT STATUS - BUDGETARY BASIS
COOLING TOWER FOR HVAC

This page intentionally left blank

G. Proprietary Funds

This page intentionally left blank

Enterprise Funds
This section has been included on Exhibit B-4, B-5 & B-6

This page intentionally left blank

Internal Service Fund
Not Applicable

This page intentionally left blank

H. Fiduciary Fund

This page intentionally left blank

EXH
IBIT
H-1
UN
EMPL
OY
MEN
TC
OM
PEN
SATI
ON
INSU
RA
NC
EST
UD
ENT
ASS
ETS
TRU
STSC
HO
LAR
SHIP
AC
TIV
ITY
PAY
RO
LL20
1420
13
Cas
h &
Cas
h Eq
uiva
lent
s24
,724
$
6,96
8$
29,3
51$
225,
720
$
286,
763
$
27
7,78
0$
Due
from
Une
mpl
oym
ent
-
-
-
35
1
35
1
-
T
otal
Ass
ets
24,7
24
6,
968
29
,351
22
6,07
1
28
7,11
4
277,
780
LIA
BIL
ITIE
S
Payr
oll D
educ
tions
& W
ithho
ldin
gs-
-
-
214,
948
214,
948
20
9,26
5Fl
exib
le S
pend
ing
-
-
-
11
,123
11
,123
11,3
67D
ue to
Pay
roll
351
-
-
-
351
-D
ue to
Stu
dent
Gro
ups
-
-
29,3
51
-
29
,351
31,4
24
T
otal
Lia
bilit
ies
351
29,3
51
226,
071
255,
773
25
2,05
6
NET
PO
SITI
ON
Res
erve
d fo
r Une
mpl
oym
ent C
ompe
nsat
ion
24,3
73
-
-
-
24
,373
18,6
64U
nres
erve
d-
6,
968
-
-
6,
968
7,
060
T
otal
Net
Pos
ition
24,3
73$
6,
968
$
-
$
-$
31
,341
$
25,7
24$
AG
ENC
Y
PRIV
ATE
PU
RPO
SE
(With
Com
para
tive
Tot
als f
or J
une
30, 2
013)
LO
GA
N T
OW
NSH
IP B
OA
RD
OF
ED
UC
AT
ION
FID
UC
IAR
Y F
UN
DS
CO
MPA
RA
TIV
E C
OM
BIN
ING
ST
AT
EM
EN
T O
F FI
DU
CIA
RY
NE
T P
OSI
TIO
NFO
R T
HE
YE
AR
EN
DE
D J
UN
E 3
0, 2
014

EXHIBIT H-2
UNEMPLOYMENTADDITIONS SCHOLARSHIP COMPENSATION 2014 2013
Local Sources: Transfer from Payroll Agency Account -$ 10,602$ 10,602$ 13,227$ Investment Earnings: Interest 8 3 11 18
Total Additions 8 10,605 10,613 13,245
DEDUCTIONS
Quarterly Unemployment Contribution Reports - 4,896 4,896 1,461 Scholarship Payments 100 - 100 200
Total Deductions 100 4,896 4,996 1,661
Change in Net Position (92) 5,709 5,617 11,584 Net Position - Beginning of the Year 7,060 18,664 25,724 14,140
Net Position - End of the Year 6,968$ 24,373$ 31,341$ 25,724$
PRIVATE PURPOSE
(With Comparative Totals for June 30, 2013)
LOGAN TOWNSHIP BOARD OF EDUCATIONFIDUCIARY FUNDS
COMBINING STATEMENT OF CHANGES IN FIDUCIARY NET POSITIONFOR THE YEAR ENDED JUNE 30, 2014

EXHIBIT H-3
BALANCE BALANCEJULY 1, CASH CASH JUNE 30,
2013 RECEIPTS DISBURSEMENTS 2014
Student Activity 31,424$ 22,015$ 24,088$ 29,351$
Total Student Activity 31,424$ 22,015$ 24,088$ 29,351$
EXHIBIT H-4
BALANCE BALANCEJULY 1, JUNE 30,
ASSETS 2013 ADDITIONS DELETIONS 2014
Cash & Cash Equivalents 220,632$ 8,301,246$ 8,296,158$ 225,720$ Due from Unemployment - 351 - 351
Total Assets 220,632$ 8,301,597$ 8,296,158$ 226,071$
LIABILITIES
Payroll Deductions & Withholding 209,265$ 3,721,967$ 3,716,284$ 214,948$ Net Payroll - 4,552,941 4,552,941 - Flexible Spending 11,367 26,689 26,933 11,123
Total Liabilities 220,632$ 8,301,597$ 8,296,158$ 226,071$
PAYROLL AGENCY FUNDSCHEDULE OF RECEIPTS AND DISBURSEMENTS
FOR THE FISCAL YEAR ENDED JUNE 30, 2014
LOGAN TOWNSHIP BOARD OF EDUCATIONSTUDENT ACTIVITY AGENCY FUND
SCHEDULE OF RECEIPTS AND DISBURSEMENTSFOR THE FISCAL YEAR ENDED JUNE 30, 2014

This page intentionally left blank

I. Long-Term Debt

This page intentionally left blank

EXH
IBIT
I-1
BA
LAN
CE
BA
LAN
CE
DA
TE O
FA
MO
UN
T O
FIN
TER
EST
JULY
1,
JUN
E 30
,IS
SUE
ISSU
EIS
SUE
DA
TEA
MO
UN
TR
ATE
2013
ISSU
EDR
ETIR
ED20
14
Ref
undi
ng B
onds
-04
/15/
2002
7,63
0,00
0$
665,
000
$-
$
66
5,00
0$
-$
Serie
s 200
2
Ref
undi
ng B
onds
-04
/20/
2005
4,84
0,00
07/
15/2
014
515,
000
3.40
%3,
170,
000
-
495,
000
2,
675,
000
Serie
s 200
57/
15/2
015
530,
000
4.00
%7/
15/2
016
545,
000
4.00
%7/
15/2
017
540,
000
3.75
%7/
15/2
018
545,
000
4.00
%
Tota
l3,
835,
000
$-
$
1,
160,
000
$2,
675,
000
$
AN
NU
AL
MA
TUR
ITIE
S
LO
GA
N T
OW
NSH
IP B
OA
RD
OF
ED
UC
AT
ION
LO
NG
-TE
RM
DE
BT
SCH
ED
UL
E O
F SE
RIA
L B
ON
DS
JUN
E 3
0, 2
014

EXH
IBIT
I-2
AM
OU
NT
AM
OU
NT
INTE
RES
TO
UTS
TAN
DIN
GIS
SUED
RET
IRED
OU
TSTA
ND
ING
DA
TE O
FTE
RM
OF
AM
OU
NT
OF
OR
IGIN
AL
LEA
SER
ATE
JUN
E 30
,C
UR
REN
TLE
ASE
C
UR
REN
TJU
NE
30,
SER
IES
LEA
SELE
ASE
PRIN
CIP
AL
INTE
RES
TPA
YA
BLE
2013
YEA
RA
DJU
STM
ENT
YEA
R20
14
Del
l Com
pute
r Equ
ipm
ent
8/1/
2009
49 M
onth
s24
7,13
5
27
,010
6.
930%
9,78
3$
-$
-
$
9,78
3$
-$
Del
l Com
pute
r Equ
ipm
ent
8/1/
2011
48 M
onth
s21
7,64
0
25
,459
8.
400%
103,
094
-
9,13
0
49,9
49
62
,275
Del
l Com
pute
r Equ
ipm
ent
8/1/
2011
48 M
onth
s88
,644
8,
370
6.
000%
45,8
47
-
-
20,6
08
25
,239
Del
l Com
pute
r Equ
ipm
ent
5/31
/201
249
Mon
ths
104,
129
11,3
35
7.50
0%76
,326
-
-
22
,532
53,7
94
Del
l Com
pute
r Equ
ipm
ent
8/1/
2013
49 M
onth
s79
,514
6,
393
5.
100%
-
79,5
14
-
20,6
82
58
,832
Tot
al23
5,05
0$
79,5
14$
9,
130
$
123,
554
$
200,
140
$
LO
GA
N T
OW
NSH
IP B
OA
RD
OF
ED
UC
AT
ION
LO
NG
-TE
RM
DE
BT
SCH
ED
UL
E O
F O
BL
IGA
TIO
NS
UN
DE
R C
API
TA
L L
EA
SES
JUN
E 3
0, 2
014

EXH
IBIT
I-3
VA
RIA
NC
EV
AR
IAN
CE
POSI
TIV
E/PO
SITI
VE/
(NEG
ATI
VE)
(NEG
ATI
VE)
AC
CO
UN
TO
RIG
INA
LB
UD
GET
FIN
AL
FIN
AL
TOO
RIG
INA
LB
UD
GET
FIN
AL
FIN
AL
TON
UM
BER
SB
UD
GET
TRA
NSF
ERS
BU
DG
ETA
CTU
AL
AC
TUA
LB
UD
GET
TRA
NSF
ERS
BU
DG
ETA
CTU
AL
AC
TUA
LR
even
ues:
L
ocal
Sou
rces
:
L
ocal
Tax
Lev
y40
-121
088
0,08
6$
-
$
880,
086
$
880,
086
$
-$
917,
936
$
-$
91
7,93
6$
91
7,93
6$
-
$
Sta
te S
ourc
es:
Deb
t Ser
vice
Aid
Typ
e II
40-3
160
410,
592
-
410,
592
41
0,59
2
-
42
8,27
0
-
42
8,27
0
428,
270
-
T
otal
Rev
enue
s1,
290,
678
-
1,
290,
678
1,29
0,67
8-
1,34
6,20
6-
1,34
6,20
61,
346,
206
-
Expe
nditu
res:
R
egul
ar D
ebt S
ervi
ce:
Int
eres
t40
-701
-510
-834
130,
678
-
130,
678
13
0,67
8
-
18
1,20
5
-
18
1,20
5
181,
204
1
Red
empt
ion
of P
rinci
pal
40-7
01-5
10-9
101,
160,
000
-
1,
160,
000
1,16
0,00
0-
1,16
5,00
0-
1,16
5,00
01,
165,
000
-
T
otal
Exp
endi
ture
s1,
290,
678
-
1,
290,
678
1,29
0,67
8-
1,34
6,20
5-
1,34
6,20
51,
346,
204
1
Oth
er F
inan
cing
Sou
rces
/(Use
s):
T
rans
fers
from
Gen
eral
Fun
d -
Deb
t Ser
vice
Rel
ief
-
-
-
-
-
-
-
-
-
-
Tota
l Oth
er F
inan
cing
Sou
rces
/(Use
s)-
-
-
-
-
-
-
-
-
-
Exce
ss/(D
efic
ienc
y) o
f Rev
enue
s
Ove
r/(U
nder
) Exp
endi
ture
s-
-
-
-
-
1
-
1
2
(1)
Fund
Bal
ance
, Jul
y 1
2
-
2
2
-
-
-
-
-
-
Fund
Bal
ance
, Jun
e 30
2$
-$
2
$
2
$
-
$
1
$
-
$
1$
2$
(1)
$
JUN
E 30
, 201
4
LO
GA
N T
OW
NSH
IP B
OA
RD
OF
ED
UC
AT
ION
BU
DG
ET
AR
Y C
OM
PAR
ISO
N S
CH
ED
UL
E
DE
BT
SE
RV
ICE
FU
ND
FOR
FIS
CA
L Y
EA
RS
EN
DE
D J
UN
E 3
0, 2
014
AN
D 2
013
JUN
E 30
, 201
3

This page intentionally left blank

STATISTICAL SECTION (Unaudited)

This page intentionally left blank

EXH
IBIT
J-1
2014
2013
2012
2011
2010
2009
2008
2007
2006
2005
Gov
ernm
enta
l Act
iviti
es:
N
et In
vest
men
t in
Cap
ital A
sset
s7,
359,
389
$
6,37
7,07
8$
6,05
3,97
5$
5,23
4,13
1$
4,37
7,07
8$
3,52
9,49
8$
2,72
1,02
2$
1,86
4,85
7$
1,30
1,38
6$
620,
037
$
Res
trict
ed3,
455,
685
3,66
6,37
4
3,10
3,88
1
1,96
4,26
3
1,12
2,41
5
1,45
7,89
9
1,
039,
811
1,
245,
159
1,
634,
354
95
0,42
6
Unr
estri
cted
(259
,289
)
(293
,140
)
(2
74,2
14)
(259
,094
)
(3
50,7
90)
(356
,486
)
(6
3,08
5)
(8
7,74
4)
(3
31,5
65)
135,
515
Tota
l Gov
ernm
enta
l Act
iviti
es
Net
Pos
ition
10,5
55,7
85$
9,75
0,31
2$
8,88
3,64
2$
6,93
9,30
0$
5,14
8,70
3$
4,63
0,91
1$
3,69
7,74
8$
3,02
2,27
2$
2,60
4,17
5$
1,70
5,97
8$
Bus
ines
s-Ty
pe A
ctiv
ities
:
Net
Inve
stm
ent i
n C
apita
l Ass
ets
17,3
11$
22
,331
$
27
,351
$
32
,371
$
32
,965
$
31
,782
$
36
,934
$
42
,107
$
3,
690
$
4,91
4$
Res
trict
ed-
-
-
-
-
-
-
-
-
-
Unr
estri
cted
90,1
25
86
,368
72
,203
68
,996
74
,873
58
,491
28
,581
4,
949
7,
107
2,
730
Tota
l Bus
ines
s-Ty
pe A
ctiv
ities
N
et P
ositi
on10
7,43
6$
108,
699
$
99,5
54$
101,
367
$
107,
838
$
90,2
73$
65,5
15$
47,0
56$
10,7
97$
7,64
4$
Dis
trict
-Wid
e:
Net
Inve
stm
ent i
n C
apita
l Ass
ets
7,37
6,70
0$
6,
399,
409
$ 6,
081,
326
$ 5,
266,
502
$ 4,
410,
043
$ 3,
561,
280
$2,
757,
956
$ 1,
906,
964
$ 1,
305,
076
$ 62
4,95
1$
R
estri
cted
3,45
5,68
5
3,
666,
374
3,10
3,88
11,
964,
263
1,
122,
415
1,
457,
899
1,03
9,81
1
1,24
5,15
9
1,63
4,35
4
950,
426
U
nres
trict
ed(1
69,1
64)
(2
06,7
72)
(202
,011
)
(1
90,0
98)
(275
,917
)
(2
97,9
95)
(34,
504)
(82,
795)
(324
,458
)
13
8,24
5
Tota
l Dis
trict
Net
Pos
ition
10,6
63,2
21$
9,85
9,01
1$
8,98
3,19
6$
7,04
0,66
7$
5,25
6,54
1$
4,72
1,18
4$
3,76
3,26
3$
3,06
9,32
8$
2,61
4,97
2$
1,71
3,62
2$
FISC
AL
YEA
R E
ND
ING
JUN
E 30
,
LO
GA
N T
OW
NSH
IP B
OA
RD
OF
ED
UC
AT
ION
NE
T P
OSI
TIO
N B
Y C
OM
PON
EN
TL
AST
TE
N F
ISC
AL
YE
AR
S(A
ccru
al B
asis
of A
ccou
ntin
g)

EXH
IBIT
J-2
(Pag
e 1
of 3
)
2014
2013
2012
2011
2010
2009
2008
2007
2006
2005
Expe
nses
: G
over
nmen
tal A
ctiv
itie s
In
stru
ctio
n:
R
e gul
ar5,
297,
351
$5,
183,
958
$5,
144,
823
$5,
092,
056
$5,
100,
450
$4,
920,
746
$4,
789,
042
$4,
466,
348
$4,
379,
210
$4,
287,
725
$
S
peci
al E
duca
tion
687,
144
57
3,74
6
611,
867
53
3,49
4
548,
382
52
5,05
3
504,
639
51
6,75
2
470,
881
46
3,20
4
B
asic
Ski
ll/R
emed
ial I
nstru
ctio
n22
2,12
6
386,
526
32
3,73
1
240,
767
37
0,02
0
326,
229
24
7,91
6
204,
011
16
2,89
0
201,
387
Bili
n gua
l Edu
catio
n-
-
-
-
-
-
5,
810
5,40
1
5,
746
5,68
5
O
ther
Inst
ruct
ion
57,9
19
63
,143
50
,335
32
,280
63
,582
51
,235
42,9
60
46,5
84
47,0
84
40,7
38
Su p
port
Serv
ices
:
T
uitio
n4,
011,
053
3,57
9,02
0
3,
231,
290
3,58
4,33
3
4,
441,
648
4,62
7,79
3
4,
848,
260
4,30
8,89
3
3,
864,
931
3,69
9,12
4
S
tude
nt &
Inst
ruct
ion
Rel
ate d
Serv
ices
1,48
0,94
01,
321,
244
1,24
1,42
71,
128,
319
1,27
6,58
51,
138,
680
1,14
2,73
21,
163,
638
1,16
4,17
41,
010,
406
Sch
ool A
dmin
istra
tive
Serv
ice s
319,
580
37
4,50
1
360,
831
34
7,94
3
385,
887
37
9,19
0
395,
626
37
4,19
3
377,
218
37
7,54
1
G
ener
al &
Bus
ines
s Adm
inis
trativ
e
Se
rvic
es57
5,25
2
533,
675
53
0,39
7
520,
965
51
8,12
7
511,
764
50
1,89
6
527,
044
52
2,47
3
552,
859
Pla
nt O
pera
tions
& M
aint
enan
ce1,
431,
213
1,33
5,05
91,
360,
706
1,34
4,57
81,
358,
684
1,22
6,15
41,
228,
585
1,25
1,15
81,
211,
558
1,18
7,60
9
P
u pil
Tran
spor
tatio
n91
8,07
6
910,
312
97
2,83
9
871,
551
1,
250,
299
1,26
7,77
5
1,
251,
819
1,28
8,86
6
1,
102,
199
1,08
6,69
8
A
lloca
ted
Ben
efit s
-
-
-
-
-
-
1,67
0,07
9
-
-
-
Una
lloca
ted
Ben
efit s
3,01
0,60
23,
231,
394
2,79
7,92
82,
739,
236
2,74
1,35
52,
619,
071
1,33
8,35
92,
898,
605
2,33
6,44
82,
157,
418
S
peci
al S
choo
ls-
-
-
-
30
,829
39
,734
38,0
65
32,9
43
29,7
70
29,3
30
Inte
rest
on
Lon g
-Ter
m D
ebt
108,
861
15
8,69
0
209,
311
25
9,68
3
310,
109
36
6,90
9
416,
784
46
6,13
1
512,
928
53
6,51
8
Rev
alua
tion
of F
ixed
Ass
ets
-
647,
073
-
-
-
-
-
-
-
-
U
nallo
cate
d D
e pre
ciat
ion
619,
354
58
7,81
6
763,
459
69
5,91
1
674,
708
62
1,16
5
621,
165
61
4,33
8
549,
445
54
9,65
4
T
otal
Gov
ernm
enta
l Act
iviti
e s
E
xpen
ses
18,7
39,4
71
18
,886
,157
17
,598
,944
17
,391
,116
19
,070
,665
18
,621
,498
19,0
43,7
37
18,1
64,9
05
16,7
36,9
55
16,1
85,8
96
Bus
ines
s-T y
pe A
ctiv
ities
:
Foo
d Se
rvic
e30
7,06
6
328,
623
34
3,04
6
331,
553
35
4,87
5
368,
575
35
9,70
8
375,
970
34
5,11
8
349,
899
Tota
l Bus
ines
s-T y
pe A
ctiv
ities
E
xpen
se30
7,06
6
328,
623
34
3,04
6
331,
553
35
4,87
5
368,
575
35
9,70
8
375,
970
34
5,11
8
349,
899
T
otal
Dis
trict
Ex p
ense
s19
,046
,537
$
19,2
14,7
80$
17,9
41,9
90$
17,7
22,6
69$
19,4
25,5
40$
18,9
90,0
73$
19
,403
,445
$ 18
,540
,875
$ 17
,082
,073
$ 16
,535
,795
$
FISC
AL
YEA
R E
ND
ING
JUN
E 30
,
LO
GA
N T
OW
NSH
IP B
OA
RD
OF
ED
UC
AT
ION
CH
AN
GE
S IN
NE
T P
OSI
TIO
N -
(AC
CR
UA
L B
ASI
S O
F A
CC
OU
NT
ING
)L
AST
TE
N F
ISC
AL
YE
AR
S

EXH
IBIT
J-2
(Pag
e 2
of 3
)
2014
2013
2012
2011
2010
2009
2008
2007
2006
2005
Pro g
ram
Rev
enue
s:
Ope
ratin
g G
rant
s & C
ontri
butio
ns42
2,30
7$
390,
877
$
43
7,28
0$
508,
917
$
54
0,32
6$
382,
074
$
37
2,75
5$
391,
729
$
1,
029,
820
$
1,56
7,60
7$
Tota
l Gov
ernm
enta
l Act
iviti
es P
rogr
am
Rev
enue
s42
2,30
7
390,
877
43
7,28
0
508,
917
54
0,32
6
382,
074
37
2,75
5
391,
729
1,
029,
820
1,56
7,60
7
Bus
ines
s-T y
pe A
ctiv
ities
:
Cha
rges
for S
ervi
ces:
Foo
d Se
rvic
e18
5,42
9
213,
016
22
4,53
6
240,
049
25
6,95
4
249,
595
24
9,70
4
237,
530
21
6,35
4
226,
814
Ope
ratin
g G
rant
s & C
ontri
butio
ns12
0,37
4
124,
752
10
0,54
6
102,
391
96
,379
88
,572
123,
456
72
,496
64
,355
65
,629
Tota
l Bus
ines
s Typ
e A
ctiv
ities
Pro
gram
R
even
ues
305,
803
33
7,76
8
325,
082
34
2,44
0
353,
333
33
8,16
7
373,
160
31
0,02
6
280,
709
29
2,44
3
Tota
l Dis
trict
Pro
gram
Rev
enue
s72
8,11
0$
728,
645
$
76
2,36
2$
851,
357
$
89
3,65
9$
720,
241
$
74
5,91
5$
701,
755
$
1,
310,
529
$
1,86
0,05
0$
Net
(Exp
ense
)/Rev
enue
:
Gov
ernm
enta
l Act
iviti
es(1
8,31
7,16
4)$
(18,
495,
280)
$(1
7,16
1,66
4)$
(16,
882,
199)
$(1
8,53
0,33
9)$
(18,
239,
424)
$(1
8,67
0,98
2)$
(17,
773,
176)
$(1
5,70
7,13
5)$
(14,
618,
289)
$
Bus
ines
s-T y
pe A
ctiv
ities
(1,2
63)
9,14
5(1
7,96
4)10
,887
(1,5
42)
(30,
408)
13,4
52(6
5,94
4)(6
4,40
9)(5
7,45
6)
T
otal
Dis
trict
-Wid
e N
et E
x pen
se(1
8,31
8,42
7)$
(18,
486,
135)
$(1
7,17
9,62
8)$
(16,
871,
312)
$(1
8,53
1,88
1)$
(18,
269,
832)
$(1
8,65
7,53
0)$
(17,
839,
120)
$(1
5,77
1,54
4)$
(14,
675,
745)
$
LO
GA
N T
OW
NSH
IP B
OA
RD
OF
ED
UC
AT
ION
CH
AN
GE
S IN
NE
T P
OSI
TIO
N -
(AC
CR
UA
L B
ASI
S O
F A
CC
OU
NT
ING
)L
AST
TE
N F
ISC
AL
YE
AR
S
FISC
AL
YEA
R E
ND
ING
JUN
E 30
,
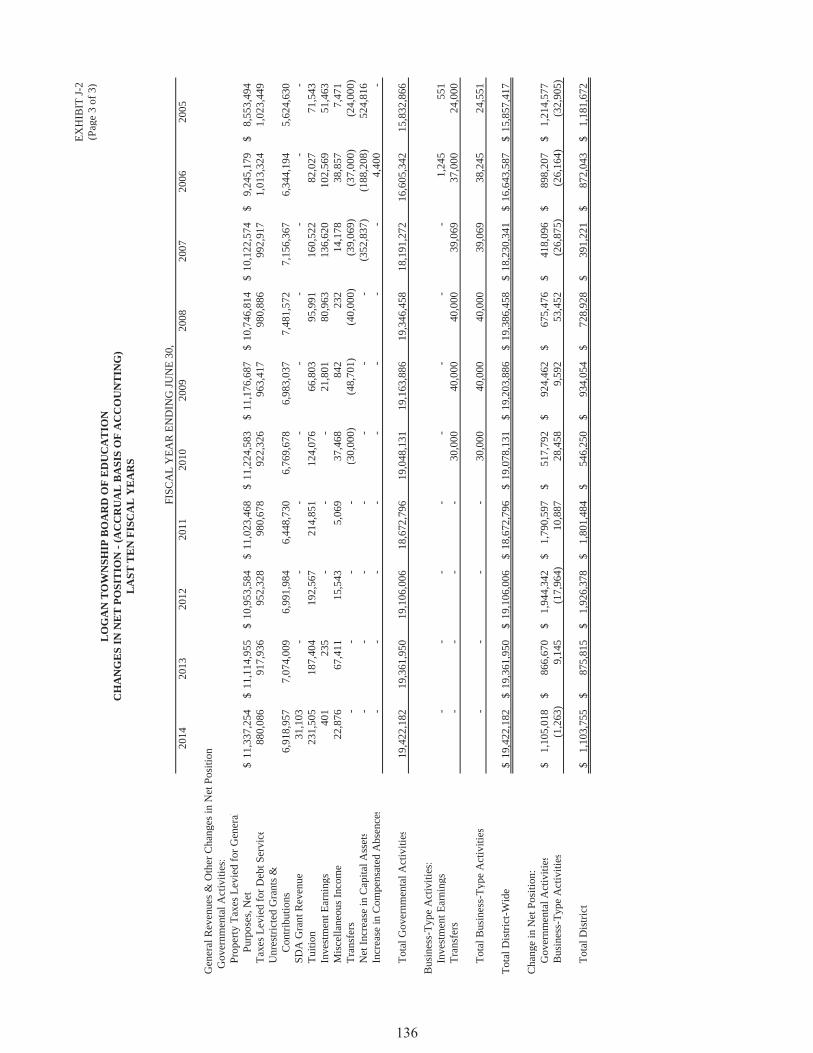
EXH
IBIT
J-2
(Pag
e 3
of 3
)
2014
2013
2012
2011
2010
2009
2008
2007
2006
2005
Gen
eral
Rev
enue
s & O
ther
Cha
n ges
in N
et P
ositi
on G
over
nmen
tal A
ctiv
ities
:
Pro
perty
Tax
es L
evie
d fo
r Gen
eral
Pur
pose
s, N
et11
,337
,254
$
11,1
14,9
55$
10,9
53,5
84$
11,0
23,4
68$
11,2
24,5
83$
11,1
76,6
87$
10
,746
,814
$ 10
,122
,574
$ 9,
245,
179
$
8,55
3,49
4$
T
axes
Lev
ied
for D
ebt S
ervi
c e88
0,08
6
917,
936
95
2,32
8
980,
678
92
2,32
6
963,
417
98
0,88
6
992,
917
1,
013,
324
1,02
3,44
9
Unr
estri
cted
Gra
nts &
Con
tribu
tions
6,91
8,95
77,
074,
009
6,99
1,98
46,
448,
730
6,76
9,67
86,
983,
037
7,48
1,57
27,
156,
367
6,34
4,19
45,
624,
630
S
DA
Gra
nt R
even
u e31
,103
-
-
-
-
-
-
-
-
-
Tui
tion
231,
505
18
7,40
4
192,
567
21
4,85
1
124,
076
66
,803
95,9
91
160,
522
82
,027
71
,543
In
vest
men
t Ear
nin g
s40
1
23
5
-
-
-
21,8
01
80
,963
13
6,62
0
102,
569
51
,463
M
isce
llane
ous I
ncom
e 22
,876
67,4
11
15,5
43
5,06
9
37
,468
84
2
232
14
,178
38
,857
7,
471
T
rans
fers
-
-
-
-(3
0,00
0)(4
8,70
1)(4
0,00
0)(3
9,06
9)(3
7,00
0)(2
4,00
0)
Net
Incr
ease
in C
a pita
l Ass
ets
-
-
-
-
-
-
-(3
52,8
37)
(188
,208
)52
4,81
6
Incr
ease
in C
ompe
nsat
ed A
bsen
ces
-
-
-
-
-
-
-
-
4,40
0
-
T
otal
Gov
ernm
enta
l Act
iviti
e s19
,422
,182
19,3
61,9
50
19,1
06,0
06
18,6
72,7
96
19,0
48,1
31
19,1
63,8
86
19
,346
,458
18
,191
,272
16
,605
,342
15
,832
,866
Bus
ines
s-T y
pe A
ctiv
ities
:
Inve
stm
ent E
arni
ngs
-
-
-
-
-
-
-
-
1,24
5
55
1
Tra
nsfe
rs-
-
-
-
30
,000
40
,000
40,0
00
39,0
69
37,0
00
24,0
00
T
otal
Bus
ines
s-T y
pe A
ctiv
ities
-
-
-
-
30,0
00
40,0
00
40
,000
39
,069
38
,245
24
,551
Tota
l Dis
trict
-Wid
e19
,422
,182
$
19,3
61,9
50$
19,1
06,0
06$
18,6
72,7
96$
19,0
78,1
31$
19,2
03,8
86$
19
,386
,458
$ 18
,230
,341
$ 16
,643
,587
$ 15
,857
,417
$
Cha
n ge
in N
et P
ositi
on:
G
over
nmen
tal A
ctiv
ities
1,10
5,01
8$
866,
670
$1,
944,
342
$1,
790,
597
$51
7,79
2$
924,
462
$
67
5,47
6$
418,
096
$
89
8,20
7$
1,21
4,57
7$
B
usin
ess-
T ype
Act
iviti
es(1
,263
)9,
145
(17,
964)
10,8
8728
,458
9,59
253
,452
(26,
875)
(26,
164)
(32,
905)
T
otal
Dis
tric t
1,10
3,75
5$
875,
815
$1,
926,
378
$1,
801,
484
$54
6,25
0$
934,
054
$
72
8,92
8$
391,
221
$
87
2,04
3$
1,18
1,67
2$
LO
GA
N T
OW
NSH
IP B
OA
RD
OF
ED
UC
AT
ION
CH
AN
GE
S IN
NE
T P
OSI
TIO
N -
(AC
CR
UA
L B
ASI
S O
F A
CC
OU
NT
ING
)L
AST
TE
N F
ISC
AL
YE
AR
S
FISC
AL
YEA
R E
ND
ING
JUN
E 30
,

EXH
IBIT
J-3
2014
2013
2012
2011
2010
2009
2008
2007
2006
2005
Gen
eral
Fun
d:
Res
erve
d3,
504,
100
$
3,73
7,74
3$
3,
198,
504
$
1,69
2,83
2$
1,
233,
275
$
1,09
6,30
1$
90
1,77
9$
1,18
4,64
2$
1,38
4,46
9$
91
2,71
4$
U
nres
erve
d1,
821
(45,
157)
(1
34,4
74)
262,
970
(1
57,8
80)
331,
461
41
7,53
6
319,
446
25
,768
34
7,61
3
Tota
l Gen
eral
Fun
d3,
505,
921
$3,
692,
586
$
3,06
4,03
0$
1,
955,
802
$
1,07
5,39
5$
1,
427,
762
$
1,31
9,31
5$
1,
504,
088
$
1,41
0,23
7$
1,
260,
327
$
All
Oth
er G
over
nmen
tal F
unds
:
Res
erve
d29
9,54
7$
2$
-
$
-$
-
$
-$
-
$
240,
287
$
-
$
-$
Unr
eser
ved,
Rep
orte
d in
:
S
peci
al R
even
ue F
und
(3,6
30)
(3,6
30)
(3,6
30)
(3,6
30)
(3,6
30)
2
-
-
-
-
C
apita
l Pro
ject
s Fun
d-
-
-
-
-
-
-
-
30
,729
30
,729
D
ebt S
ervi
ce F
und
-
-
-
1,
072
8,70
1
1
10,4
94
9,59
7
1
1
Tota
l All
Oth
er G
over
nmen
tal
F
unds
295,
917
$
(3
,628
)$
(3
,630
)$
(2
,558
)$
5,
071
$
3$
10
,494
$
24
9,88
4$
30,7
30$
30,7
30$
LO
GA
N T
OW
NSH
IP B
OA
RD
OF
ED
UC
AT
ION
FUN
D B
AL
AN
CE
S A
ND
GO
VE
RN
ME
NT
AL
FU
ND
SL
AST
TE
N F
ISC
AL
YE
AR
S(M
odifi
ed A
ccru
al B
asis
of A
ccou
ntin
g)
FISC
AL
YEA
R E
ND
ING
JUN
E 30
,
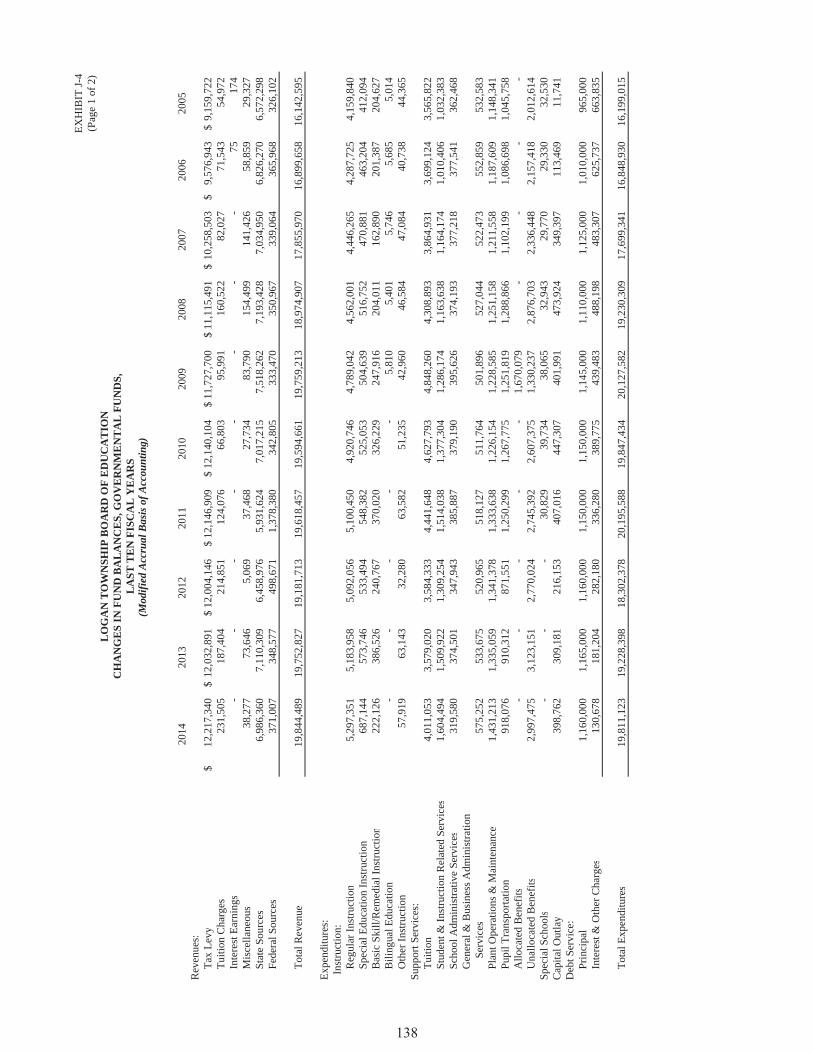
EXH
IBIT
J-4
(Pag
e 1
of 2
)
2014
2013
2012
2011
2010
2009
2008
2007
2006
2005
Rev
enue
s :
Tax
Lev
y12
,217
,340
$
12
,032
,891
$ 12
,004
,146
$ 12
,146
,909
$ 12
,140
,104
$ 11
,727
,700
$ 11
,115
,491
$ 10
,258
,503
$ 9,
576,
943
$
9,15
9,72
2$
T
uitio
n C
harg
e s23
1,50
5
187,
404
21
4,85
1
124,
076
66
,803
95
,991
160,
522
82
,027
71,5
4354
,972
Inte
rest
Ear
ning
s-
-
-
-
-
-
-
-
75
174
M
isce
llane
ous
38,2
77
73
,646
5,
069
37,4
68
27,7
34
83,7
9015
4,49
9
141,
426
58,8
5929
,327
Sta
te S
ourc
e s6,
986,
360
7,11
0,30
9
6,
458,
976
5,93
1,62
4
7,
017,
215
7,51
8,26
27,
193,
428
7,03
4,95
06,
826,
270
6,57
2,29
8
F
eder
al S
ourc
e s37
1,00
7
348,
577
49
8,67
1
1,37
8,38
0
34
2,80
5
333,
470
350,
967
33
9,06
436
5,96
832
6,10
2
T
otal
Rev
enu e
19,8
44,4
89
19,7
52,8
27
19,1
81,7
13
19,6
18,4
57
19,5
94,6
61
19,7
59,2
1318
,974
,907
17,8
55,9
7016
,899
,658
16,1
42,5
95
Expe
nditu
res:
Ins
truct
ion:
R
egul
ar In
stru
ctio
n5,
297,
351
5,18
3,95
8
5,
092,
056
5,10
0,45
0
4,
920,
746
4,78
9,04
24,
562,
001
4,44
6,26
54,
287,
725
4,15
9,84
0
S
peci
al E
duca
tion
Inst
ruct
ion
687,
144
57
3,74
6
533,
494
54
8,38
2
525,
053
50
4,63
951
6,75
2
470,
881
463,
204
412,
094
B
asic
Ski
ll/R
emed
ial I
nstru
ctio
n22
2,12
6
386,
526
24
0,76
7
370,
020
32
6,22
9
247,
916
204,
011
16
2,89
020
1,38
720
4,62
7
Bili
ngua
l Edu
catio
n-
-
-
-
-
5,
810
5,40
1
5,
746
5,68
55,
014
Oth
er In
stru
ctio
n57
,919
63,1
43
32,2
80
63,5
82
51,2
35
42,9
6046
,584
47
,084
40,7
3844
,365
Su
ppor
t Ser
vice
s:
Tui
tion
4,01
1,05
33,
579,
020
3,58
4,33
3
4,
441,
648
4,62
7,79
3
4,
848,
260
4,30
8,89
3
3,
864,
931
3,69
9,12
43,
565,
822
Stu
dent
& In
stru
ctio
n R
elat
ed S
ervi
ces
1,60
4,49
4
1,
509,
922
1,30
9,25
4
1,
514,
038
1,37
7,30
4
1,
286,
174
1,16
3,63
8
1,
164,
174
1,01
0,40
61,
032,
383
Sch
ool A
dmin
istra
tive
Serv
ice s
319,
580
37
4,50
1
347,
943
38
5,88
7
379,
190
39
5,62
637
4,19
3
377,
218
377,
541
362,
468
G
ener
al &
Bus
ines
s Adm
inis
tratio
n
S
ervi
ces
575,
252
53
3,67
5
520,
965
51
8,12
7
511,
764
50
1,89
652
7,04
4
522,
473
552,
859
532,
583
P
lant
Ope
ratio
ns &
Mai
nten
anc e
1,43
1,21
3
1,
335,
059
1,34
1,37
8
1,
333,
638
1,22
6,15
4
1,
228,
585
1,25
1,15
8
1,
211,
558
1,18
7,60
91,
148,
341
Pup
il Tr
ansp
orta
tion
918,
076
91
0,31
2
871,
551
1,
250,
299
1,26
7,77
5
1,
251,
819
1,28
8,86
6
1,
102,
199
1,08
6,69
81,
045,
758
Allo
cate
d B
enef
it s-
-
-
-
-
1,
670,
079
-
-
-
-
Una
lloca
ted
Ben
efit s
2,99
7,47
5
3,
123,
151
2,77
0,02
4
2,
745,
392
2,60
7,37
5
1,
330,
237
2,87
6,70
3
2,
336,
448
2,15
7,41
82,
012,
614
Sp
ecia
l Sch
ool s
-
-
-
30,8
29
39,7
34
38,0
6532
,943
29
,770
29,3
3032
,530
C
apita
l Out
lay
398,
762
30
9,18
1
216,
153
40
7,01
6
447,
307
40
1,99
147
3,92
4
349,
397
113,
469
11,7
41
Deb
t Ser
vice
:
Prin
cipa
l1,
160,
000
1,16
5,00
01,
160,
000
1,15
0,00
0
1,
150,
000
1,14
5,00
01,
110,
000
1,12
5,00
01,
010,
000
965,
000
In
tere
st &
Oth
er C
harg
e s13
0,67
8
181,
204
28
2,18
0
336,
280
38
9,77
5
439,
483
488,
198
48
3,30
762
5,73
766
3,83
5
T
otal
Exp
endi
ture
s19
,811
,123
19
,228
,398
18
,302
,378
20
,195
,588
19
,847
,434
20
,127
,582
19,2
30,3
0917
,699
,341
16,8
48,9
3016
,199
,015
LO
GA
N T
OW
NSH
IP B
OA
RD
OF
ED
UC
AT
ION
CH
AN
GE
S IN
FU
ND
BA
LA
NC
ES,
GO
VE
RN
ME
NT
AL
FU
ND
S ,L
AST
TE
N F
ISC
AL
YE
AR
S(M
odifi
ed A
ccru
al B
asis
of A
ccou
ntin
g)

EXH
IBIT
J-4
(Pag
e 2
of 2
)
2014
2013
2012
2011
2010
2009
2008
2007
2006
2005
Exce
ss (D
efic
ienc
y) o
f Rev
enue
s
Ove
r/(U
nder
) Exp
endi
ture
s33
,366
524,
429
87
9,33
5
(577
,131
)(2
52,7
73)
(368
,369
)(2
55,4
02)
156,
629
50,7
28(5
6,42
0)
Oth
er F
inan
cing
Sou
rces
/(Use
s):
C
apita
l Lea
ses
79,5
14
10
4,12
9
288,
578
-
24
7,13
5
406,
290
213,
103
14
8,93
1
249,
437
-
Tra
nsfe
rs I n
346,
200
-
-
1,
600
-
8,70
1-
-
11
3,07
5
-
Tra
nsfe
rs O
ut(3
46,2
00)
-
-
(1
,600
)
(3
0,00
0)
(48,
701)
(4
0,00
0)
(39,
069)
(1
50,0
75)
(24,
000)
Tota
l Oth
er F
inan
cing
Sou
rces
/(Use
s )79
,514
104,
129
28
8,57
8
-
217,
135
36
6,29
017
3,10
3
109,
862
21
2,43
7
(24,
000)
Net
Cha
nge
in F
und
Bal
ance
s11
2,88
0$
628,
558
$
1,
167,
913
$
(577
,131
)$
(35,
638)
$
(2
,079
)$
(8
2,29
9)$
266,
491
$
26
3,16
5$
(80,
420)
$
Deb
t Ser
vice
as a
Per
cent
age
of
Non
capi
tal E
xpen
ditu
res
6.6%
7.1%
8.0%
7.5%
7.9%
8.0%
8.5%
9.3%
10.8
%11
.2%
Sour
ce: D
istri
ct re
cord
s
Not
e: N
onca
pita
l exp
endi
ture
s are
tota
l exp
endi
ture
s les
s cap
ital o
utla
y
LA
ST T
EN
FIS
CA
L Y
EA
RS
(Mod
ified
Acc
rual
Bas
is o
f Acc
ount
ing)
LO
GA
N T
OW
NSH
IP B
OA
RD
OF
ED
UC
AT
ION
CH
AN
GE
S IN
FU
ND
BA
LA
NC
ES,
GO
VE
RN
ME
NT
AL
FU
ND
S,
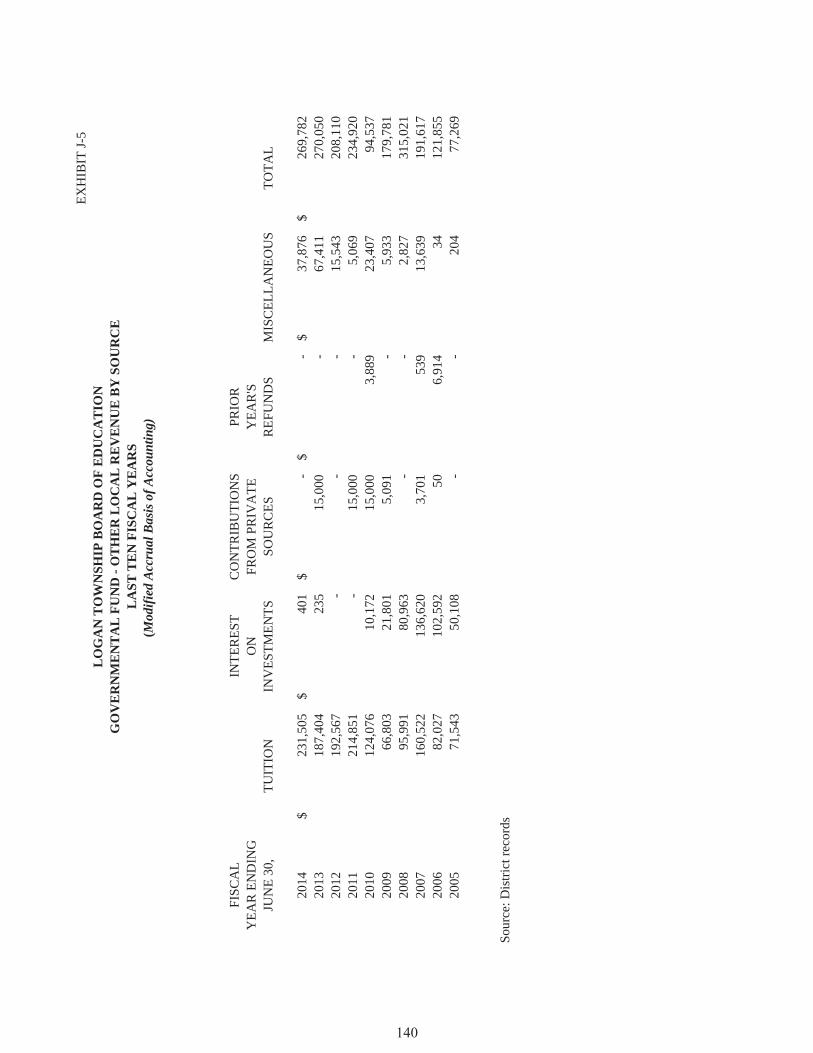
EXH
IBIT
J-5
FISC
AL
INTE
RES
TC
ON
TRIB
UTI
ON
SPR
IOR
YEA
R E
ND
ING
ON
FRO
M P
RIV
ATE
YEA
R'S
JUN
E 30
,TU
ITIO
NIN
VES
TMEN
TSSO
UR
CES
REF
UN
DS
MIS
CEL
LAN
EOU
STO
TAL
2014
231,
505
$
40
1$
-$
-$
37,8
76$
269,
782
$
20
1318
7,40
4
235
15
,000
-
67
,411
27
0,05
0
2012
192,
567
-
-
-
15
,543
20
8,11
0
2011
214,
851
-
15
,000
-
5,
069
234,
920
20
1012
4,07
6
10,1
72
15,0
00
3,88
9
23
,407
94
,537
20
0966
,803
21
,801
5,
091
-
5,93
3
17
9,78
1
2008
95,9
91
80,9
63
-
-
2,82
7
31
5,02
1
2007
160,
522
13
6,62
0
3,70
1
53
9
13,6
39
191,
617
20
0682
,027
10
2,59
2
50
6,
914
34
12
1,85
5
2005
71,5
43
50,1
08
-
-
204
77
,269
Sour
ce: D
istri
ct re
cord
s
LO
GA
N T
OW
NSH
IP B
OA
RD
OF
ED
UC
AT
ION
GO
VE
RN
ME
NT
AL
FU
ND
- O
TH
ER
LO
CA
L R
EV
EN
UE
BY
SO
UR
CE
LA
ST T
EN
FIS
CA
L Y
EA
RS
(Mod
ified
Acc
rual
Bas
is o
f Acc
ount
ing)

EXH
IBIT
J-6
ESTI
MA
TED
FISC
AL
LESS
:TO
TAL
AC
TUA
LY
EAR
TOTA
LTA
XN
ETD
IREC
T(C
OU
NTY
END
EDV
AC
AN
TFA
RM
ASS
ESSE
DEX
EMPT
PUB
LIC
VA
LUA
TIO
NSC
HO
OL
EQU
ALI
ZED
)JU
NE
30,
LAN
DR
ESID
ENTI
AL
REG
.Q
FAR
MC
OM
MER
CIA
LIN
DU
STR
IAL
APA
RTM
ENT
VA
LUE
PRO
PER
TYU
TILI
TIES
TAX
AB
LETA
X R
ATE
VA
LUE
2014
26,6
53,3
00$
394,
150,
700
$
9,14
4,60
0$
2,57
0,40
0$
115,
569,
200
$
498,
306,
200
$
-$
1,04
6,39
4,40
0$
53
,894
,900
$ 2,
598,
689
$ 1,
048,
993,
089
$
1.16
5
1,
172,
134,
424
$20
1317
,647
,900
22
7,01
1,80
0
4,
700,
000
2,
829,
700
64
,805
,410
29
5,79
9,51
7
-
61
2,79
4,32
7
20,7
34,6
00
1,50
7,22
2
614,
301,
549
1.
959
1,13
5,01
4,49
7
20
1214
,829
,100
22
5,07
3,70
0
4,
684,
100
2,
950,
700
57
,188
,010
30
8,15
1,89
0
12
7,20
0
613,
004,
700
20
,435
,100
1,
507,
288
61
4,51
1,98
8
1.93
7
1,
133,
785,
956
2011
14,3
83,9
00
222,
037,
200
5,11
6,10
0
3,08
9,40
0
57,8
92,6
00
314,
055,
690
127,
200
61
6,70
2,09
0
20,5
19,5
00
1,60
7,52
5
618,
309,
615
1.
941
1,18
4,27
4,30
5
20
1013
,725
,300
21
9,31
2,70
0
5,
234,
600
3,
203,
300
58
,936
,600
32
7,54
7,19
0
12
7,20
0
628,
086,
890
20
,520
,700
1,
638,
069
62
9,72
4,95
9
1.92
8
1,
181,
195,
346
2009
13,9
90,1
00
215,
398,
700
5,01
1,20
0
3,20
8,40
0
334,
464,
800
45,8
71,8
90
12
7,20
0
618,
072,
290
18
,838
,900
1,
632,
771
61
9,70
5,06
1
1.95
9
1,
095,
967,
784
2008
13,9
86,8
00
212,
717,
300
5,01
1,20
0
3,20
8,60
0
346,
504,
900
34,6
62,5
90
12
7,20
0
616,
218,
590
18
,838
,900
1,
763,
988
61
7,98
2,57
8
1.89
8
968,
320,
693
20
0711
,442
,500
21
1,52
3,60
0
5,
078,
800
3,
264,
400
34
3,13
8,50
0
34
,662
,590
127,
200
60
9,23
7,59
0
18,6
71,8
00
2,00
9,76
6
611,
247,
356
1.
818
812,
200,
130
20
0612
,917
,300
20
3,02
0,50
0
4,
896,
100
3,
301,
800
32
9,01
7,30
0
34
,662
,590
127,
200
58
7,94
2,79
0
18,6
33,6
00
2,33
5,25
3
590,
278,
043
1.
738
712,
688,
976
20
0514
,172
,100
19
7,36
1,30
0
4,
887,
600
3,
249,
900
32
7,22
8,80
0
34
,869
,390
127,
200
58
1,89
6,29
0
18,2
80,7
00
2,57
3,42
9
584,
469,
719
1.
638
636,
527,
488
Rea
sses
smen
t occ
urs w
hen
orde
red
by th
e C
ount
y B
oard
of T
axat
ion
a. T
axab
le V
alue
of M
achi
nery
, Im
plem
ents
and
Equ
ipm
ent o
f Tel
epho
ne, T
eleg
raph
and
Mes
seng
er S
yste
m C
ompa
nies
b. T
ax ra
tes a
re p
er $
100
Rea
l pro
perty
is re
quire
d to
be
asse
ssed
at s
ome
perc
enta
ge o
f tru
e va
lue
(fai
r or m
arke
t val
ue) e
stab
lishe
d by
eac
h co
unty
boa
rd o
f tax
atio
n.
LO
GA
N T
OW
NSH
IP B
OA
RD
OF
ED
UC
AT
ION
ASS
ESS
ED
VA
LU
E A
ND
AC
TU
AL
VA
LU
E O
F T
AX
AB
LE
PR
OPE
RT
Y,
LA
ST T
EN
FIS
CA
L Y
EA
RS

EXH
IBIT
J-7
FISC
AL
TOTA
LY
EAR
DIR
ECT
&EN
DED
LOC
AL
DEB
TTO
TAL
LOG
AN
GLO
UC
ESTE
RC
OU
NTY
OV
ERLA
PPIN
GJU
NE
30,
SCH
OO
LSE
RV
ICE
DIR
ECT
TOW
NSH
IPC
OU
NTY
LIB
RA
RY
OTH
ERTA
X R
ATE
2014
1.08
1
0.
084
1.16
5
0.
208
0.63
1
0.
049
0.05
2
2.
105
20
131.
810
0.14
9
1.
959
0.34
5
0.
948
0.07
8
0.
075
3.40
5
2012
1.78
2
0.
155
1.93
7
0.
345
1.00
6
0.
082
0.08
0
3.
450
20
111.
782
0.15
9
1.
941
0.34
5
1.
043
0.08
3
0.
082
3.49
4
2010
1.78
2
0.
146
1.92
8
0.
345
0.97
5
0.
079
0.07
7
3.
404
20
091.
804
0.15
5
1.
959
0.34
5
0.
924
0.07
5
0.
072
3.37
5
2008
1.73
9
0.
159
1.89
8
0.
326
0.80
1
0.
067
0.06
3
3.
155
20
071.
638
0.18
0
1.
818
0.30
9
0.
738
0.05
9
0.
053
2.97
7
2006
1.54
7
0.
191
1.73
8
0.
286
0.71
5
0.
055
0.04
1
2.
835
20
051.
456
0.18
2
1.
638
0.28
9
0.
603
0.05
2
0.
032
2.61
4
Sour
ce: D
istri
ct R
ecor
ds a
nd M
unic
ipal
Tax
Col
lect
or
SCH
OO
L D
ISTR
ICT
DIR
ECT
RA
TE
LO
GA
N T
OW
NSH
IP B
OA
RD
OF
ED
UC
AT
ION
DIR
EC
T A
ND
OV
ER
LA
PPIN
G P
RO
PER
TY
TA
X R
AT
ES
LA
ST T
EN
FIS
CA
L Y
EA
RS
(Rat
e pe
r $10
0 of
Ass
esse
d V
alue
) OV
ERLA
PPIN
G R
ATE
S

EXHIBIT J-8
% OF TOTALTAXABLE DISTRICT NETASSESSED ASSESSED
TAXPAYER VALUE RANK VALUE
Liberty Venture I LP $92,163,400 1 8.79%CBRE Inc. 30,000,000 2 2.86%Birch Creek Distrbution Center 17,199,600 3 1.64%SunTrust Bank 17,105,800 4 1.63%Liberty Property LTD 16,392,200 5 1.56%IIT Center Square DC LLC 14,347,700 6 1.37%Duke Realty LP 14,003,700 7 1.33%DGI LS LLC 13,675,800 8 1.30%Prologis NA3 NV IV LLC 13,355,900 9 1.27%IIT Pureland DC I LLC 11,750,000 10 1.12%
Total 239,994,100$ 22.88%
% OF TOTALTAXABLE DISTRICT NETASSESSED ASSESSED
VALUE RANK VALUE
Liberty Ventures I, LLP $49,132,000 1 8.808%Pureland VI Limited Partnership 14,805,700 2 2.654%Mid-Atlantic (Pureland Ind) 14,097,200 3 2.527%Sun Trust Equity Funding, LLC 12,289,100 4 2.203%Pureland Industrial Assoc, LLC 10,954,700 5 1.964%Wachovia Development Corp. 10,000,000 6 1.793%BPG Management Comp. 7,140,200 7 1.280%Liberty Property LTD Partnership 7,089,100 8 1.271%Pureland Birch Creek, LLC 6,855,700 9 1.229%VWR SCI, Inc. 6,451,200 10 1.157%
Total 138,814,900$ 24.89%
Source: Municipal Tax Assessor
2014
2005
LOGAN TOWNSHIP BOARD OF EDUCATIONPRINCIPAL PROPERTY TAX PAYERS,
CURRENT YEAR AND NINE YEARS AGO

EXHIBIT J-9
FISCAL TAXES COLLECTIONSYEAR LEVIED FOR IN
ENDED THE FISCAL PERCENTAGE SUBSEQUENTJUNE 30, YEAR AMOUNT OF LEVY YEARS
2014 12,217,340$ 12,217,340$ 100.00% -2013 12,032,891 12,032,891 100.00% -2012 11,905,912 11,905,912 100.00% -2011 12,004,146 12,004,146 100.00% -2010 12,146,909 12,146,909 100.00% -2009 12,140,104 12,140,104 100.00% -2008 11,727,700 11,727,700 100.00% -2007 11,115,491 11,115,491 100.00% -2006 10,258,503 10,258,503 100.00% -2005 9,576,943 9,576,943 100.00% -
Source: District records including the Certificate and Report of School Taxes (A4F form)
YEAR OF THE LEVY
LOGAN TOWNSHIP BOARD OF EDUCATIONSCHOOL PROPERTY TAX LEVIES AND COLLECTIONS
LAST TEN FISCAL YEARS
COLLECTED WITHIN THE FISCAL

EXHIBIT J-10
FISCALYEAR GENERAL CERTIFICATES
ENDED OBLIGATION OF CAPITAL TOTALJUNE 30, BONDS PARTICIPATION LEASES DISTRICT PER CAPITA
2014 2,675,000$ -$ 200,140$ 2,875,140$ 478 2013 5,000,000 - 235,050 5,235,050 676 2012 5,000,000 - 319,599 5,319,599 878 2011 6,165,000 - 301,735 6,466,735 1,070 2010 7,325,000 - 482,670 8,947,988 1,133 2009 8,475,000 - 472,988 9,930,322 1,433 2008 9,625,000 - 305,322 11,005,661 1,778 2007 10,770,000 - 235,661 12,062,383 1,960 2006 11,880,000 - 182,383 13,005,000 2,107 2005 13,005,000 - - 13,632,000 2,238
Note: Details regarding the district's outstanding debt can be found in the notes to the financial statements.
GOVERNMENTAL ACTIVITIES
LOGAN TOWNSHIP BOARD OF EDUCATIONRATIOS OF OUTSTANDING DEBT BY TYPE
LAST TEN FISCAL YEARS
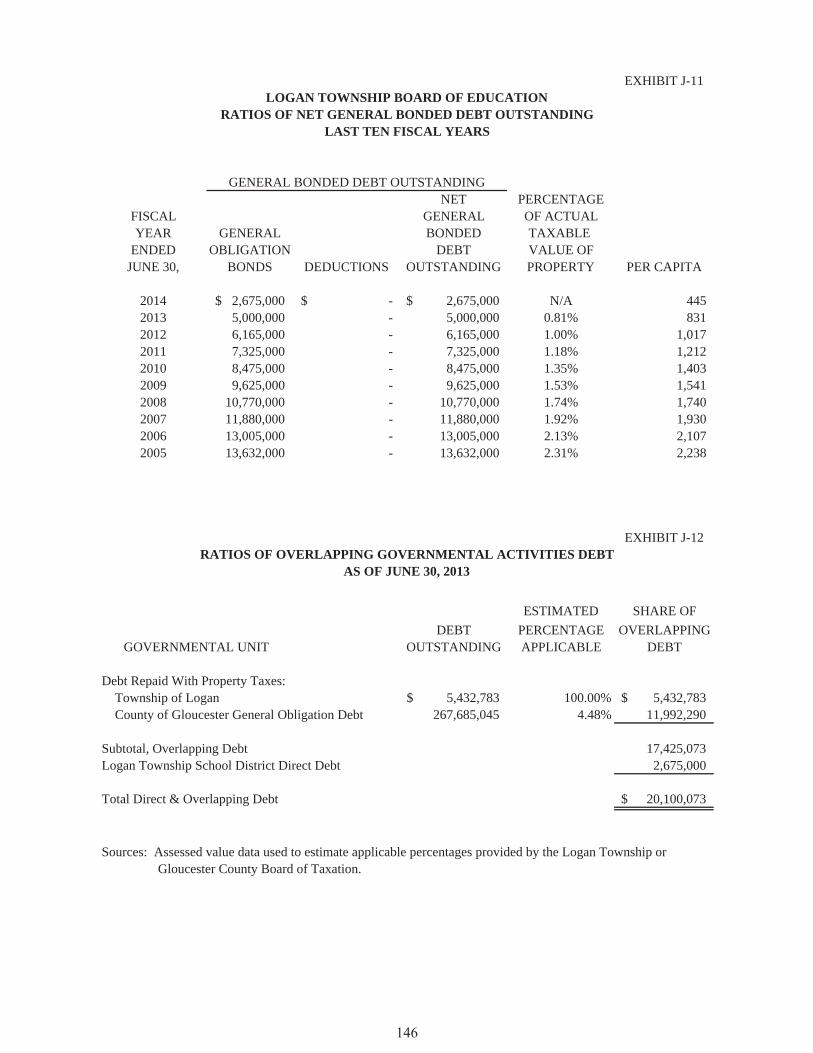
EXHIBIT J-11
NET PERCENTAGEFISCAL GENERAL OF ACTUALYEAR GENERAL BONDED TAXABLE
ENDED OBLIGATION DEBT VALUE OFJUNE 30, BONDS DEDUCTIONS OUTSTANDING PROPERTY PER CAPITA
2014 2,675,000$ -$ 2,675,000$ N/A 445 2013 5,000,000 - 5,000,000 0.81% 831 2012 6,165,000 - 6,165,000 1.00% 1,017 2011 7,325,000 - 7,325,000 1.18% 1,212 2010 8,475,000 - 8,475,000 1.35% 1,403 2009 9,625,000 - 9,625,000 1.53% 1,541 2008 10,770,000 - 10,770,000 1.74% 1,740 2007 11,880,000 - 11,880,000 1.92% 1,930 2006 13,005,000 - 13,005,000 2.13% 2,107 2005 13,632,000 - 13,632,000 2.31% 2,238
EXHIBIT J-12
ESTIMATED SHARE OFDEBT PERCENTAGE OVERLAPPING
OUTSTANDING APPLICABLE DEBT
Debt Repaid With Property Taxes: Township of Logan 5,432,783$ 100.00% 5,432,783$ County of Gloucester General Obligation Debt 267,685,045 4.48% 11,992,290
Subtotal, Overlapping Debt 17,425,073 Logan Township School District Direct Debt 2,675,000
Total Direct & Overlapping Debt 20,100,073$
Sources: Assessed value data used to estimate applicable percentages provided by the Logan Township or Gloucester County Board of Taxation.
AS OF JUNE 30, 2013
GOVERNMENTAL UNIT
GENERAL BONDED DEBT OUTSTANDING
LOGAN TOWNSHIP BOARD OF EDUCATIONRATIOS OF NET GENERAL BONDED DEBT OUTSTANDING
LAST TEN FISCAL YEARS
RATIOS OF OVERLAPPING GOVERNMENTAL ACTIVITIES DEBT

EXH
IBIT
J-13
2014
2013
2012
2011
2010
2009
2008
2007
2006
2005
Deb
t Lim
i t34
,601
,417
$
34,9
05,2
64$
35,0
63,7
10$
35,4
88,3
12$
34,5
01,2
43$
32,1
90,6
31$
28
,195
,875
$ 24
,322
,278
$ 20
,798
,779
$ 19
,059
,307
$
Tota
l Net
Deb
t App
licab
le to
Lim
it2,
675,
000
3,83
5,00
0
5,00
0,00
06,
165,
000
7,
325,
000
8,47
5,00
0
9,
625,
000
10,7
70,0
0011
,880
,000
13,0
05,0
00
Lega
l Deb
t Mar
gin
31,9
26,4
17$
31
,070
,264
$ 30
,063
,710
$
29
,323
,312
$27
,176
,243
$ 23
,715
,631
$
18,5
70,8
75$
13,5
52,2
78$
8,91
8,77
9$
6,
054,
307
$
Tota
l Net
Deb
t App
licab
le to
the
Lim
it
as a
Per
cent
age
of D
ebt L
imit
7.73
%10
.99%
14.2
6%17
.37%
21.2
3%26
.33%
34.1
4%44
.28%
57.1
2%68
.23%
Equa
lized
Val
uatio
n B
asi s
2013
1,15
6,84
2,89
7$
2012
1,16
7,89
4,65
820
111,
135,
404,
149
3,46
0,14
1,70
4$
Ave
rage
Equ
aliz
ed V
alua
tion
of T
axab
le P
rope
rt y1,
153,
380,
568
$
Deb
t Lim
it (3
% o
f Ave
rage
Equ
aliz
atio
n V
alue
)34
,601
,417
Net
Bon
ded
Scho
ol D
ebt
2,67
5,00
0
Lega
l Deb
t Mar
gin
31,9
26,4
17$
Sour
ce:
Equa
lized
val
uatio
n ba
ses w
ere
obta
ined
from
the
Ann
ual R
epor
t of t
he S
tate
of N
ew Je
rse y
Dep
artm
ent o
f Tre
asur
y, D
ivis
ion
of T
axat
ion
aLi
mit
set b
y N
JSA
18A
:24-
19 fo
r a K
thro
ugh
12 d
istri
ct; o
ther
% li
mits
wou
ld b
e ap
plic
able
for o
ther
dis
trict
Leg
al D
ebt M
argi
n C
alcu
latio
n fo
r Fi
scal
Yea
r 20
12
FISC
AL
YEA
R
LO
GA
N T
OW
NSH
IP B
OA
RD
OF
ED
UC
AT
ION
LE
GA
L D
EB
T M
AR
GIN
INFO
RM
AT
ION
LA
ST T
EN
FIS
CA
L Y
EA
RS

EXHIBIT J-14
PER CAPITAPERSONAL UNEMPLOYMENT
YEAR POPULATION INCOME RATE
2014 6,013 N/A N/A2013 6,018 N/A 8.6%2012 6,059 44,868 4.3%2011 6,042 43,658 4.2%2010 6,042 41,663 4.3%2009 6,245 41,072 4.1%2008 6,189 40,898 2.7%2007 6,154 39,052 2.1%2006 6,171 37,630 2.3%2005 6,091 35,694 2.1%
Source: State of New Jersey, Department of Labor and Workforce Development, Labor Planning and Analysis.
LOGAN TOWNSHIP BOARD OF EDUCATIONDEMOGRAPHIC AND ECONOMIC STATISTICS
LAST TEN FISCAL YEARS

EXHIBIT J-15
PERCENTAGE OF(1) TOTAL
EMPLOYEES RANK EMPLOYMENT
Inspira Health 1,825 1Kennedy Memorial Hospital 1,675 2Washington Township School District 1,598 3Rowan University 1,483 4County of Gloucester 1,425 5MISSA Bay LLC 950 6Monroe Twp School District 792 7U.S. Foodservice 725 8ExxonMobil Research & Engineering 540 9LaBrea Bakery 525 10
11,538 N/A
This exhibit reflects principal employers for Gloucester County.
Source: (1) Gloucester County Office of Economic Development for company and employee data. (2) New Jersey Department of Labor and Workforce Development for the total employment data.
N/A
LOGAN TOWNSHIP BOARD OF EDUCATIONPRINCIPAL EMPLOYERS
CURRENT YEAR AND NINE YEARS AGO
2014
2004

EXHIBIT J-16
Function/Program 2014 2013 2012 2011 2010 2009 2008 2007 2006 2005
Instruction: Regular 63 63 63 69 73 71 75 75 75 76 Special Education 12 9 10 9 9 9 7 7 7 7 Other Special Education 4 5 5 4 3 3 3 3 3 3Support Services: Student & Instruction Related Services 26 29 25 23 20 20 20 20 20 17 General & Business Administrative Services 2 2 2 2 2 2 2 2 2 2 School Administrative Services 3 3 3 5 6 6 5 5 5 5 Central Services 2 2 2 3 3 3 4 4 4 4 Administrative Information Technology 1 1 1 1 3 3 2 2 2 2 Plant Operations & Maintenance 5 5 5 5 6 6 3 3 3 3 Pupil Transportation 1 1 1 1 1 1 1 1 1 1Food Service - - 1 2 2 2 4 4 4 6
Total 119 120 118 124 128 126 126 126 126 126
Source: School District Records.
LOGAN TOWNSHIP BOARD OF EDUCATIONFULL-TIME EQUIVALENT DISTRICT EMPLOYEES BY FUNCTION/PROGRAM
LAST TEN FISCAL YEAR

EXH
IBIT
J-17
AV
ERA
GE
AV
ERA
GE
% C
HA
NG
E IN
OPE
RA
TIN
GTE
AC
HER
DA
ILY
DA
ILY
AV
ERA
GE
STU
DEN
T FI
SCA
LEX
PEN
DIT
UR
ESC
OST
PER
PER
CEN
TAG
ETE
AC
HIN
GR
ATI
OEN
RO
LLM
ENT
ATT
END
AN
CE
DA
ILY
A
TTEN
DA
NC
EY
EAR
ENR
OLL
MEN
T(a
)PU
PIL
CH
AN
GE
STA
FF (b
)EL
EMEN
TAR
Y(A
DA
) (c)
(AD
A) (
c)EN
RO
LLM
ENT
PER
CEN
TAG
E
2014
839
$
1
8,12
1,68
3 21
,599
2.
97%
8010
.5:1
838.
9 80
5.6
0.08
%96
.03%
2013
838
1
7,57
7,30
4 20
,975
9.
16%
809.
6:1
838.
2 79
9.3
-4.6
4%95
.36%
2012
879
1
6,89
0,27
0 19
,215
0.
90%
8110
.8:1
879.
0 84
6.1
0.56
%96
.26%
2011
874
1
6,64
4,04
5 19
,044
-4
.04%
8310
.5:1
874.
1 84
0.5
-3.2
3%96
.16%
2010
903
1
8,30
1,29
2 19
,845
0.
00%
8510
.6:1
903.
3 86
5.5
3.14
%96
.00%
2009
900
1
7,86
0,35
2 19
,845
-4
.17%
8211
.0:1
899.
7 86
3.7
2.73
%96
.00%
2008
876
1
8,14
1,10
8 20
,709
12
.61%
8211
.4:1
875.
8 84
2.1
-5.7
4%96
.15%
2007
933
1
7,15
8,18
7 18
,390
8.
53%
8211
.3:1
933.
4 89
5.7
0.46
%95
.96%
2006
929
1
5,74
1,63
8 16
,945
5.
60%
83
11.2
:192
9.1
892.
1 -1
.22%
96.0
2%20
0594
1
15,
099,
724
16,0
46
5.52
%81
12
.1:1
940.
6 90
3.1
-1.8
1%96
.01%
Sour
ces:
D
istri
ct re
cord
s
PUPI
L/
LO
GA
N T
OW
NSH
IP B
OA
RD
OF
ED
UC
AT
ION
OPE
RA
TIN
G S
TA
TIS
TIC
SL
AST
TE
N F
ISC
AL
YE
AR
S

EXH
IBIT
J-18
DIS
TRIC
T B
UIL
DIN
GS
2014
2013
2012
2011
2010
2009
2008
2007
2006
2005
Elem
enta
ry S
choo
ls:
L
ogan
Tow
nshi
p (1
991)
:
S
quar
e Fe
et13
1,06
813
1,06
813
1,06
813
1,06
813
1,06
813
1,06
813
1,06
813
1,06
813
1,06
813
1,06
8
C
apac
ity (S
tude
nts)
877
877
877
877
877
877
877
877
877
877
Enr
ollm
ent
605
610
657
650
651
672
658
728
728
712
C
ente
r Squ
are
(200
1):
Squ
are
Feet
39,1
3539
,135
39,1
3539
,135
39,1
3539
,135
39,1
3539
,135
39,1
3539
,135
Cap
acity
(Stu
dent
s)26
626
626
626
626
626
626
626
626
626
6
E
nrol
lmen
t (a)
234
228
222
224
252
227
218
202
202
229
Num
ber o
f Bui
ldin
gs a
t Jun
e 30
, 201
4:
Ele
men
tary
= 2
M
iddl
e =
0
Hig
h Sc
hool
= 0
O
ther
= 0
Sour
ce: D
istri
ct F
acili
ties O
ffic
e, L
ong
Ran
ge F
acili
ty P
lan
- FES
and
Dis
trict
Cap
acity
repo
rt .
LO
GA
N T
OW
NSH
IP B
OA
RD
OF
ED
UC
AT
ION
SCH
OO
L B
UIL
DIN
G IN
FOR
MA
TIO
NL
AST
TE
N F
ISC
AL
YE
AR
RE
VIS
ED

EXHIBIT J-19
UNDISTRIBUTED EXPENDITURES - REQUIREDMAINTENANCE FOR SCHOOL FACILITIES11-000-261-xxx
LOGAN CENTERTOWNSHIP SQUARE
ELEMENTARY ELEMENTARY TOTAL
2014 133,803$ 34,549$ 168,352$ 2013 116,326 51,784 168,110 2012 115,606 53,582 169,188 2011 98,680 43,685 142,365 2010 95,490 31,141 115,688 2009 87,605 28,083 115,688 2008 24,564 99,644 124,208 2007 72,864 36,367 109,231 2006 97,956 17,253 115,209 2005 93,695 62,464 156,159
Total School Facilities
* School facilities as defined under EFCFA. (N.J.A.C. 6A:26-1.2 and N.J.A.C. 6A:26A-1.3)
Source: District records
LOGAN TOWNSHIP BOARD OF EDUCATIONSCHEDULE OF REQUIRED MAINTENANCE
LAST TEN FISCAL YEARS

EXHIBIT J-20
COVERAGE DEDUCTIBLESchool Package Policy: Property Blanket Building & Contents 43,057,205$ 1,000$ Pollution 1,000,000 - Blanket Dishonesty-Crime Coverage Per Person 100,000 - Per Loss 400,000 1,000 General Liability 5,000,000 - Automobile 5,000,000 - Automobile Comprehensive & Collision Coverage 1,000 School Board Legal Liability 5,000,000 5,000 Workers Compensation Including Supplemental 5,000,000 - Excess Liability-Auto, General Liability, Workers Compensation & School Board Legal 15,000,000 - Student Accident Maximum Benefit Per Injury 1,000,000 - Surety Bonds: Treasurer 250,000 - Business Administrator 5,000 -
Source: District records
LOGAN TOWNSHIP BOARD OF EDUCATIONINSURANCE SCHEDULE
JUNE 30, 2014

SINGLE AUDIT SECTION

This page intentionally left blank

EXHIBIT K-1
INDEPENDENT AUDITOR’S REPORT ON INTERNAL CONTROL OVER FINANCIAL REPORTING AND ON COMPLIANCE AND OTHER MATTERS BASED ON AN AUDIT OF
FINANCIAL STATEMENTS PERFORMED IN ACCORDANCE WITHGOVERNMENT AUDITING STANDARDS
Honorable President and Members of the Board of Education Logan Township School District County of Gloucester Swedesboro, New Jersey 08085
We have audited, in accordance with the auditing standards generally accepted in the United States of America and the standards applicable to financial audits contained in Government Auditing Standards issued by the Comptroller General of the United States and audit requirements as prescribed by the Office of School Finance, Department of Education, State of New Jersey, the financial statements of the governmental and business-type activities, each major fund and the aggregate remaining fund information of the Logan Township Board of Education, as of and for the year ended June 30, 2014, and the related notes to the financial statements, which collectively comprise the Logan Township Board of Education’s basic financial statements, and have issued our report thereon dated November 17, 2014.
Internal Control Over Financial Reporting
In planning and performing our audit of the financial statements, we considered the Logan Township Board of Education’s internal control over financial reporting (internal control) to determine the audit procedures that are appropriate in the circumstances for the purpose of expressing our opinions on the financial statements, but not for the purpose of expressing an opinion on the effectiveness of the Logan Township Board of Education’s internal control. Accordingly, we do not express an opinion on the effectiveness of the Logan Township Board of Education’s internal control.
A deficiency in internal control exists when the design or operation of a control does not allow management or employees, in the normal course of performing their assigned functions, to prevent, or detect and correct, misstatements on a timely basis. A material weakness is a deficiency, or a combination of deficiencies, in internal control, such that there is a reasonable possibility that a material misstatement of the District’s financial statements will not be prevented, or detected and corrected on a timely basis. A significant deficiency is a deficiency, or a combination of deficiencies, in internal control that is less severe than a material weakness, yet important enough to merit attention by those charged with governance.
Our consideration of internal control was for the limited purpose described in the first paragraph of this section and was not designed to identify all deficiencies in internal control that might be material weaknesses or significant deficiencies. Given these limitations, during our audit we did not identify any deficiencies in internal control that we consider to be material weaknesses. However, material weaknesses may exist that have not been identified.

Compliance and Other Matters
As part of obtaining reasonable assurance about whether the Logan Township Board of Education’s financial statements are free from material misstatement, we performed tests of its compliance with certain provisions of laws, regulations, contracts, and grant agreements, noncompliance with which could have a direct and material effect on the determination of financial statement amounts. However, providing an opinion on compliance with those provisions was not an objective of our audit, and accordingly, we do not express such an opinion. The results of our tests disclosed no instances of noncompliance or other matters that are required to be reported under Government Auditing Standards and audit requirements as prescribed by the Office of School Finance, Department of Education, State of New Jersey.
Purpose of this Report
The purpose of this report is solely to describe the scope of our testing of internal control and compliance and the results of that testing, and not to provide an opinion on the effectiveness of the District’s internal control or on compliance. This report is an integral part of an audit performed in accordance with Government Auditing Standards and audit requirements as prescribed by the Office of School Finance, Department of Education, State of New Jersey, and federal and state awarding agencies and pass-through entities, in considering the District’s internal control and compliance. Accordingly, this communication is not suitable for any other purpose.
Respectfully Submitted,
HOLMAN FRENIA ALLISON, P.C.
Rodney R. Haines Public School Accountant Certified Public Accountant No. 2198
Medford, New Jersey November 17, 2014

EXHIBIT K-2
INDEPENDENT AUDITOR’S REPORT ON COMPLIANCE FOR EACH MAJOR PROGRAM AND ON INTERNAL CONTROL OVER COMPLIANCE REQUIRED BY
NEW JERSEY OMB CIRCULAR 04-04.
Honorable President and Members of the Board of Education Logan Township School District County of Gloucester Swedesboro, New Jersey 08085
Report on Compliance for Each Major State Program
We have audited the Logan Township Board of Education’s compliance with the types of compliance requirements described in the New Jersey Aid/Grant Compliance Supplement thatcould have a direct and material effect on each of the District’s major state programs for the year ended June 30, 2014. The Logan Township Board of Education’s major state programs are identified in the Summary of Auditor’s Results section of the accompanying Schedule of Findings and Questioned Costs.
Management’s Responsibility
Management is responsible for compliance with the requirements of laws, regulations, contracts, and grants applicable to its state programs.
Auditor’s Responsibility
Our responsibility is to express an opinion on compliance for each of Logan Township Board of Education’s major state programs based on our audit of the types of compliance requirements referred to above. We conducted our audit of compliance in accordance with auditing standards generally accepted in the United States of America; the standards applicable to financial audits contained in Government Auditing Standards, issued by the Comptroller General of the United States; OMB Circular A-133, Audits of States, Local Governments, and Non-Profit Organization; the New Jersey State Aid/Grant Compliance Supplement; the audit requirements prescribed by the Office of School Finance, Department of Education, State of New Jersey; and New Jersey OMB’s Circular 04-04, Single Audit Policy for Recipients of Federal Grants, State Grants and State Aid.Those standards, OMB Circular A-133 and New Jersey OMB’s Circular 04-04, require that we plan and perform the audit to obtain reasonable assurance about whether noncompliance with the types of compliance requirements referred to above that could have a direct and material effect on a

major state program occurred. An audit includes examining, on a test basis, evidence about Logan Board of Education’s compliance with those requirements and performing such other procedures as we considered necessary in the circumstances.
We believe that our audit provides a reasonable basis for our opinion on compliance for each major state program. However, our audit does not provide a legal determination of the Logan Township Board of Education’s compliance with those requirements.
Opinion on Each Major State Program
In our opinion, the Logan Township Board of Education complied, in all material respects, with the types of compliance requirements referred to above that could have a direct and material effect on each of its major state programs for the year ended June 30, 2014.
Report on Internal Control Over Compliance
Management of the Logan Township Board of Education is responsible for establishing and maintaining effective internal control over compliance with the types of compliance requirements referred to above. In planning and performing our audit of compliance, we considered the Logan Township Board of Education’s internal control over compliance with the types of requirements that could have a direct and material effect on each major state program to determine the auditing procedures that are appropriate in the circumstances for the purpose of expressing an opinion on compliance for each major state program and to test and report on internal control over compliance in accordance with OMB Circular A-133 or New Jersey OMB’s Circular 04-04, but not for the purpose of expressing an opinion on the effectiveness of internal control over compliance. Accordingly, we do not express an opinion on the effectiveness of the Logan Township Board of Education’s internal control over compliance.
A deficiency in internal control over compliance exists when the design or operation of a control over compliance does not allow management or employees, in the normal course of performing their assigned functions, to prevent, or detect and correct, noncompliance with a type of compliance requirement of a state program on a timely basis. A material weakness in internal control over compliance is a deficiency, or combination of deficiencies, in internal control over compliance, such that there is a reasonable possibility that material noncompliance with a type of compliance requirement of a state program will not be prevented, or detected and corrected, on a timely basis. A significant deficiency in internal control over compliance is a deficiency, or a combination of deficiencies, in internal control over compliance with a type of compliance requirement of a state program that is less severe than a material weakness in internal control over compliance, yet important enough to merit attention by those charged with governance.
Our consideration of internal control over compliance was for the limited purpose described in the first paragraph of this section and was not designed to identify all deficiencies in internal control over compliance that might be material weaknesses or significant deficiencies. We did not identify any deficiencies in internal control over compliance that we consider to be material weaknesses. However, material weaknesses may exist that have not been identified.

The purpose of this report on internal control over compliance is solely to describe the scope of our testing of internal control over compliance and the results of that testing based on the requirements of OMB Circular A-133 and New Jersey OMB’s Circular 04-04. Accordingly, this report is not suitable for any other purpose.
Respectfully Submitted,
HOLMAN FRENIA ALLISON, P.C.
Rodney R. Haines Public School Accountant Certified Public Accountant No. 2198
Medford, New Jersey November 17, 2014

This page intentionally left blank

EXH
IBIT
K-4
SCH
EDU
LE B
GR
AN
T O
RB
ALA
NC
E(A
CC
OU
NTS
DEF
ERR
EDD
UE
TOST
ATE
AT
CA
RR
YO
VER
REP
AY
MEN
TR
ECEI
VA
BLE
)R
EVEN
UE
GR
AN
TOR
CU
MU
LATI
VE
PRO
JEC
TA
WA
RD
GR
AN
TJU
NE
30,
(WA
LKO
VER
)C
ASH
OF
PRIO
R Y
EAR
BU
DG
ETA
RY
AT
JUN
E 30
,A
T JU
NE
30,
JUN
E 30
,B
UD
GET
AR
YTO
TAL
STA
TE G
RA
NTO
R/P
RO
GR
AM
TIT
LEN
UM
BER
AM
OU
NT
PER
IOD
2013
AM
OU
NT
REC
EIV
EDB
ALA
NC
EEX
PEN
DIT
UR
ES20
1420
1420
14R
ECEI
VA
BLE
EXPE
ND
ITU
RES
Stat
e D
epar
tmen
t of E
duca
tion
Gen
eral
Fun
d: C
urre
nt E
xpen
se:
E
qual
izat
ion
Ai d
14-
495-
034-
5120
-078
3,99
0,95
0$
7/1/
13-6
/30/
14-
$
-
$
3,
990,
950
$-
$
(3,9
90,9
50)
$
-$
-$
-
$
38
2,69
8$
3,99
0,95
0$
Tra
nspo
rtatio
n A
i d 1
4-49
5-03
4-51
20-0
1438
4,54
4
7/
1/13
-6/3
0/14
-
-
38
4,54
4
-
(3
84,5
44)
-
-
-
36,8
7538
4,54
4
Spe
cial
Edu
catio
n C
ateg
oric
al A
i d 1
4-49
5-03
4-51
20-0
8963
3,95
3
7/
1/13
-6/3
0/14
-
-
63
3,95
3
-
(6
33,9
53)
-
-
-
60,7
9163
3,95
3
Sec
urity
Ai d
14-
495-
034-
5120
-084
101,
621
7/1/
13-6
/30/
14-
-
101,
621
-
(101
,621
)
-
-
-
9,
745
101,
621
A
djus
tmen
t Ai d
14-
495-
034-
5120
-085
220,
299
7/1/
13-6
/30/
14-
-
220,
299
-
(220
,299
)
-
-
-
21
,124
220,
299
E
xtra
ordi
nary
Ai d
13-
495-
034-
5120
-473
47,4
54
7/
1/12
-6/3
0/13
(47,
454)
-
47
,454
--
--
--
-
Ext
raor
dina
ry A
i d 1
4-49
5-03
4-51
20-4
7346
,390
7/1/
13-6
/30/
14-
-
-
-
(4
6,39
0)(4
6,39
0)-
--
46,3
90
Non
Pub
lic T
rans
porta
tion
Ai d
13-
495-
034-
5120
-068
16,1
79
7/
1/12
-6/3
0/13
(16,
179)
-
16
,179
--
--
--
-
Non
Pub
lic T
rans
porta
tion
Ai d
14-
495-
034-
5120
-068
14,2
16
7/
1/13
-6/3
0/14
-
-
-
-
(14,
216)
(14,
216)
-
-
-14
,216
A
nti-B
ully
ing
Gra
n tN
/A63
6
7/
1/13
-6/3
0/14
-
-
63
6
-
(636
)-
-
-
-63
6
On-
Beh
alf T
PAF
Pens
ion
Con
tribu
tion
14-
495-
034-
5095
-006
260,
529
7/1/
13-6
/30/
14-
-
260,
529
-
(260
,529
)-
-
-
-26
0,52
9
On-
Beh
alf T
PAF
Med
ical
Con
tribu
tion
14-
495-
034-
5095
-006
427,
170
7/1/
13-6
/30/
14-
-
427,
170
-
(427
,170
)-
427,
170
O
n-B
ehal
f TPA
F So
cial
Sec
urity
Rei
mbu
rsem
ent
14-
495-
034-
5095
-002
435,
986
7/1/
13-6
/30/
14-
-
414,
605
-
(435
,986
)
(2
1,38
1)
-
-
-43
5,98
6
On-
Beh
alf T
PAF
Soci
al S
ecur
ity R
eim
burs
emen
t 1
3-49
5-03
4-50
95-0
0243
8,60
4
7/
1/12
-6/3
0/13
(21,
425)
-
21
,425
--
--
--
-
T
otal
Gen
eral
Fun
d(8
5,05
8)
-
6,51
9,36
5
(6,5
16,2
94)
(8
1,98
7)
-
-
511,
233
6,51
6,29
4
Spec
ial R
even
ue F
und:
P
resc
hool
Edu
catio
n A
i d14
-495
-034
-512
0-08
636
,300
7/1/
13-6
/30/
14-
-
32,6
70
-
(3
6,30
0)(3
,630
)-
-
3,
630
36,3
00
Pre
scho
ol E
duca
tion
Ai d
13-4
95-0
34-5
120-
086
36,3
00
7/
1/12
-6/3
0/13
(3,6
30)
-
3,63
0
--
--
--
-
Non
publ
ic T
extb
ook
Ai d
13-1
00-0
34-5
120-
064
687
7/1/
12-6
/30/
1368
7
-
-
(6
87)
-
-
-
-
--
N
onpu
blic
Tec
hnol
ogy
Ai d
13-1
00-0
34-5
120-
373
254
7/1/
12-6
/30/
1325
4
-
-
(2
54)
-
-
-
-
--
T
otal
Spe
cial
Rev
enue
Fun
d(2
,689
)
-
36
,300
(941
)
(36,
300)
(3
,630
)
-
-
3,
630
36,3
00
Deb
t Ser
vice
Fun
d:
Deb
t Ser
vice
Aid
Typ
e II
14-
495-
034-
5120
-125
410,
592
7/1/
13-6
/30/
14-
-
410,
592
-
(410
,592
)-
-
-
-41
0,59
2
Tota
l Deb
t Ser
vice
Fun
d-
-
410,
592
-
(410
,592
)
-
-
--
410,
592
Ent
erpr
ise
Fund
:
Nat
iona
l Sch
ool L
unch
Pro
gram
(Sta
te S
hare
)14
-100
010-
3360
-067
3,44
7
7/1/
13-6
/30/
14-
-
2,94
6
-(3
,447
)(5
01)
-
-
-3,
447
N
atio
nal S
choo
l Lun
ch P
rogr
am (S
tate
Sha
re)
13-1
0001
0-33
60-0
674,
044
7/
1/12
-6/3
0/13
(894
)-
89
4
-
--
-
-
-
T
otal
Ent
erpr
ise
Fun d
(894
)-
3,
840
(3,4
47)
(501
)-
--
3,44
7
Tot
al S
tate
Fin
anci
al A
ssis
tanc
e(8
8,64
1)$
-$
6,97
0,09
7$
(941
)$
(6,9
66,6
33)
(86,
118)
$
-$
-
$
51
4,86
3$
6,96
6,63
3$
Less
: Gra
nts N
ot S
ubje
ct to
New
Jers
ey O
MB
Circ
ular
04-
04:
O
n-B
ehal
f TPA
F Pe
nsio
n C
ontri
butio
ns14
-495
-034
-509
5-00
126
0,52
97/
1/13
-6/3
0/14
260,
529
O
n-B
ehal
f TPA
F Po
st-R
etire
men
t Med
ical
14-4
95-0
34-5
095-
001
427,
170
7/1/
13-6
/30/
1442
7,17
0
Tota
l Sta
te F
inan
cial
Ass
ista
nce
sub j
ect t
o N
ew Je
rsey
OM
B C
ircul
ar 0
4-04
(6,2
78,9
34)
$
MEM
O
LO
GA
N T
OW
NSH
IP B
OA
RD
OF
ED
UC
AT
ION
SCH
ED
UL
E O
F ST
AT
E F
INA
NC
IAL
ASS
IST
AN
CE
FOR
TH
E F
ISC
AL
YE
AR
EN
DE
D J
UN
E 3
0, 2
014

This page intentionally left blank

EXHIBIT K-5 (Page 1 of 2)
LOGAN TOWNSHIP BOARD OF EDUCATION NOTES TO THE SCHEDULES OF FINANCIAL ASSISTANCE
FOR THE YEAR ENDED JUNE 30, 2014
1. General
The accompanying schedules of expenditures of federal awards and state financial assistance include federal and state award activity of the Board of Education, Logan Township School District. The Board of Education is defined in Note 1 to the Board’s basic financial statements. All state awards received directly from state agencies, as well as state financial assistance passed through other government agencies is included on the schedule of expenditures of state financial assistance.
2. Basis of Accounting
The accompanying schedules of expenditures of awards and financial assistance are presented on the budgetary basis of accounting with the exception of programs recorded in the food service fund, which are presented using the accrual basis of accounting. These basis of accounting are described in Note 1 to the Board’s basic financial statements.
3. Relationship to Basic Financial Statements
The basic financial statements present the general fund and special revenue fund on a GAAP basis. Budgetary comparison statements or schedules (RSI) are presented for the general fund and special revenue fund to demonstrate finance related legal compliance in which certain revenue is permitted by law or grant agreement to be recognized in the audit year, whereas for GAAP reporting, revenue is not recognized until the subsequent year or when expenditures have been made.
The general fund is presented in the accompanying schedules on the modified accrual basis with the exception of the revenue recognition of the last two state aid payments in the current budget year, which is mandated pursuant to N.J.S.A.18A:22-44.2. For GAAP purposes payment is not recognized until the subsequent budget year due to the state deferral and recording of the last state aid payment in the subsequent year. The special revenue fund is presented in the accompanying schedules on the grant accounting budgetary basis, which recognizes encumbrances as expenditures and also recognizes the related revenues, whereas the GAAP basis does not. The special revenue fund also recognizes the last state aid payment in the current budget year, consistent with N.J.S.A.18A:22-4.2.
The net adjustment to reconcile from the budgetary basis to the GAAP basis is $(7,929) for the general fund and $0 for the special revenue fund. See Note 1 for a reconciliation of the budgetary basis to the modified accrual basis of accounting for the general and special revenue funds. Awards and financial assistance revenues are reported in the Board’s basic financial statements on a GAAP basis as presented as follows:

EXHIBIT K-5 (Page 2 of 2)
LOGAN TOWNSHIP BOARD OF EDUCATION NOTES TO THE SCHEDULES OF FINANCIAL ASSISTANCE
FOR THE YEAR ENDED JUNE 30, 2014
3. Relationship to Basic Financial Statements (continued):
State Total
General Fund $6,508,365 $6,508,365 Special Revenue Fund 36,300 36,300 Capital Projects Fund 31,103 31,103 Debt Service Fund 410,592 410,592 Food Service Fund 3,447 3,447
Total Financial Assistance $6,989,807 $6,989,807
4. Relationship to State Financial Reports
Amounts reported in the accompanying schedules agree with the amounts reported in the related state financial reports.
5. Other
Revenues and expenditures reported under the Food Distribution Program represents current year value received and current year distributions respectively. The amount reported as TPAF Pension Contributions represents the amount paid by the state on behalf of the District for the year ended June 30, 2014. TPAF Social Security Contributions represents the amount reimbursed by the state for the employer’s share of social security contributions for TPAF members for the year ended June 30, 2014.
Note 6. Federal and State Loans Outstanding
Logan Township Board of Education had no loan balances outstanding at June 30, 2014.

EXHIBIT K-6 (Page 1 of 2)
LOGAN TOWNSHIP BOARD OF EDUCATION SCHEDULE OF FINDINGS & QUESTIONED COSTS
For the Fiscal Year Ended June 30, 2014
Section I – Summary of Auditor’s Results
Financial Statements
Type of auditor’s report issued: Unmodified
Internal control over financial reporting:
1) Material weakness(es) identified? None Reported
2) Significant deficiencies identified that are not considered to be material weaknesses? None Reported
Noncompliance material to basic financial Statements noted? No
State Awards
Dollar threshold used to distinguish between type A and type B programs: $300,000
Auditee qualified as low-risk auditee? Yes
Type of auditor’s report issued on compliance for major programs Unmodified
Internal Control over major programs:
1) Material weakness(es) identified? None Reported
2) Significant deficiencies identified that are not considered To be material weaknesses? None Reported
Any audit findings disclosed that are required to be reported in accordance With NJ OMB Circular Letter 04-04 None Reported
Identification of major programs:
GMIS Number(s) Name of State Program
14-495-034-5120-078 Equalization Aid 14-495-034-5120-084 Security Aid 14-495-034-5120-089 Special Education Categorical Aid
14-495-034-5120-085 Adjustment Aid 14-495-034-5120-125 Debt Service Aid Type II

EXHIBIT K-6 (Page 2 of 2)
LOGAN TOWNSHIP BOARD OF EDUCATION SCHEDULE OF FINDINGS & QUESTIONED COSTS
For the Fiscal Year Ended June 30, 2014
Section II – Financial Statement Findings
This section identifies the significant deficiencies, material weaknesses, fraud, illegal acts, violations of provisions of contracts and grant agreements and abuse related to the financial statements for which Government Auditing Standards requires reporting in a Circular A-133 audit.
No Current Year Findings
Section III – State Financial Assistance Finding & Questioned Costs
This section identifies audit findings required to be reported by section .510(a) of Circular A-133 and New Jersey OMB’s Circular Letter 04-04.
No Current Year Findings

EXHIBIT K-7 LOGAN TOWNSHIP BOARD OF EDUCATION
SUMMARY SCHEDULE OF PRIOR AUDIT FINDINGS AND QUESTIONED COSTS AS PREPARED BY MANAGEMENT
For the Fiscal Year Ended June 30, 2014
This section identifies the status of prior-year findings related to the basic financial statements and federal and state awards that are required to be reported in accordance with Chapter 6.12 of Government Auditing Standards, U.S. OMB Circular A-133 (section .315 (a)(b)) and New Jersey OMB’s Circular 04-04.
No Prior Year Findings