scenario-based reliability analysis of component-based ...community.wvu.edu/~hhammar/papers/99...
TRANSCRIPT

1
Scenario-Based Reliability Analysis of Component-Based SoftwareSherif Yacoub, Bojan Cukic, and Hany AmmarComputer Science and Electrical Eng. Dept.,
West Virginia University,Morgantown, WV 26506-6109
{yacoub,cukic,ammar}@csee.wvu.edu
Abstract
Software designers are motivated to utilize off-the-shelf software components for rapid application
development. Such applications are expected to have high reliability as a result of deploying trusted
components. The claims of high reliability need further investigation based on reliability estimation models
and techniques that are applicable to component-based applications.
This paper introduces a probabilistic model and a reliability estimation and analysis technique applicable to
high-level designs. The technique is named "Scenario-Based Reliability Estimation" (SBRE). SBRE is
specific for component-based software whose analysis is strictly based on execution scenarios. Using
scenarios, we construct a probabilistic model named "Component-Dependency Graph" (CDG). CDGs are
directed graphs that represent components, component reliabilities, link and interface reliabilities,
transitions, transition probabilities, and average execution times of components. In CDGs, component
interfaces and link reliabilities are treated as first class element of the model. Based on CDGs, an algorithm
is presented to analyze the reliability of the application as function of the reliability of its components and
interfaces. A case study illustrates the applicability of the algorithm. The SBRE algorithm is used to identify
critical components and critical component interfaces by investigating the sensitivity of the application
reliability to changes in the reliabilities of components and their interfaces.
Keywords: Component-Based software, Reliability Analysis, Reliability Modeling, Component-Dependency
Graphs
1 Introduction
Component-based software engineering (CBSE) is emerging as a beneficial development paradigm for
building software from existing components by assembling these parts together in an interoperable manner.
Component-based software development is the process of assembling components (including Commercial
Off-The-Shelf components COTS) in an application such that they interact as intended. Each component
requires pre-specified services from the other components. CBSE is touted as the approach to improving
application qualities, decrease time to market, and improve software maintainability and reliability.
However, ensuring a reliable software application is a difficult task even with the use of commercial pre-
tested and trusted software components.
As a result, several techniques have emerged to estimate and analyze the reliability of component-based
applications. There are can be categorized as:

2
x System-level Reliability Estimation: Reliability is estimated for the application as a whole. For example
using system testing, or system level architecture evaluation.
x Component-Based Reliability Estimation: The application reliability is estimated using the reliability of
the individual components and their interconnection mechanisms.
The first approach treats the software application as a whole. This approach is not usually suitable for
component-based applications because it does not consider the composition and integrative property of such
systems and doesn't accommodate the reliability growth of individual component. The limitations of this
approach to component-based application are discussed in [Horgan+96].
As for the second approach, we need to estimate:
x Reliability of a Component: Reliability assessment of the components themselves including COTS
components and how those reliability models are affected by the component usage across several
applications.
x Reliability of a Component-Based System: Reliability assessment of applications developed using
software components as their building blocks.
This paper addresses the second problem, and assumes that reliability estimates of the components
themselves are available.
1.1 Motivation
In this paper, we are concerned with reliability estimation models and analysis algorithms for component-
based software whose analysis is substantially based on execution scenarios. This work is motivated by the
need to:
x Estimate the reliability of a component-based application which doesn't depend on the availability of
source code of each component (i.e. fault injection and seeding would not be applicable).
x Develop a probabilistic model and analysis technique for reliability analysis which is applicable at the
design-level even before the integration and actual development phase. Many reliability analysis
techniques use test cases and fault injection to study the reliability of a component-based system. Using
scenarios has the advantage of applicability at early phases.
x Study the sensitivity of the application reliability to reliabilities of components and interfaces. This
would guide the process of identifying critical components and interfaces and analyze the effect of
replacing components with new ones with similar interfaces but with improved estimated reliability.
x Incorporate the effect of interface and component reliabilities as first class elements in a probabilistic
model for reliability analysis.

3
x Develop a technique to analyze the reliability of applications built from reusable software components.
The field of component-based software engineering is rapidly emerging to deliver on some of the
promises of software reuse by building domain-specific component repositories and developing
applications using component from these repositories. This emerging discipline exacerbates research to
estimate component reliabilities and analysis the reliability component-based applications.
1.2 Contribution
This paper addresses the problem of reliability modeling and reliability analysis in component based
applications. We propose a new technique called Scenario-Based Reliability Estimation (SBRE), which
builds on the analysis scenarios of a component-based application. A Component Dependency Graph (CDG)
is proposed as a new probabilistic model which incorporates component and interaction probabilities, and
their reliabilities. An algorithm is proposed to analyze the reliability of component-based applications using
components, interfaces and links reliabilities. The SBRE algorithm is applied to a case study to discuss the
variations in the application reliability based on component reliability and interface reliability growth. We
also discuss the effect of different usage of components on applications developed from these components.
The contribution of this paper is a new scenario-based technique to model and analyze the sensitivity of the
application reliability to component and interface reliabilities. We are not estimating the absolute application
reliability over its execution lifetime. Instead, we limit our analysis to the average execution time of a usage
scenario.
This paper is organized as follows. Section 2 describes scenario-based analysis for component-based
applications. Section 3 defines the elements used in constructing the component dependency graphs (CDG).
In Section 4, we discuss the new SBRE algorithm. Section 5 describes the applicability of the algorithm to a
case study and show how the algorithm can detect critical components and critical component interfaces.
Section 6 discusses related work in reliability of component-based applications and highlights limitations
and differences. Finally, we conclude this paper in Section 7.
2 Dynamic Behavior Analysis using Scenarios
Scenarios are means of analyzing applications and understanding their dynamic behavior. Scenarios are
useful during design because they bridge the gap between architectures and implementation, they also add
behavior analysis capabilities to design structures[Weidenhaupt+98]. One way to model scenarios is using
sequence diagrams. Sequence diagrams specify interactions between application entities in a timely
sequence manner. In particular, they show the entities participating in an interaction, their lifelines (how
long they remained active), and their interactions as time proceeds. An interaction can be a method
invocation to an object (in an object-oriented context), a procedure call, a generated event, or a message
exchanged.

4
Scenarios are used to analyze the dynamic behavior of component-based applications. We adopt Sequence
Diagrams as means of documenting a scenario for a component-based application. We also use the word
interaction as a general term to refer to possible types of interaction and collaboration between components.
The notation of sequence diagrams between components is similar to those used for Message Sequence
Charts (MSC) or Interaction Diagrams in UML [UML99] with some generalization of the terms. A
component sequence diagram is a two-dimension graph: the vertical axe represents time, and the horizontal
axe represents different components. Time proceeds down the vertical axe. The time axe can be used as a
metric for time measurement. There is no significance to the horizontal ordering of components. A vertical
dotted line shows the lifeline of a component, i.e. its existence in the scenario, while the actual execution
periods of a component is shown by a vertical rectangle starting and ending at the start and end point of
execution of a component. Figure 1 shows an interaction diagram between three components C1, C2, and
C3.
Figure 1 An example of component sequence diagram
Using these sequence diagrams, we are able to collect statistics required for CDG graphs such as average
execution time of a component in a scenario, average execution time of a scenario, and possible interactions
among components as discussed later.
Scenarios are also related to the concepts of operations and run-types used for operational
profiles[Musa+96]. A scenario with specified input variables are similar to an operation run-type. A generic
scenario, with less details about specific input values but for specific input domain, is similar to an operation
with several run-types. Finally, a profile of the execution probability of scenarios is similar to operation
profiles. Operation profiles have long been used to guide testing, development, and performance analysis by
identifying frequently executed operations. Here, we use scenarios to derive a probabilistic model for the
purpose of reliability analysis of component-based systems. The frequency of scenario and component
executions are incorporated in one model, CDG, on which we conduct reliability analysis.
C1 C2 C3
Time

5
3 Component Dependency Graphs (CDGs)
Staring with the basic notion of control flow graphs, we develop a probabilistic model called component
dependency graph. Control flow graphs are the classical method of revealing the structure, decision points,
and branches in program code [Pressman97]. A flow graph is a directed graph that consists of a set of nodes
and directed edges G=<N,E>. Each node represents one or more program statements. The total number of
nodes is the size of the set (N), and a maximum of a NxN directed edges exist in the graph. Each edge
represents the transfer of execution control from source to destination. Each edge is an ordered-pair <n1,n2>.
Depending on a decision taken at a certain node, the next execution is one of its children.
We adapt the control flow graph principles to component-based applications to represent the dependency
between components and possible execution paths. We call this graph "Component Dependency Graph",
CDG. In this section we define the graph, and in the following section we describe how to calculate these
parameters for a component based application.
Definition 1: Component Dependency Graph "CDG"
A component dependency graph is defined by CDG= <N,E,s,t>, where:
<N,E> is a directed graph,
s is the start node, t is a termination node
N is a set of nodes in the graph, N={n}, and
E is set of edges in the graph, E={e}.
Definition 2: A Node "n"
A node n models a component and is defined by the tuple < Ci, RCi, AEci > where:
Ci is the component name,
RCi is the component reliability, and
AEci is its average execution time of he component Ci
Definition 3 : Component Reliability "RCi"
It is the probability that the component Ci will execute correctly (fault free) during its course of execution.
Definition 4: Average Execution Time of a Component "AEci"
It is the average execution time of a component Ci. The execution time of a component varies according to
the type of service it provides and the scenario that activates this service.

6
Definition 5: A Directed Edge "e"
A directed edge e models the execution path from one component to another and is defined by the tuple
<Tij,RTij,PTij> where:
Tij is the transition name from node ni to nj and denoted <ni,nj>
RTij is the transition reliability, and
PTi is the transition probability.
Definition 6: Transition Reliability "RTij"
It is the probability that data and information sent from component Ci to component Cj will be delivered
error-free. This probability includes possible interface errors and possible channel delivery errors, as
discussed in Section 4.1.3
Definition 7: Transition Probability PTij
It is the probability that Cj will execute next given that Ci is currently executing.
Thus, a CDG is defined as follows:
CDG = <N,E,s,t>N = {n}, E ={e}, s and t are the start and termination nodesn = < Ci, RCi, AEci >e = <Tij, RTij, PTij>Tij = <ni,nj>
Figure 2 shows a CDG example consisting of four components.
Figure 2 A sample CDG
<C1,RC1=0.2, AEc1=3>
<T12,RT12=1,PT12=0.8>
<C3,RC3=0.7,AEc3=6><C2,RC2=0.4,AEc2=4>
<C4,RC4=0.8, AEc4=3>
<T13 ,RT13=1,PT13= 0.2>
<T24,RT24=1,PT24=1><T34 ,RT34=0.9,PT34=1>
s
<T43 ,RT43=1,PT43=0.7>
t
Prob. Of terminate=0.3

7
4 Scenario-based Re liability Estimation (SBRE)
The proposed technique to estimate the reliability of component-based application has three steps:
1. Estimation of the parameters used in reliability model(Section 4.1),
2. Construction of the component dependency graph (Section 4.2)
3. Applying the algorithm for reliability senestivity analysis(Section 4.3).
4.1 Parameters Estimation
����� 3UREDELOLW\ RI D 6FHQDULR �36L�
The dynamic behavior of a component-based application can be specified using set of scenarios
characterizing the application behavior. Each scenario has a certain probability of execution depending on
the nature of the application. The probability of a scenario is the execution frequency of that scenario with
respect to all other scenarios and is denoted as PSi. The execution probabilities should sum to unity:
where S: is the total number of scenarios in the analysis.
It is usually difficult to exhaustively document all possible scenarios for a certain application usage. In such
cases, to estimate PSi, the concepts of operational profile and equivalence partitioning [Musa+87] could be
used to specify scenario categories. The probability of execution of a scenario category can be estimated
based on the frequency its occurrence as a fraction of the total set of scenario categories. The estimated
parameter PSi will be used to estimate the probability of transitions and average execution time of
components.
����� &RPSRQHQW 5HOLDELOLW\ �5&L�
Several techniques have been proposed to estimate the reliability of software component. In this paper, we
assume that the reliability of individual components has been calculated (numerical formula) or modeled
(mathematical formula). We refer to this estimate as RCi. Several outlines for component reliability
estimation include fault injection techniques, testing, and retrospective analysis. In case of commercial off
the shelf components (COTS), other factors can be included, such as vendor's credibility, vendor-side and
customer-side testing, and the age of the component. Assessing the reliability of individual components is
outside the scope of this paper, however, we identify some techniques to estimate components reliability in
the sequel.
McDermid [McDermid98] proposed the following techniques to measure and improve the reliability of
software components:
x Retrospective Analysis or Certification using the history of component operation and failures.
1PS1
i ¦
S
iEq 1

8
x Wrapping acts as a shelter to buffer inputs and outputs from a component and hence can mask
undesirable outputs. Adding a software wrapper around a component may limit the functionality without
modifying the component itself. Wrappers can operate on input data (input wrappers), output data
(output wrappers), or both.
x Black box Testing against the specification of the component and the requirements of the application.
x Architecture Choices, choosing the architecture such that the application functionality doesn't heavily
rely on a particular component but is achieved by several ones.
Voas [Voas98] discussed some problems in estimating reliability of components. Voas examined a method
to determine the quality of Off-the-Shelf components using black box analysis. His certification technique is
based on black box testing and fault injection methods[Voas+98].
Everett [Everett99] identified some guideline in estimating the component reliability by identifying the
component's static and dynamic properties and characterizing how usage stresses each component. Towards
a discipline of trusted commercial software components with high reliability, Meyer et.al. [Meyer+98]
discussed general principles for establishing trust in components, which include design by contract, formal
verification, extensive testing, and component-based software metrics.
����� 7UDQVLWLRQ 5HOLDELOLW\ �57LM�
The reliability of a transition from one component execution to another is the probability that the
information is correctly delivered from the source component to the destination in the course of execution.
There are two constituents for evaluating transition reliability: Component Interfaces Reliability and Link
Reliabilities. Thus, RTij = Interface Reliability X Link Reliability
In this paper, we don't describe how to calculate transition reliabilities, however we are more concerned with
incorporating them as first class element in the model such that their effect on application reliability could be
analyzed. In the following we briefly describe factors affecting interface and link reliabilities.
1) Component Interface Reliability
This is defined as the probability that two interacting components will have matching interfaces. A
component interface defines how it interacts with other components. Interfaces describe the import and
export relationship with other components. A set of exported interfaces specifies the functionality that this
component can provide. A set of imported interfaces specifies the functionalities that this component
requires from other external components which is needed in the work progress of the component execution.
A mismatch in an interface can be as a result of:
x Incompatibility in the structure and sequence of messages exchanged between components.
x Timing issues as related to requests coming in/from a component

9
x Incompatibilities in data format and types and incompatibilities in message protocols (sync/ Async/
Publish and Read / ,… )
x Incompatibility in a component role in an interaction. The role should define which component is the
client or server. Client/Server relationship is defined by the import/export interface specifications.
Formal specification of component interfaces is an approach to improve their reliability. Interface reliability
is a topic of several literatures, for example [Delamaro+96, Voas+96]. Here, we are more concerned with
how to incorporate them in reliability analysis of component-based applications.
2) Link Reliability
Reliability of a link (also refered to as a delivery channel) is the probability of correct delivery of messages
exchanged between distributed components. This factor is essential in the case of components distribution
across a network. Heimdahl et.al. [Heimdahl+98] showed that almost 35% of errors were related to interface
mismatches between components and their underlying environment which includes communication
channels. In addition to component interface mismatches, distribution across a network adds more factors
affecting link reliabilities. A message exchanged between component in a distributed environment is
exposed to operating system calls, the underlying hardware technology, communication subsystems, and the
physical network itself. This adds new sources of failures and risks as related to (for example):
x Failure to detect and respond to operating system and communication event
x Physical network problems such as delays, congestion, physical failures, and liveness constraint on a
communication link.
x Incompatibilities in timing and protocols between sending and receiving sides.
Studying factors affecting link reliabilities is outside the scope of this paper, however, we incorporate this
parameter in the reliability model and in the reliability analysis algorithm.
����� $YHUDJH ([HFXWLRQ 7LPH RI WKH DSSOLFDWLRQ �$(DSSO�
The average execution time of the application (AEappl) is given by:
where:
PSk : is the probability of execution of scenario Sk ,
S: Total number of scenarios,
Time(Sk) is the average execution time of scenario Sk
����� $YHUDJH ([HFXWLRQ 7LPH RI D &RPSRQHQW �$(FL�
The parameter AEci is the average execution time in which a component Ci is active and running. It is
calculated using the equation:
¦
u S
1k
kkappl )Time(SPSAE Eq 2
10
where:
PSk : is the probability of execution of scenario Sk ,
S: Total number of scenarios,
Time(Ci) is the execution time of Ci , measured as the sum of its active time along its lifeline (verticalrectangles as represented in the scenario diagram), and
Ci is said to belong to Sk if it participates in the execution of scenario Sk
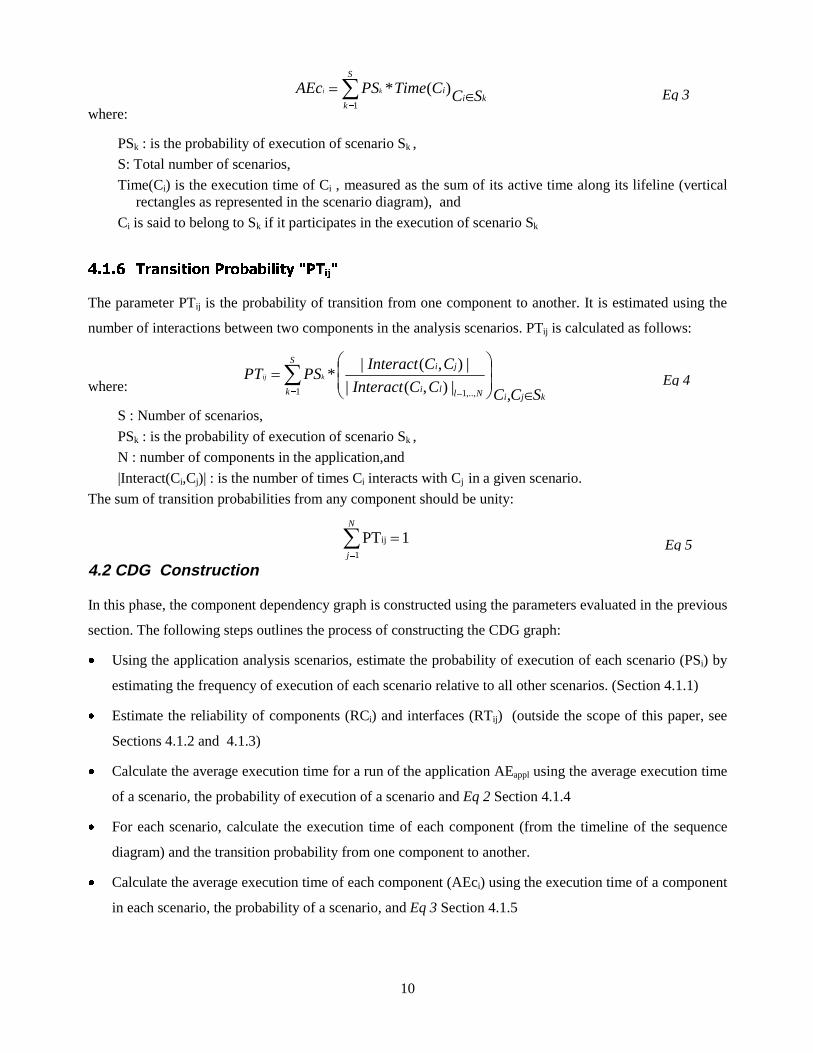
����� 7UDQVLWLRQ 3UREDELOLW\ �37LM�
The parameter PTij is the probability of transition from one component to another. It is estimated using the
number of interactions between two components in the analysis scenarios. PTij is calculated as follows:
where:
S : Number of scenarios,
PSk : is the probability of execution of scenario Sk ,
N : number of components in the application,and
|Interact(Ci,Cj)| : is the number of times Ci interacts with Cj in a given scenario.
The sum of transition probabilities from any component should be unity:
4.2 CDG Construction
In this phase, the component dependency graph is constructed using the parameters evaluated in the previous
section. The following steps outlines the process of constructing the CDG graph:
x Using the application analysis scenarios, estimate the probability of execution of each scenario (PSi) by
estimating the frequency of execution of each scenario relative to all other scenarios. (Section 4.1.1)
x Estimate the reliability of components (RCi) and interfaces (RTij) (outside the scope of this paper, see
Sections 4.1.2 and 4.1.3)
x Calculate the average execution time for a run of the application AEappl using the average execution time
of a scenario, the probability of execution of a scenario and Eq 2 Section 4.1.4
x For each scenario, calculate the execution time of each component (from the timeline of the sequence
diagram) and the transition probability from one component to another.
x Calculate the average execution time of each component (AEci) using the execution time of a component
in each scenario, the probability of a scenario, and Eq 3 Section 4.1.5
kjili Nl
jiS
k SCCCCInteract
CCInteractPSPT kij
�¸¸
¹
·
¨¨
©
§
¦,|),(|
|),(|*
,..,11Eq 4
1PT1
ij ¦
N
jEq 5
kii
S
kSCCTimePSAEc ki � ¦
)(*1
Eq 3

11
x Calculate the transition probability from one component to another for all scenarios (PTij) using the
probability of a scenario, the transition probabilities between components in each scenario, and Eq 4
Section 4.1.6).
x Construct the CDG according to the definition in Section 3
4.3 Reliability Analysis
After constructing the model (the component-dependency graph), we can analyze the reliability of the
application as function of reliability of components and transitions as follows.
AlgorithmProcedure SBREParameters
consumes CDG, AEappl,produces Rappl
Initialization:Rappl = 0, Time = 0, Rtemp = 1
Algorithmpush tuple <C1, RC1, AEc1 >, Time, Rtemp
while Stack not EMPTY dopop < Ci, RCi , AEci >, Time, Rtemp
if Time > AEappl or Ci = t (terminating node)Rappl += Rtemp (OR path)
else� < Cj ,RCj , AEcj > � children(Ci)push (<Cj, RCj ,AEcj>, Time += AEci , Rtemp = Rtemp*RCi*RTij *PTij )
endend while
The algorithm simply expands all branches of the CDG starting from the start node. The width expansions of
the tree represent logical "OR" paths and are hence translated to summation of reliabilities. The depth of
each path represents the consecutive execution of components, the logical "AND" and is hence translated to
multiplication of reliabilities. The "AND" paths take into consideration the interface and link reliabilities
(RTij) between components. The depth expansion of a path terminates when the summation of execution
time of that thread sums to the average execution time of the application or when the next node is a
terminating node.
Due to the probabilistic nature of the dependency graph, several loops might exist. In calculating the
reliability of the application using the SBRE algorithm outlined above, the algorithm may loop between two
or more components. However, these loops don't lead to a deadlock by virtue of using the average execution
time of the application to terminate the depth traversal of the graph. Therefore, deadlocks are not possible in
executing the algorithm and a termination of the algorithm execution is evident.

12
The reliability of an "AND" path is neither too pessimistic nor too optimistic. This is because the path is
either truncated with a termination node, a natural end of an application execution, or with an execution time
limit which is the average execution time of a scenario.
The algorithm assumes that each component is wrapped such that failures in one component do not
propagate[Khoshgoftaar+99] to another component in the "AND" path and hence independent assumption
could be valid.
5 Case Study
In this section we illustrate the applicability of the proposed technique to a simple component-based
application. The application was developed for simulation of waiting queues1 in which we deal with
customers lining up at checkout counters at supermarkets, immigration posts, or self-serve car wash. The
application is built by composing software components. Those components were developed as a part of an
educational experiment in software reuse at West Virginia University [Yacoub+99]. In this experiment, a
domain specific library of components was developed for the purpose of producing applications that
simulate the behavior of waiting queues. Domain engineering activities were conducted to develop reusable
software components. The domain was defined by a set of software components, a generic architecture for
communicating components, and a set of possible execution scenarios.
For the purpose of this paper, we limit our discussion to one application developed from those reusable
assets, the checkout counter. First, we briefly describe the system architecture and its constituting
components, then we construct the component dependency graph (CDG). Based on the application's CDG
(proposed in Section 3), we use the SBRE algorithm (proposed in Section 4) to investigate the reliability of
the application based on the reliability of its components and the reliability of components interfaces and
links.
5.1 The Architecture
Figure 3 describes the architecture of the application using the UML package diagram [UML99]. The
architecture of the application is centered around a dynamic event list as the communication vehicle of
events between cooperating components. In addition to the EventList component , the primary components
in the architecture are ArrivalGen, a QueuingFacility, a ServiceFacility, a Measurement recorder, and a
ScheduleManager. Those components are implemented in an object-oriented (OO) language. The
communication between components (invocations) follows the form of method calls. Some of these
components could have several classes and others have just one class.
1 "Simulation of Waiting Queues" is our case study i.e. the application whose reliability is to be analyzed. This should not be confused with thesimulation technique for reliability estimation in [Gokhale+98b]

13
Figure 3 The Application Architecture
The EventList component serves as the holder of all events. The analysis identified a set of six events that
depict all scenarios necessary for the execution of the application. Events are maintained in the EventList and
are sorted in a time-ordered fashion. Each event triggers a specific execution scenario.
The ArrivalGen component was designed to use a distribution function to generate the time of arrival of the
next customer. The distribution function determines the time of the next customer arrival, in our case study
we used uniformly distributed random generator. ArrivalGen component is invoked by ScheduleManager
component to generate customer arrivals.
The QueuingFacility component consists of a set of queue categories, where each queue category contains
one or more queues. This component contains three OO classes representing the facility interface, categories,
and queues. Events that indicate an action for a queue category or a queue are delegated to the queue facility,
which delegates the action to the appropriate queue category. For our case study, we used two categories for
checkout counters, Normal and Express, and one queue for each category. The QueuingFacility component
processes the events: REORDER, ARRIVAL, and DEQUEUE
The ServiceFacility component consists of a set of server categories, where each server category contains
one or more servers. This component contains three OO classes representing the facility interface, categories
and servers. The servers are also identified by sequentially generated numbers, and each server contains the
identification number of its associated queue. Events that indicate an action for a service category or a server
are delegated to the ServiceFacility, which delegates the action to the appropriate service category. For our
case study, we used two categories, Normal and Express, and one server for each category. The
ServiceFacility component processes the event SERVE, SERVICE_COMPLETE, and CHECK_SERVER.
The Measurement component hosts the statistical information each time a customer object completes its
number of service units. This information is maintained by the Measurement component until the
ServiceFacility
QueuingFacilityScheduleManager
SERVE,SERVICE COMPLETE,CHECK SERVER
ARRIVAL,REORDERDEQUEUE
SERVICE COMPLETE,REORDER,DEQUEUE,ARRIVAL
EventListARRIVAL
Read Events
SERVECHECK SERVER
MeasurementStoreResults
Read Results
ArrivalGenerator
Generate a new event

14
completion of the simulation. At the end of the simulation, the Measurement component calculates the
averages and totals.
The ScheduleManager component serves as the main routine for the simulation. It repeatedly dispatches
events from the event list and delegates actions based on the event type. The ScheduleManager activates the
number and type of queue and server components that are specific to the application, and then repeatedly
removes the first event from the EventList and dispatches it to the appropriate component.
5.2 Scenarios
The interaction between components in the application is analyzed using six execution scenarios. Each
scenario is triggered by an event. The following summarizes the analysis scenarios (sequence diagram for all
scenarios are shown in Appendix A):
x ARRIVAL: This scenario describes the sequence of actions taken by components to process the arrival
of a new customer to the queuing facility.
x REORDER: This scenario is executed when it is required to reorder the customer in the queue category
when a queue is empty and could carry customers from a busy queue.
x DEQUEUE: This scenario is executed when a server is ready to serve a customer from its waiting queue.
x SERVE: This scenario is executed when a customer is de-queued and needs to be served.
x SERVICE_COMPLETE: This scenario is executed whenever a customer finishes its service at a station.
x CHECK_SERVER: This scenario is executed to check whether a server is available to serve a customer.
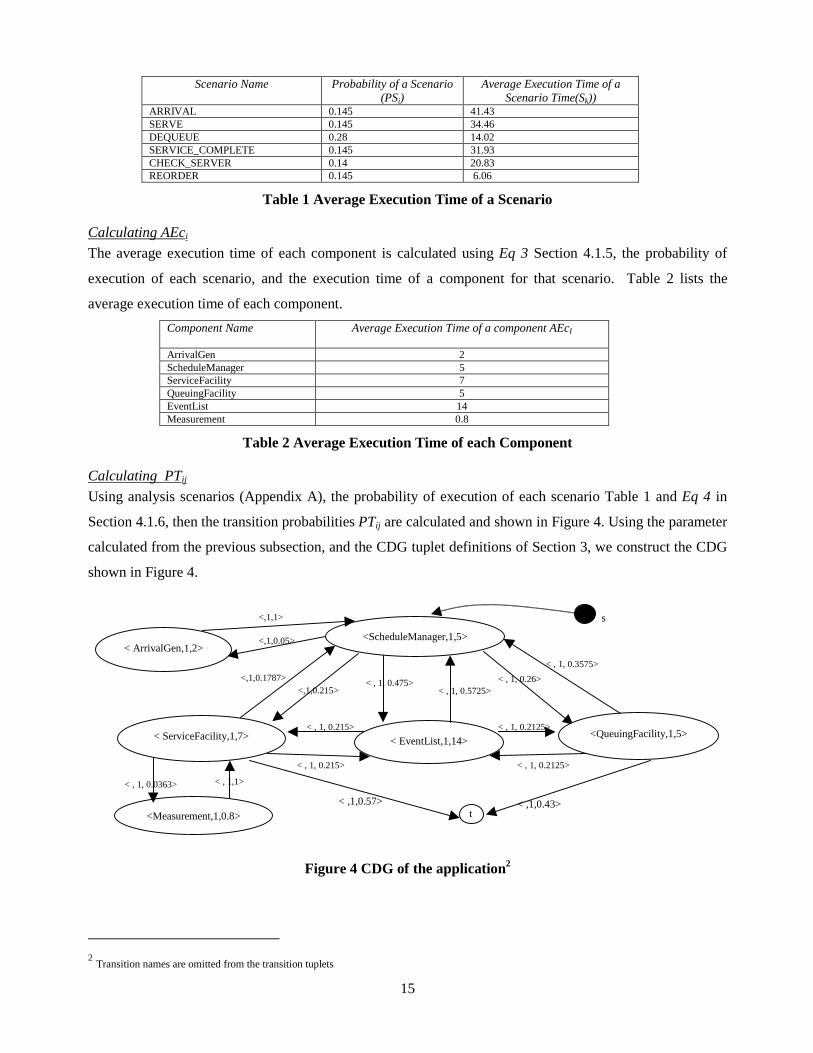
5.3 The Component Dependency Graph
Calculating PSi
Based on the execution profile of the application, the probabilities of execution of the six scenarios are lists
in table (1). These probabilities are calculated based on the several execution runs for the application and
averaging the number of execution of each scenario.
Calculating RCi and RTij
We will not estimate the reliability of the components and transitions, however we will use these two
parameters to discuss the sensitivity of the application reliability to the variations in the reliability of
components and transitions as shown later.
Calculating AEappl
The average execution time of the application (based on the execution of one scenario) is calculated using
the average execution time of each scenario and the probability of execution of a scenario. Using Eq 2 in
Section 4.1.4,then, AEappl = 23.5
15
Scenario Name Probability of a Scenario(PSi)
Average Execution Time of aScenario Time(Sk))
ARRIVAL 0.145 41.43SERVE 0.145 34.46DEQUEUE 0.28 14.02SERVICE_COMPLETE 0.145 31.93CHECK_SERVER 0.14 20.83REORDER 0.145 6.06
Table 1 Average Execution Time of a Scenario
Calculating AEciThe average execution time of each component is calculated using Eq 3 Section 4.1.5, the probability of
execution of each scenario, and the execution time of a component for that scenario. Table 2 lists the
average execution time of each component.
Component Name Average Execution Time of a component AEcI
ArrivalGen 2ScheduleManager 5ServiceFacility 7QueuingFacility 5EventList 14Measurement 0.8
Table 2 Average Execution Time of each Component
Calculating PTijUsing analysis scenarios (Appendix A), the probability of execution of each scenario Table 1 and Eq 4 in
Section 4.1.6, then the transition probabilities PTij are calculated and shown in Figure 4. Using the parameter
calculated from the previous subsection, and the CDG tuplet definitions of Section 3, we construct the CDG
shown in Figure 4.
Figure 4 CDG of the application2
2 Transition names are omitted from the transition tuplets
<ScheduleManager,1,5>
< EventList,1,14>< ServiceFacility,1,7>
<,1,0.215>< , 1, 0.475>
< ArrivalGen,1,2>
<QueuingFacility,1,5>
<Measurement,1,0.8>
<,1,0.1787>
<,1,0.05>
<,1,1>
< , 1, 0.5725>< , 1, 0.26>
< , 1, 0.3575>
< , 1, 0.2125>
< , 1, 0.2125>< , 1, 0.215>
< , 1, 0.215>
< , 1, 0.0363> < , 1,1>
t< ,1,0.43>< ,1,0.57>
s

16
0
0.2
0.4
0.6
0.8
1
1.2
1.0 0.9 0.8 0.7 0.6 0.5 0.4 0.3 0.2 0.1 0.0
Reliability of a Component
Rel
iabi
lity
of th
e A
pplic
atio
n
R(Measurement)
R(ArrivalGen)
R(ServiceFacility)
R(QueueFacility)
R(EventList)
R(ScheduleManager)
5.4 Applying the SBRE Algorithm
We have implemented the SBRE algorithm defined in Section 4, and applied it to the CDG of the application
(Figure 4). Our objective is to analyze the sensitivity of the application reliability as a function of the
components reliabilities and transitions reliabilities (interfaces and links) for a period of average scenario
execution time. We also discuss how different usage scenarios affect the application reliability.
����� 5HOLDELOLW\ RI WKH DSSOLFDWLRQ DV IXQFWLRQ RI &RPSRQHQW 5HOLDELOLW\
Using the SBRE algorithm we are able to investigate the variation in the reliability of the application as a
function of the reliability of individual components. The graph in Figure 5 shows the reliability of the
application as function of the reliability of one component at a time while the reliability of other components
are fixed (equal to 1 for the sake of comparison).
Figure 5 Application Reliability as function of Component Reliabilities (one at a time)
Table (3) is the tabular representation of the graph in Figure 5. The first column is the reliability values of a
component. Each of the following columns shows the reliability of the application when reliability of the
component between brackets varies according to the first column.
ComponentReliability
Rappl
(Measurement)Rappl
(ArrivalGen)Rappl
(ServiceFacility)Rappl
(QueuingFacility)Rappl
(EventList)Rappl
(ScheduleManager)0.9 0.999 0.993 0.956 0.951 0.917 0.8500.8 0.998 0.985 0.913 0.903 0.838 0.7120.7 0.997 0.978 0.870 0.855 0.761 0.5850.6 0.996 0.971 0.827 0.808 0.687 0.4700.5 0.995 0.964 0.785 0.762 0.617 0.3650.4 0.994 0.957 0.743 0.717 0.549 0.2710.3 0.993 0.950 0.702 0.672 0.485 0.1880.2 0.993 0.943 0.661 0.629 0.423 0.1150.1 0.992 0.937 0.620 0.586 0.365 0.053
Table 3 Tabular Representation of Figure 5

17
����� 5HOLDELOLW\ RI WKH DSSOLFDWLRQ DV IXQFWLRQ RI 7UDQVLWLRQ 5HOLDELOLW\
Using the SBRE algorithm we are able to investigate the variation in the reliability of the application as a
function of the reliability of the transition (interfaces and links) between components. The following graph
shows the reliability of the application as function of the reliability of some transitions one at a time while
the reliability of other components and transitions are fixed (equal 1 for the sake of comparison).
Figure 6 Application Reliability as function of transition reliabilities (one at a time)
Table (4) is the tabular representation of the graph in Figure 6. The first column represents transition
reliabilities. Each of the following columns shows the reliability of the application when reliability of the
transition between the two components between brackets varies according to the first column.
TransitionReliability
Rappl
(Measurement,ServiceFacility)
Rappl
(ServiceFacility,ScheduleManager)
Rappl
(EventList,ServiceFacility)
Rappl
(ScheduleManager,ServiceFacility)
Rappl
(EventList,ScheduleManager)
Rappl
(ScheduleManager,EventList)
0.9 0.999 0.992 0.982 0.967 0.953 0.9280.8 0.998 0.984 0.964 0.934 0.907 0.8580.7 0.997 0.977 0.946 0.901 0.862 0.7910.6 0.996 0.969 0.928 0.868 0.819 0.7280.5 0.995 0.961 0.910 0.836 0.778 0.6670.4 0.994 0.953 0.891 0.803 0.738 0.6090.3 0.993 0.946 0.873 0.771 0.699 0.5540.2 0.993 0.938 0.855 0.740 0.662 0.5020.1 0.992 0.931 0.837 0.708 0.626 0.453
Table 4 Tabular Representation of Figure 6
0
0.2
0.4
0.6
0.8
1
1.2
10.
900
0.80
00.
700
0.60
00.
500
0.40
00.
300
0.20
00.
100
0.00
0
Transition Reliability
App
licat
ion
Rel
iabi
lity
Measurement-ServiceFacility
ServiceFacility-ScheduleManager
EventList-ServiceFacility
ScheduleManager-ServiceFacility
EventList-ScheduleManager
ScheduleManager-EventList

18
0.00.10.20.30.40.50.60.70.80.91.0
0.9 0.8 0.7 0.6 0.5 0.4 0.3 0.2 0.1 0.0
Reliability of EventList
Rel
iabi
lity
of th
e A
pplic
atio
n
Profile1
Profile2
Profile3
Profile4
����� 5HOLDELOLW\ RI WKH DSSOLFDWLRQ DV IXQFWLRQ RI WKH 6FHQDULR 3URILOH
Software components are developed as reusable assets for multiple usage in applications development. Each
application may use the components in a similar or different operational environment. The disparity in the
manner the application uses a component has a substantial effect on the sensitivity of the application
reliability to changes in the reliability of that component. Our model accounts for changes in component
usage using probability of each scenario (PSi in Section 4.1.1). We will refer to the set of probabilities of
scenarios for an application as a Profile. For our case study, the usage of the components will differ from
one application to another, e.g supermarket, immigration posts, car wash service, ..etc. and is also function
of the inter-arrival time of customer and the limits on maximum service time requested. For illustration
purposes, we will consider four cases only. These cases were generated by varying the maximum requested
service time and the maximum limit on the period between customers inter-arrival time. The Profiles for the
four cases is shown in Table 5.
ARRIVAL SERVE DEQUEUE SERVICE_COMPLETE CHECK_SERVER REORDER
Profile1 0.950 0.011 0.011 0.011 0.006 0.011
Profile2 0.704 0.073 0.075 0.072 0.003 0.073
Profile3 0.553 0.107 0.115 0.107 0.011 0.107
Profile4 0.145 0.145 0.28 0.145 0.14 0.145
Table 5 Probabilities of each scenario for four different usage profiles
We can analyze the reliability of the application as function of the reliability of each component for different
usage (Profiles). We have selected the three components EventList, QueueFacility and ServiceFacility. The
reliability of the application as function of the reliability of each of those component is plotted in Figure 7.
For each graph, we have plotted the sensitivity of the application reliability to the component reliability for
the four profiles of Table 5.
Figure 7 Application reliaiblity as function of scenario profiles
0.00.10.20.30.40.50.60.70.80.91.0
0.9 0.8 0.7 0.6 0.5 0.4 0.3 0.2 0.1 0
Reliability of QueueFacility
Rel
iabi
lity
of th
e A
pplic
atio
n
Prof ile1
Prof ile2
Prof ile3
Prof ile4
0.0
0.2
0.4
0.6
0.8
1.0
1.2
0.9 0.8 0.7 0.6 0.5 0.4 0.3 0.2 0.1 0
Reliability of ServiceFacility
Rel
iabi
lity
of th
e A
pplic
atio
n
Profile1
Profile2
Profile3
Profile4
(a) (b) (c)

19
5.5 Results
x From Figure 5, the application reliability varies significantly with the variation in the reliability of the
components ScheduleManager and EventList. As the reliability of those component decreases the
application reliability dramatically decreases. This is due to the fact that those two components are the
heart of the simulation application and therefore any faults in those components will easily propagate
and affect the correct operation of the application.
x From Figure 5, the reliability of the application doesn't vary significantly with the variation in the
reliability of the Measurement component. This is due to the nature of that component which is
recording of simulation results and is only invoked few times in recording and retrieving statistics.
x From Figure 6, the transition reliability between components can significantly affect the reliability of the
application. For example, the interface and/or link between the ScheduleManager and EventList
components can significantly deteriorate the reliability of the overall application if there are mismatches
or error in data flow between those components.
x From Figure 7, the senestivity of the application reliability to changes in the component reliabilities
varies according to usage of components. For example, the application reliability becomes more
sensitive to the reliability of the components EventList and QueueFacility for Profile1 than the case for
Profiles2, Profile3, and Profile4 (Figure 7-a, 7-b). On the contrary, the application reliability becomes
less sensitive to the reliability of the component ServiceFacility for Profile1 than it is for Profiles2,
Profile3, and Profile4 (Figure 7-c)
6 Related Work
Several reliability models and estimation techniques have been proposed to assess the reliability of software-
intensive systems. In the sequel we are concerned with those addressing component-based applications3.
Gokhale et.al. [Gokhale+98b] discussed the flexibility offered by discrete-event simulation to analyze
component-based applications. Their approach relies on random generation of faults in components using a
programmatic procedure that returns the inter-failure arrival time of a given component. Total number of
failures is calculated for the application under simulation and its reliability is estimated. This approach
assumes the existence of control flow graph (component reliability and transitions) of a program, and did not
specify the basis for calculating transition probabilities. The simulation approach assumes failure and repair
rates for components and uses them to generate failures in executing the application. It also assumes constant
execution time per component interaction and ignores failures in component interface and links (transition
3 Discussion on the applicability of traditional reliability estimation techniques to component-based software and their limitations is beyond the scope
of this paper.

20
reliabilities). Our proposed technique is analytical, not simulation based. We develop a probabilistic model
(component dependency graphs) using execution scenarios. We use scenarios to drive the average execution
times of applications and components. Our CDG also incorporates execution times, interface and link
reliabilities. Our implementation of SBRE algorithm takes a CDG as an input and doesnot require simulation
to study the effect of component reliability growth.
The work in [Sanyal+97] introduces the usage of Program Dependency Graphs (PDG) and Fault Propagation
Analysis (PGA) [Shah+97, Voas97] for analytical reliability estimation of component based-applications.
Their approach is a code-based (reverse-engineering) approach, in which dependency graphs are generated
from source code; this is not usually available for components and component-based systems. The authors
did not emphasize on how to evaluate the parameters used in their graph (the event and branch probabilities).
Their approach is applicable at lower development level, here we propose an approach applicable at higher
development level. Their approach also suggests a random mechanism for solving deadlocks due to loops,
our algorithm doesn't suffer from loop problems.
The approach in [Krishnamurthy+97] assesses the reliability of component-based applications using
reliability of their components, they proposed a technique called Component Based Reliability Estimation
(CBRE). Their approach is based on test information and test cases. For each test case, the execution path is
identified, the path reliability is calculated using the reliability of the components assuming a series
connection (using the independent failure assumption and perfect interfaces between components). The
reliability of the application is the average estimate of the reliability of each test path. This approach does
not consider component interface-errors although they are considerable factors in reliability analysis of
component based software. Estimating reliability based on test cases is not the same as using analysis
scenarios. Test cases don't take into consideration the frequency of interaction between components. Our
approach doesn't use test cases. Instead, we use analysis scenarios to derive a probabilistic dependency graph
which is used to analyze the sensitivity of application reliability to component reliabilities, transitions
reliabilities, and usage scenarios. We take into account the component interface reliabilities and link
reliabilities to incorporate the case of distributed components.
To apply models used in hardware reliability analysis to component-based software, the research group at
university of Toronto [Mason+98, Woit+98] proposed following certain discipline in software component
development and a set of design and interaction rules to minimize the interaction and dependability issues
between component. The proposed rules would facilitate modeling the component based system in Markov
chains and hence can apply the same reliability analysis techniques as in hardware cases. However, such
disciplines are difficult to impose and practice by the component developer and vendors.
Most of these approaches can be considered as path-based approach to reliability estimation of component
based software. The work in [Gokhale+98] proposed a solution to dependencies among components in path-
based techniques, which usually gives a pessimistic evaluation of the system reliability. The solution takes

21
into account time-dependent representation of the reliability of a component and a fixed execution time per
interaction. Our approach solves the dependency in a more simplistic way using the average execution time
of the application, and that of a component, based on analysis scenarios.
Everett [Everett99] described an approach to analyzing software reliability using component analysis. The
approach uses the Extended Execution Time (EET) reliability growth model and uses test cases to arrive at a
composite reliability growth model for the testing period. Our approach shares the same benefits of early
reliability analysis of component-based applications prior to detailed implementation. Our CDG model and
SBRE algorithm integrates into the "superimpose component reliability" step in Everett framework. Our
approach is scenario-based and incorporate interface and link reliabilities which were not considered by
Everett.
7 Conclusion
This paper presents a new technique to analyze the reliability of component-based applications. The
algorithm is named Scenario-Based Reliability Estimation (SBRE). The technique is suitable for applications
whose analysis is based on valid scenarios with timed sequence diagrams and the execution profile of those
scenarios are available. Component Dependency Graphs (CDG) are derived to establish a probabilistic
model on which the reliability estimation technique is based. A stack-based algorithm is discussed to analyze
the reliability of component-based applications. A simple case study for "simulation of waiting queues" is
used to illustrate the applicability of the approach. This case study, being simple enough for illustration
purposes, clearly shows that SBRE algorithm can be used to discuss the sensitivity of the application
reliability to component reliabilities, interface reliabilities, and usage scenarios. Results of applying the
algorithm can clearly identify critical component and critical component interfaces and links that would
require intensive testing and validation. We can summarize the benefits and limitations of the approach as
follows:
Benefits
x The approach is based on scenarios, execution times, and components usage. A fault in a frequently
executed component would easily manifest itself into a failure. Using our CDG model, we incorporate
the effect of frequently executed components, interfaces, and links and hence we can dedicate more
testing and development effort to those critical artifacts.
x The algorithm is applicable early at the development phase of a component-based software because they
are based in scenarios between reusable components.
x The SBRE algorithm is automatable. We have implemented the algorithm and used the implementation
in our case study. Automating the calculation of the parameters from a sequence diagrams is a
straightforward task.

22
x Using scenarios to derive the model allows us to incorporate differences in the usage of a component in
reliability analysis of component-based software. Applications using the same component, but with
different usage scenarios, will have different sensitivity to the reliability of that particular component.
Limitations
x The nature of the application: The approach is applicable to component-based application which are
analyzed using execution scenarios.
x The algorithm does not consider failure dependencies between components.
x The algorithm is applicable for sensitivity analysis of application reliability to component and interface
reliability in a given period of execution, a scenario average execution time. Currently, the algorithm
does not consider the overall application reliability growth as function of time. However, using the
reliability growth of individual components, we can periodically conduct sensitivity analysis for the
application reliability.
Future work
x Extend the applicability the algorithm and the CDG model to complex systems which are hierarchical in
nature. The extension will incorporate subsystem concepts and hence the CDG will have to be extended
to include root and leaf nodes.
x Extend the model to consider the effect of intra-component dependency.
x Extend the model to account for the criticality and complexity of a component or a scenario. Some
scenarios could be more critical than others but they are seldomely executed. The model should be able
to consider the reliability sensitivity to those particular scenarios.
8 References
[Delamaro+96] Delamaro, M., J. Maldonado, and A. Mathur, "Integration Testing using InterfaceMutations", Proc. of Seventh International Symposium on Software Reliability Engineering, ISSRE'96, IEEEComputer Society Press, New York, Oct 30-Nov 2, 1996, pp112-121.
[Everett99] Everett, W., "Software Component Reliability Analysis", Proc. of the 1999 IEEE Symposium onApplication-Specific Systems and Software Engineering & Technology, ASSET'99, Richardson, Texas,March 24-27, 1999, pp204-211
[Gokhale+98] Gokhale, S., and K. Trivedi, "Dependency Characterization in Path-Based Approaches toArchitecture-Based Software Reliability Prediction" Proc. of the 1998 IEEE Workshop on ApplicationSpecific Software Engineering and Technology, ASSET'98, Richardson, Texas, March 26-28, 1998, pp86-89
[Gokhale+98b] Gokhale, S., M. Lyu, and K. Trivedi, "Reliability Simulation of Component-Based SoftwareSystems", in Proc. of the ninth International Symposium on Software Reliability Engineering, ISSRE'98,Paderborn, Germany, Nov. 1998, pp192-201
[Heimdahl+98] Heimdahl, M., J. Thompson, and B. Czerny "Specification and Analysis of IntercomponentCommunication" IEEE Computer Magazine, April 1998, pp47-54
[Horgan+96] Horgan, J., and A. Mathur. "Software Testing and Reliability", in Handbook of SoftwareReliability Engineering, Michael R. Lye (edt.), McGraw-Hill, New York, NY, 1996, Chapter 13, pp531-566

23
[Khoshgoftaar+99] Khoshgoftaar, T., E. Allen, W. Tang, C. Michael, J. Voas, "Identifying Modules WhichDo Not Propagate Errors" Proc. of the 1999 IEEE Symposium on Application-Specific Systems and SoftwareEngineering & Technology, ASSET'99, Richardson, Texas, March 24-27, 1999, pp185-193
[Krishnamurthy+97] Krishnamurthy S., and A. P. Mathur, "On the Estimation of Reliability of a SoftwareSystem using Reliabilities of its Components", Proc. of Eighth International Symposium on SoftwareReliability Engineering, ISSRE'97, Albuquerque, New Mexico, Nov. 1997, pp146-155.
[Lyu96] Handbook of Software Reliability Engineering, M.R. Lyu Editor, McGraw-Hill, New York, NY,1996
[Mason+98] Mason, D., and D. Woit, "Problems with Software Reliability Composition", in the ninthInternational Symposium on Software Reliability Engineering, ISSRE'98, Fast Abstracts, Paderborn,Germany, Nov. 1998, pp41-42
[McDermid98] McDermid, J., "The Cost of COTS", IEEE Computer Magazine, June 1998, pp46-52.
[Meyer+98] Meyer, B., C. Mingins, and H. Schmidt, "Building Trusted Components to the Industry", IEEEComputer Magazine, May 1998, pp104-105
[Musa+87] Musa, J., A. Iannino, and K. Okumoto, "Software Reliability: Measurement, Prediction andApplication", McGraw Hill, New York, 1987, pp230
[Musa+96] Musa, J., G. Fuoco, N. Irving, D. Kropfl, and B. Julin, "The Operational Profile", in theHandbook of Software Reliability Engineering, Michael R. Lye (edt.), McGraw-Hill, New York, NY, 1996,Chapter 5, pp167-216
[Musa97] Musa, J., "Applying Operational Profile in Testing", in Proc. of the Tenth International SoftwareQuality Week, San Francisco, U.S.A., May 1997
[Pressman97] Pressman, R. "Software Engineering: A Practitioner's Approach" McGraw Hill, Inc. FourthEdition 1997, pp456
[Sanyal+97] Sanyal, S., V. Shah, and S. Bhattacharya, "Framework of a Software Reliability EngineeringTool" Proc. of the IEEE High-Assurance Systems Engineering Workshop, HASE'97, Washington DC, 1997,pp 114-119
[Shah+97] Shah V., and S. Bhattacharya, "Fault Propagation Analysis Based Variable Length CheckpointPlacement for Fault Tolerant Parallel and Distributed System", Proc. of the Twenty-First AnnualInternational Computer Software and Applications Conference, COMPSAC'97, Bethesda, Maryland, August1997
[UML99] Unified Modeling Language resource center, Rational Rose Inc.,http://www.rational.com/uml/documentation.html
[Voas+96]. Voas, J, F. Charron, and K. Miller. "Tolerant Software Interfaces: Can COTS-based Systems beTrusted Without Them?" In Proc. of the 15th Int'l. Conference on Computer Safety, Reliability, and SecuritySAFECOMP'96, Vienna, October, 1996, pp126-135
[Voas+98] Voas, J. and J. Payne "COTS Failures : Can Anything be Done?" Proc. of the 1998 IEEEWorkshop on Application Specific Software Engineering and Technology, ASSET'98, Richardson, Texas,March 26-28, 1998, pp140-144
[Voas97] Voas, J., "Error Propagation Analysis for COTS Systems" IEE Computing and ControlEngineering Journal, 8(6), Dec. 1997, pp269-272
[Voas98] J.Voas, "Certifying Off-the-Shelf Software Components", IEEE Computer June 1998, pp53-59
[Weidenhaupt+98] Weidenhaupt, K., K. Pohl, M. Jarke, and P. Haumer, "Scenarios in System Development:Current Practice", IEEE Software, March/April 1998, pp34-45
[Woit+98] Woit, D, and D. Mason, "Component Independence for Software System Reliability", in thesecond International Software Quality Week Europe 1998 QWE'98, Brussels, Belgium, 9-13 Nov. 1998
[Yacoub+99] Yacoub, S., E. Addy, and A. Mili, "A Controlled Experiment in Software Reuse", submitted toa journal, Jan, 1999

24
Appendix A: Analysis Scenarios for the Example
CHECK_SERVER ScenarioARRIVAL Scenario
SERVE Scenario
TheEventList :
EventList
ScheduleManager :
Driver
AServiceFacility : Service_
Facility
SelectedCat : Service
Category
AServer : Server
Dispatch( )
Serve(Customer&,CurrentTime,ServerID,Category)
Schedule(SERVICE_COMPLET
SelectServer
Serve(Customer&,CurrentTime,ServerID)
Serve(Customer&, Time)
SelectCategory
Schedule(REORDER)
Case:
SERVE
CalculateServiceCompleteTime
SERVICE_COMPLETE Scenario
TheEventList :EventList
ScheduleManager :Driver
A_Facility :Service_Facility
SelectedCat :ServiceCategory
SelectedServer: Server
TheMeasurements: Measurements
Dispatch( )
ServiceComplete(CurrentTime,ServerID,Category)
SelectCategory
ServiceComplete(CurrentTime,ServerID)
ServiceComplete(CurrentTime)
Schedule(DEACTIVATE )
EndService( )
Yes
Yes
Case: SERVICE_
COMPLETE
SelectServer
Is ServiceTime > Maximum
Schedule(ARRIVAL)
No AccumlateStatistics
No
Schedule(DEQUEUE )
REORDER Scenario
ScheduleManager :Driver
TheQueuingFacility: QueuingSystem
SelectedCategory :QueuingCategory
TheEventList :EventList
REORDER Dispatch( )
ReorderCategory(CategoryID)
Reorder( )
SelectCategory
Reordable?
Yes? Reorder()
Case:REORDER
TheEventList :EventList
ScheduleManager
TheQueuingFacility :QueuingSystem
AQueueCategory :QueuingCategory
AQueue :Queue
Dispatch( ) Case:DEQUEUE
Dequeue(CategoryID,FromQueueID,CurrentTime, ServerID)
SelectCategory
Dequeued = Dequeue(QueueID,Customer&)
SelectedQueue
Dequeue(Customer&)
If Dequeued = TrueSchedule(SERVE )
DEQUEUE Scenario
TheEventList : EventList
ScheduleManager:Driver
AServiceFacility : Service_Facility
AServiceCategory : ServiceCategory
Case: CHECK_SERVERDispatch( )
CheckServer(CurrentTime,QueueID,Categories)
SelectCategory
CheckServer(CurrentTime,FromQueueID)
SelectServer
If ServerBusy = False
Schedule(Dequeue )
ServiceFacility
ScheduleManager
AQueuingFacility :QueuingSystem
SelectedCat :QueuingCategory
SelectedQueue : :QueueArrivalGenerator :
ArrivalGen
TheEventList :
EventList
ProcessArrival(Customer&,CurrentTime)SelectCategory
Enqueue(Customer&, CurrenTime)
Enqueue(Customer&)
Dispatch
LengthOf( )
Yes
Case:
SelectQueue
GenerateNextArrivals(CurrentTime, Customer&)
Schedule(ARRIVAL )
If Length == 1
Schedule(CHECK_SERVER )
QueuingFacility
ServiceFacility
ServiceFacility
QueuingFacilityQueuingFacility

25
Appendix B Fault Propagation Analysis (FPA)
The probabilistic model constructed in Section 3 as a component dependency graph establishes the basis of
probabilistic study of fault propagation in an application developed from components. Fault propagation
analysis is useful in component based applications because:
x It facilitates studying the effect of a defective component on other components in the application and
possible on the output of the application as a whole.
x The study of adding, replacing, or modifying a component becomes more feasible from a single model
(the component dependency graph).
The algorithm of Section 4.3 is modified to allow fault propagation analysis from a source node to a
destination. The objective of the modified algorithm is to estimate the probability that a destination
component "D" is affected by a fault in the source component "S". The probability of fault propagation is
called Fault Propagation Probability (FPP). The algorithm is named Scenario Based Fault Propagation
Analysis (SB_FPA). The algorithm is limited to single failure propagation and no loops include the source
node.
Procedure SB_FPAParameters
consumes CDG, AEappl, S, Dproduces FPP
Initialization:FPP = 0, Time = 0, FPPtemp = (1-Rs)
Algorithmpush tuple <S, Rs, AEs >, Time, FPPtemp
while Stack not EMPTY dopop < Ci, RCi , AEci >, Time, FPPtemp
if Time < AEappl
if Cj = DFPP += FPPtemp
else� < Cj ,RCj , AEcj > � children(Ci)FPPtemp = FPPtemp*PTij *RCj*RTij ###
push (<Cj, RCj ,AEcj>, Time += AEci , FPPtemp)end
endend while
### The algorithm assumes a single fault at a time.