scandinavian tobacco group powerpoint template
TRANSCRIPT
INVESTORPRESENTATION
FULL YEAR 2018
14 MARCH 2019
AGENDA
1. Highlights
2. Fuelling the Growth
3. Our categories
4. Financials
5. Financial ambitions and guidance 2019
6. Q&A
2
This presentation contains forward-looking statements. All statements other than statements of
historical fact included in the presentation are forward-looking statements. Forward-looking statements
give Scandinavian Tobacco Groups (“STG”) current expectations and projections relating to its financial
condition, results of operations, plans, objectives, future performance and business.
No representation, warranty or undertaking, express or implied, is made as to, and no reliance should
be placed on, the fairness, accuracy, completeness or correctness of the Information or the opinions
contained therein. The presentation has not been independently verified and will not be updated.
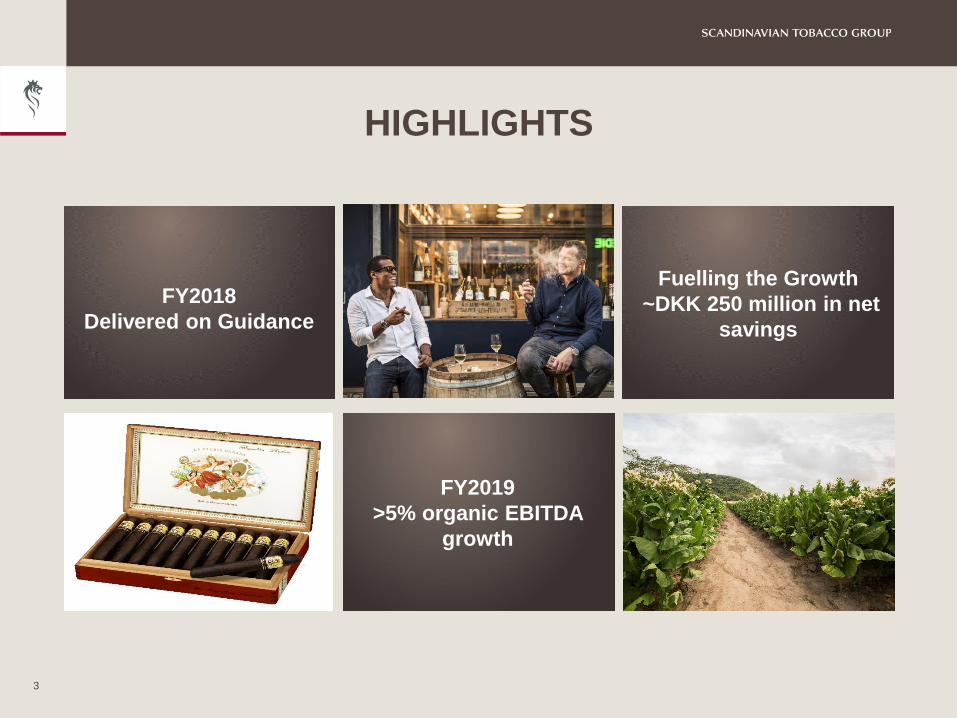
HIGHLIGHTS
3
Fuelling the Growth
~DKK 250 million in net
savings
FY2018
Delivered on Guidance
FY2019
>5% organic EBITDA
growth
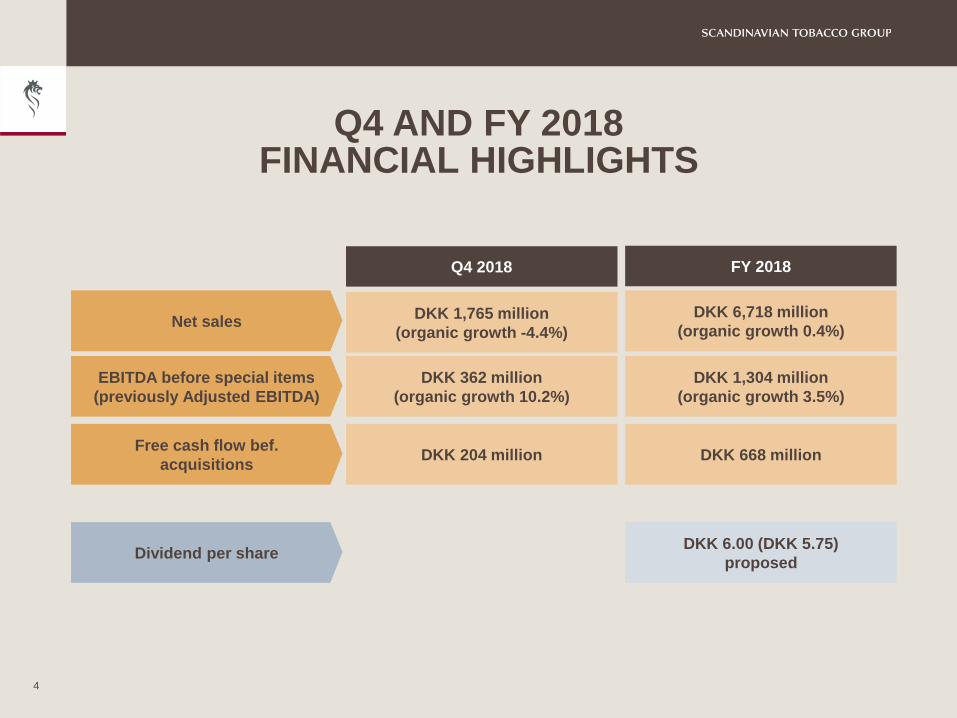
Q4 AND FY 2018FINANCIAL HIGHLIGHTS
4
Q4 2018
DKK 1,765 million
(organic growth -4.4%)
DKK 362 million
(organic growth 10.2%)
DKK 204 million
Net sales
EBITDA before special items
(previously Adjusted EBITDA)
Free cash flow bef.
acquisitions
DKK 6,718 million
(organic growth 0.4%)
FY 2018
DKK 1,304 million
(organic growth 3.5%)
DKK 668 million
Dividend per shareDKK 6.00 (DKK 5.75)
proposed
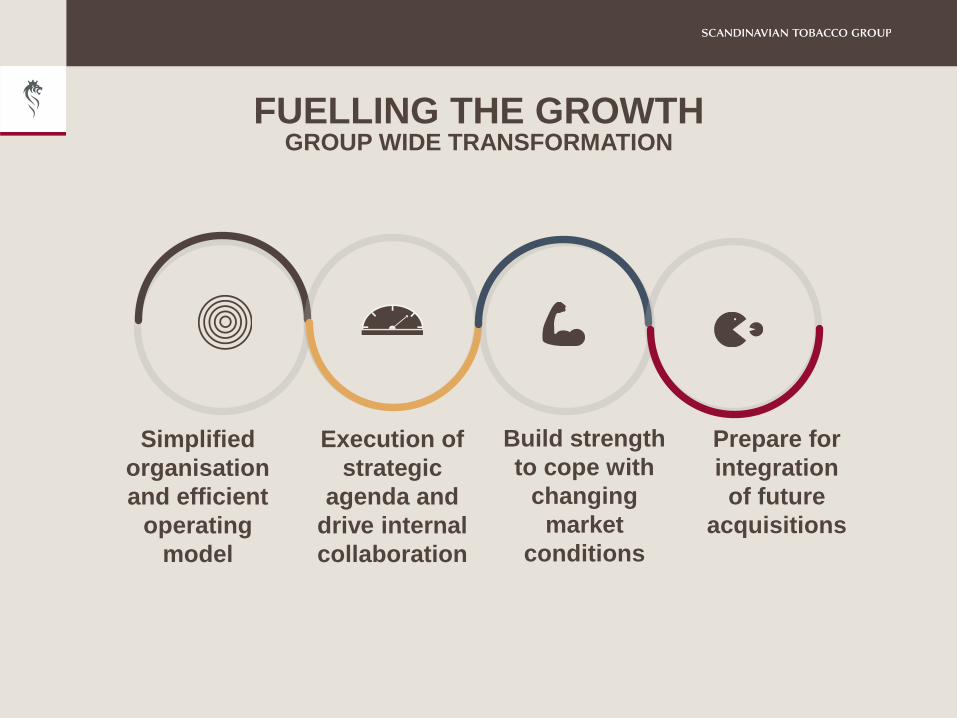
Simplified
organisation
and efficient
operating
model
Execution of
strategic
agenda and
drive internal
collaboration
Build strength
to cope with
changing
market
conditions
Prepare for
integration
of future
acquisitions
FUELLING THE GROWTH GROUP WIDE TRANSFORMATION
6
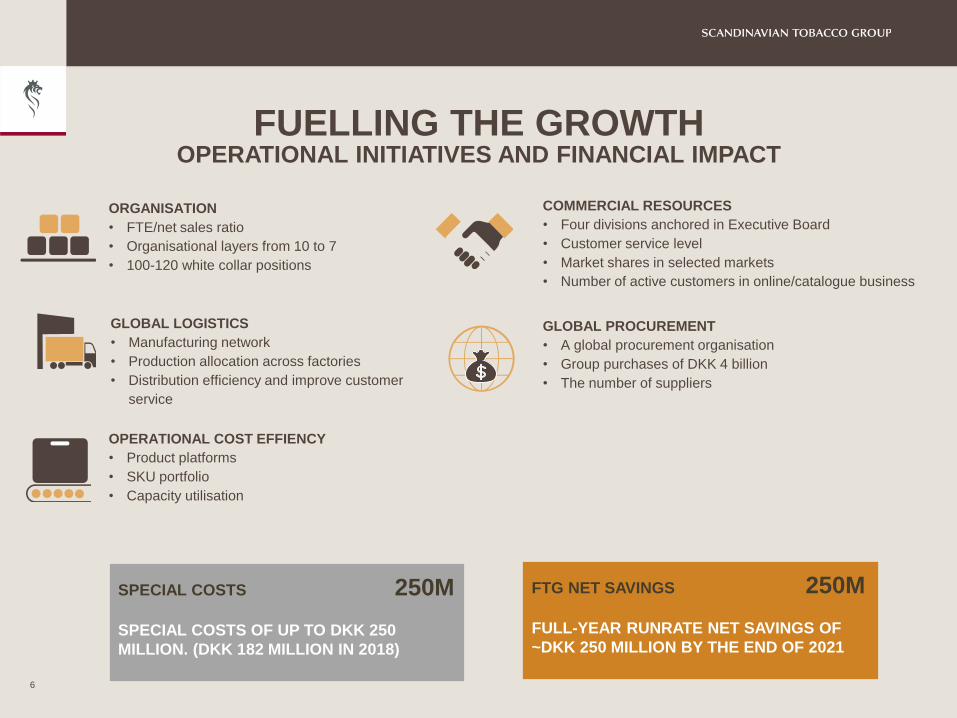
ORGANISATION
• FTE/net sales ratio
• Organisational layers from 10 to 7
• 100-120 white collar positions
GLOBAL LOGISTICS
• Manufacturing network
• Production allocation across factories
• Distribution efficiency and improve customer
service
OPERATIONAL COST EFFIENCY
• Product platforms
• SKU portfolio
• Capacity utilisation
FTG NET SAVINGS 250M
FULL-YEAR RUNRATE NET SAVINGS OF
~DKK 250 MILLION BY THE END OF 2021
SPECIAL COSTS 250M
SPECIAL COSTS OF UP TO DKK 250
MILLION. (DKK 182 MILLION IN 2018)
COMMERCIAL RESOURCES
• Four divisions anchored in Executive Board
• Customer service level
• Market shares in selected markets
• Number of active customers in online/catalogue business
FUELLING THE GROWTHOPERATIONAL INITIATIVES AND FINANCIAL IMPACT
GLOBAL PROCUREMENT
• A global procurement organisation
• Group purchases of DKK 4 billion
• The number of suppliers
HANDMADE CIGARS
NO. 1 IN THE US
7
.
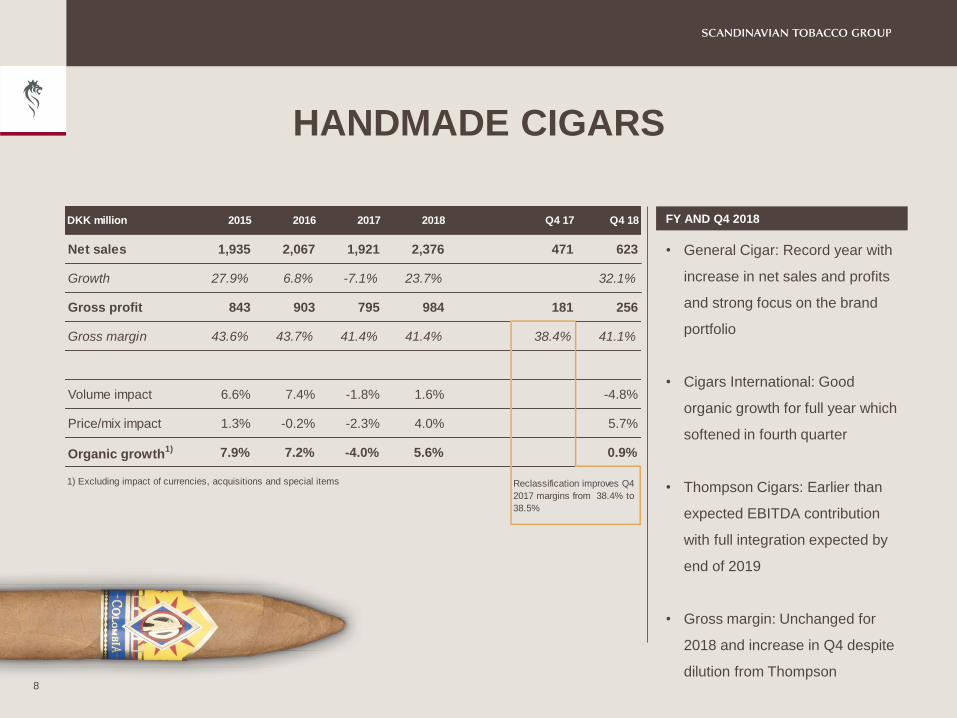
HANDMADE CIGARS
8
FY AND Q4 2018
• General Cigar: Record year with
increase in net sales and profits
and strong focus on the brand
portfolio
• Cigars International: Good
organic growth for full year which
softened in fourth quarter
• Thompson Cigars: Earlier than
expected EBITDA contribution
with full integration expected by
end of 2019
• Gross margin: Unchanged for
2018 and increase in Q4 despite
dilution from Thompson
DKK million 2015 2016 2017 2018 Q4 17 Q4 18
Net sales 1,935 2,067 1,921 2,376 471 623
Growth 27.9% 6.8% -7.1% 23.7% 32.1%
Gross profit 843 903 795 984 181 256
Gross margin 43.6% 43.7% 41.4% 41.4% 38.4% 41.1%
Volume impact 6.6% 7.4% -1.8% 1.6% -4.8%
Price/mix impact 1.3% -0.2% -2.3% 4.0% 5.7%
Organic growth1) 7.9% 7.2% -4.0% 5.6% 0.9%
1) Excluding impact of currencies, acquisitions and special items
Reclassification improves Q4
2017 margins from 38.4% to
38.5%
MACHINE-MADE CIGARSNO. 1 IN THE EU, AUSTRALIA AND CANADA
9
.avv
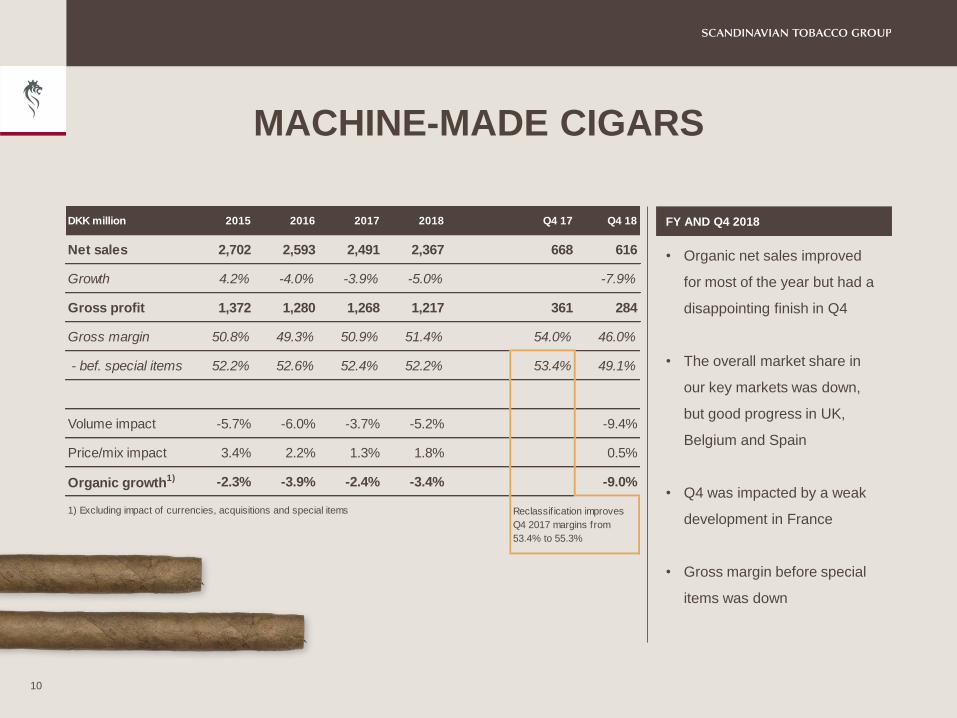
MACHINE-MADE CIGARS
FY AND Q4 2018
• Organic net sales improved
for most of the year but had a
disappointing finish in Q4
• The overall market share in
our key markets was down,
but good progress in UK,
Belgium and Spain
• Q4 was impacted by a weak
development in France
• Gross margin before special
items was down
10
DKK million 2015 2016 2017 2018 Q4 17 Q4 18
Net sales 2,702 2,593 2,491 2,367 668 616
Growth 4.2% -4.0% -3.9% -5.0% -7.9%
Gross profit 1,372 1,280 1,268 1,217 361 284
Gross margin 50.8% 49.3% 50.9% 51.4% 54.0% 46.0%
- bef. special items 52.2% 52.6% 52.4% 52.2% 53.4% 49.1%
Volume impact -5.7% -6.0% -3.7% -5.2% -9.4%
Price/mix impact 3.4% 2.2% 1.3% 1.8% 0.5%
Organic growth1) -2.3% -3.9% -2.4% -3.4% -9.0%
1) Excluding impact of currencies, acquisitions and special items
Reclassif ication improves
Q4 2017 margins from
53.4% to 55.3%
PIPE TOBACCO
NO. 1 GLOBALLY
11
.
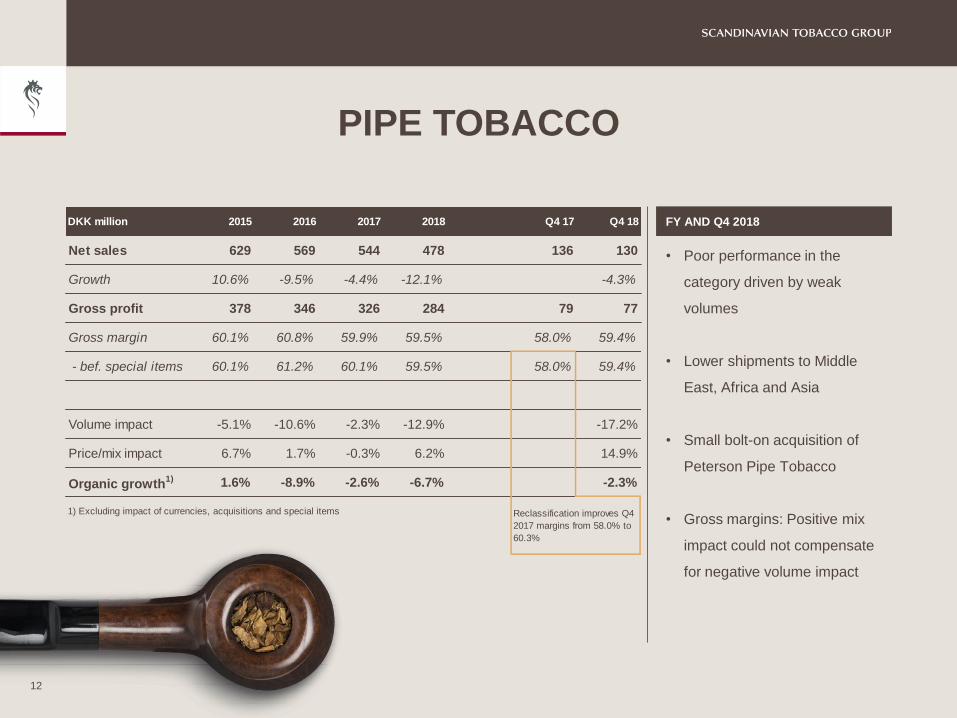
PIPE TOBACCO
12
FY AND Q4 2018
• Poor performance in the
category driven by weak
volumes
• Lower shipments to Middle
East, Africa and Asia
• Small bolt-on acquisition of
Peterson Pipe Tobacco
• Gross margins: Positive mix
impact could not compensate
for negative volume impact
DKK million 2015 2016 2017 2018 Q4 17 Q4 18
Net sales 629 569 544 478 136 130
Growth 10.6% -9.5% -4.4% -12.1% -4.3%
Gross profit 378 346 326 284 79 77
Gross margin 60.1% 60.8% 59.9% 59.5% 58.0% 59.4%
- bef. special items 60.1% 61.2% 60.1% 59.5% 58.0% 59.4%
Volume impact -5.1% -10.6% -2.3% -12.9% -17.2%
Price/mix impact 6.7% 1.7% -0.3% 6.2% 14.9%
Organic growth1) 1.6% -8.9% -2.6% -6.7% -2.3%
1) Excluding impact of currencies, acquisitions and special items Reclassification improves Q4
2017 margins from 58.0% to
60.3%
FINE-CUT TOBACCONO. 1 IN THE US AND DENMARK
13
.
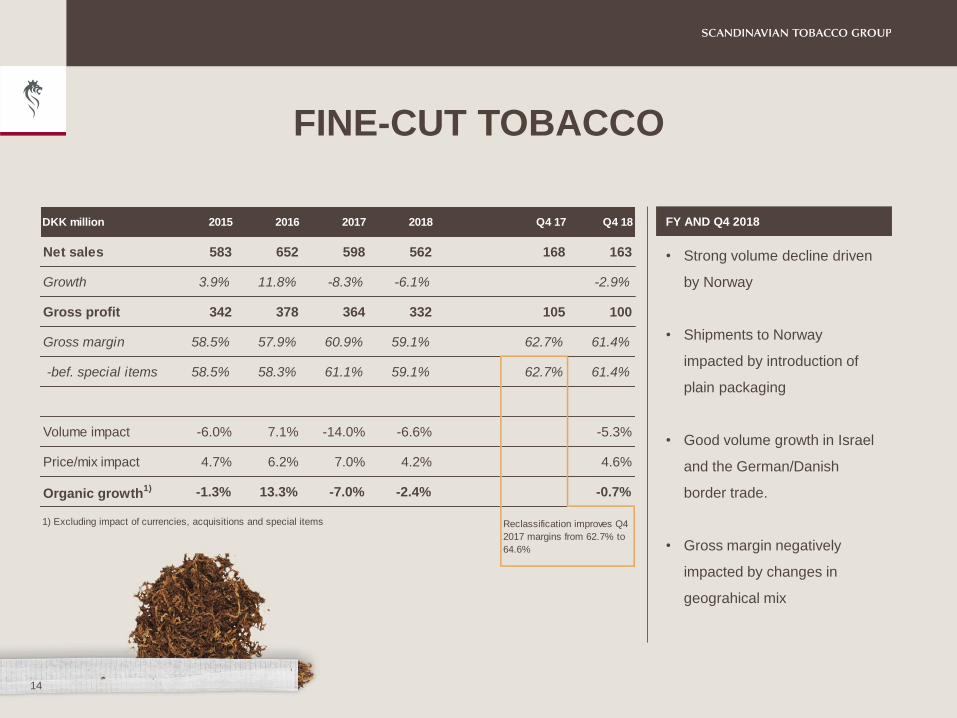
FINE-CUT TOBACCO
14
FY AND Q4 2018
• Strong volume decline driven
by Norway
• Shipments to Norway
impacted by introduction of
plain packaging
• Good volume growth in Israel
and the German/Danish
border trade.
• Gross margin negatively
impacted by changes in
geograhical mix
DKK million 2015 2016 2017 2018 Q4 17 Q4 18
Net sales 583 652 598 562 168 163
Growth 3.9% 11.8% -8.3% -6.1% -2.9%
Gross profit 342 378 364 332 105 100
Gross margin 58.5% 57.9% 60.9% 59.1% 62.7% 61.4%
-bef. special items 58.5% 58.3% 61.1% 59.1% 62.7% 61.4%
Volume impact -6.0% 7.1% -14.0% -6.6% -5.3%
Price/mix impact 4.7% 6.2% 7.0% 4.2% 4.6%
Organic growth1) -1.3% 13.3% -7.0% -2.4% -0.7%
1) Excluding impact of currencies, acquisitions and special items Reclassification improves Q4
2017 margins from 62.7% to
64.6%

ACCESSORIES AND CONTRACTMANUFACTURING
POSITIVE GROWTH
15
.
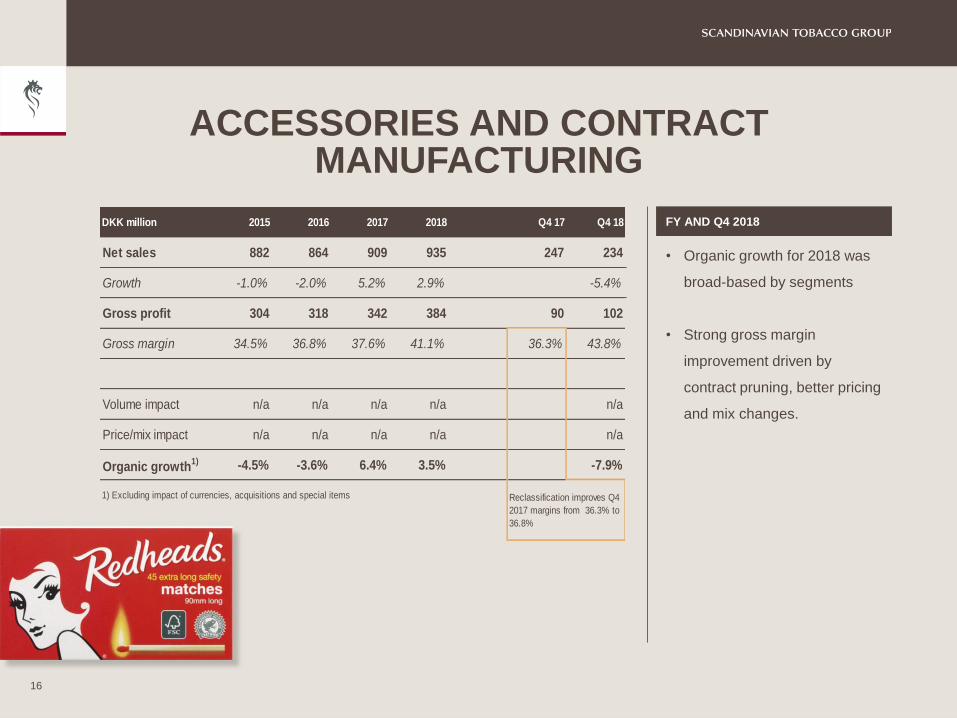
ACCESSORIES AND CONTRACTMANUFACTURING
16
FY AND Q4 2018
• Organic growth for 2018 was
broad-based by segments
• Strong gross margin
improvement driven by
contract pruning, better pricing
and mix changes.
DKK million 2015 2016 2017 2018 Q4 17 Q4 18
Net sales 882 864 909 935 247 234
Growth -1.0% -2.0% 5.2% 2.9% -5.4%
Gross profit 304 318 342 384 90 102
Gross margin 34.5% 36.8% 37.6% 41.1% 36.3% 43.8%
Volume impact n/a n/a n/a n/a n/a
Price/mix impact n/a n/a n/a n/a n/a
Organic growth1) -4.5% -3.6% 6.4% 3.5% -7.9%
1) Excluding impact of currencies, acquisitions and special items Reclassification improves Q4
2017 margins from 36.3% to
36.8%
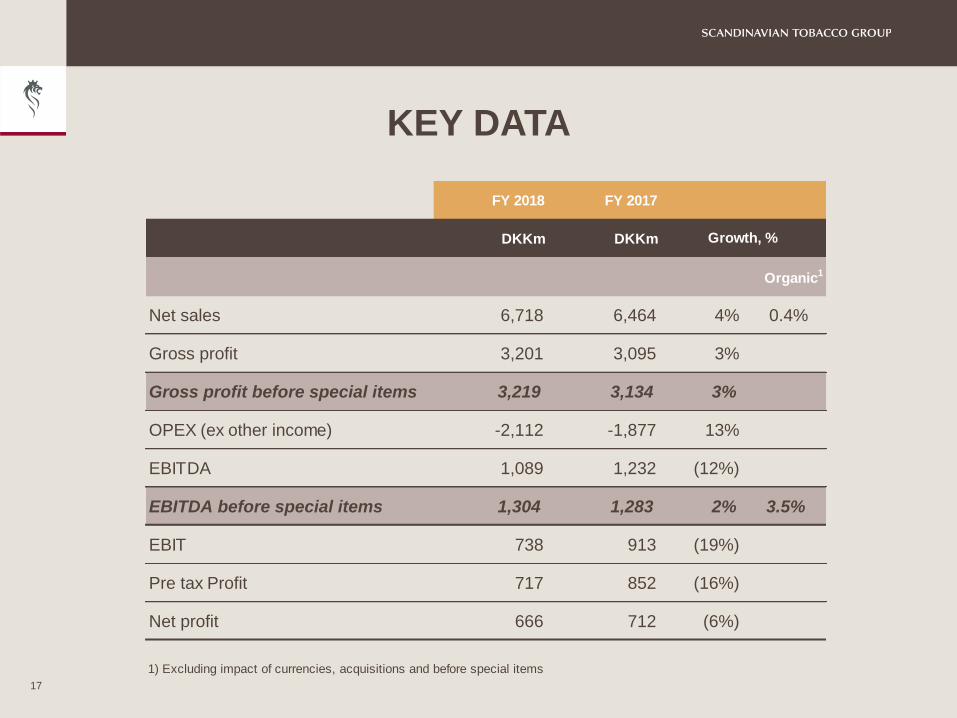
KEY DATA
17
FY 2018 FY 2017
DKKm DKKm
Organic1
Net sales 6,718 6,464 4% 0.4%
Gross profit 3,201 3,095 3%
Gross profit before special items 3,219 3,134 3%
OPEX (ex other income) -2,112 -1,877 13%
EBITDA 1,089 1,232 (12%)
EBITDA before special items 1,304 1,283 2% 3.5%
EBIT 738 913 (19%)
Pre tax Profit 717 852 (16%)
Net profit 666 712 (6%)
1) Excluding impact of currencies, acquisitions and before special items
Growth, %
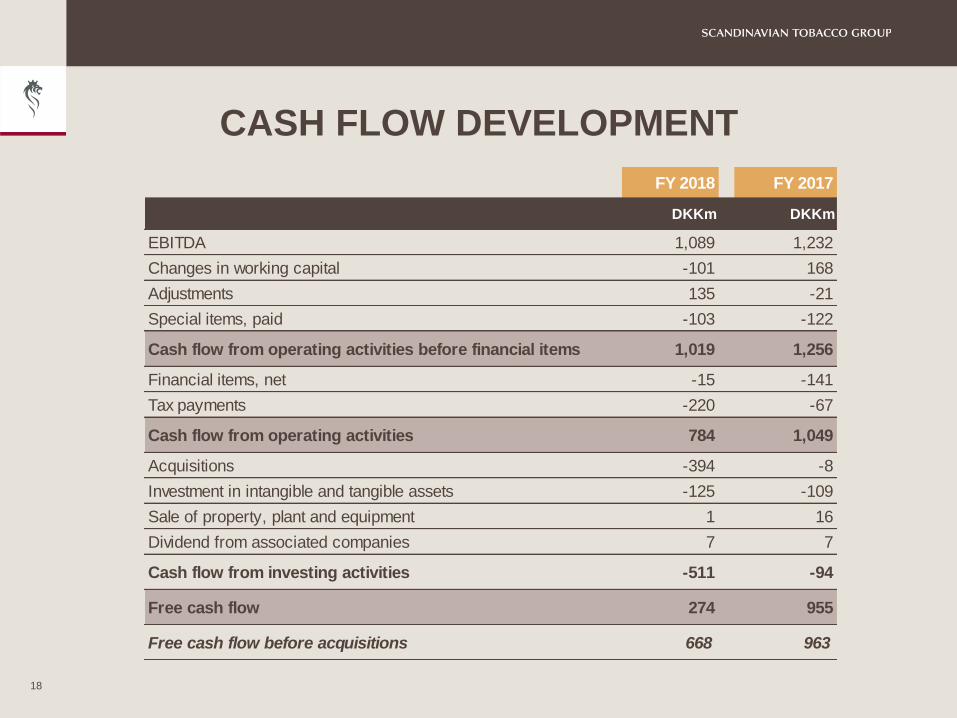
CASH FLOW DEVELOPMENT
18
FY 2018 FY 2017
DKKm DKKm
EBITDA 1,089 1,232
Changes in working capital -101 168
Adjustments 135 -21
Special items, paid -103 -122
Cash flow from operating activities before financial items 1,019 1,256
Financial items, net -15 -141
Tax payments -220 -67
Cash flow from operating activities 784 1,049
Acquisitions -394 -8
Investment in intangible and tangible assets -125 -109
Sale of property, plant and equipment 1 16
Dividend from associated companies 7 7
Cash flow from investing activities -511 -94
Free cash flow 274 955
Free cash flow before acquisitions 668 963
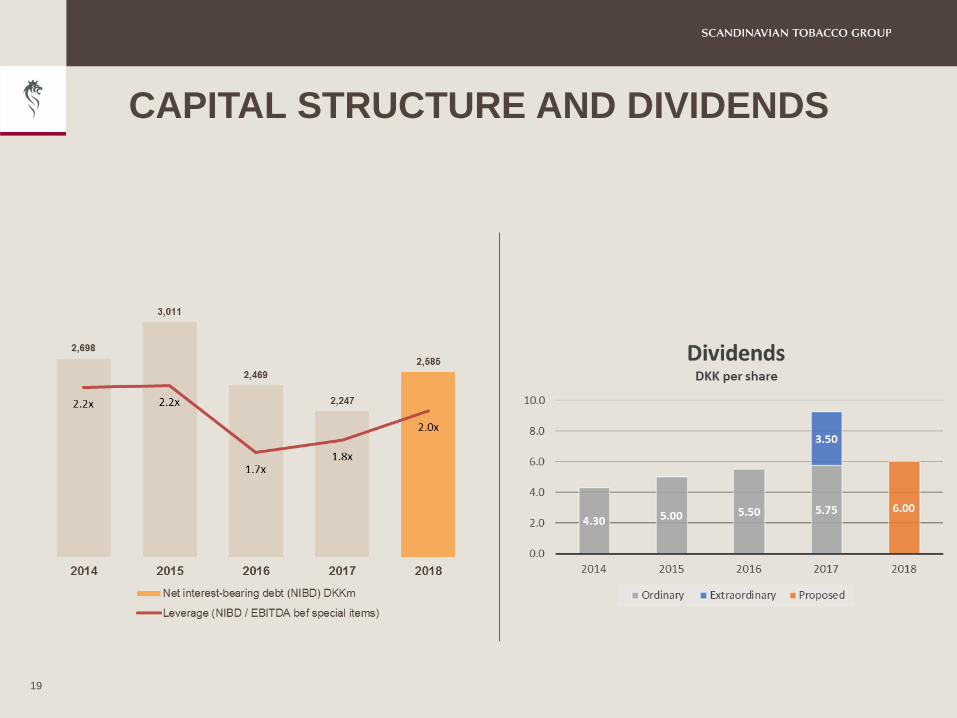
CAPITAL STRUCTURE AND DIVIDENDS
19
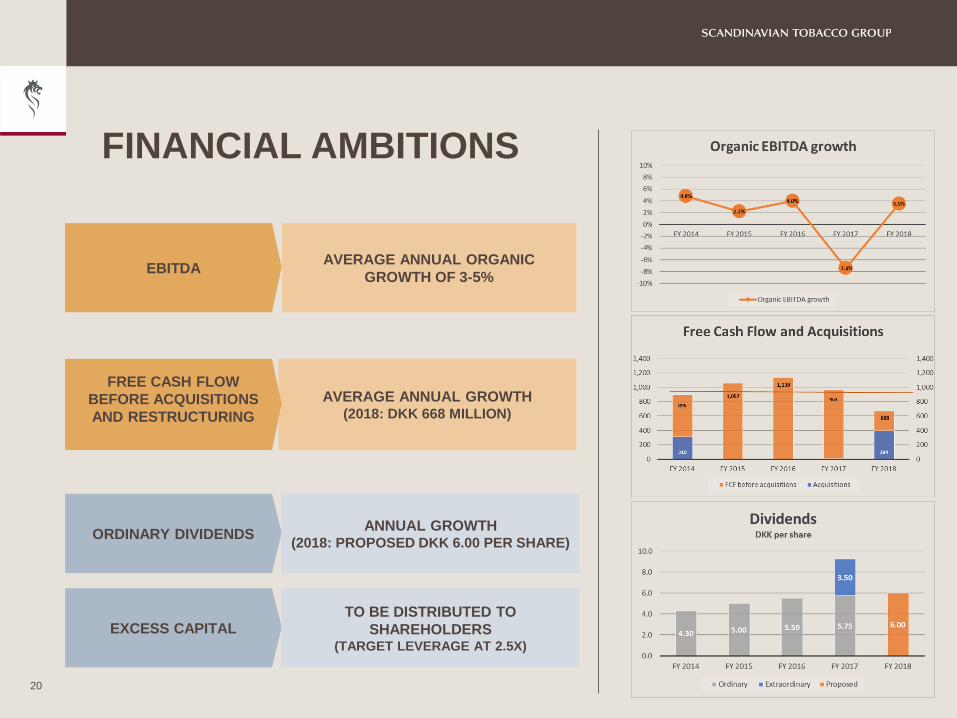
FINANCIAL AMBITIONS
20
AVERAGE ANNUAL ORGANIC
GROWTH OF 3-5%
AVERAGE ANNUAL GROWTH (2018: DKK 668 MILLION)
EBITDA
FREE CASH FLOW
BEFORE ACQUISITIONS
AND RESTRUCTURING
ORDINARY DIVIDENDS
EXCESS CAPITAL
ANNUAL GROWTH(2018: PROPOSED DKK 6.00 PER SHARE)
TO BE DISTRIBUTED TO
SHAREHOLDERS(TARGET LEVERAGE AT 2.5X)
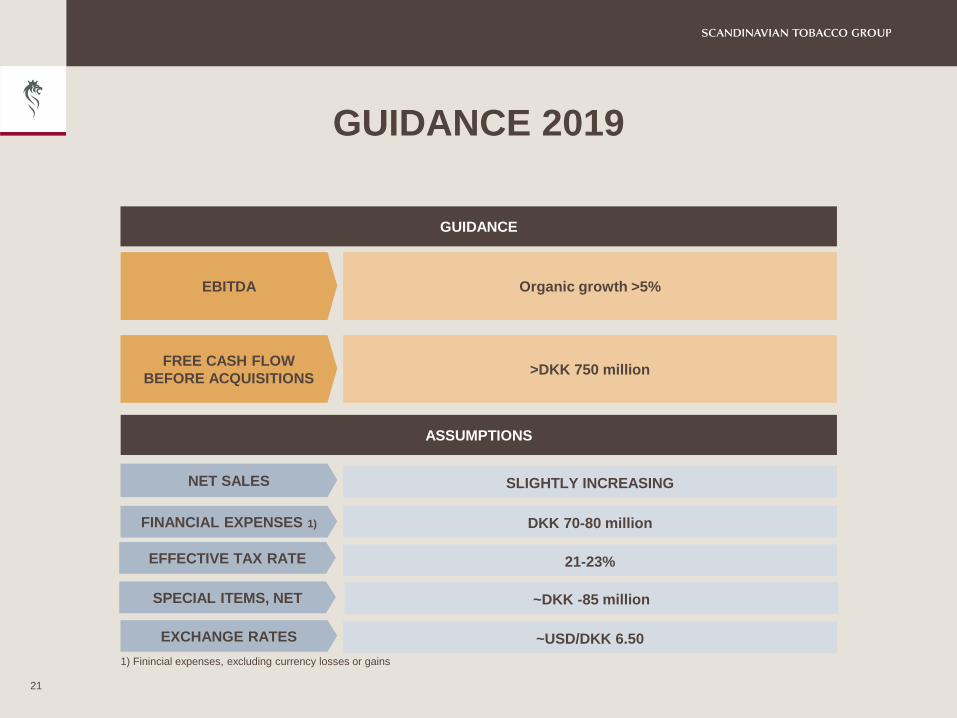
GUIDANCE 2019
21
GUIDANCE
Organic growth >5%
>DKK 750 million
EBITDA
FREE CASH FLOW
BEFORE ACQUISITIONS
NET SALES
1) Finincial expenses, excluding currency losses or gains
SLIGHTLY INCREASING
ASSUMPTIONS
FINANCIAL EXPENSES 1) DKK 70-80 million
21-23%
~DKK -85 million
~USD/DKK 6.50
EFFECTIVE TAX RATE
SPECIAL ITEMS, NET
EXCHANGE RATES

Q&A
22
23
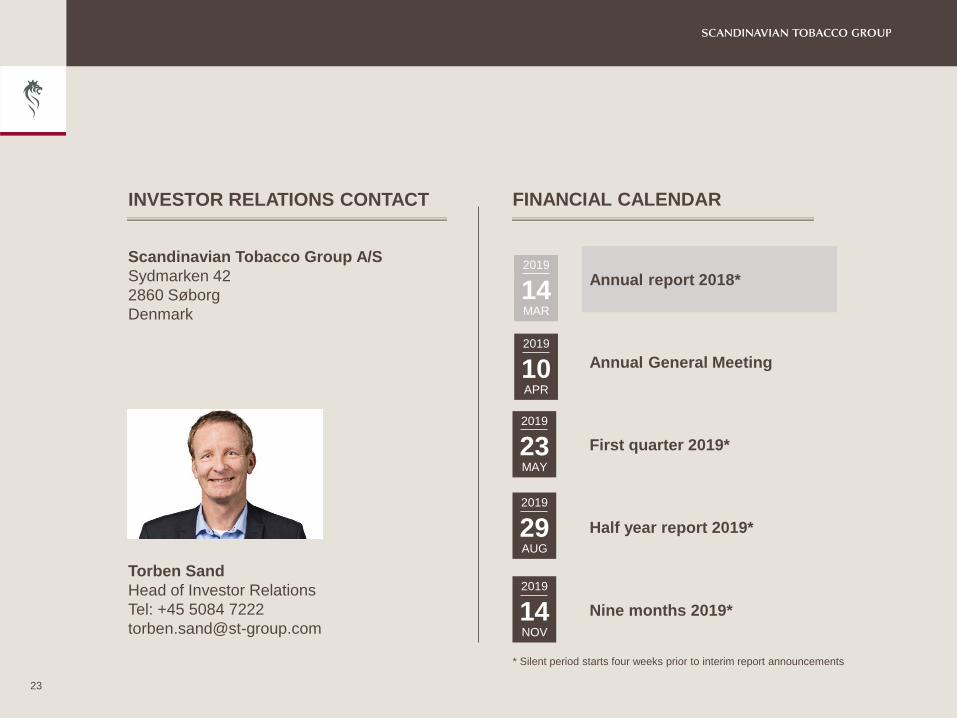
INVESTOR RELATIONS CONTACT FINANCIAL CALENDAR
Scandinavian Tobacco Group A/S
Sydmarken 42
2860 Søborg
Denmark
Torben Sand
Head of Investor Relations
Tel: +45 5084 7222
2019
14NOV
Annual report 2018*
Annual General Meeting
First quarter 2019*
Half year report 2019*
Nine months 2019*
* Silent period starts four weeks prior to interim report announcements
2019
14MAR
2019
10APR
2019
23MAY
2019
29AUG
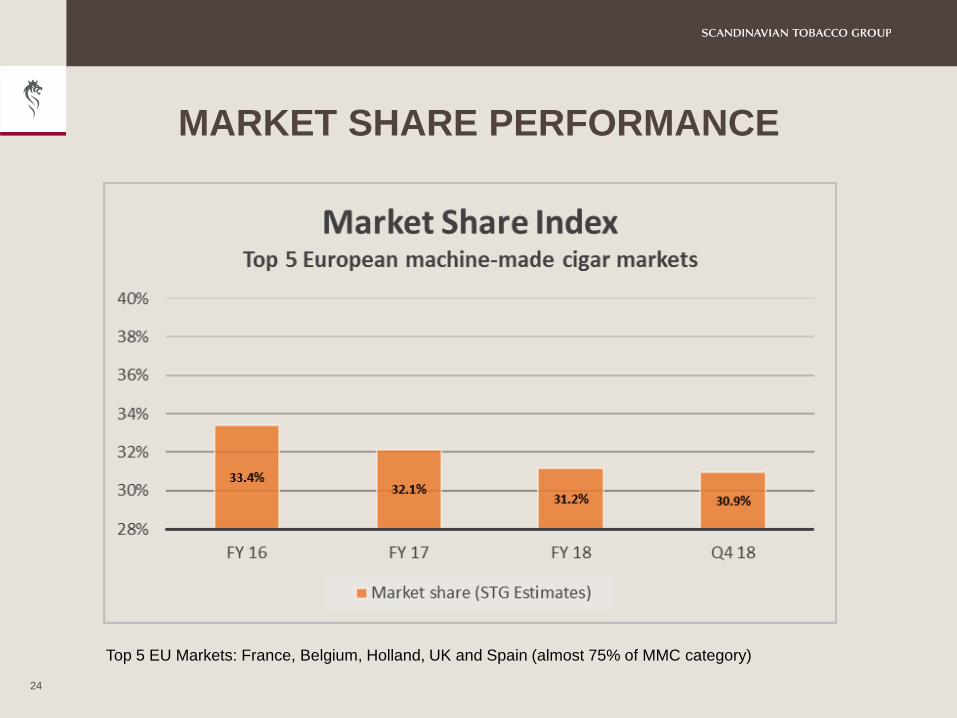
MARKET SHARE PERFORMANCE
24
Top 5 EU Markets: France, Belgium, Holland, UK and Spain (almost 75% of MMC category)
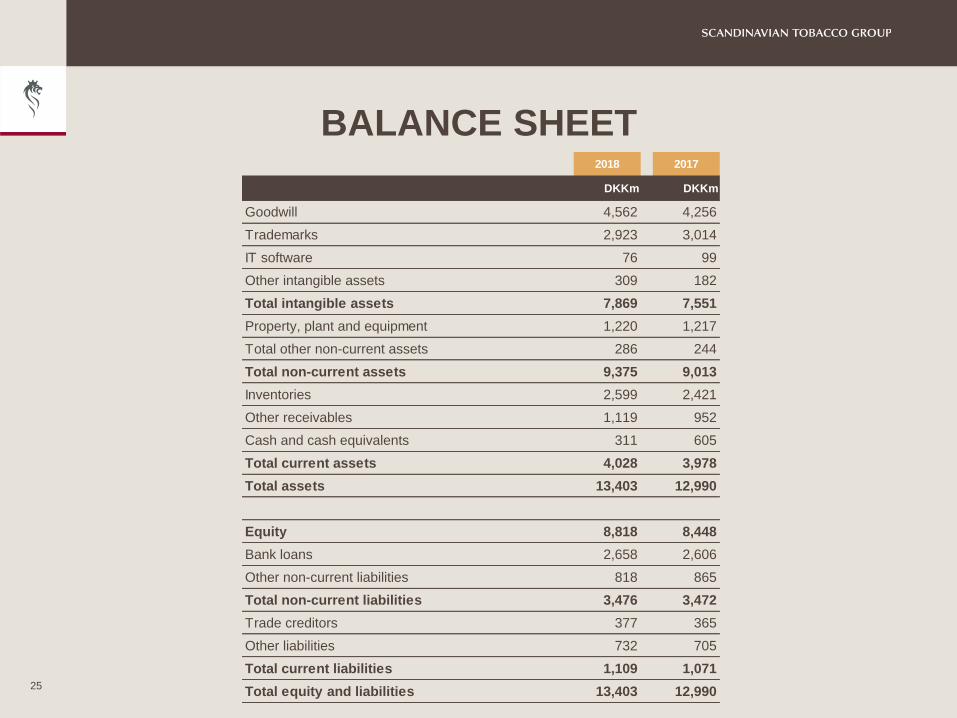
BALANCE SHEET
25
2018 2017
DKKm DKKm
Goodwill 4,562 4,256
Trademarks 2,923 3,014
IT software 76 99
Other intangible assets 309 182
Total intangible assets 7,869 7,551
Property, plant and equipment 1,220 1,217
Total other non-current assets 286 244
Total non-current assets 9,375 9,013
Inventories 2,599 2,421
Other receivables 1,119 952
Cash and cash equivalents 311 605
Total current assets 4,028 3,978
Total assets 13,403 12,990
Equity 8,818 8,448
Bank loans 2,658 2,606
Other non-current liabilities 818 865
Total non-current liabilities 3,476 3,472
Trade creditors 377 365
Other liabilities 732 705
Total current liabilities 1,109 1,071
Total equity and liabilities 13,403 12,990
FORWARD LOOKING STATEMENTS
This presentation contains forward-looking statements. All statements other than statements of historical fact included in
the presentation are forward-looking statements. Forward-looking statements give Scandinavian Tobacco Groups (“STG”)
current expectations and projections relating to its financial condition, results of operations, plans, objectives, future
performance and business. These statements may include, without limitation, any statements preceded by, followed by or
including words such as “target,” “believe,” “expect,” “aim,” “intend,” “may,” “anticipate,” “estimate,” “plan,” “project,” “will,”
“can have,” “likely,” “should,” “would,” “could” and other words and terms of similar meaning or the negative thereof. Such
forward-looking statements involve known and unknown risks, uncertainties and other important factors beyond STG’s
control that could cause STG’s actual results, performance or achievements to be materially different from the expected
results, performance or achievements expressed or implied by such forward-looking statements. Such forward-looking
statements are based on numerous assumptions regarding STG’s present and future business strategies and the
environment in which it will operate in the future.
No representation, warranty or undertaking, express or implied, is made as to, and no reliance should be placed on, the
fairness, accuracy, completeness or correctness of the Information or the opinions contained therein. The presentation
has not been independently verified and will not be updated. The Information, including but not limited to forward-looking
statements, applies only as of the date of this document and is not intended to give any assurances as to future results.
STG expressly disclaims any obligation or undertaking to disseminate any updates or revisions to the Information,
including any financial data or forward-looking statements, and will not publicly release any revisions it may make to the
Information that may result from any change in STG’s expectations, any change in events, conditions or circumstances on
which these forward-looking statements are based, or other events or circumstances arising after the date of this
document. Market data used in the Information not attributed to a specific source are estimates of STG and have not been
independently verified.
26