scaling up circular strategies to achieve zero plastic
TRANSCRIPT

SCALING UP CIRCULAR STRATEGIES TO ACHIEVE ZERO PLASTIC WASTE IN THAILANDWWF Thailand, November 2020

WWF THAILAND 2020
ABOUT THIS REPORT
PURPOSE: This report intends to promote existing circular strategies that support plastic waste management in Thailand, as well as to provide key insights and considerations to guide future strategic development among government and the private sector towards a more collaborative, fair and impactful circular waste management system for all those involved. In doing so, it aims to envision a sustainable, healthy and prosperous ‘zero plastic waste’ Thailand.
Desired outcomes:• To serve as a knowledge base for
conversations between WWF, national and local government, private sector businesses and supporting organisations (civil society, universities, think tanks, etc.).
• To bring together diverse stakeholders to connect, collaborate and be part of an action-led network.
• To develop trusted and impactful partnerships in Thailand between WWF and national and local government, private sector businesses and supporting organisations.
• To generate awareness on a broader level around the benefits of reducing plastic waste.
• To build a case for empowering informal waste collectors in their efforts to support national plastic waste achievements and targets.

3
HOW TO READ THIS REPORT:The first half of this report - Sections 1 to 3 - is intended to raise awareness and empower conversations with and among policymakers, the private sector and supporting organisations. It discusses Thailand’s current plastic waste management system to foster understanding around where to grow efficiencies and identify opportunities to build on the positive progress that has already been made on a local and national level.
The second half - the Technical Analysis - is intended for those more closely engaged in the design and implementation of the plastic waste management system and/or circular strategies. Here we present the methodology, data driven analysis and key considerations for scaling up circular strategies to meet national targets on zero plastic waste leakage.
This is Urgent: The COVID-19 Pandemic is Escalating Plastic WasteWhile much has been made of the unexpected environmental benefits of the COVID-19 pandemic (e.g. an initial 5% reduction in greenhouse gas emissions), it has also brought additional challenges to international environmental efforts. It has particularly exacerbated the plastics crisis, which was already a critical threat to natural ecosystems around the world. Plastic waste and litter have risen globally due to the necessary use of personal protective equipment, the increase in take-away meals and booming e-commerce sales. Even before the COVID-19 pandemic, the UN estimated that 75% of all plastic ends up as waste (UNCTAD, 2019).
In Bangkok alone, the amount of plastic waste increased by 62% in March and April 2020 compared to the same time in 2019, according to the Thailand Environment Institute.
“Cooperation is key to reducing plastic waste.”Environment Minister Varawut Silpa-archa (Bangkok Post, 2019)

WWF THAILAND 2020

5
CONTENTSACKNOWLEDGEMENTS, ACRONYMS, & GLOSSARY 6
01. INTRODUCING THAILAND’S PLASTIC CRISIS 8
02. UNPACKING THE THAI WASTE MANAGEMENT SYSTEM 14
03. SCALING UP TRANSITION TOWARDS CIRCULARITY 22
04. ENVISIONING AN EPR FOR THAILAND: KEY CONSIDERATIONS 40
05. MATERIAL FLOW ANALYSIS METHODOLOGY 52
BIBLIOGRAPHY 62
WWF THAILAND 2020
ACKNOWLEDGEMENTS
ACRONYMS
WWF would like to thank the anonymous interviewees as well as the following groups, institutions, organisations and individuals for their work in this topic, and their generosity in providing valuable contributions.
ASEAN: The Association of Southeast Asian Nations
EPR: Extended Producer Responsibility
LAO: Local Administrative Organisation
MFA: Material Flow Analysis
PRO: Producer Responsibility Organisation
SDG: Sustainable Development Goal
TIPMSE: The Thailand Institute of Packaging and Recycling Management for Sustainable Development
Department of Local Administrations Pollution Control Department
Dow Thailand Coca-Cola Thailand Food Industry Asia GEPP SA-ARD Co., Ltd INSEE Ecocycle Management (PPP Plastic) NR Instant Produce PCL PETROMAT Thailand Public Private Partnership for Sustainable Plastic and Waste
Deutsche Gesellschaft für Internationale International Union for Conservation of Nature (IUCN) Asia Region Thailand Environment Institute (TEI) United Nations Environmental Programme (UNEP) Zusammenarbeit(GIZ)
Centre for Natural Resources and Environmental Law, Faculty of Law, Thammasat University Chula Zero Waste, Chulalongkorn University The Circular Economy for Waste-free Thailand Working Group, Mae Fah Luang University

7
GLOSSARYCircular Economy: The circular economy is a new economic model for addressing human needs and fairly distributing resources without undermining the functioning of the biosphere or crossing any planetary boundaries. In a circular economy, materials are continuously used at their highest value and there is no “waste” as all byproducts are gainfully utilised.
End-of-Life Handling: Another term for waste management, end-of-life handling refers to the various management processes (collection, sorting, processing, etc.) involved in treating materials at the end of their useful lives – i.e. when they are considered waste.
Extended Producer Responsibility (EPR): A concept underpinning both voluntary and legislative schemes which acknowledges that producers of consumer goods bear some financial responsibility for the management of waste resulting from their sales. In general, the more of a given product a company sells into a particular country, the greater their contribution will be to support the waste management and recycling systems in that country. EPR schemes are increasingly used around the world to combat litter and increase recycling rates in a way that is fair to businesses, governments and the public.
Hotspot: These are areas to focus on when attempting to improve a system. A hotspot is part of a system that creates irreversible negative environmental, social, or financial impacts, causes impacts that cross a critical threshold, or where a small number of entities or materials cause a
disproportionately high level of negative impacts.
Leverage Point or Opportunity for Leverage: A leverage point or opportunity for leverage is a point in a system where a small change, effort, or investment can result in substantial positive results.
Material Flow Analysis (MFA): A systematic assessment of the flows (movements) and stocks (amounts) of materials within a system defined in space and time. For example, an MFA might trace the amount and types of food produced in a country for a given year as it moves from producers to processors to retailers/caterers/households to various waste treatment options.
Polluter Pays Principle: A concept underpinning producer responsibility whereby the entities that introduce products or packaging that become litter are held responsible for arranging the collection and waste management of these materials as well as additional activities to reduce waste.
Producer Responsibility Organisation (PRO): The system operator of an EPR scheme. PROs are responsible for managing the EPR fees, engaging producers, and issuing contracts with waste management operators
Whole-of-Society Approach: Whole-of-society approaches use collaboration between public, private, academic and NGO sectors to complement public policy. Emphasis is placed on coordination through shared visions and trust building between stakeholders.

WWF THAILAND 2020
01
INTRODUCING THAILAND’S PLASTIC CRISIS

9
1.1 A GROWING PLASTIC PROBLEM IN PARADISEThe world is in the midst of a serious plastic waste crisis. Annually, up to 13 million tonnes of plastic waste enters the world’s oceans (Akenji et al., 2019). Each year, roughly 11.1 billion items of plastic flow into the Indian and Pacific Oceans. This number is expected to increase to 15.7 billion by 2025 if proper waste management strategies are not implemented in the next couple of years (Akenji et al., 2019).
In Thailand, population growth coupled with economic development has resulted in a 7-8% annual increase in plastic usage (Marks et al., 2020). Indeed, this economic development has changed citizens’ lifestyles and consumption patterns, resulting in an increase in domestic and industrial waste generation of 12% over the past 10 years (Wichal-utcha and Chavalparit, 2018). Furthermore, ~80% of all plastic waste generated in Thailand consists of single-use plastic bags (PCD, 2019). Currently, Thailand’s per capita consumption of plastic is among the highest in Asia (Akenji et al., 2019, Wichai-utcha, N. and Chavalparit, O., 2018), estimated at 15.52kg annually in the Plastic Packaging in Southeast Asia report from WWF (WWF, 2020). Much of this plastic ends up in the environment, notably marine ecosystems; approximately 65.3% of waste collected from Thai natural environments in 2018 was some form of plastic packaging (PCD, 2019).
The situation is exacerbated by inefficient collection schemes and disposal methods: low household waste separation, overstretched waste collection services and low economic incentives for waste separation and recycling. These issues have resulted in improper disposal of 27% of municipal solid waste (Akenji et al., 2019; PCD, 2019). Plastic waste generation in particular has increased more rapidly than any other waste stream, negating recent improvements in the proper disposal of plastic waste. Plastic waste has increased at an average rate of 12% per year, to between 2 and 2.5 million tonnes of plastic waste per year, making Thailand among the largest plastic consumers in Asia (Ocean Conservancy, 2017; PCD, 2019).
Thailand’s plastic packaging waste is dominated by just two products: plastic bags and bottles. Together, they account for some 60% of all plastic packaging waste. While the mass of plastic bag waste (including mono-layers and shopping bags) is almost double that of plastic bottle waste, very few bags are collected for recycling – they are lightweight and often too contaminated for recycling. However, household waste separation can significantly increase the efficacy of recycling even for bags.
The ongoing COVID-19 pandemic has exacerbated single-use plastic consumption not only in personal protective equipment but also as businesses try to regain consumers’ trust by wrapping all products in plastic. This waste has flooded Thailand’s waste management system, causing significant leakage of plastic waste into the environment, primarily affecting marine ecosystems.
Annually, up to 13 million tonnes of plastic waste enters the world’s oceans. – (Akenji et al., 2019)
~80% of all plastic waste generated in Thailand consists of single-use plastic bags. – (PCD, 2019)
Approximately 65.3% of waste collected from Thai natural environments in 2018 was some form of plastic packaging. – (PCD, 2019)
WWF THAILAND 2020
LEGEND
OPPOSITEOUTCOMEPHYSICALSOCIALECONOMICSPOLITICAL
ENHANCEDIMINISH
AVAILABLECAPACITY FOR
RECYCLING
COLLECTIONRATE
PRESSUREFROM MEDIA,
NGO’S, & FOREIGNPOLITICS
ILLEGAL/UNSAFEDUMPING OR
BURNING
CONSUMER’SPARTICIPATIONON DISPOSAL
GOVERNMENTTRUST
MANUALSEPARATION
AVAILABILITYOF PROPERDISPOSAL
POINTS
BAN OFSINGLE-USESHOPPING
PLASTIC BAGS
LACK OFREGULATION &
GUIDELINES FORPRODUCERS
CONTROL OFRECYCLING-WASTE
IMPORT
INVESTMENTGROWTH IN HTERECYCLING BIZ FINANCIAL
INCENTIVESON RECYCLING
BUSINESS
IMPORT OFWASTE FORRECYCLING
TECHNICAL &FUNCTIONAL
REQUIREMENT
TOURISM
SINGLE-USESHOPPING BAGCONSUMPTION
SINGLE-USEGARBAGE PLASTIC
BAGCONSUMPTION
POPULATION& ECONOMIC
GROWTHCONSUMPTION
OF PLASTICPACKAGING
STRICTNESSOF WASTE
MANAGEMENTREGULATIONS
FOOD SAFETYREGULATIONS
DISPOSALQUALITY
COLLECTIONPROCESSQUALITY
MATERIALCONTAMINATION
AVAILABILITYOF PROPER
TREATMENTFACILITIES
LOSS DURINGRAINSTORM/
FLOODS
RECYCLINGPROCESSQUALITY RECYCLING
RATE
MIXEDMATERIALS
WASTETREATMENT
QUALITY
PLASTICLEAKAGE
AVAILABILITYOF FORMAL WASTE
SEPARATIONSYSTEM
SUFFICIENCY &ACCESSIBILITYOF LOGISTICS
GOVERNMENT’SBUDGET ASSIGNED
TO WASTEMANAGEMENT
MOTIVATIONTO ADDRESS
PLASTIC WASTEISSUES
PLASTICMATERIAL COST
CONSUMERBURDEN
OF WASTEMANAGEMENT
COST
VOLUME OFPOST-CONSUMER
WASTES
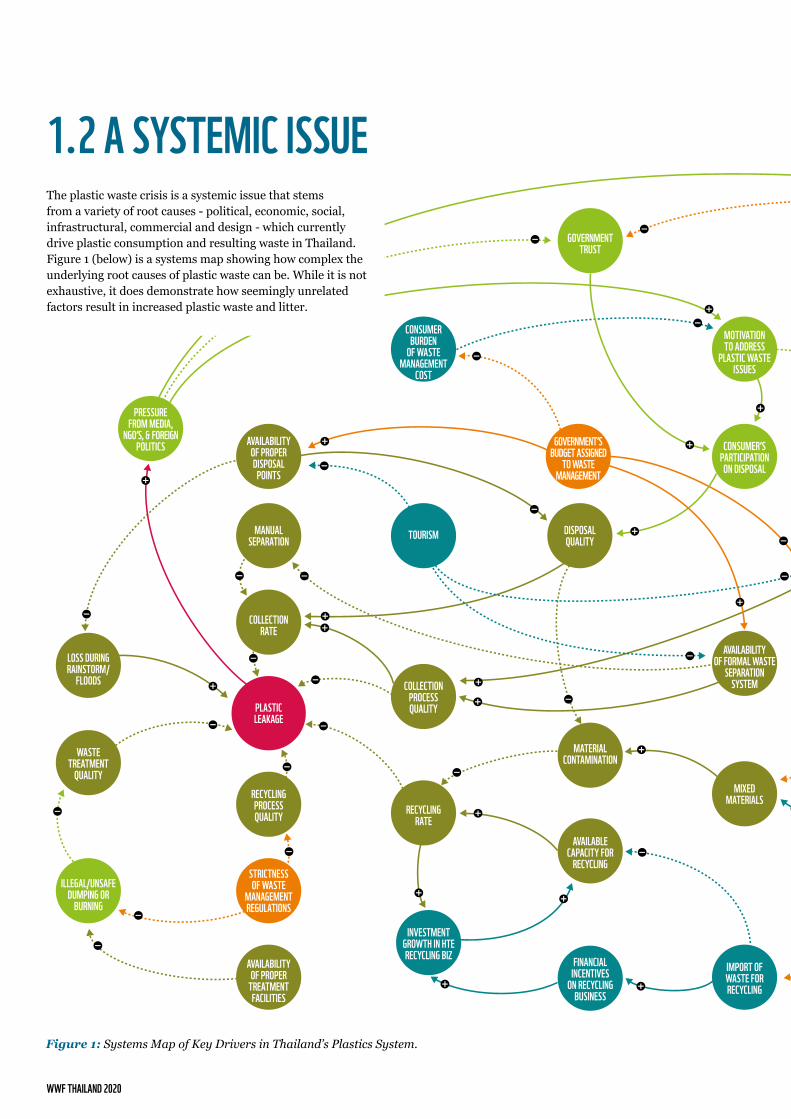
Figure 1: Systems Map of Key Drivers in Thailand’s Plastics System.
1.2 A SYSTEMIC ISSUEThe plastic waste crisis is a systemic issue that stems from a variety of root causes - political, economic, social, infrastructural, commercial and design - which currently drive plastic consumption and resulting waste in Thailand. Figure 1 (below) is a systems map showing how complex the underlying root causes of plastic waste can be. While it is not exhaustive, it does demonstrate how seemingly unrelated factors result in increased plastic waste and litter.

11
LEGEND
OPPOSITEOUTCOMEPHYSICALSOCIALECONOMICSPOLITICAL
ENHANCEDIMINISH
AVAILABLECAPACITY FOR
RECYCLING
COLLECTIONRATE
PRESSUREFROM MEDIA,
NGO’S, & FOREIGNPOLITICS
ILLEGAL/UNSAFEDUMPING OR
BURNING
CONSUMER’SPARTICIPATIONON DISPOSAL
GOVERNMENTTRUST
MANUALSEPARATION
AVAILABILITYOF PROPERDISPOSAL
POINTS
BAN OFSINGLE-USESHOPPING
PLASTIC BAGS
LACK OFREGULATION &
GUIDELINES FORPRODUCERS
CONTROL OFRECYCLING-WASTE
IMPORT
INVESTMENTGROWTH IN HTERECYCLING BIZ FINANCIAL
INCENTIVESON RECYCLING
BUSINESS
IMPORT OFWASTE FORRECYCLING
TECHNICAL &FUNCTIONAL
REQUIREMENT
TOURISM
SINGLE-USESHOPPING BAGCONSUMPTION
SINGLE-USEGARBAGE PLASTIC
BAGCONSUMPTION
POPULATION& ECONOMIC
GROWTHCONSUMPTION
OF PLASTICPACKAGING
STRICTNESSOF WASTE
MANAGEMENTREGULATIONS
FOOD SAFETYREGULATIONS
DISPOSALQUALITY
COLLECTIONPROCESSQUALITY
MATERIALCONTAMINATION
AVAILABILITYOF PROPER
TREATMENTFACILITIES
LOSS DURINGRAINSTORM/
FLOODS
RECYCLINGPROCESSQUALITY RECYCLING
RATE
MIXEDMATERIALS
WASTETREATMENT
QUALITY
PLASTICLEAKAGE
AVAILABILITYOF FORMAL WASTE
SEPARATIONSYSTEM
SUFFICIENCY &ACCESSIBILITYOF LOGISTICS
GOVERNMENT’SBUDGET ASSIGNED
TO WASTEMANAGEMENT
MOTIVATIONTO ADDRESS
PLASTIC WASTEISSUES
PLASTICMATERIAL COST
CONSUMERBURDEN
OF WASTEMANAGEMENT
COST
VOLUME OFPOST-CONSUMER
WASTES
EXAMPLE: VIRTUOUS CYCLE OF INVESTMENT AND CAPACITY

WWF THAILAND 2020
From a governance and political standpoint, and according to Yukuland et al. (2018), the government historically focuses on dealing with water and sewage issues rather than waste. This has been changing in recent years as the Thai government has been increasingly active in issues related to waste management – including waste imports, plastic bag usage and behavioural change. This may mean that time, energy and resources are not primed for streamlining Thailand’s waste system, nor able to serve the entire population. The onset of the COVID-19 pandemic has compounded this issue, understandably diverting governmental focus from the plastics crisis. Environment Minister Varawut Silparcha has openly spoken about how COVID has hindered the fight against plastic waste (Aung, W.Y., May 12, 2020).
From an economic standpoint, the low priority focus on plastic waste means limited resources are available for waste collection schemes. Low budgets for waste collection often result in low service coverage and collection rates; this is especially true in remote areas where lower population density makes waste management more expensive. Allocated funding often does not cover the costs of gasoline to collect waste in these remote areas, nor machine and vehicle maintenance (Pansuk et al., 2018). By contrast, in areas with many households operational plans for waste collection and regulations can be determined and the allocated money goes further. Another relevant systemic driver is the environmental externality around plastic waste imports previously destined for China. Due to China’s National Sword policy, Thailand received 481,000 tonnes of plastic waste imports in 2018, compared to 70,000 tonnes in 2016 (Marks et al., 2020). If these imports continue to increase, Thailand will face an even greater plastics problem as these imports compromise the capacity to process and recycle local waste.
From a social standpoint, several systemic issues are at play. Informal waste pickers are not officially recognised, yet play a key role in Thailand’s waste management, further driving an informal economy (see sections below for more on this). Citizens also require information on how to dispose of plastic waste appropriately. For example, Thai households often do not know which materials are recyclable and may not sort their waste properly, making effective collection more challenging.
From an infrastructure standpoint, Thailand’s waste infrastructure has struggled to cope with waste generation levels. Collection and contamination have been recognised as the most critical issues in the waste system, exacerbated by the vast number of stakeholders involved in waste management (see Section 2.2 below on limitations). There are many individual groups collecting waste in Thailand, each with different collection methods.

13
From a design standpoint, current packaging further inhibits improved waste disposal and recycling. If eco-design principles were prioritised and products were made from one plastic monomer, recycling could be made easier (Wichal-utcha and Chavalparit, 2019). Thailand’s Ministry of Natural Resources and Environment (MONRE) has launched the “Plastic Debris Management Plan” to ensure the protection of the marine environment by promoting eco-packaging design for recyclability and eco-friendly (recyclable or compostable) plastic substitute materials (Akenji et al., 2019). Further measures like these can effectively change packaging design for the better.
From a commercial standpoint, plastic and packaging industries currently work with linear (take, make, dispose), single-use product design. Multiple layers, dyes, lightweighting, single serving products and other design choices reduce the feasibility of both collection and recycling. This accelerates plastic waste and limits opportunities to reintroduce plastic back into production processes where it can be reused to make new products.
In addition, current forms of recycling are actually forms of downcycling (where materials are downgraded to a lower value or a lower level of functionality). Furthermore, low prices for certain types of plastic and increasing plastic waste imports have impacted Thai recycling companies without a large end-market for their recycled materials, further reducing investment in recycling businesses (Johnson and Trang, 2019). As shown in the diagram above, the virtuous cycle of investment in recycling businesses, leading to greater recycling capacity and greater recycling rates, is in fact inhibited by plastic waste imports and contaminated waste streams.
Finally, restrictions on the use of recycled plastics in food packaging (the largest user of plastic packaging) critically limit the market for recycled products. Connecting back to the governance standpoint, the various types of plastics produced by industry are not yet addressed by law, and neither is their labelling, which complicates sorting plastic for reuse and recycling.

WWF THAILAND 2020
02
UNPACKING THE THAI WASTE MANAGEMENT SYSTEM

15
A large network of governmental bodies manages plastic waste in Thailand. These include: the Ministry of Natural Resources and Environment (MONRE), the Pollution Control Department (PCD), the Department of Local Administration (DLA), the Department of Industrial Works (DIW) and the Ministry of Energy (MOE). Local governments are also responsible for implementing policies and directives from higher levels of government. Currently, most decision-making processes concerning waste handling and budgetary management are centralised in national government ministries, while operational capacities and responsibilities are determined locally.
Plastic waste collectors in Thailand are split into formal collectors (waste collection crews) and informal collectors (pickers, scavengers and itinerant buyers), all of which collect different materials in different locations.
From beverage companies to the plastic and packaging industries in Thailand, many invested organisations are responsible for the ever-increasing production of plastics for consumer products, while simultaneously concerned about the negative environmental and health impacts. As such, numerous businesses have launched their own EPR systems and the Thailand Business Council for Sustainable Development (TBCSD) to promote environmental awareness and sustainable development strategies.
In order to assess the existing waste management system, and to identify its strengths and areas for improvement, we must first look at the nuts and bolts of the system itself.
Many NGOs (both Thai and international) work directly with plastic waste, for example through education programmes, policy recommendations and supporting waste collectors. Various international NGOs such as the International Union for Conservation of Nature (IUCN) Asia Region, the United Nations Environment Programme (UNEP) and WWF have been working with the Thai government, private sector and entities like the Thailand Environment Institute (TEI) and the Thailand Public Private Partnership for Sustainable Plastic and Waste Management (PPP Plastic) to solve plastic waste issues within Thailand. They provide research-based input on the country’s progress towards a circular plastic economy, developing supporting policy suggestions.
It is also important to mention the role of the public within the waste management system, particularly given their role in disposing of ‘used’ plastic products. In many municipalities, trash and recycling bins are not provided and households are responsible for providing their own bins. Where this is the case, or where public collection services are not offered, waste is often burned in backyard pits or illegally dumped.
Box 1: Key Players in the Thai Waste Management System.
GOVERNMENTS CIVIL SOCIETY, NGOS AND SUPPORT ORGANISATIONS
WASTE COLLECTORS GENERAL PUBLIC
PRIVATE SECTOR
2.1 HOW THE SYSTEM WORKSVarious actors are involved in waste management, including local governments, waste collectors, recyclers and waste shops. Research institutions and civil organisations are also involved in conducting research and developing technologies to support waste management. See Box 1 below for the key players.

WWF THAILAND 2020
Municipalities are responsible for providing or funding public collection services to the entire population, reporting on their performance and providing input to the Producer Responsibility Organization (PRO) about needs on the ground. However, owing to the system’s limitations discussed below, trash and recycling bins are often not provided, nor are public collection services offered to large portions of the population.
Formal waste collectors aim to collect separated waste streams from households, improving coverage from current levels to ensure that 100% of the population receives this service and to maximise separation of recyclables. Waste collectors report their performance and needs to the LAOs they serve. Formal waste collectors also scavenge some of the most valuable recyclables for sale/recycling, but operate under significant time pressure.
RECYCLINGUNITS
LARGE JUNK ANDSCRAP DEALERS
SMALL SCRAP DEALERS
ITINERANT WASTE BUYERS
WASTE COLLECTORS
INFORMALWASTESECTORPYRAMID
Collect waste from households, scavenge at secondary bins, vacant land parcels, roadsides and landfills and sell to small scrap dealers.
Buy recyclables from households institutions, and small shops.
Small shops that short, store, and resell material to large scrap dealers.
Large shops that sort, store, process, and resell material to recycling/manufacturing units.
Recycling and manufacturing industry; converts materials into final products.
Ammo
unt of
incom
e
-
+
WHILE WASTE PICKERS ARE BOTH THE LARGEST STAKEHOLDER GROUP IN THE INFORMAL SECTOR AND COLLECT THE LARGEST AMOUNT OF RECYCLABLE/REUSABLE MATERIAL, THEY RECEIVE THE LEAST AMOUNT OF INCOME FROM THESE ACTIVITIES, WHEREAS RECYCLING UNITS RECEIVE THE MOST INCOME.
Source: Extracted from Sandhu, K. et al. (2016).
The informal sector also collects a significant amount of recyclable materials. This involves picking out high-value plastic waste, such as PET (plastic bottles), and leaving out other plastic waste (e.g. plastic bags which are too low-value), which consequently pollutes the natural environment (see Figure 2 below). Because waste pickers have low income, they are forced to focus on only high-value plastics which means that their efficacy is tied to market prices, and when the price for plastic drops, collection also drops.
After collection, recyclable plastic is transported by itinerant waste buyers for sale in waste shops and stockpiled. This allows wholesalers to sell large volumes of processed materials to recycling companies. In this pyramid-like configuration, wholesalers – or middlemen – can secure large profits, while waste collectors suffer ongoing hardships. Exact numbers of informal waste collectors are unknown, making it difficult to quantify the true economic and environmental impact of their work. Informal pickers are an important part of this chain; making this a more desirable job could have significant positive impact.
Figure 2: How Waste Pickers Contribute to the Thai Waste Management System.

17
WWF THAILAND 2020
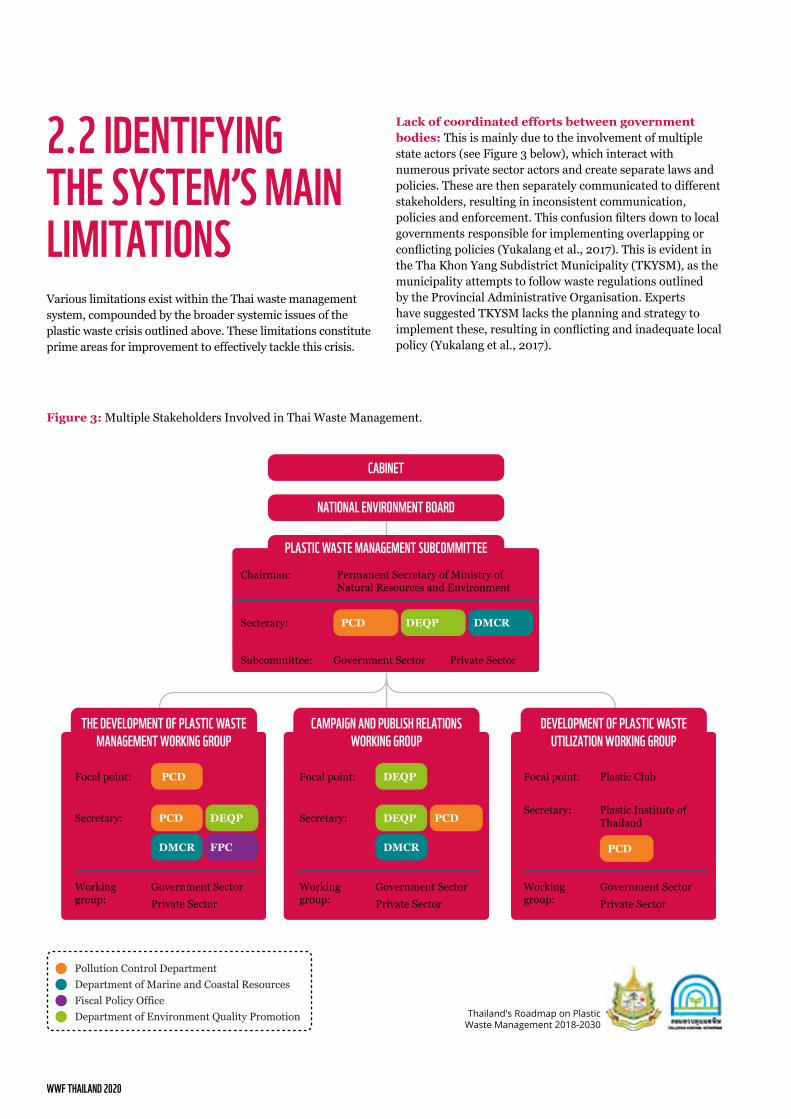
2.2 IDENTIFYING THE SYSTEM’S MAIN LIMITATIONSVarious limitations exist within the Thai waste management system, compounded by the broader systemic issues of the plastic waste crisis outlined above. These limitations constitute prime areas for improvement to effectively tackle this crisis.
Lack of coordinated efforts between government bodies: This is mainly due to the involvement of multiple state actors (see Figure 3 below), which interact with numerous private sector actors and create separate laws and policies. These are then separately communicated to different stakeholders, resulting in inconsistent communication, policies and enforcement. This confusion filters down to local governments responsible for implementing overlapping or conflicting policies (Yukalang et al., 2017). This is evident in the Tha Khon Yang Subdistrict Municipality (TKYSM), as the municipality attempts to follow waste regulations outlined by the Provincial Administrative Organisation. Experts have suggested TKYSM lacks the planning and strategy to implement these, resulting in conflicting and inadequate local policy (Yukalang et al., 2017).
Figure 3: Multiple Stakeholders Involved in Thai Waste Management.
Thailand's Roadmap on Plastic Waste Management 2018-2030
Focal point:
Secretary: PCD DEQP
DMCR FPC
Secretary: DEQP PCD
DMCR
Working group:
Government SectorPrivate Sector
Working group:
Government SectorPrivate Sector
Working group:
Government SectorPrivate Sector
Secretary: Plastic Institute of Thailand
PCD
Focal point: Focal point:
CABINET
NATIONAL ENVIRONMENT BOARD
Permanent Secretary of Ministry of Natural Resources and Environment
Secterary: PCD
Government Sector Private Sector
DEQP DMCR
Chairman:
Subcommittee:
PLASTIC WASTE MANAGEMENT SUBCOMMITTEE
Pollution Control DepartmentDepartment of Marine and Coastal ResourcesFiscal Policy OfficeDepartment of Environment Quality Promotion
MECHANISM OF PLASTIC WASTE MANAGEMENT IN THAILAND TO ACHIEVE ROADMAP GOALS
PCD Plastic ClubDEQP
THE DEVELOPMENT OF PLASTIC WASTE MANAGEMENT WORKING GROUP
CAMPAIGN AND PUBLISH RELATIONS WORKING GROUP
DEVELOPMENT OF PLASTIC WASTE UTILIZATION WORKING GROUP

19
A lack of financial resources to properly implement waste management schemes: For example, local administrative organisations (LAOs) in Thailand are rarely allocated sufficient funds for their waste management duties. According to Kojima (2019), ~16% of LAOs stated that they receive inadequate waste collection funding from the government. As such, LAOs rely heavily on citizens to provide their own bins and manage their waste, leading to ineffective waste collection.
A lack of consumer awareness and waste disposal options: According to Johnson and Trang (2019), just 8% of the Thai population separates waste. Increased government focus on building consumer awareness through public awareness campaigns on appropriate waste disposal could alleviate this issue. For example, most households are unaware that junk shops will buy LDPE bags; they do not separate them, which exacerbates the existing prevalence of plastic bag litter (D. Boonyanurak from GEPP, personal interview, March 30, 2020). This further highlights the importance of effective communication and awareness raising among all stakeholders, to prevent plastic waste leaking into the environment. Current schemes to encourage recycling (e.g. the 3Rs scheme) are largely voluntary and have yet to achieve widespread participation; without enforceable regulations, supporting infrastructure and incentives to comply, voluntary schemes are ineffective (Marks et al., 2020). An economic incentive to separate waste such as deposit refund schemes would likely increase recycling rates (Johnson and Trang, 2019).
Exacerbation of informal economy and insecure livelihoods: Informal waste pickers collect a lot of material for very little money. They are the frontline against plastic waste, yet their role is currently unrecognised by the government. This exacerbates the informal economy and consequent insecure livelihoods. As a result, informal waste collectors are vulnerable to price fluctuation of plastics, causing inconsistent collection. Box 2 below provides a spotlight on these essential actors in the Thai waste management system and the challenges they face.
Thailand’s waste management system is currently overwhelmed by the deluge of unwanted plastic waste. It is clear that disconnects between product/packaging design, business models and waste management capacity, including complex governance and lack of funding, are at the root of the problem. The next section looks at how Thailand’s roadmap can offer a beacon of hope to address these issues.
Thai waste collectors tend to be poor, under-educated and female. They work ~6-10 hours per day for an average daily income of ~150-250 baht (Thai PBS, 2019). Their financial situation is precarious – managing a household of 2-4 members on little income – leading to high debt levels. In crises such as the COVID-19 pandemic, this group is among the hardest hit. Incorporating the informal sector into public waste collection can alleviate poverty, streamline waste collection and improve public health by providing waste collectors with the knowledge and equipment to safely perform their work.
Box 2: Spotlight on Thai Informal Waste Collectors
Just 8% of the Thai population separates waste – (Kojima, 2019)
~16% of LAOs stated that they receive inadequate waste collection funding from the government – (Kojima, 2019)

WWF THAILAND 2020
2021
2.3 MOVING FORWARDS: THAILAND’S ROADMAPMultiple efforts by the government, private sector and civil society have been made within Thailand’s waste management system to limit the ever-growing consumption and disposal of plastic. The timeline (see Figure 4 below) is a valuable tool highlighting the progress made so far, focusing on Thailand’s future commitments to recycle 100% of target materials according to circular economy principles by 2027.
2.3.1 DELIVERING A
2027: Target for 100% recycled plastic.
Figure 4: A Timeline Showing Thailand’s Progress and Future Commitments for Zero Plastic Waste.
2018
2017
2009
2019
2030
JUNE 2017: Thailand pledged to reduce plastic
use at an international forum.
1 APRIL 2018:Goal for ceasing use of plastic
cap seals on drinking water bottles according to an agreement
between Thailand’s Pollution Control Department (PCD) and
five major water bottlers.
APRIL 2019: Thailand formally adopted the
Roadmap on Plastic Waste Management, 2018-2030.
SEPTEMBER 2019: Thailand’s Minister of
Environment moves up the planned ban on certain plastic
bags 2 years from 2022 to 2020.
1 JANUARY 2020:Effective date set for a ban on single-use plastic bags with a
thickness of less than 36 microns at major retailers, exempting 40%
of the total volume of single-use bags used at wet markets and
restaurants until 2021.
5 JUNE 2019: Dow Thailand Group and other partners in the Thailand Public Private Partnership for Sustainable Plastic and Waste Management (PPP Plastic) launched the 2nd year of their plastic waste management initiative to implement the new roadmap.
2020: Thai government holds public consultations regarding EPR.
JANUARY-MARCH 2020: COVID-19 pandemic takes hold.
SEPTEMBER 2020:Pepsico Foundation and TerraCycle Global Foundation partner up to clean waterways in Thailand and find ways to recycle recovered materials.
2030:SDGs are met.
2009: The Wongpanit Company, of Phitsanulok, collects 140 tonnes of waste per day.
JANUARY 2018:Coca-Cola’s “World Without Waste” project begins in Thailand and five other ASEAN countries.
21 JULY 2018: The Thai government kicked off a campaign to reduce the use of foam containers and single-use plastic bags at fresh markets countrywide.
2020
We are here
21
NATIONAL ROADMAP BASED ON CIRCULAR ECONOMY PRINCIPLES to coordinate. This has led to a new circular agenda for addressing plastic waste. Industries have been encouraged to implement eco-packaging design as well as eco-friendly plastic substitutes to allow for more plastic recycling (Wichal-utcha and Chavalparit, 2018). Five of the country’s biggest companies (Boonrawd Trading Company, SermSuk, Thai Drink Company, Nestlé and Caraboa) have taken steps to reduce their plastic consumption by pledging to stop using plastic bottle cap seals (Akenji et al., 2019). In addition, PPP Plastic (led by the plastics industry) has created a roadmap with ambitious goals covering infrastructure, education, innovation, policy and legislation and database centres, in order to reduce Thailand’s marine debris by 50% by 2027 (PPP Plastic, 2019).
2.3.2 IDENTIFYING ROADBLOCKS IN THE CIRCULAR ROADMAPDespite the vast increases in plastic waste due to COVID-19, its effects have understandably diverted focus from the transition to circularity. Yet the COVID-19 pandemic is threatening to knock the Roadmap on Plastic Waste Management, 2018-2030 entirely off course. This unfolding situation requires greater emphasis on systemic interventions to scale up and bolster efforts and to achieve the target dates (e.g. 100% of plastic waste will be recycled by 2027).
The Roadmap on Plastic Waste Management, 2018-2030 promulgated by MONRE, DEQP, and PCD and PPP Plastic (a public private partnership including some of the largest plastic producers) lays out ambitious targets for progress on this front: by 2022 they aim to eliminate the use of thin plastic bags, foam food containers and plastic straws/cups. Furthermore, these government agencies aim to develop a plastic waste recycling system according to circular economy principles that will start in 2022 and achieve 100% recycling of targeted plastic wastes by 2027.
The Thai government has adopted the Roadmap on Plastic Waste Management, 2018-2030 as a policy framework with initial bans on problematic materials, with a Sub-Committee on plastic waste management and several working groups
Thailand is just beginning its transition towards circularity; as such, the current pace of change is gradual as legal frameworks are adjusted and industry is consulted. The Roadmap on Plastic Waste Management, 2018-2030 is also identifying fundamental roadblocks, such as lacking legal restrictions on the use of plastic bags, lacking regulations to incentivise waste separation and recovery (many provisions are currently voluntary and lack sufficient participation) and lacking enforcement requiring manufacturers to specify the types of plastics used for products (Ministry of Natural Resources and Environment (MONRE), 2019). In addition, Thailand’s large informal waste sector is involved at multiple stages of the value chain but suffers from low and unpredictable income, health risks and inconsistent material collection prospects.
2.3.3 OPPORTUNITIES TO KEEP THAILAND ON TRACK TO DELIVER TARGETS Based on analysis of the current waste management system and Thailand’s national targets, Thailand is undoubtedly faced with a unique historic opportunity to turn the tide on plastics pollution.
In order to support Thailand to continue progressing towards the targets set out in its Roadmap on Plastic Waste Management, 2018-2030, WWF has carried out new research into the production, use and disposal of plastics in Thailand.
The aim is to deepen understanding around the hotspots and opportunities within the Thai plastic waste management system, to inform and shape further discussions around the circular strategies needed to deliver on future targets. In particular, the section that follows makes the case for further discussions around the potential of an Extended Producer Responsibility (EPR) scheme to provide the framework for scaling up Thailand’s transition towards circularity.
WWF THAILAND 2020
03
SCALING UP TRANSITION TOWARDS CIRCULARITY
23
In this section, we provide an overview of Thailand’s plastic waste flow through an approach known as a Material Flow Analysis (MFA). This facilitates a strategic diagnosis from a standpoint of knowledge about the entire plastics waste management system in Thailand.
The analysis demonstrates the volume of different types of plastic packaging waste that is collected or lost at various stages in Thailand’s waste management. This enables us to identify critical hotspots and opportunities to consider in the design, implementation and scaling up of approaches to enhance Thailand’s progress towards its 100% recycling ambitions for target materials.
Tracking plastic packaging waste’s journey from producer to consumer to disposal or recycling also highlights our shared responsibility and the need for a collaborative action-led approach.
Our method used a combination of:
• Thai government data (e.g. waste data from the Department of Local Administration and the PCD’s database on disposal sites);
• Analysis by leading international and Thai expert organisations (including IUCN Asia Region, PlasticsEurope, the Thailand Public Private Partnership for Sustainable Plastic and Waste Management, the Plastics Institute of Thailand and PETROMAT, among others);
• Consultation of local experts in the Circular Economy for Waste-free Thailand research group at Mae Fah Luang University;
• Sensitivity analyses and a focus-group meeting with other local experts to ensure the assumptions and analysis accurately reflect the reality on the ground in Thailand.
More information on the MFA approach and methodology is provided in the Technical Analysis.
3.1 TOWARDS A PLASTIC WASTE MANAGEMENT REDESIGN: HOTSPOTS AND OPPORTUNITIES FOR THAILANDVisualised in the graphics on the two pages that follow, the plastic waste MFA reveals a set of core issues (see Figure 5 and Table 1) to be considered as Thailand strives to achieve its vision of 100% circular recycling for target materials by 2027.
1 See Section 4 “Technical Analysis” for a more in depth review of this approach and how it has been applied in the particular case of Thailand.

WWF THAILAND 2020
Based on data from Thailand's PCD & DLA.
PLASTICPOLYMERS
(2,510 kton)PACKGINGPRODUCTS
PET (392 kton)
HDPE (764 kton)
LLDPE (468 kton)
LDPE (178 kton)
PP (465 kton)
PS (99 kton)
EPS (31 kton)
Others (63 kton)
PVC (50 kton)
Snack Bags/Pouches
(199 kton)
Bags(1,070 kton)
Others(307 kton)
Trays/Boxes/Cups (291 kton)
Bottles(591 kton)
Caps/Cap Rings(59 kton)
PublicCollection
(1,310 kton)
Littering (922 kton)
CrewSeparation(235 kton)
Disposal(1,110 kton)
WastePicking
(35 kton)
Scavenging(54 kton)
REMAIN ON LAND(464 kton)
LEAKAGE TO MARINEENVIRONMENT (143 kton)
OPEN BURNING(317 kton)
SANITARYLANDFILLED/INCINERATED(660 kton)
UNSANITARY LANDFILLED/INCINERATED (358 kton)
RECYCLED(569 kton)
4
5
1
4
6
7
3
6
2
Management at Source (306 kton)
Sent for Recycling
(630 kton)
53%15%10%10%10%2%
56%16%11%10%6%1%
52%15%12%10%9%2%
61%14%13%6%4%1%
72%18%6%2%2%<1%
* Open burning + UnsanitarLandfilled/Incinerated
IMPROPERDISPOSAL*
LEAKAGE TO MARINE
ENVIRONMENT
SANITARYLANDFILL
/INCINERATED
REMAINON LAND
RECYCLED
0
100
200
300
400
500
600
700
800
EPSPVCOTHERSPSLDPEPETPPLLDPEHDPE0%
20%
40%
60%
80%
100%
0%
25%
50%
75%
100%
SCAVENGING WASTEPICKING
MANAGEMENTAT SOURCE
CREWSEPARATION
Public collectioncoverage (bypopulation)
Share of wastelittered
Share of wastemanaged byhousehold
Share of wastecollected
PACKAGINGPRODUCTS
BagsBottles
Snack Bags/PouchesCaps/Cap RingsTrays/Boxes/Cups
Others
COMPOSITION OF PACKAGING COLLECTED FORRECYCLING ACROSS DIFFERENT ACTIVITIES
SHARE OF PLASTIC POLYMERS AND THE END-OF-LIFEFATES IN EACH POLYMER TYPE (KTON)
SHARE OF WASTE BEING COLLECTED, MANAGED BY HOUSEHOLD, AND LITTERED IN RELATIONTO ACCESS TO COLLECTION SERVICE IN THAILAND (BY PROVINCE)
Leakage to Marine EnvironmentOpen BurningUnsanitary Landfilled/IncineratedRemain on LandRecycledSanitary Landfilled/Incinerated
1
2
10
11
6 7 13 14
5
9
3 4 12
15
17
16
8
BottlesTrays/Boxes/CupsOthersCaps/Cap RingsBagsSnack Bags/Pouches
Figure 5: Thailand’s Plastic Waste Flow.

25
PLASTICPOLYMERS
(2,510 kton)PACKGINGPRODUCTS
PET (392 kton)
HDPE (764 kton)
LLDPE (468 kton)
LDPE (178 kton)
PP (465 kton)
PS (99 kton)
EPS (31 kton)
Others (63 kton)
PVC (50 kton)
Snack Bags/Pouches
(199 kton)
Bags(1,070 kton)
Others(307 kton)
Trays/Boxes/Cups (291 kton)
Bottles(591 kton)
Caps/Cap Rings(59 kton)
PublicCollection
(1,310 kton)
Littering (922 kton)
CrewSeparation(235 kton)
Disposal(1,110 kton)
WastePicking
(35 kton)
Scavenging(54 kton)
REMAIN ON LAND(464 kton)
LEAKAGE TO MARINEENVIRONMENT (143 kton)
OPEN BURNING(317 kton)
SANITARYLANDFILLED/INCINERATED(660 kton)
UNSANITARY LANDFILLED/INCINERATED (358 kton)
RECYCLED(569 kton)
4
5
1
4
6
7
3
6
2
Management at Source (306 kton)
Sent for Recycling
(630 kton)
53%15%10%10%10%2%
56%16%11%10%6%1%
52%15%12%10%9%2%
61%14%13%6%4%1%
72%18%6%2%2%<1%
* Open burning + UnsanitarLandfilled/Incinerated
IMPROPERDISPOSAL*
LEAKAGE TO MARINE
ENVIRONMENT
SANITARYLANDFILL
/INCINERATED
REMAINON LAND
RECYCLED
0
100
200
300
400
500
600
700
800
EPSPVCOTHERSPSLDPEPETPPLLDPEHDPE0%
20%
40%
60%
80%
100%
0%
25%
50%
75%
100%
SCAVENGING WASTEPICKING
MANAGEMENTAT SOURCE
CREWSEPARATION
Public collectioncoverage (bypopulation)
Share of wastelittered
Share of wastemanaged byhousehold
Share of wastecollected
PACKAGINGPRODUCTS
BagsBottles
Snack Bags/PouchesCaps/Cap RingsTrays/Boxes/Cups
Others
COMPOSITION OF PACKAGING COLLECTED FORRECYCLING ACROSS DIFFERENT ACTIVITIES
SHARE OF PLASTIC POLYMERS AND THE END-OF-LIFEFATES IN EACH POLYMER TYPE (KTON)
SHARE OF WASTE BEING COLLECTED, MANAGED BY HOUSEHOLD, AND LITTERED IN RELATIONTO ACCESS TO COLLECTION SERVICE IN THAILAND (BY PROVINCE)
Leakage to Marine EnvironmentOpen BurningUnsanitary Landfilled/IncineratedRemain on LandRecycledSanitary Landfilled/Incinerated
1
2
10
11
6 7 13 14
5
9
3 4 12
15
17
16
8
BottlesTrays/Boxes/CupsOthersCaps/Cap RingsBagsSnack Bags/Pouches

WWF THAILAND 2020
HOTSPOTS Demographic expansion and economic development have changed citizens’ consumption patterns, resulting in a 12% increase in waste generation from domestic and industrial sectors over the past 10 years (Wichal-utcha and Chavalparit, 2018).
Bags are the most consumed plastic packaging product in Thailand (40%) by weight, but are light, easily contaminated, low-value and rarely recycled. Over 60% of bags are improperly disposed of or leaked into the environment (both terrestrial and marine). ~27.3% of littered wastes retrieved from the environment are plastic bags (PCD, 2018).
Actual waste collection varies widely from city to city. Each province has a web of connections that generates financial resources for an entrenched group of stakeholders with overlapping politics and incentives. It is important to work with these groups rather than override them (D. Boonyanurak from Gepp, personal interview, March 30, 2020).
Local governments have limited budgets. This impedes collection and sorting of waste in several provinces. Per-capita expenditure for managing municipal solid waste in 2014-2015 was 1-2 USD (which is approximately 1/3 of the world average) (GIZ, 2018). The 2017 Act on Maintenance, Cleanliness and Orderliness of Thailand proposed a 150 baht/month/household (US$ 4.5) waste collection service fee (ibid.), but a significant portion of the population is not willing to pay these fees due to low trust in the quality of the public service, reinforcing the need for transparency, reporting, and education related to EPR.
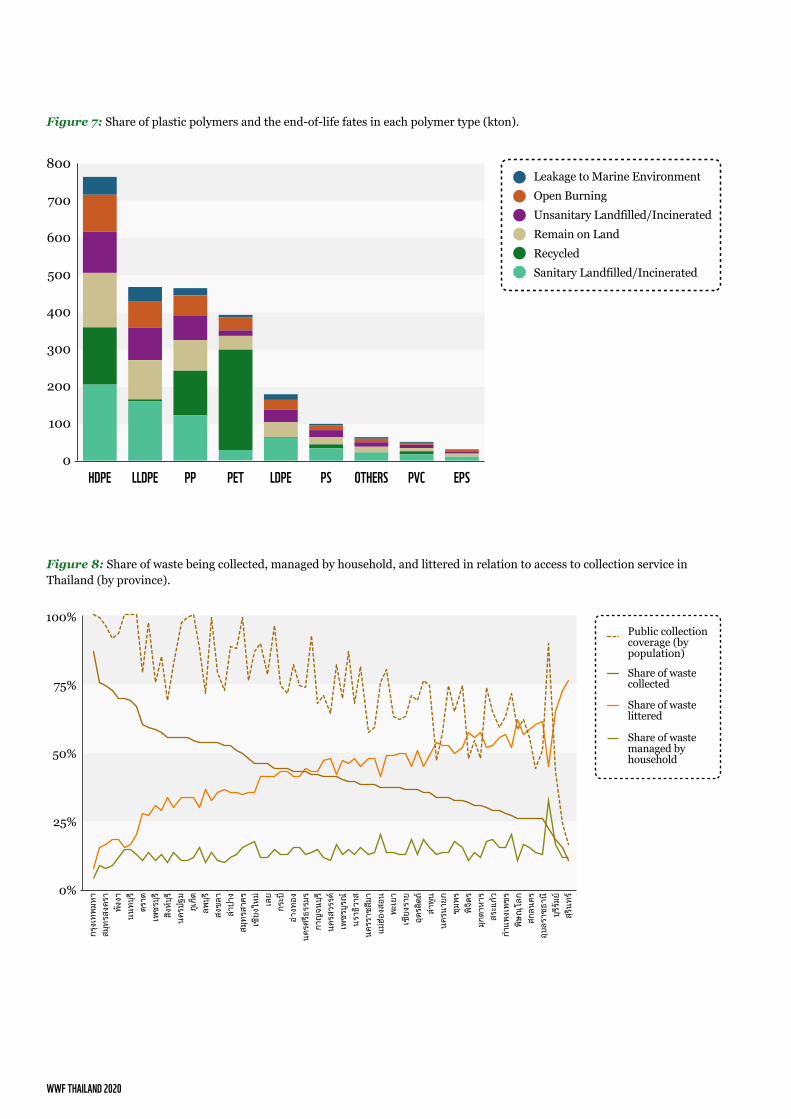
In provinces in the Northeast region (e.g. Surin, Sisaket, and Buriram) public collection services cover a small portion of the population, leading to high littering rates. Elsewhere, Nakhon Ratchasima and Phitsanulok have the highest littering per capita and Nakhon Ratchasima has the highest amount of litter in the country. Despite collection coverage of 90-100% in Ranong, Rayong, Phuket, and Nakhon Pathom, 30+% of waste is littered in these places. These provinces need to focus on more effective public collection.
Only 12% of packaging waste is separated by households. People neither see the benefits from it nor believe that the separated waste will actually be recycled. There is also no fine or penalty related to sorting (the current scheme is still voluntary).
Households don’t know what is recyclable. For example, due to recent publicity about a plastic bag ban, many think that LDPE bags are not recyclable, when in fact they are. Throwing bags in general waste results in contamination that negates any recovery value. In order to be recycled, LDPE bags must be separated at source, otherwise they are too difficult to recover.
Recycled plastic products are not approved for food-contact packaging due to fear of contamination (including recycled PET). Because the food sector is one of the largest users of plastic packaging, this results in a cycle of lower grade streams of recycling, less investment in recycling, and continued poor collection.
About a quarter of packaging waste is improperly disposed of. This means that packaging is either incinerated/landfilled in unsanitary sites or burned openly in the environment.
1
2
3
4
5
6
7
8
9
Table 1: Thailand’s Plastic Waste Flow.

27
OPPORTUNITIES Although ~ 70% of plastic bottles are already recycled – they make up the highest share of recycled material (72%) – Thailand still has about 180 kton of bottles left uncollected. There are many different uses for recycled bottles (see Wat Chat Daeng), some of which bring significant economic benefits.
Most trays and boxes, particularly those made from Polypropylene (PP), can be recycled, but most households do not know that so they throw them in general waste (C. Tantisirirak, personal interview, March 20, 2020).
Our MFA model found that provinces with public-collection coverage for at least 75% of the population are likely to have more waste collected than littered. This could be a tipping-point for setting provincial coverage targets. Thailand’s Roadmap on Plastic Waste Management 2018-2030 identified this same issue as one of the most critical.
Snack bags and plastic bags can be recycled only if they are separated by households. It is not feasible to capture them through other processes (i.e. crew separation and scavengers) because they are too contaminated and too low in value.
Some recyclables are separated and collected at source by households and offices, and either directly sent for recycling or sold through private waste collectors. Improving separation yield can prevent improper disposal of packaging waste and its leakage to the environment.
Garbage collection crews usually separate recyclables to get additional income of ~10K THB per month. However, because these crews work under time pressure, they separate only easily identifiable and salable materials. Adjusting collection systems could enable them to recover more recyclable materials.
Waste pickers play an intermediate role by collecting littered waste or waste that the public sector does not collect and sending it for recycling. If they were formally registered as workers or partners with the government and incentivised to collect waste with lower recycling value, waste pickers could better support the public sector in improving the effectiveness of packaging waste collection.
Similar to waste pickers, scavengers are the result of ineffective waste collection systems and infrastructure. Scavengers help divert some recyclable wastes from landfill. However, they are exposed to increased health and safety risks due to the nature of their working place and conditions.
10
11
12
13
14
15
16
17
0
100
200
300
400
500
600
700
800
EPSPVCOTHERSPSLDPEPETPPLLDPEHDPE
0%
20%
40%
60%
80%
100%
0%
25%
50%
75%
100%
SCAVENGING WASTEPICKING
MANAGEMENTAT SOURCE
CREWSEPARATION
Public collectioncoverage (bypopulation)
Share of wastelittered
Share of wastemanaged byhousehold
Share of wastecollected
Leakage to Marine EnvironmentOpen BurningUnsanitary Landfilled/IncineratedRemain on LandRecycledSanitary Landfilled/Incinerated
BottlesTrays/Boxes/CupsOthersCaps/Cap RingsBagsSnack Bags/Pouches
Figure 6: Composition of packaging collected for recycling across different activities.
WWF THAILAND 2020
0
100
200
300
400
500
600
700
800
EPSPVCOTHERSPSLDPEPETPPLLDPEHDPE
0%
20%
40%
60%
80%
100%
0%
25%
50%
75%
100%
SCAVENGING WASTEPICKING
MANAGEMENTAT SOURCE
CREWSEPARATION
Public collectioncoverage (bypopulation)
Share of wastelittered
Share of wastemanaged byhousehold
Share of wastecollected
Leakage to Marine EnvironmentOpen BurningUnsanitary Landfilled/IncineratedRemain on LandRecycledSanitary Landfilled/Incinerated
BottlesTrays/Boxes/CupsOthersCaps/Cap RingsBagsSnack Bags/Pouches
Figure 7: Share of plastic polymers and the end-of-life fates in each polymer type (kton).
Figure 8: Share of waste being collected, managed by household, and littered in relation to access to collection service in Thailand (by province).

29
3.2 CRITICAL ISSUES AND OPPORTUNITIES FOR THAILANDOur analysis of plastic waste flows shows that many factors from policy to consumer behaviour to financial incentives can be addressed to improve the efficiency of Thailand’s plastic waste management.
TACKLING BAGS AND BOTTLES IS PARAMOUNTPeople in Thailand consume and generate about 2.5 million tonnes of plastic packaging waste a year, roughly the weight of 1.8 million cars. This waste is dominated by just two products: plastic bags and bottles, which together account for 60% of total plastic packaging waste. While the mass of plastic bag waste is almost double that of plastic bottle waste, few bags are collected for recycling as they are lightweight and often too contaminated for recycling.
Bags constitute the majority of packaging waste that ends up in disposal sites and the environment. In contrast, most plastic bottles (70%) are collected for recycling as they have much higher recycling value. PP trays and boxes are also valuable in the recycling market (especially when they are clear); however, because they are less familiar to households, they are often discarded as general waste, leading to contamination and preventing economic recycling. This suggests that Thailand’s future scheme should not only address brand users of consumer packaging such as trays, bottles and jugs but also include all kinds of plastic bags, including reusable plastic bags.
SEPARATION AT SOURCE CAN SIGNIFICANTLY SCALE UP RECYCLINGOnly 12% of packaging waste is separated by households, many of which are not sure what is recyclable. Many types of packaging waste, including bags, can be recycled if they are properly separated and managed at household level. This is because they are less exposed to contamination – compared to when they are treated as general waste – and have a lower chance of getting lost or carried away by wind or rain water. This indicates a clear and substantial opportunity for Thailand to significantly increase recycling through public awareness raising and education campaigns. Further
engagement is needed to encourage people to sort their waste, increase awareness of the issues and encourage waste separation, but these programmes must overcome a lack of accountability from citizens and incidents of blaming others for any issues (Yukulang et al., 2017).
INCREASED PUBLIC COLLECTION REDUCES LITTERINGLittering is the main cause of plastic waste in Thailand. The MFA at the provincial level shows that provinces with public collection coverage of at least 75% of their population are likely to have higher levels of waste collection than littering. This could be a tipping point in policy-making to improve waste collection in Thailand’s provinces. Furthermore, the Northeast provinces are the regional hotspot for intervention as they generally have low public collection coverage. A complementary plastic waste management scheme for Thailand could bolster collection by directing funds towards enhancing collection and waste management efforts.
INCORPORATE THE INFORMAL SECTOR TO IMPROVE EFFECTIVENESSWaste pickers play an intermediate role in plastic waste management by collecting littered waste, or waste that the public sector does not collect, and sending it for recycling. If they were incentivised to collect waste with lower recycling value, they could support the public sector in improving the effectiveness of packaging waste collection. Similar to waste pickers, scavengers help divert some recyclable waste from landfill. However, they are exposed to increased health and safety risks due to the nature of their work sites and conditions.
2.5 million tonnes of plastic packaging
= The weight of1.8 million cars

WWF THAILAND 2020
Incorporating informal waste collectors into formal collection services would assist in expanding coverage areas of public collection crews. More valuable end markets for these waste materials could be created to incentivise separation and recycling. More effective collection could be achieved through a cohesive partnership between the informal sector and LAOs, streamlining waste collection methods and generating purer waste streams.
Furthermore, incorporating the informal sector into public waste collection can alleviate poverty, streamline waste
collection and improve public health by providing waste collectors with the knowledge and equipment to safely perform their work. In several countries, waste collectors play a key communication and education outreach role, through their direct engagement with households and other waste collection points (such as offices and schools).
Many countries around the world have developed models for incorporating the informal sector into national waste management efforts, as shown in Box 3 below.
Three models have proven successful in the formalisation of waste pickers: microenterprises, cooperatives and public-private partnerships. These are mechanisms that the EPR scheme in Thailand could imitate.
• In Pune, India waste pickers organised into a union in 1993, which became in 2002-2003 a wholly worker-owned cooperative that could be contracted by the City for waste management (Chikarmane, 2012). At that time, the Municipal Corporation of Pune adopted the Scheme for Medical Insurance for all registered waste pickers in its jurisdiction (Chikarmane and Narayan, 2009). In Pune alone, nearly 118,000 tonnes of materials were recovered by the informal sector annually, diverting 22% of recyclables away from landfills in 2006. In monetary terms, the net environmental benefit from the informal sector is calculated as US$ 3,615,900 for that same year (Scheinberg et al., 2010).
• In Mexico, microenterprises have been the most common form of formalisation. A study in three Mexican cities found that nearly 3,000 informal
collectors collect 353,000 tonnes of waste a year, earning up to five times the minimum wage. They tend to invest in pushcarts and pickup trucks, making their work more productive.
• Cooperatives are most numerous in Latin America. Brazil alone has more than 500 waste picker cooperatives, with more than 60,000 members. COOPAMARE, one of the most important cooperatives, collects and sells about 100 tonnes of recyclables a month, at lower costs than the city recycling programme. Its members earn $300/month, twice the minimum wage.
• Public-private partnerships became a successful form of formalisation in Colombian cities. Municipalities, together with the central government, provided infrastructure and equipment, while waste pickers provided labour. In Bogotá, a partnership has been formed to operate a recycling plant, managed by the Bogotá Association of Waste Pickers, where the municipality takes recyclables separated at source.
Box 3: Formalisation of Waste Collectors.
These findings point to multiple opportunities, as well as challenges, to instigate impactful and lasting change in Thailand’s plastic waste management. In particular, the scale and breadth of these issues call for a systematic shift and evolution in the dynamics of waste management.
Based on our knowledge of plastic waste management schemes from around the world, and on information gathered
from our interactions with key stakeholders and local experts, we have identified Extended Producer Responsibility as one model that could enable Thailand to recycle and recover 100% of target packaging by 2027.
In the following sections we outline the appropriateness of this model to Thailand’s context and set out key considerations and a call to action for making it possible.

31
3.3 EXTENDED PRODUCER RESPONSIBILITY: A PROMISING OPTION FOR SCALING UP THE PLASTIC CIRCULAR ECONOMY IN THAILANDExtended Producer Responsibility (EPR) belongs to a family of approaches aimed at eliminating waste and promoting the continual use of resources. It is often considered a cornerstone of the transition towards a circular economy. It is a tool with the potential to provide economic incentives for producers and manufacturers to better design their products, while better implementing the Polluter Pays Principle (see Box 4 below) and penalising non-circular products. What is more, EPR is one of the few circular approaches that can unlock significant financial resources for improving public waste management systems.
Waste handling issues are managed based on the Polluter Pays Principle of societal fairness, where the companies that sell packaging or packaged goods into the market are responsible for financing the end-of-life handling of these materials. EPR schemes use this principle to relieve municipal budgets and reduce the environmental impact of waste treatment.
Box 4: The Polluter Pays Principle.As such, EPR schemes are increasingly popular around the globe, including in Asian countries such as India, South Korea and Taiwan. Besides an impressive track record of holding manufacturers accountable for the end-of-life impacts of their plastic products and packaging, EPR schemes can provide a range of important environmental, economic and social benefits as shown in Box 5 below.

WWF THAILAND 2020
To realise these benefits, EPR schemes need to be suitably tailored to local conditions, priorities and stakeholders. As such, an understanding of behaviour, current infrastructure, policies and how stakeholders collaborate in their roles and responsibilities is crucial. EPR schemes are not “plug-in” approaches that can be applied in a standardised way; they should be carefully crafted to respond to local issues and stakeholders through collaborative and inclusive efforts.
Creating Awareness: EPR schemes foster and strengthen societal awareness of packaging waste and waste management issues, encouraging behaviour change towards increased separation at source.
Incentivising Eco-Design: EPR systems can incentivise manufacturers to design resource-efficient, recyclable products to best support high-value recycling.
Scaling Up Recycling: EPR systems increase the effective collection and environmentally sound treatment of packaging waste. As such, an EPR implemented in Thailand could enable the country to reach its goal of 100% of target materials recycled by 2027.
Pollution Control: A core result of successful EPR systems is the prevention of (plastic) packaging pollution in nature, while limiting other negative environmental impacts such as greenhouse gas emissions (from improper disposal mechanisms such as open burning or direct from landfill).
Private Sector Investment/Commitment/Action: Mandatory EPR schemes ensure that all obligated companies contribute resources to waste management, improving overall commitment to this topic by eliminating “free-riding” companies who have yet to contribute resources or actions towards end-of-life management for their products.
Co-benefits of incorporating the informal sector include:
Poverty Alleviation/Job Creation: By formalising and supporting the work of waste pickers through cooperatives, many waste pickers see their income increase and become more stable. This amplifies Thailand’s progress towards SDG 1: No Poverty.
Public Health: Providing resources and personal protective equipment to waste pickers can significantly improve public health, as these workers commonly work in dangerous or unhealthy environments.
Gender Equality: A large proportion of waste pickers are women. By recognising their work and empowering these women to become safer and more productive, Thailand can expand progress towards SDG 5: Gender Equality.
Box 5: Key Benefits of EPR Schemes.

33
3.4 COMMON CHARACTERISTICS OF SUCCESSFUL EPR SCHEMEIn the Technical Analysis, we provide an overview of selected local and international experiences in circular approaches and EPR. While EPR schemes vary from country to country, several characteristics are common to the most successful EPR schemes in operation:
• Transparent supervision is crucial in order to build trust in the scheme amongst consumers, industry and waste management stakeholders. Many stakeholders will resist or ignore an EPR scheme if there is insufficient clarity about the use of funds.
• Mandatory participation is crucial, with clearly defined material categories and management targets. While voluntary initiatives may be a first step, mandatory participation with shared financial responsibility creates a level playing field amongst obligated companies and lays foundations for effective action at the national level.
• Clear role definition among all actors in the plastic waste management chain is vital. EPR schemes work best when embedded in comprehensive visions, policies, regulations and initiatives.
• The inclusion of all relevant stakeholders enables collaboration, trust-building and a shared understanding of waste issues.
• System readiness is essential to consider in the initial phases of EPR implementation (ASEAN, 2020). Information on waste flows, pilot-testing, professionalisation of the waste sector, infrastructure requirements, exploration of relevant recycling technologies, government mandates and enforcement mechanisms are all important components of the system that must be taken into account when introducing an EPR scheme in Thailand.
• Sustainable fee structures are crucial to ensure fairness and cost internalisation. Cost internalisation refers to the process whereby the costs of managing waste are included in the price of a given product, thereby ensuring that manufacturers and producers optimise plastic packaging for effective waste management. Contributions for sales packaging are usually collected from brand users of materials prior to final sale, while contributions for service packaging for plastic bags are often collected from manufacturers. Contributions are used to reduce costs of waste management for local authorities or subcontracted firms. Fees can be spread across the value chain or levied from the first company in the domestic value chain (producer or importer).
• Cost bridging is applied, which means the scheme should produce enough revenue so that, when combined with existing public budgets, it is sufficient to cover the true cost of end-of-life management of materials in the system, provide educational and awareness campaigns and improve the efficiency and performance of the waste management system.
• A strong fee modulation framework creates the right types of incentives to enable both reductions in total packaging consumption and changes in procurement, design and consumer behaviour.

WWF THAILAND 2020
3.5 ENVISIONING AN EPR FOR THAILANDThere are multiple precedents for Thailand to learn from in exploring a potential EPR scheme. In the Technical Analysis, we share some detailed considerations around potential scope, organisation and function of an EPR scheme in Thailand. These are intended to spark further discussions with and among government, private sector and civil society stakeholders.
While the ultimate goal would be to establish a mandatory EPR scheme in Thailand that is supported by a strong legal framework and enforcement, findings from our analysis indicate that the initial focus should be to maximise participation and standardise reporting and data collection. Once the legal and organisational structure of the scheme is in place, it can begin to effectively combat packaging waste by collecting contributions and diverting funds to critical hotspots in the waste system.
To make this work, the scheme would consist of:
• Broad stakeholder engagement, from designing a locally appropriate scheme to supporting implementation and transparent monitoring.
• A defined scope for who is required to participate, how and what is covered. In Thailand’s case, it is suggested that an EPR scheme should cover consumer packaging of all materials with particular attention paid to plastic bags and plastic bottles.
• A central monitoring and supervising organisation (the PRO) with an independent governance structure.
• A financial framework. Proper financial means provided by the required companies (a functional fee system), used to ensure proper disposal.
• An operational plan for data collection and monitoring, managing partnerships and allocating resources (education, recycling projects, etc.).

35
3.6 A CALL TO ACTIONThe plastics crisis continues to be an urgent issue of human health, environmental health and livelihoods the world over, and especially in Thailand. Urgent action is needed to address the root causes of plastic pollution to save the oceans and livelihoods that depend on them.
First and foremost, this requires concerted and collaborative efforts to further explore the potential of a national EPR scheme in Thailand, to bolster and scale up ongoing local and national efforts to achieve zero plastic waste.
In this final section, we outline our commitments to supporting these collaborations and engagements and set out a call to action for three key stakeholder groups: government agencies, business and public-private organisations, NGOs and supporting organisations.
GOVERNMENT AGENCIESThe Thai government has already accelerated its response to the plastics crisis by moving its proposed plastic bag ban from 2022 to 2020. To follow up on this, it is suggested the government continues to support and expand the activities of the EPR Working Group; in particular, integrating the informal sector into ongoing consultations. Responsibilities of this group could include developing new information on waste flows, exploration and pilot-testing of relevant recycling technologies, assessment of infrastructure requirements, professionalisation of the informal waste sector, a review of policy, regulatory, legislatory and enforcement frameworks and identification of appropriate models for incorporating the informal sector.
To provide clear leadership, a single agency could be designated responsible to lead efforts to eliminate plastic pollution.
Invest in data collection for system readiness.
• Develop and publish unified national goals for improved recycling rates and zero litter, calling on industry to join the nation in this effort.
• Accelerate development of a mandatory EPR scheme to keep the Roadmap on Plastic Waste Management, 2018-2030 on track despite increases in waste imports and increases in waste generation from COVID-19. At a minimum, the scheme should include bags, bottles and low-value plastics, as well as incentivising eco-design.
• Additional first steps that the government could take include reducing plastic waste imports, providing collection bins for all communities and enacting laws that allow for recycled PET to be used in food-grade packaging, following the food safety regulations of other regions such as the European Union.
• Finally, all levels of government should recognise informal waste workers as legitimate public servants, announce their intention to support this group with their work in order to reach recycling targets and actively support their formalisation into legal groups.
BUSINESS AND PUBLIC-PRIVATE ORGANISATIONSBusiness and public-private organisations can use industry groups and associations to meet with the national government and engage in discussions about designing a transparent and fair EPR scheme to solve the plastic waste crisis. Additionally, individual businesses should speak with LAOs and waste collectors serving their offices and production facilities about properly separating and selling their waste. Partners like GEPP or Wongpanit Company can assist in these efforts.
NGOS AND SUPPORTING ORGANISATIONSWWF, NGOs and supporting organisations (think tanks, universities, etc.) should coordinate with other NGOs at the international, regional and national level to build awareness and support efforts to eliminate plastic waste in Thailand. This means sharing this work and the underlying reasoning behind it and presenting a unified message about plastics and waste management to the government, businesses and citizens of Thailand.

WWF THAILAND 2020
3.7 A POTENTIAL ROADMAP TOWARDS A NATIONAL EPR SCHEMEImplementation of an EPR scheme in Thailand would need to be accelerated in order to match the scale of the plastic waste issue and to contribute to the achievement of Thailand’s Roadmap on Plastic Waste Management, 2018-2030.
While the proposed roadmap described below might seem ambitious, it is envisioned as a starting point to give an idea of some of the most important actions required over the next 7 years. It is expected that the roadmap would need to evolve with input and exchange between local experts and key stakeholders over the course of planning and implementation.
To this end, it is suggested that the pathway to implementation could follow five main stages:
1. Initiate a stakeholder engagement process with the private sector, government agencies, civil society and the informal waste sector to agree to overall goals and principles. During this stage, stakeholders could agree to annual targets for reducing plastic consumption and for collecting and recycling plastic waste. These targets will help determine the EPR scheme’s contributions to the Roadmap on Plastic Waste Management, 2018-2030.
2. Create the legal framework to enable an EPR scheme and require participation by obligated companies.
3. Finalise the EPR scheme with stakeholders and enshrine it in law including such aspects as: materials considered, contribution calculation and determining obligated companies.
4. Begin data collection, registering obligated companies and initiating legal compliance monitoring activities to reduce free-riders.
5. Implement the full EPR system with modulated contributions in place.
The table on the next page provides an idea of how these stages could be phased over the next 7 years.
While the first half of this report is intended to raise awareness, deepen understanding and empower conversations with and among policymakers, the private sector and supporting organisations, the second half that follows - the Technical Analysis - will be useful for those more closely engaged in the design and implementation of the plastic waste management system and/or circular strategies. Here we present the methodology, data driven analysis and key considerations for scaling up circular strategies to meet national targets on zero plastic waste.

37
Table 2: Roadmap to a Thai EPR Scheme.
2020-2022
Present this report to MONRE, PCD, DIW, PPP Plastic and other key stakeholders.
Host an event with key stakeholders including the EPR Working Group.
Form a PRO advisory board.
Begin incorporating the informal sector into local authority waste collection systems and define their role in the future EPR.
Expand activities and membership of the EPR Working Group.
2022-2024
Design the initial framework of the EPR scheme.
Create a legal framework for EPR.Mandate participation by law.
Establish a PRO, register companies.
Incorporate the informal sector into public waste collection in all major population centres and through a technical group of the PRO.
Begin data collection and transparent reporting.
Publish specific national targets for reduction, collection and/or recycling of the target materials.
2024-2027
2025: Proposed start of contributions.
2027: 100% of targeted materials collected & recycled.
Create new financial incentives for eco-design, circular business models and reduction of waste generation.

WWF THAILAND 2020
39
SCALING UP CIRCULAR STRATEGIES TO ACHIEVE ZERO PLASTIC WASTE IN THAILANDPART II: TECHNICAL ANALYSIS

WWF THAILAND 2020
04
ENVISIONING AN EPR FOR THAILAND: KEY CONSIDERATIONS

41
There are various precedents for Thailand to draw inspiration from while exploring options for a potential EPR scheme. We share some key experiences and considerations here, which are intended to provide frameworks and conversation points around a possible EPR scheme for Thailand.
4.1 CIRCULAR STRATEGIES ON THE GROUND: FROM LOCAL TO INTERNATIONALWWF facilitates multi-national and local companies’ creation of a circular economy for plastics and packaging, alongside supporting government entities such as MONRE, DEQP and PCD to implement EPR systems.
A number of other public and private entities in Thailand are also involved in both small and larger-scale initiatives to increase recycling and reduce plastic waste. A selection of these experiences are described below, with the aim of initiating further discussion around their relative strengths and weaknesses, as well as their potential to be incorporated into a future EPR scheme in Thailand.
4.1.1 LOCAL INITIATIVES1. The Wongpanit Company: A Market-Driven Business
The Wongpanit Company is an organisation in Phitsanulok that buys recyclable materials from communities. It started with support from the German Corporation for International Cooperation (Gesellschaft für Internationale Zusammenarbeit or GIZ) and the Municipality of Phitsanulok, collecting significant volumes of waste (over 140 tonnes of waste per day by 2009 (Chikarmane and Narayan, 2009)). Wongpanit has ~180 franchises enabling small suppliers to join the company as franchisees in exchange for a small fee. It has grown nearly 10% per year this way, supporting small waste collectors and improving the collection and sorting of valuable waste in Phitsanulok. In addition, the municipality provides waste bins to households and along roadsides to facilitate the separation of valuable waste for pickers and itinerant buyers. The municipality also trains franchisees in safe waste picking practices, acknowledging the health hazard posed by waste handling at roadsides and dumping sites.
2. Various Waste Bank Initiatives
Waste Bank Initiatives have been a positive example of synergies between different stakeholders for waste management and recycling. Diverse Waste Bank Initiatives have been widely implemented in Thailand for over 10 years by various private and non-profit organisations. Elementary and secondary school students bring recyclables from their homes and then schools sell the valuable material, both strengthening local recycling and teaching students about material recovery. Organisations like the Wongpanit Company and SCG Chemicals have supported Waste Bank Initiatives together with public entities, by helping students understand the economic value of waste when they directly benefit from the cash flow obtained from selling waste materials and developing supporting applications such as Koomkah. Recently, Waste Bank Initiatives have been expanding as they are fairly cost effective, requiring relatively small initial capital investment for proper storage, sorting space and procuring measuring devices for recovered materials and the revenue obtained from selling recyclables.
3. GEPP
GEPP aims to increase business and household recycling, while providing governments with data on waste collection. GEPP provides education for households on sorting waste, as well as collection services to allow households and waste pickers to earn an income selling recyclables. Once a school, restaurant, or household has sorted their recycling, a pick up can be scheduled through a web service and the city will send a waste collector. Data on the waste collected is then given to cities and governments to help them design better waste management programmes and solutions.

WWF THAILAND 2020
4. TerraCycle Global Foundation
TerraCycle Global Foundation was formed in 2018 to help solve the current plastic packaging issues which are severely affecting aquatic systems. Currently, the foundation is supporting local communities in Thailand to enable waste collection and capture pollution debris. In Thailand, they were able to locally design, source and develop a device named “The River Trap” which captures plastic debris in the Tha Chin river before it reaches the ocean. “The River Trap” is an easily transportable, adaptable and affordable solution, which can be easily scaled-up for deployment in many other river systems in Thailand and South East Asia.
5. Ford Resource and Engagement Center (FREC)
In the latter half of 2019, the Ford Resource and Engagement Center (FREC) opened its doors in Bangkok, the fifth of its kind in the world. The Ford Motor Company is investing THB 53 million (US$ 1.75 million) by 2023, to create a space for social enterprises, NGOs and foundations to run programmes, many of which are waste-related. An example of one of these programmes is Precious Plastic Bangkok, a community-based plastic recycling solution which uses simple-to-build machines to turn plastic waste into new products. At the FREC, Precious Plastic Bangkok is training individuals to manage and recycle plastics themselves, to help change society’s attitude towards plastic waste.
6. Thailand Public Private Partnership for Sustainable Plastic and Waste Management (PPP Plastic)
PPP Plastic has placed its focus on infrastructure, education, innovation, policy and legislation, database creation and funding in order to change the plastic system in Thailand. PPP Plastic has outlined activity plans for each focus area,
aiming to end plastic waste. A shift in infrastructure has focused on building a plastic circular economy, creating different circular economy business models like the PPP Plastic-Rayong Model. This incorporates 68 municipalities in Rayong province over a period of 5 years to sort waste by type and sell to recycling and other reutilisation businesses. Using workshops, education and data collection, the model is aiming for zero plastic waste to landfill by 2023. In addition, PPP Plastic (“Magic Hands”) has joined the WON project operated by TPBI (formerly Thai Plastic Bags Industries), expanding drop-off points to 300 areas in Bangkok and its vicinity in June 2020.
PPP Plastic also emphasises innovation to reach the overall aim of reducing Thailand’s plastic marine debris by at least 50% by 2027. These technologies have concentrated on mechanical recycling methods, chemical recycling methods and physically reducing plastic waste in public waterways. An example of this is the “Plastic Road”, where at present roughly 3 metric tonnes of plastic waste has been recovered and used to pave roads (PPP Plastic, 2019).
7. Wat Chak Daeng
This Buddhist temple in central Thailand has been managing a campaign for plastic bottle donations, which are then processed into synthetic fibres and used to make robes. The upcycling initiative saved 40 tonnes of plastic in its first year of operation, providing jobs for locals and income for the temple. In addition to PET bottles, Wat Chak Daeng also processes other types of waste including plastic bags, beverage cartons, glass bottles, styrofoam, paper, paper cartons and aluminium cans (Boonbandit, T., September 18, 2019).
These schemes all demonstrate models with significant positive impacts that merit further investigation to understand their potential for replication and scaling up alongside, or as part of, a nation-wide EPR scheme.

43
4.1.2 INTERNATIONAL INSPIRATIONHere we highlight a selection of EPR models from across the world to provide a snapshot of their potential.
CHILEIn 2016, Chile was one of the lowest-rated countries for environmental quality within the OECD. Waste management was its second largest
environmental problem. Policymakers passed the “Waste Management, Extended Producer Responsibility and Recycling Initiatives Bill” in 2016, establishing an EPR system to get private companies to share the financial burden of waste handling, developing the recycling industry and formalising waste pickers. Notably, this legal framework acknowledges the fundamental role played by the informal sector through a certification and accreditation scheme for waste pickers. It aims to improve the recycling rate of plastics from the current 8.5% to over 40% by 2034 (ASIPLA, 2019).
SOUTH KOREAIn South Korea, packaging producers work closely with government officials to reduce the high levels of waste generation in the country. The board of the Korea Packaging Recycling Cooperative (Korea’s PRO) and the government collaboratively determine the cost of annual fees to finance collection and recycling activities. Despite a plastics recycling rate of over 44% in 2018 (Statista, 2020), the Korea Marine Environmental Management Corporation found that waste on Korean beaches was more than 80% plastic; however, the location and causes of plastic waste leaking into oceans and rivers remains relatively unclear (Yong-Chul et al. 2020).
The EPR system in South Korea relies on a rudimentary sorting and separation method, which is labour intensive. While recycling subsidies have improved downstream waste treatment infrastructure, they have yet to provide a strong increase in efficient recycling activities, improved working conditions, or improved quality of the recycled products introduced to the market. The Korean Ministry of Environment (MOE) identified several improvement opportunities to improve the current scheme, such as making all coloured drink bottles colourless to facilitate mechanical recycling and expanding the number of target products from 43 to 63 by 2022 with the aim of reducing plastic waste generation by 50% by 2030 (Yong-Chul et al. 2020).
TAIWANIn 1988, Taiwan became an early adopter of EPR in Asia, requiring manufacturers and importers to register with the Environmental Protection Administration to report sold or imported products and calculate their corresponding fees. Despite complexities in the reporting and fee calculation procedures, the scheme has been tremendously successful in financing recycling programmes (building a multi-billion-dollar recycling supply chain which collects a yearly average of ~NT$ 7 billion (US$ 232 million) from manufacturers and importers) and increasing local waste collection and treatment infrastructure. These funds created the conditions to decrease daily per capita waste disposal from 1.14kg to 0.40kg per person in 2015. Taiwan emphasises enforcement through the “Waste Disposal Act,” which has clear penalty provisions for non-compliance, failure to pay recycling fees, submission of false information and inaccurate fee calculation data.
BELGIUMIn 1996, Belgium developed an EPR scheme that has led to one of the highest recycling rates in Europe in 2019, as well as waste prevention programmes around the country (Eurostat, 2019). Belgium divides the scheme between the “Fost Plus” PRO for household packaging (including from fast food and online sales) and the Valipac PRO for industrial and commercial packaging. Fost Plus has ~5,000 member organisations that pay fees for collection, sorting and recycling. By law, any company that introduces more than 300 kilograms of consumer packaging per year to the Belgian market must join Fost Plus. Moreover, 10% of Fost Plus’ annual budget funds education and awareness campaigns for litter prevention. Belgium aims to recycle 65% of all plastic packaging by 2023 and is soon expanding its EPR system to include flexibles, films and mixed plastics (EEA, 2019).
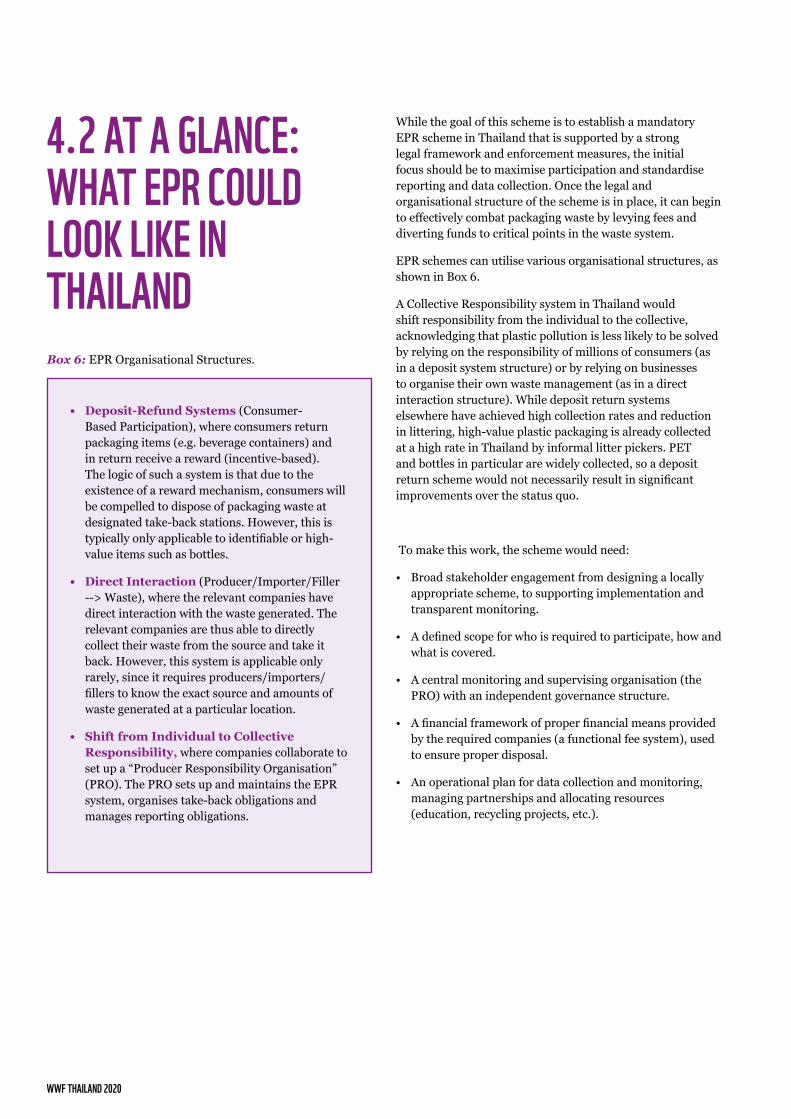
WWF THAILAND 2020
4.2 AT A GLANCE: WHAT EPR COULD LOOK LIKE IN THAILAND
While the goal of this scheme is to establish a mandatory EPR scheme in Thailand that is supported by a strong legal framework and enforcement measures, the initial focus should be to maximise participation and standardise reporting and data collection. Once the legal and organisational structure of the scheme is in place, it can begin to effectively combat packaging waste by levying fees and diverting funds to critical points in the waste system.
EPR schemes can utilise various organisational structures, as shown in Box 6.
A Collective Responsibility system in Thailand would shift responsibility from the individual to the collective, acknowledging that plastic pollution is less likely to be solved by relying on the responsibility of millions of consumers (as in a deposit system structure) or by relying on businesses to organise their own waste management (as in a direct interaction structure). While deposit return systems elsewhere have achieved high collection rates and reduction in littering, high-value plastic packaging is already collected at a high rate in Thailand by informal litter pickers. PET and bottles in particular are widely collected, so a deposit return scheme would not necessarily result in significant improvements over the status quo.
To make this work, the scheme would need:
• Broad stakeholder engagement from designing a locally appropriate scheme, to supporting implementation and transparent monitoring.
• A defined scope for who is required to participate, how and what is covered.
• A central monitoring and supervising organisation (the PRO) with an independent governance structure.
• A financial framework of proper financial means provided by the required companies (a functional fee system), used to ensure proper disposal.
• An operational plan for data collection and monitoring, managing partnerships and allocating resources (education, recycling projects, etc.).
Box 6: EPR Organisational Structures.
• Deposit-Refund Systems (Consumer-Based Participation), where consumers return packaging items (e.g. beverage containers) and in return receive a reward (incentive-based). The logic of such a system is that due to the existence of a reward mechanism, consumers will be compelled to dispose of packaging waste at designated take-back stations. However, this is typically only applicable to identifiable or high-value items such as bottles.
• Direct Interaction (Producer/Importer/Filler --> Waste), where the relevant companies have direct interaction with the waste generated. The relevant companies are thus able to directly collect their waste from the source and take it back. However, this system is applicable only rarely, since it requires producers/importers/fillers to know the exact source and amounts of waste generated at a particular location.
• Shift from Individual to Collective Responsibility, where companies collaborate to set up a “Producer Responsibility Organisation” (PRO). The PRO sets up and maintains the EPR system, organises take-back obligations and manages reporting obligations.

45
4.3 SCOPE OF OBLIGATED COMPANIESThe primary organisations that should be obligated to register with the PRO and contribute fees to the EPR scheme are brand users of packaging (of all materials), expanding to include importers of packaging and importers of plastic waste. Given the findings of our MFA, it is critical that all plastic bags and plastic bottles are covered by this scheme. To facilitate a phased implementation, we propose starting with packaging materials for consumer products (consumer sales units, or CSUs) and plastic bags as a first step. It is crucial that the growing number of online sales and delivery businesses are included in registration with the PRO. If stakeholders prefer a phased approach, later expansions should include other uses of plastic, including plastic consumer products, importers of plastic waste and industrial uses of plastic, as well as other packaging materials.
In order to cover all plastic bag usage, fresh markets, shops, food stores, etc. would need to be considered as well. In this case, it is easier to oblige plastic bag manufacturers to pay financial contributions to a PRO (this is recommended for “service” packaging like plastic bags). Further stakeholder engagement is needed to determine whether importers of plastic packaging should also be obligated to participate, as this packaging is often accounted for by brand users; however, there are several schemes in which multiple actors in the value chain contribute fees for the same material and this may be a desirable way to accelerate the development of an effective waste management system.
The EPR scheme should facilitate participation by the informal sector through a technical support group within the PRO. This group will support the work of informal waste collectors and ensure that they have input on waste management decisions and improvements. The PRO will facilitate the formation of legal entities (co-ops, unions, etc.)
for informal waste collectors and direct resources towards capacity building to increase the efficacy and safety of waste collection by these groups. Such models have seen success in Chile, in Pune, India, and in Chiang Mai (where GEPP is running a pilot programme). Later, this technical support group will serve as the informal sector’s voice in waste management decisions and infrastructure development.
The technical support group for the informal sector within the PRO should become the champion of informal waste collectors. Moreover, it should engage with the Ministry of Public Health, LAOs, scrap traders and waste picker unions in order to ensure the provision of contributory social security, medical insurance, maternity benefits and old-age pensions. In addition, it can provide training, guidance and other support directly to waste picker organisations on business modelling, activity planning and health and safety practices in waste collection. Here, it makes sense to enlist the support of the Ministry of Public Health to provide input and support for increasing health measures for waste management workers (both informal waste pickers and family recycling/junk workshops).
LAOs and the Ministry of Public Health should work together with the PRO to develop fundraising mechanisms that finance basic social welfare benefits, such as occupational healthcare for informal waste collectors. Additionally, LAOs and provincial authorities can provide land space for decentralised processing of organic waste (e.g. bio-methanation and composting), recycling sheds, material recovery facilities, storage of recyclables, intermediate processing and other activities associated with informal waste collection.
Because informal waste collectors are so vulnerable to price fluctuations for recycled materials, the PRO will coordinate with government entities to set up contracting or financial support systems to ensure that all recyclable material covered by the EPR scheme is separated and collected regardless of market fluctuations. Incorporating the informal sector in this way brings social, environmental and economic benefits by improving livelihoods among the most vulnerable sectors in Thailand, increasing the efficiency and efficacy of recyclable material collection and reducing the amount of waste that is burned, landfilled, or leaked into nature.

WWF THAILAND 2020
4.4 GOVERNANCE STRUCTUREWe propose establishing a single producer responsibility organization (PRO) for Thailand. Schemes with multiple PROs show a tendency to “cherry-pick” the most profitable packaging materials and increase the risk of “free-riding.” A single PRO means companies engage with a single entity and streamlines reporting. The industry-owned EPR producer responsibility organisation (PRO) should be defined as “non-profit” or “for-profit-but-not-for-distribution.” This ensures compliance with antitrust laws. If profits are disbursed between shareholders, a monopoly could be put in place (market failure). Non-profit status also ensures that every required company can join, that SME participants receive a
Figure 9: Possible Structure of the EPR Scheme.
PUBLIC-PRIVATE SUPERVISORY ENTITY
LAO’S
ADVISORY BOARD
PRODUCERS
CONSUMERS
PUBLICCOLLECTION
INFORMAL WASTECOLLECTOR’S
RECYCLEDMATERIAL
RECYCLINGFACILITIES
BRAND USERS,IMPORTERS,RETAILERS
SANITARY LANDFILOR WTE
INCINERATIONSeparated
wasteResidue
Residue
Support
Support
Stakeholder input
Training &guiadance
AwarenessCampaigns
Salesreports
PerformanceStatistics
PerformanceStatistics
Training
RecyclingtargetsSeed Funds
Reports
SupportReports
Produce
Sell
Recyclables
Contri-butions
PRO
Material flowFinance flowOperational activitiesTemporary flow
full and equal share for the service and that the interests of inhabitants are served through the organisation’s activities. The suggested scheme envisions a collaboration between the PRO with an overseeing government entity such as MONRE (Ministry of Natural Resources and Environment) to design and maintain a register of obligated companies and associated data such as per company contributions or national waste performance over time.
The responsibilities of each relevant actor or organisation should be clearly defined by law and be unambiguously regulated. In the initial stages of EPR implementation, the government needs to pass laws that authorise the EPR scheme to take action or integrate it into existing legal frameworks. Input gathered through stakeholder surveys indicates that the governance of the EPR scheme is the biggest determining factor for whether a stakeholder will support it or not (N. Thamhatai, personal interview, April 2, 2020; Y. Vityananan, personal interview, April 17, 2020; P. Sutaputra, personal interview, April 22, 2020).

47
All regulatory mechanisms should include a stakeholder engagement process, with multiple industry groups as well as the informal sector. All PRO participants should face clear and equitable obligations to ensure that the regulations do not disproportionately affect SMEs. The legal framework should include monitoring mechanisms that ensure transparency among all stakeholders and prevent corruption. Major decisions taken by the PRO will be reviewed by representatives from NGOs, government, obligated companies and the informal sector.
If they are expected to participate, obligated companies, local governments and the public all demand high levels of transparency with regard to the goals of the EPR scheme, how it uses funds and how it operates. In order to achieve this, the scheme should adopt a two-way audit system which maintains both an appropriate independence among actors and a proper monitoring system. Government stakeholders from agencies like the Ministry of Natural Resources and Environment (MONRE), the Pollution Control Department (PCD) and the Department of Industrial Works (DIW) could aggregate and inspect the quality and completeness of PRO reported data. This arrangement relies on the integrity of public actors to resist corruption and actively fight any type of illegal or improper activity, especially free-riding.
In parallel, the PRO should audit waste generation statistics from LAOs, collection statistics from formal and informal waste collectors and sorters and recycling statistics from processors and recyclers. An independent organisation may also be established as a mediating party between the PRO and local and national authorities. It would monitor the packaging market, waste recovery, tendering and contracting and approval of payments. This has been applied successfully in the Netherlands since 2007 (NEDVANG) and may be necessary if the participating parties feel that a neutral third party is required.
Members of NGOs and various government bodies (such as the Ministry of Industry and the Ministry of the Local Administration) can be included in an advisory board. Stakeholders from the Ministry of Natural Resources and Environment (MONRE), the Department of Industrial Works (DIW) or the Pollution Control Department (PCD) could be responsible for overseeing the PRO in a mutual reporting scheme where a government body supervises the PRO’s activities and sets national recycling rate targets, while the PRO provides reporting on actual waste management performance and contributions collected.
A task force should be established within the PRO to make decisions about how contributions are calculated and where funds are directed. This task force should have an advisory board composed of representatives from obligated companies, government bodies and NGOs. However, waste operators and investors may have a misguided incentive to increase the amount of packaging put on the market; they also have vested interest in funding decisions. For this reason, these stakeholders should not be involved directly in the coordination of the PRO and the PRO should not act as a collector, sorter or recycler itself. Each organisation has its own role and responsibility, respecting competition and antitrust laws.
The diagram on the left (Figure 9) shows a possible structure of the EPR scheme, which would need to be discussed with all key stakeholders through early engagement. It is possible that the proposed entities and flows outlined here would need to be adjusted as Thailand moves towards implementation.

WWF THAILAND 2020
4.5 FINANCIAL FRAMEWORKThe EPR scheme should shift financial responsibility for the impacts of packaging products in the waste stream from local administrative authorities to brand users and eventually to importers and retailers using plastic bags, according to their environmental impacts. Explicit goals should be set for national (plastic) waste generation per capita, the amount of materials that end up in the system, collection and recycling rates and the impacts of the system as a whole. The economic framework should be aligned to ensure these goals are met.
FEE STRUCTUREFees should be collected from obligated companies on a yearly basis and should be determined based on the total contribution to plastic packaging on the market in the previous assessment period. Initial fees should be flat (not modulated by material recyclability) and relatively low to encourage participation and reporting from the outset while establishing the baseline. Fees should, however, be high enough to cover the full costs of managing the plastic packaging waste. Establishing an appropriate framework for eco-modulated fees is highly effective yet difficult due to the complexities and tradeoffs inherent in packaging design choices. The final fee structure should be determined in consultation with the PRO, government bodies and an advisory board of other stakeholders. An example from France is provided in Box 7 on the right. Some general principles for the fee structure should include:
• Organisation size - Costs should not put undue burden on smaller organisations. Typically, under a certain threshold of units sold or revenues generated, reporting guidelines are simpler - organisations may only pay a small flat fee or be exempted altogether.
• Overall mass or volume of materials - Costs for waste management should be internalised, meaning that the largest contributors should cover a higher share.
• Overall consumer sales units (CSUs) - In order to account for lightweight packages, which incur higher costs in waste management, there should be a fee associated with the number of CSUs placed on the Thai market, with the largest contributors covering a higher share.
• Recyclability of materials - Since some costs of recycling can be recovered through the sale of secondary materials, materials that have a lower value typically have higher associated fees. The costs of materials with very low recyclability (such as multi-material laminates) should increase over time to encourage packaging design changes.
• Impacts of materials - Beyond the costs of waste management itself, material production and recycling can result in other impacts with indirect economic costs. Fee modulation by material type can also take these differences into account.
Box 7: EPR Fee Structure by Citeo, France.
• Participants with fewer than 10,000 consumer sales units (CSUs)/year placed on the French market pay a flat fee of 80 euros
• Fee per CSU by sector for participants with less than 500,000 CSUs/year (starting at €0.0627/CSU and adjusted from there)
• Fee based on packaging mass, differentiated per material – steel costs €0.0456/kg for example, while plastics are €0.3463/kg
• Additional “eco-adjustment bonuses or penalties” are applied for undertaking education activities, printing recycling information, if the package is designed to meet local sorting needs, etc.

49
USE OF FEESThe fees collected by the PRO should be by a government body that comprises representatives from various sectors including obligated companies, NGOs and the informal sector. Our analysis indicates funding would be most effectively spent on the following activities:
• The majority of funds should be used for supporting proper waste management by funding organisations responsible for collection, sorting and recycling waste materials. Waste collection funding is particularly needed to prevent litter in rural areas and areas where less than 75% of the population has access to waste services (as in the Northeast). Funding should be used to:
• Ensure that 100% of the population has access to public collection services
• Develop infrastructure for increased collection and household sorting similar to the PPP Plastic-Rayong circular business model
• Informing and creating awareness about the EPR system and source separation of waste and recyclables. A portion of the PRO budget (e.g. 10%) should be used for public educational and awareness campaigns in order to boost recycling and collection rates across the country. Engagement with the informal sector can play a key role here.
• For example, funds could be used to expand PPP Plastic’s education programmes to increase household separation at source
• Providing clear and easily accessible guidance, support and tools to help obligated companies report correctly and reduce their impacts through packaging design, material selection and labelling.
• Including data showing periodic material flow analyses (MFAs) of plastic consumption in Thailand
• Covering the overhead costs of managing the PRO, for example operational costs.
Where recycling and other waste management activities are directly funded, outcomes should be monitored and audited. Where possible, collection and recycling activities should be transparently tendered and contracted.

WWF THAILAND 2020
4.6 OPERATIONS AND ACTIVITIESCOORDINATION WITH WASTE MANAGEMENTThe PRO can play a key supporting role for the waste sector by ensuring that operational work across the country follows strict environmental standards (existing environmental quality legislation, which allows for cross-sectional collaboration among different public authorities). Additionally, the PRO can help create new national standards for identifying collection points and establishing regional waste management priorities.
EDUCATION AND OUTREACHAn important role of the PRO is to raise public awareness directly (for example through packaging and marketing) and contribute to other initiatives doing the same. The PRO should regularly support education in schools and in the informal sector, encouraging participants to transmit their knowledge to their households. This should be coordinated with consumer awareness campaigns run by the government and NGOs to ensure alignment.
RELATIONSHIP WITH REGULATORY AUTHORITIESLegislators and public authorities play an important role in enforcing EPR laws, by setting penalties for non-compliance that exceed the costs of calculated contributions. Therefore, it is important that public authorities dedicate sufficient financial resources to relevant actors to fulfil their duties. In order to close loopholes and penalise free-riding behaviour, meaningful enforcement procedures should be clearly stated and followed.
TRANSPARENCY AND ACCOUNTABILITYTransparent monitoring and reporting are essential components of the EPR scheme that should be operationalised as soon as possible. Before appropriate or differentiated fees can be levied, the PRO needs to provide supporting information, training and tools (e.g. handbooks, decision flowcharts, etc.) to build motivation and capacity for standard reporting activities.
The PRO should have staff experienced in data handling, balances, tendering and contracts. The PRO’s central office should take on such duties, in order to build a streamlined and efficient compliance framework. The PRO should be responsible and transparent in controlling the services and tasks of other involved actors.
In addition to collecting information to share within the PRO and with other parties directly involved in the PRO’s governance, reports should also be made publicly available where possible. For example, annual PRO reports can be published that clearly state all relevant outcomes of the waste management system, such as waste generation, collection and sorting rates, collection and sorting efficiency, reuse rates, contribution calculations and costs incurred.
COMPANY ENGAGEMENTCompanies registered with the PRO should provide feedback on organising data collection in order to minimise the burden and overhead costs, as well as inputs on broader governance. In return, the PRO should work actively with companies to help them increase their knowledge and design products or packaging with low environmental impact.

51
4.7 CHALLENGES AND OPPORTUNITIESIMPLEMENTING THE RIGHT INCENTIVESSo far, EPR schemes have yet to achieve major upstream impacts (eco product design) as was originally expected in their rationale (Watkins et al., 2017). In order to achieve sufficient impact reduction, fees should be higher, linked to absolute impacts and based on the true costs of waste management and environmental impacts (considering factors such as recyclability and life cycle assessment (LCA) impacts).
In the shorter term, fees should cover waste management activities, but in the longer term fees should also reflect other environmental externalities and drive eco-design in companies. This requires a nuanced fee structure that can be simplified into actionable points for producers. Oversimplified metrics can incentivise companies to adopt strategies that result in burden shifting. For example, requiring companies to produce packaging with as little mass as possible (lightweighting) can have unintended negative consequences by reducing the ratio of valuable material to contamination and by shifting towards non-recyclable multi-material packaging.
CONCERNS ABOUT THE FEE BURDENIt is important to address stakeholder concerns about the level of financial contribution they are required to make. For this reason, it is important to involve stakeholders in the decision-making process and establish a clear plan before making the EPR scheme a requirement. Government entities should work with the PRO and other stakeholders to create fee structures that establish a lower flat fee for companies whose contribution in terms of mass and amount of consumer sales units of packaging introduced to the market is below a certain threshold (e.g. in the bottom 5%-10% of contributors). However, this should be balanced with providing sufficient budget to maintain and improve the waste management system.
DATA AND REPORTINGThere is often a lack of comprehensive, validated data across regions in Thailand. This includes relatively little detailed data on imported plastic packaging and on local waste management. It is therefore critical to promote high participation levels and standardised data reporting from the outset, including training and capacity building for all reporting stakeholders. The PRO should also partially or fully reimburse costs of reporting, monitoring and enforcement by local governments. The PRO will need to establish very clear guidelines on what is and is not reimbursable and perhaps set a cap on reimbursements. Through mandatory participation and the abovementioned two-way audit setup, an EPR system in Thailand would also result in significant improvements in the amount, consistency and quality of data collected on waste generation and recycling. This data could then be used to drive economic development, infrastructure, or investment decisions.
THE INFORMAL SECTORThe informal sector’s role is crucial, but it also poses a challenge to coordination as there are deeply embedded informal groups with acknowledged territories, membership, etc. In order to improve waste pickers’ circumstances, we recommend legalising and acknowledging the waste picking profession via creation of legal entities representing waste pickers’ organisations. The informal sector should be provided with education on waste handling, protective equipment and subsidised health insurance. Additionally, a formal organisation should be established (such as a union or co-op) that can participate in contracts or tenders with the PRO and contribute to the PRO decision-making process.
HOUSEHOLD SORTINGLocal administrative organisations receive minimal waste collection funding from the government, meaning they rely heavily on citizen responsibility. This is challenging, as recycling and anti-littering schemes are voluntary. Moreover, greater infrastructure is required to support waste collection, separation and management, streamlining myriad waste collecting groups – each with different collection methods – to increase efficiency. The PRO should provide an opportunity for coordination and outreach and fees should be set at a high enough level to sufficiently support LAOs with their waste management activities.

05
MATERIAL FLOW ANALYSIS METHODOLOGY (MFA)
WWF THAILAND 2020

53
5.1 APPROACH Data on the volume of plastic packaging consumed in Thailand, obtained from IUCN Asia Region (2020), was used to determine the amount of post-consumer plastic waste, assuming that packaging was used and discarded within one year. The share of different resins was modelled on the European market (PlasticsEurope, 2019) and adjusted for the higher share of HDPE shopping bags in Thailand. The share of different types of packaging products was modelled on an MFA study of plastic flows sponsored by the Thailand Public Private Partnership for Sustainable Plastic and Waste Management (Plastics Institute of Thailand and PETROMAT, 2017). In return, we shared the data on waste generation and waste disposal which are the intermediate outputs of the model to IUCN Asia Region’s study. However, the two studies differed in scope. While we focused only on plastic packaging, IUCN Asia Region (2020) covered all types of plastics, many of which were less likely to get recycled in Thailand. It was therefore expected that the recycling rate for plastic packaging would be higher than that of plastics as a whole and that plastic packaging would, proportionally, contribute less pollution than other plastic products. Nevertheless, the sheer volume of resins that were turned into plastic packaging justified the scope of this study.
We used waste data from the Department of Local Administration (DLA)’s database for 2017, which contains data from all 7,753 local governments, to analyse waste collection scenarios. The year 2017 was selected as it constitutes the first year of the DLA’s waste database and better represents the waste trends in Thailand than 2018 – an outlier year due to China’s ban on plastic waste imports, which caused major increases in plastic waste imports for South East Asia (Marks et al., 2020). Despite being perhaps the most complete bottom-up database, DLA’s data lacked consistency, raising questions about data quality and the influence of government targets on reporting. Consequently, we made adjustments using waste data from the Pollution Control Department (PCD) and findings from academic literature to conduct further analysis of waste scenarios. The effects of urbanisation and tourism were accounted for at this stage.
We constructed disposal scenarios from PCD’s database – covering 2,252 disposal sites – and aggregated data to the provincial level. Key assumptions were made based on insights from our local expert in the Circular Economy for Waste-free Thailand research group at Mae Fah Luang University. These assumptions relate to, for example, waste separation from garbage crews, waste picking and scavenging, leakage at different stages, open burning and rejected waste sent for recycling. Sensitivity analyses and a focus-group meeting with other local experts were conducted to validate these assumptions.

WWF THAILAND 2020
5.2 DATA SOURCESWaste data in this study are extracted from the following sources:
3. PREVIOUS MFA STUDIES OF PLASTIC FLOWSIncluding PPC and Plastics Institute of Thailand (PITH) (2018) sponsored by PPP Plastic and GA (2017) sponsored by Coca-Cola Thailand. There is also an ongoing study by EA Environmental Action (EA) commissioned by IUCN Asia Region from which this study obtained valuable information on the volume of plastic packaging for 2017.
4. PREVIOUS STUDIES BY THE CIRCULAR ECONOMY FOR WASTE-FREE THAILAND (CEWT) RESEARCH GROUP AT MAE FAH LUANG UNIVERSITY (MFU). • Manomaivibool, P., Mongkonkorn, S., Unroj, P.,
Dokmaingam, P. 2018. Chiang Rai Zero Waste: participatory action research to promote source separation in rural areas. Resources, Conservation and Recycling, 136, 142-152.
• Manomaivibool, P. et al. 2018. Final Report: Efficiency, Competitiveness and Sustainability of Thai Tourism. Bangkok: Thailand Research Fund.
• Manomaivibool, P., Dokmaingam, P. 2017. Final Report: The Review of Solid Waste Management Cost and the Life Cycle Assessment of Solid Waste Management Systems: Principles and Customization for Local Governments in Thailand. Bangkok: Thailand Research Fund.
• Manomaivibool, P. 2015. Wasteful tourism in a developing economy? A present situation and sustainable scenarios. Resources, Conservation and Recycling, 103: 69-76.
1. THE DEPARTMENT OF LOCAL ADMINISTRATION (DLA)’S WASTE DATABASEAlso known as “Mor Phor 1” (มฝ.1) in Thai for the year 2017. This was the first year of DLA’s waste database. All 7,753 local governments (LGs) except Bangkok Metropolitan Administration (BMA) were obligated to submit the data via two forms. Mor Phor 1 was designed to capture basic characteristics and yearly statistics from waste generation to disposal. Mor Phor 2 was designed for LGs to submit monthly data. This was arguably the most complete, bottom-up database. However, it was criticised regarding data consistency and quality. The database for later years may also be influenced by the government’s waste reduction targets (5% in 2018 and 40% in 2019).
2. THE POLLUTION CONTROL DEPARTMENT (PCD)’S WASTE DATABASE FOR THE YEAR 2016. PCD was a leading authority for waste statistics in Thailand and published the yearly State of Pollution Reports. The database was compiled by the Ministry of Natural Resources and Environment at regional and provincial levels. Waste generation and collection data were derived from the statistics some LGs submitted and the MFA conducted by the regional offices. Waste disposal data were compiled from field surveys and reports from LGs. While being more standardised and reliable for waste disposal data, the PCD’s database was not as comprehensive as the DLA’s, particularly in rural areas without waste collection services.

55
5.3 DATA CLEANSING, CORRECTIONS AND CLASSIFICATIONSData from the DLA’s database included various errors. The following steps were taken to clean and correct the data:
Missing data: Some basic data were missing or incorrect in the database, such as population, waste generation, waste composition, waste collection, etc. We only filled in missing data for population and the composition of waste generation, as these could affect the calculations in later steps. The population number was taken from the website of the respective LG.
Waste generation (tonne/year): The figures supplied by LGs to the DLA were compared with the PCD’s waste generation rates by types of LGs, shown in the table below. The exception was Pattaya City where the PCD’s rate was insensitive to the presence of tourism; the number provided by Pattaya City to the DLA was thus retained.
For the rest, under- and over-reported numbers were detected using two rules:
• Under-reporting: Some data from the DLA were regarded as under-reported if the calculated waste generation rate was lower than 50% of the PCD’s value. In this case, the PCD’s value would be assumed instead of the DLA’s.
• Over-reporting: Some data from the DLA were regarded as over-reported if they were over the calculated waste generation based on the PCD’s rates by more than a factor of 2, i.e. 200%.
• Effects of tourism: For LGs in the provinces with a high number of tourists, additional waste would be added to the estimates based on the PCD’s rates. According to the study on tourism waste (Manomaivibool et al., 2018), it was assumed that 10% and 2.5% should be added to the estimates for LGs in the top 10 provinces and the next 10 respectively. We did not make this adjustment if LGs in these 20 provinces had already reported an amount of waste generation that was higher than the estimates.
Waste collection (tonne/year): The data on waste collection were inconsistent, as LGs could report the number in multiple ways, i.e. the amount they collected or the amount they hired other LGs or private contractors to collect. Therefore, the numbers could be affected by under- or over-reporting.
• Under-reporting: If LGs reported their own collection work, under-reports could be checked by estimating the amount of waste collection based on the capacity of garbage trucks they had. A conservative estimation was made assuming 2 tonnes of waste collected by a truck without a compactor and 3 tonnes with a compactor, assuming they made only 1 trip a week. The estimates would be used if they were still higher than the reported numbers.
• Under-reporting AND missing data: There were still cases of under-reporting from the previous step. In addition, there were cases where LGs indicated that they provided waste collection but did not report the quantity. However, there was no information on the number of vehicles available to estimate the minimum collection capacity. Therefore, we had to assume that they would at least have to collect quantities beyond the ability of households to manage at source. As it was assumed in this study that even for the so-called zero waste communities the maximum rate of source reduction and separation was 82%, a minimum collection rate of 18% of waste generation was assumed.
• Over-reporting: A case of over-reporting could be identified when the reported waste collection was higher than the amount of (adjusted) waste generation. In such cases, the waste collection would be assumed at 93% of the waste generation to reflect that households could easily separate about 7% of salable, secondary materials for the recycling businesses in Thailand.
After the above four steps of adjustments, the number of LGs without waste collection stood at 2,810 compared to 3,142 in the DLA’s data.
Data congruence: It was noticed that there were LGs that reported the exact same number for both generation and collection. Some of them would pass all the screenings in previous steps. So, in this step waste generation was compared with waste collection. If they were equal, it would be assumed that LGs should know the collected amount, not the generation. The generated amount was then calculated with the assumption that households could separate 7% at source.

WWF THAILAND 2020
5.4 COMPOSI-TIONAL ANALYSISDLA’s database contained information on waste composition. LGs were requested to classify waste generation into five categories: general waste, organic waste, recyclables, hazardous waste and electronic waste. However, only LGs that had done compositional analysis could provide accurate and reliable data. The composition of waste generation and collected waste for other LGs would be reconstructed from the data of these LGs.
COMPOSITION IN URBAN AND RURAL AREASBecause there were a limited number of Nakorn municipalities, we reduced the number of types from four to two. Nakorn and Muang municipalities, along with Pattaya City and BMA, would be designated as “urban” while Tambon municipalities and Tambon Administrative Organization belonged to “rural” areas. The composition of tourist waste was taken from the literature (Manomaivibool, 2015).
COMPOSITION OF WASTE MANAGED AT SOURCEThe level at which households managed different types of waste generated at source affected both quantity and composition of remaining waste for collection. Based on the previous study (Manomaivibool and Dokmaingam, 2017), there were four levels of source separation: 7%, 31%, 60% and 82%. However, since 82% represented the upper bound of a theoretical best case, it would not be applied in this model, as also advised by the focus group. Thus, only 3 levels of management at source were assumed: 7%, 31% and 60%.
• Level of 7% - LGs that had their waste generation adjusted in the congruence check would be assumed to have comprehensive waste collection and only 7%, mainly recyclables, was managed at source.
• Level of 31% - LGs that had waste collection higher than 40% but lower than 69% of waste generation would be assumed to have management at source of 31% for recyclables and organic waste.
• Level of 60% - LGs that had waste collection lower than 40% but not classified as under-reported would be assigned to 60% source management of recyclables and organic waste. The difference between waste generation and the combined amount of waste collection and management at source was the leakage to the environment, i.e. littering.

57
5.5 WASTE COLLECTION SCENARIOSThis was arguably the most critical step in the methodology. There were three collection scenarios that were modelled here: public collection, management at source and littering. Voluntary initiatives were discussed in the project but the scale in 2017 was negligible and not modelled.
PUBLIC COLLECTIONThis was the collection of waste by the LG, other LGs, or any private contractors. There were 4,944 LGs, including BMA, out of the total of 7,754 that had some kind of waste collection in 2017.
MANAGEMENT AT SOURCEThis covered the amount of waste households could sort and manage by themselves. It included home composting for organic waste, selling recyclables as secondary materials, turning some general waste into recyclables or energy, or source separation of hazardous waste. The amount of waste being managed at source was calculated using four categories by comparing the potential with the availability of different types of waste after public collection. For example, an LG with the assigned level of 60% would be assumed to have the potential to sort general waste, organic waste, recyclables and hazardous waste equal to 4%, 36%, 20% and 0% of the total waste generation. These would be multiplied by the total waste generation. If the calculated potentials did not exceed the available waste after public collection, the numbers were kept. If the potential exceeded the availability for any category, it would be assumed that all the remaining waste was managed at the source.
LITTERINGHouseholds, especially in areas without waste collection, might have to resort to dumping waste that they could not manage in public areas. In this study, we accounted for littering by examining the differences between waste generation, on the one hand, and public collection and management at source, on the other hand, as both methods could keep waste from entering the environment.

WWF THAILAND 2020
5.6 DISPOSAL SCENARIOS
The disposal scenarios were constructed from the PCD’s database, which contained 2,252 disposal sites in the country. However, it was not possible to identify the disposal sites and the LGs on a one-to-one basis. While many large sites accepted waste from many areas in the provinces according to the government’s cluster approach, several LGs had multiple, smaller dumpsites in their areas. Therefore, we had to aggregate the data and work at a provincial level.
DATA CHECKSThe PCD’s and the DLA’s data on waste disposal were compared with the estimated public collection of waste at a provincial level. The PCD reported the amount of waste disposal at 9.57Mt, considerably lower than the 14.77Mt public collection. There were only four provinces that had higher volumes of disposal compared to collection: Phuket, Samut Prakarn, Ubonratchatani and Yala for 4-36%. By contrast, the DLA’s disposal amounts were very high, exceeding even waste generation if we included the BMA figure. There were 11 provinces with a high chance of having over-reported by 50%.
CREW SEPARATION It was known that garbage collection crews separated recyclables for additional income of about 10K THB per month. This was one reason waste disposal was lower than public collection. The extent of crew separation could be estimated by calculating the amount of easily identifiable, salable recyclables, such as bottles and cans, that could be sorted during garbage collection that would make up the level of additional income at market prices (e.g. 5 THB per kg of mixed recyclables). This could then be compared to the total amount of garbage a crew was likely to collect within the same period. In this study, we assumed that the crews could separate easily identifiable, salable recyclables such as bottles and cans up to 3% of the total weight of public collection (which was largely composed of heavier organic waste).
WASTE DISPOSALThis included sanitary landfill, composting, incinerators and other appropriate methods such as mechanical biological treatment (MBT) and engineered landfill from the PCD’s database if the numbers did not exceed the amount of public collection after deducing what the crews could separate. If they did exceed that amount, either the DLA’s database would be used or it would be assumed that all of the rest of the public collection went to waste disposal.
IMPROPER DISPOSALThe amount of waste collected by LGs that ended up in open dumps and control dumps was calculated as the difference between public collection, on the one hand, and crew separation together with waste disposal, on the other hand. The total waste improperly disposed of that could therefore still leak plastics into the environment stood at 5.84Mt or 39% of the public collection. (Note on scavenging and leakages from the disposal sites: as waste would lose its physical properties at dumpsites due to biological and chemical processes, we only calculated the amount of plastic waste that might be recovered or leaked from dumpsites as part of plastic flows in recycling scenarios).

59
5.7 FLOWS OF WASTE PLASTICSThe flows of post-consumer plastic waste were embedded in the flows of recyclables and general waste. The market data on the volume of plastic packaging is obtained from EA. The share of different types of resins is modelled based on the
European market with the adjustment for a higher share of HDPE for shopping bags in Thailand. Nine plastic items are classified as recyclables: bottles (PET), trays/boxes/cups (PET), bottles (HDPE), caps/cap rings (HDPE), other packaging (PVC), bottles (PP), trays/boxes/cups (PP), caps/cap rings (PP), and trays/boxes/cups (PS). Fourteen plastic items are classified as general waste: snack bags/pouches (PET), bags (HDPE), bags (LLDPE), snack bags/pouches (LLDPE), bags (LDPE), snack bags/pouches (LDPE), other packaging (LDPE), bags (PP), snack bags/pouches (PP), other packaging (PP), other packaging (PS), trays/boxes/cups (EPS), other packaging (EPS) and other packaging (Others).
GEOGRAPHICAL ALLOCATIONPlastic waste could be allocated to different locations by various means: by population, by waste generation, or by additional rules that take into account the urban and rural split, for example. Alternative values were made to represent the lower and upper bound. The allocation by the share population was the lower bound, as it tended to allocate too few items to urban areas where the population tended to consume more plastic items per capita. Therefore, in the upper bound, it was assumed that BMA, Pattaya City, Nakorn municipalities, Muang municipalities and LGs in the provinces with the 10 highest number of tourists would have plastic shares in the factors of 1.5-2.5 of their shares of the population. The upper bound assumption would yield amounts of PET bottles in Bangkok and Phuket close to what was reported in the previous study commissioned by Coca-Cola Thailand (2018). Based on the feedback from the focus group, this method was chosen.
COLLECTION OF WASTE PLASTICSAs these products fall within general waste and recyclables, their flows are assumed to be similar to the collection scenarios for these two fractions. Following this method, the quantity of target products that went to public collection, management at source and littering was estimated at a local level.
CREW SEPARATION OF WASTE PLASTICSThis was done at a provincial level. First, the amounts of public collection by types of target products were aggregated within provinces. Then, an assumption was made on the efficiency of garbage collection crews in sorting different plastic items during collection work. Because the crews worked under time pressure, it was assumed that they only targeted items in the “recyclables” category.
DISPOSAL OF WASTE PLASTICS There were two types of disposal: waste disposal and improper disposal. The share of improper disposal for each province was used as a factor to allocate the remaining waste plastics in public collection after crew separation. In total, it was estimated that 0.40Mt of waste plastics were disposed of improperly and could still leak into the environment. The rest of the waste plastics from public collection ended up in waste disposal. Waste plastics in both proper and improper disposal sites could be recovered by scavengers. This was modelled in recycling scenarios.
WWF THAILAND 2020
5.8 RECYCLING SCENARIOSRecycling scenarios compiled all processes that could recover waste plastics for recycling purposes. These included management at source and crew separation. Additional processes modelled here were the work of scavengers at disposal sites and waste pickers’ recovery of littered plastic waste. The calculation was based on assumptions regarding the efficiency of these informal workers.
WASTE PICKINGWaste plastics that were littered in the environment could be picked up by waste pickers. However, some of the litter would be openly burned. Based on Pansuk et al. (2018), it was determined that 34.4% of waste would be openly burned and this was used as the baseline scenario. Therefore, 0.59Mt remained for waste picking. Waste pickers were subject to less time pressure compared to garbage collection crews and could target more types of plastics. However, they had limited ability to cover ground and lower rates were assumed.
SCAVENGINGWaste plastics at disposal sites could be recovered by scavengers. These actors were subject to less time pressure compared to garbage collection crews and could target more types of plastics. However, they were working with more contaminated waste and their efforts would be directly influenced by the market prices of recyclables. Three levels of efficiency were postulated, with the normal rates used in the default calculation.
SENT FOR RECYCLINGThe amount of waste from all four processes that could recover waste plastics that were sent for recycling.
5.9 LEAKAGE SCENARIOSThere were three hotspots for waste plastics to leak into the environment: littering, improper landfill/incineration and recycling. However, the leakage from recycling was indirect and was channeled through littering and improper disposal. It was also assumed that plastic waste from provinces without any coastal areas would be less likely to end up in the ocean.
REJECTED FROM RECYCLINGNot all plastic waste that went to the recycling system would get recycled. Some of it was rejected. It was observed that recycling businesses, especially the middlemen who sort and aggregate recyclables, could be local hotspots for plastic leakages. Lower value plastics were more likely to be leaked both unintentionally and intentionally (it was not uncommon for middlemen to abuse contamination rules set by the reprocessors by mixing unsalable plastics with target products to increase revenues).
LEAKAGES FROM LITTERINGLightweight littered items such as bags and straws were more susceptible to being carried away by wind and entering the environment.
LEAKAGES FROM IMPROPER DISPOSALSimilarly, lightweight items such as bags and straws were more susceptible to being carried away by wind and into the environment from dumpsites that did not have sufficient safeguards to contain waste.

61
5.10 SENSITIVITY ANALYSISA sensitivity analysis was performed to see the plausible range and influence of various assumptions over the results. The analysis focuses on the fate of 2.51Mt of plastic waste.
Scenario building: Four scenarios were envisioned:
THE FIRST SCENARIOis a default calculation, called the “Baseline”.
THE SECOND SCENARIOcalled “High Recycling & Low Leakages”, assumes a very lucrative market for recycling which incentivised actors to seek recyclables, which in turn would lead to a lower likelihood of leakages.
THE THIRD SCENARIOcalled “Low Recycling & High Leakages”, is the opposite of the second. It assumes a price collapse of recyclables, killing the incentive for crews, scavengers and waste pickers, which in turn would lead to a higher likelihood of leakages.
THE FOURTH SCENARIOcalled “Low Recycling & Low Leakages”, estimates the results of 2018 which witnessed the price collapse from the ban in China but an increase in public awareness on the problem of plastic waste in the ocean, which in turn gave rise to clean-up activities and lowered the likelihood of leakages.
The results show a range for the rate of recycling of plastic packaging of 17.87-28.17%, with the baseline at 22.65% or 568,781 tonnes in 2017. The range for leakages is 3.13-8.36%, with the baseline at 5.68% or 142,679 tonnes in 2017.
1
2
3
4
WWF THAILAND 2020
BIBLIOGRAPHYAkenji, L., Bengtsson, M., Kato, M., Hengesbaugh, M., Hotta, Y., Aoki-Suzuki, C., Gamaralalage, P.J.D. and Liu, C. (2019). Circular Economy and Plastics: A Gap-Analysis in ASEAN Member States. Brussels: European Commission Directorate General for Environment and Directorate General for International Cooperation and Development, Jakarta: Association of Southeast Asian Nations (ASEAN).
ASEAN (2020). Framework IV: Private Sector Engagement. Overview of mandatory packaging reporting and EPR frameworks.
Asociación Gremial de Industriales del Plástico (ASIPLA) (2019) ESTUDIO SOBRE RECICLAJE DE PLÁSTICOS EN CHILE Retrieved from: http://www.asipla.cl/wp-content/uploads/2019/04/190328-Estudio-sobre-Reciclaje-de-Pl%C3%A1sticos-en-Chile-Resumen-Ejecutivo.pdf
Aung, W.Y. (2020, May 12). Plastic Piles Up in Thailand as Pandemic Efforts Sideline Pollution Fight. The Irrawaddy. Retrieved from: https://www.irrawaddy.com/news/asia/plastic-piles-thailand-pandemic-efforts-sideline-pollution-fight.html
Bangkok Post (2019, September 30). Collaboration key to ending plastic waste. Retrieved from: https://www.bangkokpost.com/thailand/general/1761674/collaboration-key-to-ending-plastic-waste
Boonbandit, T. (2019, September 18). This temple recycles plastic bottles into monk robes. Khaosodenglish. Retrieved from: https://www.khaosodenglish.com/
Bureecam, C., Chaisomphob, T. and Sungsomboon, P. (2018). Material Flow Analysis of Plastic in Thailand. Thermal Science. 2379-2388 22 6(A).
Chikarmane, P. (2012). Integrating Waste Pickers into Municipal Solid Waste Management in Pune, India. Women in Informal Employment Globalizing and Organizing (WIEGO), Policy Brief (Urban Policies) N.8
Chikarmane, P. and Narayan, L. (2009). Rising from the waste. Organizing Wastepickers in India, Thailand and the Philippines. Committee for Asian Women.
Cyclos (2019). Legal Framework Study of Extended Producer Responsibility. Commissioned by WWF Germany.
European Environmental Agency (EEA) (2019). Overview of national waste prevention programmes in Europe. Waste Prevention Programme.
EPA (2014). Recycling Regulations in Taiwan and the 4-in-1 Recycling Program. Workshop Materials on WEEE Management in Taiwan. Retrieved from: https://www.epa.gov/sites/production/files/2014-05/documents/handout-1a-regulations.pdf
European Commission (2017). Attitudes of European Citizens towards the Environment. Special Eurobarometer 468 - Wave EB88.1 - TNS Opinion and Social. Retrieved from: https://ec.europa.eu/commfrontoffice/publicopinion/index.cfm/Archive/index
Eurostat (2020). Recycling rate of municipal waste. Retrieved from: https://ec.europa.eu/eurostat/databrowser/view/sdg_11_60/default/table?lang=en
Eurostat (2020). Recycling rate of packaging waste. Retrieved from: https://ec.europa.eu/eurostat/web/products-datasets/product?code=ten00063
Extended Producer Responsibility Alliance (EXPRA) (2019). Towards a common approach to modulated fees.
Ibitz, A. (2020). Assessing Taiwan’s endeavors towards a circular economy: the electronics sector. Asia Europe Journal. Retrieved from: https://doi.org/10.1007/s10308-019-00568-w.
Johnson, O. and Trang, N. (2019). Closing the Loop: Innovative partnerships with informal workers to recover plastic waste, in an inclusive circular economy approach. Sai Mai District, Bangkok Case Study.

63
Kenya Association of Manufacturers (2019). Kenya Plastic Action Plan: Accelerating a Circular Economy in Kenya. Report.
Kuo-Shuh, F. et al. (2005). Management and Performance of Taiwan’s Waste Recycling Fund. Journal of the Air & Waste Management Association, 55:5; 574-582.
Leal Filho, W., Saari, U., Fedoruk, M., Lital, A., Moora, H., Kloga, M., and Voronova, V. (2019). An overview of the problems posed by plastic products and the role of extended producer responsibility in Europe. Journal of Cleaner Production, 214; 550-558.
Medina, M. (2008). The informal recycling sector in developing countries. Public-Private Infrastructure Advisory Facility, World Bank. Note 44.
Ministry of Natural Resources and Environment (MONRE) (2019). Thailand’s Roadmap on Plastic Waste Management, 2018-2030.
OECD (2014). What have we learned about Extended Producer Responsibility in the past decade? Case Study Chile: An overview of key qualitative and quantitative topics. Retrieved from: https://www.oecd.org/environment/waste/20140526%20Case%20Study%20-%20EPR%20Chileamended.pdf
Rapid Transition Alliance (2019). Story of Change: Taiwan’s Transition from Garbage Island to Recycling Leader. Retrieved from: https://www.rapidtransition.org/stories/taiwans-transition-from-garbage-island-to-recycling-leader/.
Reuters (2020). Plastic piles up in Thailand as pandemic efforts sideline pollution fight. Retrieved from: https://www.reuters.com/article/us-health-coronavirus-thailand-plastic/plastic-piles-up-in-thailand-as-pandemic-efforts-sideline-pollution-fight-idUSKBN22N12W
Santa Maria, T. (2018). Challenges in the implementation of Extended Producer Responsibility Policies: The case of packaging in Chile. Research project presented for the degree of MSc. in Sustainability and Business, University of Leeds.
Statista (2020) Recycling rate of plastic waste in South Korea from 2008 to 2018. Retrieved from: https://www.statista.com/statistics/1074985/south-korea-plastic-waste-recycling-rate/
Pollution Control Department (PCD) (2019). Booklet on Thailand State of Pollution 2018. ISBN 978-616-316-511-4. Retrieved from: http://pcd.go.th/file/Booklet%20on%20Thailand%20State%20of%20Pollution%202018.pdf
Su, M-C. (2018). Taiwan’s Circulate Economy: A New Era for Waste Management. Taiwan Insight, University of Nottingham. Retrieved from: https://taiwaninsight.org/2018/01/31/taiwans-circular-economy-a-new-era-for-waste-management/
Ten Brink, P., Schweitzer, J.P. and Watkins, E. (2017). T20 Task Force Circular Economy: Circular economy measures to keep plastics and their value in the economy, avoid waste and reduce marine litter. G20 Insights.
Thailand Public-Private Partnership for Plastic and Waste Management (2018). Retrieved from: www.dmcr.go.th
Watkins, E., Grionfra, S., Schweitzer, J.P., Pantzar, M., Janssens, C. and Ten Brink, P. (2017). EPR in the EU Plastics Strategy and the Circular Economy: A focus on plastic packaging. IEEP Report.
Wichai-utcha, N. and Chavalparit, O. (2018). 3Rs Policy and plastic waste management in Thailand. Journal of Material Cycles and Waste Management 10-22 21(1).
Yong-Chul et al. (2020). Recycling and management practices of plastic packaging waste towards a circular economy in South Korea. Resources, Conservation & Recycling; 158.
Yukalang, N., Clarke, B. and Ross, K. (2017). Solid Waste Management Solutions for a Rapidly Urbanizing Area in Thailand: Recommendations based on Stakeholder Input. International Journal of Environmental Research and Public Health, 15, 1302.
Zero Waste Europe (2015). Redesigning Producer Responsibility - a New EPR is needed for a Circular Economy. Zero Waste Europe. Report, Brussels.

COLOPHON Authors & Research Team: Andrew McCue Benjamin Elizalde, Metabolic Parkpoom Kometsopha, Metabolic Mengmeng Cui, Metabolic Beth Gillies, Metabolic Dr. Panate Manomaivibool, Mae Fah Luang University
Project Steering Group WWF Thailand WWF Malaysia
Graphic Design Marta Sierra Garcia
Editorial Support from Altus Impact Chloe Hill Becky Clements Hayley Bagnall
© 2020 Paper 100% recycled
© 1986 Panda symbol WWF – World Wide Fund for Nature (Formerly World Wildlife Fund) ® “WWF” is a WWF Registered Trademark. WWF, Avenue du Mont-Bland, 1196 Gland, Switzerland. Tel. +41 22 364 9111. Fax. +41 22 364 0332.
For contact details and further information, please visit our international website at www.panda.org