scale and plant invasions: a theory of biotic acceptance
TRANSCRIPT

Scale and plant invasions: a theory of biotic acceptance
Měřítko studia a rostlinné invaze: teorie biotické akceptance
Thomas J. S t o h l g r e n1, Catherine J a r n e v i c h1, Geneva W. C h o n g2
& Paul H. E v a n g e l i s t a3
D e d i c a t e d t o M a r c e l R e j m á n e k
1Fort Collins Science Center, U. S. Geological Survey, 2150 Centre Street, Building C, FortCollins, CO 80526, USA, e-mail: [email protected]; 2 Northern Rocky Mountain Sci-ence Center, U. S. Geological Survey, 675 E Broadway, Jackson, WY 83001, USA; 3 NaturalResource Ecology Laboratory, Colorado State University, Fort Collins, CO 80523, USA
Stohlgren T., Jarnevich C., Chong G. W. & Evangelista P. H. (2006): Scale and plant invasions:A theory of biotic acceptance. – Preslia 78: 405–426.
We examined the relationship between native and alien plant species richness, cover, and estimatedbiomass at multiple spatial scales. The large dataset included 7051 1-m2 subplots, 1443 10-m2 sub-plots, and 727 100-m2 subplots, nested in 727 1000-m2 plots in 37 natural vegetation types in sevenstates in the central United States. We found that native and alien species richness (averaged acrossthe vegetation types) increased significantly with plot area. Furthermore, the relationship betweennative and alien species richness became increasingly positive and significant from the plant neigh-bourhood scale (1-m2) to the 10-m2, 100-m2, and the 1000-m2 scale where over 80% of the vegeta-tion types had positive slopes between native and alien species richness. Both native and alien plantspecies may be responding to increased resource availability and/or habitat heterogeneity with in-creased area. We found significant positive relationships between the coefficient of variation of na-tive cover in 1-m2 subplots in a vegetation type (i.e. a measure of habitat heterogeneity), and boththe relative cover and relative biomass of alien plant species. At the 1000-m2 scale, we did find weaknegative relationships between native species richness and the cover, biomass, and relative cover ofalien plant species. However, we found very strong positive relationships between alien speciesrichness and the cover, relative cover, and relative biomass of alien species at regional scales. Theseresults, along with many other field studies in natural ecosystems, show that the dominant generalpattern in invasion ecology at multiple spatial scales is one of “biotic acceptance” where naturalecosystems tend to accommodate the establishment and coexistence of introduced species despitethe presence and abundance of native species.
K e y w o r d s : alien species dominance, biotic acceptance, diversity and invasibility, exotic plantspecies, multi-scale sampling.
Introduction
Observational studies, controlled experiments, and theoretical models have been used toinvestigate the role of diversity in inhibiting invasions. The prevailing paradigm was basedlargely on observations that low diversity islands were easily invaded (i.e. with greatly re-duced environmental gradients and levels of habitat heterogeneity, Elton 1958), and rein-forced by the immensely successful invasions of alien plants and animals on Guam and theHawaiian Islands (Mack et al. 2000). However, different environmental characteristics ofislands produced different levels of plant invasions, with tropical islands being moreheavily invaded than islands in temperate zones (Rejmánek 1996). Because islands also
Preslia 78: 405–426, 2006 405

varied in distances from the mainlands, area, and habitat heterogeneity, generalizationswere slow to emerge, especially for largely ignored continental areas (Rejmánek 1996,Chytrý et al. 2005, Stohlgren et al. 2005b, Richardson & Pyšek 2006).
Contradictory field observations at different spatial scales (i.e. scales of observations,plot size) have contributed to the confusion. For example, Stohlgren et al. (1999) reportedthat four grassland vegetation types in the central grasslands biome in the US showed neg-ative relationships between native and alien species richness at 1-m2 and 1000-m2 scales,while five vegetation types in a montane biome of Colorado showed positive relationshipsat the same two spatial scales. These findings and other contradictory site-specific studiesunderscore the dire need for additional multi-scale studies of native and alien plant speciespatterns (Fridley et al. 2006).
Small-scale, controlled experiments of artificially constructed “communities” (Knopset al. 1997, Tilman 1997, Kennedy et al. 2002) generally supported the “biotic resistance”paradigm whereby species-rich habitats would be less prone to invasion than species-poorhabitats, presumably due to competitive exclusion (Grime 1973) and by usurping avail-able resources (Tilman 1997). Likewise, small-scale experiments supporting biotic resis-tance have been corroborated by some theoretical studies (Case 1990). Shea & Chesson(2002) presumed negative relationships between native and alien species within species-poor habitats and species-rich habitats at small spatial scales, where extrinsic factors donot vary, but a positive relationship across habitats, where extrinsic factors do vary. One ofmany implicit assumptions of small-scale studies is that the patterns and processes ob-served in small plots are directly scalable to larger areas (Fridley et al. 2006). For example,after a series of small-scale experiments Kennedy et al. (2002) proclaimed that “diversecommunities will probably require minimal maintenance and monitoring because they aregenerally effective at excluding undesirable invaders.” Fridley et al. (2004) used null mod-els and multi-scale plot data in one area to show that the relationship between native andalien species richness may be positive at small and large scales, but it was more positive atlarger spatial scales (also see Brown & Peet 2003). Unfortunately, the null models ofFridley et al. assumed “uniform random selection of species” (i.e. random community as-sembly) in a small species pool of 20 to 100 species, a constant proportion of species byorigin (75% native, 15% exotic, and 10% “blank” species or open spaces), a constant plantdensity, equilibrium abundance (sensu Hubbell 2001), and equal-sized individuals regard-less of species and age; conditions that are rarely if ever found in nature. Thus, direct com-parisons of observational studies to these types of null models are problematic (also seeHuston 1997).
Issues of scale have been embraced by observational ecologists as a means of docu-menting patterns of invasion at local, regional, and national scales (Stohlgren et al. 1999,2003, 2005b, Sax 2002, Brown & Peet 2003, Fridley et al. 2006). As a result, some consis-tent patterns are emerging. At sub-continental scales, for example, there is convincing evi-dence of strong positive relationships between native and alien plant species richness(Stohlgren et al. 2003), and for plant, bird and fish species in the conterminous UnitedStates (Stohlgren et al. 2005a, 2006). These results complement landscape-scale observa-tional studies (e.g., Stohlgren et al. 1999, Brown & Peet 2003, Keeley et al. 2003), but theydo not provide a mechanism for the observed patterns across scales (Levine et al. 2003,2004). Still, there have been no studies to examine the continuum of relationships betweennative and alien species from the scale of meters to regions and across many vegetation
406 Preslia 78: 405–426, 2006
types and biomes. Questions remain about how typical positive or negative relationshipsbetween native and alien species are at small spatial scales, and about how the relation-ships change with increasing scale and within and across vegetation types.
Having gathered consistent, multi-scale data in many areas in the central US, we hada unique opportunity to quantify the relationship between native and alien species at sixspatial scales from 1-, 10-, 100-, and 1000-m2 scales, at landscape scales, and for the re-gion. Our objective was to quantify the relationship between native and alien species rich-ness, cover, and biomass at multiple spatial scales and for many vegetation types. In-creases in native and alien richness across scales may suggest that similar mechanisms af-fect both native and alien plant species.
Study areas
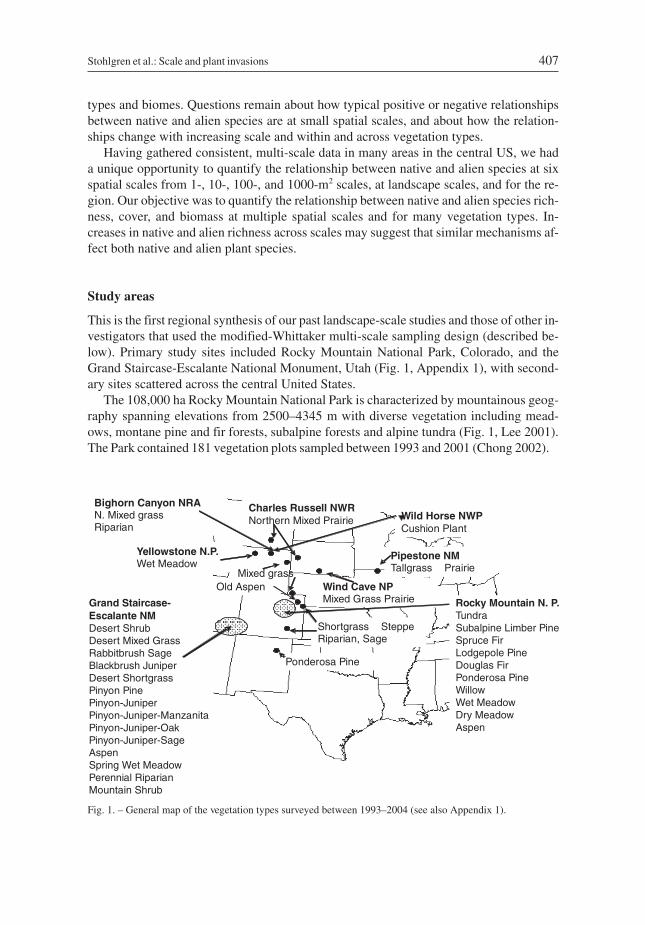
This is the first regional synthesis of our past landscape-scale studies and those of other in-vestigators that used the modified-Whittaker multi-scale sampling design (described be-low). Primary study sites included Rocky Mountain National Park, Colorado, and theGrand Staircase-Escalante National Monument, Utah (Fig. 1, Appendix 1), with second-ary sites scattered across the central United States.
The 108,000 ha Rocky Mountain National Park is characterized by mountainous geog-raphy spanning elevations from 2500–4345 m with diverse vegetation including mead-ows, montane pine and fir forests, subalpine forests and alpine tundra (Fig. 1, Lee 2001).The Park contained 181 vegetation plots sampled between 1993 and 2001 (Chong 2002).
Stohlgren et al.: Scale and plant invasions 407
Pipestone NMTallgrass Prairie
Ponderosa Pine
Wind Cave NPMixed Grass Prairie
Wild Horse NWPCushion Plant
Yellowstone N.P.Wet Meadow
Charles Russell NWRNorthern Mixed Prairie
Shortgrass SteppeRiparian, Sage
Bighorn Canyon NRAN. Mixed grassRiparian
Old AspenMixed grass
Grand Staircase-Escalante NMDesert ShrubDesert Mixed GrassRabbitbrush SageBlackbrush JuniperDesert ShortgrassPinyon PinePinyon-JuniperPinyon-Juniper-ManzanitaPinyon-Juniper-OakPinyon-Juniper-SageAspenSpring Wet MeadowPerennial RiparianMountain Shrub
Rocky Mountain N. P.TundraSubalpine Limber PineSpruce FirLodgepole PineDouglas FirPonderosa PineWillowWet MeadowDry MeadowAspen
Fig. 1. – General map of the vegetation types surveyed between 1993–2004 (see also Appendix 1).

The 850,000-ha Grand Staircase-Escalante National Monument, Utah includes table-lands of the Colorado Plateau, arid grasslands and shrublands, sparse to closed woodlands,and large and small patches of forests (Comstock & Elhleringer 1992). The area containsa wide array of desert shrub, pinyon-juniper, and riparian vegetation types (Fig. 1, Appen-dix 1), endemic species, hot spots of native plant diversity amid arid, stressful environ-ments, and multiple exposed soil and geology types (Comstock & Elhleringer 1992,Shultz 1998, Stohlgren et al. 2005b). Field sampling occurred between 1998 and 2002(see Stohlgren et al. 2005b for details).
Another 159 plots were established at secondary study sites in various states, biomes,and vegetation types using the same field methods (i.e. modified-Whittaker plot) in eachvegetation type. Plots were located from tallgrass prairie in Minnesota, to mixed grass-lands and forests in Montana, Wyoming, South Dakota, and Colorado. These other sitesranged in elevation from 500 m to over 3000 m, in a wide range of geologic and soil types(Appendix 1).
Methods
In each study location, and during peak phenology, modified-Whittaker multi-scale plots(Stohlgren et al. 1995, 1998a) were established initially in 48 different vegetation associa-tions. The nested plot was 20 m × 50 m containing one 100-m2 subplot (5 m × 20 m) in thecenter, two 10-m2 subplots (2 m × 5 m) in opposite corners, and ten 1-m2 subplots (0.5 m ×2 m) systematically arranged around the inside edges of the 1000-m2 plot and the outsideedges of the 100-m2 subplot. Foliar cover (nearest percent) and average height by plantspecies were recorded in the ten 1-m2 subplots, along with the percent cover of soil, litter,bare soil, and rock. Plant species were recorded as 0.5% cover if they occupied less than1% in a 1-m2 subplot. For more details see Stohlgren et al. (1995, 1998a). The dominanceof aliens in a plot was expressed as the relative cover (percent of total cover) or the relativebiomass (percent of total biomass) of alien species. Cumulative plant species presence wasrecorded in the 10-, 100- and 1000-m2 plots. Ancillary data included the slope and aspectof the plot, GPS location and elevation derived from a digital elevation model.
Statistical approach
We used detailed information on foliar cover and height by species on 7042 1-m2 subplotsto create an index of aboveground biomass by multiplying foliar cover times mean plantheight for native and alien species. Previous research relating cover and height to plantbiomass for Bromus tectorum showed that foliar cover, predicted biomass (cover ×height), and actual biomass (clipped, dried, and weighed samples) were highly positivelyrelated (R2 > 0.80, Waters 2003). We lacked actual biomass information for other species,but we concluded that biomass estimates were a better measure of dominance than foliarcover or height measurements alone when comparing wildly different vegetation types(tundra to tallgrass prairie, thick conifer forests to desert grasslands).
Linear and non-linear regression analyses (SYSTAT version 11.0) were used to relatenative and alien plant species richness at the 1-, 10-, 100- and 1000-m2 scales, and whenplots were combined within vegetation types. In all analyses described below, data were
408 Preslia 78: 405–426, 2006

log-transformed (log10 x+1) prior to analyses to improve normality. Due to small samplesizes or high species overlap among types, the 48 original vegetation associations sur-veyed were collapsed into 37 vegetation “types” for all analyses (Fig. 1, Appendix 1).Still, the study encompassed a wide range of environments across seven states (Appendix1 and 2). Because the number of 1000-m2 plots varied greatly by vegetation type, we sum-marized the data as mean values of vegetation characteristics by vegetation type (Appen-dix 2). This minimized the effect of unequal sampling in different vegetation types andmore accurately represented regional patterns. We did not have the aerial coverage of veg-etation types across the region to aerially weight the results. Still, this approach providesdirect comparisons to the primary studies cited in the Introduction (e.g., Brown & Peet2003, Keeley et al. 2003, Bruno et al. 2004). We evaluated whether high native speciesrichness would be positively associated with alien species richness, cover, and biomass atmultiple spatial scales.
We further evaluated whether the cover, estimated biomass, relative cover, and relativebiomass of alien plant species would be positively related to alien species richness for thevegetation types surveyed. Based on preliminary results (Stohlgren et al. 1999, 2001), wesuspected that habitats vulnerable to the establishment of several alien plant species wouldeventually be invaded by a high-biomass producing alien species (Huston 1997).
We evaluated the relationship of native to alien species richness at the vegetation typescale using the cumulative native and alien species in each type. We assumed this to bea simple index of the proportional diversity of native and alien species in a type regardlessof sample size. For example, aspen plots in Colorado contained 377 native species and 35alien species in 45 plots, while the pinyon-juniper type in Utah contained 252 native spe-cies and 16 alien species in 114 plots.
Lastly, we used the coefficient of variation in the foliar cover of native species in all 1-m2
subplots in each vegetation type as a measure of habitat heterogeneity at the plot and vege-tation-type scales. We suspected that a high coefficient of variation in foliar cover of nativespecies, as an index of habitat heterogeneity, would be positively associated with the levelof establishment and dominance of alien plant species in a vegetation type, as indicated byhigh richness, relative cover, and estimated biomass of alien species in a vegetation type.
Results
Multi-scale plot results
Mean native species richness varied greatly among vegetation types ranging from 1.9 to13.9 species in 1-m2 subplots in spring-desert vegetation in Utah and high-elevation tundrain Colorado, respectively. These same two vegetation types each had about 38 species per1000-m2 plot (Appendix 2). Mean alien species richness among vegetation types rangedfrom zero alien species in 1-m2 subplots in four vegetation types to a mean of 10 alien spe-cies per 1000-m2 plot in the irrigated shortgrass steppe type in southern Colorado.
The mean understory foliar cover of native and alien plant species also varied consider-ably among vegetation types (Appendix 2). Mean foliar cover per plot for native plant spe-cies ranged from 89% cover in aspen stands in Colorado to just 13% cover for the desertshrub type in Utah. For alien plant species, mean foliar cover was near zero for tundra plots
Stohlgren et al.: Scale and plant invasions 409

(with a very occasional Taraxacum officinale) to 32%, again for the irrigated shortgrasssteppe in Colorado (Appendix 2).
The multi-scale plot design allowed for a cursory comparison of the slopes of the rela-tionship between native and alien plant species richness at various scales within vegetationtypes. While the slopes (and significance of slopes) varied widely by scale (i.e. 1-m2, 10-m2, 100-m2, and 1000-m2 scales) and vegetation type, we found that 60% of the vegetationtypes had positive relationships between native and alien species richness at the 1-m2
scale, and 15 vegetation types had positive slopes at all four spatial scales. Only two vege-tation types, the sagebrush type in Colorado and the recently burned pinyon-juniper sagetype, had negative slopes at all four spatial scales. When we looked across vegetationtypes, we found a consistent, progressive pattern whereby the percentage of vegetationtypes with positive relationships between native and alien species richness increased withincreasing spatial scale. At the 1000-m2 scale, about 19% of the vegetation types had nega-tive relationships, while 81% of the vegetation types surveyed had positive relationships.
We found that both the slope and intercept of the relationship between native speciescover and richness consistently increased across the four spatial scales (Table 1). All therelationships were highly significant and the correlation coefficients increased with spatialscale. However, the relationship between alien species richness and native species coverwas trending negative at the four spatial scales, but it was only statistically significant atthe 1-m2 scale. There was a consistent increase in the intercept, combined with the consis-tent decline in the correlation coefficient (and significance level) with increasing spatialscale (Table 1).
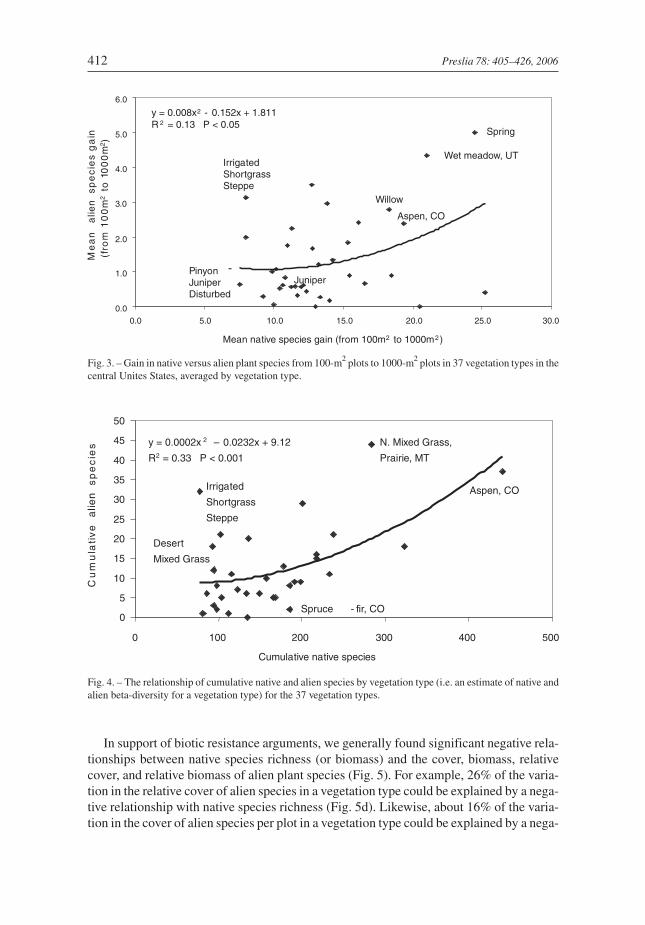
When we evaluated the mean slope of the relationship between native and alien speciesrichness, averaged across the 37 vegetation types, we found a significantly increasing pos-itive slope with increasing spatial scale (Fig. 2). The polynomial model was a better fit thana linear model. In addition, the coefficients of variation on the slope steadily decreased forthe 1-m2, 10-m2, 100-m2, and 1000-m2 scales, respectively. The mean slope for the vegeta-tion types was negative (–0.002), but near zero for the 1-m2 scale, and was significantlydifferent from zero at the 100-m2 and 1000-m2 scales. The proximate reasons for theincreasing positive slope in Fig. 2 were: (1) native species richness (averaged across thevegetation types) increased significantly and quickly with plot area (x) where native spe-cies richness = 2.4x2 + 0.63x + 5.57 (R2 = 0.75; n = 37; P < 0.0001 vegetation types for fourplot sizes); (2) alien species richness increased significantly, but slowly, with plot area (x)where alien species richness = 0.27x2 – 0.08x + 0.61 (R2 = 0.26; P < 0.0001); and (3) whilespecies-area relationships were positive for both native and alien species, the non-linearspecies-area relationship was much stronger and more predictable for native plant species.In addition, we found a significant positive relationship between the mean gain in nativeplant species from 100-m2 to 1000-m2 in the plots, to the mean gain in alien plant speciesover the same spatial scales. Thus, alien species may be responding to similar factors re-sponsible for native species increases with area (e.g. habitat heterogeneity, disturbance,water availability; Fig.3). Again, the polynomial model was a better fit than a linear model.
Regional-scale results
We found a positive relationship between cumulative native and alien species (in a givenvegetation type) across the 37 vegetation types in the survey (Fig. 4). Once more, the poly-
410 Preslia 78: 405–426, 2006

nomial model was a better fit than a linear model. Rare vegetation types such as aspen standsin Colorado and perennial riparian types in Utah, and the northern mixed grass prairie typein Montana exemplified native and alien species-rich habitats. Vegetation types with low cu-mulative native species (e.g. tundra and pinyon-juniper) with increased sampling effort, usu-ally had high species composition overlap among plots, and thus lower beta-diversity in na-tive and alien species. Measured in this way, native beta-diversity in a vegetation type ex-plained 33% of the variation in the beta-diversity of alien plant species (Fig. 4).
Stohlgren et al.: Scale and plant invasions 411
Table 1. – Correlations of mean native species cover per plot (averaged from all 1-m2 subplots in each vegetationtype) and the richness of native and alien plant species at various spatial scales; n = 35 vegetation types with atleast four 1000-m2 plots in each type (see Appendix 1).
Native species cover to: Slope Intercept R P
1-m2 (native species richness) 0.086 2.057 0.595 0.000110-m2 (native species richness) 0.149 3.914 0.657 0.0001100-m2 (native species richness) 0.229 7.137 0.711 0.00011000-m2 (native species richness) 0.349 16.539 0.719 0.0001
1-m2 (alien species richness) –0.015 1.137 –0.379 0.01710-m2 (alien species richness) –0.016 1.460 –0.270 0.096 (ns)100-m2 (alien species richness) –0.020 2.221 –0.241 0.139 (ns)1000-m2 (alien species richness) –0.012 3.262 –0.085 0.608 (ns)
-1
0
1
2
3
4
5
1 10 100 1000
y = 0.033x2 + 0.102x – 0.028R 2 = 0.132 n = 143P < 0.0001
Plot area (m2)
Slo
pe
of
na
tiv
eto
sp
ec
ies
ric
hn
es
s
Tallgrass
Aspen CO
Spring
Fig. 2. – Relationship between the slope of correlations of native to alien species richness, averaged for each of the37 vegetation types at 1-m2, 10-m2, 100-m2, and 1000-m2 scales. The coefficients of variation on the slope were1390%, 94%, 34%, and 25% for the 1-m2, 10-m2, 100-m2, and 1000-m2 scales, respectively.
In support of biotic resistance arguments, we generally found significant negative rela-tionships between native species richness (or biomass) and the cover, biomass, relativecover, and relative biomass of alien plant species (Fig. 5). For example, 26% of the varia-tion in the relative cover of alien species in a vegetation type could be explained by a nega-tive relationship with native species richness (Fig. 5d). Likewise, about 16% of the varia-tion in the cover of alien species per plot in a vegetation type could be explained by a nega-
412 Preslia 78: 405–426, 2006
0.0
1.0
2.0
3.0
4.0
5.0
6.0
0.0 5.0 10.0 15.0 20.0 25.0 30.0
y = 0.008x2 - 0.152x + 1.811R 2 = 0.13 P < 0.05
Spring
Wet meadow, UT
Willow
IrrigatedShortgrassSteppe
Pinyon -JuniperDisturbed
Aspen, CO
Juniper
Mean native species gain (from 100m2 to 1000m2)
Me
an
sp
ec
ies
ga
in(f
rom
10
0m
2to
100
0m
2 )
Fig. 3. – Gain in native versus alien plant species from 100-m2 plots to 1000-m2 plots in 37 vegetation types in thecentral Unites States, averaged by vegetation type.
0
5
10
15
20
25
30
35
40
45
50
0 100 200 300 400 500
y = 0.0002x 2 – 0.0232x + 9.12
R2 = 0.33 P < 0.001
N. Mixed Grass,
Prairie, MT
Aspen, COIrrigated
Shortgrass
Steppe
Spruce - fir, CO
Desert
Mixed Grass
Cumulative native species
Cu
mu
lati
ve
sp
ec
ies
Fig. 4. – The relationship of cumulative native and alien species by vegetation type (i.e. an estimate of native andalien beta-diversity for a vegetation type) for the 37 vegetation types.

Stohlgren et al.: Scale and plant invasions 413
1.2 1.3 1.4 1.5 1.6 1.7
Native species richness
0.0
0.5
1.0
1.5c
cc
co
oo
ov
vv
ve
ee
er
rr
r
1.2 1.3 1.4 1.5 1.6 1.7
Native species richness
0
1
2
3
bb
bb
ii
ii
oo
oo
mm
mm
aa
aa
ss
ss
ss
ss
1.2 1.3 1.4 1.5 1.6 1.7Native species richness
0.0
0.5
1.0
1.5
2.0
R R
R R
e e
e e
l l
l l
a a
a a
t t
t t
i i
i i
v v
v v
e e
e e
1.2 1.3 1.4 1.5 1.6 1.7Native species richness
0.00
0.05
0.10
0.15
0.20
1 2 3 4 5
Native species biomass
0.0
0.5
1.0
1.5
1 2 3 4 5
Native species biomass
0
1
2
3
1 2 3 4 5
Native species biomass
0.0
0.5
1.0
1.5
2.0
1 2 3 4 5
Native species biomass
0.00
0.05
0.10
0.15
0.20
y = -2.65x + 4.62R2 = 0.14 P = 0.012
y = -0.24x + 0.41R2 = 0.26 P = 0.001
y = -0.11x + 0.62R 2 = 0.02 P = 0.18
y = -1.36x + 1.92R2 = 0.16 P = 0.008
y = -0.14x + 1.24R2 = 0.001 P = 0.47
R2 = 0.04P = 0.12y = -0.22x + 1.70
y = -0.03x + 0.15R2 = 0.10 P = 0.03
R2 = 0.26P = 0.001y = -2.46x + 4.57
a
g h
e f
dc
b
Fig. 5. – The relationships between native plant species richness (a–d) and biomass (e–h) to alien species cover,biomass, relative cover, and relative biomass for 37 vegetation types. Data were log-transformed.

tive relationship with native species richness (Fig. 5a). The relationships of alien speciescover, biomass, relative cover, and relative biomass for the 37 vegetation types wereweaker for native biomass (as we calculated it; Fig. 5e-h) compared to native species rich-ness (Fig. 5a-d). There was considerable natural variation evident in all the graphs, andthree of the eight relationships were not significant (Fig. 5).
The cover, biomass, relative cover, and relative biomass of alien plant species werestrongly positively related to alien species richness per plot for the 37 vegetation types (Fig.6). These relationships were far stronger and more predictable than the relationships to na-
414 Preslia 78: 405–426, 2006
Table 2. – The mean coefficient of variation of native and alien species richness and cover in 1-m2 subplots (aver-aged by vegetation type). The minimum and maximum of the mean coefficient of variation among vegetationtypes are also presented.
Mean C.V. Min. Max.
Native species richness 5.3 0.52 0.3 0.8Native species cover 38.1 0.85 0.4 1.4Alien species richness 0.6 1.97 0.0 7.0Alien species cover 3.9 3.36 0.0 12.1
0.0 0.2 0.4 0.6 0.8 1.0
species richness
species richness
species richness
species richness
0.0
0.5
1.0
1.5
s
s
s
s
p
p
p
p
e
e
e
e
c
c
c
c
i
i
i
i
e
e
e
e
s
s
s
s
cc
oo
vv
ee
rr
0.0 0.2 0.4 0.6 0.8 1.0
0
1
2
3
bb
ii
oo
mm
aa
ss
ss
0.0 0.2 0.4 0.6 0.8 1.00.0
0.5
1.0
1.5
2.0
R
R
e
e
l
l
a
a
t
t
i
i
v
v
e
e
0.0 0.2 0.4 0.6 0.8 1.00.00
0.05
0.10
0.15
0.20
y = 0.89x - 0.12R2 = 0.57P = 0.0001
y = 2.20x - 0.20R2 = 0.58P = 0.0001
y = 0.14x - 0.002R2 = 0.43P = 0.0001
y = 1.50x + 0.34R2 = 0.52P = 0.0001
a
c d
b
Fig. 6. –The relationship of alien plant species richness to alien species cover, biomass, relative cover, and relativebiomass for 37 vegetation types. Data were log-transformed.

tive species richness per plot for the vegetation types (Fig. 5a–d). For example, 58% of thevariation in alien species biomass could be explained by a positive relationship with meanalien species richness for a vegetation type (Fig. 6b). Likewise, 57% of the variation in alienspecies cover could be explained by a positive relationship with alien species richness.
Habitat heterogeneity (i.e. the coefficient of variation in the richness or foliar cover ofnative or alien plant species in 1-m2 subplots) varied greatly for native and alien species(Table 2). For example, native species cover in 1-m2 subplots, with a coefficient of varia-tion of 85% of the mean was considerably more variable than native species richness per
Stohlgren et al.: Scale and plant invasions 415
0
0.4
0.8
1.2
1.6
0 0.2 0.4 0.6 0.8 1.0 1.2 1.4 1.6 1.8
y = 0.13x 3.84
R 2 = 0.22P < 0.05
0
0.2
0.4
0.6
0.8
1.0
1.2y = 0.39x 0.48
R 2 = 0.04P > 0.20
0
0.4
0.8
1.2
1.6
2.0y = 0.24x 3.50
R 2 = 0.24P < 0.05
Variation in native species coverin 1 -m2 subplots (log10C·V.)
RR
ee
ll
aa
tt
ii
vv
ee
spec
ies
biom
ass
spec
ies
cove
r
spec
ies
richn
ess
(100
0-m
2 )
Fig. 7. –The relationship between the coefficient of variation of the foliar cover of native plants in 1-m2 subplotsin each vegetation type and alien species richness, relative cover, and relative biomass. Data were log-transformed.

1-m2 (52%) in the same vegetation type. Meanwhile, the cover of alien species in 1-m2
subplots was about four times more variable than native species cover because only about60% of the subplots contained alien species, and because that foliar cover was verypatchily distributed in some types (maximum CV over 1200%; Table 2).
We assessed whether the variation in native species cover in a plot might allow spatialrefugia for the establishment and dominance of alien plant species. We found no relation-ship between alien plant species richness in 1000-m2 plots and variation of native foliarcover. However, we found significant positive relationships between the coefficient ofvariation of native cover and both the relative cover and relative biomass of alien plant spe-cies for the 37 vegetation types (Fig. 7). Power models fit the data better than linear, expo-nential, and polynomial models. The results suggested that the growth of alien plant spe-cies was significantly greater in vegetation types with higher spatial variability in nativespecies cover (Fig. 7).
Discussion
We demonstrate how the scale of observation influences our understanding of the patternsof invasion in many natural vegetation types. However, there are several caveats to obser-vational studies, and this study is no exception. We display statistical relationships be-tween native and alien species richness, cover, estimated biomass, and relative dominancerecognizing that cause and effect relationships cannot be determined by observationalstudies. We also recognize that the sites used in this study were only measured once, andthey may not be representative of the regional vegetation types in space or time (Hamiltonet al. 2005, Pyšek & Hulme 2005, Pauchard & Shea 2006). The studies employed stratifiedrandom sampling within major study areas (e.g. Rocky Mountain National Park, GrandStaircase-Escalante National Monument, riparian and upland sites, etc.), but this was nota stratified-random selection of plots or study sites throughout the region. Still, the datarepresent a broad range of environmental conditions in the region ranging from desertshrublands in Utah to tallgrass prairie in Minnesota, and from low-elevation grasslands toforests and high-elevation tundra (Fig. 1, Appendix 1 and 2). When these regional data areaugmented with site-specific study results for natural vegetation types in California (Sax2002, Keeley et al. 2003), Rhode Island (Bruno et al. 2004), and the southeast US (Brown& Peet 2003), a more complete and consistent evaluation of scale and invasion emerges,where invasion of alien plant species and coexistence with native plant species likely in-crease with spatial scale (Stohlgren et al. 1999, Knight & Reich 2005).
We emphasized comparisons of native to alien species relationships across scales from1 m2 to 1000 m2 (within plots). And, within a vegetation type, native species richness andcover could vary considerably (Table 1, Appendix 2). On average across vegetation types,alien species represent only 10% of the total foliar cover, and only 9% of the total speciesrichness per plot in a vegetation type. Only five vegetation types had > 10% cover of alienspecies (irrigated shortgrass steppe, the wet meadow type in Utah, disturbed pinyon-juni-per-sage, the perennial riparian type, and the desert mixed-grass type; Appendix 2). Thus,observed patterns may not represent other vegetation types or associations, or extremelydisturbed or highly invaded habitats, but they are corroborated in burned areas in Califor-nia (Keeley et al. 2003) and Utah (Evangelista et al. 2004).
416 Preslia 78: 405–426, 2006

We do not presume to distinguish among the many possible causes for the patterns we ob-served. Evaluating the complex processes of escape from pathogens and predators, nichesharing and overlap, quantifying seed dispersal (and longevity and viability in the soil), life-history characteristics and many other potential causal factors are beyond the scope of thisinvestigation (Hamilton et al. 2005). We assume that the patterns we observed follow well-established observations about natural ecosystems: (1) both native and alien species richnessgenerally increase with the area surveyed (Arrhenius 1921, Stohlgren et al. 1999); and (2)environmental heterogeneity also increases with spatial scale (Palmer 1994, Jiang & Morin2004, Davies et al. 2005), and this likely influences establishment and growth of alien spe-cies where propagules are available (Table 1, Figs 2–4 and 7). Thus, it is likely that the ratesof immigration of native plant species and the invasion of alien species are heavily influ-enced by a multitude of factors that co-vary with spatial and temporal scales such as climateand weather, vegetation structure, micro- and macro-disturbances, resource availability, spe-cies pools and propagule pressure, and associated ecosystem processes (e.g. herbivory, com-petition, disease, hybridization, adaptation).
Effects of scale on the establishment of alien species
We were surprised to find that: (1) at the 1-m2 scale, about 60% of the vegetation types hadpositive relationships between native and alien species richness; (2) only two vegetationtypes maintained negative relationships between native and alien species richness asscales increased to 1000 m2; and (3) the mean slope of the relationship between native andalien species increased significantly from the 1- to 1000-m2 scale (Fig. 2). However, thesefindings provide possible mechanisms for previously reported patterns (Stohlgren et al.1999, 2003) and perhaps observational studies in other vegetation types in California (Le-vine 2000, Keeley et al. 2003), Rhode Island (Bruno et al. 2004), and North Carolina(Brown & Peet 2003, Fridley et al. 2004): positive relationships strengthen between nativeand alien species richness at scales > 1-m2. A statistical caveat is that at very small spatialscales, the relationship between native and alien species may be affected by the sizes of in-dividuals (Fridley et al. 2004). So we tend to emphasize the more significant and positiverelationships between native and alien species richness at scales >100-m2.
In the individual plant’s extended neighbourhood (from 100 m2 to 1000 m2 in the samehabitat), it was clear that the average slope of the relationship between native and alienspecies richness increased in a significant, non-linear pattern (Fig. 2), and that native andalien species accumulation were positively associated (Fig. 3). It is well established thatspecies richness increases with area (Arrhenius 1921, Palmer 1994). In our study areas,native plant species richness increased faster than alien plant species richness with plotarea. We propose that similar factors associated with native species increases with area,such as habitat heterogeneity, extensions of environmental gradients, and increased proba-bilities of encountering disturbed habitats or micro habitats, also are responsible for in-creasing establishment of alien plant species as the spatial scale of observation is increased(Stohlgren et al. 1999, 2001, 2002, 2003). Fewer species in the local and regional speciespools, time since invasion, and many other factors may have contributed to the less-steepspecies-area relationship for alien plant species in the study areas.
It was intriguing to measure a weakening relationship between alien species richnessand native species foliar cover with increasing area, despite an increase in native species
Stohlgren et al.: Scale and plant invasions 417

richness with area and an increasing positive relationship between native species richnessand foliar cover per plot across vegetation types (Table 1). It must be that despite the in-creasing number of native species in the extended plant neighbourhood, opportunities stillexist in many vegetation types for the increasing establishment of alien species. We sus-pect that even modest changes in the spatial extent of the study (e.g. 1 m2 to 10 m2, or 10 m2
to 100 m2, etc.) may add considerably to local heterogeneity, niche availability, small-scaledisturbances, or resource availability related to plant mortality, herbivory, or loss of com-petition prowess as a result of age, pathogens, climate, or many other factors that favourco-existence (Table 2; also see Huston 2004, Levine et al. 2004).
A Theory of “Biotic Acceptance”
We speculate that early in the invasion of any area greater than 1 m2 (Figs. 2, 3), native spe-cies greatly outnumbered newly arriving invaders, but that biotic resistance (Fig. 5) be-comes overwhelmed by “biotic acceptance” (Figs 2–4 and 6), where co-existence (Levineet al. 2003, 2004) is a stronger force than competitive exclusion (Grime 1973, Corbin &D’Antonio 2004), resulting in the broad-scale establishment of many alien species. Thetheory of biotic acceptance would suggest that natural ecosystems tend to accommodatethe establishment and coexistence of introduced species despite the presence and abun-dance of native species (Table 3). This is in sharp contrast to the previous framework of bi-otic resistance, where competitive exclusion is the dominant mechanism determining thestructure and composition of communities. Our data strongly supported this theory ofbiotic resistance across scales from meters to regions. Disturbance and increasing habitatsuitability for invasive species, along with a positive feedback cycle due to increasedpropagule pressure (from growing “source” populations of invasive species) may furtherfacilitate the invasion process (Hobbs & Huenneke 1992, D’Antonio et al. 1999, Levine etal. 2004, Pyšek & Hulme 2005).
What can we say about the potential of biotic acceptance in the establishment phase ofthe invasion process? Based on these landscape- to regional-scale datasets, we would pre-dict that across the United States, the introduction and establishment of alien plant species(i.e. biotic acceptance) would be greatest in areas high in native species richness and withoptimal conditions for plant growth. This is exactly the pattern observed at county, state,region, and national scales (Brown & Peet 2003, Stohlgren et al. 2003, 2005a, 2006, Cro-sier & Stohlgren 2004, Dark 2004). Strikingly similar results have been reported for SouthAfrica (Richardson et al. 2005).
These very broad-scale patterns might be predicted by a variety of conceptual models(Shea & Chesson 2002, Huston 2004, Tilman 2004). However, only Huston’s (2004) dy-namic equilibrium model fits our observations at the scales of plant neighbourhoods,plots, vegetation types, regions, and the nation. The dynamic equilibrium model allows forextrinsic factors and species diversity to increase across all spatial scales, productivity gra-dients, and disturbance regimes within vegetation types or across regions.
Effects of scale on alien species dominance
For an alien plant species to attain dominance amongst well-established native plant spe-cies remains a difficult task. The establishing alien species must compete in environmentswhere native species richness and cover are significantly positively related at 1-m2 scales
418 Preslia 78: 405–426, 2006

(R2 = 0.35; P< 0.0001), and where native species richness and estimated biomass are sig-nificantly positively related at 1000-m2 scales across all vegetation types (R2 = 0.14; P <0.0001). So, it was not surprising to see some local (plot-scale) evidence of biotic resis-tance. However, many of the relationships between native and alien species richness,cover, and biomass are weak (i.e. R2 values ranging from 0.001 to 0.36) with an average ofonly 12% of the variation explained at the 1000-m2 scale (Fig. 5). Many other factors mustbe important in determining invasion success in space and time (Stohlgren et al. 1999,Bashkin et al. 2003, Huston 2004).
Availability of light, water, and nutrients may be important in invasion success (i.e. therelative cover of alien plant species). While only five of the 37 vegetation types studied had>10% relative cover of alien plant species, four of those vegetation types had higher wateravailability relative to surrounding vegetation types: irrigated shortgrass steppe (alien rel-ative cover = 40%), wet meadow in Utah (35%) perennial riparian areas in Utah (17%),and freshwater springs in Utah (16%). Likewise, the burned pinyon-juniper-sage type inUtah had 15% relative cover of alien species perhaps reflecting greater light, water, and ni-trogen/phosphorus availability combined with decreased competition from native shrubsand trees, which were consumed by the fire (Evangelista et al. 2004). Desert mixed grassplots with 21% relative alien species cover typically have higher native species richness,soil fertility, plant production, and corresponding higher levels of grazing than adjacent,more xeric plant associations (e.g. blackbrush, desert shrub types; Bashkin et al. 2003, Ap-pendix 1). Within the scale of a few hectares, we often have observed small nutrient-richsites serving as focal points of invasion (Stohlgren et al. 1997, 1998b, 1999, 2001).
There are several ways in which a alien species might become locally dominant in natu-ral landscapes. Local, infrequent disturbances such as fire (Fox & Fox 1986, Keeley et al.2003) and flooding (DeFerrari & Naiman 1994) often have been proposed as prerequisitesfor invasion success, but we believe more gradual and wide-spread invasions may be moretypical at landscape scales (Stohlgren et al. 1997, 1999), regional scales (Stohlgren et al.2002), and national scales as alien species establish and reproduce in favourable climates,
Stohlgren et al.: Scale and plant invasions 419
Table 3. – General comparison of the theories of biotic resistance and biotic acceptance.
Biotic Resistance Biotic Acceptance
Definition “Forces of nature”, natural processes orecosystem properties that contribute toa reduction in the rate of establishment andspread of introduced species. [paraphrasingElton 1958 by D’Antonio & Thomsen 2004]
Where natural ecosystems tend toaccommodate the establishment andcoexistence of introduced species despite thepresence and abundance of native species.[This paper]
Proposedmechanisms
Competitive exclusion, predation, herbivory,pathogens, among others.
Individual and species turnover in space andtime, habitat heterogeneity, disturbance, openniches, and dispersal, among others.
Primaryassumptions
Assumes neighbourhood interactions scaledirectly to large areas and determinecommunity structure and composition.
Assumes environmental heterogeneity,environmental gradients, disturbance andturnover increase with spatial scale.

on fertile soils, and in conjunction with other factors that also contribute to high native spe-cies diversity (Stohlgren et al. 2003, 2005a, b, 2006).
The strong relationships between alien species richness and alien cover or biomass maybe cause for concern (Fig. 6). These field data (Figs 4 and 6), and continental-scale find-ings (Stohlgren et al. 2003, 2005a, 2006) strongly suggest that the continued establish-ment of alien plants may be directly linked to the factors responsible for growth, cover, andbiomass of other alien plants in the wide range of vegetation types studied (Fig. 6). Within-plot habitat heterogeneity (Fig. 7, Davies et al. 2005) combined with high resource avail-ability (e.g. energy/water/nutrients; Bashkin et al. 2003, Stohlgren et al. 2005b) and dis-turbance (Fox & Fox 1986) may promote the coexistence of native and alien species (Fig.4). However, we are also learning that habitat heterogeneity around plots (~240 m diame-ter) may also contribute to coexistence (Kumar et al. 2006). It is too early to tell if therewill be widespread dominance of alien species as is evident in the lowlands in Hawaii(Mack et al. 2000), the foothills of California (Keeley et al. 2003), and some riparian zonesin the United States (DeFerrari & Naiman 1994, Stohlgren et al. 1998b).
Acknowledgements
Funding for the vegetation sampling in Colorado was provided by the U.S. Geological Survey, while the fundingfor sampling in the Grand Staircase-Escalante National Monument, Utah, was provided by the Bureau of LandManagement. This work would have been impossible without the enthusiastic services of over 30 research assis-tants, graduate students, and volunteers. We received logistic support from the staffs of Rocky Mountain NationalPark, Grand Staircase-Escalante National Monument, the USGS Fort Collins Science Center, and the Natural Re-source Ecology Laboratory at Colorado State University. Other studies used in the synthesis were either funded orsupported by the USDA Forest Service, the National Biological Survey (Service), the National Park Service, andthe Environmental Protection Agency. Current funding for synthesis and analysis was obtained from NASA andthe U.S. Geological Survey. Alycia Crall and anonymous reviewers provided very helpful comments to earlierversions of the manuscript. To all we are grateful.
Souhrn
V práci je analyzován vztah mezi druhovou bohatostí, pokryvností a odhadnutou biomasou původních a nepůvod-ních druhů v různém prostorovém měřítku. Datový soubor zahrnoval 7051 ploch velikosti 1 m2, 1443 velikosti10 m2 a 727 velikosti 100 m2, vřazených do 727 1000 m2 velkých ploch, rozmístěných v 37 typech přirozené vege-tace sedmi států centrální části USA. Druhová bohatost původních a nepůvodních druhů (vyjádřená jako průměrpro všechny vegetační typy) průkazně rostla s velikostí plochy. Se zvětšujícím se měřítkem byl vztah mezi oběmaproměnnými průkaznější a vzrůstala četnost pozitivních vztahů (u ploch velikosti 1000 m2 byl nalezen pozitivnívztah v 80 % případů). Jak původní, tak nepůvodní druhy pravděpodobně reagují na dostupnost zdrojů, jež narůs-tá s měřítkem studia, a stanovištní heterogenitu, jež se zvětšuje se stoupající velikostí plochy. Byl nalezen průkaz-ný pozitivní vztah mezi stanovištní heterogenitou vegetačního typu, vyjádřenou jako hodnota variačního koefici-entu pokryvnosti původních druhů v 1 m2 plochách, a relativní pokryvností a relativní biomasou nepůvodníchdruhů. Pro měřítko 1000 m2 byl zjištěn slabý negativní vztah mezi bohatostí původních druhů a bohatostí, po-kryvností, biomasou a relativní pokryvností nepůvodních druhů, ale velmi silný pozitivní vztah mezi bohatostínepůvodních druhů a jejich pokryvností, relativní pokryvností a relativní biomasou. Tyto výsledky, podpořenémnoha dalšími studiemi v přirozené vegetaci, podporují teorii „biotické akceptance“, podle níž do přirozenýchekosystémů pronikají nepůvodní druhy bez ohledu na přítomnost původních druhů a jejich abundanci.
420 Preslia 78: 405–426, 2006

References
Arrhenius O. (1921): Species and area. – J. Ecol. 9: 95–99.Bashkin M., Stohlgren T. J., Otsuki Y., Lee M., Evangelista P. & Belnap J. (2003): Soil characteristics and plant
exotic species invasions in the Grand Staircase-Escalante National Monument, Utah, USA. – Appl. Soil Ecol.22: 67–77.
Brown R. L. & Peet R. K. (2003): Diversity and invasibility of southern Appalachian plant communities. – Ecol-ogy 84: 32–39.
Bruno J. F., Kennedy C. W., Rand T. A. & Grant M. B. (2004): Landscape-scale patterns of biological invasions inshoreline plant communities. – Oikos 107: 531–540.
Case T. J. (1990) Invasion resistance arises in strongly interacting species-rich model competition communities. –Proc. Natl. Acad. Sci. USA 87: 9610–9614.
Chong G. W. (2002): Multi-scale sampling of native and non-native plant diversity: examples of data analyses andapplications. – Thesis, Colorado State University, Fort Collins.
Chytrý M., Pyšek P., Tichý L., Knollová I. & Danihelka J. (2005): Invasions by alien plants in the Czech Republic:a quantitative assessment. – Preslia 77: 339–354.
Comstock J. P. & Elhleringer J. R. (1992): Plant adaptation in the Great Basin and Colorado Plateau. – Great Ba-sin Natur. 52: 195–215.
Corbin J. D. & D’Antonio C. M. (2004) Competition between native perennial and exotic annual grasses: Impli-cations for an historical invasion. – Ecology 85: 1273–1283.
Crosier C.S. & Stohlgren T. J. (2004): Improving biodiversity knowledge with data set synergy: A case study ofnonnative plants in Colorado. – Weed Technol. 18: 1441–1444.
D’Antonio C. M., Dudley T. L. & Mack M. (1999): Disturbance and biological invasions: direct effects and feed-backs. – In: Walker L. R. (ed.), Ecosystems of disturbed ground, p. 413–452, Elsevier, New York.
D’Antonio C. M. & Thomsen M. (2004): Ecological resistance in theory and practice. – Weed Technol. 18:572–1577.
Dark S. J. (2004): The biogeography of invasive alien plants in California: an application of GIS and spatial re-gression analysis. – Diversity Distrib. 10: 1–9.
Davies K. E., Chesson P., Harrison S., Inouye B. D., Melbourne B. A. & Rice K. J. (2005): Spatial heterogeneityexplains the scale dependence of the native-exotic diversity relationship. – Ecology 86: 1602–1610.
DeFerrari C. M. & Naiman R. J. (1994): A multi-scale assessment of the occurrence of exotic plants on the Olym-pic Peninsula, Washington. – J. Veget. Sci. 5: 247–258.
Elton C. S. (1958): The ecology of invasions by animals and plants. – Methuen, London.Evangelista P., Stohlgren T. J., Guenther D. & Stewart S. (2004): Vegetation response to fire and postburn seeding
treatments in juniper woodlands of the Grand Staircase-Escalante National Monument, Utah. – WesternNorth Amer. Natur. 64: 293–305.
Fox M. D. & Fox B. J. (1986): The susceptibility of natural communities to invasion. – In: Groves R. H. & BurdonJ. J. (eds.), Ecology of biological invasions: An Australian perspective, p. 57–66, Cambridge Univ. Press,Cambridge.
Fridley J. D., Brown R. L. & Bruno J. E. (2004): Null models of exotic invasion and scale-dependent patterns ofnative and exotic species richness. – Ecology 85: 3215–3222.
Fridley J. D., Stachowicz J. J., Naeem S., Sax D. F., Seabloom E. W., Smith M. D., Stohlgren T. J., Tilman D. &Von Holle B. (2006): The invasion paradox: reconciling pattern and process in species invasions. – Ecology(in press).
Grime J. P. (1973): Competitive exclusion in herbaceous vegetation. – Nature 242: 344–347.Hamilton M. A., Murray B. R., Cadotte M. W., Hose G. C., Baker A. C., Harris C. J. & Licari D. (2005): Life-his-
tory correlates of plant invasiveness at regional and continental scales. – Ecol. Lett. 8: 1066–1074.Hobbs R. J. & Huenneke L. F. (1992): Disturbance, diversity, and invasion: implications for conservation. –
Conserv. Biol. 6: 324–337.Hubbell S. P. (2001): The unified neutral theory of biodiversity and biogeography. – Princeton Univ. Press,
Princeton.Huston M. A. (1997): Hidden treatments in ecological experiments: re-evaluating the ecosystem function of
biodiversity. – Oecologia 110: 449–460Huston M. A. (2004): Management strategies for plant invasions: manipulating productivity, disturbance, and
competition. – Diversity Distrib. 10: 167–178.Jiang L. & Morin P. J. (2004): Productivity gradients cause positive diversity-invasibility relationships in micro-
bial communities. – Ecol. Lett. 7: 1047–1057.
Stohlgren et al.: Scale and plant invasions 421

Keeley J. E., Lubin D. & Fotheringham C. J. (2003) Fire and grazing impacts on plant diversity and alien plant in-vasions in the southern Sierra Nevada. – Ecol. Appl. 13: 1355–1374.
Kennedy T. A., Naeem S., Howe K. M., Knops J. M. H., Tilman D. & Reich P. (2002): Biodiversity as a barrier toecological invasion. – Nature 417: 636–638.
Knight K. S. & Reich P. B. (2005): Opposite relationships between invasibility and native species richness atpatch versus landscape scales. – Oikos 109: 81–88.
Knops J. M. H., Tilman D., Naeem S. & Howe K. M. (1997): Biodiversity and plant invasions in experimentalgrassland plots. – Bull. Ecol. Soc. Amer. 18: 125.
Kumar S., Stohlgren T. J. & Chong G.W. (2006): Effects of spatial heterogeneity on native and non-native plantspecies richness. – Ecology (in press).
Lee M. (2001): Non-native plant invasions in Rocky Mountain National Park: Linking species traits and habitatcharacteristics. – Thesis, Colorado State University, Fort Collins.
Levine J. M. (2000): Species diversity and biological invasions: relating local process to community pattern. –Science 288: 852–854.
Levine J. M., Adler P. B. & Yelenik S. G. (2004): A meta-analysis of biotic resistance to exotic plant invasions. –Ecol. Lett. 7: 975–989.
Levine J. M., Vila M., D’Antonio C. M., Dukes J. S., Grigulis K. & Lavorel S. (2003): Mechanisms underlyingthe impacts of exotic plant invasions. – Proc. R. Soc. London B 270: 775–781.
Mack R. N., Simberloff D., Lonsdale M., Evans H., Clout M. & Bazzaz F. (2000): Biotic invasions: causes, epide-miology, global consequences and control. – Issues in Ecology 5: 1–20.
Palmer M. W. (1994): Variation in species richness: toward a unification of hypotheses. – Folia Geobot. Phytotax.29: 511–530.
Pauchard A. & Shea K. (2006): Integrating the study of non-native plant invasions across spatial scales. – Biol.Invas. 8: 399–413.
Pyšek P. & Hulme P. E. (2005): Spatio-temporal dynamics of plant invasions: Linking pattern to process. –Ecoscience 12: 302–315.
Rejmánek M. (1996): Species richness and resistance to invasions. – In: Orians H., Dirzo R. & Cushman J. H.(eds.), Biodiversity and ecosystem processes in tropical forests, Ecological Studies 122, p. 153–172,Springer-Verlag, Berlin.
Richardson D. M. & Pyšek P. (2006): Plant invasions: merging the concepts of species invasiveness and commu-nity invasibility. – Progr. Phys. Geogr. 30: 409–431.
Richardson D. M., Rouget M., Ralston S. J., Cowling R. M., Van Rensburg B. J. & Thuiller W. (2005): Speciesrichness of alien plants in South Africa: Environmental correlates and the relationship with indigenous plantspecies richness. – Ecoscience 12: 391–205.
Sax D. F. (2002): Native and naturalized plant diversity are positively correlated in scrub communities of Califor-nia and Chile. – Diversity Distrib. 8: 193–210.
Shea K. & Chesson P. (2002): Community ecology theory as a framework for biological invasions. – Trends Ecol.Evolut. 17: 170–176.
Shultz L. M. (1998): The flora and fauna of the Colorado Plateau: What do we know? – In: Hill L. M. (ed.), Learn-ing from the land, Grand Staircase-Escalante National Monument Science Symposium, p. 203–210, ParagonPress, Salt Lake City.
Stohlgren T. J., Barnett D., Flather C., Fuller P., Peterjohn B., Kartesz J. & Master L. L. (2006): Species richnessand patterns of invasion in plants, birds, and fishes in the United States. – Biol. Invas. 8: 427–447.
Stohlgren T. J., Barnett D. T. & Kartesz J. (2003): The rich get richer: patterns of plant invasions in the UnitedStates. – Front. Ecol. Environ. 1: 11–14.
Stohlgren T. J., Barnett D. T., Flather C., Kartesz J. & Peterjohn B. (2005a): Plant species invasions along the lati-tudinal gradient in the United States. – Ecology 86: 2298–2309
Stohlgren T. J., Binkley D., Chong G. W., Kalkhan M. A., Schell L. D., Bull K. A., Otsuki Y., Newman G.,Bashkin M. & Son Y. (1999): Exotic plant species invade hot spots of native plant diversity. – Ecol. Monogr.69: 25–46.
Stohlgren T. J., Bull K. A. & Otsuki Y. (1998a): Comparison of rangeland vegetation sampling techniques in theCentral Grasslands. – J. Range Manage. 51: 164–172.
Stohlgren T. J., Bull K. A., Otsuki Y., Villa C. A. & Lee M. (1998b): Riparian zones as havens for exotic plant spe-cies. – Plant Ecol. 138: 113–125.
Stohlgren T. J., Chong G. W., Kalkhan M. A. & Schell L. D. (1997): Rapid assessment of plant diversity patterns:a methodology for landscapes. – Environ. Monitor. Assessm. 48: 25–43.
422 Preslia 78: 405–426, 2006

Stohlgren T. J., Chong G. W., Schell L. D., Rimar K. A., Otsuki Y., Lee M., Kalkhan M. A. & Villa C. A. (2002):Assessing vulnerability to invasion by nonnative plant species at multiple spatial scales. – Environ. Manage.29: 566–577.
Stohlgren T. J., Falkner M. B. & Schell L. D. (1995): A modified-Whittaker nested vegetation sampling method. –Vegetatio 117: 113–121.
Stohlgren T. J., Guenther D. A., Evangelista P. H. & Alley N. (2005b): Patterns of plant species richness, rarity,endemism, and uniqueness in an arid landscape. – Ecol. Appl. 15: 715–725.
Stohlgren T. J., Otsuki Y., Villa C.A., Lee M. & Belnap J. (2001): Patterns of plant invasions: a case example innative species hotspots and rare habitats. – Biol. Invas. 3: 37–50.
Tilman D. (1997): Community invasibility, recruitment limitation, and grassland biodiversity. – Ecology 78:81–92.
Tilman D. (2004): Niche tradeoffs, neutrality, and community structure: A stochastic theory of resource competi-tion, invasion, and community assembly. – Proc. Natl. Acad. Sci. USA 101: 10854–10861.
Waters M. A. (2003): Species richness, vegetation cover, and disturbance relationships in an arid ecosystem. –Thesis, Colorado State University, Fort Collins.
Received 18 May 2006Revision received 17 August 2006
Accepted 31 August 2006
Appendix 1. – Vegetation types and codes (i.e. short names) identified in this and previous studies (Stohlgren etal. 1998b, 1999, 2001, 2002), site descriptions, locations, and number of 1000 m2 sample plots (n).
Vegetation typecode
Description and location n
Aspen Populus tremuloides stands in Grand Staircase-Escalante National Monument, UT 6
AspenCO Populus tremuloides stands in the Colorado Rocky Mountains 45
AspenOldCO Decadent Populus tremuloides stands in Arapaho-Roosevelt National Forest, CO 5
Blackbrush Coleogyne ramosissima dominated stands in Grand Staircase-Escalante Na-tional Monument, UT
27
CushMG Cushion plant communities and mixed grass prairie dominated areas in NorthernWY
8
Desert Shrub Ephedra spp., Gutierrezia sarothrae , Atriplex confertifolia, Ceratoides lanataand Chrysothamnus spp. dominated stands in Grand Staircase-Escalante Na-tional Monument, UT
29
DesertMG Desert Mixed Grass prairie of Badlands National Park, SD 8
DesertShGr Desert shrub species mixed with Stipa spp., Hilaria jamesii, Agropyron smithii,Bouteloua gracilis, and Bromus tectorum in Grand Staircase-Escalante NationalMonument, UT
16
Douglas fir Psuedotsuga menziesii stands in Northern CO Rocky Mountains 10
Dry meadow Carex helianthus and Artemisia tridentata dominated meadows in Rocky Moun-tain National Park, CO
9
Juniper Juniperus osteosperma stands in Grand Staircase-Escalante National Monu-ment, UT
37
Lodgepole Pinus contorta stands in Rocky Mountain National Park, CO 23
MixGrPrWyo Mixed grass prairie of Bouteloua gracilis, Koeleria pyramidata, Stipa comata,and Artemisia frigida in Southeastern WY
4
Stohlgren et al.: Scale and plant invasions 423

NMixGrPrMT Northern mixed grass prairie dominated by Poa pratensis, Stipa comata,Bromus japonicus, and Agropyron smithii in north-eastern WY, eastern MT, andwestern SD
57
PerenRipUT Populus fremontii , Tamarix spp., Salix spp., and Elaeagnus angustifolia standsin Grand Staircase-Escalante National Monument, UT
22
Pinyon Pine Pinus edulis stands in Grand Staircase-Escalante National Monument, UT 6
Pinyon-Junip P. edulus / Juniperus osteosperma mixed stands in Grand Staircase-EscalanteNational Monument, UT
114
PJManz P. edulis / J. osteosperma /Arctostaphylos patula mixed stands in Grand Stair-case-Escalante National Monument, UT
6
PJOak P. edulis / J. osteosperma / Quercus spp. mixed stands in Grand Staircase-Escalante National Monument, UT
18
PJSageDist Post-fire of P. edulis / J. osteosperma / Artemisia tridentata stands in GrandStaircase-Escalante National Monument, UT, samples a few years after burning.
28
PondPineCO Pinus ponderosa stands in Northern CO Rocky Mountains 32
PondPineUT Pinus ponderosa stands in Grand Staircase-Escalante National Monument, UT 7
Rabbitbrush Chrysothamnus nauseosus dominated stands in Grand Staircase-Escalante Na-tional Monument, UT
9
SageBrCO Artemesia tridentata dominated areas in western CO and southwestern WY 33
SageBrUT A. tridentata stands in Grand Staircase-Escalante National Monument, UT 37
MntShrubUT Cercocarpus montanus, Purshia mexicana, Amelanchier spp., andSymphoricarpos spp. dominated overstory in Grand Staircase-Escalante Na-tional Monument, UT
12
ShoGRStCUp Bouteloua gracilis and Opuntia spp. dominated Short grass steppe in Eastern CO 8
ShortGRStIrr Bromus inermis, Juncus balticus, Mulenbergia asperifolia, and Hordeumjubatum dominated area in the San Luis Valley, CO
8
Spring Scirpus and Juncus spp. dominated stands in Grand Staircase-Escalante Na-tional Monument, UT
2
Spruce Fir Picea engelmannii / Abies lasiocarpa stands in Rocky Mountain National Park, CO 11
Subalpine Pinus flexilis and A. lasiocarpa stands in Rocky Mountain National Park, CO 17
tallgrass pr Bromus inermis, Aster oblongifolia, and Symphoricarpos occidentalis domi-nated tallgrass prairie at Pipestone National Monument, Minnesota
4
Tundra High elevation alpine tundra in Rocky Mountain National Park, CO 36
WetMeadCO Poa palustris, P. interior and Deschampsia caespitosa dominated meadows inRocky Mountain National Park, CO
12
WetMeadUT Juncus, Carex and Poa spp. mixed meadows in Grand Staircase-Escalante Na-tional Monument, UT
3
wetMeadYELL Festuca idahoensis and Artemisia tridentata dominated wet meadows in Yel-lowstone National Park, WY
9
Willow Salix spp. dominated stands in Rocky Mountain National Park, CO 9
424 Preslia 78: 405–426, 2006

Appendix 2. – Mean native (nat) and alien (ali) plant species richness (rich) and cover (cov) at the 1-m2 scale, andmean native and alien plant species richness at the 10-m2, 100-m2, and 1000-m2 scale, respectively, by vegetationtype. Standard errors (SE) on second row of each vegetation type.
n nat rich1 m2
ali rich1 m2
nat cov%
ali cov%
nat rich10 m2
ali rich10 m2
nat rich100 m2
ali rich100 m2
nat rich1000 m2
ali rich1000 m2
Aspen 60 4.4 0.9 52.8 8.0 7.7 1.1 16.3 2.8 31.7 4.7SE 0.2 0.1 4.6 2.1 0.6 0.1 1.4 0.7 3.2 1.0
AspenCO 448 9.2 0.4 88.6 2.5 16.5 0.8 27.4 1.4 46.7 3.7SE 0.2 0.0 2.6 0.3 0.6 0.2 1.1 0.3 1.7 0.6
AspenOldCO 50 7.0 0.0 71.6 0.0 15.1 0.0 19.4 0.0 44.6 0.4SE 0.6 0.0 6.1 0.0 3.2 0.0 4.1 0.0 4.4 0.2
Blackbrush 253 3.8 0.6 26.7 2.6 6.3 0.7 11.2 0.9 20.4 1.2SE 0.1 0.0 1.4 0.4 0.3 0.1 0.9 0.2 1.1 0.2
CushMG 80 4.6 0.9 26.2 7.1 8.5 1.3 14.9 3.5 24.8 4.5SE 0.2 0.1 2.9 1.6 1.0 0.4 1.2 1.2 3.1 1.6
Desert Shrub 270 3.9 0.7 13.0 1.8 7.5 0.9 11.2 1.3 21.6 1.9SE 0.1 0.0 0.9 0.3 0.5 0.1 1.0 0.2 1.5 0.2
DesertMG 80 5.4 1.9 29.4 10.9 8.6 2.6 13.9 4.1 26.6 7.6SE 0.2 0.2 2.3 2.3 1.0 0.4 1.9 0.8 2.8 0.8
DesertShGr 157 5.1 0.8 20.0 2.3 8.9 1.1 12.8 1.1 25.2 1.6SE 0.2 0.1 1.6 0.3 0.5 0.1 1.2 0.2 1.7 0.2
Douglas fir 100 5.7 0.0 49.9 0.0 10.3 0.2 18.9 0.1 37.4 1.0SE 0.5 0.0 4.3 0.0 1.7 0.1 3.0 0.1 6.2 0.4
Dry meadow 90 9.0 0.7 38.6 2.2 15.8 0.9 25.2 1.6 39.4 2.9SE 0.4 0.1 1.7 0.4 1.2 0.2 2.9 0.3 3.4 0.6
Juniper 350 3.9 0.6 18.2 3.5 7.1 0.8 11.9 1.2 24.0 1.8SE 0.1 0.0 1.3 0.5 0.4 0.1 0.9 0.2 1.4 0.2
Lodgepole 195 2.9 0.1 29.1 0.4 6.3 0.1 11.7 0.2 22.9 0.8SE 0.1 0.0 2.2 0.4 0.5 0.0 1.2 0.1 1.9 0.2
MixGrPrWyo 40 9.3 0.1 40.9 0.0 14.5 0.5 21.3 0.5 29.3 2.5SE 0.4 0.1 3.3 0.0 2.0 0.4 3.1 0.3 2.5 1.3
NMixGrPrMT 481 5.7 0.8 26.7 4.0 9.5 1.2 15.8 2.2 27.1 4.4SE 0.2 0.1 1.0 0.4 0.6 0.1 1.0 0.3 1.4 0.4
PerenRipUT 193 3.0 1.1 32.6 12.3 5.7 2.0 10.6 2.9 24.5 5.8SE 0.1 0.1 2.6 1.6 0.5 0.2 1.1 0.3 2.1 0.4
Pinyon Pine 59 3.2 0.3 31.2 0.9 5.5 0.3 12.0 0.5 23.7 0.8SE 0.2 0.1 4.7 0.3 0.8 0.1 1.1 0.3 2.6 0.4
Pinyon-Junip 1064 3.3 0.3 25.6 1.4 6.2 0.4 11.2 0.6 23.2 1.1SE 0.1 0.0 0.9 0.2 0.2 0.0 0.4 0.1 0.7 0.1
PJManz 60 4.8 0.1 33.3 0.1 7.3 0.1 18.7 0.2 32.7 0.3SE 0.3 0.0 3.8 0.0 1.1 0.1 1.6 0.2 2.0 0.2
PJOak 175 4.1 0.2 41.6 0.4 8.4 0.3 14.7 0.3 30.2 1.2SE 0.2 0.0 2.9 0.1 0.7 0.1 1.1 0.1 1.9 0.4
PJSageDist 280 2.8 1.8 12.8 12.6 5.2 2.4 9.2 3.2 16.7 3.8SE 0.1 0.1 1.1 0.9 0.5 0.2 0.9 0.3 1.4 0.4
PondPineCO 296 5.5 0.2 37.0 0.5 12.5 0.5 21.0 0.7 34.3 1.9SE 0.2 0.0 2.1 0.1 1.1 0.1 1.4 0.2 1.9 0.3
PondPineUT 68 3.5 0.2 37.6 0.9 6.9 0.3 13.3 0.6 26.3 0.6SE 0.3 0.1 4.6 0.5 0.8 0.1 1.7 0.2 2.3 0.2
Rabbitbrush 89 2.4 0.6 17.5 4.7 5.3 0.7 10.2 1.3 23.0 3.0SE 0.2 0.1 2.9 1.6 0.7 0.2 1.3 0.3 1.5 0.6
SageBrCO 327 5.3 0.7 29.9 3.4 10.2 1.0 14.7 1.5 25.5 2.4SE 0.2 0.0 1.3 0.3 0.7 0.1 1.3 0.2 2.4 0.3
SageBrUT 368 3.7 0.6 25.4 3.2 6.2 0.8 9.4 1.0 20.0 1.6SE 0.1 0.0 1.3 0.4 0.4 0.1 0.9 0.2 1.4 0.2
MntShrubUT 112 2.8 0.2 20.3 0.6 5.1 0.2 8.8 0.5 18.9 1.6
Stohlgren et al.: Scale and plant invasions 425

n nat rich1 m2
ali rich1 m2
nat cov%
ali cov%
nat rich10 m2
ali rich10 m2
nat rich100 m2
ali rich100 m2
nat rich1000 m2
ali rich1000 m2
SE 0.2 0.0 2.3 0.3 0.4 0.1 1.2 0.2 1.4 0.5ShoGRStCUp 80 5.8 0.0 34.8 0.0 10.4 0.1 17.4 0.9 37.9 0.9
SE 0.3 0.0 2.4 0.0 0.7 0.1 2.4 0.5 5.1 0.4ShortGRStIrr 80 4.3 2.9 34.1 32.2 7.4 5.2 12.0 6.9 20.0 10.0
SE 0.2 0.3 2.5 3.6 0.7 0.9 1.5 1.5 1.3 2.0Spring 18 1.8 0.2 31.4 5.5 5.0 0.3 14.0 1.5 38.5 6.5
SE 0.3 0.1 8.1 3.8 0.6 0.3 1.0 0.5 3.5 2.5Spruce Fir 101 6.2 0.1 65.8 0.1 11.1 0.2 20.2 0.3 33.5 0.5
SE 0.4 0.0 4.8 0.1 1.4 0.1 3.4 0.2 5.9 0.2Subalpine 163 4.0 0.1 48.8 0.6 10.7 0.2 16.4 0.4 27.9 0.9
SE 0.2 0.0 3.1 0.3 1.2 0.1 2.1 0.2 2.6 0.3Tallgrass pr 40 7.7 0.2 47.0 0.6 11.6 0.8 18.3 1.5 29.3 3.3
SE 0.5 0.1 4.8 0.4 1.9 0.4 3.0 0.6 2.8 0.9Tundra 359 13.9 0.0 54.4 0.0 20.6 0.0 28.3 0.0 38.3 0.1
SE 0.2 0.0 1.0 0.0 0.6 0.0 1.1 0.0 1.6 0.0WetMeadCO 120 7.3 0.4 66.4 4.2 11.8 0.7 19.5 1.4 35.6 3.8
SE 0.3 0.1 2.9 1.0 0.9 0.2 1.4 0.4 3.3 0.8WetMeadUT 30 4.6 1.1 34.1 13.0 7.7 1.0 10.0 2.3 31.0 6.7
SE 0.4 0.2 4.8 3.7 2.2 0.3 2.5 0.9 5.6 0.9WetMeadYELL 88 7.6 0.1 43.8 0.1 13.6 0.3 15.1 0.7 31.7 1.3
SE 0.3 0.0 3.1 0.1 0.5 0.1 1.3 0.3 2.4 0.4Willow 90 7.3 0.3 58.4 0.6 12.0 0.6 23.0 1.4 41.3 4.2
SE 0.3 0.1 3.7 0.3 1.1 0.3 1.8 0.7 4.6 1.0
426 Preslia 78: 405–426, 2006