scalable architecture for anomaly detection and ...dchau/papers/17-ipdps-energy.pdf · scalable...
TRANSCRIPT
Scalable Architecture for Anomaly Detectionand Visualization in Power Generating Assets
Paras Jain∗, Chirag Tailor∗, Sam Ford∗, Liexiao (Richard) Ding‡, Michael Phillips‡,Fang (Cherry) Liu§, Nagi Gebraeel‡, Duen Horng (Polo) Chau∗
∗College of Computing‡H. Milton Stewart School of Industrial & Systems Engineering
§Partnership for an Advanced Computing EnvironmentGeorgia Institute of Technology
Atlanta, Georgia, USA.Email: {paras, chirag.tailor, sford100, richard.ding, mphillips68, polo}@gatech.edu,
[email protected], [email protected]
Abstract—Power-generating assets (e.g., jet engines, gas tur-bines) are often instrumented with tens to hundreds of sensorsfor monitoring physical and performance degradation. Anomalydetection algorithms highlight deviations from predeterminedbenchmarks with the goal of detecting incipient faults.
We are developing an integrated system to address three keychallenges within analyzing sensor data from power-generatingassets: (1) difficulty in ingesting and analyzing data from largenumbers of machines; (2) prevalence of false alarms generated byanomaly detection algorithms resulting in unnecessary downtimeand maintenance; and (3) lack of an integrated visualization thathelps users understand and explore the flagged anomalies andrelevant sensor context in the energy domain.
We present preliminary results and our key findings inaddressing these challenges. Our system’s scalable event ingestionframework, based on OpenTSDB, ingests nearly 400,000 sensordata samples per seconds using a 30 machine cluster. To reducefalse alarm rates, we leverage the False Discovery Rate (FDR)algorithm which significantly reduces the number of false alarms.Our visualization tool presents the anomalies and associatedcontent flagged by the FDR algorithm to inform users andpractitioners in their decision making process.
We believe our integrated platform will help reduce mainte-nance costs significantly while increasing asset lifespan. We areworking to extend our system on multiple fronts, such as scalingto more data and more compute nodes (70 in total).
Keywords—False discovery rate; visualization; OpenTSDB;power asset; energy sensor
I. INTRODUCTION
To improve public safety, modern power generating assets(e.g., jet engines, gas turbines) are instrumented with hundredsof sensors to monitor physical performance degradation. Suchsensors, such as temperature or pressure, is installed with thegoal of measuring potential signals of asset failure. Given thescale of data produced, it is impossible for humans to directlymonitor every signal. Instead, this monitoring process can beautomated by studying possible deviations from pre-specifiedbenchmarks, with the goal of detecting incipient faults.
Anomaly detection involves defining a pattern in observationsthat represent normal behavior and declaring observations thatdo not belong to that region as anomalies. A multitude ofdetection algorithms and techniques have been developed and
commercialized over the years, many of which have beenapplied in the manufacturing domain [1], [2] for what hasbecome known as Statistical Process Control (SPC).
In large scale settings involving thousands of power gener-ating assets where each asset is monitored by a large numberof sensors, the problem of false alarms becomes a significantchallenge. False alarms can be very costly — for example,50% of replaced parts in aircraft are classified as “no faultfound” [3]. In energy and aerospace domains, reducing ratesof false alarms can measurably reduce lifetime maintenancecosts for power generating assets.
Our goal is to develop an integrated system that reducesfalse alarms in multi-stream condition monitoring of powergenerating assets using a scalable analytics architecture thatingests, stores and analyzes large amounts of sensor data, andinteractively visualize the computation results to enhance userunderstanding and advance decision making capabilities.
Our ongoing work’s contributions are:● We present a scalable event ingestion and storage architec-
ture that can handle 399,000 sensor samples per secondwith a 30 node storage cluster.
● We adapt the FDR algorithm to the energy domain inorder to reduce the rate of falsely identified anomalies.
● We demonstrate a visualization tool that enables interactiveexploration of power-generating asset sensor data withassociated anomalies.
II. SYSTEM OVERVIEW
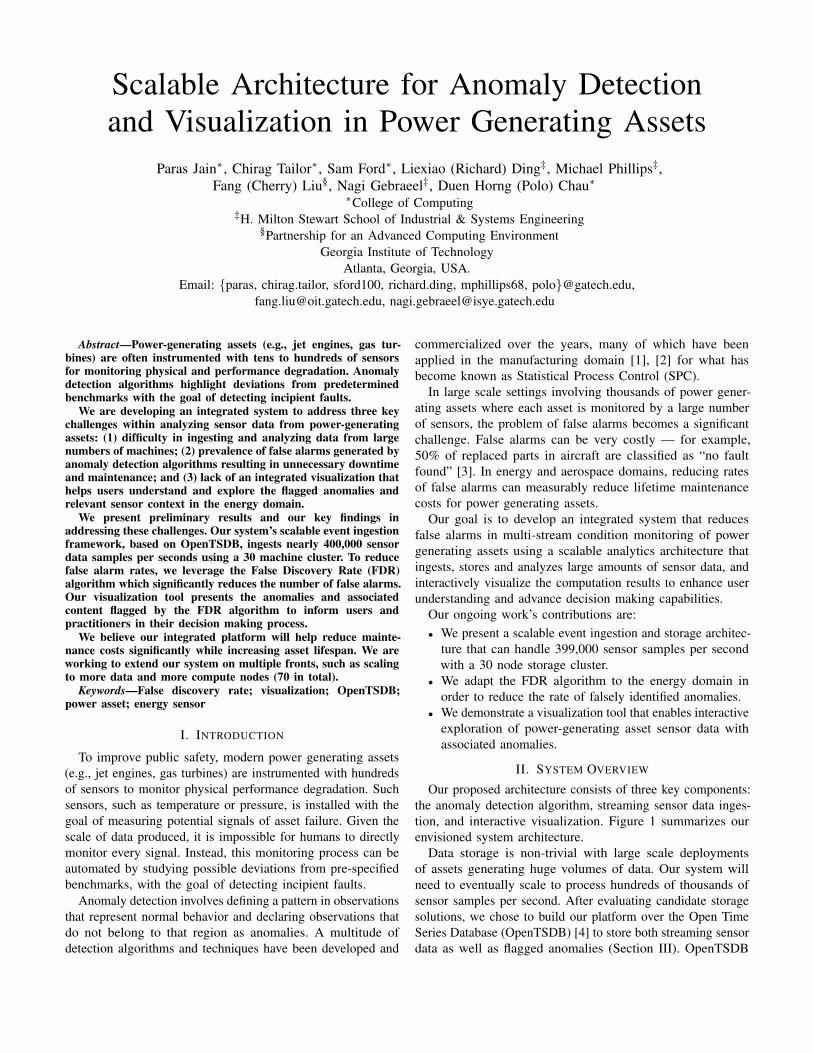
Our proposed architecture consists of three key components:the anomaly detection algorithm, streaming sensor data inges-tion, and interactive visualization. Figure 1 summarizes ourenvisioned system architecture.
Data storage is non-trivial with large scale deploymentsof assets generating huge volumes of data. Our system willneed to eventually scale to process hundreds of thousands ofsensor samples per second. After evaluating candidate storagesolutions, we chose to build our platform over the Open TimeSeries Database (OpenTSDB) [4] to store both streaming sensordata as well as flagged anomalies (Section III). OpenTSDB
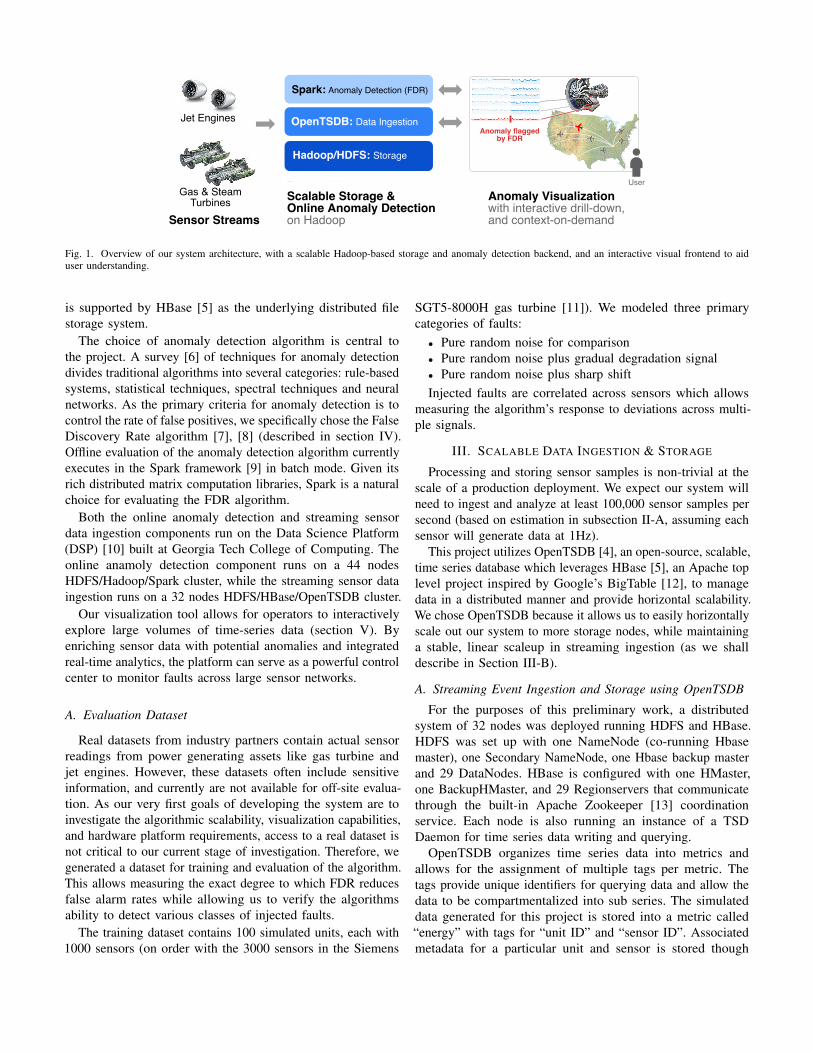
Fig. 1. Overview of our system architecture, with a scalable Hadoop-based storage and anomaly detection backend, and an interactive visual frontend to aiduser understanding.
is supported by HBase [5] as the underlying distributed filestorage system.
The choice of anomaly detection algorithm is central tothe project. A survey [6] of techniques for anomaly detectiondivides traditional algorithms into several categories: rule-basedsystems, statistical techniques, spectral techniques and neuralnetworks. As the primary criteria for anomaly detection is tocontrol the rate of false positives, we specifically chose the FalseDiscovery Rate algorithm [7], [8] (described in section IV).Offline evaluation of the anomaly detection algorithm currentlyexecutes in the Spark framework [9] in batch mode. Given itsrich distributed matrix computation libraries, Spark is a naturalchoice for evaluating the FDR algorithm.
Both the online anomaly detection and streaming sensordata ingestion components run on the Data Science Platform(DSP) [10] built at Georgia Tech College of Computing. Theonline anamoly detection component runs on a 44 nodesHDFS/Hadoop/Spark cluster, while the streaming sensor dataingestion runs on a 32 nodes HDFS/HBase/OpenTSDB cluster.
Our visualization tool allows for operators to interactivelyexplore large volumes of time-series data (section V). Byenriching sensor data with potential anomalies and integratedreal-time analytics, the platform can serve as a powerful controlcenter to monitor faults across large sensor networks.
A. Evaluation Dataset
Real datasets from industry partners contain actual sensorreadings from power generating assets like gas turbine andjet engines. However, these datasets often include sensitiveinformation, and currently are not available for off-site evalua-tion. As our very first goals of developing the system are toinvestigate the algorithmic scalability, visualization capabilities,and hardware platform requirements, access to a real dataset isnot critical to our current stage of investigation. Therefore, wegenerated a dataset for training and evaluation of the algorithm.This allows measuring the exact degree to which FDR reducesfalse alarm rates while allowing us to verify the algorithmsability to detect various classes of injected faults.
The training dataset contains 100 simulated units, each with1000 sensors (on order with the 3000 sensors in the Siemens
SGT5-8000H gas turbine [11]). We modeled three primarycategories of faults:● Pure random noise for comparison● Pure random noise plus gradual degradation signal● Pure random noise plus sharp shiftInjected faults are correlated across sensors which allows
measuring the algorithm’s response to deviations across multi-ple signals.
III. SCALABLE DATA INGESTION & STORAGE
Processing and storing sensor samples is non-trivial at thescale of a production deployment. We expect our system willneed to ingest and analyze at least 100,000 sensor samples persecond (based on estimation in subsection II-A, assuming eachsensor will generate data at 1Hz).
This project utilizes OpenTSDB [4], an open-source, scalable,time series database which leverages HBase [5], an Apache toplevel project inspired by Google’s BigTable [12], to managedata in a distributed manner and provide horizontal scalability.We chose OpenTSDB because it allows us to easily horizontallyscale out our system to more storage nodes, while maintaininga stable, linear scaleup in streaming ingestion (as we shalldescribe in Section III-B).
A. Streaming Event Ingestion and Storage using OpenTSDB
For the purposes of this preliminary work, a distributedsystem of 32 nodes was deployed running HDFS and HBase.HDFS was set up with one NameNode (co-running Hbasemaster), one Secondary NameNode, one Hbase backup masterand 29 DataNodes. HBase is configured with one HMaster,one BackupHMaster, and 29 Regionservers that communicatethrough the built-in Apache Zookeeper [13] coordinationservice. Each node is also running an instance of a TSDDaemon for time series data writing and querying.
OpenTSDB organizes time series data into metrics andallows for the assignment of multiple tags per metric. Thetags provide unique identifiers for querying data and allow thedata to be compartmentalized into sub series. The simulateddata generated for this project is stored into a metric called“energy” with tags for “unit ID” and “sensor ID”. Associatedmetadata for a particular unit and sensor is stored though
0
4
8
12
16
20
0 20 40 60 80 100 120
10nodes
15nodes
20nodes
25nodes
30nodes
Ingestion duration (sec)
Samples ingested(millions)
0
100,000
200,000
300,000
400,000
0 10 20 30 40
20 nodes257k samples / sec
15 nodes233k samples / sec
10 nodes173k samples / sec
25 nodes325k samples / sec
30 nodes399k samples / sec
# of Nodes
Throughput(samples per second)
Fig. 2. Left: Ingestion rates achieved as the ingestion framework was ramped up from 10 machines to 30 machines. The system scales linearly, with eachadded machine increasing throughput by 11K samples per second on average. Right: The line graph of sensor samples ingested versus the ingestion durationshows a constant and stable ingestion rate for each configuration of the framework.
configuration in JSON outside the time series database, whichallows configuration updates to be managed in version control.
For storing data, the TSD Daemon takes a metric, timestamp,data value, and tag identifiers as input and produces an entry tobe written to an HBase table. First, the key is generated froma binary encoding of the metric, timestamp, and tag values.Then, the TSD Daemon submits an RPC call to HBase whichdistributes the write based upon the key value. The writesfor similar keys are grouped onto the same Regionserver byHBase.
B. Preliminary Results & Key Findings
Linear Scale-up. We tested our event ingestion frameworkwith the evaluation dataset (described in Section II-A, consist-ing of 100 assets with 1000 sensors each). Figure 2a shows theingestion rate scales up linearly with the number of machines.Each machine runs one HBase RegionServer instance andone OpenTSDB daemon. The ingestion rate reaches 300,000samples per second with 30 machines, while maintaining astable ingestion speed, shown in Figure 2b.OpenTSDB Key Design. One obstacle encountered early inthe ingestion process was an issue with these writes notbeing distributed across all the HBase Regionservers efficiently.Since sequential data values share the same metric and similartimestamp values, their binary encoded keys are also similarresulting in the RPC calls being sent to the same HBaseRegionserver. To combat this, the binary key encodings weresalted with an additional uniformly randomly generated byteat the beginning to create unique keys for chronologicaldata values. Additionally, HBase regions were manually splitto ensure each region handled an equal proportion of thewrites. Salting the keys allowed for the full utilization of all
the deployed HBase Regionservers and provided a dramaticincrease to the ingestion rate.Buffering Requests for Backpressure and Scalability. An-other obstacle encountered while working with OpenTSDB andHBase was frequent crashes of Regionservers due to overloadedRPC Queues. Initially, the cause of these crashes was attributedto HBase having no means of providing back pressure to RPCcalls made by OpenTSDB. To remedy this, we built a reverseproxy to buffer requests to OpenTSDB in order to limit thenumber of concurrent requests. Compaction was also disabledon OpenTSDB to reduce RPC calls to HBase. This proxy alsoserves to increase ingestion throughput by load-balancing trafficto multiple ingestion processes. Ingestion throughput scaleshorizontally by distributing the requests to the OpenTSDBnodes via a round-robin fashion.
IV. FLAGGING ANOMALIES WITHLOW FALSE ALARM RATES
A key component in our system is the algorithm to flagpotential anomalies. Given the large expense caused byerroneously flagged faults, we aim to use an anomaly detectionalgorithm that balances identifying the majority of true faultswhile also controlling the rate of false alarms.
From a statistical standpoint, anomaly detection amountsto performing a hypothesis test on sample observations todetect possible shifts in the mean of the sampling distribution.Rejection of the null hypothesis implies that there is significantevidence to conclude that the distribution has indeed changed.A common mistake committed in hypothesis testing is to rejectthe null hypothesis when it is actually true (type I error).
In our setting, a type I error amounts to a false alarm, i.e.,an equipment is classified as faulty when in reality there was

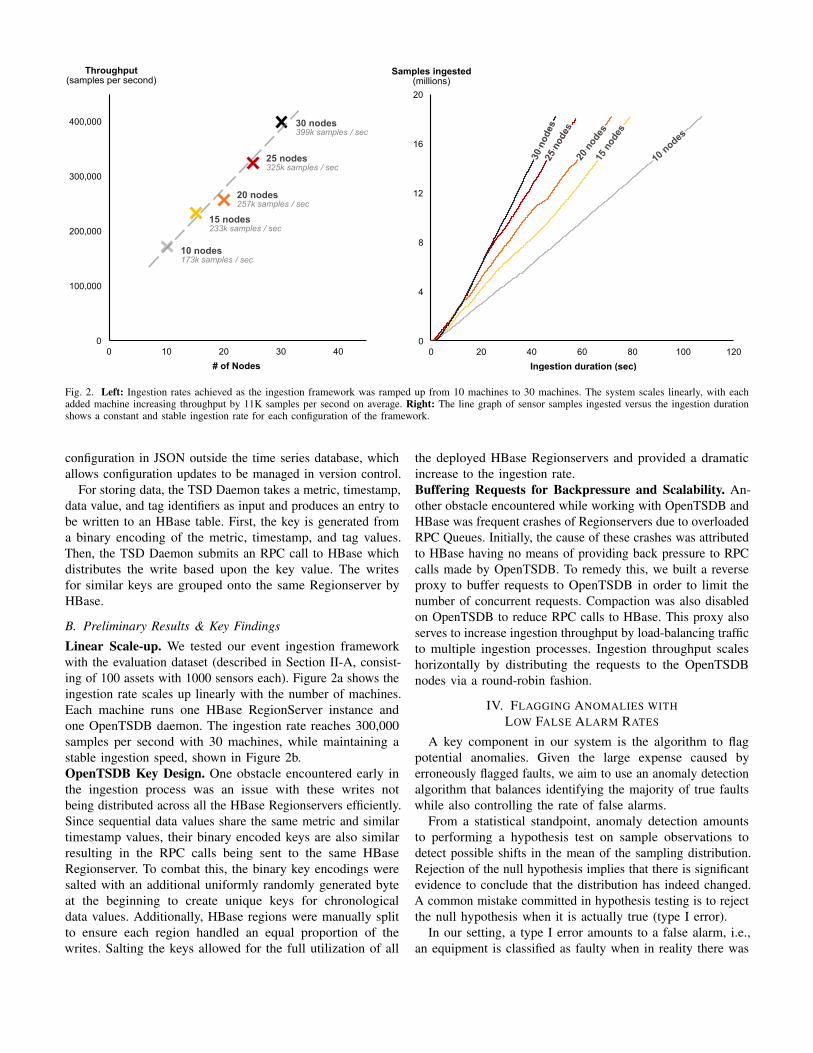
Fig. 3. A web application shows sensor readings across all machine and sensors. For machine 17, the timeline at the top visualizes correlated anomalousevents across all sensors. A detailed view of each sensor’s time series with associated anomalies is displayed at the bottom.
nothing wrong. One of the key aspects of type I errors isthat they tend to increase as the number of hypothesis testsincreases. In our context, this translates to higher false alarmrates as the number of sensors increases. For example, for asingle sensor with an allowable α = 0.05, the probability ofmaking at least one false alarm is 5%. However, if we increasethe number of sensors to 10 sensors each with α = 0.05, thatprobability jumps to 40% , i.e., 1 − (1 − α)10 = 0.4.
Traditionally, false alarms in multi-inference studies werecontrolled using family-wise error rate (FWER). FWER focuseson controlling the probability of committing any type I errorwhen performing multiple hypothesis tests by applying acorrection to a family of inferences. A popular example is theBonferroni correction [14] where for m hypotheses each havinga probability α of committing type I error, then the correctedprobability for the family would be α/m. In other words, rejectall hypotheses with p-values ≤ α/m. One drawback of thisapproach was that it provided much less detection power andwas overly conservative.
FDR was first introduced by Benjamini and Hochberg in1995 [7], [8]. The goal was to reduce false alarms in multipleinferences (hypothesis tests) in clinical trials. Compared toFWER, FDR was designed to control the expected proportionof type I errors.
The underlying premise of FDR is that when multiple testedhypotheses are rejected, it is more important to control theproportion of errors (wrong rejections) than it is a singleerroneous rejection. As we wish to balance the rate of type Iand type II errors, FDR is a promising option for a choice ofalgorithm for preliminary testing.
Production latency and throughput requirements necessitatesthat the chosen anomaly detection algorithm be scalable. TheFDR algorithm is easy to scale using distributing matrixcomputation provided by Spark’s MLlib. This property makesFDR more attractive than more complex algorithms.
A. Preliminary Results
Our implementation of the FDR algorithm is composedof two parts — an offline training component and an onlineevaluation component. Offline training occurs in Spark, runningin batch mode. Spark’s MLlib [15] provides an implementationof distributed matrix factorization, which allows our offlinetraining system to scale to large numbers of sensors. Oncetraining is complete, we can evaluate for anomalies at a rateof 939,000 sensor samples per second on average.
In offline training, model estimation of each sensor on eachunit begins by calculating the covariance matrix of each dataset. Singular Value Decomposition is then performed on eachcovariance matrix to obtain the mean and variance. Resultsfrom the decomposition are cached to HDFS. Evaluation isthereby relatively fast requiring a single matrix multiplicationper iteration. Results from online evaluation are reported backto OpenTSDB for use by the integrated visualization tool. Thecurrent system can deal with one machine at a time and weplan to utilize concurrency of Spark to scale up workload.
V. ANOMALY VISUALIZATION
Advanced anomaly detection without commensurate visu-alization presents limited value for operators. Our platformincludes an interactive visualization tool that equips users toquickly respond to flagged anomalies. Our tool integrates A)live sensor data, B) highlighted anomalies, and C) real-timesystem analytics into a single control center for users to monitorand react to events in a network of power-generating assets.
A. Preliminary Results
Our tool provides an overview of the overall health of thenetwork of power-generating assets. It helps users exploreand understand the context surrounding the flagged anomalies.By using the FDR anomaly detection algorithm, we avoidunnecessarily notifying users of false alarms.

Analytics summarize global system status across a largedeployment of power-generating assets. By selectively surfacingthe most concerning anomalies, we allow users to focus onlyon what is important. Anomalous machines are clearly markedin a single list on the left of Figure 3, allowing operators toquickly check system health.
Power-generating asset faults often result in correlatedanomalies across multiple sensors (e.g., pressure and tem-perature). Our tool displays a summary of detected correlatedanomalies in a single timeline at the top of Figure 3.
Drill-down capabilities enable users to quickly examinedetails about a fault with necessary context. Clicking on aparticular event in the machine-wide status timeline at the top ofthe application displays detailed time series for relevant sensorsat the bottom of the page. This allows operators to quicklyview local context surrounding an anomaly with visualizationsfor all relevant sensors. Operators can filter the list of displayedsensor time-series to only anomalous sensors, all sensors orsome custom subset of sensors.
The visualization tool is a web application that is availableon both desktop and mobile devices. Mobile access allowstechnicians to explore pertinent sensor data while performingmaintenance on a particular machine in the field.
VI. CONCLUSION & ONGOING WORK
We present our preliminary work and key findings indeveloping an integrated system to address three key challengeswithin analyzing sensor data from power-generating assets: (1)difficulty in ingesting and analyzing data from large numbers ofmachines; (2) prevalence of false alarms generated by anomalydetection algorithms resulting in unnecessary downtime andmaintenance; and (3) lack of an integrated visualization thathelps users understand and explore the flagged anomalies andrelevant sensor context in the energy domain. Our system cancurrently ingest and analyze 399,000 sensor samples per secondwhile running on a 30 node cluster. The system visualizessensor data in an interactive web application which presentspotential anomalies with the associated context surroundingthe event.
Ongoing work for the project includes: experimentingwith increasing storage nodes to further scale up throughput,migrating our anomaly detection implementation to SparkStreaming [16] for online training, and evaluating our systemwith domain users through our collaboration with industrypartners like General Electric (GE) to test the system on theirdatasets.
ACKNOWLEDGMENT
This work is supported in part by the Strategic EnergyInstitute (SEI) at Georgia Tech, and NSF grants IIS-1563816,TWC-1526254, IIS-1217559. We also thank Yahoo! for theirgenerous 200-machine donation. We thank Will Powell onhardware support for our system.
REFERENCES
[1] R. Isermann, Fault-diagnosis applications : model-based conditionmonitoring: actuators, drives, machinery, plants, sensors, and fault-tolerant systems. Berlin Heidelberg New York: Springer, 2011.
[2] L. Chiang, Fault Detection and Diagnosis in Industrial Systems. London:Springer London, 2001.
[3] P. Sderholm, “A system view of the no fault found (nff) phenomenon,”Reliability Engineering & System Safety, vol. 92, no. 1, pp. 1 – 14,2007. [Online]. Available: http://www.sciencedirect.com/science/article/pii/S0951832005002139
[4] “Opentsdb : The scalable time series database, http://opentsdb.net/,” 2016.[5] “Apache hbase : A distributed, scalable, big data store,
https://hbase.apache.org/,” 2016.[6] V. Chandola, A. Banerjee, and V. Kumar, “Anomaly detection: A survey,”
ACM computing surveys (CSUR), vol. 41, no. 3, p. 15, 2009.[7] Y. Benjamini and Y. Hochberg, “Controlling the false discovery rate:
a practical and powerful approach to multiple testing,” Journal of theroyal statistical society. Series B (Methodological), pp. 289–300, 1995.
[8] Y. Benjamini and D. Yekutieli, “The control of the false discovery rate inmultiple testing under dependency,” Annals of statistics, pp. 1165–1188,2001.
[9] M. Zaharia, M. Chowdhury, M. J. Franklin, S. Shenker, and I. Stoica,“Spark: cluster computing with working sets.”
[10] F. C. Liu, F. Shen, D. H. Chau, N. Bright, and M. Belgin, “Building aresearch data science platform from industrial machines,” 3rd Workshopon Advances in Software and Hardware for Big Data to KnowledgeDiscovery (ASH) co-located with IEEE Big Data Conference, 2016.
[11] P. Ratliff, P. Garbett, and W. Fischer, “The new siemens gas turbinesgt5-8000h for more customer benefit,” VGB powertech, vol. 87, no. 9,pp. 128–132, 2007.
[12] F. Chang, J. Dean, S. Ghemawat, W. C. Hsieh, D. A. Wallach, M. Burrows,T. Chandra, A. Fikes, and R. E. Gruber, “Bigtable: A distributed storagesystem for structured data,” ACM Transactions on Computer Systems(TOCS), vol. 26, no. 2, p. 4, 2008.
[13] P. Hunt, M. Konar, F. P. Junqueira, and B. Reed, “Zookeeper: Wait-freecoordination for internet-scale systems.” in USENIX Annual TechnicalConference, vol. 8, 2010, p. 9.
[14] O. J. Dunn, “Multiple comparisons among means,” Journal of theAmerican Statistical Association, vol. 56, no. 293, pp. 52–64, 1961.
[15] X. Meng, J. Bradley, E. Sparks, S. Venkataraman, D. Liu, J. Freeman,D. Tsai, M. Amde, S. Owen et al., “Mllib: Machine learning in apachespark,” 2016.
[16] M. Zaharia, T. Das, H. Li, T. Hunter, S. Shenker, and I. Stoica,“Discretized streams: Fault-tolerant streaming computation at scale,”in Proceedings of the Twenty-Fourth ACM Symposium on OperatingSystems Principles. ACM, 2013, pp. 423–438.