satomi harada for the master of science title: chemical
TRANSCRIPT

AN ABSTRACT OF THE THESIS OF
Satomi Harada for the Master of Science
in Physical Science presented on November 16, 2011
Title: Chemical and Physical Properties of Biodiesel
Abstract Approval:
Although biodiesel is a promising alternative fuels, it still has many challenging
issues. One of the problems is its purification process. The traditional wet washing
method can increase the production costs so it is important to investigate other reusable
and inexpensive purifications methods. In this study, calcium-based desiccants and
molecular sieves were investigated as new purification materials. The study showed that
the calcium-based desiccants were comparable to wet wash purification for removing
volatile byproducts; however, calcium concentration in biodiesel increased dramatically
after the treatment. The application of the molecular sieves successfully achieved the
reduction of calcium concentration but further experiments will be necessary to
determine whether the combination of desiccants can be the replacement for the
traditional purification process.
In addition, the application of biodiesel is limited due to its poor cold weather
properties. In order to improve performance in the cold climate, additives are typically
added to biodiesel. The second part of this study focused on the chemical and physical
effects on biodiesel using various additives. Results indicated that additives can improve
cold weather properties but canola oil, soybean oil, palm oil, and lard based biodiesel
with 2 weight-percent of Wintron XC30 and XC40 additives could not achieve the

viscosity requirement therefore those additives were not applicable with that
concentration. Also, no changes in the chemical structures and freezing point by additives
were observed. A faster and novel cloud point analytical methodology using Rayleigh
light scattering was developed and applied in this study.

Chemical and Physical Properties of Biodiesel
----------
A Thesis
Presented to
the Department of Physical Sciences
EMPORIA STATE UNIVERSITY
----------
In Partial Fulfillment
of the Requirements for the Degree
Master Science
----------
by
Satomi Harada
December 2011

ii
Approved by the Department Chair
Committee Member
Committee Member
Committee Member
Committee Chair
Dean of the Graduate School and
Distance Education

iii
Acknowledgments
First of all, I would like to thank Dr. David Bailey for becoming my research
adviser. I went to his office about two and a half years ago with a topic about biodiesel
and even though the topic was not his research area, he accepted the position to be my
research adviser. He has given me good advice and knowledge since the moment we
started. I also like to thank the other professors in chemistry department and my
committee members, Dr. Malonne Davies, Dr. Kim Simons, and Dr. Jorge Ballester for
their time and helpful comments. I acknowledge R3 Energy LLC. and MidContinental
Chemical Co. Inc. for providing their products as well as the Emporia State University
Research and Grants Center for their financial support for this project.
Also, I am most grateful to my family, friends, and neighbors for their support.
Most of all, I would like to express my gratitude to my encouraging and patient fiancé
Mauricio and our Rottweiler Maverick D.C. who always be there for me and became my
biggest supporters.

iv
Table of Contents
I. Background ............................................................................................................ 1
A. History of Biodiesel .......................................................................... 1
B. Transesterification and Purification of Biodiesel ............................. 2
C. Physical Properties of Biodiesel ....................................................... 4
D. Study Goals and Design ................................................................... 8
II. Experimental ........................................................................................................ 10
A. Materials ......................................................................................... 10
B. Procedures ...................................................................................... 10
1. Transesterification of Biodiesel .................................................... 11
2. Purification of Biodiesel ............................................................... 11
3. Cold Soak Filtration of Biodiesel ................................................. 12
4. Preparation of Biodiesel with Additives ....................................... 12
C. Analytical methods ......................................................................... 12
1. Purification of Biodiesel by Desiccants ........................................ 13
a. Determination of Volatile Byproducts Content in Biodiesel .... 13
b. Determination of Reusability of Desiccants ............................. 13
c. Determination of Saturation Level of Desiccants ..................... 14
d. Determination of Calcium Content in Biodiesel ....................... 14
Acknowledgments.............................................................................................................. iii
Table of Contents ............................................................................................................... iv
List of Tables ..................................................................................................................... vi
List of Figures ................................................................................................................... vii

v
2. Chemical Properties of Biodiesel Analysis................................... 15
a. Fourier Transform Infrared Spectroscopy Analysis ................. 15
b. Magnetic Resonance Spectroscopy Analysis ........................... 15
c. Gas Chromatography Mass Spectroscopy Analysis ................. 15
3. Physical Properties of Biodiesel ................................................... 16
a. Determination of Kinematic Viscosity ..................................... 16
b. Determination of Density .......................................................... 16
c. Determination of Cloud Point ................................................... 17
i. Spectrofluorometric Cloud Point Analysis Method .............. 17
ii. Modified Visual Cloud Point Analysis Method .................... 18
iii. Ultraviolet-Visible Spectroscopic Cloud Point Analysis
Method .................................................................................. 18
d. Determination of Freezing Point ............................................... 19
i. Freezing Point Analysis of Biodiesel .................................... 19
ii. Freezing Point Depression of Biodiesel ................................ 19
III. Results/Discussion ............................................................................................... 20
A. Volatile Byproducts Content in Biodiesel and Reusability and
Saturation of Desiccants ................................................................. 20
B. Chemical Compositions Analysis of Biodiesel .............................. 25
C. Physical Properties of Biodiesel ..................................................... 34
IV. Conclusions .......................................................................................................... 51
A. Conclusion and Recommendation for Future Work ....................... 51

vi
List of Tables
Table Number Page
Table I Comparison of recovery yield of calcium chloride, calcium sulfate,
4A, and 5A molecular sieves after reactivation ................................... 21
Table II Comparison of calcium concentration for crude Crisco CA-FAME
with treatments of calcium sulfate and 13X molecular sieves and
without any treatment ........................................................................... 21
Table III Calcium concentration in crude Crisco CA-FAME treated with
CaSO4, 13X, and combination of CaSO4-13X ..................................... 23
Table IV Biodiesel profiles (area %) for various feedstock based biodiesel ........... 29
Table V Comparison of CPF (K) for SO-FAME with excitation wavelength of
200, 300, 400, 600 nm .......................................................................... 40
Table VI Summary for CP (K) of CA-FAME, CO-FAME, SO-FAME, PA-
FAME, and LA-FAME with and without additives ............................ 41
Table VII Comparison of minimum equilibrium time (minute) to achieve CPF
for CA-FAME, CO-FAME, SO-FAME, PA-FAME, and LA-
FAME using 10 mm and 3 mm cuvettes .............................................. 44

vii
List of Figures
Figure Number Page
Figure 1. Transesterification reaction of oils and fats with alcohol and catalyst
to produce esters and glycerol. ............................................................... 2
Figure 2. Typical cooling curves. I: pure solvent, II: mixture of solvent and
solute, III: mixture of solvent and the eutectic composition34
............... 7
Figure 3. Comparison of average volatile byproducts content in Crisco CA-
FAME which was removed by Ca based desiccants, molecular
sieves, and acid wash and Crisco CA-FAME without any
treatments (NT). ................................................................................... 20
Figure 4. Comparison of average volatile byproducts content in Crisco CA-
FAME which was removed by CaSO4, 13X, and combination of
CaSO4-13X and Crisco CA-FAME without any treatments. ............... 22
Figure 5. Saturation analysis of CaSO4 using glass column. ................................... 23
Figure 6. Saturation of 13X using glass column. ..................................................... 24
Figure 7. Saturation of combination of CaSO4-13X using glass column. ............... 25
Figure 8. FTIR spectra from 650 to 4000 nm for CA-FAME, CO-FAME, SO-
FAME, PA-FAME and LA-FAME. .................................................... 26
Figure 9. Comparison of 1H NMR spectra of canola oil and CA-FAME. ............... 27
Figure 10. FTIR results from 650 to 4000 nm for unseparated phase from castor
oil transesterification, glycerol, and R3. .............................................. 28
Figure 11. FTIR spectra from 650 to 4000 nm for additive Bio Flo and some of
its compositions. ................................................................................... 31
Figure 12. GC spectra of CA-FAME and CA-FAME with Bio Flo additive. ........... 32
Figure 13. GC spectra of CA-FAME and CA-FAME with XC30 additive. .............. 32
Figure 14. GC spectra of CA-FAME and CA-FAME with XC40 additives. ............ 33
Figure 15. GC spectra of CA-FAME and CA-FAME with Synergy additive. .......... 33
Figure 16. Summary of average kinematic viscosity (cSt) at 40ºC of various
biodiesels and those with additives. ..................................................... 34
Figure 17. Summary of average density (g/mL) at 25ºC of various biodiesels and
those with additives. ............................................................................. 35
Figure 18. Three dimensional spectrofluorometer graph of CA-FAME with
excitation wavelength of 400 nm. ........................................................ 36
Figure 19. Average scattering peak for CA-FAME, CO-FAME, SO-FAME, PA-
FAME, and LA-FAME compared with excitation wavelength of
400 nm. ................................................................................................. 37

viii
Figure 20. Plot of CO-FAME for fluorometer cloud point determination using
Rayleigh light scattering (RLS) calculated by minimum distinguish
analytical signal (MDAS). ................................................................... 38
Figure 21. Plot of CO-FAME for UV-vis cloud point determination calculated
by derivative of transmittance. ............................................................. 39
Figure 22. Comparison of CPF before and after cold soak (CSF) filtration for
CA-FAME, CO-FAME, SO-FAME, PA-FAME, and LA-FAME. ..... 40
Figure 23. Linear regression analysis for fluorometer cloud point and visual
cloud point. ........................................................................................... 43
Figure 24. Comparison of intensity changes for CA-FAME minimum distinguish
analytical signal using 10 mm and 3 mm cuvettes. .............................. 44
Figure 25. Cooling curve of CA-FAME..................................................................... 45
Figure 26. Freezing Point Summary for CA-FAME, CO-FAME, SO- FAME,
PA-FAME, and LA-FAME and those with additives. ......................... 46
Figure 27. Change in first FP for CA-FAME with 0, 0.5, 1, 2, and 5 M of
heptane, octane, and decane. ................................................................ 47
Figure 28. Change in first FP for CA-FAME with 0, 0.5, 1, 2, 5, and 10 M of
dodecane, tetradecane, hexadecane, and octadecane. .......................... 48
Figure 29. Change in second FP for CA-FAME with 0, 0.1, 0.5, 1, 2, and 5 M of
heptane and octane. .............................................................................. 49
Figure 30. Change in second FP for CA-FAME with 0, 0.1, 0.5, 1, 2, 5, and 10
M of decane, dodecane, tetradecane, hexadecane, and octadecane. .... 50

1
BACKGROUND
History of Biodiesel
Oils and fats from biomass had been used as automobile fuels in the past. Rudolf
Diesel who invented a diesel engine in 1894, tested his diesel engine on peanut oil at the
1900 World’s Fair in Paris.1 However, the direct use of vegetable oils had many issues
such as high viscosity, low volatility, and incomplete combustion which leads to the
formation of deposits causing the clogged injector.2 The application of vegetable oil as
fuels decreased as the rapid increase of supply for inexpensive and abundant petroleum.
Petroleum has been the dominant fuel in our society for many decades. However, the
concern toward environment and energy security drove an attraction toward alternative
fuels.
The Clean Air Act Amendments (1990) and the Energy Policy Act (1992) ordered
the use of alternative fuels in some trucks and buses in the United States.1 The name of
one of the alternative fuels produced from vegetable oils was introduced in the United
States in 1992 as Biodiesel by the National Soy diesel Development Board.3 Biodiesel is
also known as FAME which stands for fatty acid methyl esters. The use of biodiesel in
the United States increased significantly after the amendments to the Energy Policy Act
were enacted into law in 1998.1 Biodiesel is biodegradable fuel, which has lower
emissions of pollutants such as carbon monoxide, particulates, hydrocarbons, soot, and
sulfur oxide than petroleum or traditional diesel and also has capability to use petroleum
diesel engines with little or no modifications.4 Biodiesel is already commercially
available in many countries such as the United States, Austria, the Czech Republic,

2
France, Germany, Italy, Malaysia, and Sweden.1 These countries typically use biodiesel
mixtures with petroleum like B20, which indicates mixture of 20% biodiesel in
traditional diesel.
Transesterification and Purification of Biodiesel
One of the most common methods to synthesize biodiesel is called
transesterification shown in Figure 1, which converts oils and fats to fatty esters using
catalyst and alcohol.5
Figure 1. Transesterification reaction of oils and fats with alcohol and catalyst to produce
esters and glycerol.
Since properties of biodiesel are directly affected by the structure of oils and fats,
it is important to understand the compositions of raw materials. Oils and fats are
primarily water-insoluble and consist of triglycerides. Triglycerides have structure of
glycerol backbone with various fatty acids attached to it.6 The properties of triglycerides
can be determined by the lengths of fatty acid and numbers of double bond.4a
In addition
to the structure of raw materials, types of alcohol can influence the properties of
biodiesel.7 A previous study showed that the use of isopropanol gave better biodiesel
properties than methanol, but due to the high cost of isopropanol, methanol or ethanol are
often employed.7 Base and acid catalysts are the two major catalysts applied to complete
3
transesterification. Base catalysts such as sodium hydroxide and potassium hydroxide
remove a proton from alcohol to produce alkoxide and the protonated catalyst leads to
nucleophilic attack of alkoxide to the carbonyl group of triglyceride.5 However,
producing biodiesel from oils which contain high free fatty acids with base catalyst can
create soap, which reduces the amount of product thus acid catalysts like sulfuric acid are
typically favored for those oils.8
Yield of transesterification is influenced by types of catalyst, amount of alcohol,
reaction temperature and time, mixing intensity, free fatty acid contents, and water
contents. Water consumes catalyst and forms stable emulsions which inhibit separation of
glycerol from fatty esters, thus reducing yield of biodiesel.6, 9
Even the use of refined
natural vegetable oils can still contain small amount of water after purification.4a
Therefore, elimination of water by preheating oils is important to achieve high yield.
Also, water can be produced from reaction between catalyst and alcohol.4a
Molecular
sieves showed effectiveness lowering water productions and shifted the reaction toward
the ester formation.10
Freedman et al. suggested that alcohol to oil molar ratio of 6:1 with
1% sodium hydroxide gives the optimum condition for the reaction.11
In addition, a
previous study showed that less than 0.06% w/w and 0.5% w/w of water and free fatty
acid content of beef tallow gave best results for transesterification using sodium
hydroxide.9b
Byproducts and impurities also influence characteristics and performance of
biodiesel and the engine life.4a
Crude biodiesel contained many impurities from the

4
reaction such as free glycerol, soap, free fatty acids, excess alcohol, catalyst, water, and
glycerol.12
Therefore, purification steps are necessary to remove those impurities. A
water wash is the most common method for a wet wash purification used in industries.13
Glycerol and methanol are both water soluble so it is easy to remove these major
impurities by the water wash.12
On the other hand, synthetic magnesium silicate, silica
gel, smectitic clay containing silica gel, and ion exchange resin are commonly used for a
dry wash purification.13-14
Physical Properties of Biodiesel
The structural features of individual fatty esters determine the physical properties
of biodiesel including ignition quality, heat of combustion, exhaust emissions, oxidative
stability, cold flow, viscosity, density and lubricity. The quality specifications have to
fulfill with the European standard specification (EN) 14214 or American Society for
Testing and Materials (ASTM) D6751.15
Thus, it is critical to identify the chemical
structures of biodiesel in order to understand overall fuel properties. Compositions of
biodiesel are generally analyzed by instrumentals such as gas chromatography-mass
spectroscopy (GC/MS), Fourier transform infrared spectroscopy (FTIR), nuclear
magnetic resonance spectroscopy (NMR), and high-performance liquid chromatography
(HPLC).
Fuel is sprayed into compressed air and broken down into small droplets forming
cone shape so viscosity is major factor to determine the atomization quality, size of
droplets, and spray growth.16
High viscosity fuel tends to have a lower spray cone angle

5
and larger droplet size which requires higher pumping power.16
Also, high viscosity
increases poor atomization performance, which leads to operational issues such as
breakage of the fuel pumps and injectors.17
On the other hand, low viscosity can cause
lubrication issue.18
According to the ASTM D6751, the kinematic viscosity of biodiesel
have to meet the requirement of value between 1.9 to 6.0 centistokes (cSt) at 40ºC.19
Longer fatty esters have higher viscosity than shorter fatty esters.18
Moreover, Rodrigues
and coworkers reported that one double bond increases viscosity due to stronger
interactions between p electrons of double bonds than no double bond, which has only
van der Waals interaction.20
On the other hand, two or more double bonds have spatial
geometry which weakens interactions between p orbitals and leads to a reduction of
viscosity.18
In addition, density is one of the physical properties that affects directly
engine performance characteristics related to other quality measurements such as a
heating value and a combustion quality.17
Density increases as the number of double
bonds increases and chain length shortens.18
However, low density impurities such as
methanol can reduce density.18
In addition to kinematic viscosity and density, cold flow characteristics are
important parameters for biodiesel because of its poor cold weather properties.4d
The
temperature when biodiesel starts cloudy due to a formation of particles is called a cloud
point (CP). The temperature when the fuel no longer flows is called a pour point (PP). As
the temperature decreases below the CP, particles continue to grow and aggregate
causing plugged fuel filters and pipes.21
Common traditional diesel have -16ºC and -27ºC
for the CP and the PP on the other hand, biodiesel produced from soybean oil typically

6
have 0ºC and -2ºC of the CP and the PP.18
Molecular interactions have significant effect
on crystallization. Saturated compounds crystallize faster than unsaturated compounds
due to double bonds structures.22
Double bonds provide the spatial geometry which
prevents from packing at lower temperature. Biodiesel derived from beef tallow or palm
oil contains high amount of saturated compounds have much higher CP than biodiesel
derived from canola or linseed oil. It has been reported by Rodrigues et al. that double
bonds located near the ends of carbon chain can pack more efficiently than double bonds
found in middle of carbon chain.18
Not only double bonds but also chain lengths affect
properties in low temperature.23
Other studies showed that branched carbon chains can
crystallize slower than linear carbon chains which have larger van der Waals
attractions.24
There are several approaches to improve the cold weather properties of biodiesel.
The first method is blending biodiesel with traditional diesel.25
Since traditional diesel is
mainly consisted of hydrocarbon, mixture of biodiesel and petroleum diesel can reduce
crystallization temperature. The second method is called winterization and this method
removes components which have higher melting point by separation processes. However,
this method is highly expensive in biodiesel production process.26
In addition, removing
saturated compounds results in decreasing the ignition quality and calorific value.27
The
third method is adding additives in biodiesel. Polymers and copolymers are commonly
used as pour point depressants and wax dispersants.28
In general, those additives have oil-
soluble long chain alkyl group with polar structure moiety which can interfere the host
material in molecular-level and prevent aggregation process of wax and particles due to

7
the polar moiety.25-26, 29
Various analysis techniques for the CP have been reported such
as visual observation, turbidimetry, light scattering, viscometry, thermo-optical analysis,
neutron scattering, microcalorimetry, refractometry, near-infrared/fiber optic technique
analysis and particle counting.30
The common way to examine the CP is by ASTM
D2500 which measures the CP visually however, frequent inspections are necessary.31
The temperature when biodiesel freezes below the PP is called a freezing point
(FP). Sajith and coworkers showed that metal additives especially manganese has a great
effect in the reduction of the FP.32
Differential scanning calorimetry, thermomechanical
analysis and dynamic mechanical analysis are useful to analyze the FP.33
However, those
methods require expensive instruments. On the other hand, the cooling curve method is
easier, accurate, and cheaper to analyze. Typical cooling curve shown in Figure 2
illustrated freezing process for various situations.
Figure 2. Typical cooling curves. I: pure solvent, II: mixture of solvent and solute, III:
mixture of solvent and the eutectic composition.34
8
The temperature of a sample decreases gradually and goes into the super cooling
phase and starts to solidify.34
Then, a sudden increase in temperature to the FP is obtained
by the faster release in its latent heat to the surroundings than the removing heat from the
system.33
During the solidification, the temperature stabilizes and the cooling curve levels
off. After the crystallization is completed, the temperature decreases as cooling resumes.
Figure 2 (I) graph shows a pure solvent cooling curve which have steady stabilization
temperature. Two phase cooling curve can be seen in Figure 2 (II) which indicates that
this solution is a mixture. Figure 2 (III) graph shows eutectic composition in mixture. The
solute crystals form by releasing latent heat of crystallization causing slight increase in
temperature.33
Study Goals and Design
In this study, two different biodiesel analyses were investigated. First, several
desiccants including molecular sieves and calcium-based desiccants were chosen as the
dry wash purification materials and compared especially removing volatile compounds
from crude biodiesel. Calcium chloride and calcium sulfate, which are well known
desiccants, were applied. In addition, 4A, 5A, 13X molecular sieves which are widely
used for purification, separation, chemical sensors, optoelectronic devices, shape-
selective catalysis, ion exchange, and desiccant due to their well defined various pore
structures were employed.35
The pore sizes of 4A, 5A, and 13X are 4, 5, and 10
angstroms respectively. Since both types of desiccants have a capacity to absorb
chemicals, they have potentials to remove some of the volatile compounds from crude
biodiesel. In addition, these desiccants can be reused after a reactivation.

9
Second, chemical and physical properties including the kinematic viscosity, the
density, the CP, and the FP of canola oil, coconut oil, soybean oil, palm oil, and lard
based biodiesel with Bio Flo, Wintron XC30, Wintron XC40, and Wintron Synergy
additives were examined. While these properties were studied, new CP methodology was
also developed. Since a particle formation is critical to analyze the CP, one way to
determine the particle formation, light scattering, was applied. One of the common light
scattering is called Rayleigh light scattering (RLS) and it is the scattering of light due to
the elastic collisions of particles which are small compare to the wavelength of incident
light.36
The RLS is commonly used in biological analysis like study of proteins, structure
of various types of complexes, and aggregation of dyes. However, determination of the
CP by the RLS has never been investigated.

10
EXPERIMENTAL
Materials
Castor, canola, coconut, soybean, and palm oils were obtained from Jedwards
International, Inc. (Quincy, MA). Lard (Armour Lard, Omaha, NE) and pure canola oil
(The J.M. Smucker Company, Orrville, OH) was purchased from a local grocery store.
Calcium chloride and calcium sulfate were purchased from Mallinckrodt and Drierite
respectively. Three various types of additives: Wintron XC30, Wintron XC40, and
Wintron Synergy were purchased from Biofuel Systems Group Limited (Lancashire,
England). Bio Flo additive was supplied by MidContinental Chemical Co. Inc. (Olathe,
KS). Factor Four Capillary Columns (30 m × 0.25 mm) was purchased from Varian Inc.
(Palo Alto, CA). R3 biodiesel (R3) was supplied by R3 Energy LLC. (Cottonwood Falls,
KS). The following chemicals were purchased from Fisher Scientific Co. (Pittsburgh,
PA): methanol (HPLC Grade); potassium hydroxide (ACS certified, purity >86.9%wt);
n-hexane (95% purity); 4A, 5A, 13X molecular sieves; triton X-100; concentrated nitric
acid; n-pentanol; mineral oil; calcium hydroxide.
Procedures
Biodiesel was synthesized by transesterification and impurities were removed by
purifications. Cold soak filtration process and additives were employed for biodiesel to
compare cold weather properties.

11
Transesterification of Biodiesel
Crisco Canola (Crisco CA-FAME), castor (CAS-FAME), canola (CA-FAME),
coconut (CO-FAME), soybean (SO-FAME), palm oil (PA-FAME), and lard (LA-FAME)
based biodiesel were synthesized in a 1000 mL Erlenmeyer flask with a magnetic stirrer
rate of 600 rpm. Approximately 1000g of oils were preheated for 30 minutes above
100°C to eliminate excess moisture and in a separate flask, 1% (wt/wt) potassium
hydroxide were mixed with methanol at a 6:1 methanol to oil molar ratio.37
Mixture of
catalyst and alcohol was added to the flask which contained oils and heated to 65°C for
120 minutes. After the reaction, the mixture was equilibrated to a room temperature and
transferred to a 2000 mL separatory funnel followed by an overnight settling. A bottom
layer, glycerol, was removed by a gravity separation.
Purification of Biodiesel
The crude FAMEs from Crisco pure canola oil were purified by calcium-based
desiccants and molecular sieves to examine the removal of volatile byproducts. Wet wash
purification by acid solution was used to compare the results. Detail procedures are listed
in the analytical methods section. Other crude FAMEs were purified by the water
washing after removing excess methanol by a rotary evaporation. Approximately 50 °C
warm distilled water was used to wash crude FAMEs in the separatory funnel.38
Excess
water was removed by the rotary evaporation.

12
Cold Soak Filtration of Biodiesel
A standard method (ASTM D6751-09a) was modified for the cold soak filtration
(CSF) to investigate differences in a cloud point (CP).39
Approximately 20 mL of
biodiesel was placed in a large glass test tube and set it in Thermo NESLAB RTE 10
digital One re-circulating thermostatic bath (Thermo Electron Company, Waltham, MA)
at 1 °C above the cloud point for 8 hours. Then, the sample was slowly warmed up to a
room temperature without adding additional heat. The sample was filtered through a
vacuum filtration system with a single 0.45µm filter paper (0.45µm membrane MCE-
47mm Non-sterile white, Fisher Scientific Co., Pittsburgh, PA) and separated into solid
and liquid phase.
Preparation of Biodiesel with Additives
Wintron XC30 and XC40 additives which are pour point depressants, Wintron
Synergy additive which is cold filter plugging point depressant, and Bio Flo additive
which is cold flow improver were used as additives. The concentration for Wintron
additives (XC30, XC40, and Synergy) was 2% (wt/wt) and the concentration of Bio Flo
in the biodiesel was 0.5% (wt/wt).
Analytical methods
Purification process using desiccants and chemical and physical properties of
biodiesel were studied.

13
Purification of Biodiesel by Desiccants
Removability of volatile byproducts was examined by various desiccants.
Reusability and a saturation level of desiccants and calcium concentration were
investigated.
Determination of Volatile Byproducts Content in Biodiesel
The volatile byproducts content was determined using a method AOCS Ca 2c-
25.40
Approximately 5% (wt/wt) of calcium chloride, calcium sulfate, 4A, 5A, or 13X
molecular sieves were weighed and placed in 5 g of crude Crisco CA-FAME individually
and let set for 30 minutes with occasional stirrings. A combination of calcium sulfate and
13X was set for 15 minutes each, total of 30 minutes setting. Then, the desiccants were
removed by the vacuum filtration followed by oven dry at 101± 1oC in a Fisher Isotemp
Oven Senior Model (Fisher Scientific, Pittsburgh, PA). The sample was weighed after 1.5
hours to 2 hours then after that, it was weighed every 30 minutes until a constant weight
was obtained. The volatile byproducts content in biodiesel was calculated by the amount
of lost weight over the initial amount of sample. Crude Crisco CA-FAME was also
washed with 5% (wt/wt) phosphoric acid solution in the separatory funnel.41
Then, the
volatile byproducts content of washed crude Crisco CA-FAME was determined and the
results were compared with various desiccants.
Determination of Reusability of Desiccants
The excess FAMEs were removed from used desiccants and the desiccants were
reactivated at 300oC oven for 24 hours. The reusability of calcium chloride, calcium

14
sulfate, 4A, and 5A desiccants was calculated by the difference in the amount of
desiccants after reactivation.
Determination of Saturation Level of Desiccants
The saturation of desiccants was determined by a glass column. Approximately 5
cm height of the glass column was packed with calcium sulfate and 13X individually and
also combination of calcium sulfate and 13X. Crude Crisco CA-FAME was poured into
the glass column and samples were collected every 15 seconds in a beaker. Then, the
volatile byproduct content was analyzed by the same procedure which was explained in
determination of volatile byproducts content in biodiesel section. The saturation graph
was plotted with the amount of volatile byproducts present in biodiesel as the function of
time.
Determination of Calcium Content in Biodiesel
The calcium concentration of biodiesel was analyzed by AAnalyst100 atomic
absorption spectrometer (Perkin-Elmer, Norwalk, CT). Standard solutions were prepared
by mixing 57.6% (wt/wt) n-pentanol as co-surfactant, 20% (wt/wt) mineral oil, 14.4%
(wt/wt) triton X-100, and 8% (wt/wt) water.42
In the water content, 1000 ppm calcium
hydroxide was added to achieve the final calcium concentration of 1, 2, 5, 8, and 10 ppm.
Biodiesel samples were prepared the same procedure except changing mineral oil to
biodiesel. A calibration curve was obtained using the data of standard solutions and the
calcium concentrations of the samples were calculated.

15
Chemical Properties of Biodiesel Analysis
Chemical properties of biodiesel were analyzed by FTIR, NMR, and GC/MS.
Fourier Transform Infrared Spectroscopy Analysis
Fourier transform infrared spectroscopy (FTIR) spectra of transmittance were
obtained using Spectrum One FTIR Spectrometer (Perkin-Elmer, Norwalk, CT) with
diamond ATR. Scanning range of 650-4000 cm-1
, scan number of four, and resolution of
4 cm-1
were employed for this analysis.
Magnetic Resonance Spectroscopy Analysis
1H magnetic resonance spectroscopy (
1H-NMR) spectra were recorded using Eft-
90 NMR spectrometer (Anasazi Instruments, Indianapolis, IN). 500 µL of sample was
diluted in 500 µL carbon tetrachloride. One scan was collected for this experiment.
Gas Chromatography Mass Spectroscopy Analysis
Gas chromatography-mass spectroscopy (GC/MS) spectra were recorded on
Varian Saturn 2100T with 30 m × 0.25 mm × 0.25 um Rtx-Wax column (Restek,
Bellefonte, PA). Split ratio of 1:10, injection temperature of 220°C, flow rate of 1
mL/min were applied for GC instrumental setting. Initial oven temperature was 160°C
followed by increase of temperature up to 200°C with 20 °C/min and increase up to
230°C with 5 °C/min and hold for 6 minutes.43
Detection delay for MS of 1.6 minutes
was employed. The ratio of sample to solvent, hexane, were 1:400.

16
Physical Properties of Biodiesel
Kinematic viscosity, density, cloud point, and freezing point of biodiesel were
investigated.
Determination of Kinematic Viscosity
The kinematic viscosity was determined with a size 100 Cannon-Fenske Routine
viscometer (Cannon Instrument Co., Boalsburg, Pa) at 40°C followed by ASTM D445-
09.44
The temperature of a water bath was set at 40°C and calibrated. 10 mL of sample
was placed into the viscometer and allowed the viscometer and sample to equilibrate to
the water bath for 30 minutes. Sample liquid was sucked above the top mark using a
vacuum hose and time required to travel from the top mark to the bottom mark was
timed. All experiments were run in quadruplicate and the kinematic viscosity was
calculated by the following equation (1)
(1)
Where v is the kinematic viscosity (centistokes, cSt), C is the viscometer constant (cSt/s),
and t is the measured flow times (s). Then, an average kinematic viscosity and a standard
deviation were reported.
Determination of Density
The density was calculated by the following equation (2).
(2)
Where ρ is the density (g/mL), m is the mass (g), and V is the volume (mL). Mass and
volume were measured using a 10 mL volumetric flask at the 25°C water bath.
17
Equilibrium time of 20 minutes was applied. All experiments were run in triplicate and
an average density and a standard deviation were reported.
Determination of Cloud Point
Cloud point was studied by spectrofluorometer, visual observation, and
ultraviolet-visible spectrophotometer.
SPECTROFLUOROMETRIC CLOUD POINT ANALYSIS METHOD
The fluorometer cloud point (CPF) was determined using Horiba JobinYvon
FluoroMax-4 Spectrofluorometer (HORIBA JobinYvon Inc., Edison, NJ) by measuring
RLS. Approximately 2 mL of sample was placed in a 10 mm silica quartz cuvette. A
width of excitation and emission slits was set at 1.0 nm. An excitation wavelength of 400
nm was used to probe the sample and a scattering of the excitation wavelength was
measured from 200 to 600 nm at various temperatures from 25°C to -15°C with a 20
minutes equilibration time for every degree decrement. Changing in the light scattering
was obtained by plotting temperature versus S1/R1 (signal over references). Then, a
minimum distinguishable analytical signal (MDAS) was calculated according to the
equation below.45
(3)
Where is the MDAS, is baseline, which is average blank signal obtaining at much
higher temperature than the CPF of the sample, and an instrument noise was calculated as
which is constant multiplied by , which is standard deviation of blank signal.
Typically, is applied in order to obtain 99.86% confidence level.46
However,
18
was used in this experiment to achieve higher confidence level. The temperature at which
the scattering signal was significantly higher than the sum of the baseline and the
instrument noise was recorded as the CPF. In addition, various equilibrium times from 1
to 20 minutes for both 10 mm and 3 mm cuvettes were employed to compare the
minimum equilibrium time to determine the CPF.
MODIFIED VISUAL CLOUD POINT ANALYSIS METHOD
The visual cloud point (CPV) method ASTM D2500 was modified to analyze the
CPV of each sample. The sample was placed in the 10 mm cuvette. The cooling system
was controlled by Horiba JobinYvon FluoroMax-4 Spectrofluorometer (HORIBA
JobinYvon Inc., Edison, NJ). Temperature was adjusted from 298 to 258 K with the 20
minutes equilibration time for each temperature. The sample was checked for cloudiness
each temperature and the temperature when the sample showed cloudy appearance was
recorded as the CPV.
ULTRAVIOLET-VISIBLE SPECTROSCOPIC CLOUD POINT ANALYSIS METHOD
The UV-vis cloud point (CPU) was determined by Cary 50 Bio UV-Visible
Spectrophotometer (Varian Inc., Palo Alto, CA, USA). The re-circulating thermostatic
bath was used for control the temperatures. Stephen and coworkers showed that biodiesel
absorbed light below 400 nm and particles scattered short wavelength light more
effectively than long wavelength light.47
Therefore, a transmittance at 540 nm was
applied. The transmittance was plotted as a function of temperature and the temperature
which has a maximum derivative was reported as the CPU.

19
Determination of Freezing Point
Freezing point of biodiesel was analyzed and freezing point depression using
hydrocarbon solutes was examined.
FREEZING POINT ANALYSIS OF BIODIESEL
Approximately 2 mL of sample was transferred into a small test tube and held
with a clamp. A thermocouple temperature probe TC101A (MadgeTech, Contoocook,
NH) was immersed into the sample solution without touching side of the test tube. The
accuracy of the temperature probe was ± 0.5°C. The apparatus was placed into either -
30°C Kelvinator freezer (Kelvinator, Charlotte, NC) or -80°C Fisher Isotemp freezer
(Fisher Scientific, Pittsburgh, PA). Temperatures were recorded every second for 30
minutes. The cooling curve was obtained by plotting temperature versus time. The
freezing point (FP) was identified at the temperature where the slowest cooling rate starts
from the cooling curve.
FREEZING POINT DEPRESSION OF BIODIESEL
Samples were prepared by mixing 3 mL CA-FAME as solvent with seven
different types of solutes at various concentrations from 0 to 10 M. The solutes used in
the FP depression experiment were heptane (C7), octane (C8), decane (C10), dodecane
(C12), tetradecane (C14), hexadecane (C16), and octadecane (C18). Then, the FP was
analyzed by applying the method described above. The relationship between the FP and
various solutes at different concentrations were examined.

20
RESULTS/DISCUSSION
Volatile Byproducts Content in Biodiesel and Reusability and Saturation of
Desiccants
Figure 3 shows the results, which were run in triplicate, of the amount of volatile
byproducts present in biodiesel produced from Crisco canola oil (Crisco CA-FAME)
after with treatment and without any treatments (NT). The NT has a higher amount of
volatile byproducts and the calcium-based desiccants were almost comparable to the acid
wash. Among the molecular sieves, the adsorption of the volatile byproducts by 13X was
higher than 4A and 5A. Overall, the calcium-based desiccants had better capability
absorbing the volatile byproducts than the molecular sieves.
Figure 3. Comparison of average volatile byproducts content in Crisco CA-FAME which
was removed by Ca based desiccants, molecular sieves, and acid wash and Crisco CA-
FAME without any treatments (NT).
0
0.01
0.02
0.03
CaCl2 CaSO4 4A 5A 13X acid wash NT
Am
ount
of
vola
tile
bypro
duct
(g)
/ 1g
Cri
sco C
A-F
AM
E

21
Table I shows very low recovery yield for calcium chloride losing about 30% of
its weight after the reactivation process. A loss of calcium chloride might happen during
the vacuum filtration since calcium chloride used in this study was fine powders. Also,
Table II indicates that calcium dissolved in biodiesel because the calcium concentration
of Crisco CA-FAME treated with calcium sulfate was much higher than that of Crisco
CA-FAME without any treatments. The calcium concentration of Crisco CA-FAME
treated with calcium sulfate was more than the limitation of calcium and magnesium
combination value of 5 ppm listed in ASTM D6751.48
Therefore, even though calcium
sulfate was the most suitable reusable desiccants among various drying agents, biodiesel
treated with calcium sulfate was inapplicable.
Table I Comparison of recovery yield of calcium chloride, calcium sulfate, 4A, and 5A
molecular sieves after reactivation
Recovery yield (%)
CaSO4 98.1
CaCl2 69.4
4A 82.0
5A 88.1
Table II Comparison of calcium concentration for crude Crisco CA-FAME with
treatments of calcium sulfate and 13X molecular sieves and without any treatment
NT CaSO4 13X
Ca conc. (ppm) 0.1 23.1 BDL

22
Then, the combination of calcium sulfate and 13X was investigated for the
removability of excess calcium from biodiesel treated with the calcium-based desiccants
by the molecular sieves. The experiments were run in triplicate and average volatile
byproduct content was shown in Figure 4. Since this Crisco CA-FAME was synthesized
in different batches, slight differences in the amount of the volatile byproducts between
Figure 3 and Figure 4 were observed. However, calcium sulfate had again higher capacity
to absorb the volatile byproducts than 13X. Crisco CA-FAME treated with the
combination of calcium sulfate and 13X gave the lowest amount of the volatile
byproducts which indicated the combination was more effective than applying individual
desiccant.
Figure 4. Comparison of average volatile byproducts content in Crisco CA-FAME which
was removed by CaSO4, 13X, and combination of CaSO4-13X and Crisco CA-FAME
without any treatments.
0.000
0.010
0.020
0.030
NT CaSO4 13X CaSO4-13X
Am
ount
of
vo
lati
le b
ypro
duct
s (g
) /
1g o
f
Cri
sco C
A-F
AM
E

23
The change in values for the calcium concentrations between Table II and III was
observed. This might be due to the size of calcium sulfate crystals. Calcium sulfate used
in Table II might be smaller crystals than that used in Table III. Slight changes in
standard solutions preparation might also contribute to this change. However, the calcium
concentration was successfully reduced from 5.7 to 2.3 ppm using the combination of the
calcium-based desiccants and the molecular sieves.
Table III Calcium concentration in crude Crisco CA-FAME treated with CaSO4, 13X,
and combination of CaSO4-13X
NT CaSO4 13X CaSO4-13X
Ca conc. (ppm) 1.0 5.7 0.8 2.3
Figure 5. Saturation analysis of CaSO4 using glass column.
0
0.01
0.02
0 200 400 600
Am
ount
of
vola
tile
bypro
duct
s (g
) /
1g o
f
Cri
sco C
A-F
AM
E
Time (sec)

24
The saturation analysis for calcium sulfate, 13X, and the combination of calcium
sulfate and 13X were plotted in Figure 5, 6, and 7. Although the absorption capability
using calcium sulfate was higher than 13X for the 30 minutes setting method, this
saturation analysis shows that calcium sulfate and 13X individually had similar amount
of the volatile byproduct contents in Crisco CA-FAME. The combination also shows
higher absorption using the 30 minutes setting method compared with the glass column
method. In addition, two distinguish level phases were observed for the combination of
desiccants shown in Figure 7. This may indicate that the one of two desiccants reached its
maximum saturation faster than the other but further examinations will be necessary to
prove the theory.
Figure 6. Saturation of 13X using glass column.
0
0.01
0.02
0 200 400 600
Am
ount
of
vola
tile
bypro
duct
s (g
) /
1g o
f
Cri
sco C
A-F
AM
E
Time (sec)

25
Figure 7. Saturation of combination of CaSO4-13X using glass column.
Chemical Compositions Analysis of Biodiesel
Biodiesel produced from canola oil, coconut oil, soybean oil, palm oil, and lard
(CA-FAME, CO-FAME, SO-FAME, PA-FAME, and LA-FAME) were successfully
synthesized through transesterification. All FAMEs have similar FTIR peaks shown in
Figure 8. Two peaks around 2950 and 3000 cm-1
were C-H vibrations. Also, wave
number of 1750 cm-1
indicates C=O vibration of esters. According to Figure 9, the strong
extra signal appeared in CA-FAME proton NMR spectrum which indicated methyl ester
formations compared with the spectrum of canola oil. This extra peak was also observed
in CO-FAME, SO-FAME, PA-FAME, and LA-FAME proton NMR spectra.
0
0.025
0.05
0 100 200 300 400 500
Am
ou
nt
of
vola
tile
by
pro
duct
s (g
) /
1g o
f
Cri
sco C
A-F
AM
E
Time (sec)

26
Figure 8. FTIR spectra from 650 to 4000 nm for CA-FAME, CO-FAME, SO-FAME,
PA-FAME and LA-FAME.
50
60
70
80
90
100
650 1150 1650 2150 2650 3150 3650
Tra
nsm
itta
nce
(%
)
Wave number (cm-1)
CA-FAME CO-FAME
SO-FAME PA-FAME
LA-FAME

27
Figure 9. Comparison of 1H NMR spectra of canola oil and CA-FAME.
However, biodiesel from castor oil could not be obtained due to an inability to separate
glycerol from the product after transesterification. FTIR data in Figure 10 shows that an
unseparated phase was a mixture of FAME and glycerol. Overlapped spectra of R3 and
the unseparated phase at wave number of 1750 cm-1
indicated the ester formation.
However, the unseparated phase shows partial glycerol at 1000 cm-1
and 3300 cm-1
. This
may be due to a solubility of castor oil and its derivatives in alcohol.49
They are
completely soluble in alcohol thus; the complete transesterification reaction might not be
achieved due to the lack of alcohol.

28
Figure 10. FTIR results from 650 to 4000 nm for unseparated phase from castor oil
transesterification, glycerol, and R3.
30
40
50
60
70
80
90
100
650 1150 1650 2150 2650 3150 3650
Tra
nsm
itta
nce
(%
)
Wave number(cm-1)
Castor unseparated phase
Glycerol
R3

29
Table IV Biodiesel profiles (area %) for various feedstock based biodiesel
CA-FAME
CO-FAME
SO-FAME
PA-FAME
LA-FAME
Caprylic (C8:0) - 6.3 - - -
Capric (C10:0)
- 6.3 - - -
Lauric (C12:0)
- 43.6 - - 0.2
Myristic (C14:0) 0.1 21.5 0.1 1.4 2.4
Pentadecylic
(C15:0)
- - - - 0.1
Palmitic (C16:0)
6.5 11.5 12.2 39.1 25.6
Palmitoleic
(C16:1)
0.3 - 0.2 0.2 2.7
Margaric (C17:0)
0.2 - 0.2 0.2 0.6
Margaroleic
(C17:1)
0.3 - - - 0.4
Stearic (C18:0)
2.3 3.4 5.6 5.6 17.6
Oleic (C18:1)
63.6 6.3 24.2 41.2 33.6
Linoleic (C18:2)
17.3 0.8 45.5 10.4 12.4
Linolenic (C18:3)
6.2 - 6.8 0.2 0.2
Arachidic (C20:0)
0.4 - 0.4 0.5 0.3
Eicosanoic (C20:1)
0.8 - 0.2 0.2 0.5
Eicosadienoic
(C20:2)
- - - - 0.4
Behenic (C22:0)
- - 0.2 - -
30
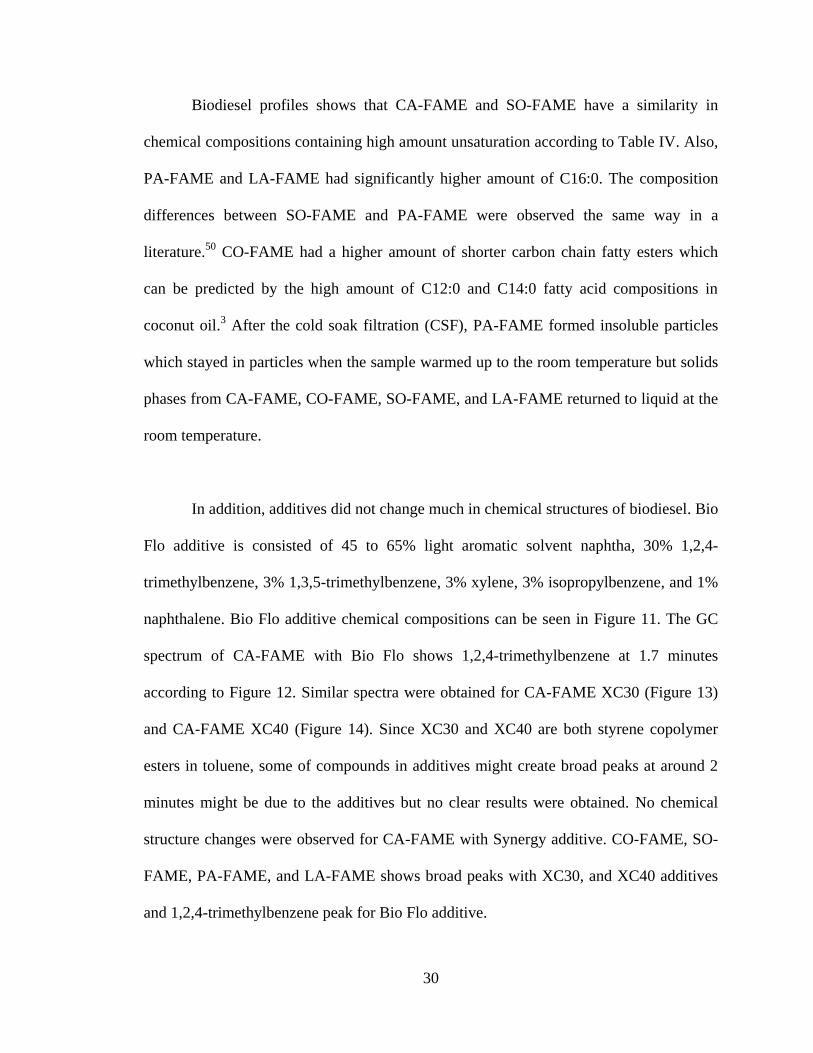
Biodiesel profiles shows that CA-FAME and SO-FAME have a similarity in
chemical compositions containing high amount unsaturation according to Table IV. Also,
PA-FAME and LA-FAME had significantly higher amount of C16:0. The composition
differences between SO-FAME and PA-FAME were observed the same way in a
literature.50
CO-FAME had a higher amount of shorter carbon chain fatty esters which
can be predicted by the high amount of C12:0 and C14:0 fatty acid compositions in
coconut oil.3 After the cold soak filtration (CSF), PA-FAME formed insoluble particles
which stayed in particles when the sample warmed up to the room temperature but solids
phases from CA-FAME, CO-FAME, SO-FAME, and LA-FAME returned to liquid at the
room temperature.
In addition, additives did not change much in chemical structures of biodiesel. Bio
Flo additive is consisted of 45 to 65% light aromatic solvent naphtha, 30% 1,2,4-
trimethylbenzene, 3% 1,3,5-trimethylbenzene, 3% xylene, 3% isopropylbenzene, and 1%
naphthalene. Bio Flo additive chemical compositions can be seen in Figure 11. The GC
spectrum of CA-FAME with Bio Flo shows 1,2,4-trimethylbenzene at 1.7 minutes
according to Figure 12. Similar spectra were obtained for CA-FAME XC30 (Figure 13)
and CA-FAME XC40 (Figure 14). Since XC30 and XC40 are both styrene copolymer
esters in toluene, some of compounds in additives might create broad peaks at around 2
minutes might be due to the additives but no clear results were obtained. No chemical
structure changes were observed for CA-FAME with Synergy additive. CO-FAME, SO-
FAME, PA-FAME, and LA-FAME shows broad peaks with XC30, and XC40 additives
and 1,2,4-trimethylbenzene peak for Bio Flo additive.

31
Figure 11. FTIR spectra from 650 to 4000 nm for additive Bio Flo and some of its
compositions.
20
30
40
50
60
70
80
90
100
650 1150 1650 2150 2650 3150 3650
Tra
nsm
itta
nce
(%
)
Wavelength (nm)
Bio Flo
1,2,4-trimethylbenzene
m-xylene
p-xylene

32
Figure 12. GC spectra of CA-FAME and CA-FAME with Bio Flo additive.
Figure 13. GC spectra of CA-FAME and CA-FAME with XC30 additive.

33
Figure 14. GC spectra of CA-FAME and CA-FAME with XC40 additives.
Figure 15. GC spectra of CA-FAME and CA-FAME with Synergy additive.

34
Physical Properties of Biodiesel
The viscosity experiments were run in quadruplicate and Figure 16 illustrates that
adding viscous copolymer additives, XC30 and XC40, led to higher viscosity than the
FAMEs without additive. The viscosity requirement of 6.0 centistokes (cSt) could not be
achieved by CA-FAME, SO-FAME, PA-FAME, and LA-FAME with XC30 and XC40
additives therefore those additives were not applicable with that concentration. Since
Synergy is mineral oil based additive, the viscosity increased slightly. The viscosity order
of XC30 > XC40 > Synergy > Bio Flo was obtained. Shorter fatty asters of CO-FAME
had the lowest viscosity which followed the general trend for viscosity.
Figure 16. Summary of average kinematic viscosity (cSt) at 40ºC of various biodiesels
and those with additives.
0
2
4
6
8
Kin
emat
ic V
isco
sity
(cS
t)
FAME Bio Flo XC30 XC40 Synergy
PA-FAME CO-FAME CA-FAME SO-FAME LA-FAME

35
Figure 17. Summary of average density (g/mL) at 25ºC of various biodiesels and those
with additives.
The density measurement done in triplicate shown in Figure 17 illustrates that CO-FAME
and PA-FAME had lower density than CA-FAME, SO-FAME, and LA-FAME. Some of
additives increased the density slightly.
0
0.2
0.4
0.6
0.8
1
Den
sity
(g/m
L)
FAME Bio Flo XC30 XC40 Synergy
PA-FAME CO-FAME CA-FAME SO-FAME LA-FAME

36
Figure 18. Three dimensional spectrofluorometer graph of CA-FAME with excitation
wavelength of 400 nm.
298
288
278
268
0
200000
400000
600000
800000
1000000
1200000
1400000
1600000
200 250 300 350 400 450 500 550 600
Tem
peratu
re (K)
S1/R
1
Wavelength (nm)

37
Figure 18 shows a three dimensional graph of the Rayleigh light scattering (RLS)
for CA-FAME. At around 415 nm, large increase in the intensity of the RLS as the
temperature decreased was observed. Typically the excitation wavelength and scattering
wavelength for RLS are the same but the shift in scattering wavelength was seen
according to Figure 19.
Figure 19. Average scattering peak for CA-FAME, CO-FAME, SO-FAME, PA-FAME,
and LA-FAME compared with excitation wavelength of 400 nm.
This phenomenon is typically observed using resonance RLS.51
Resonance RLS is
produced when the wavelength of RLS is located at or close to molecular absorption
band.52
According to the study by Zhu and coworkers, as a dielectric constant of
surrounding media increases, the scattering peak red-shifts.53
Since the dielectric constant
can be expressed using a refractive index in a following equation: εr (λ) = n2 (λ) + k
2 (λ)
where εr is relative dielectric constant, n is real part of refractive index, k is imaginary
400 405 410 415
CA-FAME
CO-FAME
SO-FAME
PA-FAME
LA-FAME
wavelength (nm)

38
refractive index, and λ is wavelength of incident light, the peak shift should be observed
by the change of the refractive index.54
Generally the refractive index of biodiesel gets
larger as the lengths of carbon chain and levels of unsaturation increase.55
Thus, biodiesel
which contains longer carbon chains with high level of unsaturation such as CA-FAME,
SO-FAME, and LA-FAME is predicted to have longer scattering wavelength than CO-
FAME and PA-FAME. Figure 19 shows the larger shift for CA-FAME, SO-FAME, and
LA-FAME and the smaller shift for PA-FAME which followed the general trend for the
refractive index and the peak shift. However, CO-FAME shifted longer than CA-FAME
and SO-FAME. This might be explained by the presence of impurities in CO-FAME such
as glycerol. Glycerol has higher refractive index than typical biodiesel and could shifts
the peak even further.56
Figure 20. Plot of CO-FAME for fluorometer cloud point determination using Rayleigh
light scattering (RLS) calculated by minimum distinguish analytical signal (MDAS).
60000
70000
80000
90000
100000
110000
120000
130000
282 284 286 288 290 292 294 296 298
S1/R
1
Temperature (K)
RLS MDAS

39
To determine the fluorometer cloud point (CPF), the emission of the RLS intensity
was plotted as the function of time as shown in Figure 20. The graph illustrates CO-
FAME sample using the fluorometer method and the minimum distinguish analytical
signal (MDAS) was calculated above 286 K. From the graph, the temperature of 284K
was significantly higher than the MDAS which indicated the presence of particles.
Therefore, the 284 K was concluded as the CPF for CO-FAME. The UV-vis cloud point
(CPU) determination of CO-FAME can be seen in Figure 21. The sudden decrease in
transmittance indicates the start of particle formation. The highest derivative of CO-
FAME was obtained at 283 K thus, 283 K was recorded as the CPU.
Figure 21. Plot of CO-FAME for UV-vis cloud point determination calculated by
derivative of transmittance.
70
75
80
85
90
95
100
280 282 284 286 288 290 292
Tra
nsm
itta
nce
(%
)
Temperature (K)
derivative
CO-FAME

40
Table V Comparison of CPF (K) for SO-FAME with excitation wavelength of 200, 300,
400, 600 nm
Figure 22. Comparison of CPF before and after cold soak (CSF) filtration for CA-FAME,
CO-FAME, SO-FAME, PA-FAME, and LA-FAME.
255
260
265
270
275
280
285
290
CA-FAME CO-FAME SO-FAME PA-FAME LA-FAME
Tem
per
ature
(K
)
before CSF after CSF
Excitation wavelength (nm) CPF
200 -
300 270
400 271
600 271

41
Table VI Summary for CP (K) of CA-FAME, CO-FAME, SO-FAME, PA-FAME, and
LA-FAME with and without additives
CPF CPU CPV
CA-FAME 268 267 269
Bio Flo 268 267 267
XC30 268 266 266
XC40 267 267 266
Synergy 265 263 264
CO-FAME 284 283 282
Bio Flo 282 281 281
XC30 281 280 280
XC40 281 281 280
Synergy 283 282 282
SO-FAME 271 272 271
Bio Flo 271 271 270
XC30 268 269 267
XC40 269 269 268
Synergy 268 268 267
PA-FAME 284 285 285
Bio Flo 283 285 284
XC30 282 284 283
XC40 285 284 284
Synergy 281 282 282
LA-FAME 285 286 285
Bio Flo 284 284 284
XC30 284 285 284
XC40 285 285 285
Synergy 284 284 283

42
The RLS is applied for particles which are smaller than incident of light so Table
V shows that particles formed in SO-FAME in lower temperature was greater than 200
nm because no change in the intensity was obtained with the 200 nm excitation
wavelengths even when particles formed.
According to summary Table VI, slight changes in the CP were achieved using
Bio Flo additives for all type of biodiesel. XC30, XC40, and Synergy additives typically
decreased the CP more for samples with high in unsaturated compounds. Since Synergy
is cold filter plugging point improver for used cooking oil and canola oil based biodiesel,
reduction of CP for CA-FAME was observed compared with other additives. XC40 is
specially formulated for canola and soybean oil based biodiesel but no significant
improvement was obtained. LA-FAME had the least effect on the CP when additives
were introduced. Overall, less than 5 K decrements of the CP were obtained using Bio
Flo, XC30, XC40, and Synergy additives. Figure 22 shows that the cold soak filtration
(CSF) could help lower the CP. Biodiesel which forms insoluble particles such as PA-
FAME has a greater effect in CP by the CSF. The accuracy of the fluorometer cloud
point method was analyzed by a linear regression analysis. It has the R2 value of 0.9882
according to Figure 23. Therefore, the fluorometer cloud point method was comparable to
the traditional visual observation method. There were slightly inconsistent results
between the fluorometer and the UV-vis methods. This can be explained by the use of
different cooling systems. The cooling system for the fluorometer had a smaller
precision, hence kept the cell at consistent temperature with smaller fluctuations than the
cooling system attached to the UV-Vis.

43
Figure 23. Linear regression analysis for fluorometer cloud point and visual cloud point.
Since a 3 mm cuvette uses smaller sample volume which requires less time to
achieve constant temperature inside sample, shorter equilibrium time is predicted. Shorter
equilibrium times were observed for CA-FAME, PA-FAME, and LA-FAME according
to Table VII. However, CO-FAME and SO-FAME required the same amount of
equilibrium time to achieve the CPF. No correlation between the equilibrium time and the
type of biodiesel were determined from this data. The 10 mm and 3 mm cuvettes were
also employed to compare the intensity of MDAS for CA-FAME. Since CA-FAME had
the CPF of 268 K, the MDAS can be predicted to be level above 268 K. However, Figure
y = 0.9494x + 14.449
R² = 0.9882
260
265
270
275
280
285
290
260 265 270 275 280 285 290
Flu
oro
met
er c
loud p
oin
t (K
)
Visual cloud point (K)

44
24 indicates that the intensity of the MDAS gradually increased for the 10 mm cuvette
compared with the 3 mm cuvette. A condensation was observed visually for the 10 mm
cuvette at lower temperatures so a gradual increase in the intensity can be explained as
the condensation.
Table VII Comparison of minimum equilibrium time (minute) to achieve CPF for CA-
FAME, CO-FAME, SO-FAME, PA-FAME, and LA-FAME using 10 mm and 3 mm
cuvettes
Figure 24. Comparison of intensity changes for CA-FAME minimum distinguish
analytical signal using 10 mm and 3 mm cuvettes.
0
20000
40000
60000
80000
100000
120000
266 268 270 272 274 276 278 280 282 284 286 288 290 292 294
S1/R
1
Temperature (K)
10mm 3mm
CA-FAME CO-FAME SO-FAME PA-FAME LA-FAME
10mm 5 20 10 5 8
3mm 1 20 10 1 2

45
Multiple distinguishable freezing points (FPs) were observed from a cooling
curve of CA-FAME as shown in Figure 25. The slope change caused by the latent heat of
fusion occurred around 140 seconds which indicated the beginning of crystallization of
some compositions (first FP). Then, the phase change of some compounds took place
around 500 seconds (second FP). Finally, the eutectic compounds solidified at constant
temperature between 1200 to 1350 seconds until the completion of crystallization (EP).
Figure 25. Cooling curve of CA-FAME.
-70
-60
-50
-40
-30
-20
-10
0
10
20
30
0 200 400 600 800 1000 1200 1400 1600 1800
Tem
per
ature
(°C
)
Time (sec)
46
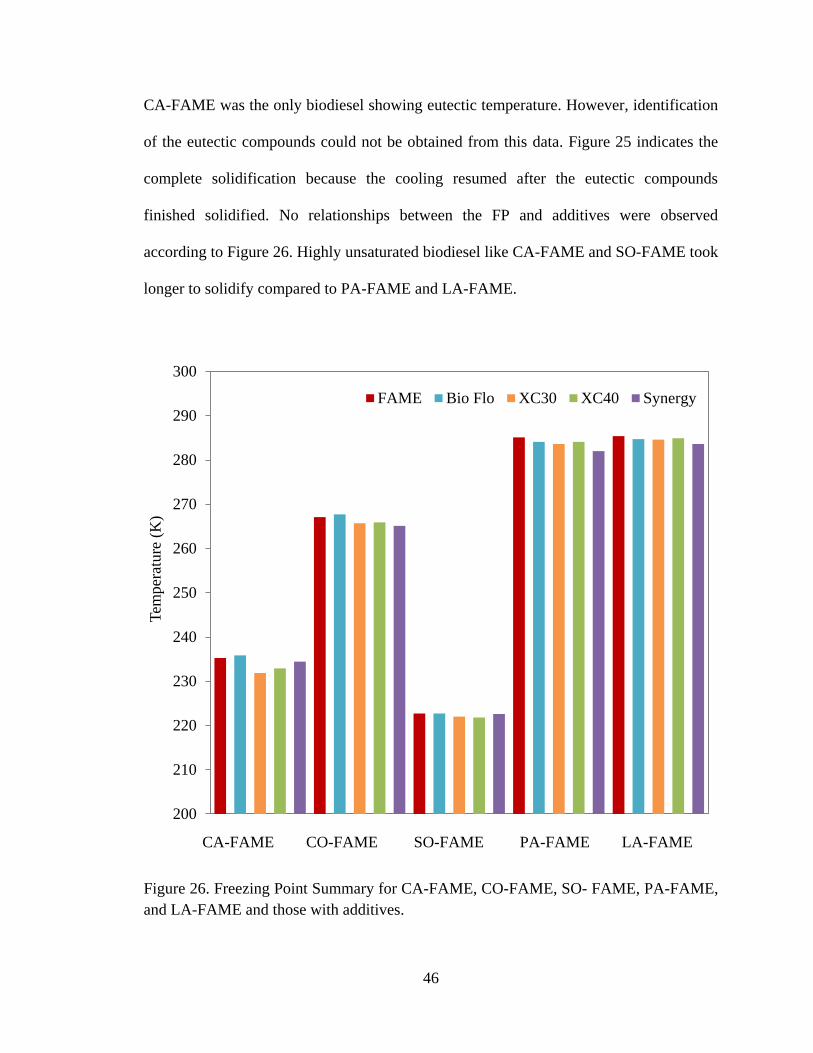
CA-FAME was the only biodiesel showing eutectic temperature. However, identification
of the eutectic compounds could not be obtained from this data. Figure 25 indicates the
complete solidification because the cooling resumed after the eutectic compounds
finished solidified. No relationships between the FP and additives were observed
according to Figure 26. Highly unsaturated biodiesel like CA-FAME and SO-FAME took
longer to solidify compared to PA-FAME and LA-FAME.
Figure 26. Freezing Point Summary for CA-FAME, CO-FAME, SO- FAME, PA-FAME,
and LA-FAME and those with additives.
200
210
220
230
240
250
260
270
280
290
300
Tem
per
ature
(K
)
FAME Bio Flo XC30 XC40 Synergy
CA-FAME CO-FAME SO-FAME PA-FAME LA-FAME

47
The first FP depression results show two different patterns depending on the
length of solute according to Figure 27 and 28. Figure 27 indicates that shorter
hydrocarbon of heptane, octane, and decane had linear relationships with negative slopes
between the first FP. Since pure heptanes, octane, and decane have the FPs of -91, -57,
and -30ºC respectively, the first FP was moving toward the freezing point of pure solute
as the concentration of solute increased. On the other hand, Figure 28 shows that the
solvent and solution did not have any correlations but solution with longer hydrocarbon
of dodecane, tetradecane, hexadecane, and octadecane had logarithm relationships.
Figure 27. Change in first FP for CA-FAME with 0, 0.5, 1, 2, and 5 M of heptane, octane,
and decane.
-20.0
-10.0
0.0
0 1 2 3 4 5
Tem
per
ature
(°C
)
Concentration (M)
Heptane Octane Decane

48
Additional of 0.5 M dodecane, tetradecane, and hexadecane decreased the first FP
of CA-FAME followed by the FP depression theory but reduction in the FP could not be
achieved by 0.5 M octadecane. No further depression was observed with higher solute
concentrations. It can be concluded that solutes at and above 0.5 M became dominant
components to control the FP. Similar phenomenon was observed in binary mixtures
study by Brewer, J. and Kurata, F..57
They concluded that the FP plot of binary mixture
as a function of concentration was simple straight line when the FP of solute was similar
to that of solvent but the FP started to curve as the number of carbon atoms in solute
increased.
Figure 28. Change in first FP for CA-FAME with 0, 0.5, 1, 2, 5, and 10 M of dodecane,
tetradecane, hexadecane, and octadecane.
-60
-50
-40
-30
-20
-10
0
10
20
30
0 2 4 6 8 10
Tem
per
ature
(°C
)
Concentration (M)
CA-FAME Dodecane
Tetradecane Hexadecane
Octadecane
49
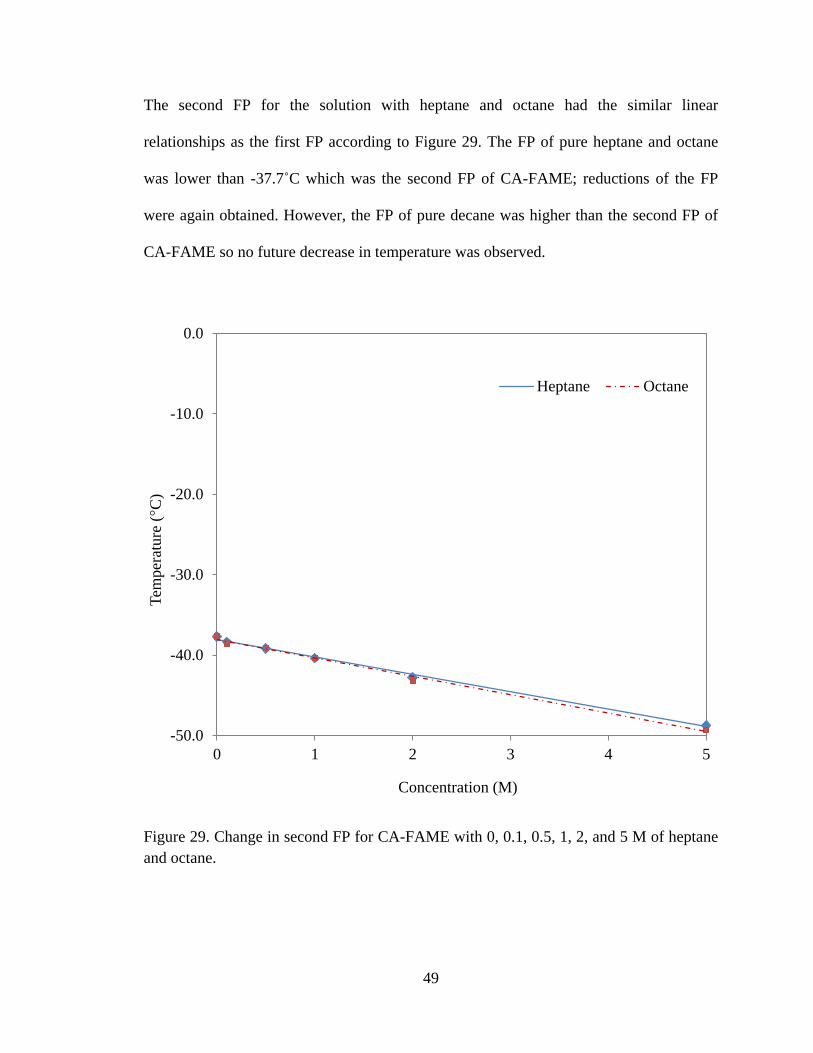
The second FP for the solution with heptane and octane had the similar linear
relationships as the first FP according to Figure 29. The FP of pure heptane and octane
was lower than -37.7˚C which was the second FP of CA-FAME; reductions of the FP
were again obtained. However, the FP of pure decane was higher than the second FP of
CA-FAME so no future decrease in temperature was observed.
Figure 29. Change in second FP for CA-FAME with 0, 0.1, 0.5, 1, 2, and 5 M of heptane
and octane.
-50.0
-40.0
-30.0
-20.0
-10.0
0.0
0 1 2 3 4 5
Tem
per
ature
(°C
)
Concentration (M)
Heptane Octane

50
No significant relations were seen in Figure 30 with the longer hydrocarbon solute above
dodecane. All solute was successfully decreased the FP first but as the concentration of
the solute increased, some decreased and some increased the FP. The FP of solutes did
not show a great impact on the FP of solution. Overall, all solutions seemed to move
toward the constant temperature around -40.0˚C as the solute concentration increased.
Figure 30. Change in second FP for CA-FAME with 0, 0.1, 0.5, 1, 2, 5, and 10 M of
decane, dodecane, tetradecane, hexadecane, and octadecane.
-50.0
-40.0
-30.0
-20.0
-10.0
0.0
0 2 4 6 8 10
Tem
per
ature
(°C
)
Concentration (M)
Tetradecane Hexadecane
Octadecane Dodecane
Decane

51
CONCLUSIONS
Conclusion and Recommendation for Future Work
The removal of volatile byproducts was successfully achieved by the calcium-
based desiccants but the calcium concentration requirement of biodiesel cannot be met
due to the solubility of calcium salt in biodiesel. This issue was solved by using the
combination of the calcium-based desiccants and the molecular sieves for the biodiesel
purification process. This combination of desiccants reduced the calcium concentration to
acceptable levels. In addition, the setting treatment method was more effective than the
glass column treatment method. Therefore, the setting method with the combination of
desiccants gave the best results of all. However, in order to determine whether the
combination of desiccants can replace the traditional wet wash purification, further study
will be necessary. Removability of other impurities such as free fatty acid and glycerol
will be a good topic to examine.
The chemical and physical properties of various types of biodiesel were studied.
Biodiesel was synthesized from canola oil, coconut oil, soybean oil, palm oil and lard
except castor oil. In this research, new methodology for the cloud point analysis by
Rayleigh light scattering was successfully developed. The 3 mm cuvette had an
advantage compared to 10 mm cuvette because not only it requires small sample volume
but also it gives possibility of shortened the analysis time and easier reading due to the
less effect by the condensation. This work indicated that additives helped cold weather
properties but the additive concentration for XC30 and XC40 used in this study created
viscosity issues. Therefore, the concentration of XC30 and XC40 additives needs to

52
adjust in order to meet biodiesel requirements for viscosity. Moreover, additives did not
change much in the chemical compositions and the freezing point of biodiesel. The
results of the freezing point depression of biodiesel indicated that solutes control the
freezing point even at 0.5 M therefore examining smaller concentrations may help to
understand the freezing point depression of biodiesel.
REFERENCES
1. Knothe, G. Historical perspective vegetable oil based-diesel fuels. Inform
2001,12, 1103-1107.
2. Demirbas, A. Biodiesel production from vegetable oils via catalytic and non-
catalytic supercritical methanol transesterification methods. Progress in Energy and
Combustion Science 2005,31, 466–487.
3. Singh, S. P.; Singh, D. Biodiesel production through the use of different sources
and characterization of oils and their esters as the substitute of diesel: A review.
Renewable and Sustainable Energy Reviews 2010,14, 200–216.
4. (a) Fangrui, M.; Milford, A. H. Biodiesel production: A review. Bioresource
Technology 1999,70, 1-15;(b) Encinar, J. M.; Gonzalez, J. F.; Rodriguez-Reinares, A.
Biodiesel from used frying oil. Variables affecting the yields and characteristics of the
biodiesel. Industrial & Engineering Chemistry Research 2005,44 (15), 5491-5499;(c)
Fukuda, H.; Kondo, A.; Noda, H. Biodiesel fuel production by transesterification of oils.
J. Biosci. Bioeng. 2001,92 (5), 405-416;(d) Bozbas, K. Biodiesel as an alternative motor
fuel: Production and policies in the European Union. Renewable and Sustainable Energy
Reviews 2008,12 (2), 542-552.
5. Demirbas, A. Comparison of transesterification methods for production of
biodiesel from vegetable oils and fats. Energy Conversion and Management 2008,49 (1),
125-130.
6. Canakci, M.; Gerpen, J. V. Biodiesel production from oils and fats with high free
fatty acid.American Society of Agricultural Engineers 2001,44 (6), 1429–1436.

7. Knothe, G. Dependence of biodiesel fuel properties on the structure of fatty acid
alkyl esters.Fuel Processing Technology 2005,86, 1059-1070.
8. Chongkhong, S.; Tongurai, C.; Chetpattananondh, P.; Bunyakan, C. Biodiesel
production by esterification of palm fatty acid distillate.Biomass and Bioenergy2007, 31
(8),563-568.
9. (a) Dadan Kusdiana, S. S. Effects of water on biodiesel fuel production by
supercritical methanol treatment. Bioresource Technology 2004,91, 289-295;(b) Ma,
F.;Clements, L. D.;Hanna, M. A. The effects of catalyst, free fatty acids, and water on
transesterification of beef tallow. American Society of Agricultural Engineers 1998,41
(5), 1261-1264.
10. Hsu, A. F.; Jones, K.; Marmer, W. N.; Foglia, T. A. Production of alkyl esters
from tallow and grease using lipase immobilized in a phyllosilicate sol-gel. Journal of the
American Oil Chemists' Society 2001,78 (6), 585-588.
11. Freedman, B.; Pryde, E. H.; Mounts, T. L. Variables affecting the yields of fatty
esters from transesterified vegetable oils. Journal of the American Oil Chemists' Society
1984,61 (10), 1638-1643.
12. M. Berrios, R. L. S. Comparison of purification methods for biodiesel.Chemical
Engineering journal 2008,144, 459-465.
13. Mazzieri, V. A.; Vera, C. R.; Yori, J. C. Adsorptive properties of silica gel for
biodiesel refining. Energy & Fuels 2008,22 (6), 4281-4284.
14. Sohling, U.; Ruf, F.; Schurz, K. Natural mixture of silica and smectite as a new
clayey material for industrial application. Clay Minerals 2009,44, 525-537.

15. Knothe, G. “Designer” Biodiesel: Optimizing fatty ester composition to improve
fuel properties. Energy & Fuels 2008,22 (2), 1358-1364.
16. Anand, K.; Ranjan,A.;Mehta, P. S. Estimating the viscosity of vegetable oil and
biodiesel fuels. Energy & Fuels 2010,24, 664-672.
17. Alptekin, E.;Canakci, M. Determination of the density and the viscosities of
biodiesel-diesel fuel blends. Renewable Energy 2008,33, 2623-2630.
18. Refaat, A. A. Correlation between the chemical structure of biodiesel and its
physical properties. Int. J. Environ. Sci. Tech. 2009,6 (4), 677-694.
19. Knothe, G.; Kevin, R. S. Kinematic viscosity of biodiesel components (fatty acid
alkyl esters) and related compounds at low temperature. Fuel 2007,86, 2560-2567.
20. Rodrigues, J.; Cardoso, F.; Lachter, E.; Estevão, L.; Lima, E.; Nascimento, R.
Correlating chemical structure and physical properties of vegetable oil esters. Journal of
the American Oil Chemists' Society 2006,83 (4), 353-357.
21. Chuang-Wei Chiu, L. S., GalenJ. Suppes, Impact of cold flow improvers on
soybean biodiesel blend.Biomass and Bioenergy 2004,27 (5), 485-491.
22. Lotero, E.; Liu, Y.; Lopez, D. E.; Suwannakarn, K.; Bruce, D. A.; Goodwin, J. G.
Synthesis of biodiesel via acid catalysis. Industrial & Engineering Chemistry Research
2005,44 (14), 5353-5363.
23. (a) HaiyingTang, S. S., K.Y. SimonNg, Fuel properties and precipitate formation
at low temperature in soy-, cottonseed-, and poultry fat-based biodiesel blends. Fuel
2008,87, 3006-3017;(b) Wexler, R.; Levine, F.; Sadvary, D. J.; Sadler, J.; Scala, J. L. The
effects of fatty acid molecular structure on the properties of bio-based fuels. In 27th army
science conference, Orlando, Florida, 2010.

24. Nascimento, R. S. V.; Soares, V. L. P.; Albinante, S.; Barreto, L. R. Effect of
ester-additives on the crystallization temperature of methyl hexadecanoate. Journal of
Thermal Analysis and Calorimetry 2005,79 (2), 249-254.
25. Cheah Han Sern, C. Y. M., Zuriati Zakaria, The effect of polymers and
surfactants on the pour point of palm oil methyl esters. Eur. J. Lipid Sci. Technol.
2007,109, 440-444.
26. Hamada, H.; Kato, H.; Ito, N.; Takase, Y.; Nanbu, H.; Mishima, S.; Sakaki, H.;
Sato, K. Effects of polyglycerol esters of fatty acids and ethylene-vinyl acetate co-
polymer on crystallization behavior of biodiesel. European Journal of Lipid Science and
Technology 2010,112 (12), 1323-1330.
27. Kazancev, K.; Makareviciene, V.; Paulauskas, V.; Janulis, P. Cold flow properties
of fuel mixtures containing biodiesel derived from animal fatty waste. European Journal
of Lipid Science and Technology 2006,108 (9), 753-758.
28. Nubia M. R.; Angelo, C. P. The role of additives for diesel and diesel blended
(ethanol or biodiesel) fuels; A review. Energy & Fuels 2007,21, 2433-2445.
29. Song, Y.; Ren, T.; Fu, X.; Xu, X. Study on the relationship between the structure
and activities of alkyl methacrylate-maleic anhydride polymers as cold flow improvers in
diesel fuels. Fuel Processing Technology 2005,86 (6), 641-650.
30. (a) Eliassi, A.; Parach, A. Cloud points of poly(propylene glycol) aqueous
mixtures at various concentrations. Journal of Chemical & Engineering Data 2010,55
(9), 4010-4012;(b) Mohsen-Nia, M.; Rasa, H.; Modarress, H. Cloud-point measurements
for (water + poly(ethylene glycol) + salt) ternary mixtures by refractometry method.
Journal of Chemical & Engineering Data 2006,51 (4), 1316-1320;(c) Alex, R. F.; Fuhr,

B. J.; Klein, L. L. Determination of cloud point for waxy crudes using a near-
infrared/fiber optic technique. Energy & Fuels 1991,5 (6), 866-868.
31. Standard test method for cloud point of petroleum prodcuts. In ASTM D2500-09,
ASTM International: West Conshohocken, PA, 2009.
32. Sajith, V.; Sobhan, C. B.; Peterson, G. P. Experimental investigations on the
effects of cerium oxide nanoparticle fuel additives on biodiesel. Advances in Mechanical
Engineering 2010, 1-6.
33. Rahman, M. S.; Guizani, N.; Al-Khaseibi, M.; Ali Al-Hinai, S.; Al-Maskri, S. S.;
Al-Hamhami, K. Analysis of cooling curve to determine the end point of freezing. Food
Hydrocolloids 2002,16 (6), 653-659.
34. Halpern, A. M.; McBane, G.Experimental physical chemistry: a laboratory
textbook 3rd ed.; W. H. Freeman and Company: New York, 2006.
35. (a) Hu, E.; Lai, Z.; Wang, K. Adsorption properties of the SAPO-5 molecular
sieve. Journal of Chemical & Engineering Data 2010,55 (9), 3286-3289;(b) Caro, J.;
Finger, G.; Kornatowski, J.; Richter-Mendau, J.; Werner, L.; Zibrowius, B. Aligned
molecular sieve crystals. Advanced Materials 1992,4 (4), 273-276.
36. Wang, M.; Yang, J.; Wu, X.; Huang, F. Study of the interaction of nucleic acids
with acridine red and CTMAB by a resonance light scattering technique and
determination of nucleic acids at nanogram levels. Analytica Chimica Acta 2000,422 (2),
151-158.
37. Rashid, U.; Anwar, F. Production of biodiesel through optimized alkaline-
catalyzed transesterification of rapeseed oil. Fuel 2008,87 (3), 265-273.

38. Predojevic, Z. J. The production of biodiesel from waste frying oils; A
comparison of different purification steps. Fuel 2008,87, 3522-3528.
39. Standard test method for determination of fuel filter blocking potential of
biodiesel (B100) blend stock by cold soak filtration test (CSFT). ASTM International:
West Conshohochen, PA, 2009; Vol. ASTM D7501-09b.
40. O'Brien, R. D.Fats and Oils: Formulating and Processing for Applications. 3 ed.;
CRC Press: New York, 2008.
41. Zlatica J, P. The production of biodiesel from waste frying oils: A comparison of
different purification steps. Fuel 2008,87 (17-18), 3522-3528.
42. Alexandre de Jesus, Ariane, V. Z. Determination of calcium and magnesium in
biodiesel by flame atomic absorption spectometry using microemulsions as sample
preparation. Energy & Fuels 2010,24, 2109-2112.
43. Moraes, M. S. A.; Krause, L. C.; da Cunha, M. E.; Faccini, C. S.; de Menezes, E.
W.; Veses, R. C.; Rodrigues, M. R. A.; Caramão, E. B. Tallow biodiesel: Properties
evaluation and consumption tests in a diesel engine. Energy & Fuels 2008,22 (3), 1949-
1954.
44. Standard test method for kinematic viscosity of transparent and opaque liquids
(and calculation of dynamic viscosity). ASTM International: West Conshohocken, PA,
2009; Vol. ASTM D445-09.
45. Skoog, D. A.; Holler, E. J.; Grouch, S. R.Principles of Instrumental Analysis. 6
ed.; Thomson Higher Education Belmont 2007.
46. Long, G. L.; Winefordner, J. D. Limit of detection. A closer look at the IUPAC
definition. Analytical Chemistry 1983,55 (7), 712A-724A.

47. Stephen, M. A.; J. L. C.; Stephanie, N. T.; Keith, B. R. Determination of the heat
of combustion of biodiesel using bomb calorimetry.Journal of Chemical Education
2006,83 (2).
48. Haas, M. J.; Adawi, N.; Berry, W. W.; Feldman, E.; Kasprzyk, S.; Ratigan, B.;
Scott, K.; Landsburg, E. B. Butter as a feedstock for biodiesel production. Journal of
Agricultural and Food Chemistry 2010,58 (13), 7680-7684.
49. Simoni M. Plentz M.; Mario R. M.;Carlos R. W.; Eid C. S.; G. E. S. L.;
Masurquede de A. C.; João Inácio S.; Sandra, H. V. C. Ethanolysis of castor and
cottonseed oil: A systematic study using classical catalysts.Journal of American Oil
Chemists' Society 2006,83, 819-822.
50. Haiying, T.; Rhet, C. D. G.; Steven, O. S.; Simon Ng, K. Y. Formation of
insolubles in palm oil-, yellow grease-, and soybean oil-based biodiesel blends after cold
soaking at 4 °C.Journal of American Oil Chemists' Society 2008,85, 1173-1182.
51. Michaels, A. M.; Nirmal, M.; Brus, L. E. Surface enhanced Raman spectroscopy
of individual rhodamine 6G molecules on large Ag nanocrystals. Journal of the American
Chemical Society 1999,121 (43), 9932-9939.
52. Guo, Z. X.; Shen, H. X. A highly sensitive assay for protein using resonance
light-scattering technique with dibromohydroxyphenylfluorone-molybdenum(VI)
complex. Spectrochim. Acta, Part A 1999,55A (14), 2919-2925.
53. Zhu, J.; Wang, Y.; Huang, L.; Lu, Y. Resonance light scattering characters of
core-shell structure of Au-Ag nanoparticles. Physics Letters A 2004,323 (5-6), 455-459.

54. Kim, J. Y.; Hwang, M. S.; Kim, Y.-H.; Kim, H. J.; Lee, Y. Origin of low
dielectric constant of carbon-incorporated silicon oxide film deposited by plasma
enhanced chemical vapor deposition. Journal of Applied Physics 2001,90 (5), 2469-2473.
55. Chuck, C. J.; Bannister, C. D.; Hawley, J. G.; Davidson, M. G.; La Bruna, I.;
Paine, A. Predictive model to assess the molecular structure of biodiesel fuel. Energy &
Fuels 2009,23 (4), 2290-2294.
56. Spangler, J.; Davies, E. Freezing points, densities, and refractive indexes of
system glycerol-ethylene glycol-water. Industrial & Engineering Chemistry Analytical
Edition 1943,15 (2), 96-99.
57. Brewer, J.; Kurata, F. Freezing points of binary mixtures of methane. AIChE
Journal 1958,4 (3), 317-318.

I, Satomi Harada, hereby submit this thesis to Emporia State University as partial
fulfillment of the requirements for an advanced degree. I agree that the Library of the
University may make it available to use in accordance with its regulations governing
materials of this type. I further agree that quoting, photocopying, digitizing or other
reproduction of this document is allowed for private study, scholarship (including
teaching) and research purposes of a nonprofit nature. No copying which involves
potential financial gain will be allowed without written permission of the author.
Satomi Harada
Data
Chemical and Physical Properties of Biodiesel
Title
Signature of Graduate School Staff
Data Received
