sas1804-2015: take your data ... - sas technical...
TRANSCRIPT

1
Paper SAS1804-2015
Take Your Data Analysis and Reporting to the Next Level by Combining SAS® Office Analytics, SAS® Visual Analytics, and SAS® Studio
David Bailey, Tim Beese, Casey Smith, SAS Institute Inc., Cary, NC
ABSTRACT
SAS® Office Analytics, SAS® Visual Analytics, and SAS® Studio provide excellent data analysis and report generation. When these products are combined, their deep interoperability allows you to take your analysis and reporting to the next level. Build interactive reports in SAS Visual Analytics Designer, and then view, customize, and comment on these reports in Microsoft Office and SAS® Enterprise Guide®. Create stored processes in SAS Enterprise Guide, and then run them in SAS Visual Analytics Designer, mobile tablets, or SAS Studio. Run your SAS Studio tasks in SAS Enterprise Guide and Microsoft Office using data provided by those applications. These interoperability examples and more will allow you to combine and maximize the strength of each SAS application.
INTRODUCTION
You need tools to analyze data, generate reports, share information, and collaborate before making decisions and taking action. Combining SAS Office Analytics, SAS Visual Analytics, and SAS Studio provides two advantages. First, these tools leverage different environments, including the desktop, Microsoft Office, tablets, or the web. As a result, you can select the environment that works for you. Figure 1 shows the SAS applications and their environments.
Figure 1: SAS Office Analytics, SAS Visual Analytics and SAS Studio Provide Convenient Access from Different Environments
Second, this integration provides you with multiple tools, each with distinct advantages in their environment. The most common operations that can be accomplished include:
Data access and manipulation – SAS Visual Analytics, SAS Office Analytics (which includes the SAS Add-In for Microsoft Office and SAS Enterprise Guide)

2
Editing and running SAS programs – SAS Office Analytics (SAS Enterprise Guide), SAS Studio
Creating and customizing reports – SAS Visual Analytics, SAS Office Analytics (SAS Add-In for Microsoft Office and SAS Enterprise Guide)
Sharing information and collaborating – SAS Visual Analytics, SAS Office Analytics (SAS Add-In for Microsoft Office and SAS Enterprise Guide), SAS Studio
This paper provides examples of this integration, so you can work in your environment with the best tools for that environment. The following four interoperability scenarios are discussed:
SAS Visual Analytics to SAS Office Analytics
SAS Office Analytics to SAS Visual Analytics
SAS Studio to SAS Office Analytics
SAS Office Analytics to SAS Studio
PRODUCT OVERVIEW
SAS OFFICE ANALYTICS
SAS Office Analytics is a stand-alone offering that enables businesses of all sizes to access the power of SAS through the SAS Add-In for Microsoft Office, Microsoft SharePoint integration, guided analysis, and SAS programming. SAS Office Analytics provides add-ins to Excel, Word, and PowerPoint that enable you to combine native Excel, Word, and PowerPoint functionality with SAS reports and data. SAS Office Analytics also provides integration with Microsoft Outlook and SharePoint for collaboration. Finally, SAS Office Analytics also includes the popular rich desktop SAS programming and analysis application, SAS Enterprise Guide.
For more information about SAS Office Analytics, see www.sas.com/technologies/bi/office-analytics.html.
SAS VISUAL ANALYTICS
SAS Visual Analytics provides a complete platform for analytics visualization and interactive reporting capabilities. SAS Visual Analytics easily explores and analyzes huge volumes of data with SAS Visual Analytics Designer and SAS Visual Analytics Explorer. You can quickly create interactive reports that are easy to consume in web and native mobile tablet applications.
For more information about SAS Visual Analytics, see www.sas.com/software/visual-analytics.
SAS STUDIO
SAS Studio is a SAS development environment that runs in a web browser, so developers can program and interact with SAS wherever and whenever they want. Because no installation is required, SAS Studio is available for immediate use. SAS Studio delivers a consistent experience from any computing device with productivity features that are always available integrated into the framework. SAS Studio is not a stand-alone product, but an interface that comes with every SAS product and solution (wherever Base SAS is included).
For more information about SAS Studio, see http://www.sas.com/en_us/software/foundation/studio.html .

3
SAS VISUAL ANALYTICS TO SAS OFFICE ANALYTICS
Integrating SAS Visual Analytics with SAS Office Analytics brings SAS Visual Analytics reports to Microsoft Office and SAS Enterprise Guide. Microsoft Office is the leading productivity suite with over one billion users according to Microsoft. SAS Enterprise Guide is the desktop application for SAS analytics. This section contains five examples of the SAS Office Analytics functionality that you can use with SAS Visual Analytics content:
View and customize your SAS Visual Analytics reports in Microsoft Office
View your SAS Visual Analytics reports in SAS Enterprise Guide
Create Excel content based on your SAS Visual Analytics reports
Run SAS tasks in Excel and SAS Enterprise Guide on your SAS Visual Analytics report data
Interact and comment on your SAS Visual Analytics reports from Microsoft Outlook and Microsoft SharePoint
VIEW AND CUSTOMIZE YOUR SAS VISUAL ANALYTICS REPORTS IN MICROSOFT OFFICE
The SAS Add-In for Microsoft Office runs in Microsoft Excel, PowerPoint, Word, and Outlook. It allows you to fully integrate the content from your SAS Visual Analytics report into these Microsoft Office applications. You can customize the layout, sizing, and formatting of the report content. You can apply table and text styles as well as Excel table highlighting. All SAS Visual Analytics interactions (brushing, filtering, expanding, collapsing, and drilling) are available, and all SAS Visual Analytics content can be refreshed.
Figure 2 shows an Excel spreadsheet containing two SAS Visual Analytics reports – the pie chart on the left and the table on the right. The SAS Visual Analytics reports were added using the SAS Add-In for Microsoft Office, which you can access from the SAS ribbon in Excel. In Figure 2, the Report Control pane on the right supports interactions and comments. This report can be refreshed using Refresh option in the SAS ribbon.
Figure 2: Multiple SAS Visual Analytics Reports in an Excel Worksheet

4
VIEW YOUR SAS VISUAL ANALYTICS REPORTS IN SAS ENTERPRISE GUIDE
SAS Enterprise Guide is a popular desktop application for SAS analysis. Now, SAS Enterprise Guide also provides a convenient location for consuming SAS Visual Analytics results. This integration enables you to open and refresh reports that were created using SAS Visual Analytics Designer and SAS Visual Analytics Explorer. When you open the report in SAS Enterprise Guide, you have full interaction support. Examples of interactions include prompts, element filtering, brushing, and expanding, drilling, and collapsing for crosstabs. You can also extract the data from a report element to perform further analytics. Figure 3 shows a SAS Visual Analytics report opened in SAS Enterprise Guide. (To open a SAS Visual Analytics report, select File Open Report.) The toolbar above the report provides quick access to refresh the report, extract the data from a report element into the SAS Enterprise Guide data grid, view the report in SAS Visual Analytics Viewer, send the report to Excel, PowerPoint, or Word, and display properties for the report.
Figure 3: Viewing a SAS Visual Analytics Report in SAS Enterprise Guide
CREATE EXCEL CONTENT BASED ON YOUR SAS VISUAL ANALYTICS REPORTS
After inserting your SAS Visual Analytics report into Microsoft Excel, you can use specific Excel features to complement your SAS Visual Analytics report and create additional analysis.
Figure 4 shows a SAS Visual Analytics table that was opened using the SAS Add-In for Microsoft Office. The table uses these Excel features:
Excel data bars on the Weight column
Excel conditional highlighting in the Height column

5
Excel formulas to calculate the average height
Excel charts for plotting the average heights
Figure 4: Excel Highlighting, Data Bars, Formulas, and Charts Created from a SAS Visual Analytics Table
When the SAS Visual Analytics table is refreshed (by clicking Refresh on the SAS ribbon), all of the additional Excel content (table highlighting, formulas, and charts) is updated. By using the native Excel capabilities on a SAS Visual Analytics report, you can customize your SAS Visual Analytics results and represent information in a way that best meets your needs.
RUN SAS TASKS IN EXCEL AND SAS ENTERPRISE GUIDE ON YOUR SAS VISUAL ANALYTICS REPORT DATA
The SAS Add-In for Microsoft Office and SAS Enterprise Guide both include a large number of tasks that can use your SAS Visual Analytics graph and table data as an input data source. Use one of the following options to extract the data from a SAS Visual Analytics table or graph:
When displaying SAS Visual Analytics tables in Excel, you have two options to use the SAS Visual Analytics data as input for your SAS tasks:
o You can select Tasks Data Copy to SAS Server to copy the data from the SAS Visual Analytics table to your SAS server, and then you can use it like any other SAS data set.
o After selecting the SAS task, you can select Excel Data when the Choose Data dialog is displayed. This allows you to specify the Excel cells which contain the SAS Visual Analytics table.
When displaying SAS Visual Analytics graphs in Excel, select Selected Element Extract Graph Data on the SAS ribbon.
When displaying SAS Visual Analytics graphs in SAS Enterprise Guide, select Extract Data on the ribbon above the report.
Figure 5 shows how to create a data set from a SAS Visual Analytics table using the SAS Add-In for Microsoft Office in Excel. (You select Tasks Data Copy to SAS Server.) Figure 5 also shows the Extract Data option in SAS Enterprise Guide ribbon.

6
Figure 5: "Copy to SAS Server" Functionality in the SAS Add-In for Microsoft Office (left) and “Extract Data” in SAS Enterprise Guide (right) Allow for Further Analysis on SAS Visual Analytics Report Data
After using one of these methods to select your SAS Visual Analytics report data as the input data for the task, you can select one of the many SAS Enterprise Guide and SAS Add-In for Microsoft Office tasks. Figure 6 shows the Distribution Analysis task in the SAS Add-In for Microsoft Office. This task is using data from a SAS Visual Analytics table.
Figure 6: Using Data from a SAS Visual Analytics Table (left) as Input to the Distribution Analysis Task (right)

7
INTERACT AND COMMENT ON YOUR SAS VISUAL ANALYTICS REPORTS IN MICROSOFT OUTLOOK AND SHAREPOINT
Many businesses use Microsoft Outlook and SharePoint for content sharing and collaboration. SAS Office Analytics integrates with both of these popular applications. This integration makes it easy for you to share your SAS Visual Analytics content and collaborate with others who might be adding other content.
SAS Office Analytics includes an add-in for Outlook that enables individuals to easily consume business intelligence and analytics, without distracting from the main email task and without filling up Microsoft Exchange Server quotas. SAS Office Analytics enables you to open and interact with SAS Visual Analytics reports in Microsoft Outlook. SAS Central (similar to the SAS Visual Analytics Hub) is your starting point and provides a quick thumbnail view of your recent and favorite reports. The Gadget Pane makes it very convenient to keep track of selected reports without distracting from important emails, tasks, or appointments. By adding your key performance indicators and reports to the Gadget Pane, you turn your Outlook application into a business intelligence application.
SAS Office Analytics includes two SharePoint Web Parts for SAS Visual Analytics integration. These Web Parts provide the same user experience as in Outlook. First, a SAS Central web part shows your recent and favorite reports in SharePoint. Second, a SAS Content Viewer web part enables you to add SAS content (stored processes, dashboards, SAS® Web Report Studio reports, and SAS Visual Analytics reports) to your SharePoint site. Many users have departmental SharePoint sites with a lot of other information. Like the Gadget Pane in the Outlook, this SAS web part provides unobtrusive access to SAS Visual Analytics results in a location where most of your users are already looking for business information or sharing documents. If colleagues need to access documents that contain SAS Visual Analytics results, they can retrieve the documents from the SharePoint site and refresh or manage the SAS content using the SAS add-in in Excel, Word, or PowerPoint (as previously described). Figure 7 shows the SAS Web Parts for Microsoft SharePoint displaying a SAS Visual Analytics report. All SAS Visual Analytics interactions (prompts, graphs, table filtering and brushing, and so on.) are supported.
Figure 7: SAS Web Parts for Microsoft SharePoint Displaying a SAS Visual Analytics Report
In addition to viewing reports, SAS Office Analytics provides more collaboration functionality in Outlook and SharePoint by enabling you to view, add, and edit comments that are saved with the report. Comments are available from various clients including mobile tablet apps in iOS and Android. For each report, comments are centralized, so all of the comments are accessible to different types of users.

8
SAS OFFICE ANALYTICS TO SAS VISUAL ANALYTICS
If you are currently a SAS Office Analytics user, integrating with SAS Visual Analytics enables you to increase the visibility of your analysis and use your data or data results as input in SAS Visual Analytics. Content created in SAS Office Analytics can easily be shared and further analyzed on the web. This section contains three examples of the SAS Visual Analytics functionality that you can use with SAS Office Analytics content:
Integrate your stored processes from SAS Enterprise Guide into SAS Visual Analytics reports.
Upload your Microsoft Excel data to use as your data source in SAS Visual Analytics reports.
Upload your SAS Enterprise Guide data or data results to use in SAS Visual Analytics reports.
.
INTEGRATE YOUR SAS ENTERPRISE GUIDE STORED PROCESSES INTO SAS VISUAL ANALYTICS REPORTS
Adding stored processes to your SAS Visual Analytics reports enables you to include results generated by SAS code directly in your reports. SAS Enterprise Guide provides a simple point-and-click interface to create the stored process from your SAS code. Then you use SAS Visual Analytics Designer to insert these stored processes into your SAS Visual Analytics reports.
In Figure 8, SAS Visual Analytics Designer is displaying a stored process created in SAS Enterprise Guide. SAS Visual Analytics Designer expands the visibility of your stored process to the web, iPad, and Android tablets.

9
Figure 8: Adding a Stored Process from SAS Enterprise Guide in a SAS Visual Analytics Report
UPLOAD YOUR EXCEL DATA TO USE AS YOUR DATA SOURCE IN SAS VISUAL ANALYTICS REPORTS
Microsoft Excel provides a natural interface for many users to create and edit their data. The Upload to LASR task in the SAS Add-In for Microsoft Office enables you to upload your data from Excel to the SAS LASR Analytic Server. After uploading the data, you can access the data in SAS Visual Analytics to create graphs and tables in SAS Visual Analytics reports.
When you are ready to upload your data, select Tasks Data Upload to LASR in the SAS Add-In for Microsoft Office. When the Upload to LASR task opens, choose the data to upload. You can select Excel data, SAS data in Excel, or external SAS data.
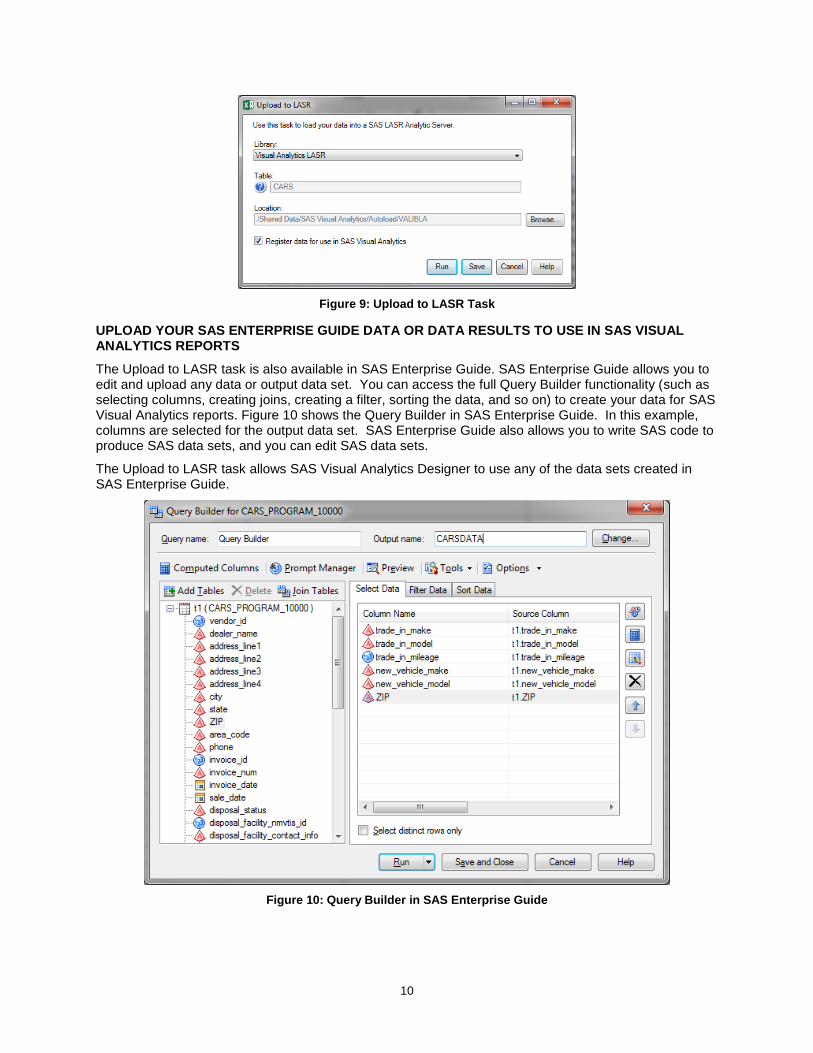
After selecting your data, you specify the library, table, and location on the SAS LASR Analytic Server. (See Figure 9.) After you run the Upload to LASR task, your data is available for use in SAS Visual Analytics.
10
Figure 9: Upload to LASR Task
UPLOAD YOUR SAS ENTERPRISE GUIDE DATA OR DATA RESULTS TO USE IN SAS VISUAL ANALYTICS REPORTS
The Upload to LASR task is also available in SAS Enterprise Guide. SAS Enterprise Guide allows you to edit and upload any data or output data set. You can access the full Query Builder functionality (such as selecting columns, creating joins, creating a filter, sorting the data, and so on) to create your data for SAS Visual Analytics reports. Figure 10 shows the Query Builder in SAS Enterprise Guide. In this example, columns are selected for the output data set. SAS Enterprise Guide also allows you to write SAS code to produce SAS data sets, and you can edit SAS data sets.
The Upload to LASR task allows SAS Visual Analytics Designer to use any of the data sets created in SAS Enterprise Guide.
Figure 10: Query Builder in SAS Enterprise Guide

11
SAS STUDIO TO SAS OFFICE ANALYTICS
Adding SAS Office Analytics enables you to use SAS Enterprise Guide and the SAS Add-In for Microsoft Office with your SAS Studio content. SAS Enterprise Guide gives you more options for your SAS Studio code, tasks, and data sets. The SAS Add-In for Microsoft Office enables you to use the functionality of Microsoft Office on your SAS Studio content. This section contains four examples of this SAS Office Analytics functionality:
Modify your SAS Studio code in SAS Enterprise Guide.
Run SAS Studio tasks in SAS Enterprise Guide and Microsoft Office.
Create SAS Stored Processes in SAS Enterprise Guide from SAS Studio code.
Edit your SAS data sets in Excel or SAS Enterprise Guide.
MODIFY YOUR SAS STUDIO CODE IN SAS ENTERPRISE GUIDE
SAS Enterprise Guide has the following functionality to enhance programs that you created in SAS Studio:
Analyze program – Identify the component parts of a program, view program as a process flow, and suggest substitutions for code that might affect internationalization.
Source control – Commit changes, show history, identify, and revert changes.
Editor options – Customize appearance, autocomplete, indenting, and many general options.
Figure 11 shows a program that was created in SAS Studio being edited in SAS Enterprise Guide. The analyze program and source control functionality is accessible from the tool bar above the code. To access the editor options, select Tools Options. Then in the Options dialog box, select SAS Programs.
Figure 11: Program Editor in SAS Enterprise Guide
RUN SAS STUDIO TASKS IN SAS ENTERPRISE GUIDE AND MICROSOFT OFFICE
The task browser in SAS Enterprise Guide and the SAS Add-In for Microsoft Office enables you to access SAS Studio tasks. You can quickly find tasks by selecting categories, creating filters, and searching. Figure 12 shows the task browser interface. A filter is selected, so only the available SAS Studio tasks are listed.

12
Figure 12: Selecting SAS Studio Tasks from SAS Enterprise Guide and the SAS Add-In for Microsoft Office
The SAS Studio tasks work like the other SAS Enterprise Guide and SAS Add-In for Microsoft Office tasks. You select your data source, enter the required values, and then specify the results location in your Microsoft Office document or the result type in SAS Enterprise Guide. You can also refresh the results or use these results for further analysis.
CREATE STORED PROCESSES IN SAS ENTERPRISE GUIDE FROM SAS STUDIO CODE
SAS Stored Processes are SAS programs that are centrally stored on a server for easier maintenance, management, and security. Because they can be easily accessed from many clients, they are used to share your code and results. You can use code written in SAS Studio in your SAS Stored Processes. After loading your SAS Studio code in SAS Enterprise Guide, you can create a stored process from either the process flow or the program tree. Figure 13 shows the Create Stored Process option in the pop-up menu in the process flow. Figure 13 also shows the Create New Stored Process wizard. When creating the stored process, you can specify a name, description, keywords, responsibilities, and location.

13
Figure 13: Creating a Stored Process in SAS Enterprise Guide
EDIT YOUR SAS DATA SETS IN MICROSOFT EXCEL OR IN SAS ENTERPRISE GUIDE
You can easily open your SAS Studio data sets in Microsoft Excel or SAS Enterprise Guide to edit, add, or delete values. Figure 14 shows a SAS data set opened in Excel. In the SAS ribbon, you can access options to commit your changes, edit column properties, create new records, and delete records. In SAS Enterprise Guide, select Protect Data to edit data set values.

14
Figure 14: Editing a SAS Data Set in Excel by using the SAS Add-In for Microsoft Office
SAS OFFICE ANALYTICS TO SAS STUDIO
Because SAS Studio runs in a web browser, SAS Studio can access your SAS Office Analytics content from anywhere. You can view and perform further analysis on your SAS code that you created in SAS Enterprise Guide. Any Excel or SAS Enterprise Guide data can be used in SAS Studio. This section contains three examples of SAS Studio functionality that you can use with your SAS Office Analytics content:
Modify and run your SAS Enterprise Guide code in SAS Studio.
Use your Excel data in SAS Studio code or tasks.
Use your SAS Enterprise Guide data or data results in SAS Studio.
MODIFY AND RUN YOUR SAS ENTERPRISE GUIDE CODE IN SAS STUDIO
SAS Studio allows you to access SAS code created in SAS Enterprise Guide from anywhere. After opening the SAS code in SAS Studio, you can edit and run your code. You can save your changes, and these changes will be available when you return to SAS Enterprise Guide. Figure 15 shows the same SAS program in SAS Enterprise Guide and SAS Studio.

15
Figure 15: Editing the Same SAS Program in SAS Enterprise Guide (left) and SAS Studio (right)
USE YOUR EXCEL DATA IN SAS STUDIO CODE OR TASKS
The SAS Add-In for Microsoft Office enables you to easily create SAS data sets from existing SAS data or Excel data. For existing SAS data, the SAS Add-In for Microsoft Office provides variable selection, filter options, and sort options before opening SAS data sets in Excel. When data sets are opened in Excel, you can select Begin Edit to edit the values, create new records, and delete records. Figure 16 shows how to select the variables to include in the data set (by using in the Modify Data Source dialog box) and the editing options that are available in the SAS ribbon. After you have completed editing your data in Excel, select Tasks Data Copy to SAS Server to create a SAS data set from Excel data. Now, you can use these data sets in SAS Studio code or tasks.
Figure 16: Variable Selection (left) and Editing Options (right) for SAS Data Sets in the SAS Add-In for Microsoft Office

16
USE YOUR SAS ENTERPRISE GUIDE DATA OR DATA RESULTS IN SAS STUDIO
SAS Enterprise Guide excels at data preparation and manipulation. You can take your data or data results from SAS Enterprise Guide and use SAS Studio for further analysis or reporting. Here are four examples how SAS Enterprise Guide can create your data for SAS Studio:
Output data sets – You can use any output data set created by SAS Enterprise Guide. Figure 17 shows the Distribution Analysis task with the option to save the output statistics to a data set.
Query Builder – You can use the Query Builder functionality (computed columns, joins, filter, sort, and so on) to create the data set to use in SAS Studio.
Import data – You can import data into SAS Enterprise Guide, and then select Task Data Upload Data Files to Server to copy your data set for SAS Studio.
Edit Data – You can edit your open data sets in SAS Enterprise Guide by selecting View Protect Data.
Figure 17: The Distribution Analysis Task with the Option Selected to Save the Output Statistics to a Data Set
ALL APPLICATIONS WORKING TOGETHER
As you would expect, you can combine all of the products to provide additional functionality. Here are two examples that use all three products.
DISPLAYING SAS STUDIO RESULTS ON MOBILE DEVICES
You can display your SAS Studio results on mobile devices:
1. Use SAS Studio to write your SAS code.
2. Use SAS Enterprise Guide (which is part of SAS Office Analytics) to generate a stored process from your SAS code.
3. Use SAS Visual Analytics Designer to customize a SAS Visual Analytics report that contains your stored process.

17
4. Open the SAS Visual Analytics report that contains a stored process on a tablet in a native SAS Visual Analytics application.
USING DATA FROM SAS VISUAL ANALYTICS RESULTS AS INPUT TO SAS STUDIO TASKS
You can use data from SAS Visual Analytics results as input to SAS Studio tasks:
1. Use SAS Visual Analytics Designer to produce a report.
2. Use the SAS Add-In for Microsoft Office (which is part of SAS Office Analytics) to open the report and create SAS data sets from the report elements.
3. Use SAS Studio to run tasks using these data sets as input.
PRODUCT VERSION INFORMATION
All examples in this paper used the following products:
SAS Add-In for Microsoft Office 7.11
SAS Enterprise Guide 7.11
SAS Web Parts 6.13
SAS Studio 3.3
SAS Visual Analytics Designer 7.1
Microsoft Office 2013, Microsoft SharePoint 2013
INTEROPERABILITY VERSION TABLE
Table 1 shows the interoperability of all versions for the products discussed in this paper.
Version of Office Analytics – Add-In for Microsoft Office (AMO), Enterprise Guide (EG), Web Parts for SharePoint
Supported Versions of Visual Analytics
Supported Versions of SAS Studio
Additional requirements
AMO 6.1
Web Parts 6.1
VA 6.1 None
AMO 6.1M1
EG 6.1M1
Web Parts 6.11
VA 6.2, 6.3, 6.41 None 1AMO/EG hot fix 1 or later required for VA 6.4 support
AMO 7.1
EG 7.1
Web Parts 6.12
VA 6.2, 6.3, 6.4, 7.1 SAS Studio 3.2, 3.32 2SAS Studio integration limited to AMO and EG
AMO 7.11
EG 7.11
Web Parts 6.13
VA 6.2, 6.3, 6.4, 7.1, 7.2
SAS Studio 3.2, 3.3, 3.43
3SAS Studio integration limited to AMO and EG
Table 1: Interoperability for SAS Office Analytics, SAS Visual Analytics, and SAS Studio
18
CONCLUSION
The interoperability of SAS Office Analytics, SAS Visual Analytics, and SAS Studio enables you to further your data analysis and reporting. You can work in your environment, from the desktop and Microsoft Office to the web and tablets. You have multiple tools, each with distinct advantages to perform your data analysis and manipulation, editing and running SAS programs, creating and customizing reports, and sharing information and collaborating.
RECOMMENDED READING
Allemang, Mark. 2014. “I Didn’t Know SAS® Enterprise Guide® Could Do That!” Proceedings of the SAS Global Forum 2014 Conference. Cary, NC: SAS Institute, Inc. Available at http://support.sas.com/resources/papers/proceedings14/.
Bailey, David, Anand Chitale, and I-kong Fu. 2014. “Share Your SAS® Visual Analytics Report with SAS Office Analytics”. Proceedings of the SAS Global Forum 2014 Conference. Cary, NC: SAS Institute, Inc. Available at http://support.sas.com/resources/papers/proceedings14/.
Beese, Tim. 2011. “Tips and Techniques for Automating the SAS® Add-In for Microsoft Office with Visual Basic for Applications.” Proceedings of the SAS Global Forum 2011 Conference. Cary, NC: SAS Institute, Inc. Available at http://support.sas.com/resources/papers/proceedings11/012-2011.pdf.
Chitale, Anand and Mike Barnhart. 2012. “A New Outlook into Your Business.” Proceedings of the SAS Global Forum 2012 Conference. Cary, NC: SAS Institute, Inc. Available at http://support.sas.com/resources/papers/proceedings12/024-2012.pdf.
Mullis, Randy. 2014. “Better Together: Best Practices for Deploying the SAS® Web Parts for Microsoft SharePoint.” Proceedings of the SAS Global Forum 2014 Conference. Cary, NC: SAS Institute, Inc. Available at http://support.sas.com/resources/papers/proceedings14/.
CONTACT INFORMATION
Your comments and questions are valued and encouraged. Contact the authors:
David Bailey 100 SAS Campus Dr. Cary, NC 27513 SAS Institute Inc. [email protected] http://www.sas.com Tim Beese 100 SAS Campus Dr. Cary, NC 27513 SAS Institute Inc. [email protected] http://www.sas.com Casey Smith 100 SAS Campus Dr. Cary, NC 27513 SAS Institute Inc. [email protected] http://www.sas.com
SAS and all other SAS Institute Inc. product or service names are registered trademarks or trademarks of SAS Institute Inc. in the USA and other countries. ® indicates USA registration.
Other brand and product names are trademarks of their respective companies.