sas group annual report with sustainability overview ... · policy framework for ... agreement for...
TRANSCRIPT
SAS Group Annual Report with sustainability overview, November 2012–October 2013
Towards excellence

ContentsThe year in figures 1 President’s comments 2
Operating environment and strategy 4Business model 6The restructuring program 8Fleet strategy 10
Customers and customer offering 12
Sustainability 18Airline industry 22 Policy framework for civil aviation 24Quality and safety 25The airline’s operations 26Divested operations 28Financial position 29Risks and risk management 32The share and shareholder service 35
Formal financial accounts Contents 37Report by the Board of Directors 38Notes 50 Corporate Governance Report 82Board of Directors 88Group Management 90
SAS in figures 94
SAS summary of events for 2012/2013November 2012– January 2013As expected, due to seasonality, the first quarter was weak and SAS posted negative earnings. At the start of the quarter, the restructur-ing program was initiated to bolster financial preparedness and enable positive earnings already in 2012/2013:
– New collective agreements that reduced costs and enabled increased productivity
– New pension plans that laid the foundation for a reduction in pension commitments of about SEK 19 billion
– The goal to divest assets with a liquidity effect of about SEK 3 billion
The new agreements facilitated the provision of a credit facility of SEK 3.5 billion at the Group’s disposal until March 2015.
February–April 2013Due to seasonality, the second quarter is the next weakest quarter of the Group’s fiscal year. Income before tax and non-recurring items increased by MSEK 686 to MSEK 57:
– Unit cost declined 10.7%, positively impacted by the effects of changed terms for early retirement pensions
– Sale of spare engines for MSEK 700
– Agreement signed concerning the outsourcing of call centers to a third party
May–July 2013 In terms of earnings, the third quarter was the strongest quar-ter for SAS with income before tax and nonrecurring items of MSEK 973. During the summer, the new agreements enabled SAS to increase capacity by 7.9%, essentially using existing resources.
– SAS signed an agreement for the sale of 80% of its holding in the Widerøe airline and aircraft
– SAS simplified travel with the launch of the SAS Go and SAS Plus service concepts
– The EuroBonus ban was lifted by the Norwegian authorities for Norwegian domestic flights
– SAS signed an outsourcing agreement for IT, with Tata Consultancy Services (TCS)
– SAS initiated a plan for the renewal of the long-haul aircraft fleet with an order for four Airbus A330 Enhanced aircraft, eight Airbus A350s and an upgrade of the passenger cabins in the Airbus A330/A340s
August–October 2013The seasonally favorable fourth quarter was characterized by re-duced growth and substantially increased competition. Despite this, SAS reported positive income before tax and nonrecurring items of MSEK 546.
– The sale of 10% of SAS Ground Handling
– Issue of a SEK 1.5 billion unsecured bond
– SAS completed the sale of Widerøe (80%)
Events after the end of the fiscal yearIn November, the SAS Group’s balance sheet and statement of income will be affected, as fol-lows, by the implementation of new pension terms, the reversal of deferred tax liabilities related to pensions, the accounting for special payroll tax as part of the surplus in the Alecta and Euro-ben plans, and the implementa-tion of the revised IAS 19. The above will negatively impact the Group’s shareholders’ equity in an amount of about SEK 7 billion:
– Pension commitments will be reduced by about SEK 12.9 billion
– Plan assets will be reduced by about SEK 10.7 billion
– Actuarial gains and losses will be impaired by about SEK 10.3 billion
– Deferred tax liabilities will be reduced by about SEK 1.2 billion
– Improvement in the statement of income (payroll expenses) of about SEK 1 billion
The Board has proposed the following measures to the 2014 Annual General Shareholders’ Meeting to meet the SAS Group’s funding needs:– Amendment of the Articles of
Association to allow the issue of preference shares
– Authorization to issue a maximum of 7 million preference shares
– Authorization to issue convertible bonds in a maximum amount of SEK 2 billion
A complete description of the Board’s proposals is available in the notice of the Annual General Shareholders’ Meeting:www.sasgroup.net under Investor Relations
A full version of the Sustain-ability Report for November 2012 to October 2013 and an online version of the financial accounts are available at: www.sasgroup.net
While every care has been taken in the translation of this annual report, readers are reminded that the original annual report, signed by the Board of Directors, is in Swedish.

The 2012/2013 fiscal year was marked by the radical restructuring work to strengthen the SAS Group’s financial preparedness and market position. Vigorous measures resulted in increased financial stability and a more competitive cost structure which, in turn, enabled more aggressive initiatives and investments in the Group’s customer offering. Due to a significant improvement in productivity, SAS was also able to increase capacity. Despite the highly competitive market situation, not least at the end of the year, SAS delivered positive earnings, a decreased net debt.
Key figures for SAS2012–2013
Nov–Oct2011–2012
Nov–Oct
Revenue, MSEK 42,182 42,419EBIT margin 3.3 –1.6Income before tax and nonrecurring items, MSEK 775 21Income before tax, EBT, MSEK 433 –3,255EBT margin before tax and nonrecurring items, % 1.8 0.0Net income for the period, MSEK 179 –3,010Cash flow from operating activities, MSEK 1,028 1,717Investments, MSEK 1,877 1,814Earnings per share, SEK 0.54 –9.15Share price at end of fiscal year, SEK 19.5 6.45Dividend, common shares (proposal for 2012/2013), SEK 0 0
Key financial figures for SAS2013
Oct 312012
Oct 31
CFROI, 12-month rolling, % 19 9Financial preparedness, % of fixed costs 26 29Equity/assets ratio, % 31 30Adjusted equity/assets ratio, % 23 24Financial net debt, MSEK 4 567 6 549Debt/equity ratio 0.41 0.59Adjusted debt/equity ratio 1.49 1.54Interest-coverage ratio 1.4 –1.6
Other key figures for SAS2012–2013
Nov–Oct2011–2012
Nov–Oct
Number of passengers, millions 28.1 28.2Revenue passenger km, RPK, million 29,650 28,621Available seat km, ASK, million 40,583 38,406Average number of employees 14,127 14,9031
of whom women, % 39 382
Sick leave, %3 8.0 7.12
Carbon dioxide (CO2), 000 tonnes 3,8154 3,919Nitrogen oxides (NOX), 000 tonnes 16.24 15.9Climate index 964 98
1) Applies to the November 2011–October 2012 period 2) Applies for January to October 2012 3) Applies only to Scandinavian Airlines (excl. Blue1) 4) Excluding Widerøe
Vigorous measures place SAS on the right course
Financial targetsIn conjunction with the launch of the restructuring program, SAS decided to update its financial targets. These targets should reflect an operation that has cut its fixed costs and improved its profitability and cash flow. At the end of the 2012/2013 fiscal year, the market was characterized by reduced growth and significantly increased capacity in parallel with a decline in the NOK against the SEK. These conditions are expected to continue and, accordingly, SAS expects that the financial targets that were originally intended to be reached in 2014/2015 will not be reached until 2015/2016.
%
Financial preparedness
0
5
10
15
20
25
30
Oct 13
Oct12
Dec 11
Dec 10
Dec 09
Target >20%%
Equity/assets ratio
0
5
10
15
20
25
30
35
Oct 13
Oct 12
Dec 11
Dec 10
Dec 09
Target >35%
Profitability
%
-8
-6
-4
-2
0
2
4
–8
–6
–4
–2
0
2
4
Oct 13
Oct12
Dec 11
Dec 10
Dec 09
Target >8%
1SAS Group Annual Report November 2012–October 2013

During the year, the market was affected by intensifying competition, price pressure and swings in demand. Toward the end of the year, the climate became even harsher with a decline in business travel and growth in capacity among European airlines. These developments were particularly perceptible in our Scandinavian home market in the fourth quarter.
Despite market trends, SAS delivered, as promised, positive earnings for the full 2012/2013 fiscal year. Income before tax amounted to MSEK 433. This is an improvement that we can be proud of. At the same time, we are all aware that the journey toward a long-term competitive SAS has only just begun.
SAS creates an efficient operating platformThe improvement in earnings for SAS is tangible evidence that the restructuring program launched at the start of the fiscal year is delivering. It has entailed exacting, but entirely necessary measures, which comprised new collective agreements, new pension terms, halved IT expenses, a streamlined sales organization and cutting 1,000 fulltime administration positions.
The effects of the program are exceedingly clear. During the year, SAS expanded through a significant increase in productivity. SAS increased capacity 5.7% in parallel with a decrease in operating expenses excluding jet fuel of SEK 2.7 billion. Aircraft utilization per day increased by almost 30 minutes yearonyear, partly as a result of a more highly optimized network and new collective agreements.
The measures contributed to reducing unit cost by 5.9%. Cost-structure flexibility has increased through outsourcing, for example of call centers, thereby reducing the Group’s fixed costs. A first step has been taken toward outsourcing Ground Handling through the sale of 10% to Swissport. Through increased wet-lease production on shorter routes with turboprop aircraft, SAS can increase the network most cost-efficiently.
Despite these extensive measures, SAS did not allow any slip in the levels of quality and reliability that are at the core of the SAS brand. Customer satisfaction and loyalty remained high, not least among frequent travelers. Punctuality declined slightly in the middle of the year, primarily due to teething issues with a new IT system, but, from August onward, punctuality was back among the best in Europe at about 90%.
Taken together, the results during the fiscal year show that SAS is well on its way to creating a more competitive operating platform.
Improved financial position The SAS Group’s financial position improved during the year through divestments that increased liquidity by about SEK 2.8 billion. In addition, SAS issued two new bonds (MEUR 35 and MSEK 1,500). The single largest divested asset was Widerøe, where SAS now owns 20%. Widerøe has long been a key link in the Group’s regional Norwegian network and the companies will continue to work closely in the future.
New agreements were signed in November 2012 pertaining to salaries, employment terms and pensions, which are crucial for the Group’s ability to meet intensifying competition. Furthermore, the new pension terms are necessary to reduce the impact of changed pension accounting policies, which entered into force for SAS on November 1, 2013. The new agreements reduced the need for impairment of shareholders’ equity from SEK 13.5 billion to SEK 7 billion in parallel with a reduction in the Group’s pension commitments of about SEK 19 billion or 60%. Even with the reduction in impairment of shareholders’ equity, the balance sheet, as of November 1, 2013, shows clearly the necessity of continuing to strengthen the Group’s financial position. Therefore, the Board has proposed that the AGM resolve in favor of the issue of preference shares and convertibles to address the need for investment and credit facilities falling due. The issue of preference shares would strengthen the capital structure, which would decrease net debt and increase the equity/assets ratio and financial preparedness. A convertible issue would be aimed at replacing the company’s existing convertible bonds that mature in 2015.
Investments in the Group’s commercial offeringThe primary target group for SAS is frequent travelers, both in terms of business and leisure. They value time-efficient and easy travel, frequent departures, many destinations and good service. Currently, these passengers account for about 70% of the value of tickets sold in Scandinavia.
President’s comments
Strengthened competitiveness with the new platform
Measures implemented by SAS during the fiscal year to increase efficiency and strengthen the financial position
• New collective agreements• New pension agreements• Agreements signed with new IT suppliers• Outsourcing of call centers• Restructuring of the sales organization• Centralization of administration – 75% of reductions
implemented in line with plans• Sale of Widerøe• Sale and leaseback agreement for spare aircraft
engines• Sale and leaseback agreement for aircraft• Issue of a SEK 1.5 billion bond loan
Without any doubt, the past year entailed substantial changes. The airline industry was characterized by intensifying competition and increasing price pressure. In parallel, we initiated a radical restructuring and aggressive investments and, as a result, SAS stands significantly better equipped to meet the future.
2 SAS Group Annual Report November 2012–October 2013

During the year, SAS continued to simplify and improve its offering on the ground and in the air, through investments including Fast Track at more airports, upgraded lounges and additional seasonal destinations. In addition, at the start of June, SAS introduced SAS Go and SAS Plus on all routes in Scandinavia and Europe. By replacing all previous classes with two attractively priced and clear alternatives based on passengers’ needs, rather than on historic industry standards, SAS is adapting its offering to frequent travelers.
Easier travel, more routes and departures, and competitive pricing mean that an increasing proportion of our frequent travelers now choose to fly with SAS for leisure travel. For example, slightly over 50% more EuroBonus members flew with SAS in the July–August period this year compared to last year. This shows that investments in the Group’s commercial offering are delivering results.
In 2014, we will continue to develop our offering. For example, SAS plans to launch 43 new routes and is investing in major enhancements to the Group’s loyalty program (EuroBonus).
A more efficient aircraft fleet The improved financial position has been crucial for the Group’s possibilities of investing in an extensive renewal of the aircraft fleet:
– During the year, the aircraft fleet was renewed through the phasing in and out of 48 aircraft. The MD-80 was phased out in October 2013 and, in December 2013, the last Boeing 737 Classic was phased out.
– In June, SAS placed an order for 12 new long-haul aircraft (four Airbus A330 Enhanced and eight Airbus A350s) with the first delivery in 2015 as well as an upgrade of the passenger cabins of existing aircraft. This includes new seats throughout the cabins including flat-bed seats in Business Class. New seats are already being installed in our fleet throughout Europe.
The investments in new aircraft not only strengthen the Group’s commercial offering but, also, comprise the key underlying reason for the substantial increase in environmental efficiency achieved in 2013. The climate index improved two percentage points. The Group’s target to reduce emissions by 20% in 2015 compared with 2005 remains firm. In 2018, when we take delivery of the first Airbus A350, fuel consumption will be more than 30% lower per passenger kilometer compared with the existing Airbus A340s.
SAS personnel Without a doubt, the past year has been trying for the Group’s employees. There is no avoiding the fact that a number of the changes have meant that valued colleagues have had to leave the organization, while those of us remaining have to work even harder to increase efficiency. Despite these major changes, SAS has, essentially, kept the same high level of customer satisfaction, which underlines the incredible professionalism of the Group’s employees.
OutlookDuring the year, SAS took an important step toward a long-term profitable SAS. We have created a more competitive operating platform. We are more relevant for frequent travelers and we are investing in our future. Despite this, we are all aware that the work on making a long-term profitable SAS has only just begun. In the 2013/2014 fiscal year, the earnings impact from the restructuring program is expected to amount to SEK 1.2 billion. The weaker market conditions are expected to continue and, as usual, due to seasonality, the first quarter of 2013/2014 (November–January), will be extremely weak. Provided that market conditions, in terms of capacity, jet fuel and exchange rates, do not decline any further and that no unexpected events occur, a positive EBT is expected, excluding the positive effect from the amendments to pension terms, in the 2013/2014 fiscal year. This positive effect from the amended pension terms will impact the results for the first quarter. SAS now expects, as an additional consequence of the weaker conditions, that the financial targets expected to be reached in 2014/2015 will not now be reached until 2015/2016.
Stockholm, January 27, 2014
Rickard GustafsonPresident and CEO
“We have created a more competitive operating platform. We are more relevant for frequent travelers and we are investing in our future.”
President’s comments
3SAS Group Annual Report November 2012–October 2013

Operating environment and strategy
Growth under intense competitive pressure
Over the past few years, the low cost carriers (LCCs) have signifi-cantly advanced their positions in the European markets and, in many cases, succeeded in establishing themselves as market lead-ers. To differing extents, network airline companies have responded with cost savings and investments in their own low-cost brands for short-haul routes to defend their positions.
Short-haul routes are at the core of the SAS Group’s operations and are mainly operated by SAS itself. Through the ongoing restruc-turing program, SAS is creating the flexibility and cost-effectiveness
to allow increasing capacity with new attractive destinations and competing profitably with LCCs in Europe and in the growing leisure market.
In Scandinavia, SAS is the single largest airline with a market share of about one-third of the total air travel market, which is valued at slightly more than SEK 70 billion. Based on official airport statis-tics (Swedavia, CPH and Avinor) in Scandinavia, the SAS Group’s market share of Scandinavian domestic traffic was slightly more than 45% in 2013.
The airline industry is particularly sensitive to economic trends and characterized by intense competi-tion. In parallel, the industry continues to grow and, despite intense competition from low cost carriers (LCCs), SAS succeeded in strengthening its position in key markets. The achievement of long-term competitiveness will require SAS to follow through on its extensive restructuring program and con-tinue to invest in its customer offering.
Continued globalization drives travelContinued growth is expected on long-haul routes. In line with global economic growth, a realignment in global travel is ongoing in favor of Asia and Africa. Europe and North America are more mature and stable markets. Leisure travel is growing more rapidly than business travel. An underlying reason for the above is that physical business meetings are increasingly being replaced by digital meetings and digital communication.
Protracted economic downturnIn Europe, the increase in air travel has been weaker due to the eco-nomic crisis afflicting the majority of countries. However, Scandinavia has been relatively unscathed by the crisis and, accordingly, SAS has noted increased demand for air travel to all regions and continents. General economic concerns have a negative impact on ticket prices and demand since companies have applied more restrictive travel policies.
Increasing competition, price pressure and increased capacityOver the last ten years, the number of direct routes to and from Scan-dinavia has increased 50%. A key reason has been the expansion of LCCs, which means that LCCs have trebled their share of European traffic during the same period. Capacity at LCCs and network airline companies is expected to continue to intensify competition. IATA, Boeing and Airbus forecast growth in capacity of about 5% per year. This increased capacity and competition is expected to negatively impact ticket prices.
Consolidation and streamlining in the airline industryIn response to increased competition in Europe, there are clear sig-nals that the major traditional airlines are attempting to streamline
their operations and outsource short-haul routes to smaller, regional, wholly or part-owned companies with the aim of lowering their costs. On long-haul routes, the major airlines are consolidating through the formation of joint venture companies with the objective of increasing efficiency and enhancing the customer offering.
Capital and personnel intensive operationsThe airline industry is particularly capital intensive and renewal of an aircraft fleet makes major demands on funding and cash flow. In paral-lel, operations remain personnel intensive. Accordingly, a number of competitors are establishing bases in low-cost countries, to which the personnel are allocated.
New aviation technology A new generation of aircraft from the major manufacturers offers 20% lower fuel and maintenance costs in parallel with an extended range, which can enable the opening of new routes.
Increased sustainability requirements from society and customersIncreased awareness of the environmental and societal effects of trans-portation means that more customers actively choose transportation with the lowest impact. More major customers require airlines to actively work to promote an improved environment and prepare transparent reports of the environmental impact of their traffic.
New regulationsNew regulations are constantly being introduced in the airline indus-try, such as, changed passenger and emission rights, which require investments and adaptations. Liberalization of the airline industry means that more airlines from different continents can compete.
Drivers and challenges
4 SAS Group Annual Report November 2012–October 2013
Lower yield and PASK Before SAS launched its restructuring program, the SAS Group’s unit revenue was declining more rapidly than its unit cost. SAS had to turn this trend around to secure sustainable, profitable development. For this reason, SAS took a key step in November 2012 when new collec-tive agreements were signed. These, in combination with other mea-sures under the restructuring program, contributed to lowering the unit cost by 5.9% in 2012/2013.
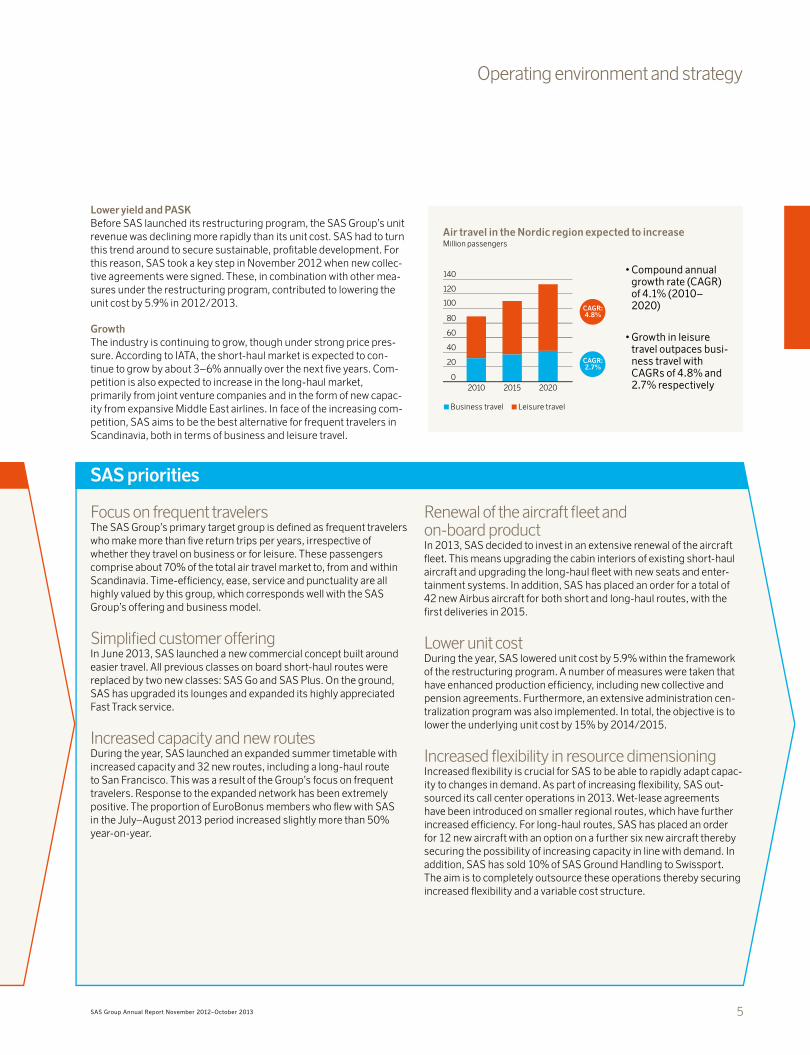
GrowthThe industry is continuing to grow, though under strong price pres-sure. According to IATA, the short-haul market is expected to con-tinue to grow by about 3–6% annually over the next five years. Com-petition is also expected to increase in the long-haul market, primarily from joint venture companies and in the form of new capac-ity from expansive Middle East airlines. In face of the increasing com-petition, SAS aims to be the best alternative for frequent travelers in Scandinavia, both in terms of business and leisure travel.
SAS priorities
Focus on frequent travelersThe SAS Group’s primary target group is defined as frequent travelers who make more than five return trips per years, irrespective of whether they travel on business or for leisure. These passengers comprise about 70% of the total air travel market to, from and within Scandinavia. Time-efficiency, ease, service and punctuality are all highly valued by this group, which corresponds well with the SAS Group’s offering and business model.
Simplified customer offeringIn June 2013, SAS launched a new commercial concept built around easier travel. All previous classes on board short-haul routes were replaced by two new classes: SAS Go and SAS Plus. On the ground, SAS has upgraded its lounges and expanded its highly appreciated Fast Track service.
Increased capacity and new routesDuring the year, SAS launched an expanded summer timetable with increased capacity and 32 new routes, including a long-haul route to San Francisco. This was a result of the Group’s focus on frequent travelers. Response to the expanded network has been extremely positive. The proportion of EuroBonus members who flew with SAS in the July–August 2013 period increased slightly more than 50% year-on-year.
Renewal of the aircraft fleet and on-board product In 2013, SAS decided to invest in an extensive renewal of the aircraft fleet. This means upgrading the cabin interiors of existing short-haul aircraft and upgrading the long-haul fleet with new seats and enter-tainment systems. In addition, SAS has placed an order for a total of 42 new Airbus aircraft for both short and long-haul routes, with the first deliveries in 2015.
Lower unit costDuring the year, SAS lowered unit cost by 5.9% within the framework of the restructuring program. A number of measures were taken that have enhanced production efficiency, including new collective and pension agreements. Furthermore, an extensive administration cen-tralization program was also implemented. In total, the objective is to lower the underlying unit cost by 15% by 2014/2015.
Increased flexibility in resource dimensioningIncreased flexibility is crucial for SAS to be able to rapidly adapt capac-ity to changes in demand. As part of increasing flexibility, SAS out-sourced its call center operations in 2013. Wet-lease agreements have been introduced on smaller regional routes, which have further increased efficiency. For long-haul routes, SAS has placed an order for 12 new aircraft with an option on a further six new aircraft thereby securing the possibility of increasing capacity in line with demand. In addition, SAS has sold 10% of SAS Ground Handling to Swissport. The aim is to completely outsource these operations thereby securing increased flexibility and a variable cost structure.
0
20
40
60
80
100
120
140Leisure
Corporate
202020152010
Air travel in the Nordic region expected to increase Million passengers
Business travel Leisure travel
• Compound annual growth rate (CAGR) of 4.1% (2010–2020)
• Growth in leisure travel outpaces busi-ness travel with CAGRs of 4.8% and 2.7% respectively
CAGR: 2.7%
CAGR: 4.8%
Operating environment and strategy
5SAS Group Annual Report November 2012–October 2013

Business model
Focus on frequent travelers
During the year, SAS has continued to build on the strengths of the offering to the primary customer group – frequent travelers in Scandinavia who value easier and more time-efficient travel. In parallel, the implemented structural changes have created a more efficient and flexible operating platform. The increased focus on passengers with high requirements on travel requires SAS to develop contin-uously, which also creates shareholder value and a robust Scandinavian infrastructure.
Over the year, three significant changes were made to the SAS Group’s business model: a new simplified customer offering, a substantially decreased cost base and a more rational production model with higher capacity.
Ease • Distinct offerings – SAS Go
and SAS Plus• Transparent pricing• Loyalty program (EuroBonus)• 24-hour money back guarantee• Digital services
Access• An extensive proprietary route net-
work and unbeatable global reach via Star Alliance
• A service offering that is in demand with and appreciated by customers
Time• Scandinavia’s best timetable with
almost 800 daily departures• Punctuality among the best in Europe• Time-efficient solutions on the
ground
Flexible use of resources • Aircraft fleet flexibility• Wet lease capacity for peaks and
low traffic flows• Simplified working conditions• Outsourcing initiated of ground
handling, customer service and administrative functions
Efficient processes• Easier and smoother flows• Simplified production logistics• Lean operations throughout
Efficient organization• Centralization of administration• Centralization and streamlining of
the sales organization• Outsourcing for increased flexi-
bility and efficiency in the cost structure
Customer offering
Production model
SAS focuses primarily on frequent travelers and offers more destina-tions and more departures than any other Nordic airline, which is the core strength of our business model. Due to increased productivity and more efficient processes, SAS has been able to invest in many new destinations during the year and, thereby, meet demand from its frequent customers. More routes and departures with competitive pricing throughout the year means that a larger proportion of our customers now choose to fly with SAS for leisure travel.
During the year, SAS has also secured the renewal of the aircraft fleet and continued to develop services that make travel easier. Efforts have also been initiated to further lower costs and increase efficiency by introducing Lean to all production processes. These improve-ments mean that SAS has strengthened its competitiveness vis-à-vis traditional network airlines and LCCs. The goal is for SAS to always be the natural choice for frequent travelers.
Business model
=Revenue
Earnings
=Costs
Read more on pages 12–17
Read more on pages 8–11 and 25
6 SAS Group Annual Report November 2012–October 2013
Valu
e cr
eatio
n
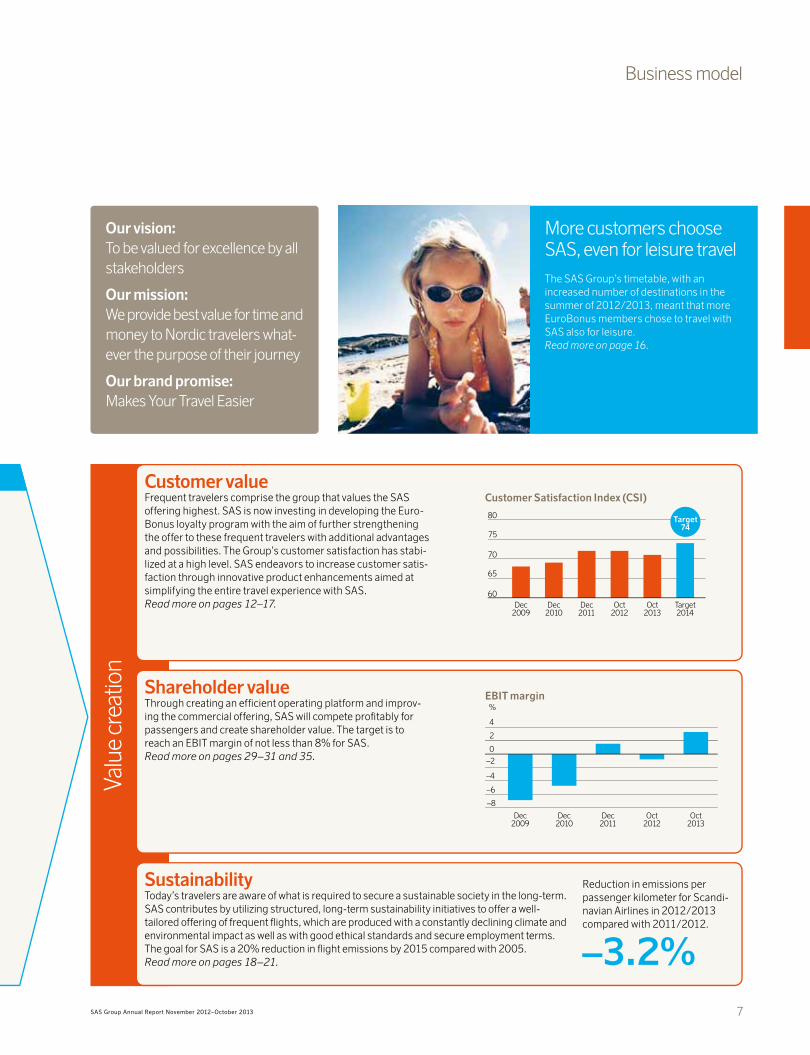
More customers choose SAS, even for leisure travel
The SAS Group’s timetable, with an increased number of destinations in the summer of 2012/2013, meant that more EuroBonus members chose to travel with SAS also for leisure. Read more on page 16.
Customer valueFrequent travelers comprise the group that values the SAS offering highest. SAS is now investing in developing the Euro-Bonus loyalty program with the aim of further strengthening the offer to these frequent travelers with additional advantages and possibilities. The Group’s customer satisfaction has stabi-lized at a high level. SAS endeavors to increase customer satis-faction through innovative product enhancements aimed at simplifying the entire travel experience with SAS. Read more on pages 12–17. Target
2014Oct
2013Oct
2012Dec
2011Dec
2010Dec
2009
60
65
70
75
80
Customer Satisfaction Index (CSI)
Shareholder valueThrough creating an efficient operating platform and improv-ing the commercial offering, SAS will compete profitably for passengers and create shareholder value. The target is to reach an EBIT margin of not less than 8% for SAS. Read more on pages 29–31 and 35.
EBIT margin%
–8
–6
–4
–2
0
2
4
Oct2013
Oct2012
Dec2011
Dec2010
Dec2009
SustainabilityToday’s travelers are aware of what is required to secure a sustainable society in the long-term. SAS contributes by utilizing structured, long-term sustainability initiatives to offer a well- tailored offering of frequent flights, which are produced with a constantly declining climate and environmental impact as well as with good ethical standards and secure employment terms. The goal for SAS is a 20% reduction in flight emissions by 2015 compared with 2005. Read more on pages 18–21.
Reduction in emissions per passenger kilometer for Scandi-navian Airlines in 2012/2013 compared with 2011/2012.
–3.2%
Our vision: To be valued for excellence by all stakeholders
Our mission: We provide best value for time and money to Nordic travelers what-ever the purpose of their journey
Our brand promise: Makes Your Travel Easier
Target 74
Business model
7SAS Group Annual Report November 2012–October 2013

Primary challenges Measures
Costs and flexibility (A)The SAS Group’s historical legacy and a geographical home base in three countries have created a cost structure that is too expensive and inflexible. Costs have been fixed to a far too great extent and the unit cost have been too high. The transition to changed circum-stances has taken too long.
a New collective agreements and pen-sion termsa Centralization of the administrationa IT restructuringa Restructuring of the sales organizationa Optimization of the route network and
resource planninga Increased use of external production,
known as wet leasinga Outsourcing of Ground Handling
Shareholders’ equity (B)The changed accounting policies for pen-sion commitments, IAS19, mean that accumulated actuarial gains and losses must be recognized directly in sharehold-ers’ equity. For SAS, allowing the situation to continue would have resulted in negative shareholders’ equity.
a New defined-contribution pension agreements
Financial preparedness (C)The financial preparedness of SAS has, largely, been dependent on external credit facilities. This dependence entails increased costs and reduced room for maneuver.
a Asset salesa Refinancing of aircraft
The restructuring program
A flexible and competitive cost base enables aggressive investment
In November 2012, SAS launched the 4Excellence Next Generation restructuring pro-gram to achieve substantial cost savings and increased flexibility. The program aims to align circumstances at SAS with those of the market. After 12 months, clear results were posted even though the pro-gram is far from completed.
New collective agreements (A)The new agreements that were signed in Novem-ber 2012 mean significant enhancements in planning and scheduling efficiency. The new employment terms were fully implemented in the spring of 2013 and resulted in a productivity increase in excess of 7% for the year. The new agreements are also open to the possibility of using wet leases to create additional flexibility and balance to counter seasonal variations in demand.
New pension terms (A and B)The agreement regarding new pension terms in November 2012 entails new defined-contribution pension solutions for most employees. The new pension terms reduce the negative impact on sharehold-ers’ equity arising on November 1, 2013 for accounting purposes by approximately SEK 3.4 billion. The sale of Widerøe further reduce this effect by about SEK 1 billion. This means that the negative effect on shareholders’ equity is estimated at about SEK 7 billion. The defined-benefit pension commitments will be reduced by about 60% over time, which corresponds to about SEK 19 billion and, thereby, reduces earnings volatility.
Centralization of administration (A)The measures entail a reduction in and cen-tralization of administration to Stockholm. In total, the number of employees will be reduced by slightly more than 1,000 full-time equivalents. The process is proceeding according to plan and, at the end of the fiscal year, 75% of these cutbacks were imple-mented.
600
650
700
750Piloter
Kabinpersonal
Oct2013
Jan2013
Jan2012
Jan2011
Increase in productivity for Scandinavian Airlines’ flight crewsBlock hours/year Cabin crew Pilots
Administrative costs reduced by 43%
Productivity has increased continuously since 2011 and, particularly, for cabin crew in 2013. The increased need for retraining due to phasing out the MD-80s and Boeing 737 Classics resulted in lower pilot productivity improvements in 2013.
8 SAS Group Annual Report November 2012–October 2013

Outcome for the full-year
aUnit cost down 5.9%a��Scandinavian Airlines’ payroll expenses
reduced 18%aAircraft utilization rate up 5.3%aScandinavian Airlines’ capacity up 6%aNew wet lease agreements signed
a Lowered pension costs with a full effect of MSEK 500 from the 2013/2014 fiscal year
a� Reduction in the negative effect on shareholders’ equity from changed accounting standards, from SEK –13.5 billion to about SEK –7 billiona Pension commitments outstanding reduced by 60%
a Sale of non-core operations and assets completed with a liquidity effect of SEK 2.8 billion: – Widerøe – Aircraft engines – Aircraft financing
a The net debt was reduced by about SEK 2 billion
a Long-term liquidity was strengthened by: – the issue of a MEUR 35 bond loan (under the EMTN program) – the issue of a SEK 1.5 billion bond loan
a�Cash and cash equivalents increased MSEK 1,962 compared with October 2012
Gross effect of the restructuring programSEK billion
IT restructuring (A)SAS aims to halve IT expenses by 2016. Dur-ing the fiscal year, a five-year agreement was made with Tata Consultancy Services (TCS) for IT services. The remaining IT organiza-tion has been reduced and restructured to create a clearer and more businesslike link to operations. The systems and infrastruc-ture will be consolidated and simplified in conjunction with the transfer to TCS.
Commercial & Sales (A)The SAS sales organization has been restructured and centralized. A new remu-neration model is being implemented for sales personnel. Better utilization of the Group’s aircraft and wet leasing of smaller aircraft has enhanced network efficiency. A new commercial concept has been imple-mented with simplified logistics. SAS signed an agreement with Sykes and outsourced additional parts of call-center operations.
Divestment of assets and funding plan (C)In September, 80% of the Group’s share-holding in Widerøe was sold. SAS intends to divest its entire holding in 2016. As part of the transaction, SAS sold seven Bombardier Q400 aircraft to Widerøe. The total value of these various transactions may amount to SEK 2.3 billion with full divestment of the shares in 2016. Other transactions were also carried out, including the sale and leaseback of engines and refinancing of aircraft.
The divestment of assets in com-bination with the SAS Group’s increased profitability has con-tributed to reducing financial net debt by almost SEK 2 billion.
Outsourcing of Ground Handling (A)The outsourcing of Ground Handling is a long-term strategic measure aimed at achiev-ing increased cost-base flexibility and provid-ing enhanced conditions for operations to grow. In March 2013, a letter of intent was signed with Swissport regarding the out-sourcing of operations. As a first step, 10% of Ground Handling was sold to Swissport on October 31, 2013. The parties have agreed to pause negotiations until Swissport has con-cluded the acquisition and integration of Servis air (with the prerequisite that the acquisition is approved).
0
1
2
3
Total2014/20152013/20142012/2013
1.5
1.2
New collective agreements 0.7
IT restructuring 0.6
Commercial & Sales 0.5
0.3–0.4 ~3
New pension agreements 0.5
Centralization of administration 0.7
The restructuring program
Oct 2012
SEK 6.5 billion
SEK 4.6 billion
Oct 2013
Defined-benefit pension commitments lowered by
60% by the new pension agreements
9SAS Group Annual Report November 2012–October 2013

Financing new aircraftSAS has signed agreements for the pur-chase and lease of a total of 51 aircraft with delivery from 2014 to 2021. The total list price of the aircraft ordered by SAS is approximately USD 5.8 billion. SAS plans to both lease and own aircraft with delivery from 2015. SAS intends to utilize a mix of export credit financing, enhanced equip-ment trust certificates (EETCs), bank loans and bank facilities to finance directly owned aircraft. Read more about aircraft fleet financing on page 29.
Unit costThe comparison of unit costs (see page 99 for a definition) between airlines is difficult and can be extremely misleading. A key parameter for unit cost is the flying distance. The longer the flight, the lower the unit cost. The following diagram illustrates how the unit cost for the Group’s Boeing 737-800 production varied for differing flying distances in 2012/2013 com-pared with 2010. Since a large proportion of the Group’s flights are within Scandinavia and often, on short domestic routes, fair comparison with other airlines frequently requires adjust-ment of the unit cost.
Fleet strategy
Fleet renewal strengthens efficiency and flexibility
Trend in aircraft productivityHours/day
A simplified and renewed fleet tailored to large and small traffic flows will strengthen competitive-nessThe SAS Group’s fleet strategy for Europe is based on having various aircraft sizes, ranging from 50 to about 200 seats, adapted to meet customer demand in Scandinavia. This enables SAS to offer higher frequencies and improved sched-ules and connections to smaller destina-tions. By establishing a Boeing 737 Next Generation platform in Norway and Swe-den and an Airbus A320 platform in Den-mark, SAS will create homogeneous fleets at each base. During 2012/2013, SAS increased the utilization of the short and medium-haul fleet by 5.3%.
2014–2016
A320/A320neo
737NG 737NG
En flygplanstyp på varje produktionsbas, Scandinavian Airlines
Oslo
Copenhagen
Stockholm
Number of aircraft in service October 2013 2014–2021
Aircraft type Age Owned Leased Total Firm orders Lease orders
Airbus A330/A340 11.4 5 6 11 4 1
Airbus A350 - 0 0 0 8 0
Airbus A321/A320/A319/A320neo 8.8 6 18 24 30 1
Boeing 737NG/Classic 12.0 17 66 831 0 7
Boeing 717/Bombardier CRJ900 8.2 16 5 21 0 0
Total 51 aircraft
SAS will upgrade the passenger cabins on up to seven selected Airbus A330/A340s. The upgrades will comprise new seats including full-flat seats in Business Class.
SAS substantially renewed its aircraft fleet during 2011–2013. In 2012/2013, 48 aircraft were phased in and out of service and at October 31, 2013, with the exception of three aircraft that were phased out in December 2013, the short and medium-haul fleet comprised only the latest generation of aircraft.
Primary aircraft models:
SAS supplements and expands its own production with a smaller share of wet leases, primarily on regional routes that are largely flown with turboprop aircraft.
Long-haul flightsRange: 10,100–12,800 kmSeating capacity: 245–264 seats
Airbus A330/A340-300
Short/medium-haul jetsRange: 2,400–5,100 kmSeating capacity: 123–198 seats
Airbus A319/A320/A321
SAS unit cost for Boeing 737-800 production
2013 2010
Seating capacity: 245–264 seats Seating capacity: 123–198 seats
6
7
8
9
Oct 2013Oct 2010
Uni
t cos
t
Flying distance,km1,000 2,000 3,000
1) Three of these aircraft are the Boeing 737 Classic
10 SAS Group Annual Report November 2012–October 2013

MD-80 – A faithful old servant retires from the aircraft fleetThe last commercial MD-80 flight took place in October 2013 and, in this man-ner, the faithful servant retired from the SAS fleet. SAS has flown MD-80 aircraft for almost 30 years. During this period, SAS MD-80 aircraft flew a distance equivalent to about 3,870 return trips to the moon. SAS took delivery of its first of a total of 66 MD-80s in October 1985. By the time the aircraft was phased out, the aircraft had made about 3,134,900 flights.
Fleet strategy
Sustainability aspects with a newer fleetGenerally, newer aircraft are more efficient than older aircraft and require less technical main-tenance. Compared with the MD-80 and the Boeing 737 Classic, which has recently been phased out by SAS, the Boeing 737 Next Generation and Airbus A320 families have a longer range, lower fuel consumption and lower emissions of greenhouse gases. Compared with an MD-80, the fuel consumption of an Airbus A320 is about 20% less for an average flying distance and, at the same time, offers 18 extra seats. In addition, the aircraft has lower noise levels. For example, the area exposed to 85 dB on takeoff is reduced by 55%. A diligent sus-tainability assessment in line with the Group’s policies and guidelines is always carried out in conjunction with wet leases and the procurement of aircraft.
How SAS works to save jet fuelIn addition to the renewal of the fleet, SAS works actively with improving the fuel efficiency of existing aircraft as part of daily operations. Since the base year in 2005/2006, fuel efficiency has increased 6.4% through a number of fuel-saving mea-sures. Measures utilized include the use of more effi-cient methods of flying aircraft, running fewer engines for air-craft ground movements and reducing the aircraft weight.
110
115
120
125
130
135
140
Grams
2005 2006 2007 2008 2009 2010 Nov–Oct 2011–2012
Nov–Oct 2012–2013
2011
Scandinavian Airlines CO2 emissions per passenger kilometer
Purchase of 30 Airbus A320neosIn 2011, SAS signed a firm order for the purchase of 30 Airbus A320neos. In addition, SAS has options on another 11 aircraft. The first Airbus A320neos will start to be delivered in 2016. These aircraft are, essentially, identical to existing aircraft in the Air-bus A320 family but have new engines and “sharklet” wingtips, which improve aerodynamic efficiency. Compared with current aircraft of the same size, noise is reduced significantly and fuel consumption decreased by about 15%.
Purchase of eight Airbus A350-900 XWBs and four Airbus A330-300 EnhancedsIn October 2013, SAS signed the final agreement for the purchase of four Airbus A330-300 Enhanceds and eight Airbus A350-900 XWBs for delivery from 2015 and 2018 respectively. The agreement includes options for the purchase of six additional Airbus A350-900s. The Air-bus A330-300 Enhanced has an extended range compared with the Group’s existing Airbus A330-300s and about 15% lower fuel con-sumption compared with the current Airbus A340-300. The Airbus A350-900 will have a fuel consumption that is over 30% lower per seat than the Airbus A340-300, and substantially lower noise levels. Com-pared with competing aircraft of the same size, the Airbus is wider, which allows enhanced passenger comfort.
Number of aircraft in service October 2013 2014–2021
Aircraft type Age Owned Leased Total Firm orders Lease orders
Airbus A330/A340 11.4 5 6 11 4 1
Airbus A350 - 0 0 0 8 0
Airbus A321/A320/A319/A320neo 8.8 6 18 24 30 1
Boeing 737NG/Classic 12.0 17 66 831 0 7
Boeing 717/Bombardier CRJ900 8.2 16 5 21 0 0
Total 51 aircraft
SAS will increase its efficient Airbus A330 fleet from four to eight aircraft by replacing four Airbus A340s with four Airbus A330-300 Enhanceds, when existing leases expire.
Boeing 737-600/700/800
Regional jetsRange: 2,100–2,800 kmSeating capacity: 88–115 seats
Bombardier CRJ900 Boeing 717
Results of the new aircraft fleeta A more attractive offering a Built-in flexibility to market
trendsa One homogeneous fleet at
each respective base: Oslo, Stockholm and Copenhagena Lower maintenance costsa Reduced emissions
11SAS Group Annual Report November 2012–October 2013

Customers and customer offering
Customer driven development ensures continued customer satisfaction
The primary target group for SAS is frequent travelers in Scandinavia, regardless of whether the trip is for business or leisure purposes. The objective is to continue to be the target group’s natural choice by providing easy, clear and time-saving products and services, all linked to an unsurpassed network and a schedule with frequent departures. In addition, there is the security that membership in Star Alliance provides in the event of any irregularities.
Product development tailored to changed travel habitsSAS endeavors to facilitate and make planning, booking and taking a trip easy for customers. Irrespective of whether traveling on business or pleasure, today’s travelers expect the same level of ease, clarity and efficiency. This, in turn, sets requirements for the production process. During the year, SAS was the first airline in the world to receive IATA’s Fast Travel Platinum Award for the development of self-service options throughout the travel chain.
Travel agency recommendationsEnvironmental work
Business travel servicesPolicy
Route networkInternet services
Service and attitudeFlexible terms
PriceNon-stop flights
Easily accessible airportsShortest travel time
ScheduleCorrect delivery
Punctuality
0 1 2 3 4 5 6 7 8 9 10
Okt13
Sep13
Aug13
Jul13
Jun13
Maj13
Apr13
Mar13
Feb13
Jan13
Dec12
Nov12
1 = Stark köprekommendation 2 = Köp 3 = Behåll 4 = Underpresterande 5 = Sälj
Frequent travelers in ScandinaviaAbout 2 million of Scandinavia’s approximately 20 million inhabitants make five or more return flights per year. A shared trait of these pas-sengers is that they value their time and want easy and efficient travel solutions. They are located in major cities as well as smaller towns, are well-educated, interested in technology and are high media con-sumers. About 1.7 million of these passengers chose to travel with SAS at least once in 2013.
As part of improving the offering to this target group, including leisure travel, SAS has expanded its network. This expansion has now led to SAS competing more actively for leisure market revenue, which contributed to the rise in currency-adjusted passenger reve-nue in 2012/2013.
The frequent traveler:• At least five return trips per year• Values time and ease• Requires the same service whether traveling
on business or for pleasure• Represents about 70% of the Scandinavian
travel market
Time-related factors are most important to frequent travelers
Time-related
Easy from start to finishSAS works actively to develop and improve its customer offering at every stage of the journey. Passengers of SAS value easier and more time-efficient travel, from the actual booking to arrival at the end des-tination. The Group’s EuroBonus loyalty program forms a key ele-
ment in this offering, both during the journey and at home. Custom-ers are able to earn and redeem EuroBonus points throughout the journey, for uses including everything from hotels and rental cars to shopping.
More attractive offerings with SAS Go and SAS Plus
Possible to redeem EuroBonus points during the journey and at home
Booking via new digital services
Simplified check-in procedures and security controls Lounge upgrades
New on-board concept Arrival
12 SAS Group Annual Report November 2012–October 2013

Customers and customer offering
New product conceptAn entirely new product concept was launched in June 2013: SAS Go and SAS Plus. The products were developed together with the SAS Group’s customers and aim to meet the increasing demand for easier and more time-efficient travel, both for business and pleasure. The concept builds on ease, clarity and transparency regarding content and pricing. Passengers must know what they will receive and how much it costs, without any hidden costs and charges. The base prod-uct SAS Go includes everything needed at a competitive price. SAS Plus includes additional benefits, such as, Fast Track, Lounge, an extra bag and free refunds. Business Class will continue to be offered on SAS intercontinental flights.
SAS Go SAS Plus
Ticket flexibility Rebooking fee Rebooking
free of chargeRefundableSeat selection on bookingLoungeFast TrackTea and coffeeBreakfast 1
Food and drink For sale IncludedBaggage 1 x 23 kg 2 x 23 kgPriority baggage, Intl.EuroBonus points 100% 100%
1) SAS serves a free breakfast on domestic flights before 9:00 am.
Apps and social mediaOver the year, SAS launched apps for smartphones and tablet devices. Apps are available that allow passengers to book and rebook flights, check in, download boarding cards, check their flight status and much more besides. This saves time and makes life easier for SAS customers. SAS maintains an active dialog with passengers, both on Facebook and through My SAS Idea. Many of the improvements implemented originated from suggestions by SAS passengers.from suggestions by SAS passengers.
Check-in and baggage handlingWhen traveling within Schengen and to the UK, SAS customers can use the Self Service Bag Drop and scan the bags’ tags themselves. In 2012/2013, the SAS Self Service Bag Drop has been rolled out at several airports including Copen-hagen, Luleå, Oslo and Arlanda International. The service is avail-able at a total of 15 airports.
SAS has continuously improved the quality of baggage handling. In the November 2012–October 2013 period, 7.6 pieces of baggage were delayed per 1,000 passengers. This is a 24% decrease compared with the average during the last ten years.
13SAS Group Annual Report November 2012–October 2013

Customers and customer offering
Renewed commercial concept reduces complexityOne effect of the new on-board concept is reduced complexity in the underlying logistics. The three separate catering ranges, multiple payment solutions and complex planning that was needed previously has been replaced by a single range. The difference is that the range is available free of charge in SAS Plus and must be paid for in SAS Go. This leads to less complexity, reduced wastage and lower costs.
Examples of reduced complexity:• Increased harmonization between the routes• From three to two classes in Europe• One cart concept. Same range of food and
beverages in both cabins.
Lounge upgradesIn 2012/2013, SAS completed an upgrade of the lounges, which now make it even easier to relax or work. In conjunction with the launch of SAS Go and SAS Plus, SAS changed the name of its lounges. The SAS Business Lounge became the SAS Lounge and the SAS Scandinavian Lounge changed name to the SAS Gold Lounge. During the year, SAS also made it possible for SAS Go customers, on international flights, to pay for access to selected SAS lounges when checking in online. EuroBonus points may be used for payment.
Easy and accessibleSecurity controls are an extremely time-consuming part of any journey. Irrespective of whether passengers have to queue for a long time or if they came early to be sure of making their flight, security controls add time to traveling. During 2012/2013, SAS invested in expanded and improved Fast Track facilities, in both Copenhagen and Oslo, which saves considerable time for pas-sengers. In Oslo, SAS now offers Fast Track for domestic flights.
14 SAS Group Annual Report November 2012–October 2013

An expanded loyalty program for increased customer satisfactionThe SAS EuroBonus program has evolved from its origins as a fre-quent-flyer program to its current guise as a broad loyalty program that reflects members’ everyday life – when traveling and at home. Together with external partners, earning EuroBonus points is made possible on everything from flights, hotels and rental cars to shopping, insurance, electricity and groceries. New, attractive partners are continuously being added to this partnership. By rewarding EuroBonus members and simplifying their everyday life, SAS increases their loyalty, which generates increased revenue for SAS and its business partners.
A key change that has been implemented in EuroBonus is that members no longer need to wait until they have reached a specific level of points to be able to redeem a bonus flight. Today, EuroBonus points can be used freely to buy regular airline tickets, for partial payment of journeys, to shop at the EuroBonus online shop, pur-chase food and beverages at the SAS onboard Café, buy gift vouch-ers at restaurants, stores, theme parks and much more. After only a few journeys or purchases with SAS partners, EuroBonus members are able to use their points, which strengthens loyalty and gives more members reason to choose SAS – a key ingredient for the con-tinued success of EuroBonus. For EuroBonus, every point earned represents revenue and every point used is a cost. For SAS, this means that every point used represents, in parallel, an important investment in the customer’s loyalty.
To optimize relevance, it is important that communication with EuroBonus members is increasingly dynamic and based on how the individual members use their points. This communication is adapted to each member’s behavior, interests and needs.
The number of EuroBonus members is steadily on the rise. On October 31, 2013, the program had 3.2 million members, up 214,000 year-on-year.
Next generation of EuroBonusIn 2014, SAS will make major improve-ments in the EuroBonus program. The changes comprise expanding the num-ber of member benefits, increasing the number of partners and products that simplify travel as well as earning and redeeming points.
SAS CreditsThe SAS Group’s unique offering for small and medium-sized compa-nies, SAS Credits, provides companies with the opportunity to lower their travel costs by (in addition to personal bonus points) collecting credits for the company. Companies can redeem these for airline tick-ets and hotel nights through the Group’s partner Rezidor Hotels. SAS Credits has grown at record speed over the three years that have passed since its launch and, on October 31, 2013, had close to 35,000 corporate agreements worldwide, of which 28,000 in Scan-dinavia. At the end of the fiscal year, SAS Credits comprised about one-third of the Group’s corporate contract portfolio.
SAS Credits is the core component of the Group’s offering to small and medium-sized companies, whereby these companies can, over time, grow and acquire a number of efficient solutions to lower the companies’ direct and indirect travel costs. More partners and services are in the pipeline.
Customers and customer offering
Number of EuroBonus members, thousands
2013 Oct
2012 Oct Change
Number of members, total 3,153 2,939 7.3%of which in Sweden 947 867 9.3%of which in Norway 897 795 12.8%of which in Denmark 603 573 5.4%of which in Finland 244 248 –1.7%of which international 462 457 1.1%
Total number of gold members 80 74 7.6%Total number of silver members 143 125 14.1%
15SAS Group Annual Report November 2012–October 2013

Customers and customer offering
Kirkenes
TromsøAlta
Kristiansund
Oulu
Kokkola
Molde
Ålesund
Narvik
Chicago
New York
TokyoBeijing
Bangkok
Washington D.C.San Francisco
Vilnius
Palanga
Gothenburg
Stuttgart
Hanover
Birmingham
Aalborg
AarhusBillund
Bologna
Poznan
Luxembourg
Pristina
Thessaloniki
Santorini
Bucharest
Alanya
Tel Aviv
Munich
Moscow
St. Petersburg
Helsinki
Kiruna
Luleå
Östersund
Helsingborg/Ängelholm
Prague
Geneva
Ronneby
Malmö
Kalmar
Skellefteå
Sundsvall
Split
Warsaw
Lodz
Turku
Tampere
Vaasa
Hamburg
Brussels
Paris
Rome
Cagliari
Nice
Zurich
London
Haugesund
Amsterdam
Dublin
Milan
Manchester
Bodø
Bergen
Aberdeen
Barcelona
Alicante
Malaga
Berlin
Frankfurt
Biarritz
Düsseldorf
Stavanger
Longyearbyen
Trondheim
Kristiansand
Athens
Gran Canaria
Las Palmas
Tenerife
Madrid
Faro
Lisbon
Gdansk
Venice
Malta
Edinburgh
Reykjavik
Umeå
Dubrovnik
Palma de Mallorca
Newcastle
Shanghai
Pula
Stockholm
Copenhagen
Oslo
Wroclaw
Katowice
BudapestInnsbruck
Salzburg
Palermo
Sochi
Linköping
Leeds
Bristol
PisaBastia
Montpellier Sarajevo
Larnaca
Naples
Chania
Olbia
Visby
New routes, 2013 New routes, 2014
Aggressive investment in new routes
A competitive network with more destinationsWith an average of 791 departures per day, SAS offers the best net-work to, from and within Scandinavia. With frequent departures to in-demand destinations, customers are offered freedom of choice and the ability to use time optimally, whether traveling on business or leisure.
SAS listens to its passengers, which resulted in an increased capacity with over 6,000 departures on both existing and new routes in 2012/2013. A total of 52 new routes were opened, includ-ing Copenhagen–San Francisco and a number of routes to the Mediterranean during the summer months. The expansion has been primarily through increased utilization of the aircraft fleet.
The SAS Group’s range of destinations varies over the season to meet the travel needs of frequent travelers and to ensure the year round relevance of the offering. The core of the offering is frequent domestic departures, between the Scandinavian countries and to international destinations in Europe, the US and Asia. This core net-work is then supplemented according to season with desirable routes to the Mediterranean, the Canaries and the Alps.
In 2014, SAS will continue to strengthen its offering aimed at frequent travelers with more departures on desirable routes, new year-round destinations and over 30 new seasonal routes in the sum-mer months.
Stockholm-Arlanda–Oslo
Stockholm-Arlanda–Gothenburg
Oslo–Bergen
19
16
23
10
7
19
Stockholm-Arlanda–Copenhagen
Oslo–Copenhagen
23
31
9
14
SAS departures compared with the largest competitor, fiscal year 2013
SASLargest competitor
2013Jul–Aug
2012Jul–Aug
2011Jul–Aug
2010Jul–Aug
+3.6%+7.3%
+51.3%More EuroBonus members travel with SAS
The investment by SAS in increased capacity and a range of seasonal destinations generated results. The number of EuroBonus members increased and the most loyal customers flew more with SAS in 2012/2013.
16 SAS Group Annual Report November 2012–October 2013
Customers and customer offering
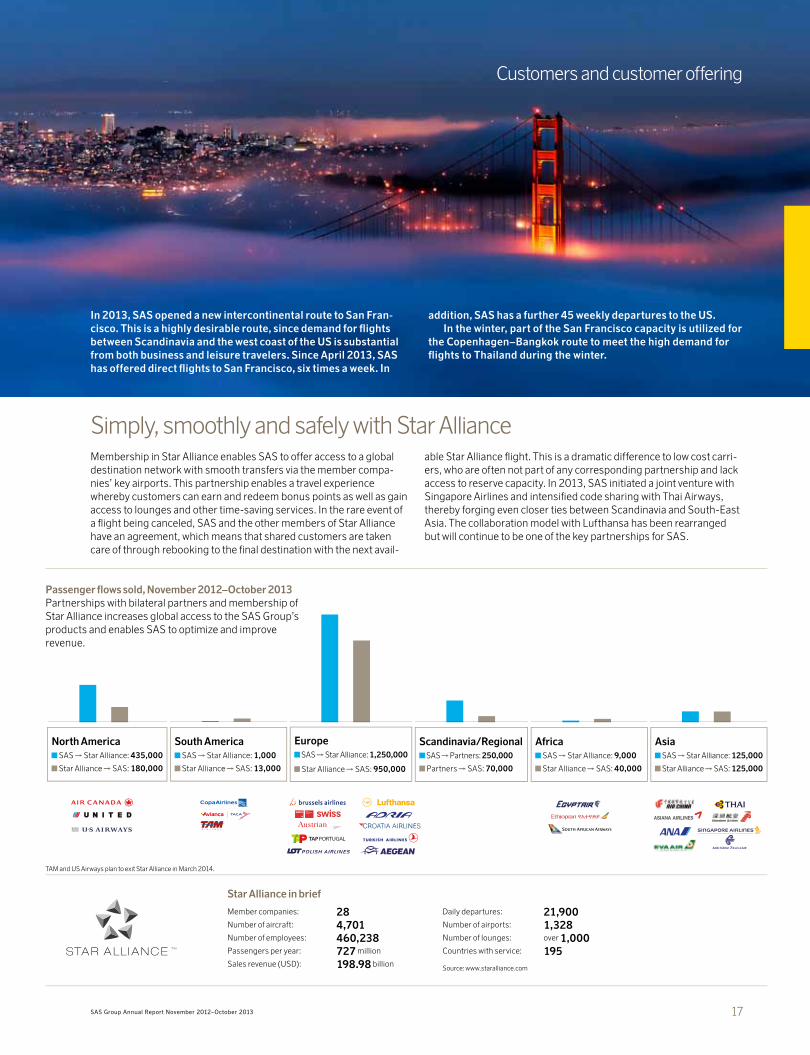
Star Alliance in brief
Member companies: 28Number of aircraft: 4,701Number of employees: 460,238Passengers per year: 727 million
Sales revenue (USD): 198.98 billion
Daily departures: 21,900
Number of airports: 1,328Number of lounges: over 1,000
Countries with service: 195
Simply, smoothly and safely with Star AllianceMembership in Star Alliance enables SAS to offer access to a global destination network with smooth transfers via the member compa-nies’ key airports. This partnership enables a travel experience whereby customers can earn and redeem bonus points as well as gain access to lounges and other time-saving services. In the rare event of a flight being canceled, SAS and the other members of Star Alliance have an agreement, which means that shared customers are taken care of through rebooking to the final destination with the next avail-
able Star Alliance flight. This is a dramatic difference to low cost carri-ers, who are often not part of any corresponding partnership and lack access to reserve capacity. In 2013, SAS initiated a joint venture with Singapore Airlines and intensified code sharing with Thai Airways, thereby forging even closer ties between Scandinavia and South-East Asia. The collaboration model with Lufthansa has been rearranged but will continue to be one of the key partnerships for SAS.
Europe SAS Star Alliance: 1,250,000
Star Alliance SAS: 950,000
North America SAS Star Alliance: 435,000
Star Alliance SAS: 180,000
South America SAS Star Alliance: 1,000
Star Alliance SAS: 13,000
Scandinavia/Regional SAS Partners: 250,000
Partners SAS: 70,000
Africa SAS Star Alliance: 9,000
Star Alliance SAS: 40,000
Asia SAS Star Alliance: 125,000
Star Alliance SAS: 125,000
Passenger flows sold, November 2012–October 2013Partnerships with bilateral partners and membership of Star Alliance increases global access to the SAS Group’s products and enables SAS to optimize and improve revenue.
In 2013, SAS opened a new intercontinental route to San Fran-cisco. This is a highly desirable route, since demand for flights between Scandinavia and the west coast of the US is substantial from both business and leisure travelers. Since April 2013, SAS has offered direct flights to San Francisco, six times a week. In
addition, SAS has a further 45 weekly departures to the US.In the winter, part of the San Francisco capacity is utilized for
the Copenhagen–Bangkok route to meet the high demand for flights to Thailand during the winter.
Source: www.staralliance.com
TAM and US Airways plan to exit Star Alliance in March 2014.
17SAS Group Annual Report November 2012–October 2013
Personnel-related key figures
2012–2013Nov–Oct
2011–2012Nov–Oct
Job satisfaction 57 63Leadership index 67 69Number of hours of training 540,0001 660,0002
Average number of employees 14,127 14,9033
of whom women, % 39 382
Sick leave, %4 8.0 7.12
Total number of occupational injuries 2801 2572
1) Excluding Widerøe 2) Applies to January–October 2012 3) Applies to the November 2011–October 2012 period 4) Applies to Scandinavian Airlines (exklusive Blue1)
Sustainable development creates valueThe Group’s work with sustainable development is always based on securing the societal, environmental and financial responsibility as well as ensuring continuous ongoing improvement efforts. Structured long-term efforts allow clear measurable improvements to be reached and sustainability-related risks to be minimized. Utilizing clearly defined management systems to maintain, for example, flight safety, HR pro-cesses, quality work and environmental management, is self evident for a professional operator in a regulated and competitive market. For example, in 2010, SAS elected to be certified in line with the ISO 14001 environmental management system and, in the 2012/2013 fiscal year, the entire operations were re-certified. This guarantees the possibility of working in a structured manner to maintain the legal requirements pertaining to the environmental impact of the Group’s operations, while the environmental improvement initiatives are placed in clearer focus by the management and Board. Finally, the management system is examined and audited by an external party, thereby creating the trans-parency and credibility that the issues merit. Furthermore, SAS allows the sustainability report to be reviewed by an external party.
The SAS Group’s stakeholders generally emphasize environmen-tal responsibility, particularly how SAS manages requirements to reduce climate-impacting emissions. Environmental responsibilities therefore comprise the largest section of the SAS Group’s reported sustainability practices. However, societal responsibility – in the wid-est sense of the term – is equally important for SAS.
Long-term sustainability initiativesTo communicate the sustainability initiatives and their results, SAS endeavors to maintain the high level of its sustainability reporting, work that is also driven by external requirements and stakeholder expectations.
The Group’s long-term goals remain firmly in place and sustain-ability reporting will maintain the high standard, for which SAS has received praise from sustainability analysts and other external appraisers.
Despite market turmoil in the airline industry during recent years, commitment to sustainability-related issues has not waned.
SAS hopes that active and structured sustainability initiatives will create increased customer loyalty. In the end, customers decide how significant sustainability aspects should be when they choose their air travel supplier. The Group’s approach is that this comprises a core issue when services are produced and encourages all stake-holders to adopt the same approach.
SAS personnelPeople ExcellencePeople Excellence is one of four core areas under the restructuring program and the Group’s employees comprise a key resource for reaching our goals.
Employee job satisfaction is measured each year and, in 2013, the results declined by 6 points to 57. The decline was attributable
Sustainability
Employee and environmental responsibility: a major competitive advantages for SAS
The overall objective for the SAS Group’s sustainability practices is to create long-term value growth for our owners and help SAS reach its targets, while safeguarding sustainability-related aspects. The 2012/2013 fiscal period was characterized by tangible changeovers and intermittent turbulent peri-ods. The Group’s sustainability efforts continued at a high intensity.
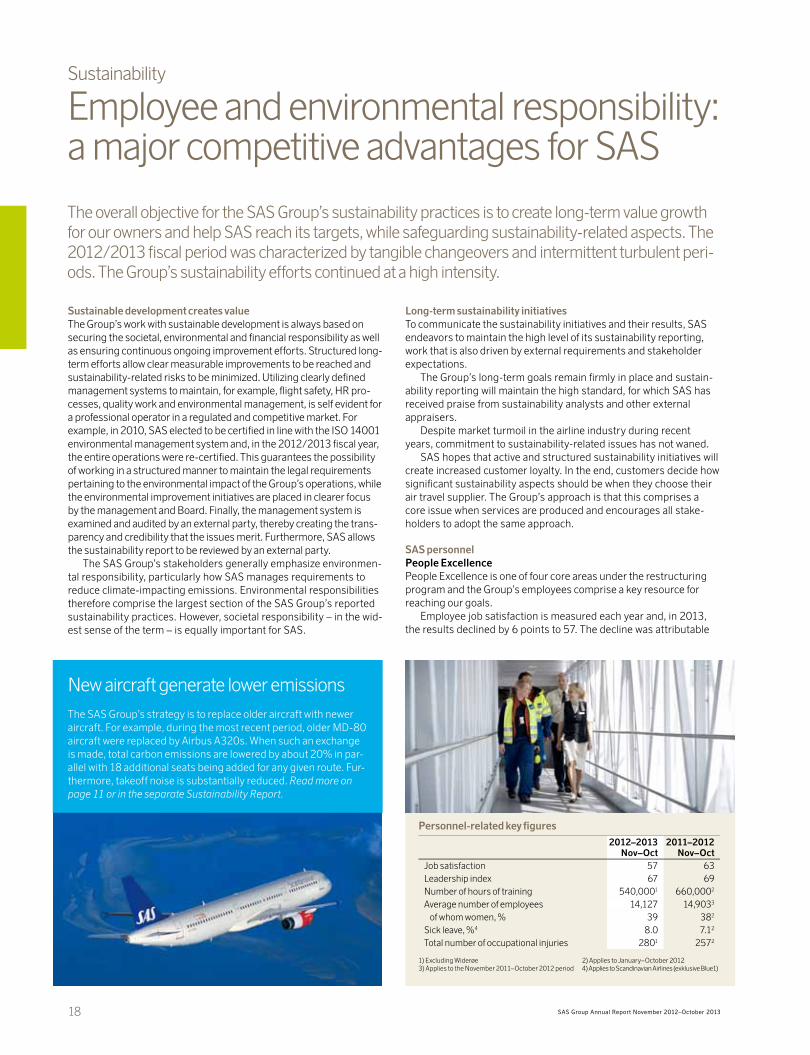
New aircraft generate lower emissionsThe SAS Group’s strategy is to replace older aircraft with newer aircraft. For example, during the most recent period, older MD-80 aircraft were replaced by Airbus A320s. When such an exchange is made, total carbon emissions are lowered by about 20% in par-allel with 18 additional seats being added for any given route. Fur-thermore, takeoff noise is substantially reduced. Read more on page 11 or in the separate Sustainability Report.
18 SAS Group Annual Report November 2012–October 2013

Environmental visionSAS intends to be part of the long-term sustainable society and supports IATA’s vision to make it possible to fly without green-house gas emissions by around 2050.
Environmental policySAS will have an environmental program on par with leading industry competitors. It should attract employees, customers, and investors and be perceived as positive by other stakeholders.
SAS will contribute to sustainable development by optimizing
resource use, seeking to use renewable energy and minimizing its environmental impact throughout its operations.
The SAS Group’s environmental programs and activities are based on continuous improvement, in line with the Group’s over-all environmental goals. Each company and unit is responsible for setting specific targets and working to reach them.
The activities within the Group’s environmental programs will be coordinated and integrated with production, quality and finan-cial activities and will comply with applicable legislation and other requirements.
Index
85
90
95
100
201320122011
110
115
120
125
130
135
140
Grams
2005 2006 2007 2008 2009 2010 Nov–Oct 2011–2012
Nov–Oct 2012–2013
2011
The climate index measures climate impact in relation to traffic measured in passenger kilometers and comprises two-thirds carbon dioxide and one-third nitrogen oxides (as indicators of other greenhouse gases). See Accounting Policies at www.sasgroup.net/miljo.
Scandinavian Airlines, Climate index Scandinavian Airlines, CO2 emissions per passenger kilometer
to the major structural changes implemented, such as the reorgani-zations, personnel cutbacks and new market terms and conditions. Despite these extensive changes, SAS employees have demon-strated consistent professionalism, which is underlined by the high level of customer satisfaction (CSI) maintained, about 71–72 for the period.
A positive collaborative climate and motivated personnel are pre-requisites for SAS remaining competitive, generating healthy earn-ings and enabling the airline to grow. SAS long-term goal is to be among the top five in the Nordic transportation sector. Three focus areas have been defined to that end:1. Stabilize and standardize SAS procedures2. Focus on leadership3. Look forward
A performance management program has been rolled out under the Peo-ple Excellence framework aimed at strengthening leadership. Leadership is measured annually in the SAS leadership index, which amounted to 67 against the benchmark of 64 for the year. In addition, an extensive training
program is conducted each year and, during the fiscal year, SAS personnel (excluding Widerøe) participated in about 540,000 hours of training.
Diversity and equalityThe SAS Group’s diversity policy is based on equal treatment of all employ-ees and all job applicants at SAS. Each year, the equal treatment plan is examined based on analysis and surveys of several factors including everything from sick leave to bullying.
Environmental responsibility at SASThe SAS approach to environmental responsibility is to ensure com-pliance with applicable regulatory requirements and continuous development, whereby emissions per passenger kilometer and total emissions are reduced over time.
SAS has targets that address both relative and absolute emissions, as well as other environment-related areas. Initiatives to realize these targets are conducted within the framework of the environmental management system.
Sustainability
19SAS Group Annual Report November 2012–October 2013
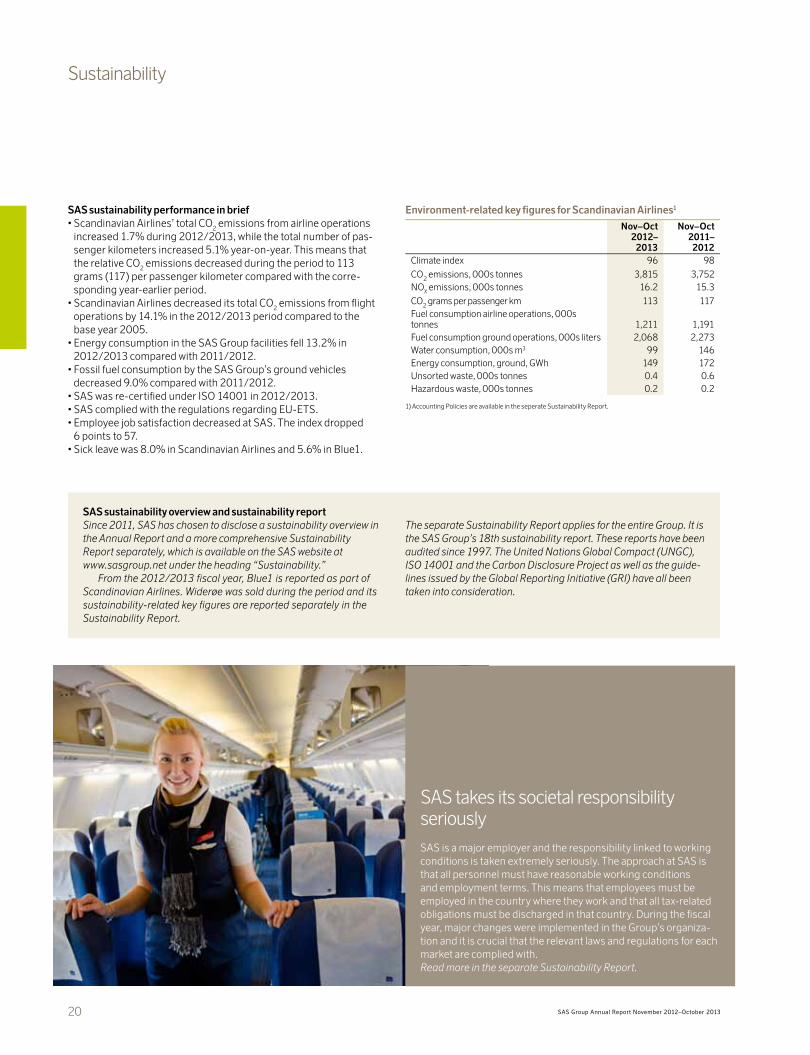
SAS takes its societal responsibility seriouslySAS is a major employer and the responsibility linked to working conditions is taken extremely seriously. The approach at SAS is that all personnel must have reasonable working conditions and employment terms. This means that employees must be employed in the country where they work and that all tax-related obligations must be discharged in that country. During the fiscal year, major changes were implemented in the Group’s organiza-tion and it is crucial that the relevant laws and regulations for each market are complied with.Read more in the separate Sustainability Report.
Sustainability
SAS sustainability performance in brief• Scandinavian Airlines’ total CO2 emissions from airline operations
increased 1.7% during 2012/2013, while the total number of pas-senger kilometers increased 5.1% year-on-year. This means that the relative CO2 emissions decreased during the period to 113 grams (117) per passenger kilometer compared with the corre-sponding year-earlier period.
• Scandinavian Airlines decreased its total CO2 emissions from flight operations by 14.1% in the 2012/2013 period compared to the base year 2005.
• Energy consumption in the SAS Group facilities fell 13.2% in 2012/2013 compared with 2011/2012.
• Fossil fuel consumption by the SAS Group’s ground vehicles decreased 9.0% compared with 2011/2012.
• SAS was re-certified under ISO 14001 in 2012/2013.• SAS complied with the regulations regarding EU-ETS.• Employee job satisfaction decreased at SAS. The index dropped
6 points to 57.• Sick leave was 8.0% in Scandinavian Airlines and 5.6% in Blue1.
Environment-related key figures for Scandinavian Airlines1
Nov–Oct2012–
2013
Nov–Oct 2011–
2012Climate index 96 98
CO2 emissions, 000s tonnes 3,815 3,752NOX emissions, 000s tonnes 16.2 15.3
CO2 grams per passenger km 113 117Fuel consumption airline operations, 000s tonnes 1,211 1,191Fuel consumption ground operations, 000s liters 2,068 2,273Water consumption, 000s m3 99 146Energy consumption, ground, GWh 149 172Unsorted waste, 000s tonnes 0.4 0.6Hazardous waste, 000s tonnes 0.2 0.2
1) Accounting Policies are available in the seperate Sustainability Report.
SAS sustainability overview and sustainability reportSince 2011, SAS has chosen to disclose a sustainability overview in the Annual Report and a more comprehensive Sustainability Report separately, which is available on the SAS website at www.sasgroup.net under the heading “Sustainability.”
From the 2012/2013 fiscal year, Blue1 is reported as part of Scandinavian Airlines. Widerøe was sold during the period and its sustainability-related key figures are reported separately in the Sustainability Report.
The separate Sustainability Report applies for the entire Group. It is the SAS Group’s 18th sustainability report. These reports have been audited since 1997. The United Nations Global Compact (UNGC), ISO 14001 and the Carbon Disclosure Project as well as the guide-lines issued by the Global Reporting Initiative (GRI) have all been taken into consideration.
20 SAS Group Annual Report November 2012–October 2013

Sustainability
Read more about the SAS Group’s sustainability efforts in the separate Sustainability Report on www.sasgroup.net/miljo
Environmental target Outcome 2012/2013 Priorities 2014
SAS will reduce flight emissions by 20% in 2015 compared with 2005.
During the 2012/2013 fiscal year, SAS replaced 26 MD-80s and Boeing 737 Classics with 21 more effi-cient and quieter Boeing 737 Next Generations and Airbus A320s.
The SAS Group’s fuel-saving efforts under the frame-work of the SAS transition initiative continued during the period and generated increased fuel efficiency of 1.6% compared with the year-earlier period. Examples of activities that have been completed include the mod-ification of existing aircraft and more efficient proce-dures, etc.
Together, these actions resulted in a decline in emis-sions per passenger kilometer of 3.2% in 2012/2013 compared with 2011/2012. Since the base year in 2005, emissions have declined 16.0%.
In the 2013/2014 fiscal year, addi-tional Boeing 737 Next Generations and Airbus A320s will be phased into the SAS fleet. The fuel-saving efforts under the framework of the SAS transition initiative continues with undiminished vigor.
SAS will reduce energy consumption in buildings by 15% in 2015 compared with 2010.
Total energy consumption in the SAS Group facilities fell 13.2% in 2012/2013 compared with 2012. Since the base year in 2010, consumption has declined 24.8%.
SAS continues to seek methods for reducing energy consumption. The office space utilized will be reduced in conjunction with the organiza-tional changes, which is expected to lead to reduced energy consumption.
SAS will reduce ground-vehicle consumption of fossil fuels by 10% at the Group’s major airports in Scandinavia by 2015 compared with 2010.
Total fuel consumption by the SAS Group ground vehicles fell 9.0% in 2012/2013 compared with 2012. Since the base year in 2010, consumption has declined 33.4%.
Initiatives will continue to be imple-mented. This pertains primarily to further enhancing procedural effi-ciency.
SAS will reduce takeoff noise by 15% in 2015 compared with 2010.
Through the introduction of quieter aircraft, the area exposed to noise levels of 85 dB on takeoffs declined 8.7% in 2012/2013 compared with 2012. Since the base year in 2010, noise has been reduced 10.9%.
The continued introduction of newer and quieter aircraft, as well as the focus on more efficient procedures will support reaching the targets.
The environmental goals up to 2015 will lay the basis for ensuring that SAS operations are sustainable in the long-term
21SAS Group Annual Report November 2012–October 2013

Airline industry
Conditions ripe for growth in the SAS Group’s markets
While on the one hand, the airline industry is char-acterized by intense competition and stringent streamlining requirements, it is also characterized by healthy growth. Continuous efficiency enhancements in combination with the liberaliza-tion of the industry in the 1990s contributed to fundamental changes in the airline industry.
New business models have required existing airlines to implement additional streamlining measures. The pressure to continue enhanc-ing efficiency is also expected to continue characterizing the industry moving forward. In parallel, the airline industry has posted healthy growth for many years. Since the 1970s, global airline traffic has risen by slightly more than 6% per year and, moving forward, contin-ued advantageous growth is expected of about 5% each year. In 2013, the Scandinavian air travel market is expected to turnover slightly more than SEK 70 billion.
Air travel market in the Nordic regionIn relation to its population, the Nordic market is relatively large com-pared with the rest of Europe. In the Nordic region, each person flies almost four times per year compared with about two times per year in the rest of Europe.
In particular, it is the short-haul routes that people in Scandinavia choose to fly to a greater extent than people in other parts of Europe and the world. Key reasons for this are the relatively long distances in the Nordic region, difficult topography, relatively small towns and the fact that the Nordic Region is largely surrounded by sea, which makes other forms of transport time-consuming. Accordingly, short-haul flights are the core business and main focus for SAS. This is also a busi-ness that SAS primarily operates itself, unlike many network airlines in Europe who have outsourced parts of European production to their own LCCs or production companies. The restructuring program allows SAS to create the necessary operational conditions to compete competi-tively with LCCs in Europe and in the expanding leisure travel market.
Liberalization and increased competitionLiberalization of the air travel market in the Nordic region started at the beginning of the 1990s. Formal liberalization of the Swedish domestic
market took place in 1992. The Norwegian and Danish markets were lib-eralized in 1994 and 1995. By the mid-1990s, all companies from EU/EEA countries were free to establish air traffic services in Scandinavia.
New business models, such as LCCs have arisen. The impact from LCCs on existing network airlines differs according to the net-work, offering and airports used. Many new LCCs means that the total market has grown and existing airlines have continued to fly at, largely, unchanged volumes. New, more efficient business models have also put pressure on existing airlines and required additional efficiency enhancements since the turn of the century. Competition in Europe remains intense, which is illustrated by the low EBIT mar-gins expected by airlines in Europe in 2013. Enhanced efficiency and a slightly more stable European economy meant that in Decem-ber 2013, IATA projected an improvement in net earnings for airlines in Europe in 2014 to USD 3.2 billion.
Enhanced balance between supply and demandSince 2000, capacity growth in the Group’s home market has primar-ily stemmed from LCCs. Since 2010, indications point to growth lev-eling off and LCCs’ total share of capacity stagnating. This is partly due to the bankruptcy of certain LCCs. Through its enhanced cost base, SAS is favorably positioned to profitably compete with LCCs in their more traditional leisure travel segment.
Increased leisure travelThe enhanced efficiency of the airline industry means that leisure travel has become more affordable. This, in combination with greater utiliza-tion of digital meeting forms by businesses, means that IATA expects close to 80% of market growth by 2020 to stem from leisure travel.
Capacity and traffic trendsFlight capacity increased on a global basis by 6–7% in 2013 accord-ing to IATA. In Europe the increase was 2–3%. The trend in Europe differed between markets. Capacity rose about 1% in Southern Europe, about 2% in Central Europe and about 8% in Northern Europe.
Capacity growth in Northern Europe exceeded Scandinavian Air-lines’ growth of 6%. Moving forward, Airbus and Boeing project that global traffic will increase about 5% by 2030 and about 3% in Europe.
In 2014, capacity in Scandinavia is expected to continue growing. SAS plans to increase scheduled capacity by 3–4% in the 2013/2014 fiscal year.
–1
0
1
2
3
4
5
6
7
NorthAmerica
Asia-Pacificregion
MiddleEast
LatinAmerica
EuropeAfrica
EBIT margin, IATA forecast%
Source: IATA, December 2013
Examples of European network airline companies that outsource production in Europe to LCCs
2013 2014
22 SAS Group Annual Report November 2012–October 2013
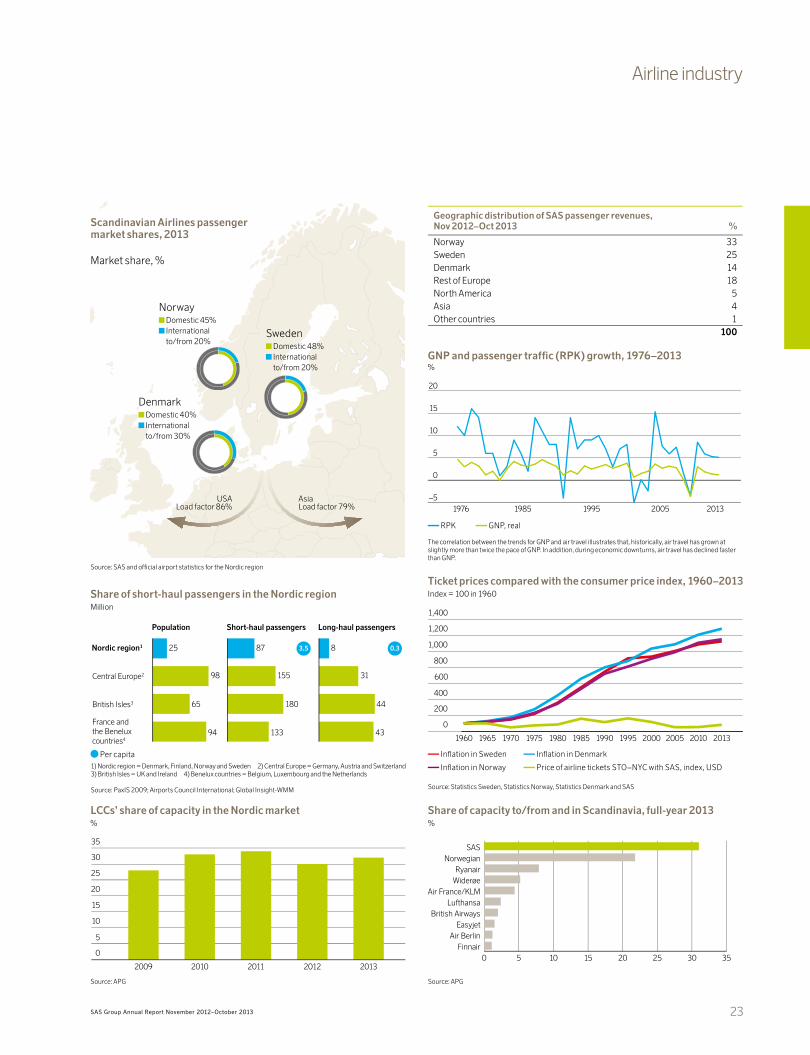
Airline industry
In�ation, SE
In�ation, DK
In�ation, NO
Flygpris STO-NYC med SAS, index, USD
201320102005200019951990198519801975197019651960
0
200
400
600
800
1,400
1,000
1,200
Ticket prices compared with the consumer price index, 1960–2013Index = 100 in 1960
Inflation in Sweden Inflation in Denmark
Inflation in Norway Price of airline tickets STO–NYC with SAS, index, USD
RPK GNP, real The correlation between the trends for GNP and air travel illustrates that, historically, air travel has grown at slightly more than twice the pace of GNP. In addition, during economic downturns, air travel has declined faster than GNP.
Source: Statistics Sweden, Statistics Norway, Statistics Denmark and SAS
1) Nordic region = Denmark, Finland, Norway and Sweden 2) Central Europe = Germany, Austria and Switzerland3) British Isles = UK and Ireland 4) Benelux countries = Belgium, Luxembourg and the Netherlands Source: PaxIS 2009; Airports Council International; Global Insight-WMM
20132012201120102009
0
5
10
15
20
25
30
35
0 5 10 15 20 25 30 35Finnair
Air BerlinEasyjet
British AirwaysLufthansa
Air France/KLMWiderøeRyanair
NorwegianSAS
LCCs’ share of capacity in the Nordic market%
Share of capacity to/from and in Scandinavia, full-year 2013%
Source: APG Source: APG
Scandinavian Airlines passenger market shares, 2013
Market share, %
Norway Domestic 45% International to/from 20%
Denmark Domestic 40% International to/from 30%
Sweden Domestic 48% International to/from 20%
Geographic distribution of SAS passenger revenues, Nov 2012–Oct 2013 %
Norway 33Sweden 25Denmark 14Rest of Europe 18North America 5Asia 4Other countries 1
100
Source: SAS and official airport statistics for the Nordic region
RPK
BNP, real
20132005199519851976–5
0
5
10
15
20
GNP and passenger traffic (RPK) growth, 1976–2013%
Nordic region1
Population Short-haul passengers Long-haul passengers
Central Europe2
British Isles3
France and the Benelux countries4
25 87 8
98 155 31
65 180 44
94 133 43
3.5 0.3
Share of short-haul passengers in the Nordic regionMillion
Per capita
USA Load factor 86%
Asia Load factor 79%
23SAS Group Annual Report November 2012–October 2013
Policy framework for civil aviation
Regulations define the framework of the airline industry
Political and administrative decisions at national or EU level have a major strategic and economic significance for the airline industry. Extensive effort is invested to influence these develop-ments, both by SAS and by our trade organiza-tions IATA and AEA.
The IATA and AEA trade organizationsThe airline industry attempts actively to influence civil aviation regu-lation through the IATA and AEA bodies, to the benefit of the entire industry and the airlines’ customers.
The International Air Transport Association (IATA) is a global organization with 240 member companies (84% of all global air traf-fic). The IATA has a central role through its contact with government agencies worldwide.
The Association of European Airlines (AEA), based in Brussels, acts as the contact for European airlines with the EU’s institutions. Currently, the AEA has 29 member companies.
SAS is a member of both the IATA and the AEA, and the President and CEO of SAS was elected to the boards of both organizations in 2013.
Developments in the EU in 2013Since 2012, all air traffic to, from and within the EU has been included in the European emissions trading system (ETS). However, heavy criticism from a large number of non-EU states, resulted in a decision to exempt traffic to and from the EU until recognition of a global solution for the issue under the International Civil Aviation Organization (ICAO). At the October 2013 ICAO conference, an agreement was reached to prepare a global system for market-based measures, for approval at the next con-ference in 2016 and implementation in 2020. New compromises on this issue continue to be discussed in the EU system.
During the year, the European Commission presented a pro-posed revision of Regulation 261/2004, which governs compensa-tion and assistance to passengers in the event of delays and denied boarding. The proposal entails some measure of relief for the indus-try while posing problems in other areas. The final outcome will be reported after a parliamentary hearing in 2014.
Faced with the difficulties in implementing a Single European Sky,
the Commission has presented a new package of measures aimed at accelerating the process. The proposal, which involves the transfer of certain management and control functions to supranational bodies, has been met with considerable scepticism by many member states. However, the airline industry deems it entirely necessary to meet future traffic flow trends and reduce the cost of air traffic control.
Towards the end of the year, a proposal was presented to regu-late state and regional support to airports and from airports to air-lines due to the extensive support provided to many regional air-ports around Europe and consequent distortion of competition. Direct support is also provided by state/municipal airports to air-lines without any transparency. The guidelines are aimed at ensur-ing equal competition and are expected to apply from early 2014.
The Cape Town ConventionThe Cape Town Convention standardizes transactions pertaining to mobile equipment (including, aircraft equipment). The Convention cre-ates international standards for the registration of ownership, collateral and security as well as various legal procedures in the event of a sus-pension in payments. The Convention has been ratified by some fifty states, including Norway. SAS has proposed that Denmark and Sweden ratify the Convention, since it enables more advantageous terms to be obtained when financing items including aircraft and engines.
EuroBonus points on domestic Norwegian flightsFollowing a protracted legal and political process, in May 2013, the Norwegian government decided that the ban on loyalty programs on domestic Norwegian routes should cease with immediate effect. SAS welcomes the decision, which, over an extended period, has discrimi-nated against the SAS business model.
Creative employment terms“Flagging” has become more prominent in the Scandinavian airline industry during the past year, with several of the Group’s closest com-petitors at the forefront. The issues around outsourcing are of funda-mental importance and concern, since this enables Scandinavian leg-islation pertaining to employment terms, taxes and social security expenses to be circumvented, and undermines the principle of equal competition. The issue has been noted at both national and EU level but no concrete measures are yet in place.
Infrastructure costsUnlike other forms of transport, the airline industry defrays all of the costs for using its infrastructure through fees paid for access to air-ports and air traffic control services. During the fiscal year, Scandina-vian Airlines’ infrastructure costs amounted to MSEK 7,348. Part of the cost is charged to the Group’s earnings and the remainder is paid by passengers to the respective suppliers via the airline. The monop-oly structure of suppliers means that airlines often find themselves in an unequal battle when trying to reduce the fees.
Scandinavian Airlines infrastructure costs, Nov 2012–Oct 2013, MSEK
Government user fees
Overflight fees Total
Denmark 1,167 162 1,329Norway 1,692 254 1,946Sweden 925 383 1,308International 1,900 866 2,766Scandinavian Airlines, total 5,683 1,665 7,348
Air traffic rights and takeoff/landing rights (known as slots)For an airline to operate commercial air traffic, it must have both air traffic rights and slots. Air traffic rights are permits to conduct air traffic between two (or more) countries that have been negotiated by individual states or at EU level. Air traffic within the EU and between the EU and the US is now, essen-tially, fully liberalized.
Slots are allocated ahead of each season (summer and winter) at each individual airport in line with rules established at IATA and approved by governing bodies, essentially, in the entire world. Slots are allocated by an independent coordina-tor. Priority is given to airlines that have previously used a specific arrival/departure time. Slots at airports with heavy traffic loads, for example, London Heathrow, can have a sub-stantial commercial value and a certain degree of secondary market trading takes place. The European Commission has proposed a set of rules and regulations for this trading.
24 SAS Group Annual Report November 2012–October 2013
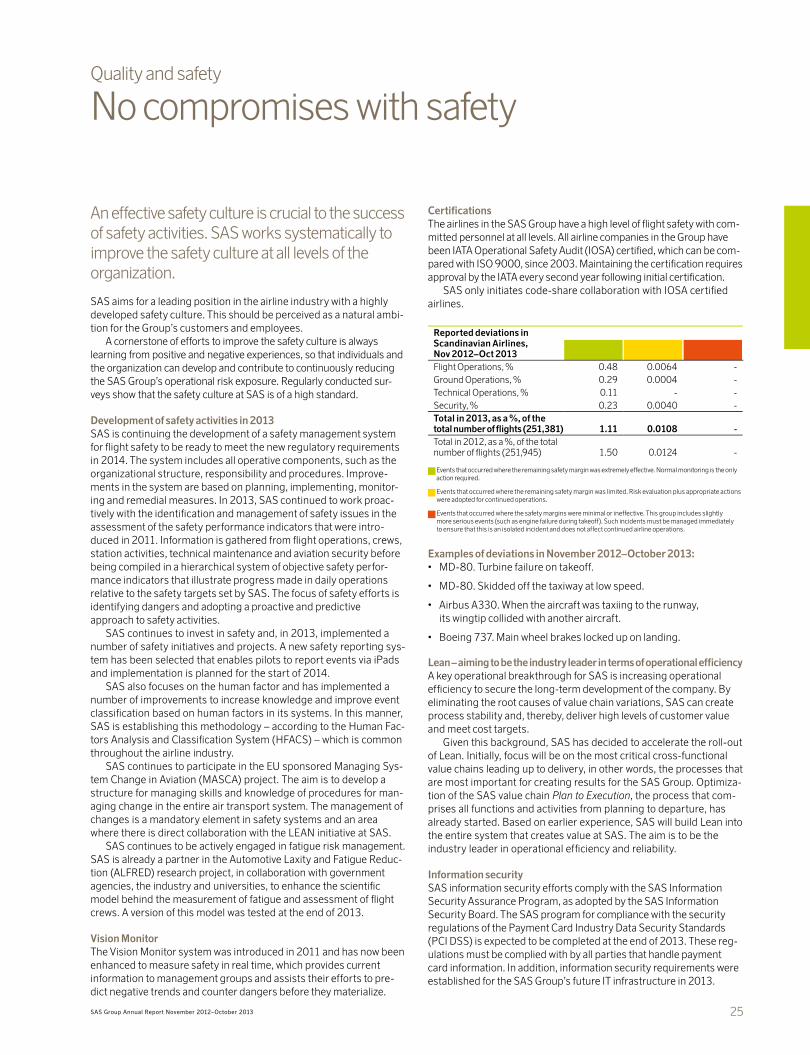
Quality and safety
No compromises with safety
An effective safety culture is crucial to the success of safety activities. SAS works systematically to improve the safety culture at all levels of the organization.
SAS aims for a leading position in the airline industry with a highly developed safety culture. This should be perceived as a natural ambi-tion for the Group’s customers and employees.
A cornerstone of efforts to improve the safety culture is always learning from positive and negative experiences, so that individuals and the organization can develop and contribute to continuously reducing the SAS Group’s operational risk exposure. Regularly conducted sur-veys show that the safety culture at SAS is of a high standard.
Development of safety activities in 2013SAS is continuing the development of a safety management system for flight safety to be ready to meet the new regulatory requirements in 2014. The system includes all operative components, such as the organizational structure, responsibility and procedures. Improve-ments in the system are based on planning, implementing, monitor-ing and remedial measures. In 2013, SAS continued to work proac-tively with the identification and management of safety issues in the assessment of the safety performance indicators that were intro-duced in 2011. Information is gathered from flight operations, crews, station activities, technical maintenance and aviation security before being compiled in a hierarchical system of objective safety perfor-mance indicators that illustrate progress made in daily operations relative to the safety targets set by SAS. The focus of safety efforts is identifying dangers and adopting a proactive and predictive approach to safety activities.
SAS continues to invest in safety and, in 2013, implemented a number of safety initiatives and projects. A new safety reporting sys-tem has been selected that enables pilots to report events via iPads and implementation is planned for the start of 2014.
SAS also focuses on the human factor and has implemented a number of improvements to increase knowledge and improve event classification based on human factors in its systems. In this manner, SAS is establishing this methodology – according to the Human Fac-tors Analysis and Classification System (HFACS) – which is common throughout the airline industry.
SAS continues to participate in the EU sponsored Managing Sys-tem Change in Aviation (MASCA) project. The aim is to develop a structure for managing skills and knowledge of procedures for man-aging change in the entire air transport system. The management of changes is a mandatory element in safety systems and an area where there is direct collaboration with the LEAN initiative at SAS.
SAS continues to be actively engaged in fatigue risk management. SAS is already a partner in the Automotive Laxity and Fatigue Reduc-tion (ALFRED) research project, in collaboration with government agencies, the industry and universities, to enhance the scientific model behind the measurement of fatigue and assessment of flight crews. A version of this model was tested at the end of 2013.
Vision MonitorThe Vision Monitor system was introduced in 2011 and has now been enhanced to measure safety in real time, which provides current information to management groups and assists their efforts to pre-dict negative trends and counter dangers before they materialize.
CertificationsThe airlines in the SAS Group have a high level of flight safety with com-mitted personnel at all levels. All airline companies in the Group have been IATA Operational Safety Audit (IOSA) certified, which can be com-pared with ISO 9000, since 2003. Maintaining the certification requires approval by the IATA every second year following initial certification.
SAS only initiates code-share collaboration with IOSA certified airlines.
Reported deviations in Scandinavian Airlines, Nov 2012–Oct 2013Flight Operations, % 0.48 0.0064 -Ground Operations, % 0.29 0.0004 -Technical Operations, % 0.11 - -Security, % 0.23 0.0040 -Total in 2013, as a %, of the total number of flights (251,381) 1.11 0.0108 -Total in 2012, as a %, of the total number of flights (251,945) 1.50 0.0124 -
Events that occurred where the remaining safety margin was extremely effective. Normal monitoring is the only action required.
Events that occurred where the remaining safety margin was limited. Risk evaluation plus appropriate actions were adopted for continued operations.
Events that occurred where the safety margins were minimal or ineffective. This group includes slightly more serious events (such as engine failure during takeoff). Such incidents must be managed immediately to ensure that this is an isolated incident and does not affect continued airline operations.
Examples of deviations in November 2012–October 2013: • MD-80. Turbine failure on takeoff.
• MD-80. Skidded off the taxiway at low speed.
• Airbus A330. When the aircraft was taxiing to the runway, its wingtip collided with another aircraft.
• Boeing 737. Main wheel brakes locked up on landing.
Lean – aiming to be the industry leader in terms of operational efficiencyA key operational breakthrough for SAS is increasing operational efficiency to secure the long-term development of the company. By eliminating the root causes of value chain variations, SAS can create process stability and, thereby, deliver high levels of customer value and meet cost targets.
Given this background, SAS has decided to accelerate the roll-out of Lean. Initially, focus will be on the most critical cross-functional value chains leading up to delivery, in other words, the processes that are most important for creating results for the SAS Group. Optimiza-tion of the SAS value chain Plan to Execution, the process that com-prises all functions and activities from planning to departure, has already started. Based on earlier experience, SAS will build Lean into the entire system that creates value at SAS. The aim is to be the industry leader in operational efficiency and reliability.
Information securitySAS information security efforts comply with the SAS Information Security Assurance Program, as adopted by the SAS Information Security Board. The SAS program for compliance with the security regulations of the Payment Card Industry Data Security Standards (PCI DSS) is expected to be completed at the end of 2013. These reg-ulations must be complied with by all parties that handle payment card information. In addition, information security requirements were established for the SAS Group’s future IT infrastructure in 2013.
25SAS Group Annual Report November 2012–October 2013
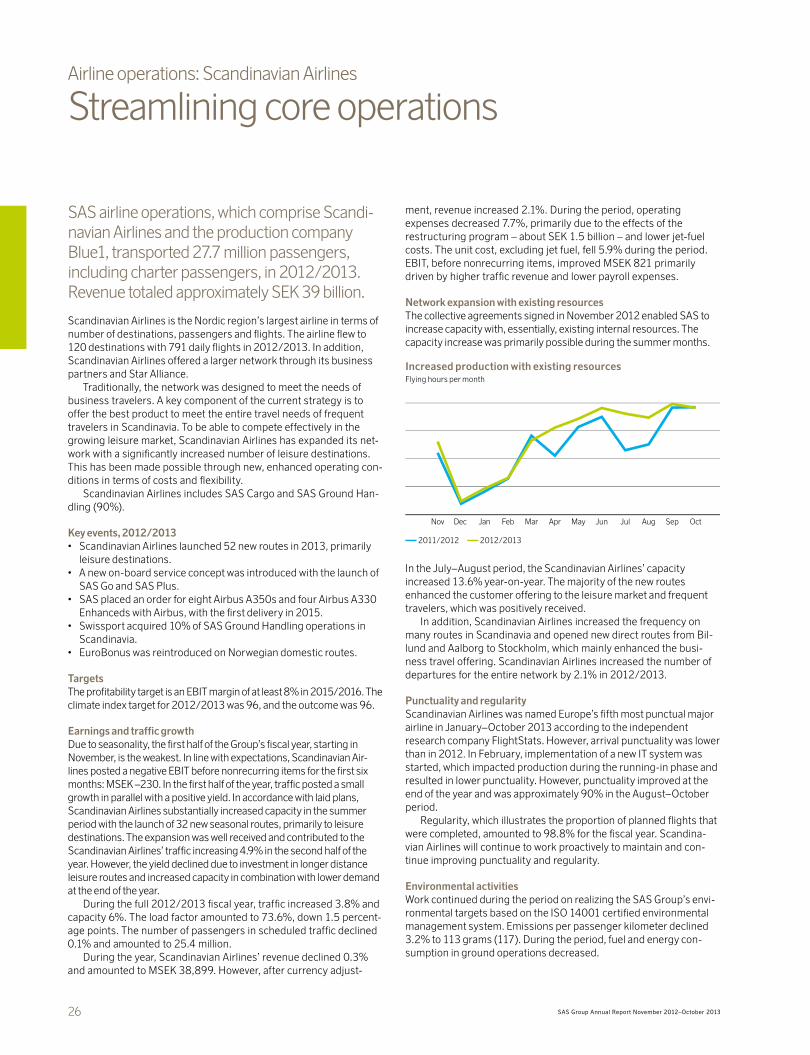
Airline operations: Scandinavian Airlines
Streamlining core operations
SAS airline operations, which comprise Scandi-navian Airlines and the production company Blue1, transported 27.7 million passengers, including charter passengers, in 2012/2013. Revenue totaled approximately SEK 39 billion.
Scandinavian Airlines is the Nordic region’s largest airline in terms of number of destinations, passengers and flights. The airline flew to 120 destinations with 791 daily flights in 2012/2013. In addition, Scandinavian Airlines offered a larger network through its business partners and Star Alliance.
Traditionally, the network was designed to meet the needs of business travelers. A key component of the current strategy is to offer the best product to meet the entire travel needs of frequent travelers in Scandinavia. To be able to compete effectively in the growing leisure market, Scandinavian Airlines has expanded its net-work with a significantly increased number of leisure destinations. This has been made possible through new, enhanced operating con-ditions in terms of costs and flexibility.
Scandinavian Airlines includes SAS Cargo and SAS Ground Han-dling (90%).
Key events, 2012/2013• Scandinavian Airlines launched 52 new routes in 2013, primarily
leisure destinations.• A new on-board service concept was introduced with the launch of
SAS Go and SAS Plus.• SAS placed an order for eight Airbus A350s and four Airbus A330
Enhanceds with Airbus, with the first delivery in 2015.• Swissport acquired 10% of SAS Ground Handling operations in
Scandinavia.• EuroBonus was reintroduced on Norwegian domestic routes.
TargetsThe profitability target is an EBIT margin of at least 8% in 2015/2016. The climate index target for 2012/2013 was 96, and the outcome was 96.
Earnings and traffic growth Due to seasonality, the first half of the Group’s fiscal year, starting in November, is the weakest. In line with expectations, Scandinavian Air-lines posted a negative EBIT before nonrecurring items for the first six months: MSEK –230. In the first half of the year, traffic posted a small growth in parallel with a positive yield. In accordance with laid plans, Scandinavian Airlines substantially increased capacity in the summer period with the launch of 32 new seasonal routes, primarily to leisure destinations. The expansion was well received and contributed to the Scandinavian Airlines’ traffic increasing 4.9% in the second half of the year. However, the yield declined due to investment in longer distance leisure routes and increased capacity in combination with lower demand at the end of the year.
During the full 2012/2013 fiscal year, traffic increased 3.8% and capacity 6%. The load factor amounted to 73.6%, down 1.5 percent-age points. The number of passengers in scheduled traffic declined 0.1% and amounted to 25.4 million.
During the year, Scandinavian Airlines’ revenue declined 0.3% and amounted to MSEK 38,899. However, after currency adjust-
ment, revenue increased 2.1%. During the period, operating expenses decreased 7.7%, primarily due to the effects of the restructuring program – about SEK 1.5 billion – and lower jet-fuel costs. The unit cost, excluding jet fuel, fell 5.9% during the period. EBIT, before nonrecurring items, improved MSEK 821 primarily driven by higher traffic revenue and lower payroll expenses.
Network expansion with existing resourcesThe collective agreements signed in November 2012 enabled SAS to increase capacity with, essentially, existing internal resources. The capacity increase was primarily possible during the summer months.
In the July–August period, the Scandinavian Airlines’ capacity increased 13.6% year-on-year. The majority of the new routes enhanced the customer offering to the leisure market and frequent travelers, which was positively received.
In addition, Scandinavian Airlines increased the frequency on many routes in Scandinavia and opened new direct routes from Bil-lund and Aalborg to Stockholm, which mainly enhanced the busi-ness travel offering. Scandinavian Airlines increased the number of departures for the entire network by 2.1% in 2012/2013.
Punctuality and regularityScandinavian Airlines was named Europe’s fifth most punctual major airline in January–October 2013 according to the independent research company FlightStats. However, arrival punctuality was lower than in 2012. In February, implementation of a new IT system was started, which impacted production during the running-in phase and resulted in lower punctuality. However, punctuality improved at the end of the year and was approximately 90% in the August–October period.
Regularity, which illustrates the proportion of planned flights that were completed, amounted to 98.8% for the fiscal year. Scandina-vian Airlines will continue to work proactively to maintain and con-tinue improving punctuality and regularity.
Environmental activitiesWork continued during the period on realizing the SAS Group’s envi-ronmental targets based on the ISO 14001 certified environmental management system. Emissions per passenger kilometer declined 3.2% to 113 grams (117). During the period, fuel and energy con-sumption in ground operations decreased.
OctSepAugJulJunMayAprMarFebJanDec Nov
Increased production with existing resourcesFlying hours per month
2011/2012 2012/2013
26 SAS Group Annual Report November 2012–October 2013

Operational key figures
Nov–Oct 2012–2013
Nov–Oct 2011–2012
Market share, home market, % 29 30Number of scheduled passengers, 000s 25,446 25,467Passenger kilometers (RPK), million 28,854 27,798Available seat km (ASK), million 39,202 36,996Passenger load factor, % 73.6 75.1Yield, currency-adjusted change, % –0.4 –1.0RASK, change, % –3.2 +1.1Total unit cost, change, % –6.0 –0.1Number of destinations 120 113Average flight distance, scheduled, km 861 844Number of daily departures, annual average 791 773Number of departures per destination/day 6.6 6.8Number of aircraft 139 145Aircraft, block hours/day 8.7 8.2Number of pilots 1,413 1,3281
Pilots, block hours 665 659Number of cabin crew 2,607 2,6131
Cabin crew, block hours 721 674Regularity, % 98.8 99.0Punctuality, % within 15 min. 86.2 89.4
Other key figures
Nov–Oct 2012–2013
Nov–Oct 2011–2012
Customer satisfaction 71 72Climate index 96 98Carbon dioxide (CO2), 000s tonnes 3,815 3,752Nitrogen oxides (NOX), 000s tonnes 16.2 15.3Average number of employees 12,884 13,604
of whom women, % 40 381
Total sick leave, %2 8.0 7.11
Total No. of occupational injuries 280 2571
> 1 day sick leave
1) Pertains to January–October 2012. 2) Excluding Blue1.
Airline operations: Scandinavian Airlines
Aircraft fleetScandinavian Airlines has an extensive network of destinations with varied passenger volumes and distances, which requires a fleet with aircraft of varying size and range to make the customer offering attractive to more frequent travelers. In October 2013, Scandinavian Airlines including Blue1 had an aircraft fleet comprising 139 aircraft in service, a reduction of six aircraft compared with October 2012. The fleet comprised 11 long-haul aircraft, 116 short-haul aircraft, and 12 regional jets. In addition, SAS wet leased 12 aircraft: four CRJ200s, four ATR-72s and four S2000s.
The average age of the aircraft fleet in service was 10.9 years, down about two years compared with October 2012. During the year, 19 MD-80s and seven Boeing 737 Classics were phased out of service. SAS sold nine MD-80s during the period. In parallel, the aircraft fleet was rejuvenated through nine Boeing 737 Next Genera-tions and 12 Airbus A320s being phased into the fleet. SAS also phased one Boeing 737-600 out of service.
Operations in Scandinavian AirlinesSAS Ground HandlingSAS Ground Handling is a leading developer of services that enable fast and flexible check-in and boarding. In Scandinavia, ground hand-ling services are performed by SAS Ground Handling. Outside Scan-dinavia, while these services are outsourced, they are carried out under the management or supervision of Scandinavian Airlines per-sonnel.
A relatively large portion of the services provided by SAS Ground Handling consists of services that are sold to other airlines that operate in Scandinavia, such as other airlines in Star Alliance.
During the year, a letter of intent was signed with Swissport regarding the divestment of SAS Ground Handling. As a first step, 10% of Ground Handling was sold to Swissport in October 2013.
Financial key figures, MSEK
Nov–Oct 2012–2013
Nov–Oct 2011–2012
Revenue 38,899 39,007of which passenger revenue 28,907 28,668EBITDAR 5,067 2,349EBIT before nonrecurring items 1,688 867EBIT margin before nonrecurring items, % 4.3 2.2EBT before nonrecurring items 1,138 42
–15
–10
–5
0
5
10Nordamerika
Asien
Europa
Sep2013
Jan2013
Jan2012
Jun2011
Annual freight growth (FTK), IATA%
Europe Asia North America
In 2012/2013, the amount of delayed baggage averaged 6.4 bags per 1,000 passengers, the second lowest proportion measured since 2003.
2012/2013
Jan–Oct
2012
201120102009200820072006200520042003
0
3
6
9
12
15
Delayed baggage, number per 1,000 passengers
27SAS Group Annual Report November 2012–October 2013

Divested operations: Widerøe
Sale of Widerøe completedWiderøe’s Flyveselskap AS is an airline based in Norway that operates regional flights. Until Septem-ber 30, 2013, when 80% of the company was sold to a group of investors comprising Torghatten ASA, Fjord1 AS and Nordland County Council, the company was wholly owned by SAS.
Key events in 2012/2013• For the third consecutive year Widerøe won the Domestic Airline of
the Year award at the Grand Travel Awards in Norway.• Widerøe won the procurement of the routes in Finnmark and Nord-
Troms for the period April 15, 2013–March 31, 2017.• Widerøe introduced EuroBonus on Norwegian domestic routes in
May 2013.• On September 30, 2013, SAS sold 80% of its shareholding in
Widerøe to a Norwegian group of investors.
Earnings and market performanceWiderøe is reported as consolidated operations for the period November 2012–September 2013, which means that Widerøe’s earnings are included up to and including September 2013, that is for 11 months. Despite intensifying competition, the number of pas-sengers increased 6.1% year-on year to 2.6 million. The growth was attributable to new routes to Florø and Røros as well as raised fre-quencies on existing routes. In total, capacity increased 8% until September, of which Norwegian domestic routes represented the largest increase, with 9.7%. Capacity on international routes increased 2.8%. The load factor declined 0.7 percentage points to 57.7%. The decline in the load factor reflected Widerøe’s increase in capacity on the short-haul domestic routes, which, in general, have a lower load factor. The network change contributed to a 3.8% increase in Widerøe’s yield.
In the November 2012 to September 2013 period, revenue amounted to MSEK 3,703 due to increased passenger numbers and a higher yield. Operating expenses totaled MSEK 3,207. EBT before nonrecurring items was MSEK 206. Earnings were negatively impacted by a cabin crew strike for four days in May and increased maintenance costs.
From October 1, 2013, SAS reports its remaining shareholding in Widerøe in the balance sheet under other securities holdings.
Financial key figures, MSEK
Nov–Sep 2012–
2013
Nov–Oct 2011–
2012Revenue 3,703 3,922 of which passenger revenue 2,832 2,932EBITDAR 496 575EBIT before nonrecurring items 214 285EBIT margin before nonrecurring items, % 5.8 7.3EBT before nonrecurring items 206 279
Operational key figures
Nov–Sep 2012–
2013
Nov–Oct 2011–
2012Market share, home market, % 18 18Number of scheduled passengers, 000s 2,611 2,722Passenger kilometers (RPK), million 796 823Available seat km (ASK), million 1,381 1,410Passenger load factor, % 57.7 58.4Yield, currency-adjusted change, % 3.81 3.52
RASK, change, % 2.11 0.12
Total unit cost, change, % 4.61 8.42
Number of destinations 47 482
Average flight distance, scheduled, km 237 2302
Number of daily departures, annual average 312 3432
Number of departures per destination/day 6.6 7.12
Number of aircraft 42 39Aircraft, block hours/day 6.4 6.9Pilots, block hours 474 485Cabin crew, block hours 486 494Regularity, % 95.2 96.32
Punctuality, % within 15 min. 86.3 87.62
1) Estimated compared with the November 2011–October 2012 period. 2) Pertains to the January–October 2012 period.
SAS Cargo Group Cargo space in Scandinavian Airlines’ aircraft is marketed and sold through the SAS Cargo Group, which serves a global market. SAS Cargo Group is market leader in airmail and air-freight to, from and within Scandinavia through high quality, competitive products and prices.
During 2012/2013, the market for airmail and air-freight was characterized by significant overcapacity and, therefore, substantial price pressure.
Freight volumes increased about 3% year-on-year. Despite challeng-ing market conditions and price pressure, SAS Cargo Group gener-ated positive earnings in the fiscal year, which was an improvement on the year-earlier period.
SpiritSpirit operates the Group’s air cargo activities on the ground. Opera-tionally, the company is closely aligned with SAS Cargo, but revenue is mainly attributable to external customers.
Airline operations: Scandinavian Airlines / Widerøe
28 SAS Group Annual Report November 2012–October 2013

Financial position
Continued focus on financial stability
The financial position of SAS improved in 2012/2013 due to increased profitability, positive cash flow and the sale of assets. A healthy financial position is crucial for managing future repayments and deliveries of new aircraft ordered from 2015.
Improved cash flow and seasonal variationsSAS works continuously with analysis of balance-sheet items and trends for operations to optimize cash flow with the aim of attaining the lowest possible total funding cost. Since the Group’s operating liabilities exceed current assets, SAS had a working capital of about SEK 9 billion at October 31, 2013. Cash flow from operating activities in 2012/2013 amounted to MSEK 1,028.
Cash flow from operating activities follows clear seasonal trends. Cash flow is strongest in periods with a high proportion of bookings and advance bookings. The proportion of advance bookings is high-est in the January to May period ahead of the holiday period and in the September to October period. Since passenger revenue is rec-ognized when SAS or another airline provides the transportation, this means that seasonal variations impact cash flow and earnings differently. In terms of earnings, the third and fourth quarters (May to July and August to October) are the strongest while cash flow from operating activities is strongest in the second and fourth quar-ters (February to April and August to October).
–1,200
–800
–400
0
400
800
1,200
Aug–Oct
May–Jul
Feb–Apr
Nov–Jan
1) Pertains to the period Q2, 2010 to Q4, 2013
Cash flow from operations after changes in working capital1
MSEK
–12
–8
–4
0
4
8
12
Aug–Oct
May–Jul
Feb–Apr
Nov–Jan
1) Pertains to the period Q2, 2010 to Q4, 2013
EBIT margin1
%
Investment plan for aircraft fleet renewalImplementation of the SAS change program allowed renewal of the SAS aircraft fleet and the order of 12 new long-haul aircraft in 2013. During the 2013–2014 period, SAS is phasing in 26 aircraft through operating leases. In addition, SAS has placed orders for 30 Airbus A320neo, four Airbus A330 Enhanced and eight Airbus A350 with delivery from 2015 to 2021. The total list price of the order amounts to about USD 5.8 billion.
Since these aircraft are significantly more efficient than existing aircraft, they are attractive from a financing perspective. SAS plans to both lease and own aircraft as this provides increased flexibility and a differentiated risk profile. SAS intends to utilize a mix of export credit financing, enhanced equipment trust certificates (EETCs), bank loans and bank facilities to finance directly owned aircraft. When leasing, which means sale and leaseback agreements, aircraft are sold on delivery and leased back over a 10–12 year period.
At October 31, 2013, the SAS aircraft fleet represented 25% of the Group’s assets. SAS depreciates directly-owned aircraft over 20 years utilizing a residual value of 10%. Passenger aircraft are generally used for 20 years in commercial passenger traffic but aircraft that are well maintained can operate for substantially longer periods. However, technical developments mean that newer aircraft are more economical compared with older aircraft. There are still items of value in an aircraft after it has been taken out of service, for example engines.
Aircraft on firm order 2014–2021
2014 2015 2016 2017 2018 2019 2020 2021
Airbus A320neo 4 11 7 8
Airbus A330E/A350 2 2 1 1 2 4
List price of aircraft ordered, MUSD
Airbus A320neo 2,550
Airbus A330E/A350 3,280
Investments and sales, 2012/2013The Group’s investments in 2012/2013 amounted to MSEK 1,877. Of these investments, MSEK 711 pertained to aircraft, MSEK 189 to engine maintenance, MSEK 158 to aircraft modifications, MSEK 257 to spare parts, MSEK 97 as an advance payment to Airbus, MSEK 124 for capitalized system development costs and MSEK 54 for shares. Aircraft investments comprised eight MD-82s, four Boeing 717s, two Airbus A320s and one Q300. Sales by SAS amounted to MSEK 1,738 in 2012/2013 and comprised the sale of 80% of the shareholding in Widerøe and 18 aircraft comprising nine MD-82s, six Boeing 737-600s and three Q400s. In March, a sale and leaseback of spare engines was carried out, which generated MSEK 738.
45% Financial fixedassets incl. pensions
13% Cash and cashequivalents
25% Aircraft
7% Other fixed assets
10% Current assets and current receivables
Breakdown of SAS Group’s assetsOctober 31, 2013
29SAS Group Annual Report November 2012–October 2013

FundingThe SAS Group uses commercial papers, bank loans, bond loans, convertible bonds, subordinated loans and leasing as sources of funding.
At October 31, 2013, SAS had contracted credit facilities of MSEK 4,155, of which MSEK 1,986 was unutilized. In November 2012, as part of securing the financial stability of the Group, SAS reached an agreement to renegotiate the existing credit facility of MEUR 366 to an amortized facility of SEK 3.5 billion and, in parallel, extend the term to March 31, 2015. The credit facilities are provided by seven banks, the three Scandinavian states and KAW. As a consequence of the sales conducted under the SAS restructuring program, SAS rene-gotiated the facility during the year. As of October 31, 2013, the credit facility was 1.8 billion. The facility consists of two parts with separate covenants, with one falling due on June 1, 2014 and the other falling due on March 31, 2015.
The Group’s interest-bearing liabilities amounted to MSEK 11,510,
up MSEK 623 compared with the year earlier. New loans raised during the year amounted to MSEK 3,115 and repayments amounted to MSEK 1,580. In addition, the Group’s interest-bearing liabilities decreased by almost MSEK 700 due to the sale of Widerøe.
Contracted credit facilities, MSEK
Committed credit facilities, October 31, 2013 Total Utilized Unutilized Maturity
Revolving credit facility, MSEK 1,800 1,800 – 1,800 Mar 2015
Credit facility, MUSD 125 803 631 172 Jan 2016
Credit facility, MUSD 59 380 380 – Oct 2017
Credit facility, MUSD 66 426 426 – Sep 2021
Credit facility, MUSD 114 732 732 – Feb 2020
Other facilities, MEUR 2 14 – 14 Dec 2013
Total 4,155 2,169 1,986
New pension agreementsIn November 2012, new collective agreements were signed with flight crew in Scandinavia. Among other things, the new agreements mean that the defined-benefit pension plans have, largely, been replaced with defined-contribution pension plans with effect from the first quarter of 2013/2014. When the above changes are reported in the first quarter of 2013/2014, the pension commitment will be reduced by about SEK 12.9 billion. In addition, the change in terms will give rise to an improvement in earnings of about SEK 1 billion.
Annual cost savings generated by the new pension terms are expected to amount to about MSEK 500 and reach their full effect from the 2013/2014 fiscal year.
In addition to the transition to defined-contribution pension plans, other measures included the removal of early retirement and part-time pensions, the lowering of pensionable income and raising the retirement age for cabin crew under the Alecta plan from 60 to 65. These changes have brought about an improvement in earnings of MSEK 450 in 2012/2013 and reduced pension commitments and actuarial gains and losses by about SEK 1.7 billion. In addition, the sale of 80% of Widerøe in September 2013 further reduced pension commitments by about SEK 2.8 billion and actuarial gains and losses by about SEK 1.1 billion.
At October 31, 2012, pension commitments totaled SEK 33.5 bil-lion. In 2012/2013, pension commitments were reduced by about SEK 5 billion and following recognition of the transition to defined-contribution pension plans, the total reduction will be about SEK 18 billion. Since some employees already have early retirement and part-time pensions in place, this commitment will decrease over the next five years and, at the end of the 2017/2018 fiscal year, pension commitments are therefore expected to amount to approximately SEK 14 billion, which means a reduction of about SEK 19.5 billion, or about 60% of the original pension commitments.
The reversal of deferred tax liabilities related to pensions will be performed in the first quarter of 2013/2014, which means that the temporary difference between the accounting and tax values will disappear. This will have a positive impact on shareholders’ equity of about SEK 1.5 billion.
The remaining pension plans in Sweden (the Alecta plan and Euroben) reported a surplus of about SEK 5 billion as of November 1,
2013. This surplus may benefit SAS in the form of future reductions in premiums and, accordingly, special payroll tax will be recognized for the surplus. This will result in a net increase in pension funds of about SEK 1.2 billion, deferred tax liabilities of about SEK 0.2 billion and shareholders’ equity of about SEK 1 billion.
Taken together, the above means that shareholders’ equity will be impaired by about SEK 7 billion on the introduction of the revised IAS 19 on November 1, 2013 and the reporting of the changed terms and conditions in the first quarter 2013/2014.
0
3
6
9
12
15
Shareholders’equity,
Nov 1, 2013
IAS 19Rimpair-ment
Specialpayroll
tax
Deferredtax
liabilities
Changein terms
Shareholders’equity,
Oct 31, 2013
Changein terms
4.3
11.1
+1.5+1.0
+1.0
–10.3
+0.4
Effects of the revised IAS 19 and new pension termsSEK billion
Financial position
Defined-benefit pension commitments
SEK 33.5billion SEK 14.0
billion
~60%From
To
1) Expected to be reached in 2017/2018. On November 1, 2013, defined-benefit pension commitments amounted to about SEK 15.6 billion.
Oct 31, 2012 2017/20181
Earnings improvements
SEK –6.8 billion
30 SAS Group Annual Report November 2012–October 2013

New loans raised principally, comprised a bond of MSEK 1,500 and the renewal of existing aircraft financing. SAS also issued a MEUR 35 bond under the framework of the EMTN program.
The Board of SAS has proposed to the 2014 Annual General Shareholders’ Meeting that the Articles of Association be amended to allow the issue of preference shares and that the Board be autho-rized to decide on new issue of a maximum of 7 million preference shares up to the 2015 Annual General Shareholders’ Meeting. Fur-thermore, the Board has proposed the authorization of the Board until the 2015 Annual General Shareholders Meeting to issue con-vertible bonds in an amount not exceeding SEK 2 billion, with enti-tlement to a maximum amount of 130 million common shares on conversion.
Fixed-rate periodDuring the year, the SAS Group’s financial net debt declined by MSEK 1,982 and amounted to MSEK 4,567 at the closing date. The average duration for financial net debt is governed by the Group’s financial policy and has a target value of 3.5 years. The average duration was 3.5 years as of October 2013.
CreditworthinessSAS is rated by three credit-rating agencies: Moody’s, Standard & Poor’s and the Japanese agency, Rating and Investment Information
Inc (R&I). In November 2012, Standard & Poor’s lowered their rating for SAS from B- to CCC+. Subsequent to the significant successes from implementation of the SAS restructuring program, Standard & Poor’s raised their rating for SAS back to B- in August 2013. R&I low-ered their rating in July 2013 from B to BB-. Moody’s changed their outlook for the SAS Group’s credit rating from stable to positive in September 2013.
The SAS Group’s cash and cash equivalents are placed in instru-ments with good liquidity or short maturity with credit ratings not lower than A3/P1 according to Moody’s, or A-/A-1 according to Standard & Poor’s.
Financial position
0
500
1,000
1,500
2,000
2,500
> Oct2019
Oct2019
Oct2018
Oct2017
Oct2016
Oct2015
Oct2014
Repayments of interest-bearing liabilities, Oct 31, 2013
MSEK
31SAS Group Annual Report November 2012–October 2013

Risks and risk management
Important steps for increased cost flexibility
The underlying purpose of risk management is to create shareholder and stakeholder value. All organizations are exposed to risks and uncer-tainties, but uncertainties mean both risks and opportunities. Risk management at SAS is about positioning SAS in relation to, known and unknown, possible events with the aim of mini-mizing the potential negative effects should an unexpected event occur.
Risk management in 2012/2013Overall risks are monitored and identified centrally and followed-up through policies that aim to control the risks. Flight safety is the SAS Group’s highest priority and is described in more detail on page 25.
Cost-structure flexibility is of strategic importance to the man-agement of our operating environment. During 2012/2013, SAS has taken key decisions that have increased the Group’s cost-structure flexibility, such as the new collective agreements, outsourcing of ground handling and call center operations to reduce fixed costs, and renewal of the aircraft fleet. Further information about the mea-sures included in the SAS Group’s restructuring program is available on pages 8–9.
Market and other risks primarily impact demand and are mitigated by greater flexibility in the cost structure to enable rapid adaptation of the production volume. The SAS Group’s exposure to various mar-kets and customer segments helps to reduce the risk level to local events but increases exposure to global events in the business envi-ronment. Despite a number of extraordinary events and crises in areas such as the Middle East in 2013, no single event had any sub-stantial negative impact on air travel. The financial crisis in Southern Europe continued to affect SAS but, since three quarters of the Group’s sales are in Scandinavia, only a limited decline in demand was experienced by SAS.
Operating risks are related to factors that can constitute a hinder to production. These factors can rapidly lead to major loss of revenue for an airline company. Among the risks facing SAS are risks con-nected to the organization and its employees. In 2012/2013, the SAS Group’s operations were impacted on a number of occasions by local labor disputes in Norway, Denmark and France, which were outside of the Group’s control. The conflicts also impacted other airlines and, accordingly, had a limited effect on SAS in terms of competition but the conflicts did, however, lead to lower revenue.
In addition, regulation of the airline industry entails that airline com-panies are exposed to political decisions that can impact profitability. There is a strong environmental opinion that benefits companies with
efficient sustainability efforts, while new financial controls can imply initial costs. The SAS Group’s decision to invest in the Airbus A320neo and Airbus A330 Enhanced/A350 positions and reduces the Group’s future risks. From 2014, the SAS Group’s aircraft fleet will only com-prise “Next Generation” aircraft with significantly enhanced fuel effi-ciency and, accordingly, will contribute to lower carbon emissions and noise levels.
Legal issues and risks are managed centrally by the SAS Group. The breadth of the SAS Group’s operations means that SAS is, and may be in the future, involved in legal processes and arbitration procedures as either plaintiff or defendant. SAS continuously monitors, if and how, changes in regulations and policies impact the Group’s procedures and operations. SAS has a Code of Conduct that aims to ensure compliance by the Group’s personnel with laws/policies.
At the end of October 2013, SAS was involved in the following significant legal dispute.
As a consequence of the European Commission’s decision in the cargo investigation in November 2010, SAS and other airlines fined by the Commission are involved in various civil lawsuits in Europe (the UK, the Netherlands and Norway). SAS, which appealed the European Commission’s decision, contests its responsibility in all of these legal processes. Further lawsuits by cargo customers cannot be ruled out and no provisions have been made.
Furthermore, SAS has noted that, in June 2013, the European Commission and the EFTA Surveillance Authority decided to initiate a detailed investigation of whether or not the three State sharehold-ers’ participation in the renewal of the SAS Group’s revolving credit facility (RCF) in November/December 2012 comprised a govern-ment subsidy.
In January 2014, the SAS pilot associations filed a lawsuit against SAS with the Swedish Labour Court claiming damages for breach of collective agreements. This comprises a claim for declara-tory judgment and no financial damages are specified in the sum-mons application. The dispute pertains to a large group of pilots employed at the Stockholm base but who worked out of the Copen-hagen base, and the calculation and coordination of the rights to Swedish and Danish pension benefits of these pilots on changing bases. SAS has yet to respond but will contest all claims. Irrespective of the outcome of the dispute, the assessment of SAS is that the dispute will not have any material negative impact on SAS.
Sensitivity analysis, November 2012–October 2013
Airline operationsScandinavian
Airlines1% change in RPK, MSEK 2201 percentage point change in the load factor, MSEK 3001% change in passenger revenue per passenger kilometer (yield), MSEK 290
1% change in the unit cost, MSEK 3701% change in the price of jet fuel, MSEK 85
32 SAS Group Annual Report November 2012–October 2013

Risks and risk management
Environmental risks are linked to the Group’s operations and more stringent requirements from the operating environment. The Group’s externally verified environmental management system provides SAS with sound control of its own operations. More stringent require-ments from the Group’s operating environment pertain, in part, to new environment-related taxes and fees as well as, in part, to require-ments for stricter rules regarding, for example, greenhouse gas emissions. SAS is a long-time supporter of the polluter pays principle (PPP). However, a prerequisite for this is that it is applied on equal terms and in a manner that does not distort competition. In addition, SAS is positive towards requirements for increased energy efficiency. This fits in well with the ambitious environmental targets that have been set but, naturally, requires predictability and a long-term approach.
Financial risks are managed through hedging against changes in exchange rates, interest rates and fuel prices thus countering short-term fluctuations and providing scope for managing any changes.
Currency risksAs a consequence of its international operations, SAS is exposed to price changes in several currencies. Transaction risk arises from exchange-rate changes that impact the size of commercial revenue and costs and thus the SAS Group’s operating income. Currency exposure is managed through continuously hedging 40–80% of the Group’s surplus and deficit currencies based on a 12-month rolling liquidity forecast.
SAS has two main net surplus and deficit currencies, principally, in USD. A decline in the SEK against, for example, the USD means a negative impact on earnings as a consequence of exchange-rate driven cost increases not being balanced by corresponding increases in revenue.
In 2012/2013 the SEK strengthened 3.2% against the USD, which positively impacted costs, primarily fuel costs. In relation to the Group’s largest surplus currency, NOK, the SEK strengthened by about 6%, which has negatively impacted the Group’s revenue. The exchange-rate trend had a negative impact on revenue of MSEK 1,027 and on operating income of MSEK 212 compared with the corresponding year-earlier period. Due to the weakness of the Group’s financial position and the restricted credit limits in the SAS Group’s financial system in the preceding year, exchange-rate hedg-ing was performed to a lesser extent than normal and, accordingly, net exchange-rate exposure increased over the fiscal year.
In October 2013, the Group hedged 46% of its anticipated USD deficit for the next 12 months.
Hedging is mainly performed through currency forward con-tracts to prevent earnings-related revaluation effects pertaining to financial assets and liabilities.
Currency risk and aircraft investmentsSAS has signed agreements for the purchase of a total of 42 aircraft with delivery from 2015 to 2021. Thirty of these aircraft will be used for short-haul routes and 12 will be used on long-haul routes. SAS has hedged about 7% of the list price order value through derivative contracts to limit the currency risk.
Net earnings effect of exchange-rate changes, SAS Group, November 2012–October 2013
SAS total1% weakening of SEK against USD –951% weakening of SEK against NOK +751% weakening of SEK against DKK +51% weakening of SEK against EUR –51% weakening of SEK against JPY +61% weakening of SEK against GBP +7
Jet fuelThe price of jet fuel was at a historic high for the 2012/2013 fiscal year. However, in April to May 2013, the fuel price declined temporarily and for a short period the price was slightly less than USD 900/tonne due to concerns about the global economy. The decline was, however, short-lived and the jet-fuel price climbed back to USD 1,000/tonne at the end of the fiscal year. In total, the jet-fuel price was 3.7% lower in 2012/2013 than the corresponding year-earlier period.
Jet-fuel costs comprised 24.5% of the SAS Group’s operating expenses (excluding leasing, depreciation and amortization). 40–80% of the Group’s forecast jet-fuel needs for the next 12 months are hedged.
Hedging of jet fuel 2013−2014
2013/2014 Nov–Jan
2014 Feb–Apr
2014 May–Jul
2014 Aug–Oct
Hedging of jet fuel 100% 80% 20% 7%
Estimated jet-fuel cost November 2013 – October 2014, SEK bn.
Market price, jet fuel
5.0 SEK/USD
6.0 SEK/ USD
7.0 SEK/USD
8.0 SEK/USD
USD 600/tonne 4.8 5.7 6.7 7.6USD 800/tonne 5.7 6.8 7.9 9.1USD 1,000/tonne 6.6 7.9 9.2 10.5USD 1,200/tonne 7.2 8.7 10.1 11.6USD 1,400/tonne 7.9 9.4 11.0 12.6
The jet-fuel costs for the coming fiscal year are as shown above at the closing date USD rates and jet-fuel cost. The SAS Group’s current hedging contracts for jet fuel at October 31, 2013 were taken into account.
MSEK
Revenue Expenses
Surplus currenciesDeficit currencies
Net
Currency breakdown in the SAS Group, November 2012–October 2013
0
5,000
10,000
15,000
20,000 IntäkterNetto
–15,000
–12,000
–9,000
–6,000
–3,000
0 Kostnader
OtherNOKSEKGBPJPYEURDKKUSD
Netto
33SAS Group Annual Report November 2012–October 2013

Operating risks
Unmotivated employeesSAS is one of the most attractive workplaces in the Nordic region.
Average PULS analysis. Employee job satisfaction declined at SAS. The index dropped six points to 57.
StrikesHistorically, the airline industry has been se-verely affected by labor market disputes.
Low Transparent and open dialog. No strikes directed toward Scandinavian Airlines as an employer. However, strikes occurred in the Nordic region and Europe that im-pacted the operations of SAS and other airlines in 2013.
Incidents and accidentsThe airline industry is exposed to aircraft accidents.
Low Safety is top priority. Constantly working for im-provement. Extensive reporting culture.
No incidents with red-level risk during 2012/2013. Read more on page 25.
Crime and fraudThe Group may be exposed to crimes that can have both an economic and material impact.
Low Code of Conduct, internal control, audits, safety activities.
No material crime or fraud was directed toward SAS.
IT securitySAS is dependent on IT for its financial trans-actions and operating activities.
Average Effective IT security secures confidentiality, accuracy, availability, traceability and authenticity.
The operations were not affected by any computer hacking.
Environmental risks
Environmental directives and requirementsLaws and regulations as well as public opinion set requirements for reduced environmental impact.
Low SAS is committed to sustainability and initiatives in-clude working actively to reduce its environmental impact.
Scandinavian Airlines reduced its carbon dioxide emissions per passenger kilometer from 117 to 113 grams. Read more on pages 18–21.
Legal and political risks
Taxes and fees directed at the airline industryThe airline industry is subject to fees for take-off, landing and overflights, etc.
Average Active dialog and negotiations with authorities and organizations.
The unit cost of government user fees for Scandinavian Airlines declined 4%. Read more on page 24.
Compliance risksInfringement of laws or internal regulations.
Average Internal policies and regulations, internal guidelines and the Code of Conduct.
No legal process of any significance had a negative impact on SAS. Read more on pages 82–86.
Financial risks
Counterparty lossesSAS is exposed through credits, lease agree-ments and guarantees to external parties.
High Exposure is regulated by SAS Group Finance Policy. No counterparty loss of any significance had any impact on SAS. Read more in Note 27.
Liquidity riskThe airline industry is seasonal, which affects cash flow during the year.
Low The target is a financial preparedness of at least 20% of fixed costs.
The Group’s financial preparedness was 26% and, accordingly, above the target in October 2013. Read more in Note 27.
Fuel priceJet fuel comprises about 24.5% of the Group’s operating expenses, which exposes the com-pany to changes in price.
High Hedging of 40−80% of consumption for the next 12 months.
The average price of jet fuel in USD decreased 3.7% and the unit cost in SEK declined 5.9%. Read more in Note 27.
Interest ratesThe airline industry is capital-intensive and the company is a net borrower. This exposes the company to interest-rate changes.
Low The finance policy regulates the proportion between floating and fixed interest rates. The objective is that the liability will have a fixed term of 3.5 years. The fixed-rate period was 3.5 years as of October 2013.
Net interest was MSEK 152 (before currency effects) lower year-on-year, primarily due to lower gross debt (financial net debt de-creased MSEK 1,982) and lower interest rates. Read more in Note 27.
Exchange ratesA considerable part of revenues, expenses and assets/liabilities is in currencies other than SEK, generating exchange-rate effects.
Average Hedging of foreign currencies. 40–80% of surplus and deficit currencies are hedged on a rolling 12-month basis.
The total variance between 2012/2013 and 2011/2012 from exchange-rate effects was MSEK –195 before tax. Read more in Note 27.
Other risks
Natural disasters, terror attacks, conflicts and epidemicsAirline companies are generally heavily impacted by extraordinary events around the world.
High SAS strives to increase the proportion of variable costs to be able to rapidly realign operations in the case of extraordinary events. The Group continuously reviews various contingency plans for catastrophe management.
No abnormal events occurred in the SAS Group’s primary home markets. SAS works with a long-term focus to outsource fixed costs, such as call centers and ground handling.
Market risks Risk level Risk management Outcome November 2012−October 2013
Macroeconomic developmentDemand in the airline industry is strongly correlated to economic growth.
Average Focus on flexibility in the cost structure through measures including good flexibility in the aircraft fleet and collective agreements.
Economic growth in the Nordic region outpaced much of Europe. Through the restructuring program, SAS will increase its cost-structure flexibility to be better able to meet changes in demand. Read more on pages 22–23.
Market impactSAS is active in several markets and impacted by various business cycles, which reduces ex-posure to individual markets. SAS is particularly sensitive to global trends.
Average SAS is adapting its production to ensure the right ca-pacity in each market to reduce business risk.
Traffic growth was healthy in 2012/2013 but the yield declined towards the end of the year. Read more on pages 22–23.
Competition and price performanceThe airline industry is subject to intense compe-tition from new companies that enter the mar-ket. Changed customer behavior and increasing numbers of LCCs in the SAS Group’s home mar-ket may lead to intensifying competition.
High To address this, SAS must lower its costs to a com-petitive level, and offer added value compared with LCCs.
The capacity share of LCCs has stabilized, but competition still intensified on several routes. SAS lowered its unit cost before jet-fuel costs by 5.9% and is implementing the restructuring pro-gram to reduce unit cost moving forward. Read more on pages 22–23.
Capacity changesDue to long delivery times, aircraft orders are based on long-term forecasts. This can lead to over or under-capacity and affect prices.
High Being a market leader in the Nordic region creates opportunities for SAS to influence capacity changes. Short-term leases are utilized to adapt capacity and demand.
Total capacity in the Nordic region increased by about 8%. SAS works strategically to maintain optimal fleet flexibility to, thereby, be able to rapidly adapt capacity to changes in demand. Read more on pages 22–23.
ä
ä
ä
ä
ä
ä
ä
ä
ää
ä
ä
ä
ä
ä
ä
ä
ä
34 SAS Group Annual Report November 2012–October 2013

The share and shareholder service
Positive share trend
Share performanceThe SAS share is traded on the stock exchanges in Stockholm, Mid Cap list (primary listing), Copenhagen and Oslo. The market capital-ization of SAS increased 202% from November 2012 to October 2013. The share price rose in conjunction with the signing of the new collective agreements in November 2012 and following the interim report for the third quarter in September 2013, when the Group’s improved profitability became even more apparent.
Compared with a weighted average of competitors’ market capi-talization, the performance of the SAS share was 145 percentage points stronger during the period. The value of the number of shares traded on all three exchanges where SAS is listed increased to SEK 6.2 billion over the fiscal year. This was attributable to an increase in the volume of shares traded and a higher average share price.
After adjustment for the three Scandinavian governments’ 50% share of the SAS Group, the number of shares traded in relation to shares out-standing was 257% in the November 2012 to October 2013 period. The distribution of trading volume between the exchanges during the year was: Stockholm 69%, Copenhagen 25% and Oslo 6%. From December 2, 2013, the SAS share was admitted for trading on the Oslo Exchange’s main index, the OSEBX, as one of the exchange’s 25 most traded shares.
Shareholder serviceA key component of the SAS Group’s shareholder service is the con-tinuous financial reporting provided through annual reports, interim reports, press releases and monthly traffic reports. In addition, SAS provides supplementary information and facts to shareholders and investors at www.sasgroup.net.
Under Investor Relations on the SAS Group’s website, SAS pro-vides a shareholder service for all registered shareholders. Four times per year, new shareholders are contacted by letter with information about how to gain access to the shareholder service. The service pro-vides opportunities to register to receive annual reports by post and notices of shareholders’ meetings by e-mail. In addition, shareholders who own at least 400 shares (the number of shares may change – see under Investor Relations on the website for the current level) – can also make return bookings with Scandinavian Airlines for special prices.
Webcasts are normally arranged in conjunction with interim reports, and can be viewed directly on the website where they are usually available
for the following two months. For the institutional market, SAS arranges regular meetings with investors and analysts. Presentations for private shareholders are also arranged at various locations throughout Scandinavia.
Diffusion of ownership and changeOn October 31, 2013, SAS had 61,383 shareholders. Holdings in Scan-dinavia were about 86%, with Sweden accounting for 45%, Denmark 25% and Norway 16%. Holdings outside the EEA area were less than 6%, of which the majority are registered in the US. Non-EEA holdings increased year-on-year by about 3–4 percentage points. Otherwise, ownership changes between the Scandinavian countries were small.
Dividend and dividend policyThe SAS Group’s annual common-share dividend is determined by the Group’s earnings, financial position, capital requirements and rel-evant economic conditions. Over a business cycle, the dividend aims to be about 30–40% of the Group’s income after standard tax. The Board of Directors proposes to the Annual General Shareholders’ Meeting (AGM) that no dividends be paid to SAS AB’s shareholders for the 2012/2013 fiscal year. This is motivated by the need for SAS to improve its financial position. A healthy financial position and financial flexibility are key to completing all measures in the restruc-turing program and in the renewal of the SAS Group’s aircraft fleet.
Issuance of preference sharesThe Board proposes that dividends payable on any preference shares outstanding, which in line with the proposal to the Shareholders’ Meeting may be issued in the period up till the 2015 AGM, should be payable on a quarterly basis in an amount of SEK 12.50 per preference share, with a ceiling of SEK 50 per preference share. The record dates proposed, ahead of the next AGM, for the quarterly dividends are May 5, August 5, and November 5 in 2014 and February 5 in 2015. Pay-ment through Euroclear Sweden AB is expected to be carried out on May 8, August 8, and November 10 in 2014 and February 10 in 2015. The first time a dividend can be paid on a preference share, or, when applicable, a subscribed and paid-up preference share, is on the pay-ment date following the first record day after the share has been regis-tered in the share register maintained by Euroclear Sweden AB in line with the provisions in the company’s Articles of Association.
Breakdown of SAS Group’s share capital
50% State ownership
15–20% Private ownership
30–35%Institutional ownership
Breakdown of SAS Group’s share capital by country
14% Other
45% Sweden
25% Denmark
16% Norway
The implementation of the Group’s restructuring program creates the preconditions to create long-term value for the SAS Group’s shareholders after several years of negative returns. The company’s share price reacted positively to the measures and the improved profitability in the 2012/2013 fiscal year, and rose from SEK 6.45 to SEK 19.5. However, much remains for SAS to do before the Group reaches its long-term profitability target of an EBIT margin of 8%.
35SAS Group Annual Report November 2012–October 2013
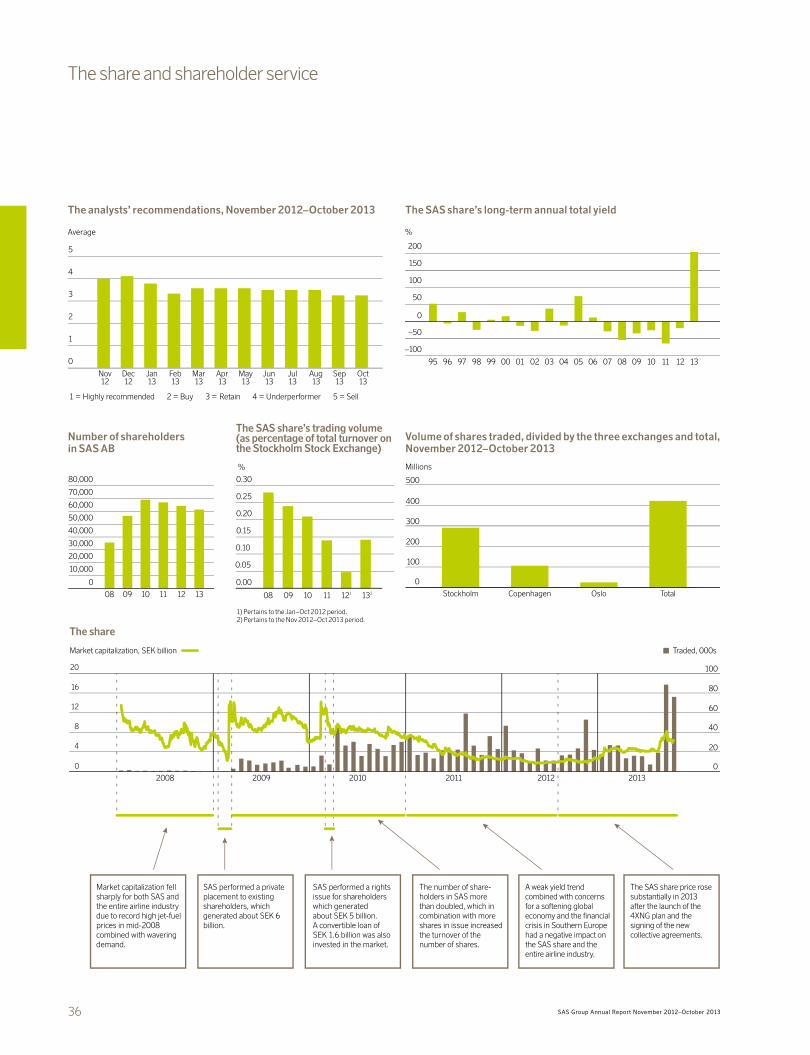
Oct13
Sep13
Aug13
Jul13
Jun13
May13
Apr13
Mar13
Feb13
Jan13
Dec12
Nov12
1 = Highly recommended 2 = Buy 3 = Retain 4 = Underperformer 5 = Sell
0
1
2
3
4
5
–100
–50
0
50
100
150
200
13121110090807060504030201009998979695
0
10,000
20,000
30,000
40,000
50,000
60,000
70,000
80,000
131211100908
0.00
0.05
0.10
0.15
0.20
0.25
0.30
The SAS share’s trading volume(as percentage of total turnover onthe Stockholm Stock Exchange)
%
08 09 10 11 121 132
The share
Market capitalization, SEK billion Traded, 000s
Market capitalization fell sharply for both SAS and the entire airline industry due to record high jet-fuel prices in mid-2008 combined with wavering demand.
SAS performed a private placement to existing shareholders, which generated about SEK 6 billion.
The number of share-holders in SAS more than doubled, which in combination with more shares in issue increased the turnover of the number of shares.
SAS performed a rights issue for shareholders which generated about SEK 5 billion. A convertible loan of SEK 1.6 billion was also invested in the market.
2008 2009 2010
60
80
100
40
20
0
A weak yield trend combined with concerns for a softening global economy and the financial crisis in Southern Europe had a negative impact on the SAS share and the entire airline industry.
The SAS share price rose substantially in 2013 after the launch of the 4XNG plan and the signing of the new collective agreements.
2011 20132012
0
4
8
12
16
20
The share and shareholder service
The SAS share’s long-term annual total yield
%
Number of shareholders in SAS AB
The analysts’ recommendations, November 2012–October 2013
Average
1) Pertains to the Jan–Oct 2012 period.2) Pertains to the Nov 2012–Oct 2013 period.
0
100
200
300
400
500
TotalOsloCopenhagenStockholm
Volume of shares traded, divided by the three exchanges and total, November 2012–October 2013
Millions
36 SAS Group Annual Report November 2012–October 2013

37SAS Group Annual Report November 2012–October 2013
Report by the Board of Directors 38
Consolidated statement of income including a statement of other comprehensive income 44
Comments on the consolidated statement of income 45
Statement of income – quarterly breakdown 46
Consolidated balance sheet 47
Comments on the consolidated balance sheet 47
Change in shareholders’ equity 48
Consolidated cash-flow statement 49
Comments on the consolidated cash flow statement 49
Notes to the financial reports 50
SAS AB, Parent Company, including notes 79
Corporate governance 82
Corporate Governance Report 82
Organization and control 82
SAS Group’s legal structure 82
Information about the Annual General Shareholders’ Meeting 86
Internal control – financial reporting 87
Board of Directors and auditors 88
Group management 90
Auditors’ report 93
Share data for SAS 94
Aircraft fleet 95
The Group’s operational key figures 96
Ten-year financial overview 97
Definitions & concepts 99
Notes to the consolidated financial statements
Note 1 Significant accounting policies 50
Note 2 Revenue 57
Note 3 Payroll expenses 57
Note 4 Other operating expenses 59
Note 5 Depreciation, amortization and impairment 59
Note 6 Share of income and equity in affiliated companies 59
Note 7 Income from the sale of aircraft and buildings 60
Note 8 Income from other holdings of securities 60
Note 9 Net financial items 60
Note 10 Tax 60
Note 11 Intangible assets 61
Note 12 Tangible fixed assets 62
Note 13 Prepayments relating to fixed assets 63
Note 14 Financial fixed assets 63
Note 15 Pension funds, net 64
Note 16 Expendable spare parts and inventories 65
Note 17 Current receivables 66
Note 18 Current receivables from affiliated companies 66
Note 19 Prepaid expenses and accrued income 66
Note 20 Short-term investments 66
Note 21 Share capital 66
Note 22 Reserves 66
Note 23 Long-term liabilities 67
Note 24 Subordinated loans 67
Note 25 Bond loans 67
Note 26 Other loans 67
Note 27 Financial risk management and financial derivatives 68
Note 28 Other provisions 74
Note 29 Short-term loans 75
Note 30 Unearned transportation revenue 75
Note 31 Accrued expenses and prepaid income 75
Note 32 Pledged assets 75
Note 33 Contingent liabilities 75
Note 34 Leasing commitments 75
Note 35 Adjustment for other items not included in the cash flow, etc. 76
Note 36 Acquisition of subsidiaries 76
Note 37 Disposals of subsidiaries 76
Note 38 Cash and cash equivalents 76
Note 39 Auditor’s fees 76
Note 40 Transactions with affiliated companies 77
Note 41 Segment reporting 77
Note 42 Subsidiaries in the SAS Group 78
Note 43 Significant events after the closing date 78
Contents

38 SAS Group Annual Report November 2012–October 2013
Report by the Board of DirectorsThe Board of Directors and the President of SAS AB hereby submit the an-nual report for SAS AB and the SAS Group for the 2012/2013 fiscal year (November 2012–October 2013). The company is domiciled in Stockholm, Sweden, and its Corporate Registration Number is 556606-8499.
MARKET PERFORMANCETraffic growth was essentially healthy during the November 2012–October 2013 fiscal year, but competition increased after the summer. Capacity and traffic growth was higher in Scandinavia than in the rest of Europe. The SAS Group increased capacity 5.7% compared with the November 2011–Octo-ber 2012 period. Over the same period, the Group’s traffic increased 3.6%, positively impacted by healthy growth on the intercontinental routes, pri-marily to the US. Traffic to and from Europe increased substantially during
the summer months as a result of SAS opening 32 new seasonal routes. In the latter part of the fiscal year, growth was lower in parallel with increased competition. Traffic in Scandinavia was relatively stable during the year.
As a consequence of continued harsh market conditions with overcapac-ity in certain markets, primarily on European routes, as well as the planned expansion in the summer, the currency-adjusted yield for Scandinavian Air-lines declined 0.4% compared with the November 2011–October 2012 pe-riod. The currency-adjusted unit revenue, PASK, declined 2.4% over the same period.
In total, the SAS Group carried 28.1 million passengers on scheduled traffic in the 2012/2013 fiscal year, down 0.5% compared with the Novem-ber 2011–October 2012 period. The traffic data included Widerøe until September 30, 2013 when 80% of the company was sold. The change in passenger numbers, excluding Widerøe, was –0.1%.
INCOME November 2012–October 2013The 2012/2013 Annual Report is the first under the new fiscal year, which starts in November and which was adopted at the SAS Annual General Shareholders’ Meeting on April 19, 2012. Accordingly, the Annual Report, including notes, for the November 1, 2012–October 31, 2013 fiscal year will be compared with the preceding fiscal year, which comprised the period January 1–October 31, 2012.
The SAS Group’s income before tax and nonrecurring items was MSEK 775 (23) and income after tax totaled MSEK 179 (–985).
The SAS Group’s revenue amounted to MSEK 42,182 (35,986).
4Excellence Next GenerationIn November 2012, a restructuring program known as 4Excellence Next Generation (4XNG) was launched with the aim of addressing the decisive structural and financial limitations in the SAS Group’s operations.
The restructuring program encompasses a number of structural stream-lining measures and the divestment of assets to reduce the dependence on credit facilities. Overall, the aim is to implement cost reductions of about SEK 3 billion in the 2013–2015 period, to reduce the impact of changed pension accounting standards on shareholders’ equity and to divest assets and im-plement a funding plan comprising a total of approximately SEK 3 billion.
The main components include new collective agreements for flight crews with salary and employment terms at market levels that enable significant efficiency enhancements with regard to planning and scheduling. Further-more, new defined-contribution pension solutions were implemented for most employees. In total, the savings from the new collective and pension agreements amounted to about SEK 1.2 billion with full effect from 2013/2014. Administrative functions are being reduced and centralized to Stockholm, which is estimated to generate savings of about SEK 0.75 billion following full implementation. In addition, major IT efficiency enhancements are being implemented with the aim of halving the SAS Group’s IT costs by 2016 and reducing costs by SEK 0.55 billion. The SAS sales organization is undergoing restructuring and centralization including the outsourcing of call center operations. In addition, network efficiency is being enhanced through better utilization of existing resources, including aircraft utilization and supplemented with wet leases of smaller aircraft. The measures applied at Commercial & Sales amounted to SEK 0.5 billion.
Beyond the cost-reducing measures, SAS sold assets during the fiscal year with a liquidity effect of about SEK 2.8 billion. These assets included
Annual report 2012/2013
Important events1
• Revenue for the year amounted to MSEK 42,182 (42,419).
• The number of passengers (scheduled traffic) totaled 28.1 million.
• Capacity (ASK) increased 5.7% year-on-year.
• Income before tax and nonrecurring items was MSEK 775 (21).
• Income before tax amounted to MSEK 433 (–3,255).
• Net income for the period totaled MSEK 179 (–3,010).
• The 4Excellence Next Generation restructuring program generated substantial impact during the year.
– Passenger revenue for Scandinavian Airlines increased 3.4% after currency adjustment.
– Unit cost decreased by 5.9% (jet fuel and currency adjustments).
– Divestment of assets with a liquidity effect of SEK 2.8 billion.
• SAS issued a SEK 1.5 billion bond loan and a MEUR 35 bond loan under the EMTN program.
• Core shareholders and banks placed a credit facility of SEK 3.5 billion at the Group’s disposal, which was amor-tized down to SEK 1.8 billion in the fourth quarter of 2013 after the sale of assets.
1) The important events in this box compare the November 2012–October 2013 period with the November 2011–October 2012 period. The remainder of the Report by the Board of Directors compares the results for the November 1, 2012–October 31, 2013 fiscal year with the year-earlier period comprising January 1–October 31, 2012 unless specified otherwise.
SAS Group, revenue breakdown, November 2012–October 2013 SAS Group, cost breakdown, November 2012–October 2013
Widerøe, 8%
Scandinavian Airlines, 92%
Leasing, 4.6%
Jet fuel, 23.4%
Government user fees,10.7%
Selling costs, 6.3%
Payroll expenses,29.6%
Technical aircraftmaintenance, 6.6%Handlingcosts, 4.3%Catering costs, 2.5%
Other, 9.4%Computer & tele-communicationcosts, 2.5%

39SAS Group Annual Report November 2012–October 2013
Widerøe, spare engines, the sale and leaseback of aircraft as well as 10% of SAS Ground Handling. The objective of the sale of SAS Ground Handling is to increase the long-term flexibility of the cost structure for SAS.
The restructuring program is estimated to have positively impacted prof-itability for SAS by about SEK 1.5 billion over the fiscal year. The program aims to enable SAS, moving forward, to efficiently compete in the growing leisure travel market while also maintaining competitiveness in the impor-tant business travel market.
SIMPLIFYING THE GROUP STRUCTUREThe Group structure continued to be simplified during the year, primarily as a consequence of the sale of Widerøe. As a consequence, SAS has transi-tioned from a holding structure with multiple subsidiaries to an airline orga-nized by function. From October 1, 2013 SAS will comprise a single seg-ment, Scandinavian Airlines.
ACCOUNTING CHANGES PERTAINING TO PENSIONSThe revised IAS 19 – Employee Benefits (defined-benefit pension plans) will be applied for fiscal years starting January 1, 2013 and onwards. As a result of the changes to the Group’s fiscal year, the Group intends to apply the amended standard for the fiscal year starting November 1, 2013.
The consequences of the revised IAS 19 include that it is no longer per-mitted to defer recognition of certain deviations in estimates (the “corridor” approach has now been eliminated) and all estimates are to be immediately recognized in other comprehensive income. Pursuant to the amended stan-dard, accumulated unrecognized deviations “Unrecognized actuarial gains and losses and plan amendments” will be recognized in their entirety in shareholders’ equity, which will have a material negative impact on the Group’s shareholders’ equity.
The Parent Company SAS AB’s recognized shareholders’ equity will not be affected by this amendment. Furthermore, interest expense and expect-ed return on plan assets are replaced with a “net interest,” which is calculat-ed using the discount rate used to measure the net defined-benefit pension liability or pension assets. Recognition of actuarial gains and losses as well as plan amendments will also mean that deferred tax liabilities linked to pen-sions will be dissolved when the temporary difference between the account-ing and tax values disappears. The effect of the reversal of deferred tax lia-bilities linked to pensions amounts to about SEK 1.5 billion, which positively impacts the SAS Group’s shareholders’ equity.
The remaining pension plans in Sweden (the Alecta plan and Euroben) re-ported a surplus of about SEK 5 billion as of November 1, 2013. This surplus may benefit SAS in the form of future reductions in premiums and, according-ly, special payroll tax will be recognized for the surplus. This results in a net in-crease in pension funds of about SEK 1.2 billion, deferred tax liabilities of about SEK 0.2 billion and shareholders’ equity of about SEK 1 billion.
In November 2012, new collective agreements were signed with flight crew in Scandinavia. Among other things, the new agreements mean that the defined-benefit pension plans were, largely, replaced with defined-contri-bution pension plans effective as of the first quarter of 2013/2014. When the above changes are reported in the first quarter of 2013/2014, the pension commitment will be reduced by about SEK 12.9 billion. In addition, the change in terms will give rise to an improvement in earnings of about SEK 1 billion.
In addition to the transition to defined-contribution pension plans, other measures included the removal of early retirement and part-time pensions, the lowering of pensionable income and raising the retirement age for cabin
crew under the Alecta plan from 60 to 65. These changes have brought about an improvement in earnings of MSEK 450 in the 2012/2013 fiscal year and reduced pension commitments and actuarial gains and losses by about SEK 1.7 billion. In addition, the sale of 80% of Widerøe in September 2013 further reduced pension commitments by about SEK 2.8 billion and actuarial gains and losses by about SEK 1.1 billion.
At October 31, 2012, pension commitments totaled SEK 33.5 billion. In the 2012/2013 fiscal year, pension commitments were reduced by about SEK 5 billion and following recognition of the transition to defined-contribu-tion pension plans, the total reduction will be about SEK 18 billion. Since some employees already have early retirement and part-time pensions in place, this commitment will decrease over the next five years and, at the end of the 2017/2018 fiscal year, pension commitments are therefore expected to amount to approximately SEK 14 billion, which means a reduction of about SEK 19.5 billion, or about 60% of the original pension commitments.
Taken together, the above means that shareholders’ equity was impaired by about SEK 7 billion on the introduction of the revised IAS 19 on Novem-ber 1, 2013.
RISK MANAGEMENTSAS works strategically to refine and improve its risk management. Risk management includes identifying new risks, increasing risks and known risks. The Group monitors the comprehensive risks centrally, while portions of risk management are conducted in the operations and include identifica-tion, action plans and policies.
Market risks: SAS is especially sensitive to global trends and events. However, the Group is active in several markets and is therefore affected by various economic cycles, thus mitigating the Group’s exposure to more lo-cal market risks. Due to the more stable economies in the Nordic region compared with the rest of Europe in 2012/2013, passenger growth was fa-vorable during the fiscal year. However, market capacity increased more than demand at the end of the fiscal year. SAS adjusts its production to en-sure the right capacity in each market to reduce market risk. The Group’s varied fleet of aircraft, comprised of different aircraft sizes, is well-suited for this purpose.
The airline industry is highly competitive since new airlines continuously enter the market in parallel with existing operators increasing (and decreas-ing) their capacity. Changes in customer behavior and an increasing num-ber of LCCs in the SAS Group’s home market are expected to result in con-tinued intense competition. To meet this, SAS is implementing its change program, which will introduce structural changes that will lower costs to lev-els that are competitive in the long-term.
Financial risks: SAS is exposed to various types of financial risk. All risk management is performed centrally pursuant to the financial policy adopt-ed by the Board. SAS utilizes derivative instruments as part of its financial risk management to limit exposure to currency, interest-rate and jet-fuel price risk; see Note 27. SAS hedges 40–80% of its anticipated fuel con-sumption on a rolling 12-month basis. This is done primarily to create enough time to adapt operations to market conditions. The SAS Group’s strategy for dealing with higher jet-fuel prices is based on the hedging of jet fuel, yield management and fare adjustments.
For foreign currency, the policy is to hedge 40–80%. In October 2013, SAS had hedged 46% of its anticipated USD deficit for the next 12 months. SAS has covered its USD deficit using a combination of forward contracts and options.
Overall risk management in the SAS GroupRisk management is implemented through the diversification of risk, operating policies, the Code of Conduct and hedging arrangements. For further infor-mation see pages 32–34.
Other risks• Natural disasters• Terror attacks• Conflicts• Epidemics
Market risks• Macro-economic
growth• Market impact• Competition – LCCs• Capacity change• Price trend
Operating risks• Unmotivated
personnel• Strikes• Incidents and
accidents• Crime and fraud• IT security
Environmental risks• Environmental
directives and requirements
• Laws and regulations• The market for
emission rights
Legal and political risks• Government user
fees and airline industry taxes
• Compliance risks – laws and internal rules
Financial risks• Counterparty losses• Liquidity risk• Fuel price• Interest rates• Exchange rates

40 SAS Group Annual Report November 2012–October 2013
Environmental risks: Environmental laws and regulations, including restric-tions on noise levels and greenhouse gas emissions, could have an adverse impact on SAS. The Group works continuously on sustainability issues to ensure compliance with national and international requirements.
Compliance risks: SAS manages and secures compliance risks through various kinds of internal policies and rules and develops internal guidelines as well as a Code of Conduct to manage these risks. The Group’s airline in-surance contracts are of the all-risks type and cover the aircraft fleet, spare parts and other technical equipment as well as liability exposure associated with airline operations.
SEASONAL EFFECTSDemand, measured as the number of transported passengers, in the SAS Group’s markets is seasonally low from December to February and at its peak from April to June and September to October. However, the share of advance bookings is greatest from January to May, which has a highly posi-tive effect on working capital ahead of the holiday period.
Seasonal fluctuations in demand impact cash flow and earnings differ-ently since passenger revenue is recognized when SAS or another company carries out the actual transportation, which results in revenue generally in-creasing during months in which more passengers are transported. Since a substantial share of an airline’s costs is fixed, earnings are impacted by fluc-tuations in revenue levels. Seasonal variations indicate that the third and fourth quarters (May–July and August–October) are seasonally the stron-gest quarters in terms of earnings. In the third quarter, cash flow from oper-ations is seasonally negative but positive in the fourth quarter.
THE SAS SHARE Share classesSAS AB has two classes of shares, common shares and subordinated shares. The Board of SAS has proposed to the 2014 AGM to allow the issue of prefer-ence shares and that the Board be authorized to decide on new issue of a maximum of 7 million preference shares up to the 2015 AGM. Furthermore, the Board has proposed the authorization of the Board until the 2015 AGM to issue convertible bonds with entitlement to a maximum of 130 million common shares on conversion. At October 31, 2013, there were 329 million common shares issued, which constitute a total registered share capital of MSEK 6,613. Common shares provide shareholders all of the rights laid down in the Swedish Companies Act and the Articles of Association.
In addition, the capacity exists to issue special subordinated shares to safeguard the company’s air traffic rights. Subordinated shares give share-holders the right to participate in and vote at SAS AB’s shareholders’ meet-ings. However, subordinated shares do not entitle shareholders to dividends or participation in bonus issues. If subordinated shares are redeemed or the company is dissolved and its assets distributed, holders of subordinated shares receive compensation equivalent only to the nominal value of the shares plus an interest-rate factor. For more information on subordinated shares, see Note 21.
No other authority has been provided to the Board empowering the Board to issue new shares or buy back treasury shares.
Share price performanceSAS AB’s market capitalization rose 202% in the November 2012 to Octo-ber 2013 period. Following the signing of the new collective agreements on November 19, 2012, the share price rose significantly. Another sharp increase in the share price occurred after the release of the interim report for the third quarter in September 2013.
Protection of the Group’s air traffic rights in the Articles of AssociationFor aviation policy reasons, the company’s Articles of Association authorizes, in part, the mandatory redemption of shares by means of a reduction of share capital and, in part, should redemption not be possible or be adjudged adequate, an option to issue subordinated shares for subscription with the support of previously issued warrants.
A precondition for both of these actions is an assessment by the company’s Board that a direct threat exists against the air traffic rights of the company or any of its subsidiaries when the company or its subsidiaries infringe or risk in-fringing provisions on ownership and control in bilateral aviation agreements or in laws or regulations pertaining to permits for air traffic in the EU/EEA.
In that case the Board may decide to mandatorily redeem a sufficient number of shares not owned by shareholders domiciled in Denmark, Norway or Sweden along with shares that, even if they are held by a legal entity domiciled in any of these countries, are controlled, directly or indirectly, by a person or company outside of these three countries, so as to ensure con-tinued Scandinavian ownership and control. Primarily, such mandatory re-demption of shares is performed on shares owned or controlled by a person or company outside the EU/EEA. Prior to redemption, the shareholders are given an opportunity to sell their shares voluntarily within a prescribed peri-od. Redemptions are made subsequently without refund to the shareholder since the reduction is to be transferred to the Company’s statutory reserve.
Should the Board deem the action of redeeming common shares not possi-ble or inadequate, the Board may propose a shareholders’ meeting to decide whether to issue subordinated shares in such number so as to safeguard con-tinued Scandinavian ownership and control. Such a decision must be approved by at least half of the votes cast at the meeting. The subordinated shares thus issued are subscribed for with the support of previously issued warrants, which are currently held by a subsidiary of SAS AB but which the Board of SAS AB has the right to decide to transfer to one or more appropriate legal entities domiciled in Denmark, Norway or Sweden as soon as this is judged necessary for aviation policy reasons. In total, there are 75,000 warrants issued, which provide entitlement to subscription of a total of 150,000,000 subordinated shares, which would increase the company’s share capital by a maximum of SEK 3,015,000,000. As soon as the threat no longer exists, the Board shall en-sure that the subordinated shares thus issued are redeemed.
Furthermore, for aviation policy reasons, the Articles of Association con-tain certain suitability and qualifications requirements for Board members to ensure that the Board will at all times have the composition it needs to en-sure that the company and its subsidiaries are able to retain their air traffic rights. These requirements include citizenship, domicile and knowledge and experience of the social, business and cultural conditions prevailing in the Scandinavian countries. Beyond these requirements and the regula-tions contained in the Articles of Association, there are no restrictions or voting rules pertaining to the appointment or removal of Board members.
Ownership and controlAt October 31, 2013, there were only three shareholders who each own and control more than 10% of the voting rights for all shares in the company. The Danish government owns 14.3%, the Norwegian government owns 14.3% and the Swedish government owns 21.4%. Combined, the three states own 50.0% of the shares in SAS AB. Scandinavian shareholders held about 85–90% and non-Scandinavian shareholders held about 10–15% of the total share capital in SAS AB.
No restrictions exist concerning the voting rights of shareholders at shareholders’ meetings and pursuant to the Swedish Companies Act, shareholders may vote for the entire number of shares they own or repre-sent by proxy. Nor are there any special plans, such as employee benefit plans or the like, through which company or Group employees own shares with restricted voting rights.
SAS AB has no knowledge of any agreements between shareholders that would restrict the capacity of shareholders to vote at a shareholders’ meeting or their right to freely transfer such shares.
Seasonal variations in the number of passengers transported, SAS Group 2004–2013
January = index 100.
50
100
150
DecNovOctSepAugJulJunMayAprMarFebJan
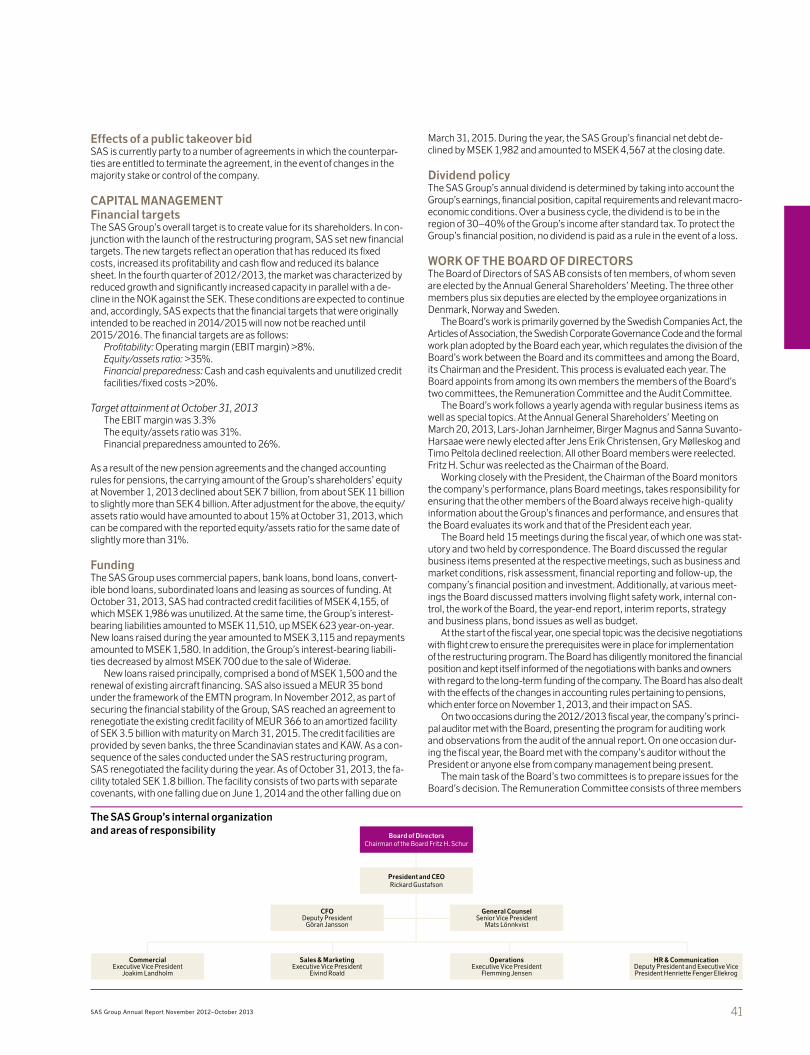
41SAS Group Annual Report November 2012–October 2013
Effects of a public takeover bidSAS is currently party to a number of agreements in which the counterpar-ties are entitled to terminate the agreement, in the event of changes in the majority stake or control of the company.
CAPITAL MANAGEMENTFinancial targetsThe SAS Group’s overall target is to create value for its shareholders. In con-junction with the launch of the restructuring program, SAS set new financial targets. The new targets reflect an operation that has reduced its fixed costs, increased its profitability and cash flow and reduced its balance sheet. In the fourth quarter of 2012/2013, the market was characterized by reduced growth and significantly increased capacity in parallel with a de-cline in the NOK against the SEK. These conditions are expected to continue and, accordingly, SAS expects that the financial targets that were originally intended to be reached in 2014/2015 will now not be reached until 2015/2016. The financial targets are as follows:
Profitability: Operating margin (EBIT margin) >8%.Equity/assets ratio: >35%. Financial preparedness: Cash and cash equivalents and unutilized credit facilities/fixed costs >20%.
Target attainment at October 31, 2013The EBIT margin was 3.3%The equity/assets ratio was 31%. Financial preparedness amounted to 26%.
As a result of the new pension agreements and the changed accounting rules for pensions, the carrying amount of the Group’s shareholders’ equity at November 1, 2013 declined about SEK 7 billion, from about SEK 11 billion to slightly more than SEK 4 billion. After adjustment for the above, the equity/assets ratio would have amounted to about 15% at October 31, 2013, which can be compared with the reported equity/assets ratio for the same date of slightly more than 31%.
FundingThe SAS Group uses commercial papers, bank loans, bond loans, convert-ible bond loans, subordinated loans and leasing as sources of funding. At October 31, 2013, SAS had contracted credit facilities of MSEK 4,155, of which MSEK 1,986 was unutilized. At the same time, the Group’s interest-bearing liabilities amounted to MSEK 11,510, up MSEK 623 year-on-year. New loans raised during the year amounted to MSEK 3,115 and repayments amounted to MSEK 1,580. In addition, the Group’s interest-bearing liabili-ties decreased by almost MSEK 700 due to the sale of Widerøe.
New loans raised principally, comprised a bond of MSEK 1,500 and the renewal of existing aircraft financing. SAS also issued a MEUR 35 bond under the framework of the EMTN program. In November 2012, as part of securing the financial stability of the Group, SAS reached an agreement to renegotiate the existing credit facility of MEUR 366 to an amortized facility of SEK 3.5 billion with maturity on March 31, 2015. The credit facilities are provided by seven banks, the three Scandinavian states and KAW. As a con-sequence of the sales conducted under the SAS restructuring program, SAS renegotiated the facility during the year. As of October 31, 2013, the fa-cility totaled SEK 1.8 billion. The facility consists of two parts with separate covenants, with one falling due on June 1, 2014 and the other falling due on
March 31, 2015. During the year, the SAS Group’s financial net debt de-clined by MSEK 1,982 and amounted to MSEK 4,567 at the closing date.
Dividend policyThe SAS Group’s annual dividend is determined by taking into account the Group’s earnings, financial position, capital requirements and relevant macro-economic conditions. Over a business cycle, the dividend is to be in the region of 30–40% of the Group’s income after standard tax. To protect the Group’s financial position, no dividend is paid as a rule in the event of a loss.
WORK OF THE BOARD OF DIRECTORSThe Board of Directors of SAS AB consists of ten members, of whom seven are elected by the Annual General Shareholders’ Meeting. The three other members plus six deputies are elected by the employee organizations in Denmark, Norway and Sweden.
The Board’s work is primarily governed by the Swedish Companies Act, the Articles of Association, the Swedish Corporate Governance Code and the formal work plan adopted by the Board each year, which regulates the division of the Board’s work between the Board and its committees and among the Board, its Chairman and the President. This process is evaluated each year. The Board appoints from among its own members the members of the Board’s two committees, the Remuneration Committee and the Audit Committee.
The Board’s work follows a yearly agenda with regular business items as well as special topics. At the Annual General Shareholders’ Meeting on March 20, 2013, Lars-Johan Jarnheimer, Birger Magnus and Sanna Suvanto-Harsaae were newly elected after Jens Erik Christensen, Gry Mølleskog and Timo Peltola declined reelection. All other Board members were reelected. Fritz H. Schur was reelected as the Chairman of the Board.
Working closely with the President, the Chairman of the Board monitors the company’s performance, plans Board meetings, takes responsibility for ensuring that the other members of the Board always receive high-quality information about the Group’s finances and performance, and ensures that the Board evaluates its work and that of the President each year.
The Board held 15 meetings during the fiscal year, of which one was stat-utory and two held by correspondence. The Board discussed the regular business items presented at the respective meetings, such as business and market conditions, risk assessment, financial reporting and follow-up, the company’s financial position and investment. Additionally, at various meet-ings the Board discussed matters involving flight safety work, internal con-trol, the work of the Board, the year-end report, interim reports, strategy and business plans, bond issues as well as budget.
At the start of the fiscal year, one special topic was the decisive negotiations with flight crew to ensure the prerequisites were in place for implementation of the restructuring program. The Board has diligently monitored the financial position and kept itself informed of the negotiations with banks and owners with regard to the long-term funding of the company. The Board has also dealt with the effects of the changes in accounting rules pertaining to pensions, which enter force on November 1, 2013, and their impact on SAS.
On two occasions during the 2012/2013 fiscal year, the company’s princi-pal auditor met with the Board, presenting the program for auditing work and observations from the audit of the annual report. On one occasion dur-ing the fiscal year, the Board met with the company’s auditor without the President or anyone else from company management being present.
The main task of the Board’s two committees is to prepare issues for the Board’s decision. The Remuneration Committee consists of three members
OperationsExecutive Vice President
Flemming Jensen
The SAS Group’s internal organization and areas of responsibility
CFODeputy President
Göran Jansson
General CounselSenior Vice President
Mats Lönnkvist
President and CEORickard Gustafson
HR & CommunicationDeputy President and Executive Vice President Henriette Fenger Ellekrog
Sales & MarketingExecutive Vice President
Eivind Roald
CommercialExecutive Vice President
Joakim Landholm
Board of DirectorsChairman of the Board Fritz H. Schur
42 SAS Group Annual Report November 2012–October 2013
and the Audit Committee of three members, all elected by the AGM. During the fiscal year, the Audit Committee held five minuted meetings, examining the scope and performance of external and internal auditing work, financial reporting and internal control. During the year, the Remuneration Commit-tee had one minuted meeting plus a number of informal meetings in con-nection with the adoption of guidelines and policies for remuneration and other employment terms for senior executives. These terms were reviewed in connection with the restructuring program. Prior to the 2014 AGM, the Remuneration Committee prepared the recommendation for remuneration policies and other terms of employment for company management that, pursuant to the Swedish Companies Act and the Swedish Corporate Gover-nance Code, the Board is obligated to present to the Meeting for resolution. The fees paid to Board members and remuneration for serving on the sepa-rate Board committees are reported in Note 3.
SAS prepares a separate corporate governance report; see page 82.
GUIDELINES FOR REMUNERATION OF SENIOR EXECUTIVESThe Remuneration Committee prepares remuneration policies applicable to the Group Management, which are subsequently addressed by the Board, which presents the motion to the Annual General Shareholders’ Meeting for resolution. Remuneration of the President is to be decided by the Board within the framework of approved policies following preparation and recom-mendation by the Remuneration Committee. Remuneration of other senior executives is decided by the President within the framework of approved policies and after consulting with the Remuneration Committee.
The guidelines adopted at the 2013 Annual General Shareholders’ Meeting are outlined in Note 3. During the fiscal year, one deviation from the stipulated guidelines was made with regard to the Executive Vice President for Sales & Marketing. The Board is of the opinion that he should receive variable remu-neration from 2013 with a target salary of 100%, comprising a fixed base salary of 60% and a variable salary of 40%. The variable salary portion is based on the outcome in relation to preset targets and is set in a target con-tract. The remuneration policies adopted by the Annual General Sharehold-ers’ Meeting permit the Board to deviate from the guidelines on an individual basis if particular reasons exist for so doing. The Board is of the opinion that particular reasons do exist for deviation from the policies regarding no variable remuneration to Group Management since (i) the model was introduced in parallel with a substantial reduction in the members of the Group Manage-ment’s annual salary and (ii) since the variable salary applies to the member of Group Management who is responsible for Sales & Marketing, which is a functional area where variable salary is an established market standard.
In conjunction with the negotiations regarding new collective agree-ments in 2012, a decrease in pay of between 5 and 20% was decided for all members of Group Management from December 1, 2012. The guidelines to be proposed to the Annual General Shareholders’ Meeting on February 18, 2014 are unchanged in relation to the remuneration policies adopted at the 2013 Annual General Shareholders’ Meeting.
SAFETY IN THE SAS GROUP Pervasive safety cultureThe safety culture in the SAS Group rests on the values, skills and experience of all employees throughout the organization. The safety culture includes actively learning, adapting and modifying individual and organizational behavior to constantly improve operations and reduce exposure to risk.
SAS’s safety work has top priority. The efforts are managed with the aim of achieving continuous improvements and a shared understanding of the importance of safety to the customers and to SAS. The Group’s safety policy is documented and applied throughout all operations. The management of SAS is continuously engaged in safety issues based on a safety policy that is documented, communicated and implemented in SAS operations.
In 2013, SAS worked proactively to identify and manage safety issues in its assessment of safety performance indicators that were introduced in 2011. Information is gathered from airline operations, crews, station activi-ties, technical maintenance and aviation security. This information is compiled in a hierarchical system of objective safety performance indicators, which show how well the daily operations are progressing in relation to the safety targets that SAS has identified. In addition, SAS has continued to develop a safety management system for flight safety to ensure the fulfillment of new requirements from civil aviation authorities in 2014. A new safety reporting system has been selected that is compatible with the pilots’ tablet devices and its implementation is planned for the start of 2014. Likewise, a new supplier has been selected for the administration of flight data, which is used to mea-
sure safety performance, that will deliver increased capacity and input data.SAS has a high level of flight safety with committed personnel at all levels.
All airlines in the Group hold IATA Operational Safety Audit (IOSA) certifica-tion which can be compared to ISO 9000 certification. To remain certified, the airlines must be audited and approved every second year by IATA following the original inspection. The last IOSA audit performed by SAS was in 2012. SAS only initiates code-share collaboration with other airlines that have IOSA certification or that have submitted to a comparable audit.
During the 2012/2013 fiscal year, the flight safety level in the SAS Group was high and in line with the current industry standard.
LEGAL ISSUESAs a consequence of the European Commission’s decision on the cargo in-vestigation in November 2010, SAS and other airlines fined by the Commis-sion are involved in various civil lawsuits in Europe (the UK, the Netherlands and Norway). SAS, which appealed the European Commission’s decision, contests its responsibility in all of these legal processes. Further lawsuits by cargo customers cannot be ruled out and no provisions have been made.
In June 2013, the European Commission and the EFTA Surveillance Authority decided to initiate a detailed investigation of whether the three state shareholders’ participation in the renewal of the SAS Group’s revolving credit facility (RCF) in November/December 2012 comprised a government subsidy.
In January 2014, the SAS pilot associations filed a lawsuit against SAS with the Swedish Labour Court claiming damages for breach of collective agreements. This comprises a claim for declaratory judgment and no financial damages are specified in the summons application. The dispute pertains to a large group of pilots employed at the Stockholm base but who worked out of the Copenhagen base, and the calculation and coordination of the rights to Swedish and Danish pension benefits of these pilots on changing bases.SAS has yet to respond but will contest all claims. Irrespective of the outcome of the dispute, the assessment of SAS is that the dispute will not have any material negative impact on SAS.
CONTRIBUTION BY SAS TO SUSTAINABLE DEVELOPMENT SAS has a sustainability policy which supports its ambition, based on the requirement regarding long-term financial performance, to reduce environ-mental impact and further social progress. Together with the Code of Conduct, the sustainability policy is a part of the SAS Corporate Manual that governs the Group’s operations.
Environmental responsibilityThe majority of the environmental impact comprises airline operations. Other environmental impact consists primarily of cabin and ground opera-tions, the majority of which comprises energy and water consumption as well as waste generation.
The environmental impact of airline operations mainly consists of emis-sions of carbon dioxide and nitrogen oxides related to the consumption of non-renewable fuels, as well as noise. To lessen the environmental impact, two long-term measures have the greatest potential according to SAS: con-tinuous renewal of the aircraft fleet to a newer generation and incorporation of biofuel blends to reduce total carbon emissions.
Airline operations use internationally type-approved aircraft according to ICAO certification standards. Environmental approval is an integral part of national registrations of aircraft. Environment-based national and/or local permits, rules and regulations provide a framework for aircraft use. The trend is toward a stricter environmental policy framework for the airline industry.
All of the airlines have approved and verified Monitoring, Reporting and Verification (MRV) plans as well as reports which are verified to meet statutory requirements in EU ETS. Otherwise, SAS is not aware of any changes in the policy framework that could have significant operational or financial conse-quences for its business during the coming fiscal years.
Scandinavian Airlines measures its eco-efficiency with a climate index, which tracks trends in airline operations relative to environmental impact. The climate index for Scandinavian Airlines improved by 4 percentage points to 96 at October 31, 2013 compared with the base year 2011. Scan-dinavian Airlines’ CO2 emissions per passenger kilometer decreased to 113 grams (117) during the fiscal year.
In general, the SAS Group’s airline operations are dependent on the licensed activities conducted by Ground Operations and Technical Opera-tions in workshops, vehicle maintenance bases and hangars and on the respective airport owners’ licenses for operations and glycol handling and thresholds for atmospheric emissions and noise. SAS has obtained all the

43SAS Group Annual Report November 2012–October 2013
necessary licenses and permits for its operations in Scandinavia.Airline operations have a dispensation for halon use and submit annual
reports to the authorities on consumption including leakages and storage. SAS estimates that the discharge of halon was slightly more than 27 kilo-grams during the fiscal year. During the year, the authorities did not issue SAS any orders with a material impact on the SAS Group’s activities.
During the fiscal year, aircraft operated by SAS Group airlines, in excep-tional cases, deviated from local approach and takeoff rules. It is the consid-ered opinion of SAS that none of the incidents had any material environ-mental consequences.
Otherwise, SAS was not involved in any environment-related disputes or complaints and has no known major environment-related liabilities or provi-sions for ground pollution or the like.
Corporate social responsibilityThe social responsibilities of SAS include responsibility for employees and for its impact on the surroundings and communities in which the Group operates. Given the organizational changes that have been decided, redun-dancies will continue to occur.
The issue of redundancy is managed through negotiations in compliance with national laws and practice. In addition, SAS has its own guidelines that permit transfer of employees between the national companies under a spe-cial arrangement negotiated between SAS and the personnel trade union organizations.
SAS reports sick leave and occupational injuries pursuant to national legislation. Efforts to reduce sick leave have priority.In the fiscal year, sick leave at Scandinavian Airlines was 8.0%.
SAS works actively on equal opportunity, based on the legislation in effect in each country. The diversity policy at SAS is based on equal treatment of all employees and job applicants. Work on equal treatment includes promotion of diversity and equality in all its forms. SAS Group Management consisted of one woman and six men at October 31, 2013. The proportion of women in the management groups that report direct to the Group Management was 29%.
With regard to human resources, the airlines plan and conduct regular in-service training of all certified personnel such as technicians, cabin crew and pilots. This is done to uphold competency standards, such as those required by air operator certificates (AOCs). In addition, SAS has an extensive manage-ment training program and a large number of web-based training programs. The PULS employee satisfaction survey shows that general job satisfaction in the SAS Group is declining. This is probably due to the major ongoing changes and the general uncertainty regarding the Group’s situation. Long-term plans are ongoing to address these issues. The response rate was declining but still relatively high.
The sustainability section of this report and the separate Sustainability Report for SAS in 2013 contain more complete descriptions of efforts at SAS to contribute to sustainable development.
PUNCTUALITY AND REGULARITYScandinavian Airlines achieved a punctuality rating (departures within 15 minutes) of 86.2% in 2012/2013, which represented a year-on-year decline. In February, implementation was started of a new IT system that suffered from teething issues, which negatively impacted punctuality. Vigorous efforts were made during the year to rectify the initial IT issues and during the August–October period punctuality for SAS was 89.8%.
PARENT COMPANYSAS AB is a Swedish public limited company registered in Stockholm, Sweden and the address of its head office is Kabinvägen 5, Arlanda, Stockholm, Sweden. SAS AB is the Parent Company of the SAS Group. The company conducts air traffic operations in a comprehensive Nordic and international network. At October 31, 2013, shareholders’ equity was MSEK 9,475, of which MSEK 2,389 was unrestricted equity. The equity/assets ratio was 72% on the closing date.
DIVIDEND 2012/2013The Board of Directors proposes to the 2014 AGM that no dividends be paid to SAS AB’s shareholders for the November 1, 2012–October 31, 2013 fis-cal year. This is motivated by the SAS Group’s financial position and future investment need for renewal of the aircraft fleet. A good financial position and financial flexibility will be important in completing all measures in the SAS change program as well as in future investments.
The Board proposes that dividends payable on any preference shares outstanding, which in accordance with the proposal to the Shareholders’
Meeting may be issued in the period up till the 2015 AGM, should be pay-able on a quarterly basis in an amount of SEK 12.50 per preference share, with a ceiling of SEK 50 per preference share.
The record dates proposed, ahead of the next AGM, for the quarterly divi-dends are May 5, August 5, and November 5 in 2014 and February 5 in 2015. Payment through Euroclear Sweden AB is expected to be carried out on May 8, August 8, and November 10 in 2014 and February 10 in 2015. The first time a dividend can be paid on a preference share, or, when applica-ble, a subscribed and paid-up preference share, is on the payment date fol-lowing the first record day after the share has been registered in the share register maintained by Euroclear Sweden AB in line with the provisions in the company’s Articles of Association.
PROPOSED DISPOSITION OF EARNINGSThe following Parent Company earnings are available for disposition by the Annual General Shareholders’ Meeting:
MSEK
Retained earnings 3,545Net income for the year –1,156Total unrestricted equity 2,389
The Board of Directors proposes that the earnings be allocated as follows:
MSEK
Dividends to holders of preference shares of SEK 50/prefer-ence share, on full utilization of the authorization1 350Retained earnings 2,039Total 2,389
1) 7 million preference shares * SEK 50
The position of the Group and Parent Company at October 31, 2013 and the earnings from operations for the 2012/2013 fiscal year are stated in the fol-lowing statements of income, balance sheets, cash-flow statements, chang-es in shareholders’ equity, comments on the financial statements and notes.
SIGNIFICANT EVENTS AFTER THE CLOSING DATE• In November, the SAS Group’s balance sheet and statement of income will
be affected as follows by the implementation of new pension terms, the re-versal of deferred tax liabilities related to pensions, the accounting for spe-cial payroll tax as part of the surplus in the Alecta and Euroben plans, and the implementation of the revised IAS 19. The above will negatively impact the Group’s shareholders’ equity in an amount of about SEK 7 billion:
– Pension commitments will be reduced by about SEK 12.9 billion– Plan assets will be reduced by about SEK 10.7 billion– Actuarial gains and losses will be impaired by about SEK 10.3 billion– Deferred tax liabilities will be reduced by about SEK 1.2 billion– An improvement in the statement of income (payroll expenses) of
SEK 1 billion.• The Board of SAS has proposed to the 2014 AGM that the Articles of Asso-
ciation be amended to allow the issue of preference shares and that the Board be authorized to decide on new issue of a maximum of 7 million pref-erence shares up to the 2015 AGM. Furthermore, the Board has proposed the authorization of the Board until the 2015 AGM to issue convertible bonds in an amount not exceeding SEK 2 billion, with entitlement to a max-imum of 130 million common shares on conversion.
FULL-YEAR 2013/2014Market conditions continue to be challenging with overcapacity in many of the Group’s markets and, accordingly, the yield and PASK (total passenger revenue/schedule ASK) is expected to decline in 2013/2014. The restruc-turing program is gradually increasing the Group’s competitiveness. In the 2013/2014 fiscal year, the earnings impact from the restructuring program is expected to amount to SEK 1.2 billion. Provided that market conditions, in terms of capacity, jet fuel and exchange rates, do not decline any further and that no unexpected events occur, potential exists to post a positive EBT, ex-cluding the positive effect from the amendments to pension reporting, also in the 2013/2014 fiscal year. As usual, however, due to seasonality, the first quarter of 2014 (November–January), will be extremely weak, but will be positively impacted by the changes to pension reporting.

44 SAS Group Annual Report November 2012–October 2013
The SAS Group’s consolidated statement of income including a statement of other comprehensive income
MSEK Note2012–2013
Nov–Oct2012
Jan–Oct
Revenue 2 42,182 35,986Payroll expenses1 3 –11,451 –11,584Other operating expenses2 4 –25,442 –22,105Leasing costs for aircraft3 –1,786 –1,342Depreciation, amortization and impairment 5 –1,658 –1,426Share of income in affiliated companies 6 25 32Income from the sale of shares in subsidiaries, affiliated companies and operations –371 400Income from the sale of aircraft and buildings 7 –118 –247Operating income 1,381 –286
Income from other holdings of securities 8 1 0Financial income 9 50 96Financial expenses 9 –999 –1,055Income before tax 433 –1,245
Tax 10 –254 260Net income for the year 179 –985
Other comprehensive income:Items that may later be reversed to the income statement:Exchange-rate differences on translation of foreign operations, net after tax of 11 (–1) –224 –29Cash-flow hedges – hedging reserve, net after tax of 6 (94) –23 –263Change in holdings in subsidiaries 1 -Total other comprehensive income for the year, net after tax –246 –292Total comprehensive income –67 –1,277
Net income for the year attributable to:Parent Company shareholders 178 –985Non-controlling interests 1 -Comprehensive income attributable to:Parent Company shareholders –69 –1,277Non-controlling interests 2 -
Earnings per share (SEK) 4 0.54 –2.99
1) Includes restructuring costs of MSEK 40 (979).2) Includes restructuring costs of MSEK –186 (295).3) Includes restructuring costs of MSEK - (39).4) Earnings per share is calculated on the basis of 329,000,000 (329,000,000) shares outstanding.
The SAS Group has no option or share programs. The convertible bond loan of MSEK 1,600 covering 34,408,602 shares has no dilution effect, as the interest rate per common share that can be obtained on conversion exceeds earnings per share before dilution.
Income before tax and nonrecurring items, MSEK2012–2013
Nov–Oct2012
Jan–Oct
Income before tax 433 –1,245Restructuring costs –146 1,313Capital gains 488 –153Other nonrecurring items 0 108Income before tax and nonrecurring items 775 23

45SAS Group Annual Report November 2012–October 2013
Comments on the consolidated statement of income
All figures in parenthesis pertain to the preceding fiscal year, 2012, which comprised 10 months (January–October). On September 30, 2013, the sale of 80% of the shareholding in Widerøe’s Flyveselskap AS (Widerøe) was completed, which means that Widerøe’s earnings are included for the November 2012 to September 2013 period (11 months).
The SAS Group’s operating income was MSEK 1,381 (–286) and income before tax and nonrecurring items totaled MSEK 775 (23).
Income before tax amounted to MSEK 433 (–1,245) and income after tax was MSEK 179 (–985). The tax expense totaled MSEK –254 (260), which included a tax expense due to the changed tax rate in Sweden from 26.3% to 22%, which resulted in a reduction in deferred tax assets linked to loss carryforwards. Earnings were also charged with capital losses that arose in conjunction with stock transfers, which were non-tax-deductible.
The exchange-rate trend had a negative impact on revenue and earnings. Due to the SAS Group’s weak financial position in the preceding year, exchange-rate hedging was performed to a lesser extent than normal and, accordingly, exchange-rate exposure increased over the current fiscal year.
The Group’s revenue amounted to MSEK 42,182 (35,986).The Group’s total operating expenses totaled MSEK –40,801 (–36,272).Payroll expenses amounted to MSEK –11,451 (–11,584), which included
restructuring costs of MSEK –40 (–979) and a positive effect of MSEK 450 attributable to changed terms for early retirement pensions, etc. This reduced the pension liability and generated a corresponding positive effect in the statement of income. Expenses for jet fuel amounted to MSEK –9,046 (–8,035) and other operating expenses, excluding jet-fuel costs, amounted to MSEK –16,396 (–14,070). Leasing costs totaled MSEK –1,786 (–1,342). Depreciation and amortization amounted to MSEK –1,658 (–1,426).
Income from sale of shares in subsidiaries, affiliated companies and operations totaling MSEK –371 (400) was primarily attributable to a capital loss from the sale of 80% of Widerøe, which amounted to MSEK –367 (0). Income in the corresponding year-earlier period pertained to property transactions and the sale of Flybussen. Income from sale of aircraft and buildings totaled MSEK –118 (–247), of which aircraft sales amounted to MSEK –118 (–257).
Income from other holdings of securities amounted to MSEK 1 (0).The Group’s net financial items amounted to MSEK –949 (–959), of which,
net interest expense accounted for MSEK –773 (–757), exchange-rate differ-ences for MSEK 3 (1) and other financial items MSEK –179 (–203), of which, MSEK 0 (–50) was classified as a nonrecurring item.
Total nonrecurring items amounted to MSEK –342 (–1,268) and comprised restructuring costs, capital gains/losses and other nonrecurring items. Restructuring costs amounted to MSEK 146 (–1,313), of which MSEK –40 (–979) pertained to payroll expenses, MSEK 186 (–280) the reversal of previous restructuring costs pertaining to properties and MSEK 0 (–54) to other operating expenses.
The capital loss was MSEK –488 (153) and pertained to the capital losses mentioned above. Other nonrecurring items amounted to MSEK 0 (–108) from an out of court settlement in the year-earlier period pertaining to a legal dispute in Cargo in an amount of MSEK –28, a provision of MSEK –30 for the renegotiation of suppliers’ agreements and financial expenses arising from renegotiation of the credit facility in an amount of MSEK –50.
CURRENCY EFFECTS ON SAS GROUP EARNINGSRevenue as well as operating expenses and financial items are affected significantly by exchange-rate fluctuations. Only approximately 25% of revenue and 20% of operating expenses are in Swedish kronor. The aggregate effect of currency fluctuations on the SAS Group’s operating income for 2012/2013 compared with the corresponding year-earlier period was MSEK –212. The currency effect on revenue and operating expenses was attributable to the strengthening of the Swedish krona. The difference between the years in the effect of exchange-rate differences on the financial net debt was MSEK 17. Comparing 2012/2013 with the corresponding year-earlier period, the total currency effect on income before tax was therefore MSEK –195.
Currency effect
MSEK
2012–2013 compared
with2011–2012
Nov–Oct
2012 compared with
2011 Jan–Oct
Revenue –1,027 87Payroll expenses 286 69Other operating expenses 697 –470Translation of working capital 34 –66Income from hedging of commercial flows –202 –517Operating income –212 –897
Net financial items 17 –14Income before tax –195 –911
Currency effects on net income for the year
MSEK2012–2013
Nov–Oct2012
Jan–Oct
Translation of working capital –17 –46Income from hedging of commercial flows –16 75Operating income –33 29
Currency effect on the Group’s financial net debt 3 1Income before tax –30 30

46 SAS Group Annual Report November 2012–October 2013
Statement of income excluding other comprehensive income – quarterly breakdown
MSEK 2012 2012–2013
Jan–Mar Apr–Jun Jul–Sep Oct Jan–Oct Nov–Jan Feb–Apr May–Jul Aug–Oct Nov–Oct
Revenue 9,591 11,392 11,096 3,907 35,986 9,597 9,933 11,593 11,059 42,182Payroll expenses –3,403 –3,323 –3,013 –1,845 –11,584 –3,216 –2,576 –2,943 –2,716 –11,451Other operating expenses –6,229 –6,870 –6,429 –2,577 –22,105 –6,119 –6,260 –6,379 –6,684 –25,442Leasing costs for aircraft –367 –413 –390 –172 –1,342 –397 –423 –480 –486 –1,786Depreciation, amortization and impairment –421 –434 –426 –145 –1,426 –426 –418 –426 –388 –1,658Share of income in affiliated companies –14 17 32 –3 32 –13 0 19 19 25Income from the sale of shares in subsidiaries, affiliated companies and operations 0 336 63 1 400 0 –302 0 –69 –371Income from the sale of aircraft and buildings –24 –73 –70 –80 –247 –7 –40 –39 –32 –118Operating income –867 632 863 –914 –286 –581 –86 1,345 703 1,381
Income from other holdings of securities 0 0 0 0 0 1 0 0 0 1Financial revenue 49 32 14 1 96 8 13 11 18 50Financial expenses –314 –293 –309 –139 –1,055 –251 –233 –236 –279 –999Income before tax –1,132 371 568 –1,052 –1,245 –823 –306 1,120 442 433
Tax 403 –51 –134 42 260 193 –82 –276 –89 –254Net income for the period –729 320 434 –1,010 –985 –630 –388 844 353 179
Attributable to:Parent Company shareholders –729 320 434 –1,010 –985 –630 –388 844 352 178Non-controlling interests 0 0 0 0 0 0 0 0 1 1
0
4,000
8,000
12,000
Q4Q3Q2Q1Q4Q3Q2Q1
MSEK
2012 2013
Revenue, 2012–2013 (Per quarter, according to the new November–October fiscal year)
–15
–10
–5
0
5
10
15
Q4Q3Q2Q1Q4Q3Q2Q1
2012 2013
%
EBIT margin, 2012–2013(Per quarter, according to the new November–October fiscal year)

47SAS Group Annual Report November 2012–October 2013
SAS Group consolidated balance sheet
ASSETS, MSEK Note Oct 31, 2013 Oct 31, 2012
Fixed assetsIntangible assets 11 1,802 1,922Tangible fixed assets 12Land and buildings 241 353Aircraft 8,795 11,220Spare engines and spare parts 147 1,349Workshop and aircraft servicing equipment 117 110Other equipment and vehicles 105 117Investment in progress 21 34Prepayments relating to tangible fixed assets 13 251 160
9,677 13,343Financial fixed assets 14Equity in affiliated companies 6 352 325Other holdings of securities 292 23Pension funds, net 15 12,507 12,232Deferred tax asset 10 536 597Other long-term receivables 2,249 1,250
15,936 14,427Total fixed assets 27,415 29,692
Current assetsExpendable spare parts and inventories 16 359 687Prepayments to suppliers 2 0
361 687Current receivables 17Accounts receivable 1,376 1,311Receivables from affiliated companies 18 1 3Other receivables 866 1,399Prepaid expenses and accrued income 19 858 873
3,101 3,586Cash and cash equivalentsShort-term investments 20 2,080 366Cash and bank balances 2,671 2,423
4,751 2,789Total current assets 8,213 7,062TOTAL ASSETS 35,628 36,754
SHAREHOLDERS’ EQUITY AND LIABILITIES, MSEK Note Oct 31, 2013 Oct 31, 2012
Shareholders’ equityShare capital 21 6,613 6,613Other contributed capital 337 337Reserves 22 –230 17Retained earnings 4,367 4,189Total shareholders’ equity attributable to Parent Company owners 11,087 11,156Non-controlling interests 16 -Total shareholders’ equity 11,103 11,156
Longterm liabilities 23Subordinated loans 24 956 978Bond loans 25 2,641 2,763Other loans 26 5,054 5,260Deferred tax liability 10 938 1,013Other provisions 28 1,361 1,967Other liabilities 161 130
11,111 12,111Current liabilitiesCurrent portion of long-term loans 2,517 1,403Short-term loans 29 231 411Prepayments from customers 16 0Accounts payable 1,689 1,929Tax payable 36 32Unearned transportation revenue 30 3,932 4,292Current portion of other provisions 28 855 1,186Other liabilities 722 1,033Accrued expenses and prepaid income 31 3,416 3,201
13,414 13,487TOTAL SHAREHOLDERS’ EQUITY AND LIABILITIES 35,628 36,754
Book equity per share (SEK)1 33,70 33.91
Information about the Group’s pledged assets, contingent liabilities and leasing commitments is given in Notes 32, 33 and 34.
1) Calculated on 329,000,000 (329,000,000) shares outstanding. No dilution occurred during the year.
Comments on the consolidated balance sheet
AssetsThe SAS Group’s total assets decreased from MSEK 36,754 to MSEK 35,628 in the November 1, 2012 – October 31, 2013 fiscal year.
Investment for the fiscal year amounted to MSEK 1,877 and pertained, primarily, to the purchase of aircraft, spare parts, engine maintenance and aircraft modifications. Aircraft investments totaled MSEK 1,058, of which aircraft purchases comprised MSEK 711 for 15 aircraft – eight MD-82s, four Boeing 717s that were previously on operational leases, two Airbus A320s and one Bombardier Q300 that was previously under an operational lease with Widerøe. Of these aircraft, four MD-82s were sold on during the year.
A total of 18 aircraft were sold during the fiscal year and, together with the spare engines sold in the second quarter, total revenue from these sales was about SEK 1.5 billion. In September, 80% of the shares in Widerøe’s Flyveselskap AS were sold and the remaining 20% reported under other se-curities holdings.
At October 31, 2013, book net pension funds totaled MSEK 12,507. At December 31, 2012, the value of book net pension funds was MSEK 12,232 (see also Note 15).
At the end of the fiscal year, cash and cash equivalents amounted to MSEK 4,751, which was an increase of MSEK 1,962 since October 31, 2012. Cash and cash equivalents totaled 13% of total assets.
Shareholders’ equityTotal shareholders’ equity decreased by MSEK 53 to MSEK 11,103. Net in-come for the year was MSEK 179. Other comprehensive income was net MSEK –246, the majority of which was attributable to translation of foreign operations at MSEK –224. At October 31, 2013, the equity/assets ratio was 31% (30) and equity per share was SEK 33.70 (33.91).
LiabilitiesAt October 31, 2013, MSEK 11,510 (10,887) of total liabilities was interest-bearing. The value of contracted credit facilities was MSEK 4,155 (7,113) of which MSEK 1,986 (5,266) was unutilized. Amortization in the fiscal year amounted to MSEK 1,580 (2,572) and the year’s borrowing amounted to MSEK 3,115 (714), of which the majority comprised new bond loans and re-placement finance for aircraft.
Financial net debt excluding net pension funds amounted to MSEK 4,567 (6,549), corresponding to a decrease of MSEK 1,982 from the start of the year. This was primarily due to the sale of Widerøe and funds generated from operations.
Total capital employed amounted to MSEK 22,613 (22,043) at year-end. Average capital employed during the year was MSEK 21,530 (24,757). Re-turn on capital employed was 7% (–8).
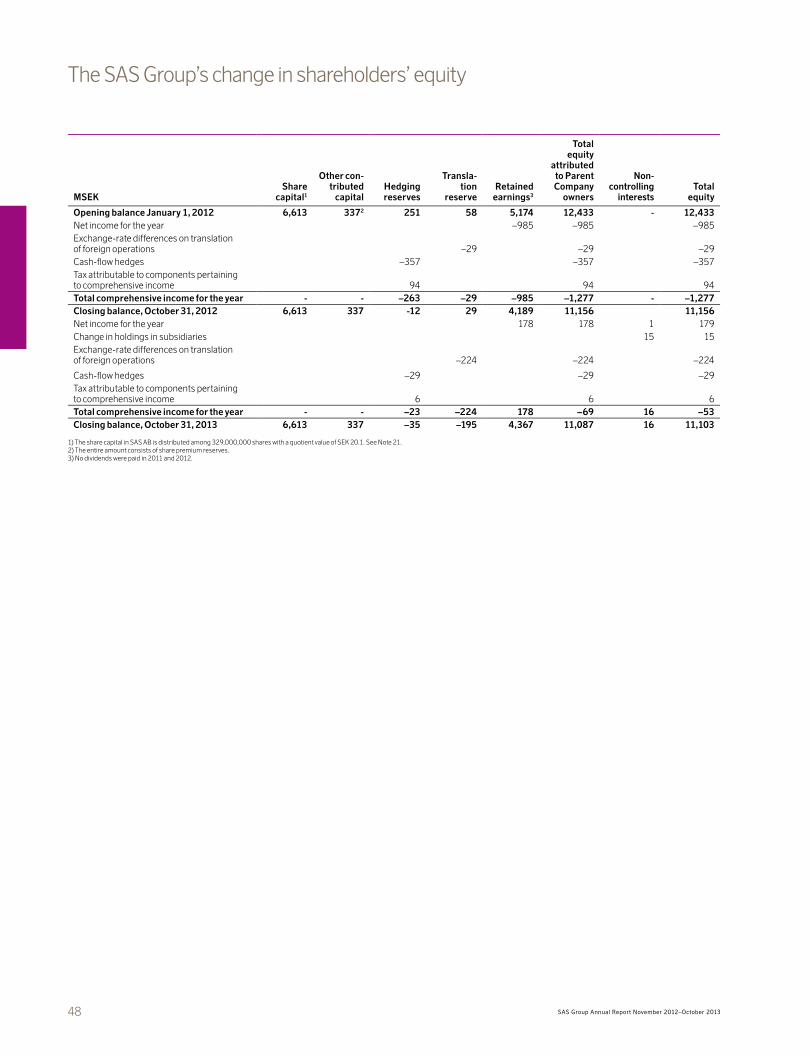
48 SAS Group Annual Report November 2012–October 2013
The SAS Group’s change in shareholders’ equity
MSEKShare
capital1
Other contributed
capital Hedging reserves
Translation
reserve Retained
earnings3
Total equity
attributed to Parent Company
owners
Non controlling
interestsTotal
equity
Opening balance January 1, 2012 6,613 3372 251 58 5,174 12,433 12,433Net income for the year –985 –985 –985Exchange-rate differences on translation of foreign operations –29 –29 –29Cash-flow hedges –357 –357 –357Tax attributable to components pertaining to comprehensive income 94 94 94Total comprehensive income for the year –263 –29 –985 –1,277 –1,277Closing balance, October 31, 2012 6,613 337 12 29 4,189 11,156 11,156Net income for the year 178 178 1 179Change in holdings in subsidiaries 15 15Exchange-rate differences on translation of foreign operations –224 –224 –224
Cash-flow hedges –29 –29 –29Tax attributable to components pertaining to comprehensive income 6 6 6Total comprehensive income for the year –23 –224 178 –69 16 –53Closing balance, October 31, 2013 6,613 337 –35 –195 4,367 11,087 16 11,103
1) The share capital in SAS AB is distributed among 329,000,000 shares with a quotient value of SEK 20.1. See Note 21.2) The entire amount consists of share premium reserves. 3) No dividends were paid in 2011 and 2012.
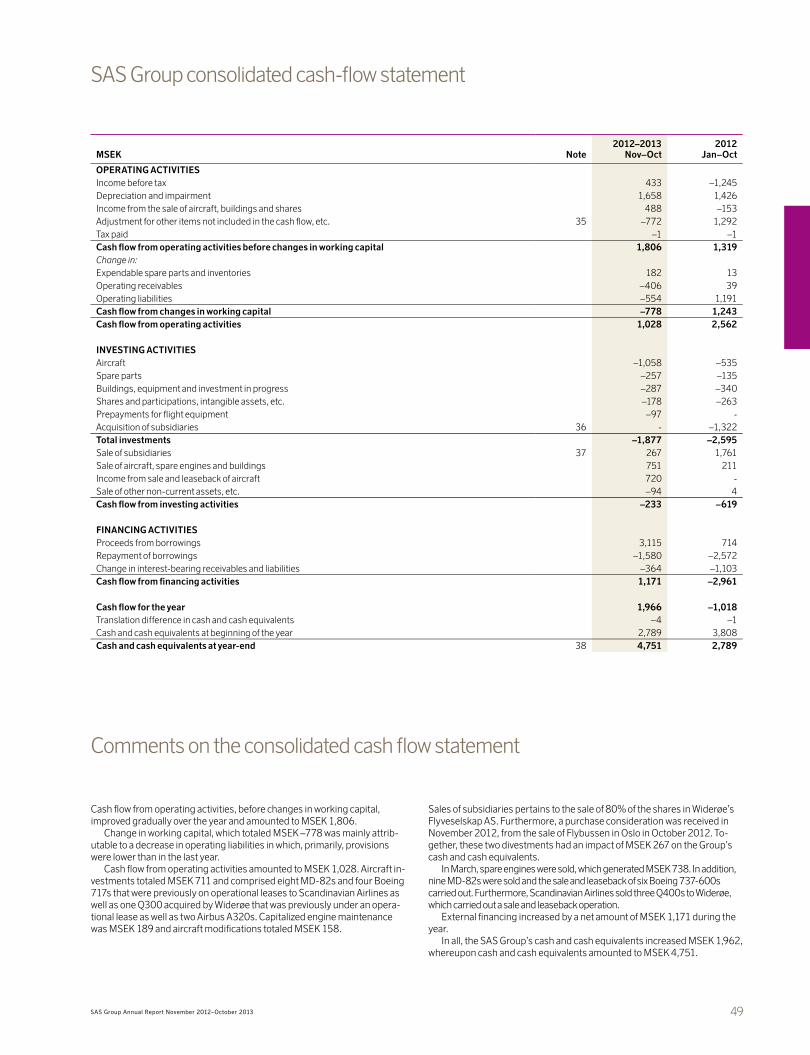
49SAS Group Annual Report November 2012–October 2013
MSEK Note2012–2013
Nov–Oct2012
Jan–Oct
OPERATING ACTIVITIESIncome before tax 433 –1,245Depreciation and impairment 1,658 1,426Income from the sale of aircraft, buildings and shares 488 –153Adjustment for other items not included in the cash flow, etc. 35 –772 1,292Tax paid –1 –1Cash flow from operating activities before changes in working capital 1,806 1,319Change in:Expendable spare parts and inventories 182 13Operating receivables –406 39Operating liabilities –554 1,191Cash flow from changes in working capital –778 1,243Cash flow from operating activities 1,028 2,562
INVESTING ACTIVITIESAircraft –1,058 –535Spare parts –257 –135Buildings, equipment and investment in progress –287 –340Shares and participations, intangible assets, etc. –178 –263Prepayments for flight equipment –97 -Acquisition of subsidiaries 36 - –1,322Total investments –1,877 –2,595Sale of subsidiaries 37 267 1,761Sale of aircraft, spare engines and buildings 751 211Income from sale and leaseback of aircraft 720 -Sale of other non-current assets, etc. –94 4Cash flow from investing activities –233 –619
FINANCING ACTIVITIESProceeds from borrowings 3,115 714Repayment of borrowings –1,580 –2,572Change in interest-bearing receivables and liabilities –364 –1,103Cash flow from financing activities 1,171 –2,961
Cash flow for the year 1,966 –1,018Translation difference in cash and cash equivalents –4 –1Cash and cash equivalents at beginning of the year 2,789 3,808Cash and cash equivalents at yearend 38 4,751 2,789
Comments on the consolidated cash flow statement
SAS Group consolidated cash-flow statement
Cash flow from operating activities, before changes in working capital, improved gradually over the year and amounted to MSEK 1,806.
Change in working capital, which totaled MSEK –778 was mainly attrib-utable to a decrease in operating liabilities in which, primarily, provisions were lower than in the last year.
Cash flow from operating activities amounted to MSEK 1,028. Aircraft in-vestments totaled MSEK 711 and comprised eight MD-82s and four Boeing 717s that were previously on operational leases to Scandinavian Airlines as well as one Q300 acquired by Widerøe that was previously under an opera-tional lease as well as two Airbus A320s. Capitalized engine maintenance was MSEK 189 and aircraft modifications totaled MSEK 158.
Sales of subsidiaries pertains to the sale of 80% of the shares in Widerøe’s Flyveselskap AS. Furthermore, a purchase consideration was received in November 2012, from the sale of Flybussen in Oslo in October 2012. To-gether, these two divestments had an impact of MSEK 267 on the Group’s cash and cash equivalents.
In March, spare engines were sold, which generated MSEK 738. In addition, nine MD-82s were sold and the sale and leaseback of six Boeing 737-600s carried out. Furthermore, Scandinavian Airlines sold three Q400s to Widerøe, which carried out a sale and leaseback operation.
External financing increased by a net amount of MSEK 1,171 during the year.
In all, the SAS Group’s cash and cash equivalents increased MSEK 1,962, whereupon cash and cash equivalents amounted to MSEK 4,751.
50 SAS Group Annual Report November 2012–October 2013
Note 1 Significant accounting policies
GeneralSAS AB (the “Company”) and its subsidiaries (collectively referred to as the “Group”) provide transportation services.
The core business of the Group is operating passenger flights on an extensive Nordic and international route network. The Group’s three main operational hubs in Copenhagen, Stockholm and Oslo form the backbone of its flight network. In addition to passenger flights, the Group provides air cargo and other aviation services at selected airports in the Group’s route network. The Group’s operations include Scandinavian Airlines and Widerøe. However, as of September 30, 2013, 80% of the shareholding in Widerøe had been disposed of. In addition to the airline operations of the consortium Scandinavian Airlines System, Scandinavian Airlines also comprises ground operations, technical operations, SAS Cargo and Blue1. Besides these operations there are Group-wide functions and other opera-tions.
SAS AB is a Swedish public limited company domiciled in Stockholm and the address of its head office is Kabinvägen 5, Arlanda, Stockholm. SAS AB is the Parent Company of the SAS Group.
At the Annual General Shareholders’ Meeting (AGM) of the SAS Group on April 19, 2012 a resolution was passed to change the Group’s fiscal year to comprise the period November 1–October 31 instead of the calendar year and that the fiscal year for 2012 be shortened to comprise the period January 1–October 31, 2012. Accordingly, the Annual Report, including notes, for the November 1, 2012–October 31, 2013 fiscal year will be compared with the preceding fiscal year, which comprised the period January 1–October 31, 2012.
The consolidated financial statements have been prepared in accor-dance with the EU-approved International Financial Reporting Standards (IFRS) and interpretations issued by the International Financial Reporting Interpretations Committee (IFRIC) that apply for the fiscal year starting on November 1, 2012. These standards have been consistently applied to all periods presented in the Group’s financial statements. The financial state-ments have been prepared on a cost basis, except for the remeasurement of financial assets and liabilities. The principal accounting policies adopted are set out below.
Accounting estimates and assumptions in the financial statementsThe preparation of financial statements in accordance with IFRS requires management to perform estimates and assumptions that influence the application of the accounting policies and the carrying amounts of assets, liabilities, income and expenses. Actual outcome may differ from these esti-mates and assumptions.
The estimates and assumptions are regularly reviewed. Changes in esti-mates are recognized in the period in which the change is made if the change affects only that period, or in the period in which the change is made and future periods if the change affects both the current and future periods. For more information, see “Critical accounting judgments and key sources of estimation uncertainty” below.
New and amended standards and interpretations 2012/2013None of the IFRS or IFRIC interpretations that were mandatory for first time in the fiscal year starting November 1, 2012 had any material impact on the Group other than that specified below:
IAS 1 — Presentation of Financial Statements, changed with regard to other comprehensive income. The primary amendment is the requirement to group items recognized in other comprehensive income based on whether or not they can be reclassified to profit and loss in the future. The amendment has meant the addition of new row headings in the statement of other com-prehensive income.
New standards, amendments and interpretations of existing standards where the amendments are not yet effective and have not been adopted early by the GroupThe following new, amended standards and interpretations of existing stan-dards have been issued and are mandatory for the accounting of the Group for fiscal years beginning on or after November 1, 2013, but have not been adopted early:
IAS 19 Employee Benefits (Amended) means that it is no longer permitted to defer recognition of certain deviations in estimates (the “corridor” approach has now been eliminated) and all estimates are to be immediately recognized in other comprehensive income. Pursuant to the amended standard, accu-mulated unrecognized deviations “Unrecognized deviations from estimates and plan amendments” will be recognized in their entirety in shareholders’ equity, which will have a material negative impact on the Group’s sharehold-ers’ equity. The Parent Company SAS AB’s recognized shareholders’ equity will not be affected by this amendment. Furthermore, interest expense and expected return on plan assets are replaced with a “net interest,” which is calculated using the discount rate used to measure the net defined-benefit pension obligation or pension assets. SAS intends to classify this net inter-est expense as a payroll expense and recognize the net interest expense in profit or loss. Recognition of actuarial gains and losses as well as plan amendments will also mean that deferred tax liabilities linked to pensions will be dissolved when the temporary difference between the accounting and tax values disappears. The effect of dissolving deferred tax liabilities linked to pensions amounts to about SEK 1.5 billion, which positively impacts the SAS Group’s shareholders’ equity.
The remaining pension plans in Sweden (the Alecta plan and Euroben) reported a surplus of about SEK 5 billion as of November 1, 2013. This sur-plus may benefit SAS in the form of future reductions in premiums and, accordingly, special payroll tax will be recognized for the surplus. This re-sults in a net increase in pension funds of about SEK 1.2 billion, deferred tax liabilities of about SEK 0.2 billion and shareholders’ equity of about SEK 1 billion.
IAS 19 including amendments will be applied for fiscal years starting January 1, 2013 and onwards. As a result of the changes to the Group’s fiscal year, the Group will retroactively apply the amended standard for the fiscal year starting November 1, 2013. As a result of the amendments in IAS 19, the Swedish Financial Reporting Board has withdrawn UFR 4 Accounting for special payroll tax and tax on returns. Instead, the Group will report special payroll tax in line with the rules in IAS 19, which means that those actuarial assumptions made in the calculation of defined-benefit pen-sion plans must also include taxes payable on pension benefits.
In November 2012, new collective agreements were signed with flight crew in Scandinavia. Among other things, the new agreements mean that the defined-benefit pension plans were largely replaced with defined- contribution pension plans effective as of the first quarter of 2013/2014. When the above changes are reported in the first quarter of 2013/2014, the pension commitment will be reduced by about SEK 12.9 billion. In addition, the change in terms will give rise to an improvement in earnings of about SEK 1 billion.
In addition to the transition to defined-contribution pension plans, other measures included the removal of early retirement and part-time pensions, the lowering of pensionable income and raising the retirement age for cabin crew under the Alecta plan from 60 to 65. These changes have brought about an improvement in earnings of MSEK 450 in the 2012/2013 fiscal year and reduced pension commitments and actuarial gains and losses by about SEK 1.7 billion. In addition, the sale of 80% of Widerøe in September 2013 further reduced pension commitments by about SEK 2.8 billion and actuarial gains and losses by about SEK 1.1 billion.
At October 31, 2012, pension commitments totaled SEK 33.5 billion. In the 2012/2013 fiscal year, pension commitments were reduced by about SEK 5 billion and following recognition of the transition to defined-contribu-tion pension plans, the total reduction will be about SEK 18 billion. Since some employees already have early retirement and part-time pensions in place, this commitment will decrease over the next five years and, at the end of the 2017/2018 fiscal year, pension commitments are therefore expected to amount to approximately SEK 14 billion, which means a reduction of about SEK 19.5 billion, or about 60% of the original pension commitments.
Taken together, the above means that shareholders’ equity will be im-paired by about SEK 7 billion on the introduction of the revised IAS 19 on November 1, 2013 and the reporting of the changed terms and conditions in the first quarter 2013/2014.
IFRS 7 Financial Instruments: Disclosures (amendment), applying to dis-closures related to the offsetting of assets and liabilities.
IFRS 9 Financial Instruments replaces the parts of IAS 39 relating to the classification and measurement of financial instruments. IFRS 9 provides that financial instruments be classified in two categories; those measured at fair value and those measured at amortized cost. Classification is estab-
Notes to the financial reports Expressed in millions of Swedish kronor (MSEK) unless otherwise stated.

51SAS Group Annual Report November 2012–October 2013
lished at initial recognition based on the company’s business model and the characteristics of the contractual terms applying to cash flows. No material changes are implied for financial liabilities compared with IAS 39. The most significant change applies to liabilities identified at fair value. This provides that the portion of change in fair value attributable to changes in the credit risk be recognized in other comprehensive income instead of profit or loss if so doing does not give rise to accounting mismatch. The Group intends to apply the amended standard, at the latest, for the fiscal year starting Janu-ary 1, 2015 and has as not yet evaluated its effects. The standard has yet to be adopted by the EU.
IFRS 10 Consolidated Financial Statements (new) provides further guid-ance that can aid in determining control. The Group intends to apply IFRS 10 for the fiscal year commencing January 1, 2013 and does not expect the standard to have any impact on the financial statements.
IFRS 12 Disclosures of Interests in Other Entities (new) includes the disclo-sure requirements for subsidiaries, joint arrangements, associated compa-nies and unconsolidated structured entities. The Group intends to apply IFRS 12 for the fiscal year commencing January 1, 2013 and expects the standard to only impact the disclosure requirements for the financial state-ments.
IFRS 13 Fair Value Measurement (new) aims to reduce complexity by pro-viding a more precise definition of fair value and making disclosure require-ments more standardized. In the Group’s opinion, the standard only entails expanded supplementary disclosures.
No other IFRS or IFRIC interpretations that have not yet come into effect are expected to have any material impact on the Group.
Principles of consolidationThe consolidated financial statements include the financial statements of the Parent Company and the entities controlled by the Company. Controlling in-fluence (control) is achieved when the Group directly or indirectly owns more than 50% of the voting rights or has the right to shape or govern the financial and operating strategies of an entity so as to obtain economic benefits.
Entities in which the Group has an ownership interest of at least 20% and no more than 50% or where the Group has significant influence by other means but cannot exercise control are affiliated companies. Affiliates are accounted for under the equity method of accounting.
The earnings of subsidiaries acquired during the year are included in the Group’s earnings from the effective date of control. The separate net assets, both tangible and intangible, of newly acquired subsidiaries are consolidat-ed into the financial statements on the basis of the fair value to the Group as of the effective date of control. The earnings of subsidiaries disposed of dur-ing the fiscal year are included in the Group’s earnings up to the effective date of disposal.
Non-controlling interest in the net assets of consolidated subsidiaries is recognized in the consolidated balance sheet as a separate component of equity. The Group’s earnings and components in other comprehensive income are attributable to the Parent Company’s owners and to the non-controlling interests’ owners, even if this generates a negative value for the non-controlling interest. All intra-Group transactions, balance-sheet items, income and expenses are eliminated on consolidation.
Business combinationsAcquisitions of subsidiaries and businesses are accounted for using the purchase method. The cost of the business combination is measured as the aggregate of the fair values (at the date of acquisition when controlling influence is achieved) of the assets transferred, liabilities incurred or assumed, and equity shares issued by the Group in exchange for control of the acquiree. Acquisition-related costs are recognized in profit or loss when they are incurred. The cost also includes fair value at the date of acqui-sition for the assets or liabilities that arise from any agreement governing a contingent consideration. Changes to fair value for a contingent consider-ation that arise due to additional information received after the date of ac-quisition regarding facts or conditions present at the date of acquisition, qualify as adjustments during the measurement period and are adjusted retroactively, with a corresponding adjustment of goodwill. All other chang-es to fair value for contingent considerations that are classified as assets or liabilities are recognized in accordance with the applicable standard. Contin-gent considerations classified as equity are not remeasured and any subse-quent adjustment is reported in equity.
The acquiree’s identifiable assets, liabilities and contingent liabilities that qualify for recognition under IFRS 3 Business Combinations are recognized at fair value on the date of acquisition, with the following exceptions: • Deferred tax assets or liabilities and assets or liabilities attributable to the
acquiree’s agreement governing employee remuneration are recognized and measured pursuant to IAS 12 Income Taxes and IAS 19 Employee Benefits respectively.
• Liabilities or equity instruments attributable to the acquiree’s share-based allocations or to the exchange of the acquiree’s share-based allocations against the acquirer’s share-based allocations are measured at the acqui-sition date in accordance with IFRS 2 Share-based Payment.
• Non-current assets (or disposal groups) that are classified as held for sale in accordance with IFRS 5 Non-current Assets Held for Sale and Discontin-ued Operations are measured pursuant to that standard.
For each business combination, the non-controlling interest in the acquiree is measured either at fair value or at the value of the proportional share of the acquiree’s identifiable net assets. In the case of step acquisitions, previ-ously held equity shares in the acquiree are remeasured at fair value at the date of acquisition (i.e. when controlling influence is achieved). Any gain or loss is recognized in profit or loss. Any changes in the value of the previously held equity shares recognized in other comprehensive income prior to the date of acquisition are reclassified and recognized in profit or loss on the same basis as would be required if these shares had been sold. In business combinations where the sum of the cost, any non-controlling interests and fair value at the date of acquisition for previously held equity exceeds fair value at the date of acquisition on identifiable acquired net assets, the differ-ence is recognized as goodwill in the balance sheet. If the difference is nega-tive, this is recognized as a gain from a bargain purchase directly in profit or loss, following a review of the difference.
Transactions with non-controlling interestsChanges in the Parent Company’s share in a subsidiary that do not lead to a loss of controlling influence are recognized as equity transactions (in other words, as transactions with the Group’s owner). Any difference between the sum by which the non-controlling interest has been adjusted and the fair value of the consideration made or received is recognized directly in equity and distributed to the owners of the Parent Company.
Loss of controlling influenceWhen the Parent Company loses controlling influence of a subsidiary, the profit or loss is calculated at the divestment as the difference between: • the sum of the fair value for the consideration received and the fair value of
any remaining holdings and • the previously recognized values of the subsidiary’s assets (including
goodwill) and liabilities as well as any non-controlling interest.
When the divested subsidiary has assets measured according to the revalu-ation method or at fair value and the attributable accumulated gains or loss-es have been recognized in other comprehensive income and accumulated in equity, these sums, which were previously recognized in other compre-hensive income and accumulated in equity, are recognized as if the Parent Company had divested the assets directly, resulting in a reclassification to income or direct transfer to retained earnings.
The fair value of the remaining holdings in the former subsidiary at the date controlling influence is lost is viewed as the fair value at the first ac-counting opportunity for a financial asset pursuant to IAS 39 Financial In-struments: Recognition and Measurement or, when applicable, the cost at the first accounting opportunity for an investment in an affiliated company or jointly controlled entity.
Investments in affiliated companiesAffiliated companies are accounted for using the equity method from the date significant influence commenced until the date that significant influ-ence effectively ceased.
The earnings of affiliated companies are accounted for based upon the Group’s proportional ownership of the results of these affiliated companies. Any losses arising from affiliated companies are recorded in the consolidat-ed financial statements until the investment in such affiliated companies is impaired to zero. Thereafter, losses are only accounted for to the extent that the Group is committed to providing financial support to such affiliated com-panies.
The carrying amount of investments in affiliated companies represents the cost of each investment, including goodwill, the share of retained earn-ings following acquisition and any other changes in equity. The carrying amount of investments in affiliated companies is reviewed on a regular basis and if any decline in value has occurred, it is impaired in the period in which this occurred.
Profits and losses resulting from transactions with affiliated companies are eliminated in proportion to the Group’s interest in these affiliated com-panies.
Note 1, continued

52 SAS Group Annual Report November 2012–October 2013
Discontinued operations and assets held for saleWhen the Group intends to dispose of, or classify as “held for sale,” a business component that represents a separate major line of business or geographical area of operations, it classifies it as discontinued. The net profit or loss from discontinued operations is reported in the statement of income, separate from the other results of the Group and the accounting for the comparative period is shown to present the discontinued operations separately from the continuing operations.
Assets held for sale are measured at the lower of carrying amount and fair value less selling costs. Fixed assets and disposal groups are classified as held for sale if their carrying amount will be recovered through a sale transaction rather than through continuing use. This condition is regarded as met when a decision has been made by the management and Board to dispose of the business, an active sales process has commenced, and the asset is available for immediate sale in its present condition, and it is highly probable that the sale will take place within one year.
Segment reportingIdentification of reportable segments is performed based on the external reporting to the Chief Operating Decision Maker (CODM), which for SAS is the President. The Group is governed and reported according to the segments described below. The accounting policies applied in segment reporting coincide with the Group’s accounting policies according to the description contained in this note.
The SAS Group’s operating segments consist of Scandinavian Airlines and Widerøe. However, as of September 30, 2013, 80% of the shareholding in Widerøe had been disposed of. The results of the segments are utilized by the CODM to monitor and manage operations. Other operations include some common service and management functions.
The CODM does not regularly review the operating results of remaining operations, and accordingly these operations are not reported as separate segments. They are included in the tables in Note 41 in the column under Other.
All operations, whether they are corporations or business units, are to have a businesslike relationship with customers and suppliers within the Group.
The performance of the segments is evaluated on the basis of an operating income metric, with the segment information presented per business area by operating income, EBIT. Other items are not broken down by business area.
Geographic information about revenue from external customers:Traffic revenue from domestic services in Denmark, Norway and Sweden is allocated to Domestic. Traffic between the three countries is allocated to Intra-Scandinavian. Other traffic revenues are allocated to the geographical area where the destination is located.
Other revenue is allocated to a geographical area based on the customer’s geographical location relating, for example, to goods exported to a customer in another country or, alternatively, the geographical location where the service is performed.
Assets broken down by geographic area do not include the Group’s air-craft and spare parts. Since aircraft are utilized in a flexible manner across the route network, there is no justifiable basis for allocating these assets.
Foreign currency translationThe individual financial statements of the entities in the Group are measured in the functional currency of the entities, i.e., the currency of the primary economic environment in which they operate.
Transactions in currencies other than the entity’s functional currency (foreign currencies) are remeasured at the rates of exchange prevailing on the dates of the transactions. At each balance-sheet date, monetary assets and liabilities that are denominated in foreign currencies are retranslated at the rates prevailing on the balance-sheet date. Non-monetary items carried at fair value that are denominated in foreign currencies are translated at the rates prevailing at the date when the fair value was determined. Non-mone-tary items that are measured in terms of cost in a foreign currency are not retranslated.
Exchange differences arising from the retranslation are recognized as a gain or loss in the period in which they arise except for exchange differences on transactions entered into to hedge net investments in foreign subsidiaries and exchange differences relating to monetary items receivable from or payable to a foreign operation for which settlement is neither planned nor likely to occur and, which form part of the net investment in a foreign opera-tion. These differences are recognized in other comprehensive income.
For the purpose of presenting consolidated financial statements, the assets and liabilities of the Group’s foreign operations are translated at ex-change rates prevailing on the balance-sheet date. Revenue and expense
items are translated at the average exchange rates for the period, provided that exchange rates do not fluctuate substantially in the period. In the latter case, the exchange rate on the transaction date is applied. Any translation differences are recognized in other comprehensive income.
The exchange rates applied in the translation of the financial statements for consolidation purposes are as follows:
Exchange rates
Closing rate Average rate
2013Oct 31
2012 Oct 31
2013Nov–Oct
2012 Jan–Oct
Denmark DKK 100 118.03 115.55 115.48 117.36Norway NOK 100 108.72 115.85 112.67 116.02U.S. USD 6.42 6.63 6.55 6.78U.K. GBP 10.30 10.68 10.22 10.72Switzerland CHF 100 713.46 713.27 703.77 724.59Japan JPY 100 6.53 8.31 7.07 8.59EMU countries EUR 8.80 8.62 8.61 8.73
Financial instrumentsFinancial instruments are recognized in the consolidated balance sheet when the Group becomes a party to the contractual provisions of the instru-ment and are then measured at amortized cost or fair value depending on their initial classification according to IAS 39.
Amortized cost is calculated using the effective interest method, where any premiums or discounts and directly attributable costs and revenue are capitalized over the contract period using the effective interest rate. The effective interest rate is the rate that yields the instrument’s cost when cal-culating the present value of future cash flows.
Fair value is generally determined by reference to official market quotes. When market quotes are not available, the fair value is determined using generally accepted valuation methods such as discounted future cash flows based on observable market inputs.
Financial assetsFinancial assets are classified into the following categories: available-for-sale, financial assets remeasured at fair value through the statement of income as well as loan receivables and accounts receivable. The classification depends on the nature and purpose of the financial assets and is determined at the time of initial recognition.
Loan receivables and accounts receivableReceivables in affiliated companies are categorized as loan receivables and accounts receivable and are measured at amortized cost.
Accounts receivable are categorized as loan receivables and accounts receivable. Since the term of accounts receivable is expected to be 13 days, the value of each receivable is carried at its nominal amount with no discount, which is deemed to be a good estimate of fair value. Accounts receivable are assessed individually for impairment and all impairment losses are recog-nized in profit or loss as other operating expenses.
Cash and cash equivalents Cash and cash equivalents comprise cash balances, cash deposits and liquid investments with maturities of three months or less that are readily convertible to known cash amounts and are subject to an insignificant risk of changes in value. The short-term investments as well as cash and bank balances items in the consolidated balance sheet comprise the Group’s cash and cash equivalents. Deposits and blocked funds are categorized as loans and accounts receivable, and other investments are categorized as financial assets held for trading.
Financial liabilities and equityFinancial liabilities and equity instruments are classified according to their contractual provisions.
An equity instrument is any contract that represents a residual interest in the assets of the Group after deducting its liabilities. The proceeds from equity instruments issued by the Group are recognized less direct issue costs.
Financial liabilities represent contractual obligations and are recorded when the Group becomes contractually liable.
Accounts payableAccounts payable are categorized as other liabilities. Since the terms of ac-counts payable are expected to be short, the liabilities are carried at nominal amounts with no discounts, this is deemed to be a good approximation of the fair value of the accounts payable.
Note 1, continued
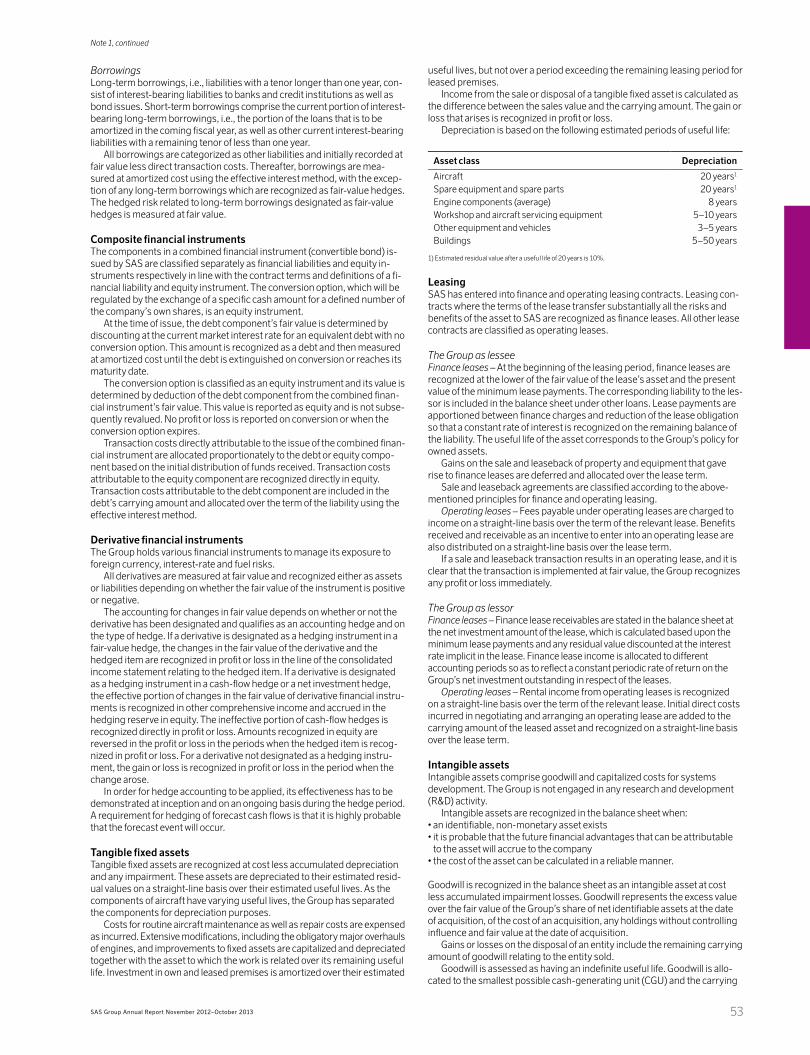
53SAS Group Annual Report November 2012–October 2013
BorrowingsLong-term borrowings, i.e., liabilities with a tenor longer than one year, con-sist of interest-bearing liabilities to banks and credit institutions as well as bond issues. Short-term borrowings comprise the current portion of interest-bearing long-term borrowings, i.e., the portion of the loans that is to be amortized in the coming fiscal year, as well as other current interest-bearing liabilities with a remaining tenor of less than one year.
All borrowings are categorized as other liabilities and initially recorded at fair value less direct transaction costs. Thereafter, borrowings are mea-sured at amortized cost using the effective interest method, with the excep-tion of any long-term borrowings which are recognized as fair-value hedges. The hedged risk related to long-term borrowings designated as fair-value hedges is measured at fair value.
Composite financial instrumentsThe components in a combined financial instrument (convertible bond) is-sued by SAS are classified separately as financial liabilities and equity in-struments respectively in line with the contract terms and definitions of a fi-nancial liability and equity instrument. The conversion option, which will be regulated by the exchange of a specific cash amount for a defined number of the company’s own shares, is an equity instrument.
At the time of issue, the debt component’s fair value is determined by discounting at the current market interest rate for an equivalent debt with no conversion option. This amount is recognized as a debt and then measured at amortized cost until the debt is extinguished on conversion or reaches its maturity date.
The conversion option is classified as an equity instrument and its value is determined by deduction of the debt component from the combined finan-cial instrument’s fair value. This value is reported as equity and is not subse-quently revalued. No profit or loss is reported on conversion or when the conversion option expires.
Transaction costs directly attributable to the issue of the combined finan-cial instrument are allocated proportionately to the debt or equity compo-nent based on the initial distribution of funds received. Transaction costs attributable to the equity component are recognized directly in equity. Transaction costs attributable to the debt component are included in the debt’s carrying amount and allocated over the term of the liability using the effective interest method.
Derivative financial instrumentsThe Group holds various financial instruments to manage its exposure to foreign currency, interest-rate and fuel risks.
All derivatives are measured at fair value and recognized either as assets or liabilities depending on whether the fair value of the instrument is positive or negative.
The accounting for changes in fair value depends on whether or not the derivative has been designated and qualifies as an accounting hedge and on the type of hedge. If a derivative is designated as a hedging instrument in a fair-value hedge, the changes in the fair value of the derivative and the hedged item are recognized in profit or loss in the line of the consolidated income statement relating to the hedged item. If a derivative is designated as a hedging instrument in a cash-flow hedge or a net investment hedge, the effective portion of changes in the fair value of derivative financial instru-ments is recognized in other comprehensive income and accrued in the hedging reserve in equity. The ineffective portion of cash-flow hedges is recognized directly in profit or loss. Amounts recognized in equity are reversed in the profit or loss in the periods when the hedged item is recog-nized in profit or loss. For a derivative not designated as a hedging instru-ment, the gain or loss is recognized in profit or loss in the period when the change arose.
In order for hedge accounting to be applied, its effectiveness has to be demonstrated at inception and on an ongoing basis during the hedge period. A requirement for hedging of forecast cash flows is that it is highly probable that the forecast event will occur.
Tangible fixed assetsTangible fixed assets are recognized at cost less accumulated depreciation and any impairment. These assets are depreciated to their estimated resid-ual values on a straight-line basis over their estimated useful lives. As the components of aircraft have varying useful lives, the Group has separated the components for depreciation purposes.
Costs for routine aircraft maintenance as well as repair costs are expensed as incurred. Extensive modifications, including the obligatory major overhauls of engines, and improvements to fixed assets are capitalized and depreciated together with the asset to which the work is related over its remaining useful life. Investment in own and leased premises is amortized over their estimated
useful lives, but not over a period exceeding the remaining leasing period for leased premises.
Income from the sale or disposal of a tangible fixed asset is calculated as the difference between the sales value and the carrying amount. The gain or loss that arises is recognized in profit or loss.
Depreciation is based on the following estimated periods of useful life:
Asset class Depreciation
Aircraft 20 years1 Spare equipment and spare parts 20 years1
Engine components (average) 8 years Workshop and aircraft servicing equipment 5–10 years Other equipment and vehicles 3–5 years Buildings 5–50 years
1) Estimated residual value after a useful life of 20 years is 10%.
LeasingSAS has entered into finance and operating leasing contracts. Leasing con-tracts where the terms of the lease transfer substantially all the risks and benefits of the asset to SAS are recognized as finance leases. All other lease contracts are classified as operating leases.
The Group as lessee Finance leases – At the beginning of the leasing period, finance leases are recognized at the lower of the fair value of the lease’s asset and the present value of the minimum lease payments. The corresponding liability to the les-sor is included in the balance sheet under other loans. Lease payments are apportioned between finance charges and reduction of the lease obligation so that a constant rate of interest is recognized on the remaining balance of the liability. The useful life of the asset corresponds to the Group’s policy for owned assets.
Gains on the sale and leaseback of property and equipment that gave rise to finance leases are deferred and allocated over the lease term.
Sale and leaseback agreements are classified according to the above-mentioned principles for finance and operating leasing.
Operating leases – Fees payable under operating leases are charged to income on a straight-line basis over the term of the relevant lease. Benefits received and receivable as an incentive to enter into an operating lease are also distributed on a straight-line basis over the lease term.
If a sale and leaseback transaction results in an operating lease, and it is clear that the transaction is implemented at fair value, the Group recognizes any profit or loss immediately.
The Group as lessor Finance leases – Finance lease receivables are stated in the balance sheet at the net investment amount of the lease, which is calculated based upon the minimum lease payments and any residual value discounted at the interest rate implicit in the lease. Finance lease income is allocated to different accounting periods so as to reflect a constant periodic rate of return on the Group’s net investment outstanding in respect of the leases.
Operating leases – Rental income from operating leases is recognized on a straight-line basis over the term of the relevant lease. Initial direct costs incurred in negotiating and arranging an operating lease are added to the carrying amount of the leased asset and recognized on a straight-line basis over the lease term.
Intangible assetsIntangible assets comprise goodwill and capitalized costs for systems development. The Group is not engaged in any research and development (R&D) activity.
Intangible assets are recognized in the balance sheet when: • an identifiable, non-monetary asset exists• it is probable that the future financial advantages that can be attributable
to the asset will accrue to the company• the cost of the asset can be calculated in a reliable manner.
Goodwill is recognized in the balance sheet as an intangible asset at cost less accumulated impairment losses. Goodwill represents the excess value over the fair value of the Group’s share of net identifiable assets at the date of acquisition, of the cost of an acquisition, any holdings without controlling influence and fair value at the date of acquisition.
Gains or losses on the disposal of an entity include the remaining carrying amount of goodwill relating to the entity sold.
Goodwill is assessed as having an indefinite useful life. Goodwill is allo-cated to the smallest possible cash-generating unit (CGU) and the carrying
Note 1, continued

54 SAS Group Annual Report November 2012–October 2013
amount is tested at least once a year for any impairment. However, testing for impairment takes place more frequently if there are indications that a loss in value has occurred. A discounted cash-flow analysis is carried out based on the cash flows of the CGU and comparing the carrying value of as-sets of the CGU with their recoverable amount. These cash flows are dis-counted at rates that the Group estimates to be the risk-affected average cost of capital for the particular businesses. Any impairment is recognized immediately in profit or loss.
Development costs that do not meet the criteria specified above are ex-pensed in the period they arise. Costs for systems development are recog-nized as an asset provided that they meet the criteria specified above. Capi-talized development costs are amortized on a straight-line basis over the estimated useful life of the asset, which amounts to no more than five years. Amortization of capitalized development costs is included in the deprecia-tion/amortization item in the statement of income.
Emission rightsAny emission rights received without the need for payment of any consider-ation from the respective countries’ government agencies are recognized at their nominal amounts, which in practice means that the intangible asset and the prepaid income are valued at zero. Any emission rights purchased for own use are recognized as intangible assets under current assets at cost after impairment. A provision is recognized in the balance sheet commen-surate to the extent that emission rights used correspond to emission rights held. This provision is measured at the cost of the emission rights held. The provision is measured at the current market price with a corresponding cost in the statement of income commensurate to the extent the emission rights used exceed the amount of emission rights held.
Impairment of tangible and intangible assets with determinable useful livesThe Group continuously evaluates whether any indications exist of a need for impairment of any tangible and intangible assets with determinable use-ful lives to identify any potential need for impairment. If any such indication is identified, the recoverable amount of the asset is calculated (or as part of the CGU to which it belongs) to determine the extent of any impairment loss. The recoverable amount is defined as the higher of an asset’s fair value less selling costs and the value in use (VIU). If the estimated recoverable amount of the asset (or the CGU) is lower than its carrying amount, the carrying amount of the asset (or the CGU) is impaired. The recoverable amount is determined based on the type of asset.
At each balance-sheet date, a review is conducted to assess for indica-tions that any earlier impairment losses no longer exist or have improved. When such indications exist, the recoverable amount is recalculated and the carrying amount is increased to the lower of the recoverable amount and the carrying amount that the asset would have had if the previous impairment had not taken place.
Expendable spare parts and inventoriesExpendable spare parts and inventories are carried at the lower of cost or net realizable value. Cost is calculated by application of the first in first out (FIFO) method. Some spare parts related to aircraft are valued collectively with the aircraft concerned according to the lower of cost or market value principle.
Provisions and contingent liabilitiesProvisions are reported when the Group identifies legal or informal commit-ments as a result of historic events, where the outcome is probable, and where the financial resources required to settle these commitments can be estimated with reasonable certainty.
A restructuring obligation is considered to have arisen and a provision for the obligation is recognized when the Group has adopted a detailed and formal restructuring plan. The plan must have been communicated to affected parties and have been commenced or publicly announced.
Remuneration of employeesPensionsThe Group has various pension plans for its employees. These vary consid-erably due to different legislation and agreements on occupational pension systems in the individual countries.
For pension plans where the employer has accepted responsibility for a defined-contribution, the obligation to employees ceases when the contrac-tual premiums have been paid. Where defined-benefit pensions have been agreed, the commitments do not cease until the contractual pensions have been paid. The Group calculates its pension commitments for the defined-
benefit pension plans based on estimated future final salaries. An estimate of funded assets is made at the same time.
Pension costs for the year comprise the present value of pension earn-ings for the year plus interest on the obligation at the beginning of the year, less the return on funded assets. Amortization of actuarial gains and losses and plan amendments is added to this total for certain pension plans. The Group applies the “corridor approach” when recognizing actuarial gains and losses. Under the corridor approach, actuarial gains and losses outside the lower and upper limits of the corridor, which is calculated as 10% of the greater of the defined obligation as of that date or the fair value of plan as-sets, are recognized immediately. Actuarial gains and losses outside the corridor are amortized over a 15-year period, which corresponds to the av-erage remaining employment period.
Plan amendments and deviations between anticipated and actual results for estimated pension commitments and funded assets are amortized over the average remaining working lives of the employees participating in the pension plan.
Termination benefits Termination benefits are payable when employment is terminated before the normal retirement date, or whenever an employee accepts voluntary re-dundancy in exchange for these benefits. The Group recognizes severance pay when such an obligation exists according to employment contracts or for termination as a result of an offer made to encourage voluntary redun-dancy.
Revenue recognitionPassenger revenueSales of passenger tickets are recorded as a short-term unearned transpor-tation revenue liability on the consolidated balance sheet. Passenger reve-nue is recognized when SAS or another airline provides the transportation. Additionally, tickets that have not been utilized by the passenger and have expired are recognized as revenue. The Group estimates unutilized tickets each period on the basis of historical utilization levels for unutilized tickets over the past two- or three-year period, and recognizes revenue and reduc-es the short-term unearned transportation revenue liability based on that estimate.
The Group’s Management periodically evaluates the estimated short-term unearned transportation revenue liability and records any resulting adjustments in its financial statements in the period in which the evaluations are completed. These adjustments relate primarily to refunds, exchanges, transactions with other airlines and other items for which final settlement occurs in periods subsequent to the sale of the related tickets at amounts other than the original sales price.
Charter revenueThe Group operates aircraft on a charter basis for flights that take place out-side normal schedules through a hiring arrangement with particular custom-ers. Charter revenue, similar to passenger revenue, is recognized when trans-portation has been provided.
Mail and freight revenueThe Group provides cargo services on both passenger planes and commer-cial cargo flights. This revenue is recognized as revenue when the air trans-portation is completed.
Interest incomeInterest income is recognized in line with the effective interest method. Interest income primarily comprises interest income from bank accounts, receivables and interest-bearing financial instruments.
Other revenueSales of goods and other services are recognized as revenue when the goods are delivered or the service performed.
Loyalty programThe Group operates a frequent-flyer program, EuroBonus, through which customers can earn bonus points by flying with SAS and/or other Star Alli-ance companies or from purchases made from commercial partners such as car rental companies and credit card companies.
Under IFRIC 13, the awarding of loyalty points is considered a separately identifiable transaction in purchases of airline tickets. The portion of the ticket price allocated to loyalty points is measured at fair value and not rec-ognized as revenue until the period in which the obligation is fulfilled.
Note 1, continued
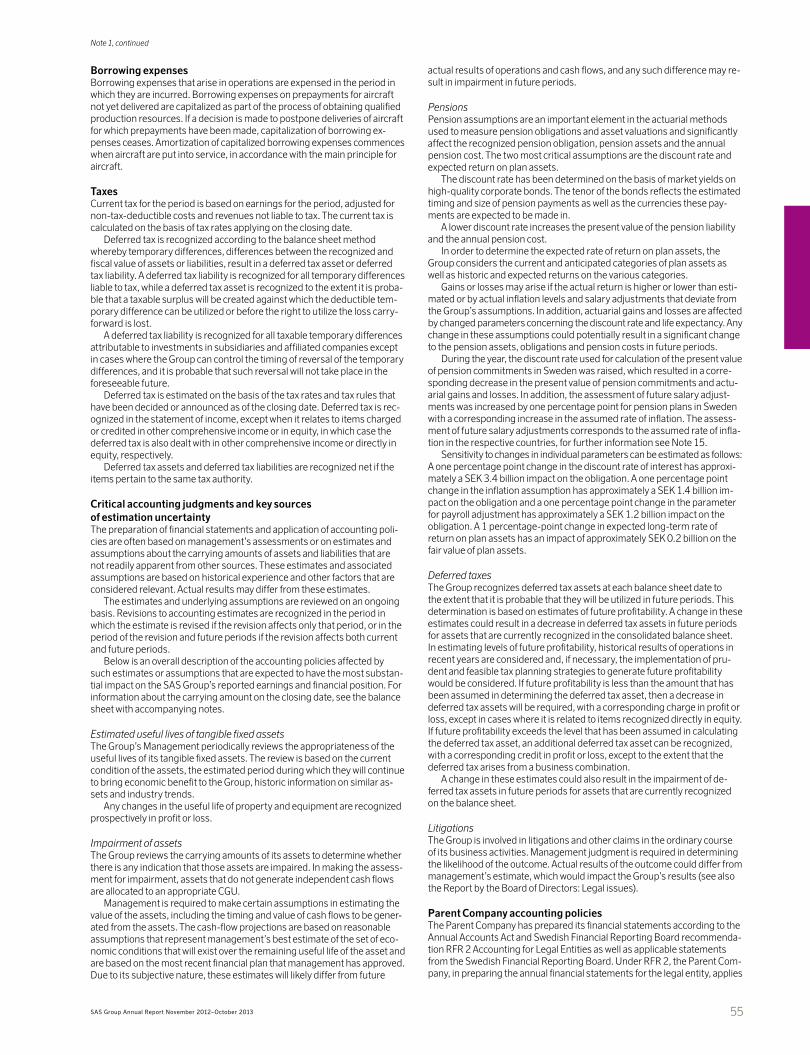
55SAS Group Annual Report November 2012–October 2013
Borrowing expensesBorrowing expenses that arise in operations are expensed in the period in which they are incurred. Borrowing expenses on prepayments for aircraft not yet delivered are capitalized as part of the process of obtaining qualified production resources. If a decision is made to postpone deliveries of aircraft for which prepayments have been made, capitalization of borrowing ex-penses ceases. Amortization of capitalized borrowing expenses commences when aircraft are put into service, in accordance with the main principle for aircraft.
TaxesCurrent tax for the period is based on earnings for the period, adjusted for non-tax-deductible costs and revenues not liable to tax. The current tax is calculated on the basis of tax rates applying on the closing date.
Deferred tax is recognized according to the balance sheet method whereby temporary differences, differences between the recognized and fiscal value of assets or liabilities, result in a deferred tax asset or deferred tax liability. A deferred tax liability is recognized for all temporary differences liable to tax, while a deferred tax asset is recognized to the extent it is proba-ble that a taxable surplus will be created against which the deductible tem-porary difference can be utilized or before the right to utilize the loss carry-forward is lost.
A deferred tax liability is recognized for all taxable temporary differences attributable to investments in subsidiaries and affiliated companies except in cases where the Group can control the timing of reversal of the temporary differences, and it is probable that such reversal will not take place in the foreseeable future.
Deferred tax is estimated on the basis of the tax rates and tax rules that have been decided or announced as of the closing date. Deferred tax is rec-ognized in the statement of income, except when it relates to items charged or credited in other comprehensive income or in equity, in which case the deferred tax is also dealt with in other comprehensive income or directly in equity, respectively.
Deferred tax assets and deferred tax liabilities are recognized net if the items pertain to the same tax authority.
Critical accounting judgments and key sources of estimation uncertaintyThe preparation of financial statements and application of accounting poli-cies are often based on management’s assessments or on estimates and assumptions about the carrying amounts of assets and liabilities that are not readily apparent from other sources. These estimates and associated assumptions are based on historical experience and other factors that are considered relevant. Actual results may differ from these estimates.
The estimates and underlying assumptions are reviewed on an ongoing basis. Revisions to accounting estimates are recognized in the period in which the estimate is revised if the revision affects only that period, or in the period of the revision and future periods if the revision affects both current and future periods.
Below is an overall description of the accounting policies affected by such estimates or assumptions that are expected to have the most substan-tial impact on the SAS Group’s reported earnings and financial position. For information about the carrying amount on the closing date, see the balance sheet with accompanying notes.
Estimated useful lives of tangible fixed assetsThe Group’s Management periodically reviews the appropriateness of the useful lives of its tangible fixed assets. The review is based on the current condition of the assets, the estimated period during which they will continue to bring economic benefit to the Group, historic information on similar as-sets and industry trends.
Any changes in the useful life of property and equipment are recognized prospectively in profit or loss.
Impairment of assetsThe Group reviews the carrying amounts of its assets to determine whether there is any indication that those assets are impaired. In making the assess-ment for impairment, assets that do not generate independent cash flows are allocated to an appropriate CGU.
Management is required to make certain assumptions in estimating the value of the assets, including the timing and value of cash flows to be gener-ated from the assets. The cash-flow projections are based on reasonable assumptions that represent management’s best estimate of the set of eco-nomic conditions that will exist over the remaining useful life of the asset and are based on the most recent financial plan that management has approved. Due to its subjective nature, these estimates will likely differ from future
actual results of operations and cash flows, and any such difference may re-sult in impairment in future periods.
PensionsPension assumptions are an important element in the actuarial methods used to measure pension obligations and asset valuations and significantly affect the recognized pension obligation, pension assets and the annual pension cost. The two most critical assumptions are the discount rate and expected return on plan assets.
The discount rate has been determined on the basis of market yields on high-quality corporate bonds. The tenor of the bonds reflects the estimated timing and size of pension payments as well as the currencies these pay-ments are expected to be made in.
A lower discount rate increases the present value of the pension liability and the annual pension cost.
In order to determine the expected rate of return on plan assets, the Group considers the current and anticipated categories of plan assets as well as historic and expected returns on the various categories.
Gains or losses may arise if the actual return is higher or lower than esti-mated or by actual inflation levels and salary adjustments that deviate from the Group’s assumptions. In addition, actuarial gains and losses are affected by changed parameters concerning the discount rate and life expectancy. Any change in these assumptions could potentially result in a significant change to the pension assets, obligations and pension costs in future periods.
During the year, the discount rate used for calculation of the present value of pension commitments in Sweden was raised, which resulted in a corre-sponding decrease in the present value of pension commitments and actu-arial gains and losses. In addition, the assessment of future salary adjust-ments was increased by one percentage point for pension plans in Sweden with a corresponding increase in the assumed rate of inflation. The assess-ment of future salary adjustments corresponds to the assumed rate of infla-tion in the respective countries, for further information see Note 15.
Sensitivity to changes in individual parameters can be estimated as follows: A one percentage point change in the discount rate of interest has approxi-mately a SEK 3.4 billion impact on the obligation. A one percentage point change in the inflation assumption has approximately a SEK 1.4 billion im-pact on the obligation and a one percentage point change in the parameter for payroll adjustment has approximately a SEK 1.2 billion impact on the obligation. A 1 percentage-point change in expected long-term rate of return on plan assets has an impact of approximately SEK 0.2 billion on the fair value of plan assets.
Deferred taxesThe Group recognizes deferred tax assets at each balance sheet date to the extent that it is probable that they will be utilized in future periods. This determination is based on estimates of future profitability. A change in these estimates could result in a decrease in deferred tax assets in future periods for assets that are currently recognized in the consolidated balance sheet. In estimating levels of future profitability, historical results of operations in recent years are considered and, if necessary, the implementation of pru-dent and feasible tax planning strategies to generate future profitability would be considered. If future profitability is less than the amount that has been assumed in determining the deferred tax asset, then a decrease in deferred tax assets will be required, with a corresponding charge in profit or loss, except in cases where it is related to items recognized directly in equity. If future profitability exceeds the level that has been assumed in calculating the deferred tax asset, an additional deferred tax asset can be recognized, with a corresponding credit in profit or loss, except to the extent that the deferred tax arises from a business combination.
A change in these estimates could also result in the impairment of de-ferred tax assets in future periods for assets that are currently recognized on the balance sheet.
LitigationsThe Group is involved in litigations and other claims in the ordinary course of its business activities. Management judgment is required in determining the likelihood of the outcome. Actual results of the outcome could differ from management’s estimate, which would impact the Group’s results (see also the Report by the Board of Directors: Legal issues).
Parent Company accounting policiesThe Parent Company has prepared its financial statements according to the Annual Accounts Act and Swedish Financial Reporting Board recommenda-tion RFR 2 Accounting for Legal Entities as well as applicable statements from the Swedish Financial Reporting Board. Under RFR 2, the Parent Com-pany, in preparing the annual financial statements for the legal entity, applies
Note 1, continued

56 SAS Group Annual Report November 2012–October 2013
all EU-approved IFRSs and statements insofar as this is possible within the framework of the Annual Accounts Act and the Swedish Pension Obligations Vesting Act and with respect to the connection between accounting and taxation. The recommendations specify which exceptions and additions are to be made from and to IFRS.
Revised accounting policies:Amendments to RFR 2, 2012/2013The amendments that have entered into force for RFR 2 Accounting for Legal Entities and, which apply for the 2012/2013 fiscal year, pertain to the follow-ing areas:
IFRS 7 Financial Instruments, Disclosures; IAS 1 Presentation of Finan-cial Statements, IAS 10 Events after the Reporting Period, IAS 11 Construc-tion Contracts and IAS 18 Revenue.
The implementation of these amendments has had no material impact on the Parent Company’s financial statements.
Amendments to RFR 2 that have not yet entered into force and which have not been applied in advance by the Parent CompanyThe Swedish Financial Reporting Board has published an amendment to RFR 2 regarding the recognition of Group contributions. The new amend-ment is to be applied to fiscal years beginning on or after January 1, 2013. The amendment entails that a company can elect to apply either the main rule or the alternative rule to the recognition of Group contributions. The main rule entails that the Parent Company recognizes Group contributions received from subsidiaries as financial income and Group contributions paid to subsidiaries as an increase in participations in Group companies. The alternative rule entails that both Group contributions received and paid are to be recognized as appropriations by the Parent Company. This amend-ment has not been applied in advance by the Group and its impact has not yet been evaluated.
The differences between the Group’s and the Parent Company’s accounting policies are listed below: Pensions: Current pension premiums are recognized as an expense.
Shares in subsidiaries and affiliated companies: Recognized at cost. Acquisition-related expenses for subsidiaries that are charged in the con-solidated income statement, are included as part of the cost for holdings in subsidiaries.
Other shares and participations: Recognized at cost. Hedging of net investments in foreign operations: Translation differences
relating to currency hedging are recognized in the statement of income.
Note 1, continued
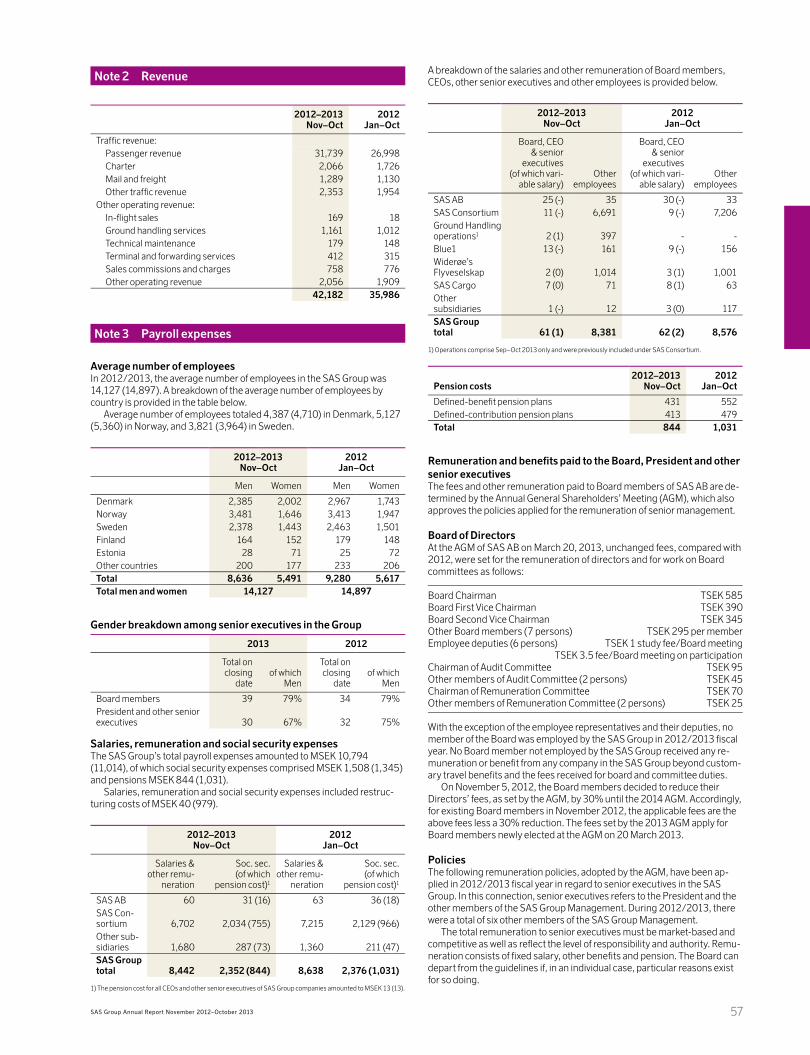
57SAS Group Annual Report November 2012–October 2013
Note 2 Revenue
2012–2013 Nov–Oct
2012Jan–Oct
Traffic revenue: Passenger revenue 31,739 26,998 Charter 2,066 1,726 Mail and freight 1,289 1,130 Other traffic revenue 2,353 1,954Other operating revenue: In-flight sales 169 18 Ground handling services 1,161 1,012 Technical maintenance 179 148 Terminal and forwarding services 412 315 Sales commissions and charges 758 776 Other operating revenue 2,056 1,909
42,182 35,986
Note 3 Payroll expenses
Average number of employeesIn 2012/2013, the average number of employees in the SAS Group was 14,127 (14,897). A breakdown of the average number of employees by country is provided in the table below.
Average number of employees totaled 4,387 (4,710) in Denmark, 5,127 (5,360) in Norway, and 3,821 (3,964) in Sweden.
2012–2013 Nov–Oct
2012 Jan–Oct
Men Women Men Women
Denmark 2,385 2,002 2,967 1,743Norway 3,481 1,646 3,413 1,947Sweden 2,378 1,443 2,463 1,501Finland 164 152 179 148Estonia 28 71 25 72Other countries 200 177 233 206Total 8,636 5,491 9,280 5,617Total men and women 14,127 14,897
Gender breakdown among senior executives in the Group
2013 2012
Total on closing
dateof which
Men
Total on closing
dateof which
Men
Board members 39 79% 34 79%President and other senior executives 30 67% 32 75%
Salaries, remuneration and social security expensesThe SAS Group’s total payroll expenses amounted to MSEK 10,794 (11,014), of which social security expenses comprised MSEK 1,508 (1,345) and pensions MSEK 844 (1,031).
Salaries, remuneration and social security expenses included restruc-turing costs of MSEK 40 (979).
2012–2013 Nov–Oct
2012 Jan–Oct
Salaries & other remu-
neration
Soc. sec. (of which
pension cost)1
Salaries & other remu-
neration
Soc. sec. (of which
pension cost)1
SAS AB 60 31 (16) 63 36 (18)SAS Con-sortium 6,702 2,034 (755) 7,215 2,129 (966)Other sub-sidiaries 1,680 287 (73) 1,360 211 (47)SAS Group total 8,442 2,352 (844) 8,638 2,376 (1,031)
1) The pension cost for all CEOs and other senior executives of SAS Group companies amounted to MSEK 13 (13).
A breakdown of the salaries and other remuneration of Board members, CEOs, other senior executives and other employees is provided below.
2012–2013 Nov–Oct
2012 Jan–Oct
Board, CEO & senior
executives (of which vari-
able salary)Other
employees
Board, CEO & senior
executives (of which vari-
able salary)Other
employees
SAS AB 25 (-) 35 30 (-) 33SAS Consortium 11 (-) 6,691 9 (-) 7,206Ground Handling operations1 2 (1) 397 - -Blue1 13 (-) 161 9 (-) 156Widerøe’s Flyveselskap 2 (0) 1,014 3 (1) 1,001SAS Cargo 7 (0) 71 8 (1) 63Other subsidiaries 1 (-) 12 3 (0) 117SAS Group total 61 (1) 8,381 62 (2) 8,576
1) Operations comprise Sep–Oct 2013 only and were previously included under SAS Consortium.
Pension costs2012–2013
Nov–Oct2012
Jan–Oct
Defined-benefit pension plans 431 552Defined-contribution pension plans 413 479Total 844 1,031
Remuneration and benefits paid to the Board, President and other senior executivesThe fees and other remuneration paid to Board members of SAS AB are de-termined by the Annual General Shareholders’ Meeting (AGM), which also approves the policies applied for the remuneration of senior management.
Board of DirectorsAt the AGM of SAS AB on March 20, 2013, unchanged fees, compared with 2012, were set for the remuneration of directors and for work on Board committees as follows:
Board Chairman TSEK 585Board First Vice Chairman TSEK 390Board Second Vice Chairman TSEK 345Other Board members (7 persons) TSEK 295 per memberEmployee deputies (6 persons) TSEK 1 study fee/Board meeting TSEK 3.5 fee/Board meeting on participationChairman of Audit Committee TSEK 95Other members of Audit Committee (2 persons) TSEK 45Chairman of Remuneration Committee TSEK 70Other members of Remuneration Committee (2 persons) TSEK 25
With the exception of the employee representatives and their deputies, no member of the Board was employed by the SAS Group in 2012/2013 fiscal year. No Board member not employed by the SAS Group received any re-muneration or benefit from any company in the SAS Group beyond custom-ary travel benefits and the fees received for board and committee duties.
On November 5, 2012, the Board members decided to reduce their Directors’ fees, as set by the AGM, by 30% until the 2014 AGM. Accordingly, for existing Board members in November 2012, the applicable fees are the above fees less a 30% reduction. The fees set by the 2013 AGM apply for Board members newly elected at the AGM on 20 March 2013.
PoliciesThe following remuneration policies, adopted by the AGM, have been ap-plied in 2012/2013 fiscal year in regard to senior executives in the SAS Group. In this connection, senior executives refers to the President and the other members of the SAS Group Management. During 2012/2013, there were a total of six other members of the SAS Group Management.
The total remuneration to senior executives must be market-based and competitive as well as reflect the level of responsibility and authority. Remu-neration consists of fixed salary, other benefits and pension. The Board can depart from the guidelines if, in an individual case, particular reasons exist for so doing.
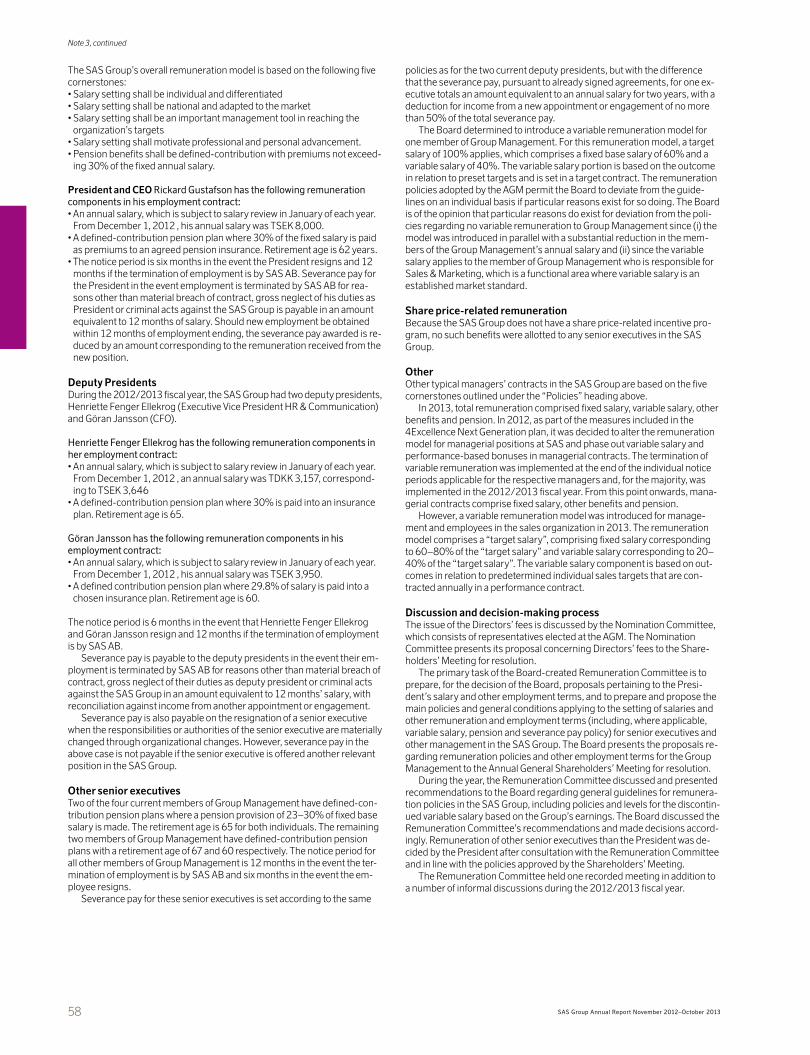
58 SAS Group Annual Report November 2012–October 2013
The SAS Group’s overall remuneration model is based on the following five cornerstones: • Salary setting shall be individual and differentiated• Salary setting shall be national and adapted to the market• Salary setting shall be an important management tool in reaching the
organization’s targets• Salary setting shall motivate professional and personal advancement.• Pension benefits shall be defined-contribution with premiums not exceed-
ing 30% of the fixed annual salary.
President and CEO Rickard Gustafson has the following remuneration components in his employment contract: • An annual salary, which is subject to salary review in January of each year.
From December 1, 2012 , his annual salary was TSEK 8,000.• A defined-contribution pension plan where 30% of the fixed salary is paid
as premiums to an agreed pension insurance. Retirement age is 62 years.• The notice period is six months in the event the President resigns and 12
months if the termination of employment is by SAS AB. Severance pay for the President in the event employment is terminated by SAS AB for rea-sons other than material breach of contract, gross neglect of his duties as President or criminal acts against the SAS Group is payable in an amount equivalent to 12 months of salary. Should new employment be obtained within 12 months of employment ending, the severance pay awarded is re-duced by an amount corresponding to the remuneration received from the new position.
Deputy Presidents During the 2012/2013 fiscal year, the SAS Group had two deputy presidents, Henriette Fenger Ellekrog (Executive Vice President HR & Communication) and Göran Jansson (CFO).
Henriette Fenger Ellekrog has the following remuneration components in her employment contract:• An annual salary, which is subject to salary review in January of each year.
From December 1, 2012 , an annual salary was TDKK 3,157, correspond-ing to TSEK 3,646
• A defined-contribution pension plan where 30% is paid into an insurance plan. Retirement age is 65.
Göran Jansson has the following remuneration components in his employment contract:• An annual salary, which is subject to salary review in January of each year.
From December 1, 2012 , his annual salary was TSEK 3,950. • A defined contribution pension plan where 29.8% of salary is paid into a
chosen insurance plan. Retirement age is 60.
The notice period is 6 months in the event that Henriette Fenger Ellekrog and Göran Jansson resign and 12 months if the termination of employment is by SAS AB.
Severance pay is payable to the deputy presidents in the event their em-ployment is terminated by SAS AB for reasons other than material breach of contract, gross neglect of their duties as deputy president or criminal acts against the SAS Group in an amount equivalent to 12 months’ salary, with reconciliation against income from another appointment or engagement.
Severance pay is also payable on the resignation of a senior executive when the responsibilities or authorities of the senior executive are materially changed through organizational changes. However, severance pay in the above case is not payable if the senior executive is offered another relevant position in the SAS Group.
Other senior executivesTwo of the four current members of Group Management have defined-con-tribution pension plans where a pension provision of 23–30% of fixed base salary is made. The retirement age is 65 for both individuals. The remaining two members of Group Management have defined-contribution pension plans with a retirement age of 67 and 60 respectively. The notice period for all other members of Group Management is 12 months in the event the ter-mination of employment is by SAS AB and six months in the event the em-ployee resigns.
Severance pay for these senior executives is set according to the same
policies as for the two current deputy presidents, but with the difference that the severance pay, pursuant to already signed agreements, for one ex-ecutive totals an amount equivalent to an annual salary for two years, with a deduction for income from a new appointment or engagement of no more than 50% of the total severance pay.
The Board determined to introduce a variable remuneration model for one member of Group Management. For this remuneration model, a target salary of 100% applies, which comprises a fixed base salary of 60% and a variable salary of 40%. The variable salary portion is based on the outcome in relation to preset targets and is set in a target contract. The remuneration policies adopted by the AGM permit the Board to deviate from the guide-lines on an individual basis if particular reasons exist for so doing. The Board is of the opinion that particular reasons do exist for deviation from the poli-cies regarding no variable remuneration to Group Management since (i) the model was introduced in parallel with a substantial reduction in the mem-bers of the Group Management’s annual salary and (ii) since the variable salary applies to the member of Group Management who is responsible for Sales & Marketing, which is a functional area where variable salary is an established market standard.
Share price-related remunerationBecause the SAS Group does not have a share price-related incentive pro-gram, no such benefits were allotted to any senior executives in the SAS Group.
OtherOther typical managers’ contracts in the SAS Group are based on the five cornerstones outlined under the “Policies” heading above.
In 2013, total remuneration comprised fixed salary, variable salary, other benefits and pension. In 2012, as part of the measures included in the 4Excellence Next Generation plan, it was decided to alter the remuneration model for managerial positions at SAS and phase out variable salary and performance-based bonuses in managerial contracts. The termination of variable remuneration was implemented at the end of the individual notice periods applicable for the respective managers and, for the majority, was implemented in the 2012/2013 fiscal year. From this point onwards, mana-gerial contracts comprise fixed salary, other benefits and pension.
However, a variable remuneration model was introduced for manage-ment and employees in the sales organization in 2013. The remuneration model comprises a “target salary”, comprising fixed salary corresponding to 60–80% of the “target salary” and variable salary corresponding to 20–40% of the “target salary”. The variable salary component is based on out-comes in relation to predetermined individual sales targets that are con-tracted annually in a performance contract.
Discussion and decision-making processThe issue of the Directors’ fees is discussed by the Nomination Committee, which consists of representatives elected at the AGM. The Nomination Committee presents its proposal concerning Directors’ fees to the Share-holders’ Meeting for resolution.
The primary task of the Board-created Remuneration Committee is to prepare, for the decision of the Board, proposals pertaining to the Presi-dent’s salary and other employment terms, and to prepare and propose the main policies and general conditions applying to the setting of salaries and other remuneration and employment terms (including, where applicable, variable salary, pension and severance pay policy) for senior executives and other management in the SAS Group. The Board presents the proposals re-garding remuneration policies and other employment terms for the Group Management to the Annual General Shareholders’ Meeting for resolution.
During the year, the Remuneration Committee discussed and presented recommendations to the Board regarding general guidelines for remunera-tion policies in the SAS Group, including policies and levels for the discontin-ued variable salary based on the Group’s earnings. The Board discussed the Remuneration Committee’s recommendations and made decisions accord-ingly. Remuneration of other senior executives than the President was de-cided by the President after consultation with the Remuneration Committee and in line with the policies approved by the Shareholders’ Meeting.
The Remuneration Committee held one recorded meeting in addition to a number of informal discussions during the 2012/2013 fiscal year.
Note 3, continued
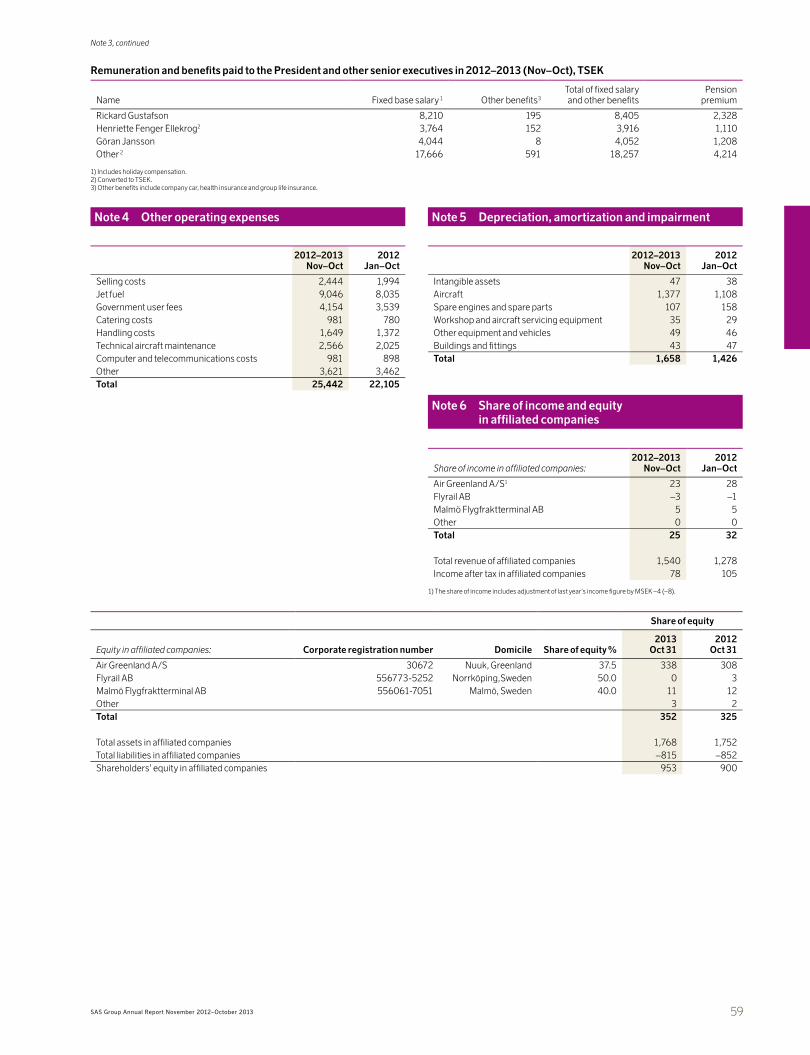
59SAS Group Annual Report November 2012–October 2013
Remuneration and benefits paid to the President and other senior executives in 2012–2013 (Nov–Oct), TSEK
Name Fixed base salary 1 Other benefits3
Total of fixed salary and other benefits
Pensionpremium
Rickard Gustafson 8,210 195 8,405 2,328Henriette Fenger Ellekrog2 3,764 152 3,916 1,110Göran Jansson 4,044 8 4,052 1,208Other 2 17,666 591 18,257 4,214
1) Includes holiday compensation.2) Converted to TSEK.3) Other benefits include company car, health insurance and group life insurance.
Note 4 Other operating expenses
2012–2013Nov–Oct
2012Jan–Oct
Selling costs 2,444 1,994Jet fuel 9,046 8,035Government user fees 4,154 3,539Catering costs 981 780Handling costs 1,649 1,372Technical aircraft maintenance 2,566 2,025Computer and telecommunications costs 981 898Other 3,621 3,462Total 25,442 22,105
Note 5 Depreciation, amortization and impairment
2012–2013Nov–Oct
2012Jan–Oct
Intangible assets 47 38Aircraft 1,377 1,108Spare engines and spare parts 107 158Workshop and aircraft servicing equipment 35 29Other equipment and vehicles 49 46Buildings and fittings 43 47Total 1,658 1,426
Note 6 Share of income and equity in affiliated companies
Share of income in affiliated companies:2012–2013
Nov–Oct2012
Jan–Oct
Air Greenland A/S1 23 28Flyrail AB –3 –1Malmö Flygfraktterminal AB 5 5Other 0 0Total 25 32
Total revenue of affiliated companies 1,540 1,278Income after tax in affiliated companies 78 105
1) The share of income includes adjustment of last year’s income figure by MSEK –4 (–8).
Share of equity
Equity in affiliated companies: Corporate registration number Domicile Share of equity %2013
Oct 312012
Oct 31
Air Greenland A/S 30672 Nuuk, Greenland 37.5 338 308Flyrail AB 556773-5252 Norrköping,Sweden 50.0 0 3Malmö Flygfraktterminal AB 556061-7051 Malmö, Sweden 40.0 11 12Other 3 2Total 352 325
Total assets in affiliated companies 1,768 1,752Total liabilities in affiliated companies –815 –852Shareholders’ equity in affiliated companies 953 900
Note 3, continued
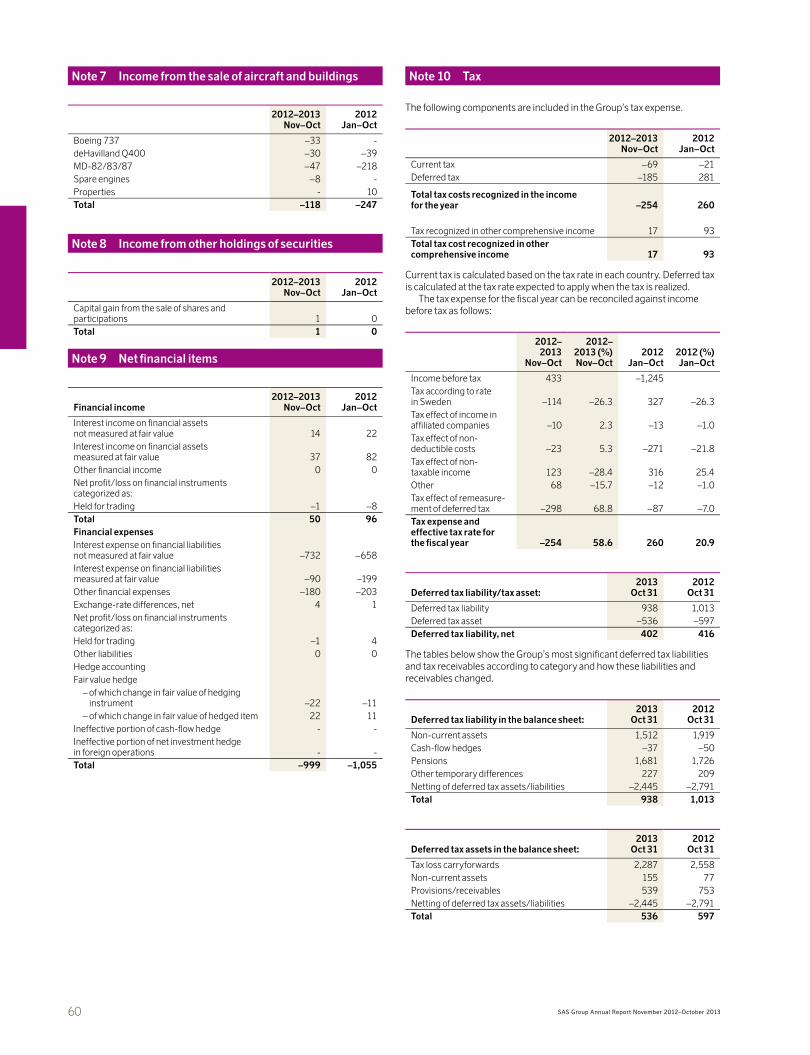
60 SAS Group Annual Report November 2012–October 2013
Note 7 Income from the sale of aircraft and buildings
2012–2013Nov–Oct
2012Jan–Oct
Boeing 737 –33 -deHavilland Q400 –30 –39MD-82/83/87 –47 –218Spare engines –8 -Properties - 10Total –118 –247
Note 8 Income from other holdings of securities
2012–2013Nov–Oct
2012Jan–Oct
Capital gain from the sale of shares and participations 1 0Total 1 0
Note 9 Net financial items
Financial income2012–2013
Nov–Oct2012
Jan–Oct
Interest income on financial assets not measured at fair value 14 22Interest income on financial assets measured at fair value 37 82Other financial income 0 0Net profit/loss on financial instruments categorized as:Held for trading –1 –8Total 50 96Financial expensesInterest expense on financial liabilities not measured at fair value –732 –658Interest expense on financial liabilities measured at fair value –90 –199Other financial expenses –180 –203Exchange-rate differences, net 4 1Net profit/loss on financial instruments categorized as:Held for trading –1 4Other liabilities 0 0Hedge accountingFair value hedge
– of which change in fair value of hedging instrument –22 –11
– of which change in fair value of hedged item 22 11Ineffective portion of cash-flow hedge - -Ineffective portion of net investment hedge in foreign operations - -Total –999 –1,055
Note 10 Tax
The following components are included in the Group’s tax expense.
2012–2013Nov–Oct
2012Jan–Oct
Current tax –69 –21Deferred tax –185 281
Total tax costs recognized in the income for the year –254 260
Tax recognized in other comprehensive income 17 93Total tax cost recognized in other comprehensive income 17 93
Current tax is calculated based on the tax rate in each country. Deferred tax is calculated at the tax rate expected to apply when the tax is realized.
The tax expense for the fiscal year can be reconciled against income before tax as follows:
2012–2013
Nov–Oct
2012–2013 (%)Nov–Oct
2012Jan–Oct
2012 (%)Jan–Oct
Income before tax 433 –1,245Tax according to rate in Sweden –114 –26.3 327 –26.3Tax effect of income in affiliated companies –10 2.3 –13 –1.0Tax effect of non- deductible costs –23 5.3 –271 –21.8Tax effect of non- taxable income 123 –28.4 316 25.4Other 68 –15.7 –12 –1.0Tax effect of remeasure-ment of deferred tax –298 68.8 –87 –7.0Tax expense and effective tax rate for the fiscal year –254 58.6 260 20.9
Deferred tax liability/tax asset:2013
Oct 312012
Oct 31
Deferred tax liability 938 1,013Deferred tax asset –536 –597Deferred tax liability, net 402 416
The tables below show the Group’s most significant deferred tax liabilities and tax receivables according to category and how these liabilities and receivables changed.
Deferred tax liability in the balance sheet:2013
Oct 312012
Oct 31
Non-current assets 1,512 1,919Cash-flow hedges –37 –50Pensions 1,681 1,726Other temporary differences 227 209Netting of deferred tax assets/liabilities –2,445 –2,791Total 938 1,013
Deferred tax assets in the balance sheet:2013
Oct 312012
Oct 31
Tax loss carryforwards 2,287 2,558Non-current assets 155 77Provisions/receivables 539 753Netting of deferred tax assets/liabilities –2,445 –2,791Total 536 597
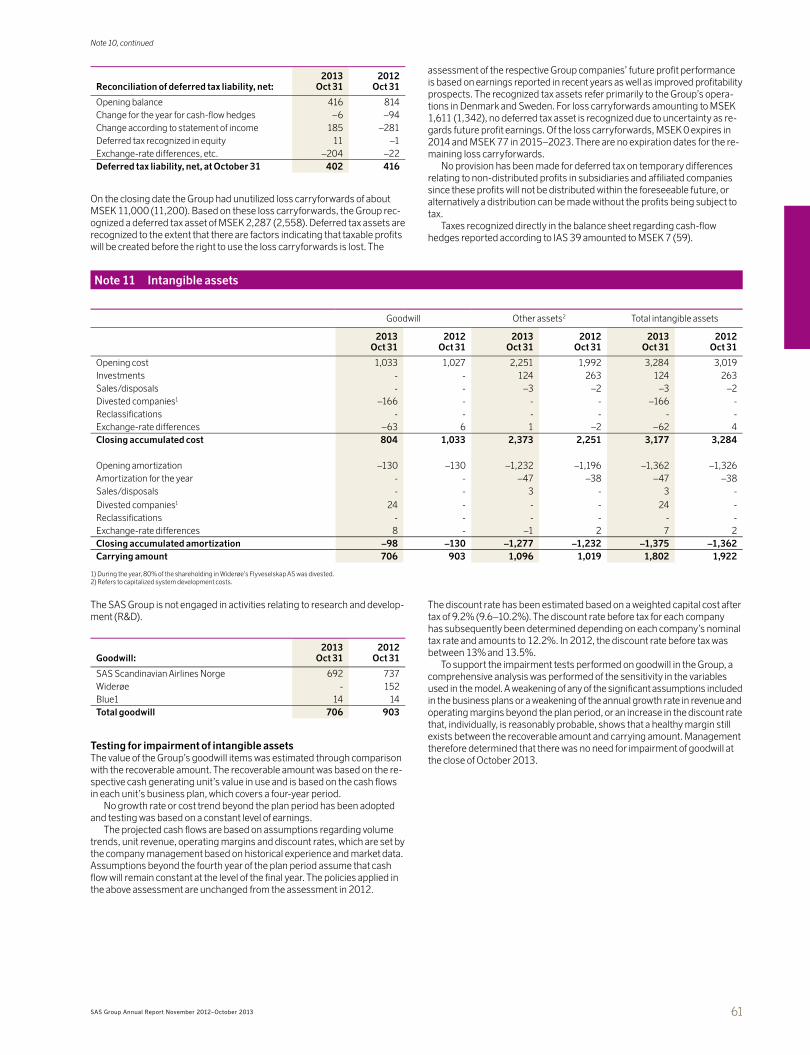
61SAS Group Annual Report November 2012–October 2013
Reconciliation of deferred tax liability, net:2013
Oct 312012
Oct 31
Opening balance 416 814Change for the year for cash-flow hedges –6 –94Change according to statement of income 185 –281Deferred tax recognized in equity 11 –1Exchange-rate differences, etc. –204 –22Deferred tax liability, net, at October 31 402 416
On the closing date the Group had unutilized loss carryforwards of about MSEK 11,000 (11,200). Based on these loss carryforwards, the Group rec-ognized a deferred tax asset of MSEK 2,287 (2,558). Deferred tax assets are recognized to the extent that there are factors indicating that taxable profits will be created before the right to use the loss carryforwards is lost. The
assessment of the respective Group companies’ future profit performance is based on earnings reported in recent years as well as improved profitability prospects. The recognized tax assets refer primarily to the Group’s opera-tions in Denmark and Sweden. For loss carryforwards amounting to MSEK 1,611 (1,342), no deferred tax asset is recognized due to uncertainty as re-gards future profit earnings. Of the loss carryforwards, MSEK 0 expires in 2014 and MSEK 77 in 2015–2023. There are no expiration dates for the re-maining loss carryforwards.
No provision has been made for deferred tax on temporary differences relating to non-distributed profits in subsidiaries and affiliated companies since these profits will not be distributed within the foreseeable future, or alternatively a distribution can be made without the profits being subject to tax.
Taxes recognized directly in the balance sheet regarding cash-flow hedges reported according to IAS 39 amounted to MSEK 7 (59).
Note 11 Intangible assets
Goodwill Other assets2 Total intangible assets
2013 Oct 31
2012 Oct 31
2013 Oct 31
2012 Oct 31
2013 Oct 31
2012 Oct 31
Opening cost 1,033 1,027 2,251 1,992 3,284 3,019Investments - - 124 263 124 263Sales/disposals - - –3 –2 –3 –2Divested companies1 –166 - - - –166 -Reclassifications - - - - - -Exchange-rate differences –63 6 1 –2 –62 4Closing accumulated cost 804 1,033 2,373 2,251 3,177 3,284
Opening amortization –130 –130 –1,232 –1,196 –1,362 –1,326Amortization for the year - - –47 –38 –47 –38Sales/disposals - - 3 - 3 -
Divested companies1 24 - - - 24 -Reclassifications - - - - - -Exchange-rate differences 8 - –1 2 7 2Closing accumulated amortization –98 –130 –1,277 –1,232 –1,375 –1,362Carrying amount 706 903 1,096 1,019 1,802 1,922
1) During the year, 80% of the shareholding in Widerøe’s Flyveselskap AS was divested.2) Refers to capitalized system development costs.
The SAS Group is not engaged in activities relating to research and develop-ment (R&D).
Goodwill:2013
Oct 312012
Oct 31
SAS Scandinavian Airlines Norge 692 737Widerøe - 152Blue1 14 14Total goodwill 706 903
Testing for impairment of intangible assetsThe value of the Group’s goodwill items was estimated through comparison with the recoverable amount. The recoverable amount was based on the re-spective cash generating unit’s value in use and is based on the cash flows in each unit’s business plan, which covers a four-year period.
No growth rate or cost trend beyond the plan period has been adopted and testing was based on a constant level of earnings.
The projected cash flows are based on assumptions regarding volume trends, unit revenue, operating margins and discount rates, which are set by the company management based on historical experience and market data. Assumptions beyond the fourth year of the plan period assume that cash flow will remain constant at the level of the final year. The policies applied in the above assessment are unchanged from the assessment in 2012.
The discount rate has been estimated based on a weighted capital cost after tax of 9.2% (9.6–10.2%). The discount rate before tax for each company has subsequently been determined depending on each company’s nominal tax rate and amounts to 12.2%. In 2012, the discount rate before tax was between 13% and 13.5%.
To support the impairment tests performed on goodwill in the Group, a comprehensive analysis was performed of the sensitivity in the variables used in the model. A weakening of any of the significant assumptions included in the business plans or a weakening of the annual growth rate in revenue and operating margins beyond the plan period, or an increase in the discount rate that, individually, is reasonably probable, shows that a healthy margin still exists between the recoverable amount and carrying amount. Management therefore determined that there was no need for impairment of goodwill at the close of October 2013.
Note 10, continued
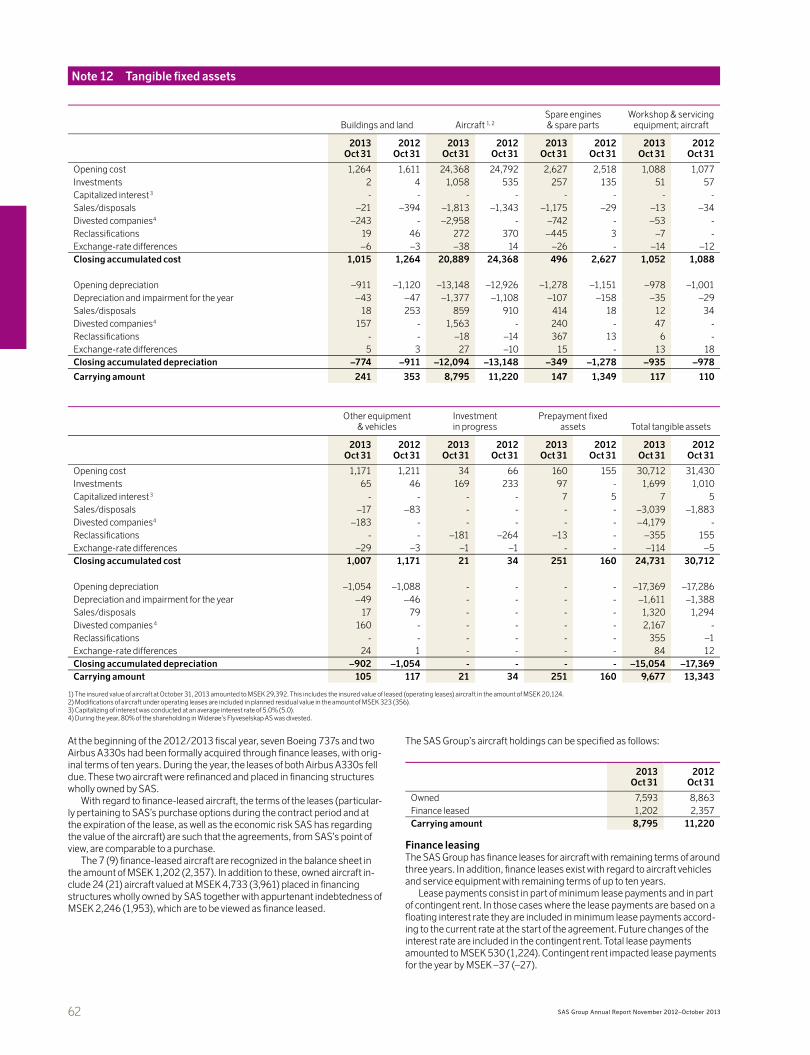
62 SAS Group Annual Report November 2012–October 2013
Note 12 Tangible fixed assets
Buildings and land Aircraft 1, 2Spare engines & spare parts
Workshop & servicing equipment; aircraft
2013 Oct 31
2012Oct 31
2013 Oct 31
2012Oct 31
2013 Oct 31
2012Oct 31
2013 Oct 31
2012Oct 31
Opening cost 1,264 1,611 24,368 24,792 2,627 2,518 1,088 1,077Investments 2 4 1,058 535 257 135 51 57Capitalized interest 3 - - - - - - - -Sales/disposals –21 –394 –1,813 –1,343 –1,175 –29 –13 –34Divested companies4 –243 - –2,958 - –742 - –53 -Reclassifications 19 46 272 370 –445 3 –7 -Exchange-rate differences –6 –3 –38 14 –26 - –14 –12Closing accumulated cost 1,015 1,264 20,889 24,368 496 2,627 1,052 1,088
Opening depreciation –911 –1,120 –13,148 –12,926 –1,278 –1,151 –978 –1,001Depreciation and impairment for the year –43 –47 –1,377 –1,108 –107 –158 –35 –29Sales/disposals 18 253 859 910 414 18 12 34Divested companies4 157 - 1,563 - 240 - 47 -Reclassifications - - –18 –14 367 13 6 -Exchange-rate differences 5 3 27 –10 15 - 13 18Closing accumulated depreciation –774 –911 –12,094 –13,148 –349 –1,278 –935 –978
Carrying amount 241 353 8,795 11,220 147 1,349 117 110
Other equipment & vehicles
Investment in progress
Prepayment fixed assets Total tangible assets
2013Oct 31
2012Oct 31
2013Oct 31
2012Oct 31
2013Oct 31
2012Oct 31
2013Oct 31
2012Oct 31
Opening cost 1,171 1,211 34 66 160 155 30,712 31,430Investments 65 46 169 233 97 - 1,699 1,010Capitalized interest 3 - - - - 7 5 7 5Sales/disposals –17 –83 - - - - –3,039 –1,883Divested companies4 –183 - - - - - –4,179 -Reclassifications - - –181 –264 –13 - –355 155Exchange-rate differences –29 –3 –1 –1 - - –114 –5Closing accumulated cost 1,007 1,171 21 34 251 160 24,731 30,712
Opening depreciation –1,054 –1,088 - - - - –17,369 –17,286Depreciation and impairment for the year –49 –46 - - - - –1,611 –1,388Sales/disposals 17 79 - - - - 1,320 1,294Divested companies 4 160 - - - - - 2,167 -Reclassifications - - - - - - 355 –1Exchange-rate differences 24 1 - - - - 84 12Closing accumulated depreciation –902 –1,054 - - - - –15,054 –17,369Carrying amount 105 117 21 34 251 160 9,677 13,343
1) The insured value of aircraft at October 31, 2013 amounted to MSEK 29,392. This includes the insured value of leased (operating leases) aircraft in the amount of MSEK 20,124. 2) Modifications of aircraft under operating leases are included in planned residual value in the amount of MSEK 323 (356).3) Capitalizing of interest was conducted at an average interest rate of 5.0% (5.0).4) During the year, 80% of the shareholding in Widerøe’s Flyveselskap AS was divested.
At the beginning of the 2012/2013 fiscal year, seven Boeing 737s and two Airbus A330s had been formally acquired through finance leases, with orig-inal terms of ten years. During the year, the leases of both Airbus A330s fell due. These two aircraft were refinanced and placed in financing structures wholly owned by SAS.
With regard to finance-leased aircraft, the terms of the leases (particular-ly pertaining to SAS’s purchase options during the contract period and at the expiration of the lease, as well as the economic risk SAS has regarding the value of the aircraft) are such that the agreements, from SAS’s point of view, are comparable to a purchase.
The 7 (9) finance-leased aircraft are recognized in the balance sheet in the amount of MSEK 1,202 (2,357). In addition to these, owned aircraft in-clude 24 (21) aircraft valued at MSEK 4,733 (3,961) placed in financing structures wholly owned by SAS together with appurtenant indebtedness of MSEK 2,246 (1,953), which are to be viewed as finance leased.
The SAS Group’s aircraft holdings can be specified as follows:
2013 Oct 31
2012 Oct 31
Owned 7,593 8,863Finance leased 1,202 2,357Carrying amount 8,795 11,220
Finance leasingThe SAS Group has finance leases for aircraft with remaining terms of around three years. In addition, finance leases exist with regard to aircraft vehicles and service equipment with remaining terms of up to ten years.
Lease payments consist in part of minimum lease payments and in part of contingent rent. In those cases where the lease payments are based on a floating interest rate they are included in minimum lease payments accord-ing to the current rate at the start of the agreement. Future changes of the interest rate are included in the contingent rent. Total lease payments amounted to MSEK 530 (1,224). Contingent rent impacted lease payments for the year by MSEK –37 (–27).
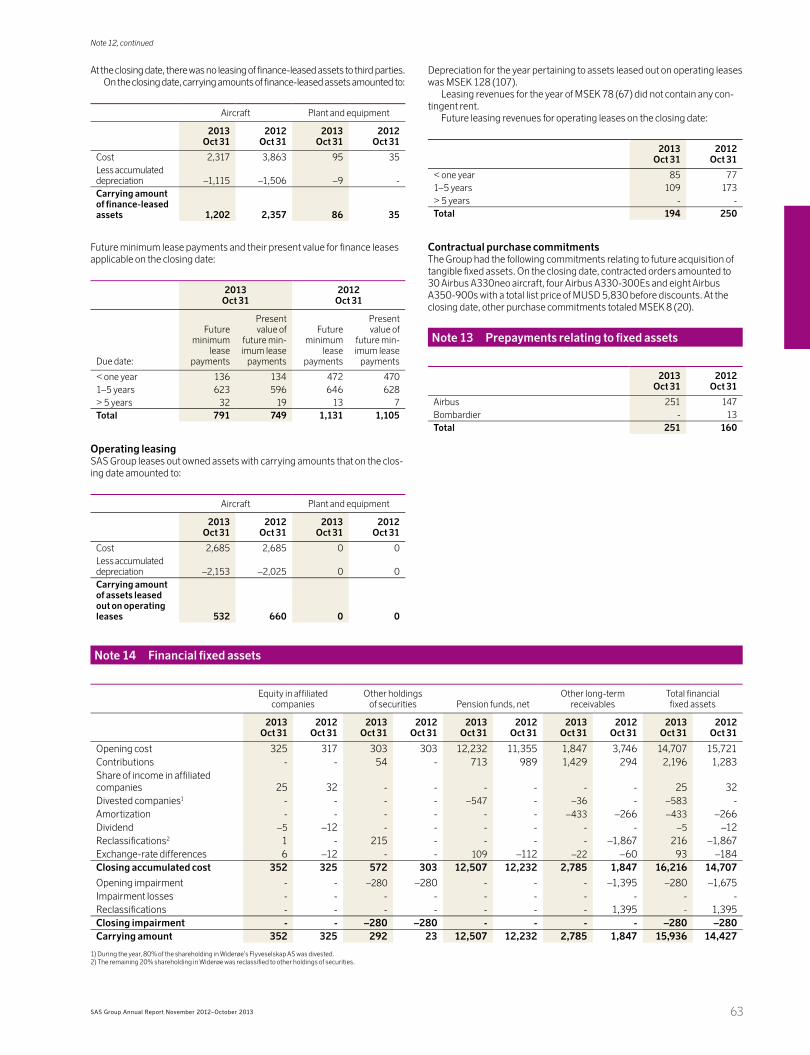
63SAS Group Annual Report November 2012–October 2013
At the closing date, there was no leasing of finance-leased assets to third parties.On the closing date, carrying amounts of finance-leased assets amounted to:
Aircraft Plant and equipment
2013Oct 31
2012Oct 31
2013Oct 31
2012Oct 31
Cost 2,317 3,863 95 35Less accumulated depreciation –1,115 –1,506 –9 -Carrying amount of finance-leased assets 1,202 2,357 86 35
Future minimum lease payments and their present value for finance leases applicable on the closing date:
2013 Oct 31
2012 Oct 31
Due date:
Future minimum
lease payments
Present value of
future min-imum lease
payments
Future minimum
lease payments
Present value of
future min-imum lease
payments
< one year 136 134 472 4701–5 years 623 596 646 628> 5 years 32 19 13 7Total 791 749 1,131 1,105
Operating leasingSAS Group leases out owned assets with carrying amounts that on the clos-ing date amounted to:
Aircraft Plant and equipment
2013Oct 31
2012Oct 31
2013Oct 31
2012Oct 31
Cost 2,685 2,685 0 0Less accumulated depreciation –2,153 –2,025 0 0Carrying amount of assets leased out on operating leases 532 660 0 0
Depreciation for the year pertaining to assets leased out on operating leases was MSEK 128 (107).
Leasing revenues for the year of MSEK 78 (67) did not contain any con-tingent rent.
Future leasing revenues for operating leases on the closing date:
2013Oct 31
2012Oct 31
< one year 85 771–5 years 109 173> 5 years - -Total 194 250
Contractual purchase commitmentsThe Group had the following commitments relating to future acquisition of tangible fixed assets. On the closing date, contracted orders amounted to 30 Airbus A330neo aircraft, four Airbus A330-300Es and eight Airbus A350-900s with a total list price of MUSD 5,830 before discounts. At the closing date, other purchase commitments totaled MSEK 8 (20).
Note 13 Prepayments relating to fixed assets
2013Oct 31
2012Oct 31
Airbus 251 147Bombardier - 13Total 251 160
Note 14 Financial fixed assets
Equity in affiliated companies
Other holdings of securities Pension funds, net
Other long-term receivables
Total financial fixed assets
2013Oct 31
2012Oct 31
2013Oct 31
2012Oct 31
2013Oct 31
2012Oct 31
2013Oct 31
2012Oct 31
2013Oct 31
2012Oct 31
Opening cost 325 317 303 303 12,232 11,355 1,847 3,746 14,707 15,721Contributions - - 54 - 713 989 1,429 294 2,196 1,283Share of income in affiliated companies 25 32 - - - - - - 25 32Divested companies1 - - - - –547 - –36 - –583 -Amortization - - - - - - –433 –266 –433 –266Dividend –5 –12 - - - - - - –5 –12Reclassifications2 1 - 215 - - - - –1,867 216 –1,867Exchange-rate differences 6 –12 - - 109 –112 –22 –60 93 –184Closing accumulated cost 352 325 572 303 12,507 12,232 2,785 1,847 16,216 14,707
Opening impairment - - –280 –280 - - - –1,395 –280 –1,675Impairment losses - - - - - - - - - -Reclassifications - - - - - - - 1,395 - 1,395Closing impairment - - –280 –280 - - - - –280 –280Carrying amount 352 325 292 23 12,507 12,232 2,785 1,847 15,936 14,427
1) During the year, 80% of the shareholding in Widerøe’s Flyveselskap AS was divested.2) The remaining 20% shareholding in Widerøe was reclassified to other holdings of securities.
Note 12, continued

64 SAS Group Annual Report November 2012–October 2013
Note 15 Pension funds, net
2013Oct 31
2012 Dec 31
Pension funds, net, funded plans 13,778 14,083Pension funds, net, unfunded plans –1,271 –1,851Total 12,507 12,232
Most personnel pension plans in Scandinavia are defined-benefit plans. De-fined-contribution pension plans are in place for the majority of personnel in Denmark as is the case for younger salaried employees in Sweden and per-sonnel covered by the SAF-LO collective agreement. The majority of de-fined-benefit pension plans are placed with insurance companies. The col-lective pension plans for pilots and salaried employees in Sweden, pilots in Denmark and for personnel in Norway are placed with defined-benefit pen-sion plans at insurance companies in the respective countries. In Sweden, pension plans are mainly placed with Alecta and Euroben, in Denmark with Danica and in Norway with DNB.
A substantial portion of SAS employees in Sweden are covered by an ITP pension reinsured by Alecta (the Alecta plan). The Alecta plan is a multi-em-ployer pension plan. According to a statement by the Swedish Financial Re-porting Board, UFR 3, this constitutes a defined-benefit plan and pursuant to UFR 6, enterprises covered by a multi-employer pension plan classified as defined-benefit must account for their proportional share of the plan’s obligations, plan assets and costs in the same way as for any other defined-benefit plan. SAS is provided with information that enables SAS to report its proportional share of the Alecta plan’s commitments, plan assets and costs in accordance with IAS 19 rules regarding defined-benefit pension plans.
In November 2012, new collective agreements were signed with flight crew in Scandinavia. Among other things, the new agreements mean that the defined-benefit pension plans were, largely, replaced with defined-con-tribution pension plans effective as of the first quarter of 2013/2014. When the above changes are reported in the first quarter of 2013/2014, the pen-sion commitment will be reduced by about SEK 12.9 billion. In addition, the change in terms will give rise to an improvement in earnings of about SEK 1 billion.
In addition to the transition to defined-contribution pension plans, other measures included the removal of early retirement and part-time pensions, the lowering of pensionable income and raising the retirement age for cabin crew under the Alecta plan from 60 to 65. These changes have brought about an improvement in earnings of MSEK 450 in the 2012/2013 fiscal year and reduced pension commitments and actuarial gains and losses by about SEK 1.7 billion. In addition, the sale of 80% of Widerøe in September 2013 further reduced pension commitments by about SEK 2.8 billion and actuarial gains and losses by about SEK 1.1 billion.
At October 31, 2012, pension commitments totaled SEK 33.5 billion. In the 2012/2013 fiscal year, pension commitments were reduced by about SEK 5 billion and following recognition of the transition to defined-contribu-tion pension plans, the total reduction will be about SEK 18 billion. Since some employees already have early retirement and part-time pensions in place, this commitment will decrease over the next five years and, at the end of the 2017/2018 fiscal year, pension commitments are therefore expected to amount to approximately SEK 14 billion, which means a reduction of about SEK 19.5 billion, or about 60% of the original pension commitments.
In calculating pension commitments, the year’s pension earnings and returns on plan assets, locally set parameters are applied in the respective countries on the basis of the local market situation and expected future trends. The following long-term economic assumptions represent a weight-ed average for the SAS Group:
2013 Oct 31
2012 Oct 31
2011 Dec 31
Discount rate 4.2% 3.8% 4.2%Expected long-term rate of return on plan assets 5.9% 5.9% 5.9%Inflation 1.9% 1.6% 1.7%Future salary adjustments 1.8% 1.6% 1.7%Future adjustments of current pensions 1.9% 1.6% 1.7%
The following interest parameters are used for the largest pension plans in Sweden and Norway:
Discount rate 4.4% (3.5%) in Sweden and 4.1% (4.0%) in Norway Long-term rate of return 6.0% (6.0%) in Sweden and 6.0% (6.0%) in Norway
According to IAS 19, the discount rate is determined by reference to the market yields on corporate bonds at the closing date with the same term as the commitment, which amounts to about 15 years for SAS. Where no cor-porate bonds exist with the same term as the commitment, the interest rate has been extrapolated or interpolated as necessary.
The discount rate has been determined on the basis of market yields on high-quality corporate bonds (mortgage bonds) and the tenor of the bonds reflects the estimated timing and size of pension payments (duration) as well as the currencies these payments are expected to be made in.
Other financial assumptions are based on anticipated developments during the term of the commitment.
As part of determining the expected return on plan assets, the Group takes into consideration the present value of the assets and expected allo-cation by category as well as the historic and expected return on the differ-ent asset categories, in other words, the long-term return must correspond to the expected long-term return on plan assets based on the pension insti-tutes’ investments in equities or interest-bearing securities.
The inflation assumption is 2.0% in Sweden, 1.5% Denmark and 1.75% in Norway, which corresponds with estimated future salary adjustments in the respective countries.
Actuarial gains and losses may arise from actual returns being lower or higher than expected, or by actual inflation levels and salary adjustments deviating from assumptions. In addition, actuarial gains and losses are im-pacted by changed parameters regarding the discount rate, life expectancy and early retirement.
IAS 19 permits the postponement of recognizing actuarial gains and losses by amortizing accumulated actuarial gains and losses that exceed the greater of 10% of the commitment or the funded assets over the aver-age remaining period of employment. SAS estimates the remaining em-ployment period for most pension plans to be 15 years. A shorter amortiza-tion period is applied in some cases where the remaining employment period is deemed to be considerably shorter.
At the beginning of the 2012/2013 fiscal year, accumulated unrecog-nized actuarial gains and losses including plan amendments amounted to SEK 13.5 billion. During the fiscal year, the deviation decreased primarily due to changed pension terms and an increased discount rate and the sale of Widerøe, which reduced actuarial gains and losses by about SEK 1.7 bil-lion and SEK 1.1 billion respectively. Amortization of actuarial gains and losses for the year amounted to about SEK 0.6 billion. At the end of the 2012/2013 fiscal year, accumulated unrecognized actuarial gains and losses including plan amendments amounted to about SEK 10.3 billion.
Sensitivity to changes in individual parameters can be estimated as follows: A 1 percentage-point change in the discount rate has an impact of approximately SEK 3.4 billion on the commitment, a 1 percentage-point change in the inflation assumption has an impact of approximately SEK 1.4 billion on the commitment and a 1 percentage-point change in the parame-ter for payroll adjustment has an impact of approximately SEK 1.2 billion on the commitment. A 1 percentage-point change in the expected long-term return on plan assets has an impact of approximately SEK 0.2 billion on the fair value of plan assets.
Defined-benefit pension plans2012–2013
Nov–Oct2012
Jan–Oct
Current service cost –758 –754Interest cost –1,156 –1,051Expected return on plan assets 1,830 1,551Curtailments 242 -Amortization of actuarial gains and losses and plan amendments for the year –589 –298Total expense recognized in profit and loss –431 –552
The above cost is recognized in its entirety as a payroll expense.

65SAS Group Annual Report November 2012–October 2013
In the financial statements, the commitments of the SAS Group are included as specified in the table below:
Status, booked pension assets2013
Oct 312012
Oct 31
Fair value plan assets 30,775 32,264Present value of pension commitments –28,536 –33,506Total 2,239 –1,242Unrecognized actuarial gains and losses and plan amendments 1 10,268 13,474Book assets 12,507 12,232
1) Of which actuarial gains and losses MSEK 10,079 (13,239).
Changes in present value of defined-benefit plan commitments 2013 2012
Opening balance, pension commitments 33,506 32,786Pensions paid out –1,693 –1,478Current service cost 758 754Interest cost 1,156 1,051Curtailments –397 -Actuarial gains and losses (–/+) –1,284 509Net increase in liabilities from disposals –2,771 -Exchange-rate differences –739 –116Closing balance, defined-benefit commitments, October 31 28,536 33,506
Change in fair value of plan assets 2013 2012
Opening balance, fair value 32,264 32,089Employer contributions 1,333 1,541Pensions paid out –1,693 –1,478Expected return on plan assets 1,830 1,551Actuarial gains and losses (+/–) –94 –1,360Net increase in assets from disposals –2,436 -Exchange-rate differences –429 –79Closing balance, fair value, October 31 30,775 32,264
Plan assets consist of the following Group
2013 Oct 31
2012 Oct 31
Equities 25% 19%Interest-bearing securities 65% 70%Properties 8% 10%Other 2% 1%
100% 100%
Only an insignificant share of the plan assets is invested in SAS shares.
In the 2012/2013 fiscal year, the actual return on plan assets was in line with the Group’s estimated long-term return. The actual rate of return on plan assets totalled MSEK 1,735 (626), which corresponds to a return of 6% (2%). In the 2013/2014 fiscal year, the return is expected to be about 6%.
In the 2013/2014 fiscal year, employer contributions are expected to amount to approximately SEK 0.6 billion, corresponding to a decrease of about SEK 0.7 billion, which is attributable to the majority of SAS employees changing to defined-contribution pension plans moving forward.
The difference between plan assets/pension commitments and net book assets is shown below (as per October 31, 2013):
Plan assets
Pension commit-
ments Difference
Unrecognized actuarial gains and losses and
plan amend-ments
Pension funds, net
Pension plans in Sweden 16,593 12,244 4,349 4,013 8,362Pension plans in Norway 8,525 9,941 –1,416 3,917 2,501Pension plans in other coun-tries 5,657 6,351 –694 2,338 1,644Total 30,775 28,536 2,239 10,268 12,507
“Pension funds, net” includes unfunded pension plans funded via operating income in the amount of MSEK 331 (461) in Sweden and MSEK 940 (1,389) in Norway.
Pension funds, net, including pension commitments, plan assets plus unrecognized plan amendments and actuarial gains and losses for the de-fined-benefit pension plans performed as follows:
Pension funds, net 2013 2012
Opening balance 12,232 11,355Total expense recognized in profit and loss –431 –552Employer contributions 1,333 1,541Pension funds (effects from disposals) –736 -Exchange-rate differences 109 –112Closing balance, October 31 12,507 12,232
Of total pension commitments of MSEK 28,536 (33,506), MSEK 26,507 (30,600) was funded and MSEK 2,029 (2,906) unfunded.
2013 Oct 31
2012 Oct 31
2011 Dec 31
2010 Dec 31
2009 Dec 31
Present value pension commitments –28,536 –33,506 –32,786 –31,370 –33,578Fair value of plan assets 30,775 32,264 32,089 31,651 32,816Deficit/surplus 2,239 –1,242 –697 281 –762
Experience gains/(losses) on plan assets –94 –925 –1,449 –280 –735Experience gains/(losses) on defined-benefit commitments 1,598 –1,417 484 1,334 –21
Note 16 Expendable spare parts and inventories
2013 Oct 31
2012 Oct 31
Expendable spare parts, flight equipment 267 454Expendable spare parts, other 47 193Inventories 45 40Total 359 687
Measured at cost 359 687Measured at net realizable value - -Total 359 687
Note 15, continued

66 SAS Group Annual Report November 2012–October 2013
Note 17 Current receivables
Net impairment of accounts receivable and recovered accounts receivable came to MSEK 10 (11), charged to income.
Age analysis of non-impaired accounts receivable
2013 Oct 31
2012 Oct 31
Accounts receivable not yet due 1,124 1,187Due < 31 days 149 64Due 31–90 days 44 0Due 91–180 days 57 18Due > 180 days 2 42Total 1,376 1,311
Provision for doubtful accounts receivable2013
Oct 312012
Oct 31
Opening provision 31 32Provision for expected losses 3 10Reversed provisions –6 –2Actual losses –11 –9Closing provision 17 31
Note 18 Current receivables from affiliated companies
2013 Oct 31
2012 Oct 31
Air Greenland A/S 1 3Total 1 3
Note 19 Prepaid expenses and accrued income
2013 Oct 31
2012 Oct 31
Prepaid expenses 653 767Accrued income 205 106Total 858 873
Note 20 Short-term investments
2013 Oct 31
2012 Oct 31
Treasury bills 599 -Deposits 977 118Commercial paper 352 -Tax deduction account in Norway 152 248Total 2,080 366
The carrying amount of short-term investments corresponds with the fair value. Fair value is the amount that should have been received for short-term investments outstanding if sold on the closing date. Deposits and the tax deduction account are categorized as loans and receivables. Other financial instruments are classified as held for trading.
All investments have a term of no more than three months. The item de-posits includes receivables from other financial institutes of MSEK 766 (118).
Note 21 Share capital
Share capital The Company has two classes of shares, common shares and subordinated shares. As of October 31, 2013, a total of 329,000,000 common shares were issued and outstanding, which together constituted a registered share
capital of SEK 6,612,900,000. No changes were made in the 2012/2013 fiscal year as regards the number of shares or share capital. There are no subordinated shares issued or outstanding. The 329,000,000 common shares have a quotient value of SEK 20.1 per share. The common shares provide shareholders the rights found in the Swedish Companies Act and the Articles of Association. Subordinated shares provide shareholders the right to participate in and vote at SAS AB’s shareholders’ meetings. Subordinated shares do not entitle shareholders to dividends or participation in bonus is-sues. If subordinated shares are redeemed or the company is dissolved and its assets distributed, holders of subordinated shares receive compensation equivalent only to the nominal value of the shares plus an interest-rate factor.
To ensure that the ownership circumstances of the company comply with the requirements stipulated in bilateral aviation agreements or in laws or reg-ulations pertaining to the state of air traffic in the EEA, the Board is entitled, pursuant to the Articles of Association, to make a decision on mandatory re-demption of shares held by shareholders outside of Scandinavia without re-fund to affected shareholders. Should the redemption of such shares not be possible, the Board is entitled (subsequent to resolution by the shareholders’ meeting) to assign warrants with subscription rights for subordinated shares to Scandinavian shareholders to dilute the non-Scandinavian shareholding to the requisite level to ensure compliance with the aforementioned regulations.
The Board of SAS has proposed to the 2014 AGM that the Articles of As-sociation be amended to allow the issue of preference shares and that the Board be authorized to decide on the new issue of preference shares and convertibles.
Dividend policyThe SAS Group’s annual dividend on common shares is determined by taking into account the Group’s earnings, financial position, capital require-ments and relevant macroeconomic conditions. Over a business cycle, the dividend is to be in the region of 30–40% of the Group’s income after stan-dard tax. To protect the Group’s financial position, no dividend is paid as a rule in the event of a loss.
Note 22 Reserves
Translation reserve 2013 2012
Opening translation reserve 29 58Translation differences for the year –284 –34Less: Hedging of exchange risk in foreign operations 49 6Tax pertaining to hedging of exchange risk in foreign operations 11 –1Closing translation reserve, Oct 31 –195 29Hedging reserveOpening hedging reserve –12 251Cash-flow hedges:
– Recognized directly in other comprehensive income –33 –225
– Change in statement of income 4 –132– Tax attributed to year’s change
in hedging reserve 6 94Closing hedging reserve, Oct 31 –35 –12Total reservesOpening reserves 17 309Change in reserves for the year:
– Translation reserve –224 –29– Hedging reserve –23 –263
Closing reserves, Oct 31 –230 17
Translation reserveThe translation reserve includes all exchange-rate differences arising in con-junction with the translation of financial statements from foreign operations that have prepared their financial statements in a currency other than Swedish kro-nor. The translation reserve also comprises exchange-rate differences arising in conjunction with the translation of liabilities and currency forward contracts re-ported as hedging instruments of a net investment in a foreign operation.
Hedging reserveThe hedging reserve includes the effective part of the cumulative net change in fair value on a cash-flow instrument attributable to hedging trans-actions that have not yet incurred.

67SAS Group Annual Report November 2012–October 2013
Note 23 Long-term liabilities
Long-term liabilities that fall due more than five years after the closing date.
2013 Oct 31
2012 Oct 31
Subordinated loans 956 978Bond loans - 201Other loans 1,110 1,274Total 2,066 2,453
Note 24 Subordinated loans
A subordinated loan of MCHF 200 was issued during the 1985/86 fiscal year. There is no set maturity date for this loan. The interest rate is fixed for 10-year periods and amounts to 2.375% from January 2006. SAS has an exclusive right to cancel this loan every fifth year. When the loan is canceled in connection with an interest-rate reset, SAS is entitled to repay the loan at 100% of its nominal value. If it is canceled five years after an interest-rate re-set, the loan must be repaid at 102.5% of nominal value.
In previous years, SAS repurchased MCHF 73 of the bonds, after which the balance of the loan is MCHF 127 (127), with a countervalue of MSEK 907 (907). The interest exposure of the loan has been switched from fixed to floating interest through an interest-rate swap. The loan is included in a fair-value hedge and the fair value amounted to MSEK 956 (978) on the closing date.
The loan is listed on the Basel Stock Exchange, Geneva Stock Exchange and Swiss Exchange. On the closing date, its total market value (including credit risk) amounted to MCHF till 48 (32), with a countervalue of MSEK 340 (231).
Note 25 Bond loans
In May 2001, a MEUR 1,000 European Medium-Term Note program was established. The EMTN program makes it possible for the Group to issue bonds with fixed or variable interest rates in any currency. On the closing
date, the SAS Group’s issued bonds amounted to MSEK 4,508 (2,763). A specification of individual bond loans is provided below:
Original amount issued Coupon rate TermDebt outstanding,
currency
2013 Oct 31
Carrying amount
2012 Oct 31
Carrying amount
MEUR 60.0 7.8% 1 2010/16 MEUR 58.2 512 494MEUR 75.0 9.7% 2011/14 MEUR 73.8 650 646MEUR 40.0 6.2% 1 2011/17 MEUR 38.0 334 323MSEK 1,300.0 10.5% 2011/14 MSEK 1,217.0 1,217 1,300MSEK 1,500.0 9,0% 2013/17 MSEK 1,487.2 1,487 -MEUR 35.0 8,7% 2013/18 MEUR 35.0 308 -Total 4,508 2,763Less amortization 2013/2014 and 2012/2013 –1,867 -Total 2,641 2,763
1) Coupon rate on closing date. The loan has a floating interest rate.
The debt outstanding in currency and the carrying amount in MSEK agrees with amortized cost. Repurchasing in an amount of MSEK 94 was per-formed in 2012/2013.
The interest-rate exposure is managed by entering into interest-rate
swap contracts to adjust the fixed-interest term for some of the loans. The Group has also entered into currency derivatives agreements for some of these bonds for the purpose of limiting currency risk.
Note 26 Other loans
2013 Oct 31
2012 Oct 31
Carrying amount Fair value1 Carrying amount Fair value1
Finance leases 625 627 1,069 1,079Convertible bond 1 ,536 1,627 1,491 1,625Other loans 3,516 3,799 4,062 4,381Derivatives 27 27 41 41Total before amortization 5,704 6,080 6,663 7,126Less amortization 2013/2014 and 2012/2013 -650 -777 –1,403 –1,505Total other loans 5,054 5,303 5,260 5,621
Maturity profile of other loans 13/14 14/15 15/16 16/17 17/18 2018> Total
Finance leases 97 103 110 315 - - 625Convertible bond - 1,536 - - - - 1,536Other loans 553 328 803 441 281 1,110 3,516Derivatives - 27 - - - - 27Total 650 1,994 913 756 281 1,110 5,704
1) Without taking into consideration the Group’s credit risk.
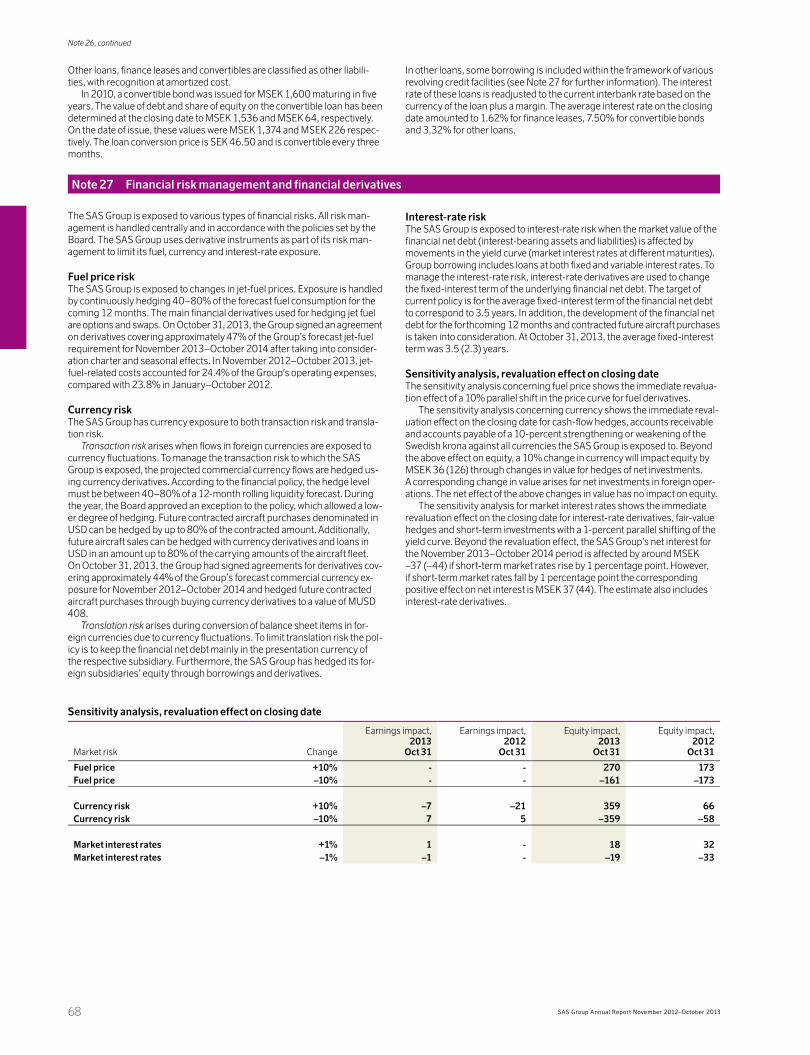
68 SAS Group Annual Report November 2012–October 2013
Other loans, finance leases and convertibles are classified as other liabili-ties, with recognition at amortized cost.
In 2010, a convertible bond was issued for MSEK 1,600 maturing in five years. The value of debt and share of equity on the convertible loan has been determined at the closing date to MSEK 1,536 and MSEK 64, respectively. On the date of issue, these values were MSEK 1,374 and MSEK 226 respec-tively. The loan conversion price is SEK 46.50 and is convertible every three months.
In other loans, some borrowing is included within the framework of various revolving credit facilities (see Note 27 for further information). The interest rate of these loans is readjusted to the current interbank rate based on the currency of the loan plus a margin. The average interest rate on the closing date amounted to 1.62% for finance leases, 7.50% for convertible bonds and 3,32% for other loans.
Note 27 Financial risk management and financial derivatives
The SAS Group is exposed to various types of financial risks. All risk man-agement is handled centrally and in accordance with the policies set by the Board. The SAS Group uses derivative instruments as part of its risk man-agement to limit its fuel, currency and interest-rate exposure.
Fuel price riskThe SAS Group is exposed to changes in jet-fuel prices. Exposure is handled by continuously hedging 40–80% of the forecast fuel consumption for the coming 12 months. The main financial derivatives used for hedging jet fuel are options and swaps. On October 31, 2013, the Group signed an agreement on derivatives covering approximately 47% of the Group’s forecast jet-fuel requirement for November 2013–October 2014 after taking into consider-ation charter and seasonal effects. In November 2012–October 2013, jet-fuel-related costs accounted for 24.4% of the Group’s operating expenses, compared with 23.8% in January–October 2012.
Currency riskThe SAS Group has currency exposure to both transaction risk and transla-tion risk.
Transaction risk arises when flows in foreign currencies are exposed to currency fluctuations. To manage the transaction risk to which the SAS Group is exposed, the projected commercial currency flows are hedged us-ing currency derivatives. According to the financial policy, the hedge level must be between 40–80% of a 12-month rolling liquidity forecast. During the year, the Board approved an exception to the policy, which allowed a low-er degree of hedging. Future contracted aircraft purchases denominated in USD can be hedged by up to 80% of the contracted amount. Additionally, future aircraft sales can be hedged with currency derivatives and loans in USD in an amount up to 80% of the carrying amounts of the aircraft fleet. On October 31, 2013, the Group had signed agreements for derivatives cov-ering approximately 44% of the Group’s forecast commercial currency ex-posure for November 2012–October 2014 and hedged future contracted aircraft purchases through buying currency derivatives to a value of MUSD 408.
Translation risk arises during conversion of balance sheet items in for-eign currencies due to currency fluctuations. To limit translation risk the pol-icy is to keep the financial net debt mainly in the presentation currency of the respective subsidiary. Furthermore, the SAS Group has hedged its for-eign subsidiaries’ equity through borrowings and derivatives.
Interest-rate riskThe SAS Group is exposed to interest-rate risk when the market value of the financial net debt (interest-bearing assets and liabilities) is affected by movements in the yield curve (market interest rates at different maturities). Group borrowing includes loans at both fixed and variable interest rates. To manage the interest-rate risk, interest-rate derivatives are used to change the fixed-interest term of the underlying financial net debt. The target of current policy is for the average fixed-interest term of the financial net debt to correspond to 3.5 years. In addition, the development of the financial net debt for the forthcoming 12 months and contracted future aircraft purchases is taken into consideration. At October 31, 2013, the average fixed-interest term was 3.5 (2.3) years.
Sensitivity analysis, revaluation effect on closing dateThe sensitivity analysis concerning fuel price shows the immediate revalua-tion effect of a 10% parallel shift in the price curve for fuel derivatives.
The sensitivity analysis concerning currency shows the immediate reval-uation effect on the closing date for cash-flow hedges, accounts receivable and accounts payable of a 10-percent strengthening or weakening of the Swedish krona against all currencies the SAS Group is exposed to. Beyond the above effect on equity, a 10% change in currency will impact equity by MSEK 36 (126) through changes in value for hedges of net investments. A corresponding change in value arises for net investments in foreign oper-ations. The net effect of the above changes in value has no impact on equity.
The sensitivity analysis for market interest rates shows the immediate revaluation effect on the closing date for interest-rate derivatives, fair-value hedges and short-term investments with a 1-percent parallel shifting of the yield curve. Beyond the revaluation effect, the SAS Group’s net interest for the November 2013–October 2014 period is affected by around MSEK –37 (–44) if short-term market rates rise by 1 percentage point. However, if short-term market rates fall by 1 percentage point the corresponding positive effect on net interest is MSEK 37 (44). The estimate also includes interest-rate derivatives.
Sensitivity analysis, revaluation effect on closing date
Market risk Change
Earnings impact, 2013
Oct 31
Earnings impact, 2012
Oct 31
Equity impact,2013
Oct 31
Equity impact,2012
Oct 31
Fuel price +10% - - 270 173Fuel price –10% - - –161 –173
Currency risk +10% –7 –21 359 66Currency risk –10% 7 5 –359 –58
Market interest rates +1% 1 - 18 32Market interest rates –1% –1 - –19 –33
Note 26, continued
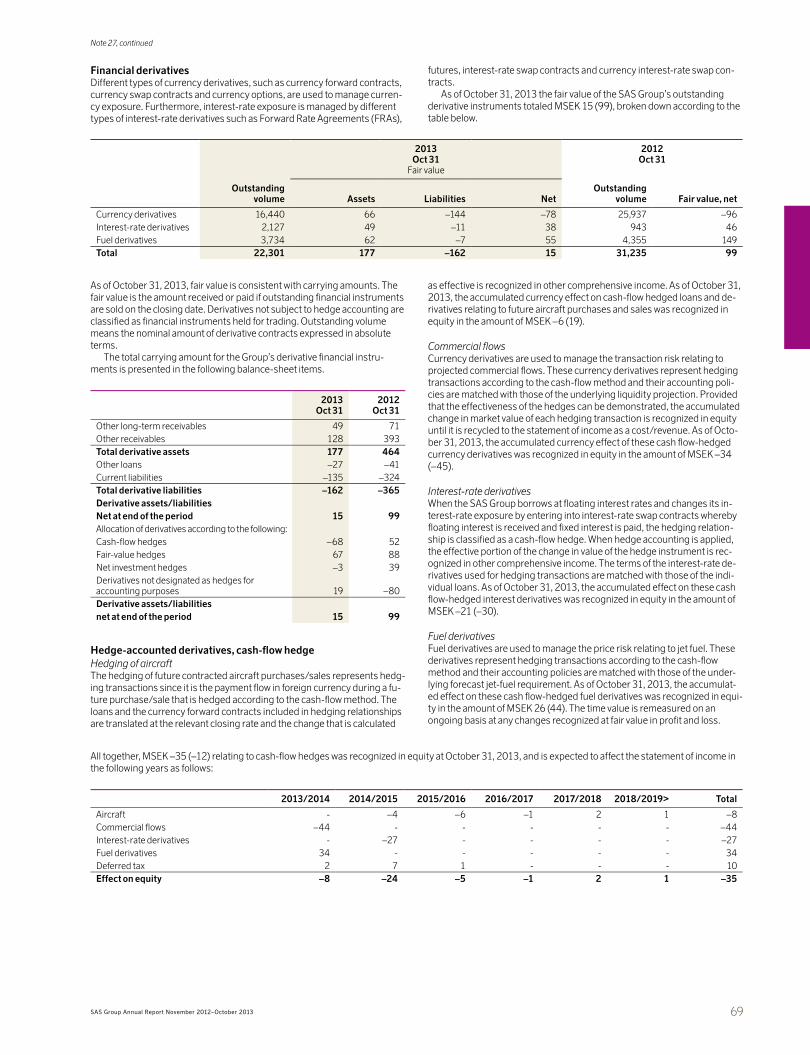
69SAS Group Annual Report November 2012–October 2013
Financial derivatives Different types of currency derivatives, such as currency forward contracts, currency swap contracts and currency options, are used to manage curren-cy exposure. Furthermore, interest-rate exposure is managed by different types of interest-rate derivatives such as Forward Rate Agreements (FRAs),
futures, interest-rate swap contracts and currency interest-rate swap con-tracts.
As of October 31, 2013 the fair value of the SAS Group’s outstanding derivative instruments totaled MSEK 15 (99), broken down according to the table below.
2013 Oct 31
Fair value
2012 Oct 31
Outstanding volume Assets Liabilities Net
Outstanding volume Fair value, net
Currency derivatives 16,440 66 –144 –78 25,937 –96Interest-rate derivatives 2,127 49 –11 38 943 46Fuel derivatives 3,734 62 –7 55 4,355 149Total 22,301 177 –162 15 31,235 99
As of October 31, 2013, fair value is consistent with carrying amounts. The fair value is the amount received or paid if outstanding financial instruments are sold on the closing date. Derivatives not subject to hedge accounting are classified as financial instruments held for trading. Outstanding volume means the nominal amount of derivative contracts expressed in absolute terms.
The total carrying amount for the Group’s derivative financial instru-ments is presented in the following balance-sheet items.
2013 Oct 31
2012 Oct 31
Other long-term receivables 49 71Other receivables 128 393Total derivative assets 177 464Other loans –27 –41Current liabilities –135 –324Total derivative liabilities –162 –365Derivative assets/liabilitiesNet at end of the period 15 99Allocation of derivatives according to the following:Cash-flow hedges –68 52Fair-value hedges 67 88Net investment hedges –3 39Derivatives not designated as hedges for accounting purposes 19 –80Derivative assets/liabilitiesnet at end of the period 15 99
Hedge-accounted derivatives, cash-flow hedgeHedging of aircraftThe hedging of future contracted aircraft purchases/sales represents hedg-ing transactions since it is the payment flow in foreign currency during a fu-ture purchase/sale that is hedged according to the cash-flow method. The loans and the currency forward contracts included in hedging relationships are translated at the relevant closing rate and the change that is calculated
as effective is recognized in other comprehensive income. As of October 31, 2013, the accumulated currency effect on cash-flow hedged loans and de-rivatives relating to future aircraft purchases and sales was recognized in equity in the amount of MSEK –6 (19).
Commercial flows Currency derivatives are used to manage the transaction risk relating to projected commercial flows. These currency derivatives represent hedging transactions according to the cash-flow method and their accounting poli-cies are matched with those of the underlying liquidity projection. Provided that the effectiveness of the hedges can be demonstrated, the accumulated change in market value of each hedging transaction is recognized in equity until it is recycled to the statement of income as a cost/revenue. As of Octo-ber 31, 2013, the accumulated currency effect of these cash flow-hedged currency derivatives was recognized in equity in the amount of MSEK –34 (–45).
Interest-rate derivativesWhen the SAS Group borrows at floating interest rates and changes its in-terest-rate exposure by entering into interest-rate swap contracts whereby floating interest is received and fixed interest is paid, the hedging relation-ship is classified as a cash-flow hedge. When hedge accounting is applied, the effective portion of the change in value of the hedge instrument is rec-ognized in other comprehensive income. The terms of the interest-rate de-rivatives used for hedging transactions are matched with those of the indi-vidual loans. As of October 31, 2013, the accumulated effect on these cash flow-hedged interest derivatives was recognized in equity in the amount of MSEK –21 (–30).
Fuel derivativesFuel derivatives are used to manage the price risk relating to jet fuel. These derivatives represent hedging transactions according to the cash-flow method and their accounting policies are matched with those of the under-lying forecast jet-fuel requirement. As of October 31, 2013, the accumulat-ed effect on these cash flow-hedged fuel derivatives was recognized in equi-ty in the amount of MSEK 26 (44). The time value is remeasured on an ongoing basis at any changes recognized at fair value in profit and loss.
All together, MSEK –35 (–12) relating to cash-flow hedges was recognized in equity at October 31, 2013, and is expected to affect the statement of income in the following years as follows:
2013/2014 2014/2015 2015/2016 2016/2017 2017/2018 2018/2019> Total
Aircraft - –4 –6 –1 2 1 –8Commercial flows –44 - - - - - –44Interest-rate derivatives - –27 - - - - –27Fuel derivatives 34 - - - - - 34Deferred tax 2 7 1 - - - 10Effect on equity –8 –24 –5 –1 2 1 –35
Note 27, continued
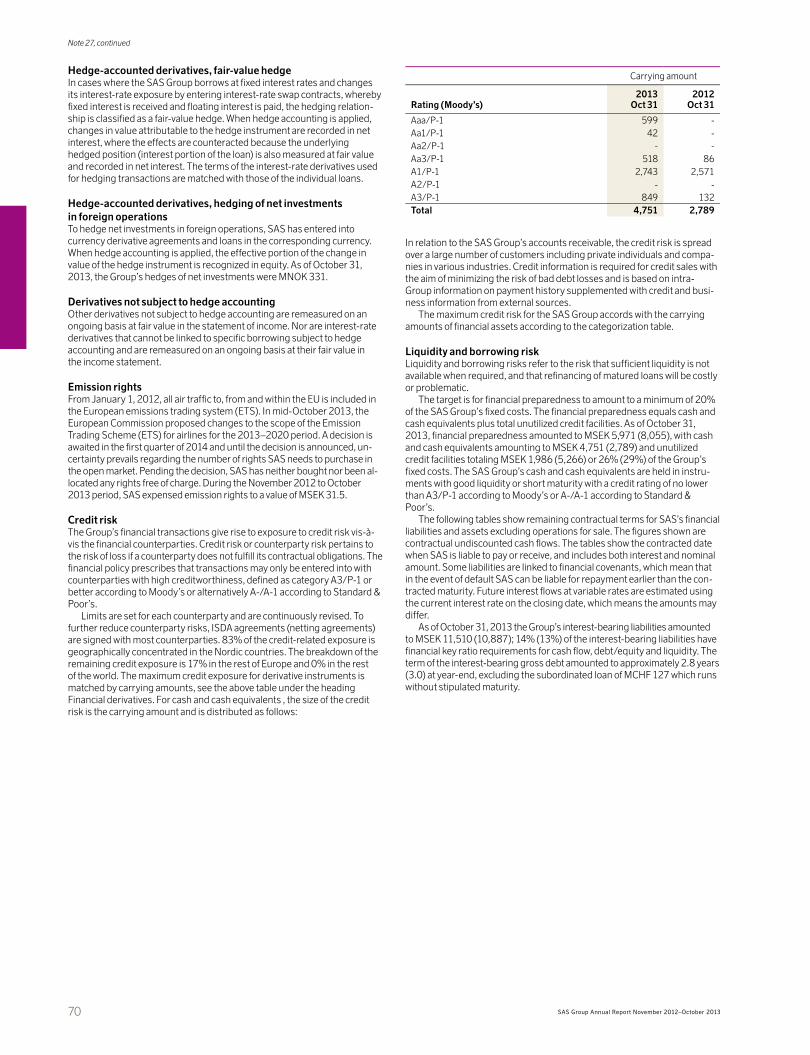
70 SAS Group Annual Report November 2012–October 2013
Hedge-accounted derivatives, fair-value hedgeIn cases where the SAS Group borrows at fixed interest rates and changes its interest-rate exposure by entering interest-rate swap contracts, whereby fixed interest is received and floating interest is paid, the hedging relation-ship is classified as a fair-value hedge. When hedge accounting is applied, changes in value attributable to the hedge instrument are recorded in net interest, where the effects are counteracted because the underlying hedged position (interest portion of the loan) is also measured at fair value and recorded in net interest. The terms of the interest-rate derivatives used for hedging transactions are matched with those of the individual loans.
Hedge-accounted derivatives, hedging of net investments in foreign operationsTo hedge net investments in foreign operations, SAS has entered into currency derivative agreements and loans in the corresponding currency. When hedge accounting is applied, the effective portion of the change in value of the hedge instrument is recognized in equity. As of October 31, 2013, the Group’s hedges of net investments were MNOK 331.
Derivatives not subject to hedge accountingOther derivatives not subject to hedge accounting are remeasured on an ongoing basis at fair value in the statement of income. Nor are interest-rate derivatives that cannot be linked to specific borrowing subject to hedge accounting and are remeasured on an ongoing basis at their fair value in the income statement.
Emission rightsFrom January 1, 2012, all air traffic to, from and within the EU is included in the European emissions trading system (ETS). In mid-October 2013, the European Commission proposed changes to the scope of the Emission Trading Scheme (ETS) for airlines for the 2013–2020 period. A decision is awaited in the first quarter of 2014 and until the decision is announced, un-certainty prevails regarding the number of rights SAS needs to purchase in the open market. Pending the decision, SAS has neither bought nor been al-located any rights free of charge. During the November 2012 to October 2013 period, SAS expensed emission rights to a value of MSEK 31.5.
Credit riskThe Group’s financial transactions give rise to exposure to credit risk vis-à-vis the financial counterparties. Credit risk or counterparty risk pertains to the risk of loss if a counterparty does not fulfill its contractual obligations. The financial policy prescribes that transactions may only be entered into with counterparties with high creditworthiness, defined as category A3/P-1 or better according to Moody’s or alternatively A-/A-1 according to Standard & Poor’s.
Limits are set for each counterparty and are continuously revised. To further reduce counterparty risks, ISDA agreements (netting agreements) are signed with most counterparties. 83% of the credit-related exposure is geographically concentrated in the Nordic countries. The breakdown of the remaining credit exposure is 17% in the rest of Europe and 0% in the rest of the world. The maximum credit exposure for derivative instruments is matched by carrying amounts, see the above table under the heading Financial derivatives. For cash and cash equivalents , the size of the credit risk is the carrying amount and is distributed as follows:
Carrying amount
Rating (Moody’s)2013
Oct 31 2012
Oct 31
Aaa/P-1 599 -Aa1/P-1 42 -Aa2/P-1 - -Aa3/P-1 518 86A1/P-1 2,743 2,571A2/P-1 - -A3/P-1 849 132Total 4,751 2,789
In relation to the SAS Group’s accounts receivable, the credit risk is spread over a large number of customers including private individuals and compa-nies in various industries. Credit information is required for credit sales with the aim of minimizing the risk of bad debt losses and is based on intra-Group information on payment history supplemented with credit and busi-ness information from external sources.
The maximum credit risk for the SAS Group accords with the carrying amounts of financial assets according to the categorization table.
Liquidity and borrowing risk Liquidity and borrowing risks refer to the risk that sufficient liquidity is not available when required, and that refinancing of matured loans will be costly or problematic.
The target is for financial preparedness to amount to a minimum of 20% of the SAS Group’s fixed costs. The financial preparedness equals cash and cash equivalents plus total unutilized credit facilities. As of October 31, 2013, financial preparedness amounted to MSEK 5,971 (8,055), with cash and cash equivalents amounting to MSEK 4,751 (2,789) and unutilized credit facilities totaling MSEK 1,986 (5,266) or 26% (29%) of the Group’s fixed costs. The SAS Group’s cash and cash equivalents are held in instru-ments with good liquidity or short maturity with a credit rating of no lower than A3/P-1 according to Moody’s or A-/A-1 according to Standard & Poor’s.
The following tables show remaining contractual terms for SAS’s financial liabilities and assets excluding operations for sale. The figures shown are contractual undiscounted cash flows. The tables show the contracted date when SAS is liable to pay or receive, and includes both interest and nominal amount. Some liabilities are linked to financial covenants, which mean that in the event of default SAS can be liable for repayment earlier than the con-tracted maturity. Future interest flows at variable rates are estimated using the current interest rate on the closing date, which means the amounts may differ.
As of October 31, 2013 the Group’s interest-bearing liabilities amounted to MSEK 11,510 (10,887); 14% (13%) of the interest-bearing liabilities have financial key ratio requirements for cash flow, debt/equity and liquidity. The term of the interest-bearing gross debt amounted to approximately 2.8 years (3.0) at year-end, excluding the subordinated loan of MCHF 127 which runs without stipulated maturity.
Note 27, continued

71SAS Group Annual Report November 2012–October 2013
Liquidity risk, MSEK
Oct 31, 2013 Up to 3 months 4–12 months 1–5 years Over 5 years
Financial liabilitiesSubordinated loans 22 - 43 907Bond loans 67 2,033 3,191 -Finance leases 53 54 544 -Convertibles 30 90 1,660 -Other loans 299 602 2,168 1,193Other liabilities 3 10 174 -Short-term loans - - - -Fuel derivatives 4 3 - -Currency derivatives 42 102 - -Interest-rate derivatives - –16 27 -Accounts payable 1,689 - - -Total 2,209 2,878 7,807 2,100Currency derivatives, gross1 14,615 1,913 - -
Financial assetsOther long-term receivables 6 17 2,271 -Accounts receivable 1,376 - - -Other receivables 2 872 - -Short-term investments 2,082 - - -Cash and bank 2,673 - - -Fuel derivatives 6 56 - -Currency derivatives 19 47 - -Interest-rate derivatives - - 49 -Total 6,164 992 2,320 0Net 3,955 –1,886 –5,487 –2,100
1) Currency derivatives have, essentially, a corresponding position in cash flow.
Oct 31, 2012 Up to 3 months 4–12 months 1–5 years Over 5 years
Financial liabilitiesSubordinated loans 21 - 65 907Bond loans 76 239 3,029 216Finance leases 72 346 701 -Convertibles 30 150 1,750 -Other loans 190 996 2,237 1,396Other liabilities - - 58 -Short-term loans - - - -Fuel derivatives 131 49 - -Currency derivatives 112 48 - -Interest-rate derivatives –16 - 41 -Accounts payable 1,929 - - -Total 2,545 1,828 7,881 2,519Currency derivatives, gross1 17,068 8,212 - -
Financial assetsOther long-term receivables 1 2 1,179 -Accounts receivable 1,311 - - -Other receivables 2 1,010 - -Short-term investments 366 - - -Cash and bank 2,423 - - -Fuel derivatives 91 237 - -Currency derivatives 60 4 - -Interest-rate derivatives - - 71 -Total 4,254 1,253 1,250 0Net 1,709 –575 –6,631 –2,519
1) Currency derivatives have, essentially, a corresponding position in cash flow.
Note 27, continued

72 SAS Group Annual Report November 2012–October 2013
Contracted credit facilitiesThe Group has entered into various credit facilities in order to provide additional funding if needed. The schedule below provides details of the credit facilities on October 31, 2013:
Facility MaturityTotal
facilityUtilized
facilityUnutilized facility,
October 2013Unutilized facility,
October 2012
Revolving credit facility MSEK 1,800 2015 1,800 - 1,800 -Revolving credit facility MUSD 125 2016 803 631 172 277Revolving credit facility MUSD 59 2017 380 380 - -Credit facility MUSD 114 2020 732 732 - 571Credit facility MUSD 66 2021 426 426 - -Other facilities 2013 14 - 14 13Bilateral bank facilities 2013 - - - 500Bilateral bank facilities 2013 - - - 500Bilateral bank facilities 2013 - - - 250Revolving credit facility MEUR 366 2013 - - - 3,155Total 4,155 2,169 1,986 5,266
In November 2012, the existing MEUR 366 credit facility was renegotiated to an amortized facility of SEK 3.5 billion and the tenor extended until March 31, 2015, which was split into two separate tranches, the utilization of which is governed by separate covenants. In parallel, the SEK 1.25 billion bilateral facilities were terminated. The new facility was amortized in conjunction with the sale of various assets and, at October 31, totaled SEK 1.8 billion. Measurement at fair valueFor fiscal years beginning on or after January 1, 2009 the disclosure re-quirements in IFRS 7 have been extended concerning financial instruments measured at fair value in the balance sheet. The standard requires disclo-sure of methods used to determine fair value according to a fair value hierar-chy consisting of three levels. The levels reflect the extent to which fair value is based on observable market data or own assumptions. Below is a descrip-tion of the different levels for determining fair value.
Level 1Level 1 comprises financial instruments for which fair value is based on quoted (unadjusted) prices in active markets for identical assets or liabili-ties. A market is considered active if quoted prices from an exchange, bro-ker, industry group, pricing service or supervisory body are readily and reg-ularly available and those prices represent actual and regularly occurring market transactions at arm’s length.
This category includes mainly treasury bills and standardized derivatives where the quoted price is used in the valuation. Cash and bank balances are also categorized as level 1.
Level 2Level 2 comprises financial instruments for which fair value is based on models that utilize observable data for the asset or liability other than the quoted prices included within level 1, either directly (i.e. as prices) or indi-rectly (i.e. derived from prices).
Examples of observable data in level 2 is data that can serve as a basis for assessing prices, such as market interest rates and yield curves.
This category includes mainly certificates and non-standard derivative instruments (interest-rate, currency and fuel swaps as well as currency and fuel options) not traded in an active market and the fair value is determined using valuation techniques based essentially on observable market data.
Level 3Level 3 comprises financial instruments for which fair value is based on val-uation models, whereby significant input is based on unobservable market data.
The SAS Group currently has no financial assets and liabilities where the valuation is essentially based on unobservable data.
Determination of fair value – valuation techniquesOther securities holdingsThe balance sheet item “Other securities holdings ” MSEK 292 (23) is made up of shareholdings that are not affiliated companies or subsidiaries.
The entire balance-sheet item is measured at cost because its fair value cannot be reliably measured at justifiable expense. For this reason, the balance-sheet item “Other securities holdings” is not included in the adja-cent table “Financial assets and liabilities measured at fair value”.
Interest-rate derivativesInterest-rate swaps: The fair value of interest-rate swaps is determined by discounting estimated future cash flows. Discounting takes place on the basis of yield curves based in turn on market rates prevailing at the closing date.
Futures: Standardized futures contracts with daily settlement. Fair value is thus determined by daily “market to market” valuation.
Forward Rate Agreement, FRA: The fair value of OTC FRAs is determined by discounting estimated future cash flows. Discounting takes place on the basis of yield curves based in turn on market rates prevailing at the closing date. Standardized FRAs with cash settlement are measured at fair value using quoted bid and ask rates at year-end for an FRA with a corresponding term to maturity.
Currency derivativesCurrency swaps: The fair value of currency swaps is determined by discount-ing estimated future cash flows in each currency and interest rate. Discount-ing is based on yield curves on the closing date. Translation of the currency component is based on exchange rates prevailing at the closing date.
Currency options: The fair value of options is determined by application of the Black and Scholes valuation model, a recognized and accepted valuation model in financial markets. The model is based primarily on observable data such as spot price, exercise price, term to maturity, interest rate, volatility, etc.
Fuel derivativesFuel options: The fair value of fuel options is determined by application of the Black and Scholes valuation model. The model is based primarily on observ-able data such as the fuel swap curve, exercise price, term to maturity, inter-est rate, volatility, etc.
Fuel swaps: The fair value of fuel swaps is determined according to the fuel swap curve at the closing date.
Short-term investmentsShort-term investments classified as held for trading comprise treasury bills, mortgage bonds and commercial paper with a maximum remaining term to maturity of three months. Fair value is determined by discounting on the basis of yield curves on the closing date.
Cash and bank balancesCash and bank balances comprise cash on hand and demand deposits at banks and corresponding financial institutions. Carrying amounts corre-spond to fair value.
Note 27, continued

73SAS Group Annual Report November 2012–October 2013
Financial assets and liabilities measured at fair value
2013 Oct 31
2012 Oct 31
Level 1 Level 2 Level 3 Level 1 Level 2 Level 3
ASSETSOther long-term receivables
– Interest-rate derivatives - 49 - - 71 -Other receivables
– Fuel derivatives - 62 - - 329 -– Currency derivatives - 66 - - 64 -– Interest-rate derivatives - - - - - -
Short-term investments 599 352 - - - -Cash and bank balances 2,671 - - 2,423 - -Total 3,270 529 0 2,423 464 0LIABILITIESOther loans
– Interest-rate derivatives - 27 - - –41 -Short-term loans
– Fuel derivatives - 7 - - –180 -– Currency derivatives - 144 - - –160 -– Interest-rate derivatives - –16 - - 16 -
Total 0 162 0 0 –365 0
Categorization of financial assets and liabilities
Held for trading
Loans and receivables
Financial assets avail-able for sale
Other liabilities
Hedging instruments,
derivates
Non- financial
items
Total carrying amount
Total fair value1
Oct 31, 2013 Fair value Amortized cost Fair value Amortized cost Fair value
ASSETSOther holdings of securities - - 292 - - - 292 292Other long-term receivables - 1,868 - - - 332 2,200 2,200
– Interest-rate derivatives - - - - 49 - 49 49Accounts receivable - 1,376 - - - - 1,376 1,376Receivables from affiliated companies - - - - - - 0 0Other receivables - 147 - - - 591 738 738
– Fuel derivatives - - - - 62 - 62 62– Currency derivatives 40 - - - 26 - 66 66– Interest-rate derivatives - - - - - - 0 0
Short-term investments 951 1,129 - - - - 2,080 2,080Cash and bank balances 2,671 - - - - - 2,671 2,671Total 3,662 4,520 292 0 137 923 9,534 9,534LIABILITIESSubordinated loans - - - 956 - - 956 340Bond loans - - - 2,641 - - 2,641 2,641Other loans - - - 5,027 - - 5,027 5,275
– Interest-rate derivatives - - - - 27 - 27 27Other liabilities - - - 109 - 52 161 161Current portion of long-term loans - - - 2,517 - - 2,517 2,644Short-term loans - - - 96 - - 96 96
– Fuel derivatives - - - - 7 - 7 7– Currency derivatives 21 - - - 123 - 144 144– Interest-rate derivatives - - - - –16 - –16 –16
Accounts payable - - - 1,689 - - 1,689 1,689Total 21 0 0 13,035 141 52 13,249 13,008
1) Fair value of short-term investments and subordinated loans has been set entirely by the use of official price quotes. Fair value of other financial assets and liabilities has been set in part by the use of official price quotes, such as discounting of future cash flows at quoted interest rates.
Note 27, continued

74 SAS Group Annual Report November 2012–October 2013
Categorization of financial assets and liabilities
Held for trading
Loans and receivables
Financial assets avail-able for sale
Other liabilities
Hedging instruments,
derivates
Non- financial
items
Total carrying amount
Total fair value1
Oct 31, 2012 Fair value Amortized cost Fair value Amortized cost Fair value
ASSETSOther holdings of securities - - 23 - - - 23 23Other long-term receivables - 878 - - - 301 1,179 1,179
– Interest-rate derivatives - - - - 71 - 71 71Accounts receivable - 1,311 - - - - 1,311 1,311Receivables from affiliated companies - - - - - - 0 0Other receivables - 207 - - - 799 1,006 1,006
– Fuel derivatives - - - - 329 - 329 329– Currency derivatives 45 - - - 19 - 64 64– Interest-rate derivatives - - - - - - 0 0
Short-term investments - 366 - - - - 366 366Cash and bank balances 2,423 - - - - - 2,423 2,423Total 2,468 2,762 23 0 419 1,100 6,772 6,772LIABILITIESSubordinated loans - - - 978 - - 978 231Bond loans - - - 2,763 - - 2,763 2,763Other loans - - - 5,219 - - 5,219 5,621
– Interest-rate derivatives - - - - 41 - 41 41Other liabilities - - - 72 - 58 130 130Current portion of long-term loans - - - 1,403 - - 1,403 1,505Short-term loans - - - 87 - - 87 87
– Fuel derivatives - - - - 180 - 180 180– Currency derivatives 125 - - - 35 - 160 160– Interest-rate derivatives - - - - –16 - –16 –16
Accounts payable - - - 1,929 - - 1,929 1,929Total 125 0 0 12,451 240 58 12,874 12,631
1) Fair value of short-term investments and subordinated loans has been set entirely by the use of official price quotes. Fair value of other financial assets and liabilities has been set in part by the use of official price quotes, such as discounting of future cash flows at quoted interest rates.
Note 28 Other provisions
Restructuring Loyalty program Other provisions Total
2013 Oct 31
2012 Oct 31
2013 Oct 31
2012 Oct 31
2013 Oct 31
2012 Oct 31
2013 Oct 31
2012 Oct 31
Opening balance 1,631 636 1,412 1,347 110 118 3,153 2,101New provisions 40 1,313 644 448 - 30 684 1,791Utilized provisions –513 –315 –820 –383 –41 –38 –1,374 –736Released provisions –186 - - - - - –186 -Divested companies1 - - - - –54 - –54 -Reclassification 5 - - - –5 - - -Currency effect 0 –3 - - –7 0 –7 –3Closing balance 977 1,631 1,236 1,412 3 110 2,216 3,153
Breakdown in balance sheet:2013
Oct 312012
Oct 312013
Oct 312012
Oct 312013
Oct 312012
Oct 312013
Oct 312012
Oct 31
Long-term liabilities 123 461 1,236 1,412 2 94 1,361 1,967Current liabilities 854 1,170 - - 1 16 855 1,186
977 1,631 1,236 1,412 3 110 2,216 3,153
1) During the year, 80% of the shareholding in Widerøe’s Flyveselskap AS was divested.
RestructuringSAS presented the 4Excellence Next Generation restructuring program in conjunction with the interim report for the third quarter 2012. The program means radical changes and simplification of operations, which will realize a substantial reduction in unit cost. The provision for the 2012 fiscal year comprised, primarily, costs directly attributable to the restructuring program.
In addition to restructuring provisions for personnel, the reserve also comprises provisions for leasing costs relating to unutilized premises. In conjunction with a decision to centralize administration, MSEK 186 of the reserve for leasing costs for unutilized premises was released in July 2013.
Loyalty programThrough membership in the Group’s loyalty program, EuroBonus, custom-ers can earn bonus points through flying with SAS and/or other Star Alli-
ance companies as well as when they make purchases from other business partners, such as car rental and credit card companies.
Under IFRIC 13, the allocation of loyalty points must be shown as a sepa-rate transaction when purchasing airline tickets. The portion of the purchase price that is allocated to loyalty points is valued at fair value and recognized as an income first in the period in which the obligation is met.
The amount for utilized provisions includes revaluation of the EuroBonus points liability. During recent years, previous estimates of fair value per point category have been adjusted downwards driven by continued price reductions, changes in EuroBonus rules and withdrawal patterns.
Other provisionsOther provisions mainly include maintenance costs for leased aircraft pur-suant to the lease agreements.
Note 27, continued

75SAS Group Annual Report November 2012–October 2013
Note 29 Short-term loans
2013 Oct 31
2012 Oct 31
Accrued interest 88 86Derivatives 135 324Other 8 1Total 231 411
Note 30 Unearned transportation revenue
Unearned transportation revenue liability consists of tickets sold and still valid but unused, see Note 1, Significant accounting policies, page 54 – revenue recognition.
On the closing date, the estimated reserve in the unearned transporta-tion revenue liability amounted to MSEK 91 (188).
Note 31 Accrued expenses and prepaid income
2013 Oct 31
2012 Oct 31
Vacation pay liability 1,248 1,413Other accrued payroll expenses 121 236Selling costs 399 415Fuel costs 162 230Government user fees 284 379Handling costs 277 210Other accrued expenses 690 194Prepaid income 235 124Total 3,416 3,201
Note 32 Pledged assets
2013 Oct 31
2012 Oct 31
Related to liabilities:
Real estate mortgages - 19Aircraft mortgages 6,395 4,151Shares in subsidiaries 0 0Related to deposits:Deposits and blocked bank funds 2,014 986Total 8,409 5,156
Outstanding liability at October 31, 2013, relating to aircraft mortgages was MSEK 3,516 (2,816).
The item Shares in subsidiaries includes the carrying amount of SAS shares in SAS’s wholly owned financing structures for aircraft. For additional information in this regard, please refer to Note 12.
2013 Oct 31
2012 Oct 31
Related to credit facility:Real estate mortgages 12 67Aircraft mortgages 101 807Mortgages for spare parts - 745Company mortgages - 816Other mortgages 324 116Blocked bank funds 600 40Total 1,037 2,591
Total collateral pledged was MSEK 9,446 (7,747) at the closing date.
Note 33 Contingent liabilities
2013 Oct 31
2012 Oct 31
Guarantees related toEmission rights - 68Other - 6Total - 74
The Group is involved in various claims and legal proceedings arising in the ordinary course of business. These claims relate to, but are not limited to, its business practices, employment matters, and tax matters. Adequate provi-sions have been recognized for such matters in accordance with probable and quantifiable loss risks. On the basis of information currently available, those issues not requiring any provisions will not have a material adverse effect on the Group’s earnings. However, litigation is inherently unpredict-able and, even though the provisions were assessed as adequate and/or that the Group has valid defenses in these matters, unfavorable results could occur. This could have a material adverse effect on the Group’s earn-ings in future accounting periods. For more information, see the Report by the Board of Directors on page 42.
Note 34 Leasing commitments
The SAS Group has entered into the following leasing commitments, with specification of the total annual rent for:
2013/2014 2014/2015 2015/2016 2016/2017 2017/2018 2018/2019>
Aircraft 2,227 2,210 1,845 1,391 1,055 1,678Properties 865 857 801 765 757 1,568Machinery and equipment 138 149 146 143 138 71Total 3,230 3,216 2,792 2,299 1,950 3,317

76 SAS Group Annual Report November 2012–October 2013
Leases with an annual rental cost in excess of MSEK 0.5 are included. Total lease costs in the 2012/2013 fiscal year amounted to MSEK 3,296 (2,148), of which MSEK –20 pertains to contingent rent. Contingent rents vary ac-cording to different factors such as revenue, the consumer price index and short-term market interest rates. In the 2012/2013 fiscal year, payments received for assets subleased to a third party amounted to MSEK 266. The value of future fixed payments for these assets subleased to third parties amounted to MSEK 676.
At the end of the 2012/2013 fiscal year, the SAS Group aircraft fleet to-taled 156 aircraft, of which 100 were leased.
SAS has an option to purchase nine of the properties being leased in Denmark and Norway. The rent on these properties amounts to MSEK 171 for the 2013/2014 fiscal year.
Note 35 Adjustment for other items not included in the cash flow, etc.
2012–2013 Nov–Oct
2012 Jan–Oct
Share of income in affiliated companies –25 –32Dividends from affiliated companies 5 12Capitalized interest on prepayments to aircraft manufacturers –7 –5Earnings impact from measuring financial instruments according to IAS 39 –125 69Provisions - 1,221Release of provisions –186 -Adjustment of pension agreements –450 -Other 16 27Total –772 1,292
Note 36 Acquisition of subsidiaries
In the fiscal year 2012/2013, no subsidiaries were acquired. In 2012, subsidiaries owning three airport properties were acquired
from Airside Properties AB. These properties were then sold to Swedavia.According to the acquisition analyses performed, the value of the assets
and liabilities acquired was as follows:
2012–2013 Nov–Oct
2012 Jan–Oct
Fixed assets - 1,279Current assets - -Cash and cash equivalents - -Long-term liabilities - -Current liabilities - -Total - 1,279Option payments and early redemption of options - 43Purchase price paid and impact on the Group’s cash and cash equivalents - 1,322
Note 37 Disposals of subsidiaries
In the 2012/2013 fiscal year, 80% of the shares in Widerøe’s Flyveselskap AS and 9.98% of the shares in SAS Ground Handling Denmark, SAS Ground Handling Norway and SAS Ground Handling Sweden were sold.
In 2012, subsidiaries containing six airport properties were sold to Swedavia.
The value of the sold assets and liabilities was as follows:
2012–2013 Nov–Oct
2012 Jan–Oct
Intangible assets 142 -Tangible fixed assets 2,012 1,427Financial fixed assets 367 -Current assets 142 -Current receivables 446 -Cash and cash equivalents 109 -Non-controlling interests 16 -Long-term liabilities –772 -Current liabilities –1,763 -Total 699 1,427Capital loss/gain excluding selling costs –352 348Purchase price 347 1,775Unpaid purchase price –14 -Selling costs –17 –14Cash and cash equivalents in divested companies –109 -Payment pertaining to divestment in 2012 60 -Impact on the Group’s cash and cash equivalents 267 1,761
Note 38 Cash and cash equivalents
2013 Oct 31
2012 Oct 31
Short-term investments 2,080 366Cash and bank balances 2,671 2,423Cash and cash equivalents at year-end 4,751 2,789
Disclosure of interest paid:During the year, interest received amounted to MSEK 48 (115), of which MSEK 21 (57) pertains to forward premiums for currency derivatives. Dur-ing the year, interest paid amounted to MSEK 729 (843), of which MSEK 131 (246) refers to forward premiums for currency derivatives.
Note 39 Auditor’s fees
The following remuneration to auditing firms for auditing services, was charged to income.
2012–2013 Nov–Oct
2012 Jan–Oct
Auditing services Deloitte 7 11 PwC 3 -Audit activities other than audit assignment Deloitte 1 6 PwC 1 -Tax consultancy services - -Other services Deloitte 4 4 PwC 5 -Total 21 21Other auditing firmsAuditing services - -Total 21 21
Note 34, continued

77SAS Group Annual Report November 2012–October 2013
Note 40 Transactions with affiliated companies
Revenue from sales to affiliated companies amounted to MSEK 22 (17). Cost of purchases from affiliated companies was MSEK 33 (24).
Note 41 Segment reporting
The Group’s operations are managed and reported as two business seg-ments: Scandinavian Airlines and Widerøe. Scandinavian Airlines includes operations in the consortium of Scandinavian Airlines System, SAS Cargo and Blue1. Widerøe is an independent airline based in Norway and is includ-
ed in the Group’s statement of income until September, 2013, when 80% of the company was divested. From this moment forward, the Group compris-es only one segment. Other operations include the Parent Company SAS AB (Group functions) and other non-reportable segments.
Reconciliation
Scandinavian Airlines Widerøe Other Eliminations SAS Group
2012–2013
Nov–Oct2012
Jan–Oct
2012–2013
Nov–Oct2012
Jan–Oct
2012–2013
Nov–Oct2012
Jan–Oct
2012–2013
Nov–Oct2012
Jan–Oct
2012–2013
Nov–Oct2012
Jan–Oct
External revenue 38,493 32,753 3,688 3,231 1 2 0 0 42,182 35,986Sales between segments 406 395 15 42 0 6 –421 –443 0 0Revenue 38,899 33,148 3,703 3,273 1 8 –421 –443 42,182 35,986Payroll expenses –10,011 –10,262 –1,357 –1,234 –83 –88 0 0 –11,451 –11,584Other operating expenses –23,821 –20,747 –1,850 –1,593 –119 –119 348 354 –25,442 –22,105Leasing costs for aircraft –1,744 –1,311 –115 –120 0 0 73 89 –1,785 –1,342Depreciation, amortization and impairment –1,491 –1,296 –167 –129 0 –1 0 0 –1,58 –1,426Share of income in affiliated companies 2 4 - 0 23 28 0 0 25 32Capital gains/losses –120 –257 - 10 –369 400 0 0 –489 153Operating income 1,714 –721 214 207 –547 228 0 0 1,381 –286Reconciliation with net income for the period:Income from other security holdings 1 0Net financial items –949 –959Tax –254 260Net income for the year 179 –985
Geographical breakdown
Domestic Intra-Scandinavian Europe Intercontinental Total
2012–2013
Nov–Oct2012
Jan–Oct
2012–2013
Nov–Oct2012
Jan–Oct
2012–2013
Nov–Oct2012
Jan–Oct
2012–2013
Nov–Oct2012
Jan–Oct
2012–2013
Nov–Oct2012
Jan–Oct
Passenger revenue 10,864 8,917 3,384 2,928 11,449 10,089 6,042 5,064 31,379 26,998Freight and mail revenue 106 82 16 18 127 69 1,040 961 1,289 1,130Charter revenue 25 35 0 5 2,041 1,686 0 0 2,066 1,726Other traffic revenue 770 646 248 241 857 687 478 380 2,353 1,954Total traffic revenue 11,765 9,680 3,648 3,192 14,474 12,531 7,560 6,405 37,447 31,808
Denmark Norway Sweden Europe Other Total
2012–2013
Nov–Oct2012
Jan–Oct
2012–2013
Nov–Oct2012
Jan–Oct
2012–2013
Nov–Oct2012
Jan–Oct
2012–2013
Nov–Oct2012
Jan–Oct
2012–2013
Nov–Oct2012
Jan–Oct
2012–2013
Nov–Oct2012
Jan–Oct
Other operating revenue 628 676 1,941 1,816 731 832 288 571 1,147 283 4,735 4,178
OTHER DISCLOSURES
Denmark Norway Sweden Europe Other Not broken down Total
2012–2013 Nov–
Oct
2012 Jan–
Oct
2012–2013 Nov–
Oct
2012 Jan–
Oct
2012–2013 Nov–
Oct
2012 Jan–
Oct
2012–2013 Nov–
Oct
2012 Jan–
Oct
2012–2013 Nov–
Oct
2012 Jan–
Oct
2012–2013 Nov–
Oct
2012 Jan–
Oct
2012–2013 Nov–
Oct
2012 Jan–
Oct
Assets1 927 1,067 610 1,596 5,656 4,138 552 647 104 167 7,778 11,956 15,627 19,571Investments for the year 82 58 385 56 575 608 37 22 0 4 798 525 1,877 1,273
1) Aircraft and spare parts are not broken down, see Note 1, Significant accounting policies – Segment reporting, page 52.
In 2012/2013 and 2012, there was no single customer who accounted for more than 10% of Group revenue.

78 SAS Group Annual Report November 2012–October 2013
Note 42 Subsidiaries in the SAS Group
Domicile
Corporate registration
numberTotal owned
shares Holding
Carrying amount at
October 31, 2013
Share of equity at
October 31, 2013
Carrying amount at
October 31, 2012
Owned by SAS AB:SAS Sverige AB Sigtuna 556042-5414 70,500,000 100 737 1,426 737SAS Norge AS Bærum 811176702 47,000,000 100 628 539 628SAS Danmark A/S Copenhagen 56994912 47,000,000 100 571 1,308 571Widerøe’s Flyveselskap AS Bodø 917330557 364,196 100 - - 1,440SAS Individual Holding AB Stockholm 556063-8255 610,000 100 756 741 756SAS Tech AB Stockholm 556137-6764 940,000 100 1,150 2,263 1,150Linjeflyg AB Sigtuna 556062-8454 2,000,000 100 237 245 237OY Nordair Ab Vantaa 525.232 150 100 71 -124 71SAS Cargo Group A/S Tårnby 25736443 200,500 100 - -281 -SAS Ground Handling Denmark A/S Tårnby 32339026 49,501 90 33 37 -SAS Ground Handling Norway AS Oslo 912056228 4,502 90 46 51 -SAS Ground Handling Sweden AB Stockholm 556934-7924 400,100 90 58 60 -Other 0
4,287 6,265 5,590Owned by SAS Danmark A/S, SAS Norge AS and SAS Sverige AB:SAS Consortium Stockholm 902001-7720 - 100 4,109 4,109 4,345
Owned by SAS Consortium:SAS Scandinavian Airlines Norge AS Bærum 962308449 150,000 100 380 382 951SAS Scandinavian Airlines Sverige AB Sigtuna 556235-5908 710,000 100 810 824 810Linjeflyg Leasing HB Sigtuna 916644-1080 - 79 - - 391Cherrydean Ltd Dublin 310983 12,633,198 100 53 48 53SAS Capital B.V. Rotterdam 167071 501 100 8 73 8SAS Ground Services Sweden AB Stockholm 556657-7374 101,000 100 222 226 300SAS Ground Services Norway AS Oslo 986978364 12,100 100 260 267 552URIS Ltd Dublin 316438 1,620,000 100 4 4 3Other 0 20 2
1,737 1,844 3,070Owned by SAS Individual Holdings AB:RASN A/S Copenhagen 24202941 500 100 1 0 1Spirit Air Cargo Handling Group AB Stockholm 556690-7076 11,000 100 63 74 63
64 74 64Owned by Uris Ltd:Commercial Aviation Leasing Limited Dublin 30 8550 1,612,747 6 5 5 5
Owned by Cherrydean Limited:Commercial Aviation Leasing Limited Dublin 30 8550 25,266,373 94 75 75 78
Note 43 Significant events after the closing date
In November, the SAS Group’s balance sheet and statement of income will be affected, as follows, by the implementation of new pension terms, the re-versal of deferred tax liabilities related to pensions, the accounting for spe-cial payroll tax as part of the Alecta and Euroben plans, and the implementa-tion of the revised IAS 19. The above negatively impacted the Group’s shareholders’ equity in an amount of about SEK 7 billion:– Pension commitments will be reduced by about SEK 12.9 billion– Plan assets will be reduced by about SEK 10.7 billion– Actuarial gains and losses will be impaired by about SEK 10.3 billion– Deferred tax liabilities will be reduced by about SEK 1.2 billion– Improvement in the statement of income (payroll expenses) of SEK 1 billion
The Board has proposed the following measures to the 2014 AGM to meet the SAS Group’s funding needs:– Amendment of the Articles of Association to allow the issue of preference
shares– Authorization to decide on a new issue of a maximum of 7 million prefer-
ence shares– Authorization to issue convertible bonds in a maximum amount of SEK 2
billion with entitlement to a maximum of 130 million common shares on conversion.
A complete description of the Board’s proposals is available in the notice of the AGM: www.sasgroup.net under Investor Relations.
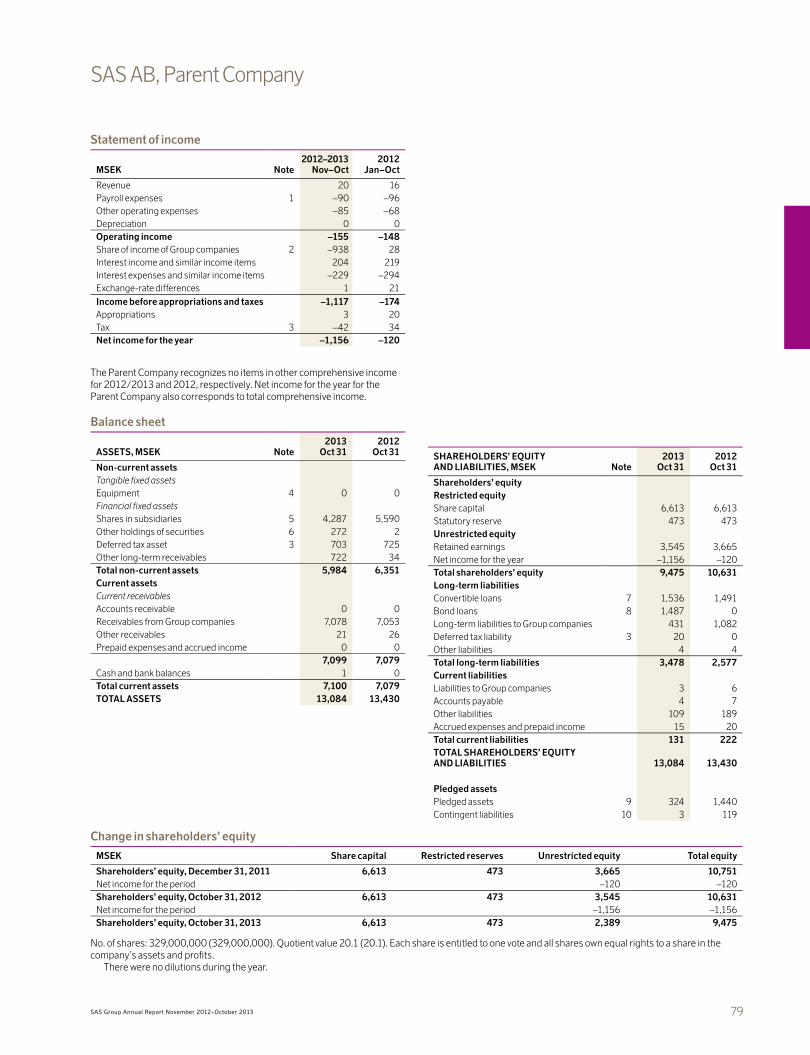
79SAS Group Annual Report November 2012–October 2013
SAS AB, Parent Company
Statement of income
MSEK Note2012–2013
Nov–Oct2012
Jan–Oct
Revenue 20 16Payroll expenses 1 –90 –96Other operating expenses –85 –68Depreciation 0 0Operating income –155 –148Share of income of Group companies 2 –938 28Interest income and similar income items 204 219Interest expenses and similar income items –229 –294Exchange-rate differences 1 21Income before appropriations and taxes –1,117 –174 Appropriations 3 20Tax 3 –42 34Net income for the year –1,156 –120
The Parent Company recognizes no items in other comprehensive income for 2012/2013 and 2012, respectively. Net income for the year for the Parent Company also corresponds to total comprehensive income.
Balance sheet
ASSETS, MSEK Note2013
Oct 312012
Oct 31
Non-current assetsTangible fixed assetsEquipment 4 0 0Financial fixed assetsShares in subsidiaries 5 4,287 5,590Other holdings of securities 6 272 2Deferred tax asset 3 703 725Other long-term receivables 722 34Total non-current assets 5,984 6,351Current assetsCurrent receivablesAccounts receivable 0 0Receivables from Group companies 7,078 7,053Other receivables 21 26Prepaid expenses and accrued income 0 0
7,099 7,079Cash and bank balances 1 0Total current assets 7,100 7,079TOTAL ASSETS 13,084 13,430
SHAREHOLDERS’ EQUITY AND LIABILITIES, MSEK Note
2013Oct 31
2012Oct 31
Shareholders’ equityRestricted equityShare capital 6,613 6,613Statutory reserve 473 473Unrestricted equityRetained earnings 3,545 3,665Net income for the year –1,156 –120Total shareholders’ equity 9,475 10,631Long-term liabilitiesConvertible loans 7 1,536 1,491Bond loans 8 1,487 0Long-term liabilities to Group companies 431 1,082Deferred tax liability 3 20 0Other liabilities 4 4Total long-term liabilities 3,478 2,577Current liabilitiesLiabilities to Group companies 3 6Accounts payable 4 7Other liabilities 109 189Accrued expenses and prepaid income 15 20Total current liabilities 131 222TOTAL SHAREHOLDERS’ EQUITY AND LIABILITIES 13,084 13,430
Pledged assetsPledged assets 9 324 1,440Contingent liabilities 10 3 119
Change in shareholders’ equity
MSEK Share capital Restricted reserves Unrestricted equity Total equity
Shareholders’ equity, December 31, 2011 6,613 473 3,665 10,751Net income for the period –120 –120Shareholders’ equity, October 31, 2012 6,613 473 3,545 10,631Net income for the period –1,156 –1,156Shareholders’ equity, October 31, 2013 6,613 473 2,389 9,475
No. of shares: 329,000,000 (329,000,000). Quotient value 20.1 (20.1). Each share is entitled to one vote and all shares own equal rights to a share in the company’s assets and profits.
There were no dilutions during the year.
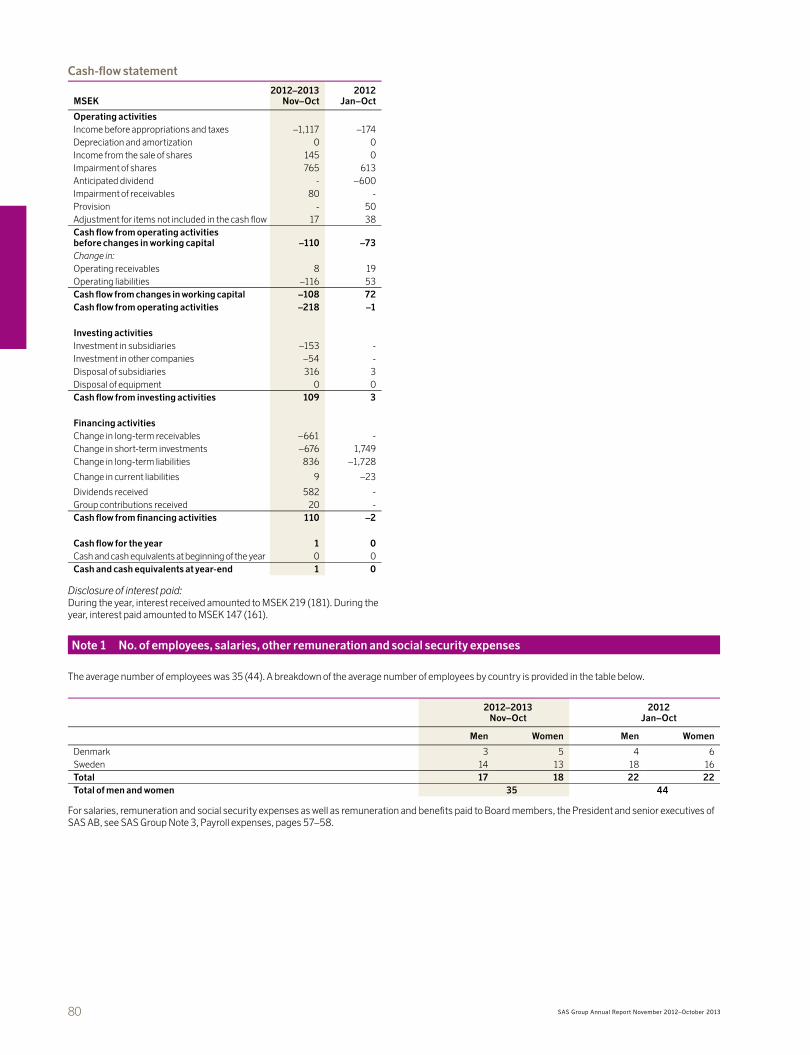
80 SAS Group Annual Report November 2012–October 2013
Cash-flow statement
MSEK2012–2013
Nov–Oct2012
Jan–Oct
Operating activitiesIncome before appropriations and taxes –1,117 –174Depreciation and amortization 0 0Income from the sale of shares 145 0Impairment of shares 765 613Anticipated dividend - –600Impairment of receivables 80 -Provision - 50Adjustment for items not included in the cash flow 17 38Cash flow from operating activitiesbefore changes in working capital –110 –73Change in:Operating receivables 8 19Operating liabilities –116 53Cash flow from changes in working capital –108 72Cash flow from operating activities –218 –1
Investing activitiesInvestment in subsidiaries –153 -Investment in other companies –54 -Disposal of subsidiaries 316 3Disposal of equipment 0 0Cash flow from investing activities 109 3
Financing activitiesChange in long-term receivables –661 -Change in short-term investments –676 1,749Change in long-term liabilities 836 –1,728
Change in current liabilities 9 –23
Dividends received 582 -Group contributions received 20 -Cash flow from financing activities 110 –2
Cash flow for the year 1 0Cash and cash equivalents at beginning of the year 0 0Cash and cash equivalents at year-end 1 0
Disclosure of interest paid:During the year, interest received amounted to MSEK 219 (181). During the year, interest paid amounted to MSEK 147 (161).
Note 1 No. of employees, salaries, other remuneration and social security expenses
The average number of employees was 35 (44). A breakdown of the average number of employees by country is provided in the table below.
2012–2013 Nov–Oct
2012 Jan–Oct
Men Women Men Women
Denmark 3 5 4 6Sweden 14 13 18 16Total 17 18 22 22Total of men and women 35 44
For salaries, remuneration and social security expenses as well as remuneration and benefits paid to Board members, the President and senior executives of SAS AB, see SAS Group Note 3, Payroll expenses, pages 57–58.
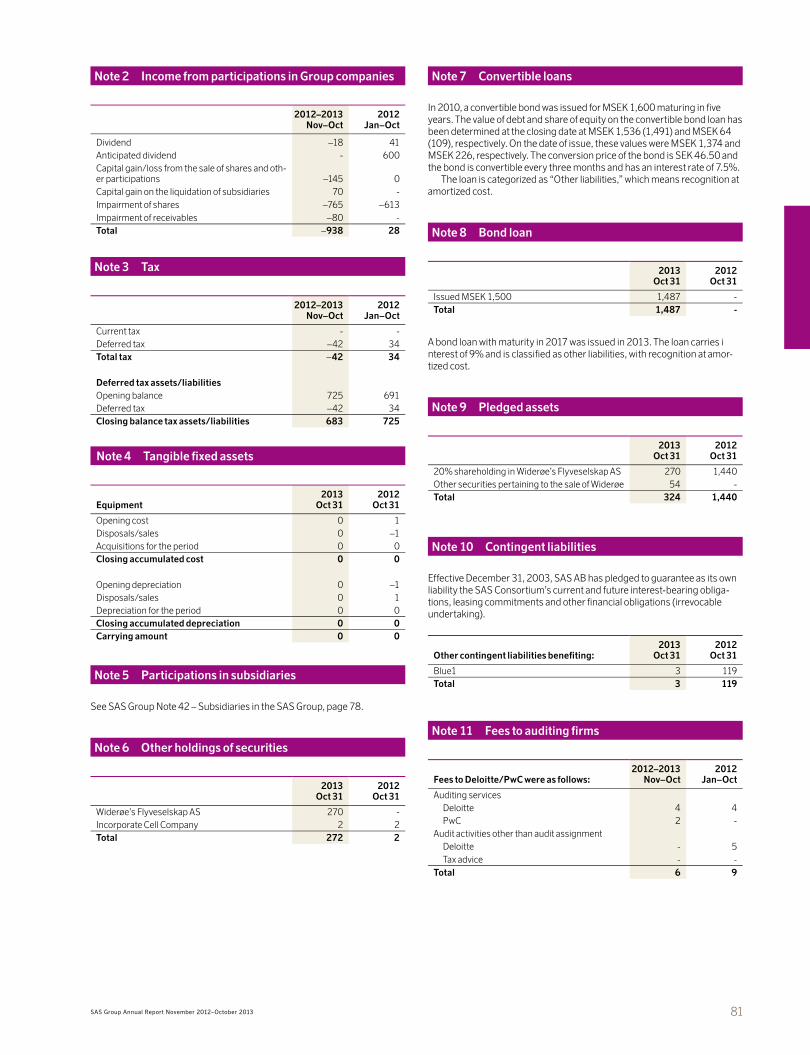
81SAS Group Annual Report November 2012–October 2013
Note 2 Income from participations in Group companies
2012–2013Nov–Oct
2012 Jan–Oct
Dividend –18 41Anticipated dividend - 600Capital gain/loss from the sale of shares and oth-er participations –145 0Capital gain on the liquidation of subsidiaries 70 -Impairment of shares –765 –613Impairment of receivables –80 -Total –938 28
Note 3 Tax
2012–2013Nov–Oct
2012 Jan–Oct
Current tax - -Deferred tax –42 34Total tax –42 34
Deferred tax assets/liabilitiesOpening balance 725 691Deferred tax –42 34Closing balance tax assets/liabilities 683 725
Note 4 Tangible fixed assets
Equipment2013
Oct 312012
Oct 31
Opening cost 0 1Disposals/sales 0 –1Acquisitions for the period 0 0Closing accumulated cost 0 0
Opening depreciation 0 –1Disposals/sales 0 1Depreciation for the period 0 0Closing accumulated depreciation 0 0Carrying amount 0 0
Note 5 Participations in subsidiaries
See SAS Group Note 42 – Subsidiaries in the SAS Group, page 78.
Note 6 Other holdings of securities
2013 Oct 31
2012 Oct 31
Widerøe’s Flyveselskap AS 270 -Incorporate Cell Company 2 2Total 272 2
Note 7 Convertible loans
In 2010, a convertible bond was issued for MSEK 1,600 maturing in five years. The value of debt and share of equity on the convertible bond loan has been determined at the closing date at MSEK 1,536 (1,491) and MSEK 64 (109), respectively. On the date of issue, these values were MSEK 1,374 and MSEK 226, respectively. The conversion price of the bond is SEK 46.50 and the bond is convertible every three months and has an interest rate of 7.5%.
The loan is categorized as “Other liabilities,” which means recognition at amortized cost.
Note 8 Bond loan
2013 Oct 31
2012 Oct 31
Issued MSEK 1,500 1,487 -Total 1,487 -
A bond loan with maturity in 2017 was issued in 2013. The loan carries i nterest of 9% and is classified as other liabilities, with recognition at amor-tized cost.
Note 9 Pledged assets
2013 Oct 31
2012 Oct 31
20% shareholding in Widerøe’s Flyveselskap AS 270 1,440Other securities pertaining to the sale of Widerøe 54 -Total 324 1,440
Note 10 Contingent liabilities
Effective December 31, 2003, SAS AB has pledged to guarantee as its own liability the SAS Consortium’s current and future interest-bearing obliga-tions, leasing commitments and other financial obligations (irrevocable undertaking).
Other contingent liabilities benefiting:2013
Oct 312012
Oct 31
Blue1 3 119Total 3 119
Note 11 Fees to auditing firms
Fees to Deloitte/PwC were as follows:2012–2013
Nov–Oct2012
Jan–Oct
Auditing services Deloitte 4 4 PwC 2 -Audit activities other than audit assignment Deloitte - 5 Tax advice - -Total 6 9

82 SAS Group Annual Report November 2012–October 2013
Corporate governance
Corporate Governance ReportSAS AB is the Parent Company for operations at SAS and a Swedish public limited company headquartered in Stockholm, Sweden. Since July 2001, SAS AB has been listed on the NASDAQ OMX Stockholm with secondary listings in Copenhagen and Oslo. The objective of corporate governance is to provide SAS with effective management and control of its operations in com-bination with adequate transparency, clarity and proper business ethics.
This report constitutes the SAS Group’s corporate governance report for the 2012/2013 fiscal year and has been prepared pursuant to the Swedish Annual Accounts Act and the provisions of the the Swedish Corporate Gov-ernance Code (the Code) based on the revision of the Code issued in Febru-ary 2010.
Departure from the Code Since the implementation of the Code, the SAS Group has followed the Code with the exception of the following instance: SAS conducts shareholder’s meetings in Swedish, Norwegian and Danish, which departs from clause 1.5 of the Code.
Reason for the departure: the Articles of Association for SAS AB specify that the language used at shareholders’ meetings is to be Swedish, Danish or Norwegian, and, if the Board so decides, other languages as well. The rea-son all three Scandinavian languages are used at shareholders’ meetings is due to the strong Scandinavian nature of the SAS Group with the largest number of shareholders in Denmark as well as a management and Board comprising citizens of all three Scandinavian countries. Meeting delibera-tions in SAS AB are held primarily in Swedish and meeting materials are available in Swedish. In view of the above, the Board believes that any one of the Scandinavian languages may be freely used at shareholders’ meetings in the company in view of the similarity of the three Scandinavian languages.
Shareholders’ meeting At the Shareholders’ Meeting of SAS AB, which is the company’s highest decision-making body, one share is equal to one vote with no restrictions on the number of votes any one shareholder is entitled to.
The shareholders’ meeting may be held in Stockholm or in Sigtuna. Up until 2013, a provision in the company’s Articles of Association stated that shareholders may also attend the meeting from locations in Copenhagen and Oslo via telecommunications links. The 2013 Annual General Share-holders’ Meeting (AGM) resolved to change the Articles of Association so
SAS Group’s legal structure January 27, 2014
Organization and control
CFODeputy President
Göran Jansson
General CounselSenior Vice President
Mats Lönnkvist
President and CEORickard Gustafson
Board of DirectorsChairman of the Board Fritz H. Schur
OperationsExecutive Vice President
Flemming Jensen
HR & CommunicationDeputy President and Executive Vice President Henriette Fenger Ellekrog
Sales & MarketingExecutive Vice President
Eivind Roald
CommercialExecutive Vice President
Joakim Landholm
SAS Norge AS SAS Sverige AB
Blue1 Oy 100%
Widerøe’s Flyveselskap AS 20%
SAS Ground Handling Denmark A/S SAS Ground Handling Norway AS 90%SAS Ground Handling Sweden AB
SAS Cargo Group A/S 100%
AS Estonian Air 2.7%
Air Greenland 37.5%
Consortium Scandinavian Airlines System Denmark – Norway – Sweden
SAS AB
Legal framework governing the SAS Group The key rules and regulations for SAS AB are:External rules• Swedish legislation • The Swedish Corporate Governance Code (the Code) • The NASDAQ OMX Rules for Issuers• The recommendations issued by relevant Swedish and international
organizations
No breach of the relevant stock exchange rules or of good stock market practices have been reported by NASDAQ’s Disciplinary Committee or the Swedish Securities Council.
Internal rules• The Articles of Association• Information/IR policy• The Board’s work plan• The Board’s instructions to the President• Internal policies and guidelines including the Code of Conduct
SAS Danmark A/S

83SAS Group Annual Report November 2012–October 2013
that, in future, shareholders’ meetings could be held at only one location in Stockholm or Sigtuna. This change is part of the SAS Group’s initiatives to streamline operations.
Notice convening the AGM is issued no earlier than six and no later than four weeks prior to the meeting. Notice is published in daily newspapers in Sweden, Denmark and Norway and announced in press releases as well as published on the company’s website. The company e-mails notices to shareholders who have requested this service via Shareholder Service on the company website; www.sasgroup.net.
The Articles of Association contain no special provisions regarding the election and discharge of Board members or regarding changes to the Arti-cles of Association. The Board of SAS has proposed to the 2014 AGM that the Articles of Association be amended to allow the issue of preference shares and that the Board be authorized to decide on new issue of a maximum of 7 million preference shares up to the 2015 AGM. Furthermore, the Board has proposed the authorization of the Board until the 2015 AGM to issue con-vertible bonds in an amount not exceeding SEK 2 billion, with entitlement to a maximum amount of 130 million common shares on conversion.
Nomination Committee
The Nomination Committee is appointed by the AGM and tasked with pre-paring the meeting’s resolutions on nomination and remuneration issues, as well as matters of procedure for the next nomination committee. Mem-bers of the Nomination Committee, irrespective of how they were appointed, must address the interests of all shareholders. In conjunction with the 2013 AGM, an instruction for the Nomination Committee was adopted. Ahead of the 2014 AGM, the Nomination Committee is tasked with making proposals for the election of the Chairman of the AGM, the number of Board members and Directors’ fees, broken down among the Chairman, Vice Chairman, oth-er Board members and any remuneration for work on Board committees, election of Board members and Chairman of the Board, election of auditors, auditors’ fees and the Nomination Committee ahead of the 2015 AGM.
Nomination Committee, three minuted meetingsJonas Iversen, Ministry of Finance, for the Swedish Government (Chairman)Peter Brixen, Danish Ministry of FinanceKnut J. Utvik, Norwegian Ministry of Trade, Industry and FisheriesPeter Wallenberg Jr, Knut and Alice Wallenberg FoundationKarsten Biltoft, Danmarks Nationalbank (through October 2013)
The Nomination Committee has evaluated the Board’s work, qualifications and composition. The Chairman liaises closely with the Committee, and the result of the evaluation of the Board is made available to the Committee. At least one meeting with the Chairman and Group CEO must be held before the Nomination Committee submits its recommendations to the AGM. The Nom-ination Committee’s recommendations are published in the notice convening the AGM, on the company website and at the AGM. Committee members received no fees or other remuneration from SAS for their work on the Nomination Committee. When required for carrying out its assignment, the Nomination Committee utilizes outside advisers and consultants, with SAS defraying the cost.
Board of Directors The Articles of Association stipulate that the Board of Directors consist of six to eight members elected by the shareholders’ meeting. During the year, the Board comprised seven duly elected members, no deputies and three employee representatives, each with two personal deputies. The employee representatives are appointed by the SAS Group’s employee groups in Denmark, Norway and Sweden in line with governing legislation and special agreements. Deputies attend Board meetings only in the absence of an ordinary member. Except for employee representatives, no Board member is employed by SAS AB or any other company in the SAS Group.
The elected Board members are appointed for the period until the end of the next AGM. No regulation exists that limits the period of time a Board member can serve as a member of the Board. The experience of the Board members and their independence in relation the owners of the company are disclosed on pages 88–89.
The average age of members is 56 and two of the seven members elected by the shareholders’ meeting are women. All members elected by the sharehold-ers’ meeting are regarded by the Nomination Committee as being independent of the company and company management, while one member is not regarded as being independent of the company’s major shareholders. Owing to his posi-tion as President and CEO of Posten Norge AS, wholly owned by the Norwegian government, Dag Mejdell is not regarded as independent in relation to major shareholders. SAS AB meets the requirements of the Code regarding Board in-dependence vis-à-vis the company, company management, and the company’s major shareholders.
The Board’s work The Board’s work is governed by the Swedish Companies Act, the Articles of Association, the Code and the formal work plan adopted by the Board each year. The Board’s work follows a plan intended, among other things, to en-sure the Board receives all necessary information. The formal work plan regulates the division of the Board’s work between the Board and its com-mittees and among the Board, its Chairman and the President. The work plan also contains provisions for meeting the Board’s needs for information and financial reporting on an ongoing basis as well as instructions for the President and the company’s Board committees.
In November 2012–October 2013, the Board of Directors held 15 sched-uled meetings. Senior executives in the company attended Board meetings to make presentations and the General Counsel of the SAS Group served as the Board’s secretary. At its meetings, the Board discussed the regular busi-ness items presented at the respective meetings including business and market conditions, risk assessment, financial reporting and follow-up, the company’s financial position, and investments. The Board also discussed any sustainability-related information of material importance.
Corporate governance, governance structureSAS AB had 61,383 shareholders on October 31, 2013. The major shareholders are the three Scandinavian governments. The largest private shareholders are the Knut and Alice Wallenberg Foundation, Avanza Pension, JPM Chase, Unionen and the funds of various banks.
Shareholders
Auditors Shareholders’ Meeting
Audit Committee
Nomination Committee
Board of Directors
Internal Audit
Remuneration Committee
President and CEO
Company Boards
Internal Control
Control environmentRisk assessmentControl activitiesInformation & communicationsFollow-up
Appointment procedures Operational procedures

84 SAS Group Annual Report November 2012–October 2013
Main issues dealt with at Board meetings11/5: Status of negotiations with banks and shareholders regarding the
new credit facility.11/7: Report for the third quarter, review of refinancing plan and re-
structuring plan .11/16: Restructuring plan status – union negotiations.11/19: Same subject as the meeting of November 16.12/11: Year-end report, PULS and evaluation of the Board’s work.2/15: Status for the restructuring program – pensions, IT transforma-
tion, Widerøe, administration and Ground Handling, adoption of budgets, adoption of the annual report, EuroBonus in Norway and adoption of the new Information Policy.
3/7: Adoption of the report for the first quarter.3/20: Presentation of and decision on the new commercial concept, re-
view of flight safety work and the status of the restructuring pro-gram.
4/29: Review of the financial position and preparedness, decision on the sale of Widerøe, joint venture with Lufthansa, move of the head office to Frösundavik and adoption of the Board’s (and its committees’) written instructions and a work plan.
6/10–11: Strategy meeting, risk assessment, adoption of the report for the second quarter, update of the SAS financial policy, review of sick leave, mandate for investment in long-haul and issue of the EMTN bond.
9/3: Sale of Ground Handling to Swissport, adoption of the report for the third quarter, issue of bond loan, review of operational quality and customer deliveries, and the follow-up of new commercial concepts.
10/24: Status and follow-up of the restructuring program, sick leave re-porting, market and revenue follow-up, budget for 2013/2014, and evaluation of the work of the Board and CEO.
In addition, there was one statutory meeting and two by corre-spondance.
To streamline and enhance the work of the Board, there are two committees; the Remuneration Committee and the Audit Committee, whose members are appointed by the Board. The main duty of the committees is to prepare issues for decision by the Board.
These committees do not imply any delegation of the Board’s or its members’ legal responsibilities. Reports to the Board on issues discussed
at committee meetings are either in writing or given verbally at the following Board meeting. The work on each committee follows written instructions and a work plan stipulated by the Board. The General Counsel of the SAS Group serves as the secretary to the committees and minutes of committee meetings are provided to all Board members. Remuneration for work on Board committees is determined by the AGM.
Remuneration Committee
Remuneration and other terms of employment for senior executives are de-signed with a view to ensuring the company’s access to executives possess-ing the requisite skills for the company at a cost appropriate to the company and so that they have the intended effects for the company’s operations.
Remuneration Committee, one minuted meeting
Number of meetings attendedFritz H. Schur (Chairman) 1Jacob Wallenberg 1Dag Mejdell 1
The Group’s Remuneration Committee complies with the Code’s instruc-tions. The Code specifies that members of the Remuneration Committee must be independent of the company or company management. Fritz H. Schur, Jacob Wallenberg and Dag Mejdell are independent in relation to the company and company management. The Remuneration Committee pre-pares proposals for remuneration policies and other employment terms for resolution at the AGM.
At the start of the 2012/2013 fiscal year, the Remuneration Committee evaluated the existing remuneration structures and levels in the company, whereupon the Remuneration Committee and the Board found that these were not, in all regards, in line with market rates. Accordingly, a salary cut of between 5 and 20 percent was decided for all members of the Group Man-agement effective from December 1, 2012.
The Remuneration Committee has followed and discussed the substan-tial work in preparing a revised strategy and the subsequent extensive reor-ganization processes that SAS has implemented and which are still ongo-ing. In its evaluation, the Committee expressed its support for the measures taken by the Group Management to guarantee these efforts through the use of so-called “stay-on” replacements for certain key skills outside the Group Management.
Attendance at Board meetings, November 2012–October 2013
Nov 5 Nov 7 Nov 16 Nov 19 Dec 11 Feb 151 Mar 7 Mar 202 Apr 29 Jun 10–111 Sep 3 Oct 24
Fritz H. Schur, ChairmanJacob Wallenberg, Vice ChairmanMonica Caneman, memberJens Erik Christensen, memberLars-Johan Jarnheimer, memberBirger Magnus, memberSanna Suvanto-Harsaae, memberDag Mejdell, Second Vice ChairmanGry Mølleskog, memberTimo Peltola, memberUlla Gröntvedt, employee representativeAnna-Lena Gustafsson, employee representativeElisabeth Goffeng, employee representative
Present Absent1) A meeting was held by correspondance on February 14, 2013. In addition to the meeting of June 11, 2013 another meeting was held by correspondance.2) The meeting of March 20, 2013 was a statutory meeting.
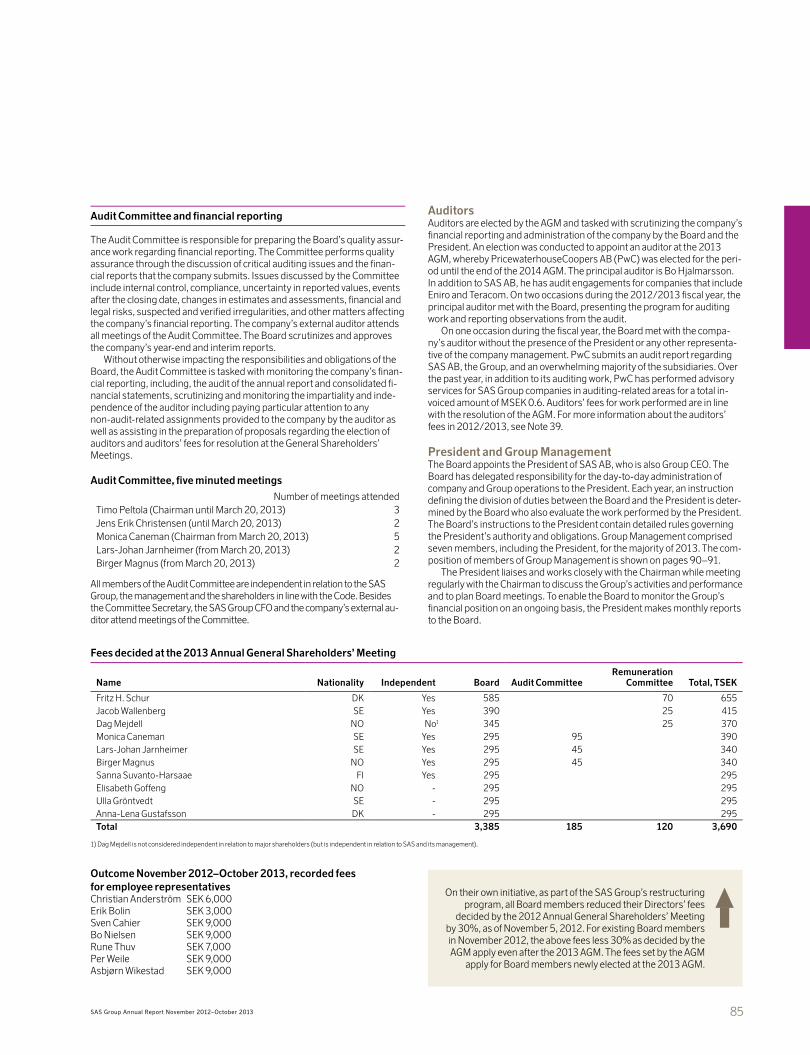
85SAS Group Annual Report November 2012–October 2013
Audit Committee and financial reporting
The Audit Committee is responsible for preparing the Board’s quality assur-ance work regarding financial reporting. The Committee performs quality assurance through the discussion of critical auditing issues and the finan-cial reports that the company submits. Issues discussed by the Committee include internal control, compliance, uncertainty in reported values, events after the closing date, changes in estimates and assessments, financial and legal risks, suspected and verified irregularities, and other matters affecting the company’s financial reporting. The company’s external auditor attends all meetings of the Audit Committee. The Board scrutinizes and approves the company’s year-end and interim reports.
Without otherwise impacting the responsibilities and obligations of the Board, the Audit Committee is tasked with monitoring the company’s finan-cial reporting, including, the audit of the annual report and consolidated fi-nancial statements, scrutinizing and monitoring the impartiality and inde-pendence of the auditor including paying particular attention to any non-audit-related assignments provided to the company by the auditor as well as assisting in the preparation of proposals regarding the election of auditors and auditors’ fees for resolution at the General Shareholders’ Meetings.
Audit Committee, five minuted meetings
Number of meetings attendedTimo Peltola (Chairman until March 20, 2013) 3Jens Erik Christensen (until March 20, 2013) 2Monica Caneman (Chairman from March 20, 2013) 5Lars-Johan Jarnheimer (from March 20, 2013) 2Birger Magnus (from March 20, 2013) 2
All members of the Audit Committee are independent in relation to the SAS Group, the management and the shareholders in line with the Code. Besides the Committee Secretary, the SAS Group CFO and the company’s external au-ditor attend meetings of the Committee.
Auditors Auditors are elected by the AGM and tasked with scrutinizing the company’s financial reporting and administration of the company by the Board and the President. An election was conducted to appoint an auditor at the 2013 AGM, whereby PricewaterhouseCoopers AB (PwC) was elected for the peri-od until the end of the 2014 AGM. The principal auditor is Bo Hjalmarsson. In addition to SAS AB, he has audit engagements for companies that include Eniro and Teracom. On two occasions during the 2012/2013 fiscal year, the principal auditor met with the Board, presenting the program for auditing work and reporting observations from the audit.
On one occasion during the fiscal year, the Board met with the compa-ny’s auditor without the presence of the President or any other representa-tive of the company management. PwC submits an audit report regarding SAS AB, the Group, and an overwhelming majority of the subsidiaries. Over the past year, in addition to its auditing work, PwC has performed advisory services for SAS Group companies in auditing-related areas for a total in-voiced amount of MSEK 0.6. Auditors’ fees for work performed are in line with the resolution of the AGM. For more information about the auditors’ fees in 2012/2013, see Note 39.
President and Group ManagementThe Board appoints the President of SAS AB, who is also Group CEO. The Board has delegated responsibility for the day-to-day administration of company and Group operations to the President. Each year, an instruction defining the division of duties between the Board and the President is deter-mined by the Board who also evaluate the work performed by the President. The Board’s instructions to the President contain detailed rules governing the President’s authority and obligations. Group Management comprised seven members, including the President, for the majority of 2013. The com-position of members of Group Management is shown on pages 90–91.
The President liaises and works closely with the Chairman while meeting regularly with the Chairman to discuss the Group’s activities and performance and to plan Board meetings. To enable the Board to monitor the Group’s financial position on an ongoing basis, the President makes monthly reports to the Board.
Fees decided at the 2013 Annual General Shareholders’ Meeting
Name Nationality Independent Board Audit Committee Remuneration
Committee Total, TSEK
Fritz H. Schur DK Yes 585 70 655Jacob Wallenberg SE Yes 390 25 415Dag Mejdell NO No1 345 25 370Monica Caneman SE Yes 295 95 390Lars-Johan Jarnheimer SE Yes 295 45 340Birger Magnus NO Yes 295 45 340Sanna Suvanto-Harsaae FI Yes 295 295Elisabeth Goffeng NO - 295 295Ulla Gröntvedt SE - 295 295Anna-Lena Gustafsson DK - 295 295Total 3,385 185 120 3,690
1) Dag Mejdell is not considered independent in relation to major shareholders (but is independent in relation to SAS and its management).
On their own initiative, as part of the SAS Group’s restructuring program, all Board members reduced their Directors’ fees
decided by the 2012 Annual General Shareholders’ Meeting by 30%, as of November 5, 2012. For existing Board members in November 2012, the above fees less 30% as decided by the AGM apply even after the 2013 AGM. The fees set by the AGM
apply for Board members newly elected at the 2013 AGM.
Outcome November 2012–October 2013, recorded fees for employee representativesChristian Anderström SEK 6,000Erik Bolin SEK 3,000Sven Cahier SEK 9,000Bo Nielsen SEK 9,000Rune Thuv SEK 7,000Per Weile SEK 9,000Asbjørn Wikestad SEK 9,000
86 SAS Group Annual Report November 2012–October 2013
Annual General Shareholders’ MeetingThe Annual General Shareholders’ Meeting of the SAS Group is to be held on February 18, 2014 at 3:00 p.m. at the following venue: Stockholm-Arlanda: Clarion Hotel, Arlanda Airport
Attending the Annual General Shareholders’ Meeting Shareholders who wish to attend the Annual General Shareholders’ Meeting must notify the company in advance. Details about notification will be pub-lished in the notice convening the Annual General Shareholders’ Meeting.
Proposals or questions for inclusion in the notice of the Annual General Shareholders’ Meeting Shareholders who wish to address a specific question or who have a pro-posal for inclusion in the notice con-vening the Annual General Sharehold-ers’ Meeting may do so. The deadline for proposals is stated in good time in line with the provisions of the Code on the SAS website.
Items in the notice• The deadline for receiving business to
be included in the notice is January 2, 2014.
Sending of the notice and notification of attendance• The notice is to be sent on January
16, 2014.• Deadline for notification of atten-
dance: February 12, 2014 in Sweden and February 11, 2014 in Norway and Denmark.
Record day • February 12, 2014
Admission cards to the AGM will be sent on• February 12–13, 2014
Annual General Shareholders’ Meeting• February 18, 2014
Group Management is not a corporate body in the sense of Swedish limited company law and as a collegial management body has no legal liability vis-à-vis the Board and shareholders. Only the President reports to the Board. Group Management normally has minuted meetings every week. These meetings are chaired by the President, who reaches decisions after consult-ing with the other members of Group Management.
Those of the Group’s main business areas that are not themselves a sepa-rate legal entity are led by Group Management through representatives for the respective business area. Group Management’s management and control of operations are based on a number of guidelines and policies regarding finan-cial management and follow-up, communication issues, human resources, le-gal issues, the Group’s brands, business ethics and environmental matters.
Remuneration policies and other terms of employment for company management Remuneration policies for company management are to be formulated and presented by the Remuneration Committee to the Board, which submits the proposal to the AGM for adoption. The 2013 AGM adopted the remunera-tion policies and other terms of employment for senior executives. The re-muneration policies for 2013 remained unchanged compared with those that applied in 2012. In conjunction with the negotiations regarding new collective agreements in 2012, a decrease in pay of between 5 and 20 per-cent was decided for all members of Group Management from December 1, 2012. Pursuant to the resolution of the AGM, no variable remuneration is payable to senior executives and no share-related incentive programs exist in SAS. The Board deems that particular circumstances exist for deviation from the remuneration policies with regard to the Board’s decision to allow
variable remuneration to the member of Group Management responsible for Sales & Marketing, see Note 3 on page 59.
Agreements concluded previously with some executives that contain partially deviating conditions governing pensions, notice periods and sever-ance pay will be respected until they cease or are renegotiated.
Total remuneration must be market-based and competitive and must be in relation to responsibility and authority.
Remuneration consists of fixed salary, other benefits and pension. The fixed salary is to reflect the position’s requirements pertaining to skills, re-sponsibility, complexity and the manner in which it contributes to achieving the business objectives. The fixed salary is to also reflect the executive’s performance and can therefore be both individual and differentiated.Other benefits, including company car and health insurance, must be market-based and only constitute a limited part of the total remuneration. Pension benefits are to be defined-contribution, with premiums not exceeding 30% of the fixed annual salary.
Remuneration of the President is to be decided within the framework of policies approved by the Board of SAS AB and after preparation and recom-mendation by the Remuneration Committee established by the Board. Re-muneration of other members of Group Management is to be decided by the President within the framework of approved remuneration policies after consultation with the Remuneration Committee. The detailed guidelines are available on the company’s website. For detailed information about remu-neration and benefits for the Board, President and senior executives in 2013 see Note 3, page 59.
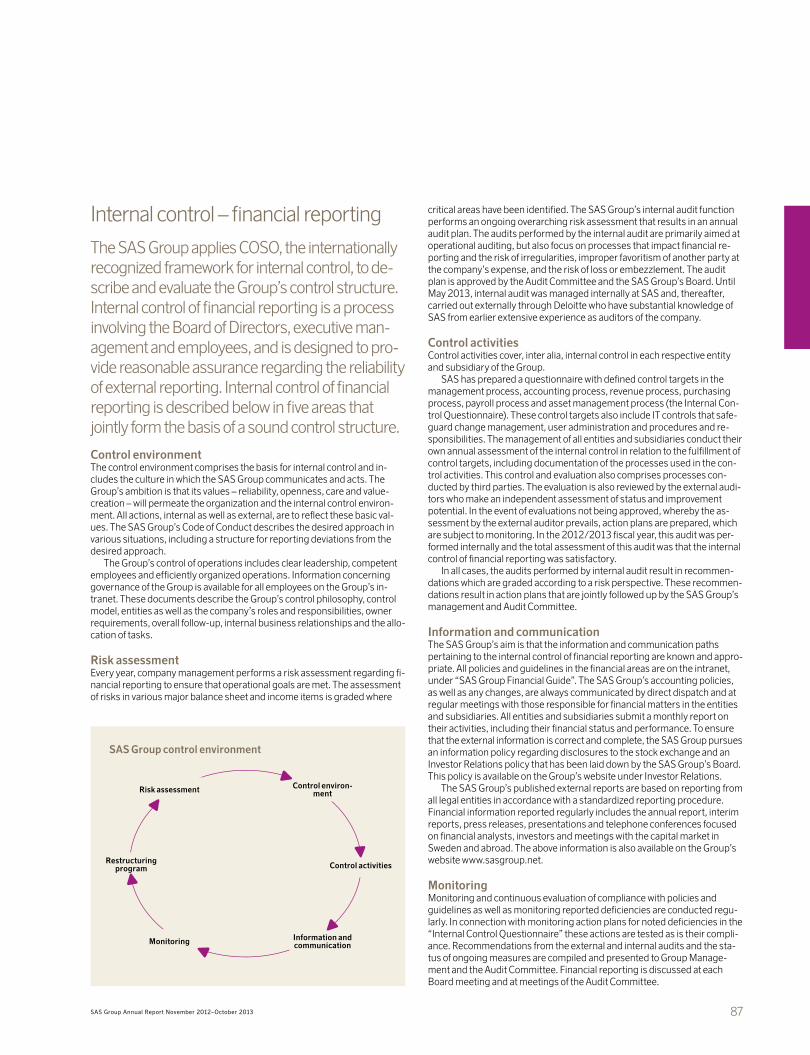
87SAS Group Annual Report November 2012–October 2013
Internal control – financial reporting
The SAS Group applies COSO, the internationally recognized framework for internal control, to de-scribe and evaluate the Group’s control structure. Internal control of financial reporting is a process involving the Board of Directors, executive man-agement and employees, and is designed to pro-vide reasonable assurance regarding the reliability of external reporting. Internal control of financial reporting is described below in five areas that jointly form the basis of a sound control structure.
Control environmentThe control environment comprises the basis for internal control and in-cludes the culture in which the SAS Group communicates and acts. The Group’s ambition is that its values – reliability, openness, care and value-creation – will permeate the organization and the internal control environ-ment. All actions, internal as well as external, are to reflect these basic val-ues. The SAS Group’s Code of Conduct describes the desired approach in various situations, including a structure for reporting deviations from the desired approach.
The Group’s control of operations includes clear leadership, competent employees and efficiently organized operations. Information concerning governance of the Group is available for all employees on the Group’s in-tranet. These documents describe the Group’s control philosophy, control model, entities as well as the company’s roles and responsibilities, owner requirements, overall follow-up, internal business relationships and the allo-cation of tasks.
Risk assessmentEvery year, company management performs a risk assessment regarding fi-nancial reporting to ensure that operational goals are met. The assessment of risks in various major balance sheet and income items is graded where
critical areas have been identified. The SAS Group’s internal audit function performs an ongoing overarching risk assessment that results in an annual audit plan. The audits performed by the internal audit are primarily aimed at operational auditing, but also focus on processes that impact financial re-porting and the risk of irregularities, improper favoritism of another party at the company’s expense, and the risk of loss or embezzlement. The audit plan is approved by the Audit Committee and the SAS Group’s Board. Until May 2013, internal audit was managed internally at SAS and, thereafter, carried out externally through Deloitte who have substantial knowledge of SAS from earlier extensive experience as auditors of the company.
Control activitiesControl activities cover, inter alia, internal control in each respective entity and subsidiary of the Group.
SAS has prepared a questionnaire with defined control targets in the management process, accounting process, revenue process, purchasing process, payroll process and asset management process (the Internal Con-trol Questionnaire). These control targets also include IT controls that safe-guard change management, user administration and procedures and re-sponsibilities. The management of all entities and subsidiaries conduct their own annual assessment of the internal control in relation to the fulfillment of control targets, including documentation of the processes used in the con-trol activities. This control and evaluation also comprises processes con-ducted by third parties. The evaluation is also reviewed by the external audi-tors who make an independent assessment of status and improvement potential. In the event of evaluations not being approved, whereby the as-sessment by the external auditor prevails, action plans are prepared, which are subject to monitoring. In the 2012/2013 fiscal year, this audit was per-formed internally and the total assessment of this audit was that the internal control of financial reporting was satisfactory.
In all cases, the audits performed by internal audit result in recommen-dations which are graded according to a risk perspective. These recommen-dations result in action plans that are jointly followed up by the SAS Group’s management and Audit Committee.
Information and communicationThe SAS Group’s aim is that the information and communication paths pertaining to the internal control of financial reporting are known and appro-priate. All policies and guidelines in the financial areas are on the intranet, under “SAS Group Financial Guide”. The SAS Group’s accounting policies, as well as any changes, are always communicated by direct dispatch and at regular meetings with those responsible for financial matters in the entities and subsidiaries. All entities and subsidiaries submit a monthly report on their activities, including their financial status and performance. To ensure that the external information is correct and complete, the SAS Group pursues an information policy regarding disclosures to the stock exchange and an Investor Relations policy that has been laid down by the SAS Group’s Board. This policy is available on the Group’s website under Investor Relations.
The SAS Group’s published external reports are based on reporting from all legal entities in accordance with a standardized reporting procedure. Financial information reported regularly includes the annual report, interim reports, press releases, presentations and telephone conferences focused on financial analysts, investors and meetings with the capital market in Sweden and abroad. The above information is also available on the Group’s website www.sasgroup.net.
MonitoringMonitoring and continuous evaluation of compliance with policies and guidelines as well as monitoring reported deficiencies are conducted regu-larly. In connection with monitoring action plans for noted deficiencies in the “Internal Control Questionnaire” these actions are tested as is their compli-ance. Recommendations from the external and internal audits and the sta-tus of ongoing measures are compiled and presented to Group Manage-ment and the Audit Committee. Financial reporting is discussed at each Board meeting and at meetings of the Audit Committee.
SAS Group control environment
Risk assessment
Restructuring program
Monitoring
Control environ-ment
Control activities
Information and communication
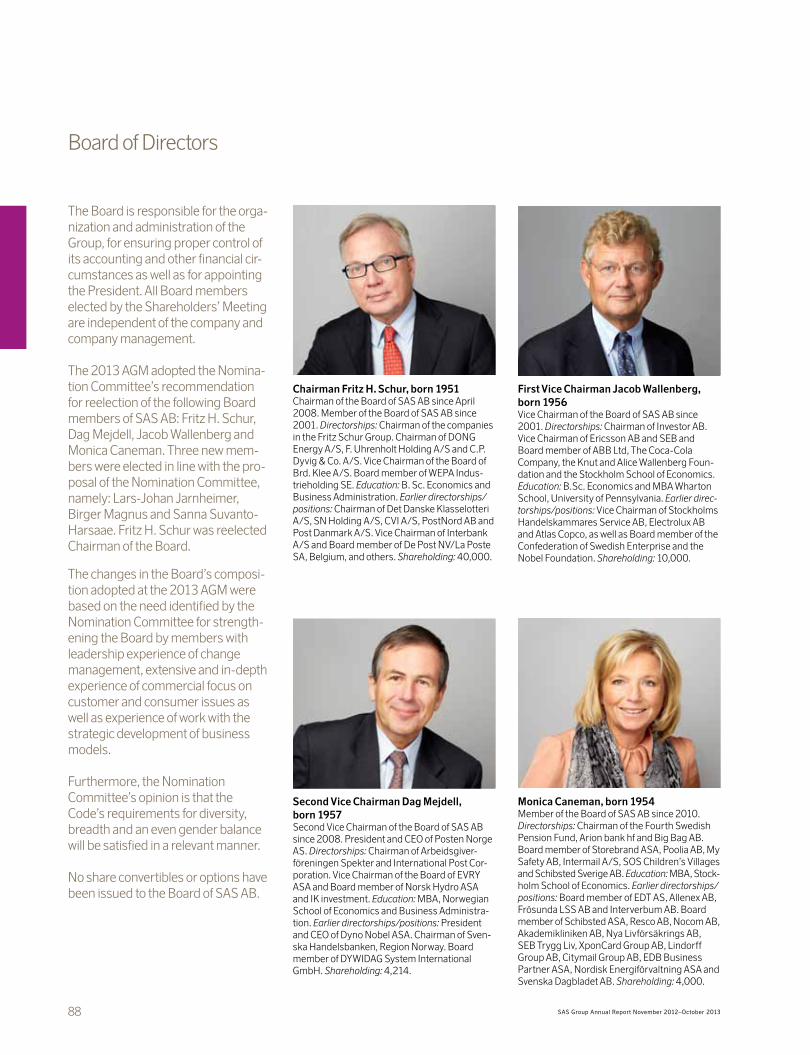
88 SAS Group Annual Report November 2012–October 2013
First Vice Chairman Jacob Wallenberg, born 1956Vice Chairman of the Board of SAS AB since 2001. Directorships: Chairman of Investor AB. Vice Chairman of Ericsson AB and SEB and Board member of ABB Ltd, The Coca-Cola Company, the Knut and Alice Wallenberg Foun-dation and the Stockholm School of Economics. Education: B.Sc. Economics and MBA Wharton School, University of Pennsylvania. Earlier direc-torships/positions: Vice Chairman of Stockholms Handelskammares Service AB, Electrolux AB and Atlas Copco, as well as Board member of the Confederation of Swedish Enterprise and the Nobel Foundation. Shareholding: 10,000.
Board of Directors
The Board is responsible for the orga-nization and administration of the Group, for ensuring proper control of its accounting and other financial cir-cumstances as well as for appointing the President. All Board members elected by the Shareholders’ Meeting are independent of the company and company management.
The 2013 AGM adopted the Nomina-tion Committee’s recommendation for reelection of the following Board members of SAS AB: Fritz H. Schur, Dag Mejdell, Jacob Wallenberg and Monica Caneman. Three new mem-bers were elected in line with the pro-posal of the Nomination Committee, namely: Lars-Johan Jarnheimer, Birger Magnus and Sanna Suvanto-Harsaae. Fritz H. Schur was reelected Chairman of the Board.
The changes in the Board’s composi-tion adopted at the 2013 AGM were based on the need identified by the Nomination Committee for strength-ening the Board by members with leadership experience of change management, extensive and in-depth experience of commercial focus on customer and consumer issues as well as experience of work with the strategic development of business models.
Furthermore, the Nomination Committee’s opinion is that the Code’s requirements for diversity, breadth and an even gender balance will be satisfied in a relevant manner.
No share convertibles or options have been issued to the Board of SAS AB.
Second Vice Chairman Dag Mejdell, born 1957Second Vice Chairman of the Board of SAS AB since 2008. President and CEO of Posten Norge AS. Directorships: Chairman of Arbeidsgiver-föreningen Spekter and International Post Cor-poration. Vice Chairman of the Board of EVRY ASA and Board member of Norsk Hydro ASA and IK investment. Education: MBA, Norwegian School of Economics and Business Administra-tion. Earlier directorships/positions: President and CEO of Dyno Nobel ASA. Chairman of Sven-ska Handelsbanken, Region Norway. Board member of DYWIDAG System International GmbH. Shareholding: 4,214.
Monica Caneman, born 1954Member of the Board of SAS AB since 2010. Directorships: Chairman of the Fourth Swedish Pension Fund, Arion bank hf and Big Bag AB. Board member of Storebrand ASA, Poolia AB, My Safety AB, Intermail A/S, SOS Children’s Villages and Schibsted Sverige AB. Education: MBA, Stock-holm School of Economics. Earlier directorships/positions: Board member of EDT AS, Allenex AB, Frösunda LSS AB and Interverbum AB. Board member of Schibsted ASA, Resco AB, Nocom AB, Akademikliniken AB, Nya Livförsäkrings AB, SEB Trygg Liv, XponCard Group AB, Lindorff Group AB, Citymail Group AB, EDB Business Partner ASA, Nordisk Energiförvaltning ASA and Svenska Dagbladet AB. Shareholding: 4,000.
Chairman Fritz H. Schur, born 1951Chairman of the Board of SAS AB since April 2008. Member of the Board of SAS AB since 2001. Directorships: Chairman of the companies in the Fritz Schur Group. Chairman of DONG Energy A/S, F. Uhrenholt Holding A/S and C.P. Dyvig & Co. A/S. Vice Chairman of the Board of Brd. Klee A/S. Board member of WEPA Indus-trieholding SE. Education: B. Sc. Economics and Business Administration. Earlier directorships/positions: Chairman of Det Danske Klasselotteri A/S, SN Holding A/S, CVI A/S, PostNord AB and Post Danmark A/S. Vice Chairman of Interbank A/S and Board member of De Post NV/La Poste SA, Belgium, and others. Shareholding: 40,000.

89SAS Group Annual Report November 2012–October 2013
Employee representativeUlla Gröntvedt, born 1948Employed at Scandinavian Airlines Sweden.Member of the Board of SAS AB since 2001. Shareholding: 2,000. Deputies: Sven Cahier, First Deputy. Shareholding: 418. Erik Bohlin, Second Deputy. Shareholding: 0.
Employee representativeAnna-Lena Gustafsson, born 1959Employed at Scandinavian Airlines Denmark.Member of the Board of SAS AB since September 2011. Shareholding: 0. Deputies: Bo Nielsen, First Deputy. Shareholding: 392. Per Weile, Second Deputy. Shareholding: 656.
Employee representativeAsbjörn Wikestad, born 1948Employed at Scandinavian Airlines in Norway.Member of the Board of SAS AB since November 2013. Shareholding: 0. Deputies: Rune Thuv, First Deputy. Shareholding: 10,238. Jan Levi Skogvang, Second Deputy. Shareholding: 0.
Sanna Suvanto-Harsaae, born 1966Member of the Board of SAS AB since 2013. Directorships: Chairman of Babysam AS, Sunset Boulevard AS, VPG AS and Best Friend AB. Mem-ber of the Board of Paulig Oy, Clas Ohlson AB, Altia OY, CCS AB and Upplands Motor AB. Edu-cation: Master of Science (Business and Eco-nomics), Lund University. Earlier directorships/positions: Chairman of Health and Fitness Nordic AB and BTX AS. Board member of Jetpak AB, Duni AB, Candyking AB and Symrise AG. Shareholding: 0.
Lars-Johan Jarnheimer, born 1960Member of the Board of SAS AB since 2013. Directorships: Chairman of CDON Group, Eniro AB and Arvid Nordqvist HAB. Board member of Ingka Holding BV (IKEA’s parent company) and Egmont International Holding AS. Education: Bachelor of Science in Business Administration and Economics, Lund and Växjö universities. Earlier directorships/positions: Chairman of BRIS. Board member of MTG Modern Times Group AB, Millicom International Cellular S.A., Invik and Apoteket AB. President and CEO of Tele2. Shareholding: 10,000.
Birger Magnus, born 1955Member of the Board of SAS AB since 2013. Directorships: Chairman of Storebrand ASA, Hafslund ASA and Bmenu AS. Board member of Wevideo Inc, Kristian Gerhard Jebsen Group, Aschehoug AS, Aktiv mot Kreft and Harvard Business School Publishing. Education: MBA, INSEAD and M.Sc., University of Science and Technology. Earlier directorships/positions: Chairman of Svenska Dagbladet, Aftonbladet, Aftenposten, VG, Media Norge and 20 Min Holding. Shareholding: 0.
Auditors PricewaterhouseCoopers AB (PwC)Principal auditor Bo Hjalmarsson, Authorized Public Accountant. Elected in 2013.Other major engagements Eniro and Teracom.Corporate Secretary Mats Lönnkvist, General Counsel, SAS Group and Member of SAS Group Management.

90 SAS Group Annual Report November 2012–October 2013
Group Management
Group Management is responsible for the Group’s business management, financial reporting, acquisitions/ disposals, financing and communica-tion and other corporate matters. The members of Group Management are appointed by the President in con-sultation with the Board of Directors. Only the President reports to the Board, although the other members of Group Management report to the President. Group Management’s responsibilities are divided among its members with regard to managing the Group’s business affairs, and minuted meetings are normally held every second week.
Rickard Gustafson, born 1964President and CEO Member of SAS Group Management from February 1, 2011. Previously, various executive positions in GE Capital, both in Europe and the US, and President of Codan/Trygg-Hansa from 2006–2011. External directorships: none. Education: Master of Science, Industrial Economics. Shareholding: 40,000. No related parties or companies of Rickard Gustafson have any shareholdings in SAS AB.
Göran Jansson, born 1958Deputy President and CFOMember of SAS Group Management since 2011.Previously CFO and Deputy CEO of Assa Abloy. External directorships: Board member of Axis Communication AB and SPP. Education: Gradu-ate in Business Administration from Stockholm University. Shareholding: 0.
Henriette Fenger Ellekrog, born 1966Deputy President and Executive Vice Presi-dent, Human Resources and CommunicationMember of SAS Group Management from Octo-ber 1, 2007. Since 2007, responsible for Human Resources and, since 2010, responsible for Communication. Previous positions include: 1998–2007 various executive positions at TDC A/C, most recently as Senior Executive Vice President, Corporate HR and Chief of Staff. Prior to that, various positions and management posts at Mercuri Urval A/S and Peptech (Eu-rope) A/S. External directorships: Chairperson of the Swedish Aviation Industry Group, Board mem-ber of Svenskt Flyg, Fonden för Dansk-Norsk Samarbejde and the Advisory Board for women in management positions and the Boards of the Confederation of Danish Industry. Education: Cand. ling. merc. degree from the Copenhagen Business School. Shareholding: 12,200.
Flemming Jensen, born 1959Executive Vice President OperationsMember of SAS Group Management since Sep-tember 14, 2011. Flemming Jensen joined SAS in 1989 and, since 2008, has held a number of executive positions in SAS production including Chief Operating Officer Production Unit CPH. During the period 2002–2008, he was Chief Pilot and before that, a pilot. External directorships: Board member of Industrial Employers in Copenhagen (IAK) and a member of the Board and Executive Committee of the Confederation of Danish Industry. Education: Pilot in the Danish Air Force. Shareholding: 14,100.

91SAS Group Annual Report November 2012–October 2013
Eivind Roald, born 1966Executive Vice President Sales & MarketingMember of SAS Group Management since April 1, 2012. Eivind Roald joined SAS after seven years as the President of Hewlett Packard in Norway. He also has 16 years’ experience from such companies as Accenture and Willi Railo Consult-ing, where he focused on the restructuring of sales and marketing functions. External directorships: Inmeta Crayon. Education: Bachelor’s degree from the Norwegian Management School (BI). Shareholding: 84,000.
Joakim Landholm, born 1969Executive Vice President CommercialMember of SAS Group Management since Janu-ary 16, 2012. Joakim Landholm joins SAS from a position as Chief Operating Officer at RSA Scandinavia, which comprises Trygg-Hansa and Codan. He has an extensive background in man-agement, strategy and analysis from GE Money Bank, Accenture and Swedbank. External direc-torships: none. Education: Master of Business Administration from the Stockholm School of Economics. Shareholding: 0.
Mats Lönnkvist, born 1955Senior Vice President, General CounselMember of SAS Group Management since 2009. Head of Legal, Insurance and Public Affairs, and is the Board secretary at SAS AB. Previous engage-ments/posts: Various legal posts in the SAS Group 1988–2009, the law firm of Mannheimer & Zetterlöf 1984–1988. External directorships: none. Education: Law degree from Uppsala University. Shareholding: 2,704.
Karl Sandlund, born 1977 Executive Vice President Strategic InitiativesMember of SAS Group Management since Febru-ary 1, 2014. Karl Sandlund comes from a position as Vice President Network & Partners and previ-ously worked in management roles with strategic assignments for SAS. Karl Sandlund worked for McKinsey before joining SAS in 2004. External directorships: none. Education: Master of Science in Industrial Engineering and Management from Linköping University. Shareholding: 2,000.

92 SAS Group Annual Report November 2012–October 2013
The Board of Directors and the President hereby give their assurance that the Annual Report has been prepared pursuant to the Swedish Annual Accounts Act and RFR 2, Accounting for Legal Entities, and provides a true and fair view of the company’s finan-cial position and earnings and that the Report by the Board of Directors provides a true and fair overview of the company’s operations, financial position and earnings, and de-scribes the significant risks and uncertainty factors to which the company is exposed.
The Board of Directors and President hereby give their assurance that the consolidated financial statements have been prepared pursuant to the International Financial Report-ing Standards (IFRS) as adopted by the EU, and provide a true and fair view of the Group’s financial position and earnings, and that the Report by the Board of Directors for the Group provides a true and fair overview of the performance of the Group’s operations, financial position and earnings, and describes the significant risks and uncertainty fac-tors to which the companies in the Group are exposed.
Stockholm, January 27, 2014
Fritz H. Schur Chairman of the Board
Jacob Wallenberg Dag Mejdell Monica Caneman First Vice Chairman Second Vice Chairman Board Member
Lars-Johan Jarnheimer Birger Magnus Sanna Suvanto-Harsaae Board Member Board Member Board Member
Asbjørn Wikestad Ulla Gröntvedt Anna-Lena Gustafsson Board Member Board Member Board Member
Rickard Gustafson President and CEO
As stated above, the annual accounts and consolidated financial statements were approved for issuance by the Board of Directors on January 27, 2014. The Group’s statement of income and balance sheet and the Parent Company’s statement of income and balance sheet will be subject to adoption by the
Annual General Shareholders’ Meeting on February 18, 2014.
Our auditors’ report was submitted on January 27, 2014
PricewaterhouseCoopers AB
Bo Hjalmarsson Christine Rankin Authorized Public Accountant Authorized Public Accountant Principal Auditor

93SAS Group Annual Report November 2012–October 2013
Auditor’s reportTo the annual meeting of the shareholders of SAS AB, Corporate Registration Number 556606-8499
Report on the annual accounts and consolidated accountsWe have audited the annual accounts and consolidated accounts of SAS AB for the year November 1, 2012–October 31, 2013 , with the exception of the Corporate Governance Report on pages 82–91. The company’s annual accounts and consolidated financial statements are included in the printed version of this document on pages 37–92.
Responsibilities of the Board of Directors and the President for the annual accounts and consolidated accounts The Board of Directors and the President are responsible for the preparation and fair presentation of these annual accounts in accordance with the Annual Accounts Act and that the consolidated accounts are prepared and fairly represented in accordance with International Financial Statements Standard as such they have been approved by the EU, and the Account act and for such internal control as the Board of Directors and the President determine is necessary to enable the preparation of annual accounts and consolidated accounts that are free from material misstatement, whether due to fraud or error.
Auditor’s responsibilityOur responsibility is to express an opinion on these annual accounts and consolidated accounts based on our audit. We conducted our audit in accordance with International Standards on Auditing and generally accepted auditing standards in Sweden. Those standards require that we comply with ethical requirements and plan and perform the audit to obtain reasonable assurance about whether the annual accounts and consoli-dated accounts are free from material misstatement.
An audit involves performing procedures to obtain audit evidence about the amounts and disclosures in the annual accounts and consolidated accounts. The pro-cedures selected depend on the auditor’s judgement, including the assessment of the risks of material misstatement of the annual accounts and consolidated accounts, whether due to fraud or error. In making those risk assessments, the auditor considers internal control relevant to the company’s preparation and fair presentation of the an-nual accounts and consolidated accounts in order to design audit procedures that are appropriate in the circumstances, but not for the purpose of expressing an opinion on the effectiveness of the company’s internal control. An audit also includes evaluating the appropriateness of accounting policies used and the reasonableness of accounting estimates made by the Board of Directors and the President, as well as evaluating the overall presentation of the annual accounts and consolidated accounts.
We believe that the audit evidence we have obtained is sufficient and appropriate to provide a basis for our audit opinion.
OpinionsIn our opinion, the annual accounts have been prepared in accordance with the Annual Accounts Act and present fairly, in all material respects, the financial position of the parent company as of October 31, 2013 and its financial performance and cash flows for the year in accordance with the Annual Accounts Act, and the consolidated financial statements have been prepared in accordance with the Annual Accounts Act and pres-ent fairly, in all material respects, the financial position of the group as of October 31, 2013 and its financial performance and cash flows in accordance with International Financial Reporting Standards, as adopted by the EU, and the Annual Accounts Act. The statutory administration report is consistent with the other parts of the annual accounts and consolidated accounts.
We therefore recommend that the annual meeting of shareholders adopt the in-come statement and balance sheet for the parent company and the Group.
Other mattersThe audit of the annual accounts for the January 1, 2012– October 31, 2012 fiscal year was performed by another auditor who submitted an auditor´s report dated February 15, 2013, with unmodified opinions in the Report on the annual accounts.
Report on other legal and regulatory requirementsIn addition to our audit of the annual accounts and consolidated accounts, we have also audited the proposed appropriations of the company’s profit or loss and the administra-tion of the Board of Directors and the President of SAS AB for the year the November 1, 2012– October 31, 2013 fiscal year.
Responsibilities of the Board of Directors and the PresidentThe Board of Directors is responsible for the proposal for appropriations of the compa-ny’s profit or loss, and the Board of Directors and the President are responsible for ad-ministration under the Companies Act.
Auditor’s responsibilityOur responsibility is to express an opinion with reasonable assurance on the proposed appropriations of the company’s profit or loss and on the administration based on our audit. We conducted the audit in accordance with generally accepted auditing stan-dards in Sweden.
As a basis for our opinion on the Board of Directors’ proposed appropriations of the company’s profit or loss, we examined the Board of Directors’ reasoned statement and a selection of supporting evidence in order to be able to assess whether the proposal is in accordance with the Swedish Companies Act.
As a basis for our opinion concerning discharge from liability, in addition to our au-dit of the annual accounts and consolidated accounts, we examined significant deci-sions, actions taken and circumstances of the company in order to determine whether any member of the Board of Directors or the President is liable to the company. We also examined whether any member of the Board of Directors or the President has, in any other way, acted in contravention of the Companies Act, the Annual Accounts Act or the Articles of Association.
We believe that the audit evidence we have obtained is sufficient and appropriate to provide a basis for our opinions.
OpinionsWe recommend to the annual meeting of shareholders that the profit be appropriated in accordance with the proposal in the Report by the Board of Directors and that the members of the Board of Directors and the President be discharged from liability for the fiscal year. A corporate governance report has been prepared and the statutory in-formation it contains is consistent with the other parts of the annual accounts and con-solidated accounts.
Stockholm January 27, 2014PricewaterhouseCoopers AB
Bo Hjalmarsson Christine RankinAuthorized Public Accountant Authorized Public AccountantPrincipal Auditor

94 SAS Group Annual Report November 2012–October 2013
Share related key figures
2012–2013
Nov–Oct2012
Jan–Oct 2011 2010 2009 2008
Market capitalization, MSEK 6,416 2,122 2,632 7,403 9,944 6,235Number of shares traded, millions1 421.9 200.7 309.8 271.2 79.2 9.2Shares traded, MSEK 6,195 1,509.8 4,900 9,540 11,183 8,936Number of shares, millions 329 329 329 329 2,467.50 164.5Income after tax, SEK per share2 0.54 –2.99 –5.13 –6.74 –8.96 –38.66Cash flow from operating activities, SEK per share2 3.12 7.79 –1.47 –0.47 –10.38 –16.12Dividend, SEK 0 0 0 0 0 0Dividend in % of earnings after tax 0 0 0 0 0 0Dividend yield, % 0 0 0 0 0 0Shareholders’ equity, SEK per share2 33.70 33.91 37.79 43.88 34.62 44.45Total assets, SEK per share2 108.29 111.71 119.10 127.13 129.16 263.61Revenue, SEK per share2 128.21 109.38 125.87 124.83 136.53 321.4
Price-related key figures, SEK
2012–2013
Nov–Oct2012
Jan–Oct 2011 2010 20091 20081
Market capitalization/equity at year-end, % 58 19 21 51 87 85Share price at year-end 19.50 6.45 8.00 22.5 30.23 18.95Highest share price during the year 25.10 9.50 27.80 43.2 43.5 41.13Lowest share price during the year 5.40 5.10 7.50 17.85 6.95 13.35Average share price during the year 13.31 7.13 16.16 25.9 28.75 23.19
1) For 2008–2009, the historic key figures have been adjusted for the rights issues in 2009 and 2010 and reverse split in 2010.2) For 2009–2013, the key figures are calculated based on 329 million shares and for 2008 based on 165.4 million shares.
The 20 largest shareholders in SAS AB1
Oct. 31, 2013Number of
shares Holding, %
The Swedish Government Offices 70,500,000 21.4Norwegian Ministry of Trade, Industry and Fisheries 47,000,000 14.3Statens Administration (FSC), Denmark 47,000,000 14.3Knut and Alice Wallenberg’s Foundation 24,855,960 7.6Fösäkringsaktiebolaget, Avanza Pension 4,894,626 1.5JPM Chase NA 4,427,387 1.3Unionen 4,150,359 1.3Robur Försäkring 2,873,217 0.9CBNY-DFA-INT SML CAP V 2,678,362 0.8Euroclear Bank S.A/N.V, W8-IMY 2,212,552 0.7SSB CL Omnibus AC OM03 (0 PCT), Pension Fund 2,157,129 0.7SEB 2,136,424 0.6JP Morgan Chase BK, W9 2,036,297 0.6CBNY-OLD Westbury Global Opps Fund 1,669,680 0.5Handelsbanken Fonder AB 1,532,544 0.5JPM Chase NA 1,393,438 0.4Nordnet Pensionsförsäkring AB 1,119,060 0.3Engström, Gerald 900,000 0.3Handelsbanken Liv 821,847 0.2SSB+TC Lending Omnibus Fd No OM79 774,846 0.2Other shareholders 103,866,272 31.6Total 329,000,000 100
1) Under Danish law, disclosure is permitted only when the shareholding exceeds 5%.
Distribution of shares
Oct. 31, 2013
No. of share-
holders No. of votes
% of share
capital
% of all share-
holders
1–1,000 49,313 11,843,357 3.6 80.31,001–5,000 9,407 21,496,684 6.5 15.35,001–10,000 1,439 10,786,359 3.3 2.310,001–100,000 1,104 27,784,001 8.4 1.8100,001–1,000,000 103 28,515,725 8.7 0.21,000,001– 17 222,637,035 67.7 0.0Unknown owners 5,936,839 1.8Total 61,383 329,000,000 100 100
Shares traded per exchange
Value, MSEK Number, millions
2012–2013Nov–Oct
2012Jan–Oct
2012–2013Nov–Oct
2012Jan–Oct
Stockholm 4,213 1,181 291.1 156.6Copenhagen 1,586 263 106.1 35.6Oslo 396 66 24.7 8.5Total 6,195 1,510 421.9 200.7
Share data for SAS

95SAS Group Annual Report November 2012–October 2013
Change in share capital1
Event No. of new shares Total no. of shares Nominal value/
share, SEK Nominal share
capital
May 2001 Company registration 50,000 50,000 10 500,000July 2001 Non-cash issue 155,272,395 155,322,395 10 1,553,223,950August 2001 Non-cash issue 6,494,001 161,816,396 10 1,618,163,960May 20052 New share issue 2,683,604 164,500,000 10 1,645,000,000April 2009 Rights issue 2,303,000,000 2,467,500,000 2.5 6,168,750,000April 2010 Rights issue 7,402,500,000 9,870,000,000 0.67 6,612,900,000June 2010 Reverse split - 329,000,000 20.1 6,612,900,000
1) Before SAS AB was formed in May 2001, the SAS Group was listed through SAS Danmark A/S, SAS Norge ASA and SAS Sverige AB.2) Technical change in connection with consolidation to one common share.
Shareholders per exchange
Oct 31, 2013
Oct 31, 2012 2011
Stockholm 21,103 22,668 24,358Copenhagen 37,031 38,457 39,416Oslo 3,249 3,143 3,143Total 61,383 64,268 66,917
Trading codes – share distribution, ISIN code SE0003366871
Reuters BloombergShare
distribution
Stockholm SAS.ST SAS SS 192.3 mill.Copenhagen SAS.CO SAS DC 84.3 mill.Oslo SASNOK.OL SAS NO 52.4 mill.
Analysts who monitor SAS
Scandinavian equity analysts Contact
ABG Sundal Collier Lars HeindorffSwedbank Hans Erik JacobsenHandelsbanken Dan Togo JensenDanske Bank Brian BörstingNordea Finn Bjarke PetersenSydbank Jacob PedersenInternational equity analysts ContactCiti Andrew LightGoldman Sachs Hugo Scott GallHSBC Andrew LobbenbergNomura Andrew Evans
Aircraft fleetThe SAS Group’s fleet of aircraft at October 31, 2013
Age Owned Leased Total In service Parked OrderedLease
orders
Airbus A330/A340/350 11.4 5 6 11 11 0 12 1Airbus A319/A320/A321 8.8 6 18 24 24 0 30 1Boeing 737 NG 11.5 17 64 81 80 1 0 7Boeing 737 Classic 22.4 0 7 7 3 4 0 0Boeing 717 13.2 4 5 9 9 0 0 0McDonnell Douglas MD-80 series - 12 0 12 0 12 0 0Bombardier CRJ900NG 4.2 12 0 12 12 0 0 0Total 10.9 56 100 156 139 17 42 9
Leased-out aircraft
Age Owned Leased Total In service
McDonnell Douglas MD-90 series 16.8 8 0 8 8Bombardier Q400 5.8 0 1 1 1Avro RJ-85 11.9 0 1 1 1Total 15.2 8 2 10 10
In addition, the following aircraft are wet leased: four CRJ200s and two ATRs for SAS Denmark, and two ATRs and four S2000s for SAS Sweden.

96 SAS Group Annual Report November 2012–October 2013
The Group’s operational key figures
Passenger traffic-related key figures
2012–2013
Nov–Oct2012
Jan–Oct 2011 2010 2009 2008 2007 2006 2005 2004
Number of destinations served, scheduled 150 136 128 127 134 157 158 164 147 146Number of flights, scheduled 402,460 338,870 396,134 367,817 380,470 427,201 423,807 552,899 554,838 530,597Number of passengers, total, 000s1 30,436 25,916 28,990 27,096 26,967 30,936 31,381 43,138 41,033 38,253Number of passengers, scheduled, 000s 28,057 23,979 27,206 25,228 24,898 29,000 29,164 39,059 36,312 34,250Available seat kilometers, total (mill.)1 44,629 36,126 40,953 38,851 39,934 45,764 44,433 63,555 62,445 60,173Available seat kilometers, scheduled (mill.) 40,583 32,813 37,003 34,660 35,571 41,993 40,019 54,907 53,689 51,478Revenue passenger kilometers, total (mill.)1 33,451 27,702 30,668 29,391 29,025 33,097 33,082 46,770 44,566 41,287Revenue passenger kilometers, scheduled (mill.) 29,650 24,746 27,174 25,711 25,228 29,916 29,365 39,247 35,864 33,312Load factor, total (%)1 75.0 76.7 74.9 75.6 72.7 72.3 74.5 73.6 71.4 68.6Average passenger distance, total (km) 1,099 1,069 1,058 1,085 1,076 1,070 1,054 1,084 1,086 1,079 Weight-related key figures2
Available tonne kilometers, ATK, total (mill. tonne km) 5,527 4,475 5,089 4,835 5,052 5,991 5,812 7,775 7,614 7,302Available tonne kilometers, scheduled (mill. tonne km) 5,042 4,098 4,604 4,318 4,463 5,291 4,987 6,461 6,376 6,068Available tonne kilometers, other (mill. tonne km) 485 377 485 517 589 700 827 1,314 1,238 1,233Revenue tonne kilometers, RTK, total (mill. tonne km) 3,930 3,201 3,555 3,448 3,327 4,136 4,210 5,496 5,299 4,629Passengers and excess baggage (mill. tonne km) 3,308 2,733 3,018 2,897 2,863 3,268 3,265 4,489 4,298 3,844Total load factor, scheduled (%) 71.1 71.5 69.9 71.3 65.9 69.0 72.4 70.7 69.6 63.4Traffic revenue/revenue tonne kilometers (SEK) 9.53 9.94 10.23 10.42 11.34 10.12 9.72 9.46 8.80 9.39 Key figures for costs and efficiencyTotal unit cost5 0.80 0.81 0.86 0.95 1.02 0.96 0.87 0.78 0.73 0.74Jet-fuel price paid incl. hedging, average (USD/tonne) 1,093 1,116 970 773 831 1,120 786 707 564 434 Revenue-related key figuresPassenger revenue/revenue passenger km, scheduled, yield (SEK) 1.07 1.09 1.12 1.16 1.30 1.27 1.25 1.12 1.10 1.11Passenger revenue/available seat km, scheduled, (SEK) 0.78 0.82 0.82 0.86 0.92 0.91 0.92 0.80 0.73 0.72 Environmental key figuresCO2, gram/passenger km6 1137 118 122 121 127 131 130 131 136 154Climate index3 (Environmental index4 until 2004) 967 98 100 90 94 98 96 95 100 76
1) Total production includes scheduled traffic, charter, ad hoc flights and bonus trips, etc. This means that the figures deviate from the traffic statistics of the respective airlines.2) Excludes Blue1 in 2004. 3) Adjusted from 2005 to reflect changes in the Group. The base year became the full-year 2011 in conjunction with the restructuring program. The result for the January–October 2012 period comprises November 2011–October 2012.4) Refers to Scandinavian Airlines. 5) Only includes aircraft depreciation for the years 2004–2007. 6) Carbon dioxide emissions per passenger kilometer comprising all passengers onboard all flights (scheduled, charter, etc.). 7) Excludes Widerøe.
50
60
70
80
1312111009080706050403
1.0
1.2
1.4
1.6
% SEK
0.6
0.8
1.0
1.2
1312111009080706050403
SEK
Load factor and yield, 2003–2013 Total unit cost, 2003–2013
Load factor, total (%) Passenger revenue/revenue passenger km, scheduled, yield (SEK)
Total unit cost

97SAS Group Annual Report November 2012–October 2013
Ten-year financial overviewFor definitions and concepts refer to page 99.
Statements of income, MSEK 2013 20121 2011 2010 2009 2008 2007 2006 2005 20042
Revenue 42,182 35,986 41,412 41,070 44,918 52,870 50,598 50,152 55,501 58,093Operating income before depreciation 3,503 955 3,019 246 –1,311 997 2,677 2,618 2,548 1,779Depreciation, amortization and impairment –1,658 –1,426 –2,413 –1,885 –1,845 –1,550 –1,457 1,757 –2,170 –2,846Share of income in affiliated companies 25 32 28 12 –258 –147 32 59 76 157Income from sale of shares in subsidiaries and affiliated companies –371 400 - –73 429 - - - 41 5Income from the sale of aircraft and buildings –118 –247 12 –239 –97 4 41 85 182 113Income before tax, EBT 433 –1,245 –1,629 –3,069 –3,423 –969 1,044 177 –246 –1,833Income from discontinued operations - - - - –327 –5,395 –135 4,528 577 -Income, EBT, before capital gains and nonrecurring items in continuing and discontinued operations 775 23 94 –444 –2,247 –1,947 824 1,279 114 –1,701Income, EBT, before capital gains and non-recurring items in continuing operations 775 23 94 –444 –1,754 –339 1,234 727 –106 - Balance sheets, MSEKFixed assets 27,415 29,692 29,883 30,591 29,636 26,840 26,663 31,189 36,439 38,458Current assets, excluding cash and cash equivalents 3,462 4,273 5,494 6,191 8,670 10,741 13,216 9,172 12,893 10,748Cash and cash equivalents 4,751 2,789 3,808 5,043 4,189 5,783 8,891 10,803 8,684 8,595Total shareholders’ equity 11,103 11,156 12,433 14,438 11,389 7,312 17,149 16,388 12,081 11,044Long-term liabilities 11,111 12,111 13,889 13,932 13,069 19,160 11,274 17,847 23,608 25,193Current liabilities 13,414 13,487 12,863 13,455 18,037 16,892 20,347 16,929 22,327 21,564Total assets 35,628 36,754 39,185 41,825 42,495 43,364 48,770 51,164 58,016 57,801
Cash-flow statements, MSEKCash-flow from operating activities 1,028 2,562 –482 –155 –3,414 –2,651 2,866 2,102 1,507 –1,440Investments –1,877 –2,595 –2,041 –2,493 –4,661 –4,448 –2,908 –2,299 –1,827 –3,865Sales of non-current assets, etc. 1,644 1,976 517 697 2,050 1,535 2,695 9,784 2,797 6,853Cash flow before financing activities 795 1,943 –2,006 –1,951 –6,025 –5,564 2,653 9,587 2,477 1,548Rights issue - - - 4,678 5,808 - - - - -Dividend - - - - - - - - - -External financing, net 1,171 –2,961 763 –1,859 –1,524 2,480 –4,492 –7,438 –2,426 –2,016Cash flow for the year 1,966 –1,018 –1,243 868 –1,741 –3,084 –1,839 2,149 51 –468 Key figuresGross profit margin, % 8.3 2.7 7.3 0.6 –2.9 1.9 5.3 5.2 4.6 3.1EBIT margin, % 3.3 –0.8 1.6 –4.7 –6.9 –1.3 2.6 2.1 1.2 –1.4EBT margin, before nonrecurring items in continuing operations, % 1.8 0.1 0.2 –1.1 –3.9 –0.6 2.4 1.4 –0.2 -Return on capital employed (ROCE), %3 6.7 –8.1 –2.2 –7.6 –11.7 –19.6 6.7 18.2 5.0 –1.1Return on equity after tax, %3 1.7 –24.8 –12.0 –17.0 –26.8 –47.6 3.8 37.8 1.4 –14.9Adjusted equity/assets ratio, %4 23 24 26 28 21 13 27 22 15 15
1) As a consequence of the Group’s fiscal year changing to November 1–October 31, the 2012 fiscal year was shortened to the period January 1–October 31. Yield-based key figures are calculated based on income-statement items for a 12-month period.
2) Comparative figures for 2004 have been restated according to IFRS. Errors relating to Spanair’s accounts have been corrected for 2004.3) Includes results from discontinued operations.4) Estimated starting 2007 with leasing costs of continuing operations. Earlier years’ key figures also include leasing costs of discontinued operations.
Definitions and concepts see page 99.
–2,500
–2,000
–1,500
–1,000
–500
0
500
1,000
1,500
Nov 12–Oct 13
12Jan–Oct
111009080706050403
MSEK
0
10
20
30
13Oct
12Oct
111009080706050403
%
EBT1 Adjusted equity/assets ratio, 2003–2013
1) Income, EBT, before capital gains and nonrecurring items in continuing and discontinued operations.

98 SAS Group Annual Report November 2012–October 2013
Financial key figures, MSEK 2013 20121 2011 2010 2009 2008 2007 2006 2005 20042
Income and capital concepts included in CFROIIncome before depreciation, EBITDA, in continuing and discontinued operations 3,503 872 3,019 246 –1,732 –1,232 2,646 3,663 2,984 1,779+ Operating lease costs, aircraft 1,786 1,618 1,560 1,815 2,534 3,186 3,472 3,527 3,133 2,689EBITDAR 5,289 2,490 4,579 2,061 802 1,954 6,118 7,190 6,117 4,468– Operating lease revenue, aircraft –76 –96 –199 –341 –312 –160 –174 –194 –155 –163Adjusted EBITDAR in continuing and discontinued operations 5,213 2,394 4,380 1,720 490 1,794 5,944 6,996 5,962 4,305 Adjusted average capital employed5
+ Total equity 10,671 12,153 14,087 13,045 11,014 13,224 16,687 12,706 11,921 11,823+ Surplus value aircraft –222 –37 –1,305 –1,037 193 –423 –208 371 –161 –674+ Capitalized leasing costs, net (x 7) 11,219 9,827 9,706 11,984 19,502 22,016 23,191 22,567 18,967 18,130– Equity in affiliated companies –321 –309 –300 –300 –567 –755 –1,054 –1,132 –853 –676+ Financial net debt 6,320 6,448 3,957 4,403 5,662 3,163 2,447 11,136 16,119 18,592Adjusted capital employed 27,667 28,082 26,145 28,095 35,804 37,225 41,063 45,648 45,993 47,195Cash Flow Return On Investments CFROI, % 18.8 8.5 16.8 6.1 1.4 4.8 14.5 15.3 13.0 9.1 Other financial dataFinancial income 50 96 224 174 304 660 787 585 492 357Financial expenses –999 –1,055 –1,030 –1,041 –645 –933 –1,041 –1,367 –1,465 –1,399Interest-bearing liabilities 11,510 10,887 13,338 11,897 14,660 16,117 12,042 16,478 26,337 27,280Operating leasing capital4 11,970 10,654 9,527 10,318 13,804 13,573 14,462 23,331 20,846 17,682Financial net debt 4,567 6,549 7,017 2,862 6,504 8,912 1,231 4,134 14,228 17,377Debt/equity ratio3 0.41 0.59 0.56 0.20 0.57 1.22 0.07 0.25 1.18 1.57Adjusted financial net debt (x7)/equity4 1.49 1.54 1.33 0.89 1.70 3.08 0.92 1.68 2.90 3.17Interest expenses/average gross debt, % 7.6 8.1 7.3 6.9 5.6 7.6 7.8 6.1 5.2 4.3Interest-coverage ratio 1.4 –1.6 –0.6 –1.9 –4.4 –5.3 1.8 4.4 1.3 –0.3
1) As a consequence of the Group’s fiscal year changing to November 1–October 31, the 2012 fiscal year was shortened to the period January 1–October 31. Yield-based key figures are calculated based on income-statement items for a 12-month period.
2) Comparative figures for 2004 have been restated according to IFRS. Errors relating to Spanair’s accounts have been corrected for 2004.3) Calculated on financial net debt.4) Estimated starting 2007 with leasing costs of continuing operations, respectively. Earlier years’ key figures also include leasing costs of discontinued operations.5) Includes continuing and discontinued operations.
Definitions and concepts see page 99.
0.50
1.25
2.00
2.75
3.50
Nov 12–Oct 13
12Oct
111009080706050403
0
5
10
15
20
13Oct
12Oct
111009080706050403
%
Adjusted net debt/equity ratio1CFROI1, 2003–2013
1) Adjusted financial net debt (x7)/Equity1) Cash Flow Return On Investments.
Ten-year financial overview, continued

99SAS Group Annual Report November 2012–October 2013
Definitions & conceptsAdjusted capital employed (AV Asset value) Total equity, plus surplus value in the aircraft fleet, plus 7 times the annual cost of operating aircraft leasing, net, plus financial net debt, less equity in affiliated companiesAdjusted debt/equity ratio Financial net debt plus capitalized leasing costs (x7) in relation to equity and non-controlling interests.Adjusted equity assets ratio Equity divided by total capital plus seven times annual operating leasing cost.AEA The Association of European Airlines.Affiliated company Company where the SAS Group’s holding amounts to at least 20% and at the most 50%.AOC Air Operator Certificate.ASK, Available seat kilometers The total number of seats available for passengers multiplied by the number of kilometers which they are flown.ATK, Available tonne kilometers The total number of tonnes of capacity available for the transportation of passengers, freight and mail multiplied by the number of kilometers which this capacity is flown.Available seat kilometers See ASK.Available tonne kilometers See ATK.Block hours Refers to the time from when the aircraft leaves the departure gate until it arrives at the destination gate.CAGR Compound annual growth rateCAPEX (Capital Expenditure) Future payments for aircraft on firm order.Capital employed Total capital according to the balance sheet less non- interest-bearing liabilities.Capitalized leasing costs (x 7) The annual cost of operating leases for aircraft multiplied by seven.Cash flow from operations Cash flow from operating activities before changes in working capital.CASK See unit cost.CFROI Adjusted EBITDAR in relation to AV.Code share When one or more airlines’ flight number is stated in the time-table for a flight, while only one of the airlines operates the flight.CSI Customer Satisfaction Index measures how customers perceive SAS’s services.Debt/equity ratio Financial net debt in relation to equity and non-controlling interests.Dividend yield, average price Dividend as a percentage of the average share price during the year.Earnings per share (EPS) Income after tax divided by the total number of shares.EBIT Operating income.EBIT margin EBIT divided by revenue.EBITDA margin EBITDA divided by revenue.EBITDA, Operating income before depreciation Income before net financial items, tax, depreciation, share of income in affiliated companies and income from the sale of fixed assets.EBITDAR margin EBITDAR divided by revenue.EBITDAR, Operating income before depreciation and leasing costs Oper-ating income before net financial items, tax, depreciation, share of income in affiliated companies, income from the sale of fixed assets and leasing costs for aircraft.EBT Income before tax.EEA European Economic Area.Equity method Shares in affiliated companies are taken up at the SAS Group’s share of equity, taking acquired surplus and deficit values into account.Equity per share Shareholders’ equity attributable to Parent Company shareholders divided by the total number of shares outstanding on the clos-ing date.Equity/assets ratio Book equity plus non-controlling interests in relation to total assets.Finance leasing Based on a leasing contract where the risks and rewards of ownership of the asset remain with the lessee. The asset is reported as a fixed asset in the balance sheet because the lessee has an obligation to pur-chase the asset at the end of the lease. The commitment to pay future leas-ing charges is entered as a liability.
Financial net debt Interest-bearing liabilities less interest-bearing assets excluding net pension funds.Financial net debt, market adjusted (x 7) Financial net debt plus capital-ized leasing costs, multiplied by seven.Financial preparedness Cash and cash equivalents including unutilized credit facilities/ fixed costs.FTE Full-time equivalent.Gross profit margin Operating income before depreciation (EBITDA) in relation to revenue.IATA International Air Transport Association. A global association of more than 200 airlines.ICAO International Civil Aviation Organization. The United Nations’ special-ized agency for international civil aviation.Interest-coverage ratio Operating income plus financial income in relation to financial expenses.Interline revenue Ticket settlement between airlines.LCC Low Cost Carrier.Load factor RPK divided by ASK. Describes the capacity utilization of avail-able seats. Also called occupancy rate. Market capitalization Share price multiplied by the number of shares out-standing.Net debt Interest-bearing liabilities less interest-bearing assets.NPV, Net present value Used to calculate capitalized future costs of oper-ating leases for aircraft, for example.Operating leasing Based on a leasing contract in which the risks and rewards of ownership remain with the lessor and is equivalent to renting. The leasing charges are expensed on a current basis in the statement of income.PASK (unit revenue) passenger revenue/ASK (scheduled).P/CE ratio Average share price divided by cash flow per share after paid tax.P/E ratio Average share price divided by earnings per share after standard tax.RASK Total traffic revenue/Total ASK (scheduled+charter).Regularity The percentage of flights completed in relation to flights sched-uled.Return on shareholders’ equity after tax Net income for the period attrib-uted to shareholders in the Parent Company in relation to average equity ex-cluding non-controlling interests.Return on capital employed (ROCE) % Operating income plus financial income in relation to average capital employed. Capital employed refers to total capital according to the balance sheet less non-interest-bearing liabilities.Revenue passenger kilometers (RPK) See RPK.Revenue tonne kilometers (RTK) See RTK.RPK, Revenue passenger kilometers Number of paying passengers multiplied by the distance they are flown in kilometers.RTK, Revenue tonne kilometers The number of tonnes of paid traffic (passengers, freight and mail) multiplied by the distance this traffic is flown in kilometers.Sale and leaseback Sale of an asset (aircraft, building, etc.) that is then leased back.Total load factor RTK divided by ATK.Total return The sum of the change in share price including dividends.Unit cost, (CASK) total The airline’s total operating costs including aircraft leasing and depreciation adjusted for currency and restructuring costs less non-traffic-related revenue per total ASK (scheduled and charter).Unit revenue See PASK.WACC, Weighted average cost of capital includes the average cost of lia-bilities, equity and operating leases for aircraft. The sources of funds are calculated and weighted in accordance with the current market value of equity and liabilities and the capitalized present value of operating lease costs for aircraft.Wet lease agreement Leasing in of aircraft including crew.Yield Passenger revenue in relation to RPK (scheduled).

100 SAS Group Annual Report November 2012–October 2013
Distribution policyAll reports are available in English and Swedish and can be downloaded at www.sasgroup.net
The SAS Group’s printed Annual Report is distributed only to shareholders who have requested it and can also be ordered via e-mail: [email protected]
Financial calendar 2014Monthly traffic is generally issued on the fifth working day of every month. The detailed financial calendar is available at www.sas-group.net under Investor Relations.
February 18, 2014 Annual General Shareholders’ Meeting
March 14, 2014 Q1 Interim Report 1 (Nov–Jan)
June 18, 2014 Q2 Interim Report 2 (Feb–Apr)
September 10, 2014 Q3 Interim Report 3 (May–Jul)
December 18, 2014 Year-end Report (Nov 2013–Oct 2014)
January/ February 2015
Annual Report & Sustainability Report 2013/2014
Contacts – SAS GroupInvestor Relations: [email protected]
Environment and sustainability: Director Lars Andersen Resare +46 709 97 23 46 [email protected]
Annual General Shareholders’ Meeting 2014The SAS Group’s Annual General Shareholders’ Meeting will be held on February 18 at 3:00 p.m.
Stockholm-Arlanda: Clarion Hotel Arlanda Airport.
For more detailed information, see pages 82–83.
For more information, please refer to www.sasgroup.net

Production: SAS Group and Intellecta CorporateDesign: Intellecta CorporateTranslation: The Bugli Company ABPhotography: Peter Knutson and SAS image bankPrinting: TMG Sthlm (ISO 14000 certified)Environmentally friendly paper: Galerie Art Silk 341 376
NO
RD
IC
ENVIRONMENTALLA
BE
L
PRINTED MATTER
The besT neTwork and schedule in The nordic region
SAS AB (publ) Corp. Reg. No. 556606-8499 Domicile: Stockholm
Street address: Kabinvägen 5, Arlanda, Sweden Postal address: SE-195 87 Stockholm, Sweden Telephone: +46 8 797 00 00
www.sasgroup.net