sas add-in 4.2 for microsoft...
TRANSCRIPT
SAS® Add-In 4.2 for Microsoft Office Getting Started with Data Analysis
SAS® Documentation

The correct bibliographic citation for this manual is as follows: SAS Institute Inc. 2009.SAS ® Add-In 4.2 for Microsoft Office: Getting Started with Data Analysis. Cary, NC: SASInstitute Inc.
SAS® Add-In 4.2 for Microsoft Office: Getting Started with Data AnalysisCopyright © 2009, SAS Institute Inc., Cary, NC, USAISBN 978-1-59994-843-0All rights reserved. Produced in the United States of America.For a hard-copy book: No part of this publication may be reproduced, stored in aretrieval system, or transmitted, in any form or by any means, electronic, mechanical,photocopying, or otherwise, without the prior written permission of the publisher, SASInstitute Inc.For a Web download or e-book: Your use of this publication shall be governed by theterms established by the vendor at the time you acquire this publication.U.S. Government Restricted Rights Notice. Use, duplication, or disclosure of thissoftware and related documentation by the U.S. government is subject to the Agreementwith SAS Institute and the restrictions set forth in FAR 52.227-19 Commercial ComputerSoftware-Restricted Rights (June 1987).SAS Institute Inc., SAS Campus Drive, Cary, North Carolina 27513.1st electronic book, February 2009
1st printing, March 2009SAS® Publishing provides a complete selection of books and electronic products to helpcustomers use SAS software to its fullest potential. For more information about oure-books, e-learning products, CDs, and hard-copy books, visit the SAS Publishing Web siteat support.sas.com/publishing or call 1-800-727-3228.SAS® and all other SAS Institute Inc. product or service names are registered trademarksor trademarks of SAS Institute Inc. in the USA and other countries. ® indicates USAregistration.Other brand and product names are registered trademarks or trademarks of theirrespective companies.

Contents
Chapter 1 � Introduction to the SAS Add-In for Microsoft Office 1What Is the SAS Add-In for Microsoft Office? 1
Benefits to Using the SAS Add-In for Microsoft Office 1
How to Use the SAS Add-In for Microsoft Office 2
Accessibility Features of the SAS Add-In for Microsoft Office 3
Chapter 2 � Learning by Example: Analyzing and Reporting Using SAS 5About the Scenario in This Book 5
Prerequisites for This Scenario 6
How to Get Help for the SAS Add-In for Microsoft Office 6
Chapter 3 � Opening a SAS Data Source in Microsoft Excel 7About the Tasks That You Will Perform 7
Open the Sales Data in an Excel Worksheet 7
Save the Workbook 10
Chapter 4 � Running SAS Tasks to Analyze the Data 11About the Tasks That You Will Perform 11
Compare Sales for Each Product 11
Determine Average Sales, Inventory, and Returns for Each Product 16
Determine Correlation between Sales, Inventory, and Returns 21
Perform a Linear Regression Analysis 26
Save the Workbook 31
Chapter 5 � Analyzing a SAS Data Source in a PivotTable Report 33About the Tasks That You Will Perform 33
Open the Sales Data into a PivotTable Report 33
Create a PivotTable Report for the Sport Shoe Product Line 36
Drilling Down on the Data for Asia in the PivotTable Report 38
Save the Workbook 40
Chapter 6 � Next Steps: A Quick Look at Additional Features 41Working with Published Documents 41
Working with Favorites 44
Sending Results to Microsoft Word or Microsoft PowerPoint 45
Chapter 7 � Recommended Reading 49Recommended Reading 49
Glossary 51
Index 53

iv

1
C H A P T E R
1Introduction to the SAS Add-Infor Microsoft Office
What Is the SAS Add-In for Microsoft Office? 1Benefits to Using the SAS Add-In for Microsoft Office 1
How to Use the SAS Add-In for Microsoft Office 2
Accessibility Features of the SAS Add-In for Microsoft Office 3
What Is the SAS Add-In for Microsoft Office?The SAS Add-In for Microsoft Office extends the functionality of Microsoft Excel,
Microsoft Word, and Microsoft PowerPoint by enabling you to access SAS analytics andSAS reporting functionality without any SAS programming experience. The SAS add-inis designed for users who are familiar with these Microsoft Office programs but whomight be new to SAS.
The SAS add-in includes approximately 80 SAS tasks that enable you to perform avariety of analyses. Examples of analyses that you can perform include linear andnonlinear regressions, multivariate analyses, time series analyses, one-way frequencies,and summary statistics. The SAS add-in enables you to refresh these analyses so thatyour results include the most up-to-date information. You can also easily share theresults with others at your site.
When the SAS add-in is installed on your computer, a SAS tab is automaticallyintegrated into the Ribbon in Excel, Word, and PowerPoint 2007. The SAS tab enablesyou to access the SAS analytics and reporting functionality directly from theseMicrosoft Office programs without having to open a separate SAS interface.
Note: If you are using Microsoft Office 2000-2003, then a SAS menu is automaticallyintegrated into Excel, Word, and PowerPoint. You can perform the tasks in this book ifyou are using Microsoft Office 2000-2003. However, the SAS options are located in theSAS menu rather than the SAS tab. The instructions and screenshots in this book arespecific to Microsoft Office 2007. �
Benefits to Using the SAS Add-In for Microsoft OfficeMost of the SAS add-in functionality is identical in Excel, Word, and PowerPoint; for
example, you can run analyses and reports in all three applications.The SAS add-in extends the functionality in Excel, Word, and PowerPoint by
enabling you to complete the following tasks:� Access SAS data sources as the input data for your analysis. You can use any SAS
data source or any data source available from your SAS server (includingdatabases such as Oracle, Teradata, and DB2) as the input data for an analysis.
2 How to Use the SAS Add-In for Microsoft Office � Chapter 1
� Perform more complex analyses and computations than what is available inMicrosoft Excel. For example, one of the complex analyses that SAS provides is theCanonical Correlation task. This task enables you to examine the relationshipbetween a linear combination of a set of X variables and a linear combination of aset of Y variables. You might run a canonical correlation analysis to determine thedegree of correspondence between a set of job characteristics and a set of measuresof employee satisfaction. This extends the correlation analysis that is available inExcel. You can run these complex analyses and computations in Excel, Word, orPowerPoint.
� Run custom analyses that were developed by others at your company. Using theSAS add-in, you can also open reports that were developed by SAS EnterpriseGuide or SAS Web Report Studio users at your site. Some of these reports mightrun programs called SAS Stored Processes. These programs are customized SAScode that is developed by business analysts or your IT department. Running theseprograms enables you to quickly generate a custom report without writing anySAS code.
� Refresh the content in the Excel worksheet, Word document, or PowerPointpresentation on demand or automatically at a specified time. Scheduling when thecontent is refreshed enables you to have the most up-to-date data and reportswhen you need it.
� Publish the results to a central location. By publishing a document, you can shareit with others without having to e-mail it. If you publish the document to ametadata repository, then you can perform an impact analysis on the document.Impact analysis enables you to see where a data source came from and the itemsthat are dependent on this source. This analysis enables you to know howchanging a data source might affect other documents.
Additional functionality is available in Excel. In Microsoft Excel, you can alsocomplete the following tasks:
� Access and view data sources that exceed the 1,048,576 record limitation inMicrosoft Excel 2007. (In Microsoft Excel 2000-2003, this record limit is 65,536.)The SAS add-in does its processing on the server, which enables it to by-pass therecord limitation in Excel.
� Copy data to a SAS server. You can copy an Excel data source or a SAS datasource to the SAS server. After a data source is copied to a SAS server, it becomesa SAS data set. This enables you to share Excel data with Word and PowerPointusers at your site. This functionality also enables Excel users to updateinformation in a SAS data source and upload it to the SAS server.
� Send the results from an analysis that you ran in Excel to a Word document orPowerPoint presentation. For example, you ran an analysis of your company’ssales for this year, and now you need to give a presentation of the results. Usingthis functionality in Excel, you can select which results to include in a PowerPointpresentation. This saves you time because you need to run the analysis only once.
This book explores some of the basic tasks that you can perform in Excel.
How to Use the SAS Add-In for Microsoft OfficeWhen you open Microsoft Excel 2007, you should see a SAS tab in the Ribbon. You
access the SAS add-in from the menu options on this tab.
Note: If you do not see a SAS tab, then you might not have the SAS add-in installed.For help, contact the SAS support personnel at your site. �

Introduction to the SAS Add-In for Microsoft Office � Accessibility Features of the SAS Add-In for Microsoft Office 3
Display 1.1 The SAS Tab in Microsoft Excel
You can perform a variety of tasks using the SAS add-in. The following processbriefly explains how you would run a SAS analysis:
1 Open Microsoft Excel.
2 Select the analysis that you want to perform.
Note: After you select the analysis, you might be prompted to log in to the SASserver if you have not previously logged in during the current session. You mustbe connected to a SAS server to run an analysis or to access a SAS data source. �
3 Select the data source that you want to use in the analysis. In Excel, you can usedata in an existing Excel worksheet or in a SAS data source. If you select a SASdata source, you can choose to filter and sort the data before the analysis.
Note: If the SAS data source is open in an Excel worksheet, then the task usesthe filter and sort criteria that you specified when opening the data source. �
4 Select the options in the analysis that you want to use and then run the analysis.5 Specify the location of the output. For example, in Excel you can choose to include
the results in the existing worksheet, in a new worksheet, or in a new workbook.
The results automatically open in Excel in the location that you chose.
Note: The SAS add-in is also available in Microsoft Word and PowerPoint. �
Accessibility Features of the SAS Add-In for Microsoft OfficeThe SAS Add-In for Microsoft Office includes accessibility and compatibility features
that improve usability of the product for users with disabilities. These features arerelated to accessibility standards for electronic information technology adopted by theU.S. Government under Section 508 of the U.S. Rehabilitation Act of 1973, as amended.For more information about the accessibility of the SAS Add-In for Microsoft Office, seethe online Help.
If you have questions or concerns about the accessibility of SAS products, send e-mailto [email protected].

4
5
C H A P T E R
2Learning by Example: Analyzingand Reporting Using SAS
About the Scenario in This Book 5Prerequisites for This Scenario 6
How to Get Help for the SAS Add-In for Microsoft Office 6
About the Scenario in This BookThis book is intended for Microsoft Excel 2007 users. Each topic in this book builds
on the previous topic, so you must work through the chapters in sequence.For the purpose of the scenario in this book, you are a data analyst for a company
that sells men’s and women’s shoes worldwide. You have been asked to analyze thecompany’s global sales for 2008. The data is saved as a SAS data source. Your companyrecently purchased the SAS Add-In for Microsoft Office, so you can now access SASdata sources from Excel. You are an experienced Excel user, but are new to SAS.
The next three chapters provide step-by-step instructions for analyzing a data sourceand creating an Excel workbook that can be shared with others at your site. During thefirst part of the scenario, you will open the SAS data source that contains yourcompany’s 2008 sales data into an Excel worksheet. Then you will run four SAS tasksto analyze the data. Running these SAS tasks will enable you to answer the followingquestions:
� Which product had the highest sales in 2008? Which product had the lowest sales?� What are the average total sales, average total inventory, and average returns for
each product?� Is there a correlation between the total sales and inventory and returns for each
product?� Which parameters (inventory, returns, and number of stores) determine the total
sales for a product?
After answering these questions, you are asked to analyze the sales for the productline with the lowest sales. During this second part of the scenario, you will open theSAS data source into a PivotTable report to answer the following questions:
� Which regions have sales less than $10,000?� Which region has the lowest sales? What are the sales and inventory costs for
each subsidiary in that region?
By the end of this scenario, you will have an Excel worksheet that you can publish toa common repository, so it can be viewed by other SAS add-in users at your site.
6 Prerequisites for This Scenario � Chapter 2
Prerequisites for This ScenarioBy the time that you are ready to perform the tasks in this book, administrators at
your site should have installed and configured all necessary components of the SASEnterprise Intelligence Platform. You must also have the following set up:
� Microsoft Office 2007 installed on your desktop.� Permissions to access the SAS Metadata Server. SAS support personnel at your
site set these permissions. Contact SAS support personnel at your site for thename and location of the SAS Metadata Server.
� A metadata configuration file to specify which SAS Metadata Server you willconnect to by default. This file enables you to access SAS data sources on remoteservers. For more information about setting up a metadata configuration file, seethe online Help for the SAS add-in.
� Access to the SHOES data source that is available in the SASHELP library. Thisis the data source that you will be using during the analysis. The SASHELPlibrary ships with the SAS Add-In for Microsoft Office. If you do not have access tothis SAS library, contact the SAS support personnel at your site.
How to Get Help for the SAS Add-In for Microsoft OfficeUse any of the following methods to get Help for the SAS Add-In for Microsoft Office:� In the Ribbon, click the SAS tab. In the Manage group, click Help and select SAS
Add-In for Microsoft Office Help.� Press F1 in most application windows and dialog boxes.
7
C H A P T E R
3Opening a SAS Data Source inMicrosoft Excel
About the Tasks That You Will Perform 7Open the Sales Data in an Excel Worksheet 7
Save the Workbook 10
About the Tasks That You Will Perform
To open and view the data that you will be using in the analysis, you will performthe following main tasks:
1 Select the data source to open.
Note: In this scenario, you are accessing a SAS data source from the SAS server.However, you can use the SAS add-in to access data from a database, such asOracle, Teradata, and DB2. In Excel, you can also use Excel worksheets as thedata source. �
2 For the data source, select the following:
� the variables to include in the output
� the sorting order for the data
� the output location for the data
Open the Sales Data in an Excel Worksheet
To open the SHOES data source (which is available in the SASHELP library) inExcel, follow these steps:
1 Select Start � Programs � Microsoft Office � Microsoft Office Excel 2007.
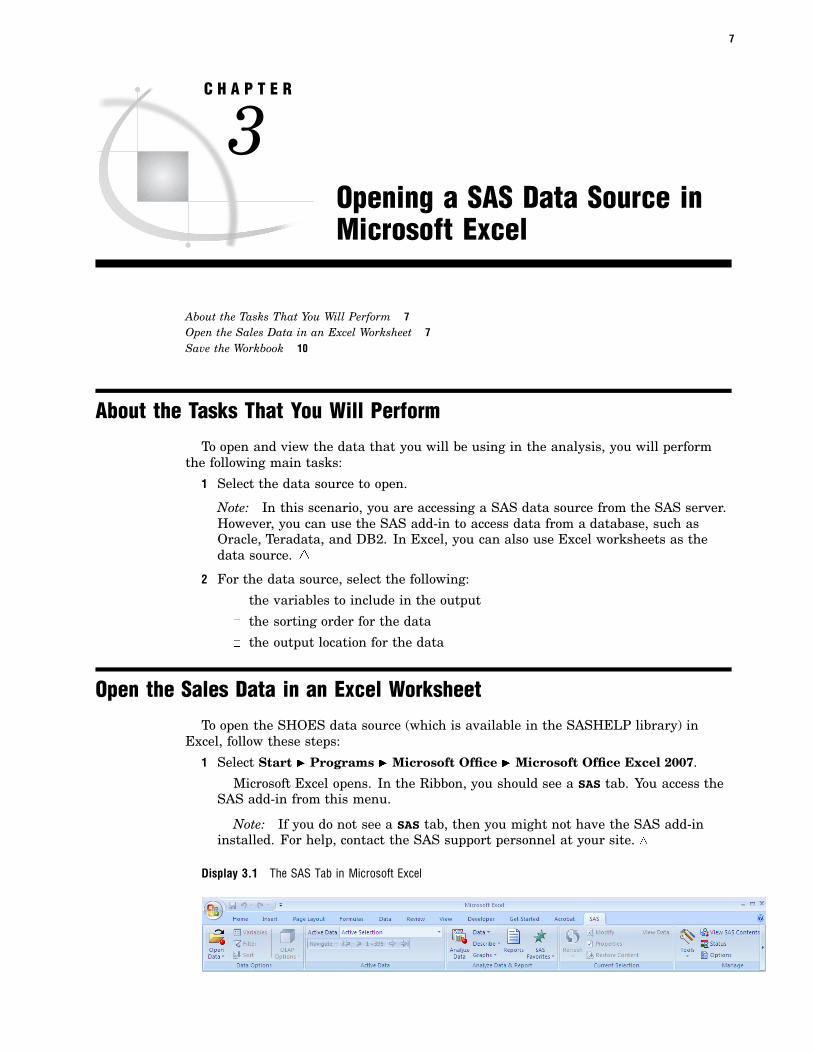
Microsoft Excel opens. In the Ribbon, you should see a SAS tab. You access theSAS add-in from this menu.
Note: If you do not see a SAS tab, then you might not have the SAS add-ininstalled. For help, contact the SAS support personnel at your site. �
Display 3.1 The SAS Tab in Microsoft Excel

8 Open the Sales Data in an Excel Worksheet � Chapter 3
2 In the Ribbon, select the SAS tab. In the Data Options group, click Open Dataand select Into Worksheet. The Open Data Source window opens.
3 Click to select the SAS server that you want to use. The Open Data Sourcewindow now displays the libraries on the selected server.
4 Select SASHELP and click Open. The Open Data Source window now displays thecontents of the SASHELP library.
Note: The location of the SASHELP library is dependent on how SAS wasinstalled at your site. If you cannot find the SASHELP library, contact the SASsupport personnel at your site. �
5 In the SASHELP library, select the SHOES data source and click Open. The ModifyData Source window opens.
6 On the Variables tab, select the variables that you want to include in the finaloutput. You can also specify the order of the variables.

Opening a SAS Data Source in Microsoft Excel � Open the Sales Data in an Excel Worksheet 9
Click to move all the variables from the Available list box to theSelected list box. Select the variables so they appear in the following order:
Click the Sort tab and continue.7 On the Sort tab, you can specify the order of the rows in the output.
Use the drop-down lists to specify the following sort order:
Click the Output Location tab and continue.8 On the Output Location tab, you can select the location for the final output.
By default, the data source is opened in a new worksheet. In the Named box,delete SASHELP.SHOES and type Worldwide Shoe Sales.
Click OK. The results open in a new worksheet called Worldwide Shoe Sales.

10 Save the Workbook � Chapter 3
As you scroll through the data, you see the following:� Ten regions are represented: Africa, Asia, Canada, Central America/Caribbean,
Eastern Europe, Middle East, Pacific, South America, United States, and WesternEurope.
� There are eight product types: Boot, Men’s Casual, Men’s Dress, Sandal, Slipper,Sport Shoe, Women’s Casual, and Women’s Dress.
� For each Region, the data is divided into product and subsidiary.� For each subsidiary, the data contains the number of stores that sell each product,
the total sales, total inventory, and total returns for the product.
Save the WorkbookTo save the workbook, follow these steps:
1 Click and select Save As � Excel Workbook. The Save As dialog boxopens.
2 From the Save in drop-down list, select C:\My Documents.3 Type Shoe Sales 2008 in the File name box.4 Click Save to save the workbook.
You are now ready to analyze the data source. For the next steps, see Chapter 4,“Running SAS Tasks to Analyze the Data,” on page 11.
Tip: After opening a data source in Excel, you do not have to save the workbookbefore analyzing the data.

11
C H A P T E R
4Running SAS Tasks to Analyzethe Data
About the Tasks That You Will Perform 11Compare Sales for Each Product 11
Determine Average Sales, Inventory, and Returns for Each Product 16
Determine Correlation between Sales, Inventory, and Returns 21
Perform a Linear Regression Analysis 26
Save the Workbook 31
About the Tasks That You Will PerformThese tasks assume that you have the SHOES data source open in a Microsoft Excel
worksheet. For these steps, see Chapter 3, “Opening a SAS Data Source in MicrosoftExcel,” on page 7.
To analyze the data, you will perform the following main tasks:1 Create a bar chart to compare the sales of each product and to determine which
products have the highest and lowest sales.2 Use summary statistics to determine the average total sales, average total
inventory, and average returns for each product.3 Determine whether there is any correlation between the total sales and total
inventory and total returns for each product.4 Use a linear regression to determine whether the parameter estimates for
inventory, returns, and number of stores should be included in a linear regressionmodel of sales.
Compare Sales for Each ProductTo create a bar chart that shows the sales for each product, follow these steps:1 From the Active Data drop-down list on the SAS tab in the Ribbon, verify that
SASHELP.SHOES is the active data source that you opened in the previouschapter.
Note: In the Active Data drop-down list, the name of the SAS server appearsbefore the name of the data source. The name of the server depends on the SASserver at your site. �
12 Compare Sales for Each Product � Chapter 4
Tip: In Excel, data sources that are open are at the top of the Active Datadrop-down list and have an exclamation point (!) before the name. By default, thecurrent selection is the active data source. Depending on where your cursor is in aworksheet, you might have a different active data source.
2 In the Analyze Data & Report group, click Graphs and select Bar ChartWizard. The Bar Chart Wizard opens.
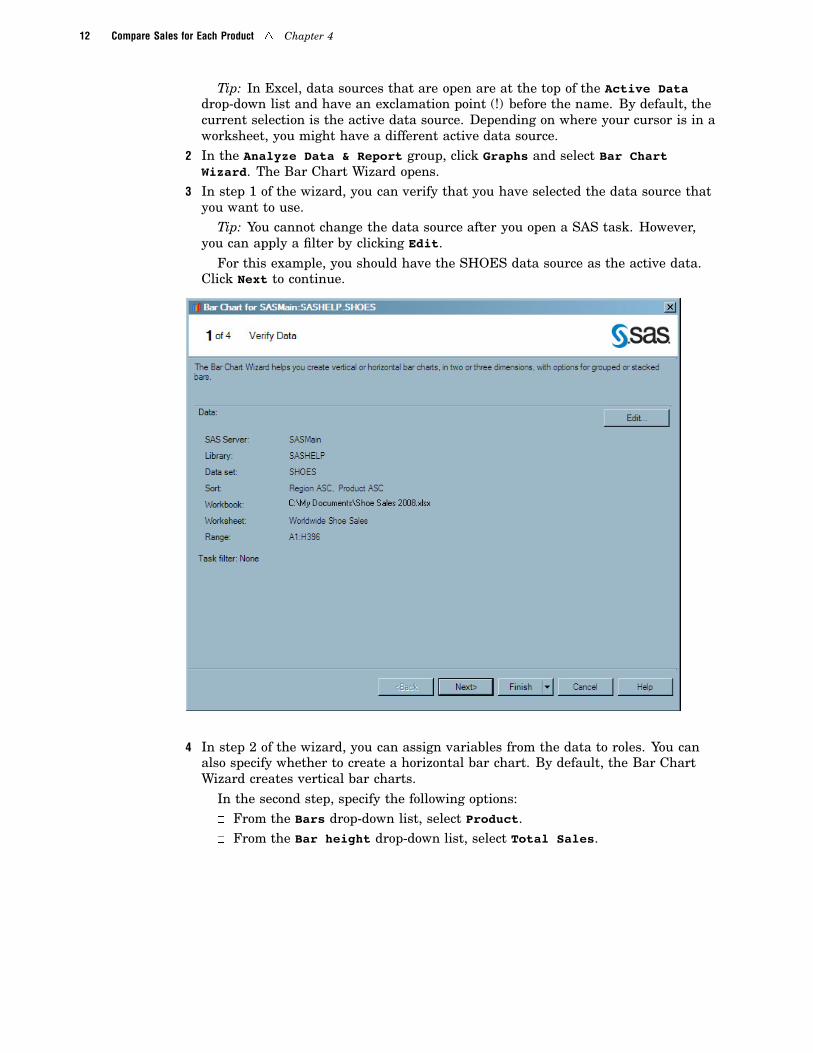
3 In step 1 of the wizard, you can verify that you have selected the data source thatyou want to use.
Tip: You cannot change the data source after you open a SAS task. However,you can apply a filter by clicking Edit.
For this example, you should have the SHOES data source as the active data.Click Next to continue.
4 In step 2 of the wizard, you can assign variables from the data to roles. You canalso specify whether to create a horizontal bar chart. By default, the Bar ChartWizard creates vertical bar charts.
In the second step, specify the following options:� From the Bars drop-down list, select Product.� From the Bar height drop-down list, select Total Sales.

Running SAS Tasks to Analyze the Data � Compare Sales for Each Product 13
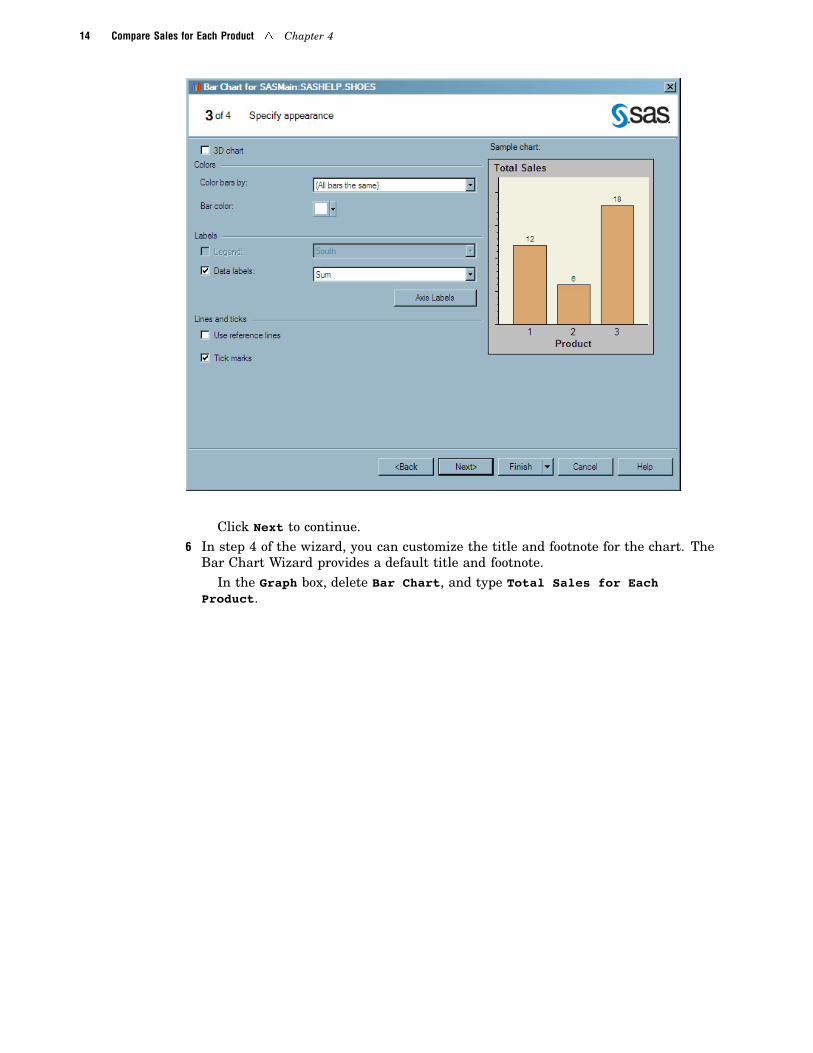
Click Next to continue.5 In step 3 of the wizard, you can specify the appearance of the chart.
In the third step, select the Data labels check box, and then select Sum fromthe drop-down list.
14 Compare Sales for Each Product � Chapter 4
Click Next to continue.6 In step 4 of the wizard, you can customize the title and footnote for the chart. The
Bar Chart Wizard provides a default title and footnote.In the Graph box, delete Bar Chart, and type Total Sales for Each
Product.

Running SAS Tasks to Analyze the Data � Compare Sales for Each Product 15
Click Finish. The Choose Location dialog box opens.7 From the Choose Location dialog box, select New worksheet and in the Named box,
type Total Sales for Each Product.
Click OK. The results open in a new worksheet called Total Sales for EachProduct.

16 Determine Average Sales, Inventory, and Returns for Each Product � Chapter 4
The bar chart shows the following:
� Men’s Casual shoes had the highest sales with $7,933,707.
� Sport Shoes had the lowest sales with $651,467.
Determine Average Sales, Inventory, and Returns for Each Product
To create an analysis that shows the average sales, inventory, and returns for eachproduct, follow these steps:
1 From the Active Data drop-down list on the SAS tab in the Ribbon, verify thatSASHELP.SHOES is the active data source.
2 In the Analyze Data & Report group, click Describe and select SummaryStatistics Wizard. The Summary Statistics Wizard opens.
3 In step 1 of the wizard, you can verify that you have selected the data source thatyou want to use.
Tip: You cannot change the data source after you have opened a SAS task.However, you can apply a filter by clicking Edit.
For this example, you should have the SHOES data source as the active data.Click Next to continue.

Running SAS Tasks to Analyze the Data � Determine Average Sales, Inventory, and Returns for Each Product 17
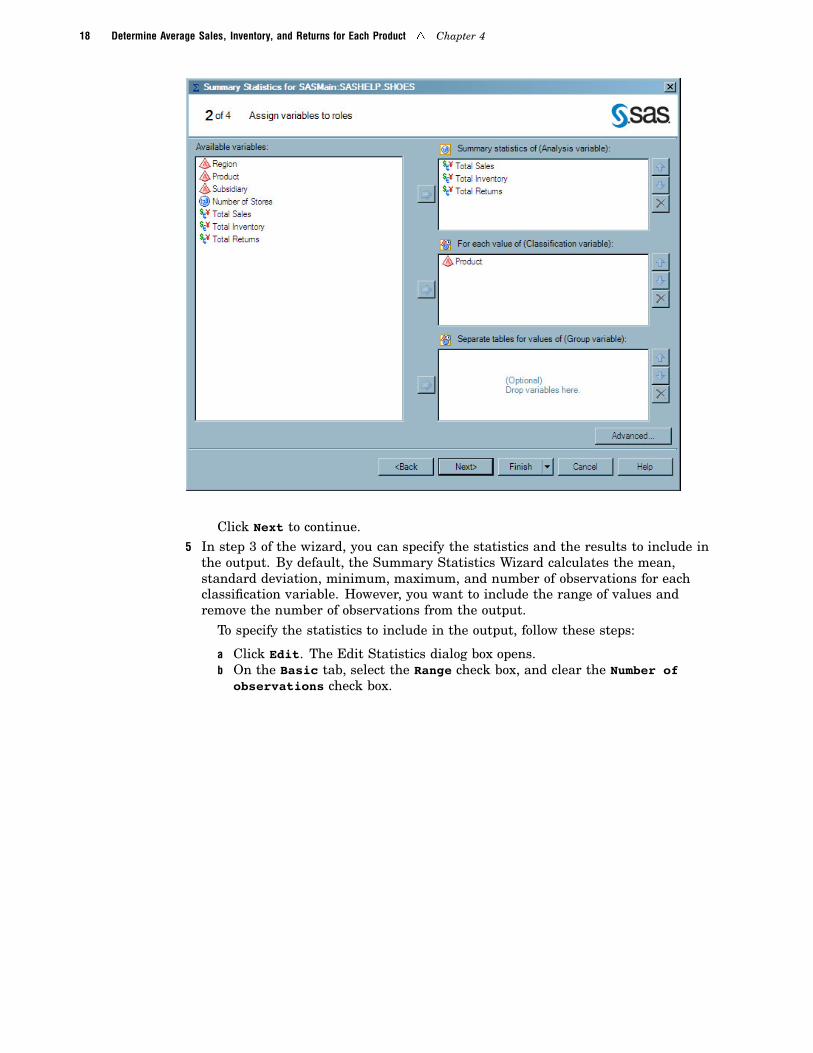
4 In step 2 of the wizard, you can assign variables from the data to roles.Select the following variables in the Available variables pane and drag and
drop them to the following roles:
Variables Role
Total Sales, TotalInventory, Total Returns
Summary statistics of (Analysis variable)
Product For each value of (Classification variable)
18 Determine Average Sales, Inventory, and Returns for Each Product � Chapter 4
Click Next to continue.5 In step 3 of the wizard, you can specify the statistics and the results to include in
the output. By default, the Summary Statistics Wizard calculates the mean,standard deviation, minimum, maximum, and number of observations for eachclassification variable. However, you want to include the range of values andremove the number of observations from the output.
To specify the statistics to include in the output, follow these steps:
a Click Edit. The Edit Statistics dialog box opens.b On the Basic tab, select the Range check box, and clear the Number of
observations check box.

Running SAS Tasks to Analyze the Data � Determine Average Sales, Inventory, and Returns for Each Product 19
c Click OK to return to step 3 of the Summary Statistics Wizard.
The statistics that are listed in the Summary Statistics Wizard should now beas shown:
Click Next to continue.
6 In step 4 of the wizard, you can customize the title and footnote for the output.
In the Analysis box, delete Summary Statistics Results and type SummaryStatistics for Each Product.
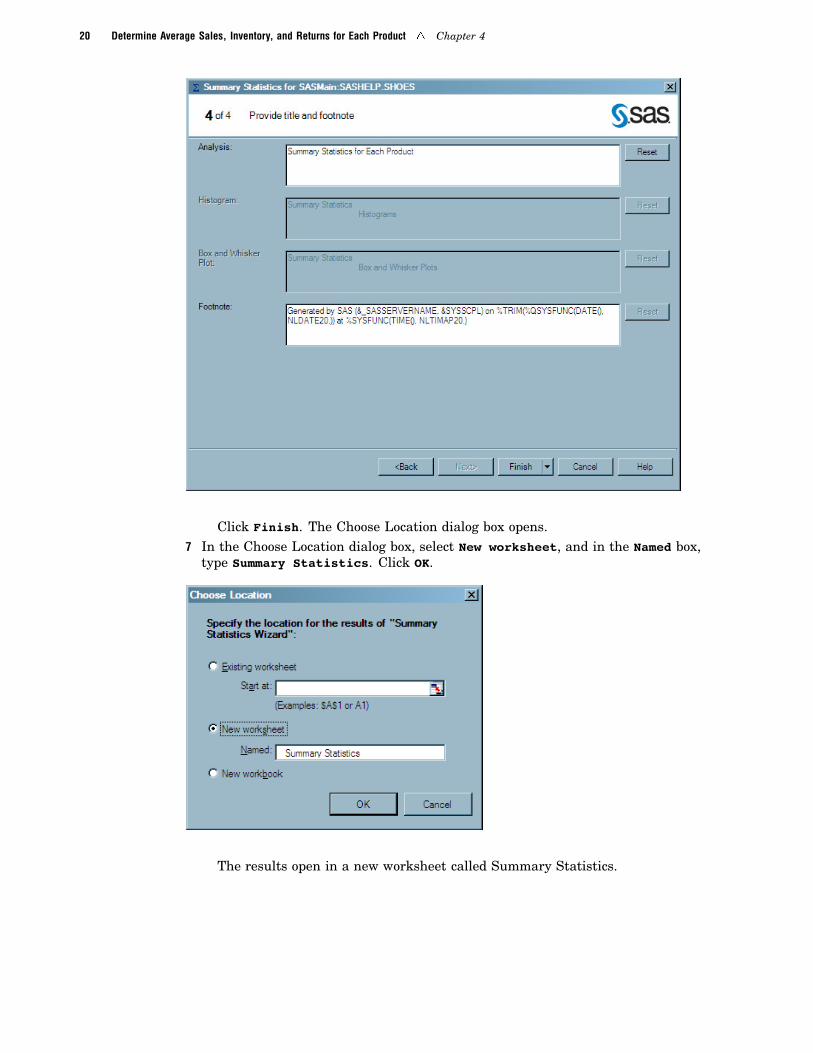
20 Determine Average Sales, Inventory, and Returns for Each Product � Chapter 4
Click Finish. The Choose Location dialog box opens.7 In the Choose Location dialog box, select New worksheet, and in the Named box,
type Summary Statistics. Click OK.
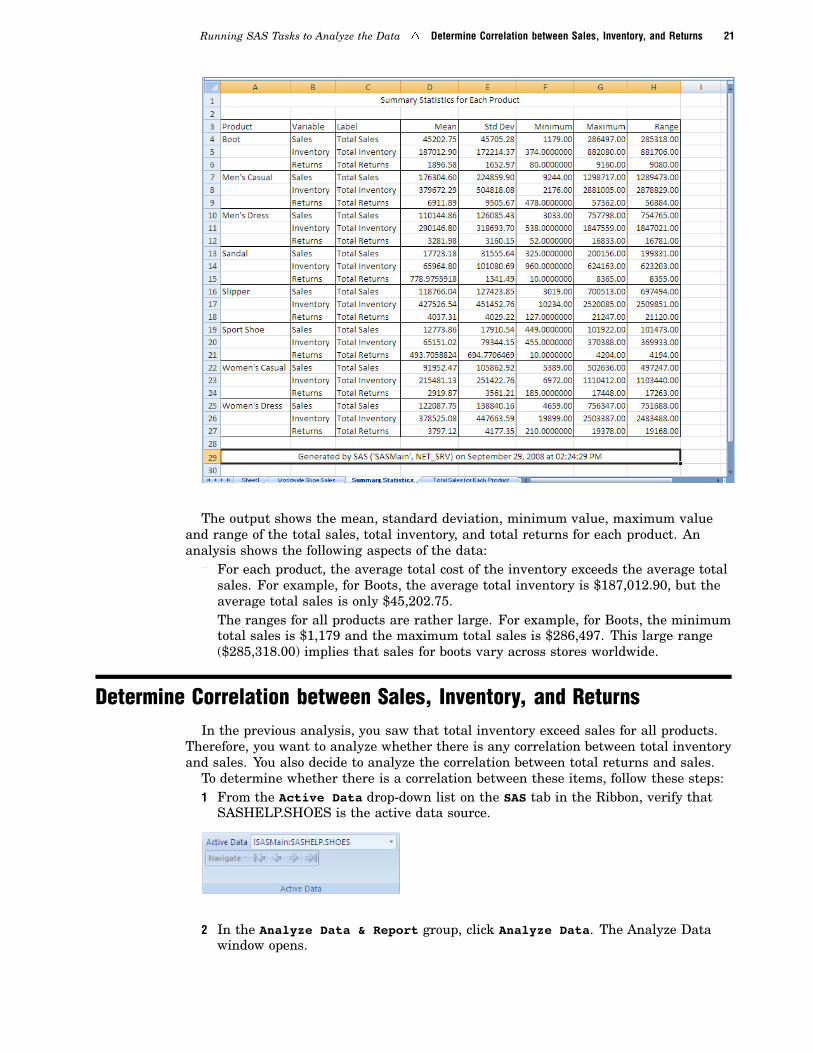
The results open in a new worksheet called Summary Statistics.
Running SAS Tasks to Analyze the Data � Determine Correlation between Sales, Inventory, and Returns 21
The output shows the mean, standard deviation, minimum value, maximum valueand range of the total sales, total inventory, and total returns for each product. Ananalysis shows the following aspects of the data:
� For each product, the average total cost of the inventory exceeds the average totalsales. For example, for Boots, the average total inventory is $187,012.90, but theaverage total sales is only $45,202.75.
� The ranges for all products are rather large. For example, for Boots, the minimumtotal sales is $1,179 and the maximum total sales is $286,497. This large range($285,318.00) implies that sales for boots vary across stores worldwide.
Determine Correlation between Sales, Inventory, and ReturnsIn the previous analysis, you saw that total inventory exceed sales for all products.
Therefore, you want to analyze whether there is any correlation between total inventoryand sales. You also decide to analyze the correlation between total returns and sales.
To determine whether there is a correlation between these items, follow these steps:1 From the Active Data drop-down list on the SAS tab in the Ribbon, verify that
SASHELP.SHOES is the active data source.
2 In the Analyze Data & Report group, click Analyze Data. The Analyze Datawindow opens.
22 Determine Correlation between Sales, Inventory, and Returns � Chapter 4
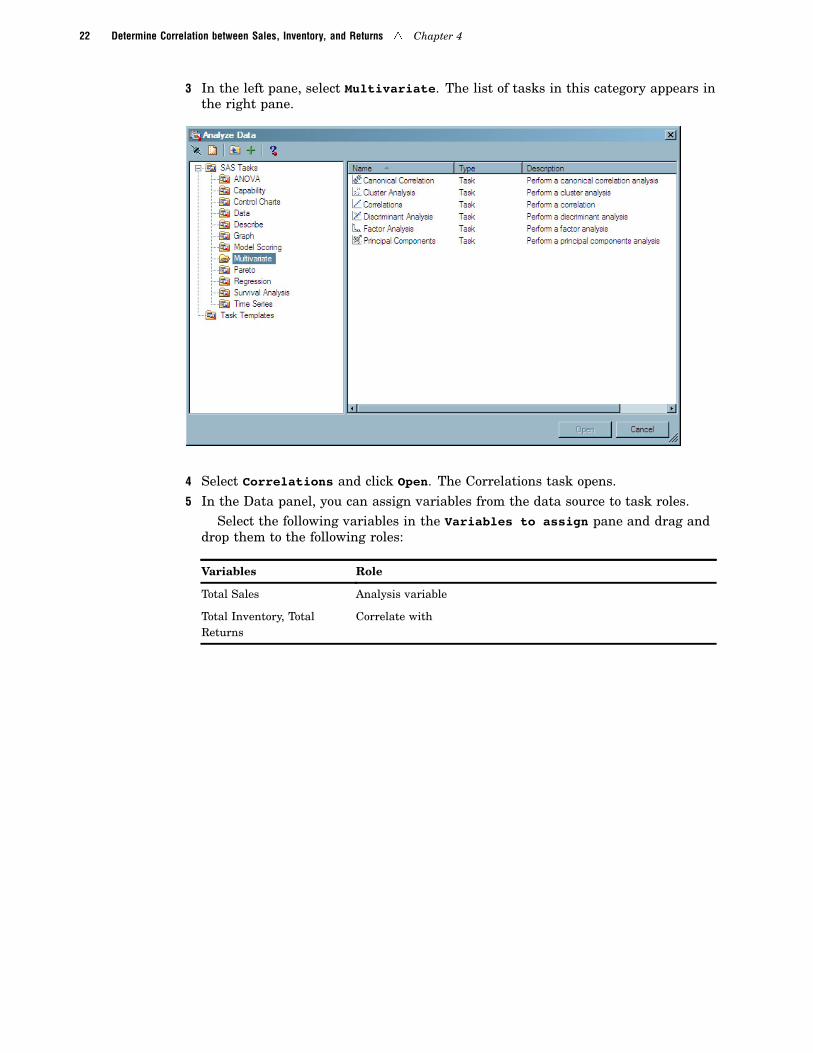
3 In the left pane, select Multivariate. The list of tasks in this category appears inthe right pane.
4 Select Correlations and click Open. The Correlations task opens.5 In the Data panel, you can assign variables from the data source to task roles.
Select the following variables in the Variables to assign pane and drag anddrop them to the following roles:
Variables Role
Total Sales Analysis variable
Total Inventory, TotalReturns
Correlate with

Running SAS Tasks to Analyze the Data � Determine Correlation between Sales, Inventory, and Returns 23
In the selection pane, select Results and continue.6 In the Results panel, you can specify whether to include any plots in the output
and what statistics to include in the output. You can also view a summary of thecorrelations for the task.
For this analysis, select the Create a scatter plot for each correlationpair check box.

24 Determine Correlation between Sales, Inventory, and Returns � Chapter 4
In the selection pane, select Titles and continue.7 In the Titles panel, you can customize the title and footnote for the output.
To create a custom title for the analysis, follow these steps:
a In the Section area, select Analysis Titles.b In the Text for section: Analysis Titles area, clear the Use default
text check box.c Delete the default text and type Correlation of Sales to Inventory and
Returns.
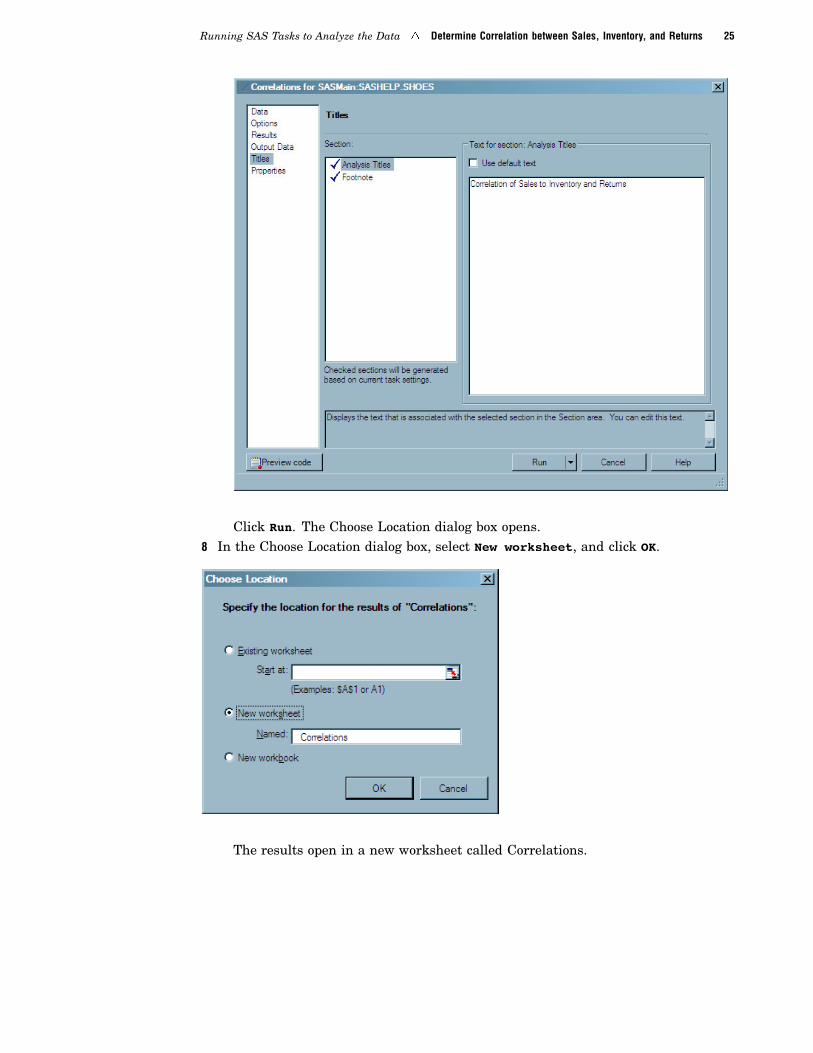
Running SAS Tasks to Analyze the Data � Determine Correlation between Sales, Inventory, and Returns 25
Click Run. The Choose Location dialog box opens.8 In the Choose Location dialog box, select New worksheet, and click OK.
The results open in a new worksheet called Correlations.
26 Perform a Linear Regression Analysis � Chapter 4
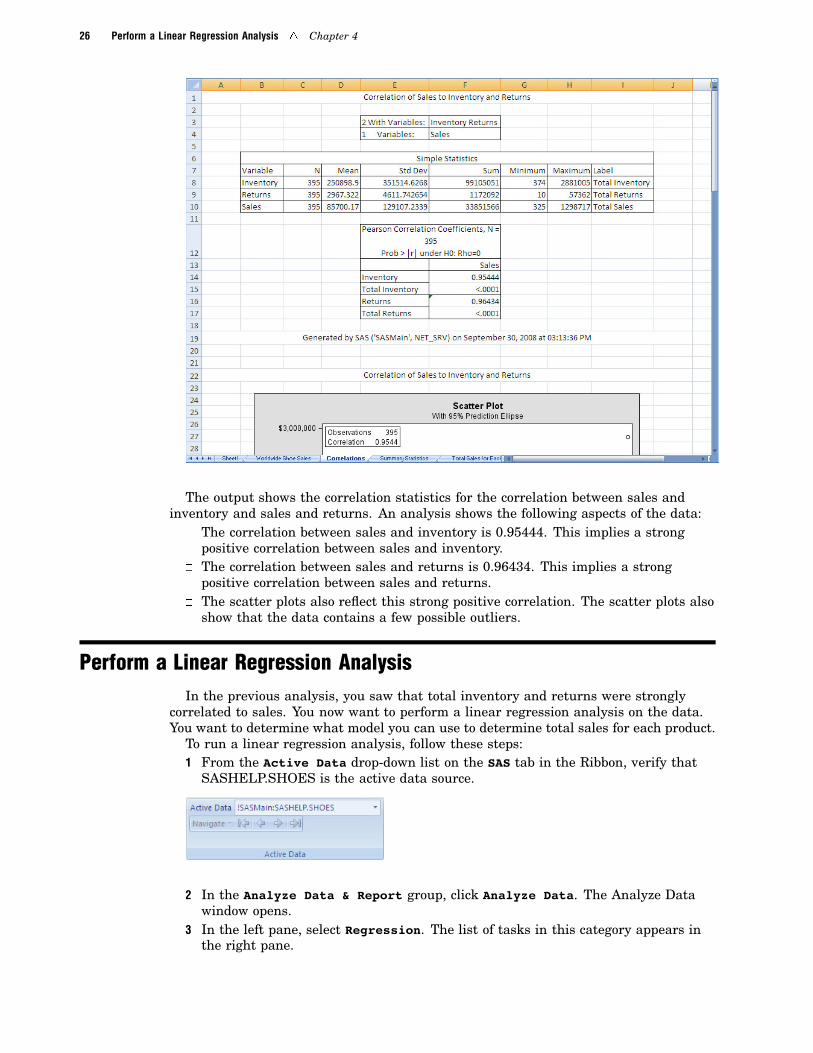
The output shows the correlation statistics for the correlation between sales andinventory and sales and returns. An analysis shows the following aspects of the data:
� The correlation between sales and inventory is 0.95444. This implies a strongpositive correlation between sales and inventory.
� The correlation between sales and returns is 0.96434. This implies a strongpositive correlation between sales and returns.
� The scatter plots also reflect this strong positive correlation. The scatter plots alsoshow that the data contains a few possible outliers.
Perform a Linear Regression AnalysisIn the previous analysis, you saw that total inventory and returns were strongly
correlated to sales. You now want to perform a linear regression analysis on the data.You want to determine what model you can use to determine total sales for each product.
To run a linear regression analysis, follow these steps:1 From the Active Data drop-down list on the SAS tab in the Ribbon, verify that
SASHELP.SHOES is the active data source.
2 In the Analyze Data & Report group, click Analyze Data. The Analyze Datawindow opens.
3 In the left pane, select Regression. The list of tasks in this category appears inthe right pane.
Running SAS Tasks to Analyze the Data � Perform a Linear Regression Analysis 27
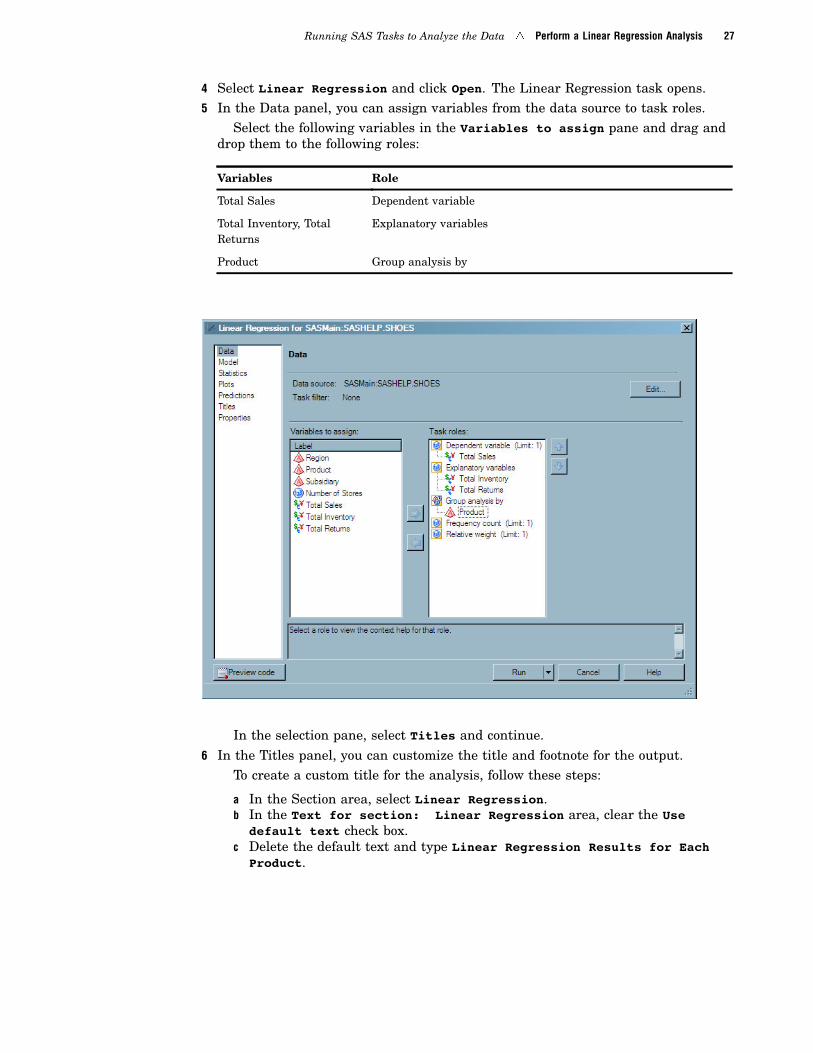
4 Select Linear Regression and click Open. The Linear Regression task opens.5 In the Data panel, you can assign variables from the data source to task roles.
Select the following variables in the Variables to assign pane and drag anddrop them to the following roles:
Variables Role
Total Sales Dependent variable
Total Inventory, TotalReturns
Explanatory variables
Product Group analysis by
In the selection pane, select Titles and continue.6 In the Titles panel, you can customize the title and footnote for the output.
To create a custom title for the analysis, follow these steps:
a In the Section area, select Linear Regression.b In the Text for section: Linear Regression area, clear the Use
default text check box.c Delete the default text and type Linear Regression Results for Each
Product.

28 Perform a Linear Regression Analysis � Chapter 4
Click Run. The Choose Location dialog box opens.7 In the Choose Location dialog box, select New worksheet and click OK.
The results open in a new worksheet called Linear Regression.

Running SAS Tasks to Analyze the Data � Perform a Linear Regression Analysis 29
Before running this analysis, you assumed a significance level of 0.05. Therefore, anyparameter estimates that have a p-value less than 0.05 should be included in themodel. Any parameter estimates that have a p-value greater than 0.05 should not beincluded in the model.
The following analysis of the Boot product shows you how to analyze the results foreach product.
� You can use the Pr>|t| column in the Parameter Estimates table to determinewhether an input is statistically significant and should be included in the model.
The total inventory and total returns have a p-value less than 0.05, so theseinputs can be included in the model.

30 Perform a Linear Regression Analysis � Chapter 4
� After you have determined that an input is statistically significant, you can usethe value in the Parameter Estimate column to determine the impact that theseinputs have.
The impact that each of these inputs have on total sales is as follows:� For each $1.00 spent on inventory, total sales increase by $0.10.� For each $1.00 of returns, total sales increase by $17.07. While at first this result
was confusing, you remembered that some of your stores charge a 20% re-stockingfee on all returns. This means that your company still makes some money off ofreturned items.

Running SAS Tasks to Analyze the Data � Save the Workbook 31
You can perform the same analysis on the other products.
Save the Workbook
To save the workbook, click in the Quick Access Toolbar.You have now finished your initial analysis of your company’s 2008 sales data. You
can now use a PivotTable report to analyze a specific product line. For more information,see Chapter 5, “Analyzing a SAS Data Source in a PivotTable Report,” on page 33.

32

33
C H A P T E R
5Analyzing a SAS Data Source ina PivotTable Report
About the Tasks That You Will Perform 33Open the Sales Data into a PivotTable Report 33
Create a PivotTable Report for the Sport Shoe Product Line 36
Drilling Down on the Data for Asia in the PivotTable Report 38
Save the Workbook 40
About the Tasks That You Will PerformDuring the first part of the scenario, you saw that sports shoes had the lowest sales.
After your initial report, your managers asked you to identify the regions that had sportshoe sales less than $10,000, and to perform a more in-depth analysis into the regionwith the lowest sales. Because you are in Microsoft Excel, you can perform this analysisusing a PivotTable report.
To analyze the Sport Shoe product line, you will perform the following main tasks:1 Select the data source to open.
Note: In this scenario, you are accessing a SAS data source from the SAS server.However, you can use the SAS add-in to access data from a database, such asOracle, Teradata, and DB2. In Excel, you can also use Excel worksheets as thedata source. �
2 For the data source, select the following:� the variables to include in the output� a filter to subset the data� the output location for the PivotTable report
Open the Sales Data into a PivotTable ReportTo open the SHOES data source (which is available from the SASHELP library) into
a PivotTable report, follow these steps:1 In the Ribbon, select the SAS tab. In the Data Options group, click Open Data
and select Into PivotTable. The Open into PivotTable window opens.
2 Click to select the SAS server that you want to use. The Open Data Sourcewindow now displays the libraries on the selected server.
3 Select SASHELP and click Open. The Open Data Source window now displays thecontents of the SASHELP library.
34 Open the Sales Data into a PivotTable Report � Chapter 5
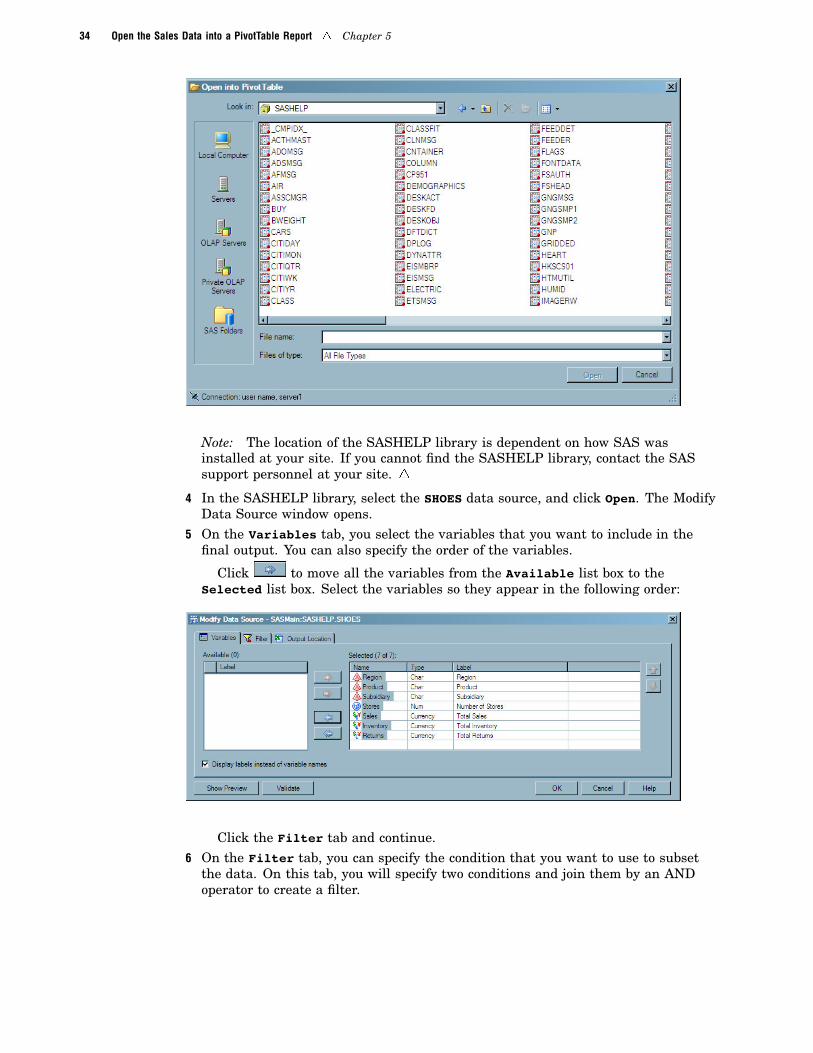
Note: The location of the SASHELP library is dependent on how SAS wasinstalled at your site. If you cannot find the SASHELP library, contact the SASsupport personnel at your site. �
4 In the SASHELP library, select the SHOES data source, and click Open. The ModifyData Source window opens.
5 On the Variables tab, you select the variables that you want to include in thefinal output. You can also specify the order of the variables.
Click to move all the variables from the Available list box to theSelected list box. Select the variables so they appear in the following order:
Click the Filter tab and continue.6 On the Filter tab, you can specify the condition that you want to use to subset
the data. On this tab, you will specify two conditions and join them by an ANDoperator to create a filter.
Analyzing a SAS Data Source in a PivotTable Report � Open the Sales Data into a PivotTable Report 35
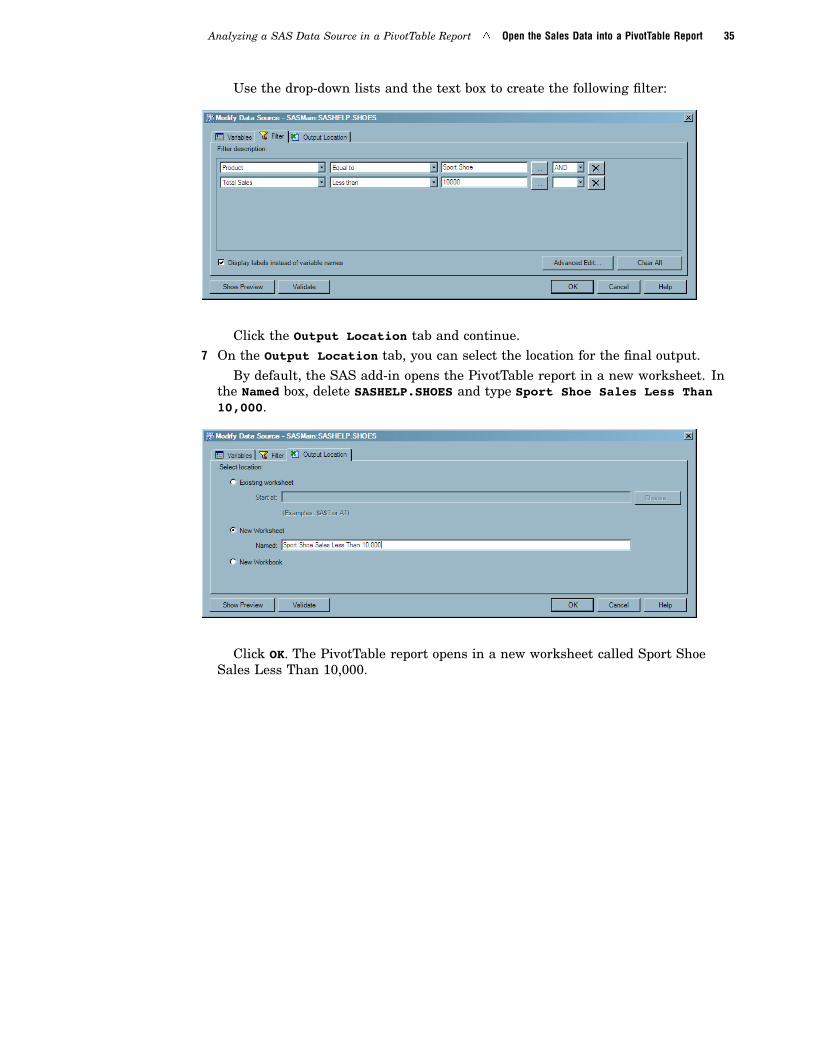
Use the drop-down lists and the text box to create the following filter:
Click the Output Location tab and continue.7 On the Output Location tab, you can select the location for the final output.
By default, the SAS add-in opens the PivotTable report in a new worksheet. Inthe Named box, delete SASHELP.SHOES and type Sport Shoe Sales Less Than10,000.
Click OK. The PivotTable report opens in a new worksheet called Sport ShoeSales Less Than 10,000.
36 Create a PivotTable Report for the Sport Shoe Product Line � Chapter 5
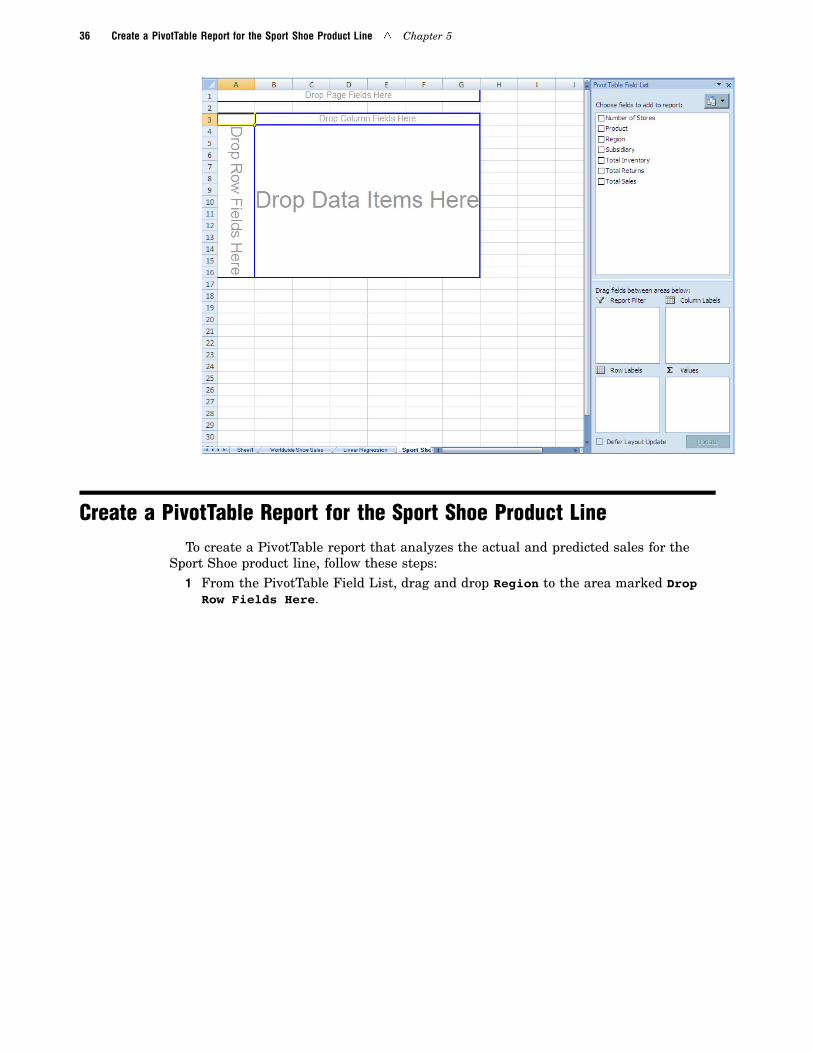
Create a PivotTable Report for the Sport Shoe Product LineTo create a PivotTable report that analyzes the actual and predicted sales for the
Sport Shoe product line, follow these steps:1 From the PivotTable Field List, drag and drop Region to the area marked Drop
Row Fields Here.
Analyzing a SAS Data Source in a PivotTable Report � Create a PivotTable Report for the Sport Shoe Product Line 37
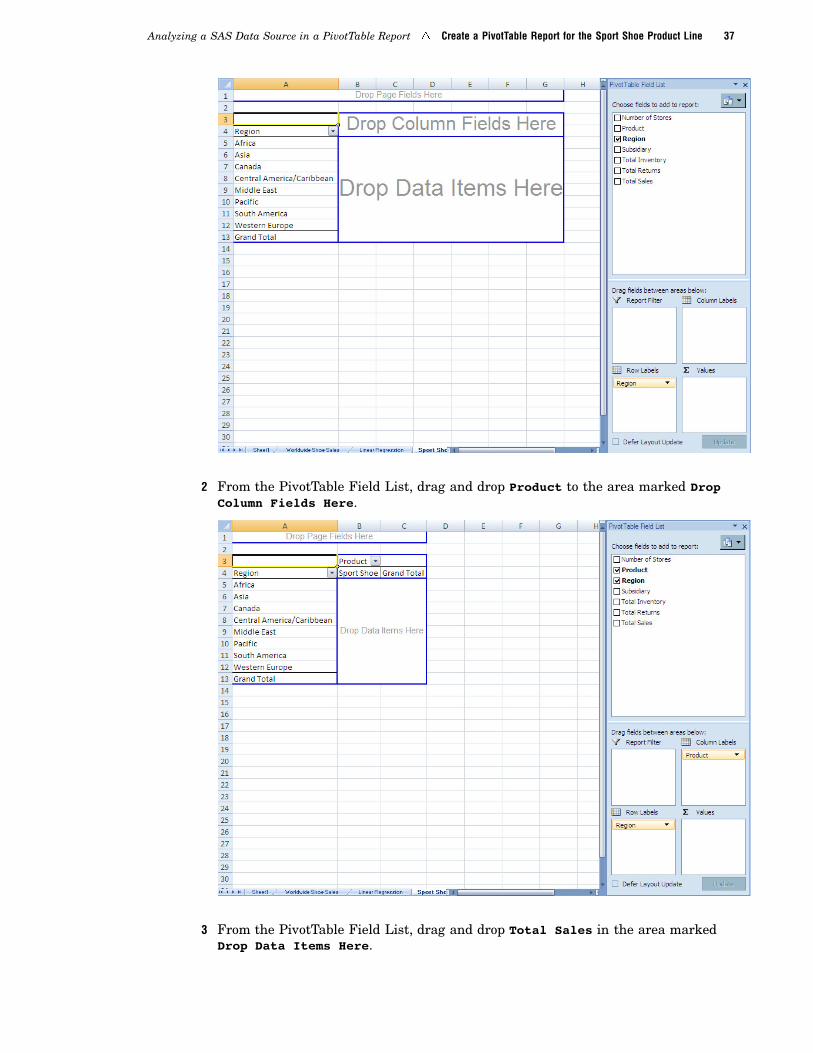
2 From the PivotTable Field List, drag and drop Product to the area marked DropColumn Fields Here.
3 From the PivotTable Field List, drag and drop Total Sales in the area markedDrop Data Items Here.

38 Drilling Down on the Data for Asia in the PivotTable Report � Chapter 5
The results show that three regions (Asia, Middle East, and Central America/Caribbean) have total sport shoe sales under $10,000. Asia has the lowest sales, so youwant to drill-down on the data in the Asia region to investigate further.
Drilling Down on the Data for Asia in the PivotTable ReportTo drill-down on the data for the Asia region, follow these steps:1 In the Region column, right-click in the Asia cell. From the pop-up menu, select
Expand/Collapse � Expand. The Show Detail dialog box opens.2 Select Subsidiary and click OK.
The Asia row now shows the sales for the Seoul and Tokyo subsidiaries.
Analyzing a SAS Data Source in a PivotTable Report � Drilling Down on the Data for Asia in the PivotTable Report 39
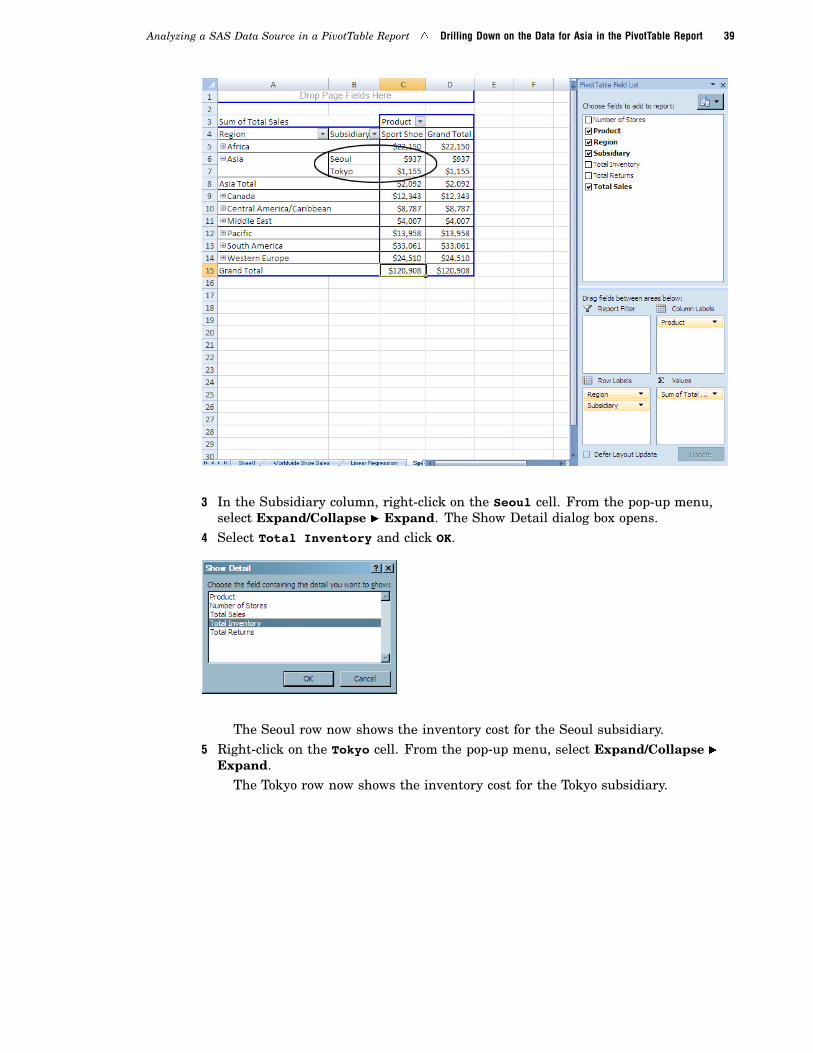
3 In the Subsidiary column, right-click on the Seoul cell. From the pop-up menu,select Expand/Collapse � Expand. The Show Detail dialog box opens.
4 Select Total Inventory and click OK.
The Seoul row now shows the inventory cost for the Seoul subsidiary.5 Right-click on the Tokyo cell. From the pop-up menu, select Expand/Collapse �
Expand.The Tokyo row now shows the inventory cost for the Tokyo subsidiary.

40 Save the Workbook � Chapter 5
The results suggest the following:� While the sales for the Seoul subsidiary were $937, the cost of inventory was only
$455. This suggests that the profit for sport shoes was good. It could also suggestthat demand for sport shoes exceeded the inventory that the Seoul subsidiary hadin the warehouse.
� While the sport shoe sales for the Tokyo subsidiary were $1,155, the cost ofinventory was $15,602. This suggests that the Tokyo subsidiary was not profitablein selling sport shoes. Then you remember that a low-price competitor recentlyentered the Tokyo market. The demand for sport shoes declined unexpectedly, andconsequently, the Tokyo subsidiary has leftover inventory in the warehouse.
Before ordering sport shoes for either of these subsidiaries, your company willprobably want to perform an in-depth market analysis into the trends in each of thesemarkets.
Save the Workbook
To save the workbook, click in the Quick Access Toolbar.You have now finished analyzing the sports shoe sales in a PivotTable report. This
completes the second part of the scenario.

41
C H A P T E R
6Next Steps: A Quick Look atAdditional Features
Working with Published Documents 41What Is a Published Document? 41
Publish the Sales Workbook 42
Open the Published Workbook 43
Working with Favorites 44
What Is a Favorite? 44Add a Favorite for the Shoe Sales 2008 Workbook 44
Run the Favorite for the Shoe Sales 2008 Workbook 45
Sending Results to Microsoft Word or Microsoft PowerPoint 45
About Sending Results from Excel 45
Send Results from the Sales Workbook to Microsoft PowerPoint 46
Refresh Your Results in Word or PowerPoint 47
Working with Published Documents
What Is a Published Document?After you have completed an analysis, you might want to share the results with
others at your site. Published documents are Excel, Word, or PowerPoint documentsthat are saved to a common repository.
Publishing your documents to a common repository has the following benefits:� The workbooks, documents, and presentations in this repository can be opened by
others at your site.
� When you publish the workbook, document, or presentation to the metadatarepository, information about all the data sources is saved to the repository.Storing this metadata in the repository enables you to perform an impact analysison a document. Impact analysis enables you to see where a data source came fromand the items that depend on this source. This analysis enables you to know howchanging a data source might affect other documents.
Note: To publish a document, the SAS support personnel at your site must haveinstalled SAS Web Report Studio on the same metadata server. If you cannot publishdocuments, contact the SAS support personnel at your site. �

42 Publish the Sales Workbook � Chapter 6
Publish the Sales WorkbookTo publish the Shoe Sales 2008 workbook, follow these steps:1 In the Ribbon, select the SAS tab. In the Manage group, click Tools and select
Publish.
Note: If you have any data sources that cannot be tracked in your document, thenthe Verify Document for Impact Analysis dialog box opens. Click OK to continue. �
The Publish window opens.
2 Select the location where you want to publish your document and click Save. TheProperties dialog box for the published document opens.
3 On the Security tab, specify the security settings for the published document.For more information about how to set the security settings for a document orfolder, click Help in this window.
Next Steps: A Quick Look at Additional Features � Open the Published Workbook 43
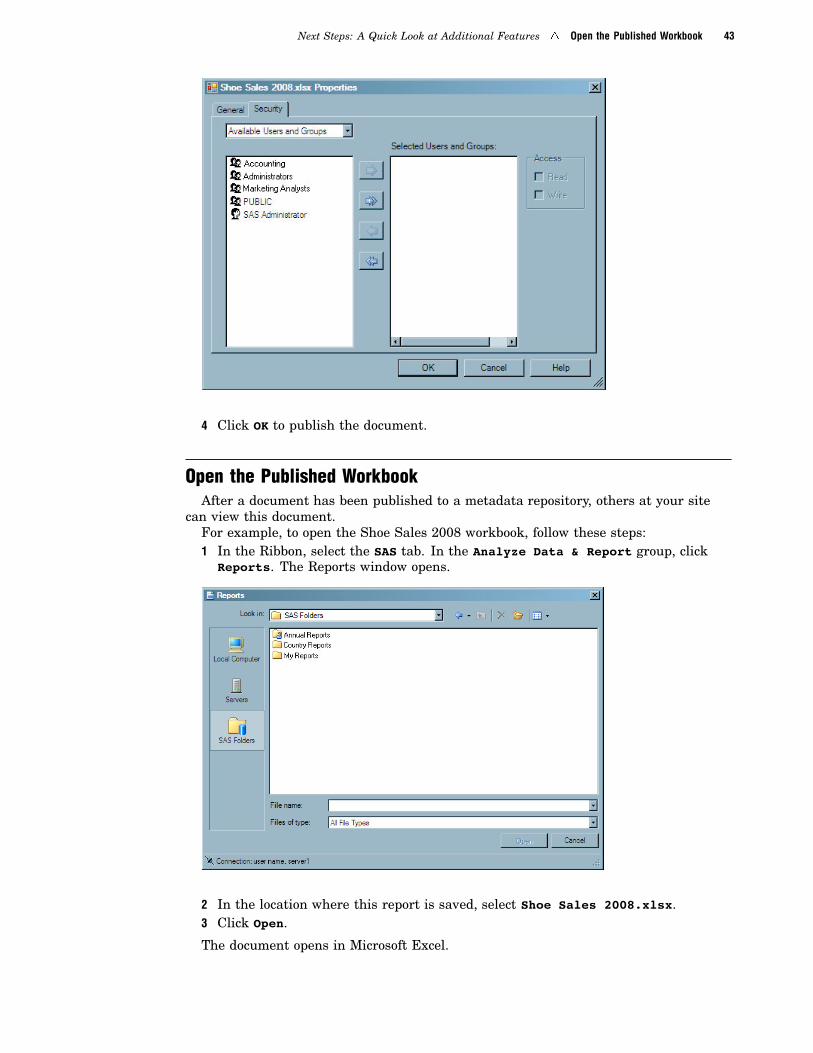
4 Click OK to publish the document.
Open the Published WorkbookAfter a document has been published to a metadata repository, others at your site
can view this document.For example, to open the Shoe Sales 2008 workbook, follow these steps:1 In the Ribbon, select the SAS tab. In the Analyze Data & Report group, click
Reports. The Reports window opens.
2 In the location where this report is saved, select Shoe Sales 2008.xlsx.3 Click Open.
The document opens in Microsoft Excel.

44 Working with Favorites � Chapter 6
Working with Favorites
What Is a Favorite?Favorites in the SAS add-in enable you to quickly access your most commonly used
reports and analyses. You can add published documents, reports, SAS tasks, and storedprocesses to your list of favorites.
Add a Favorite for the Shoe Sales 2008 WorkbookIf you want to analyze the data in the Shoe Sales 2008 workbook frequently, you
might want to add this published document to your list of favorites.To add the Shoe Sales 2008 workbook to your list of favorites, follow these steps:1 In the Ribbon, select the SAS tab. In the Analyze Data & Report group, click
Reports. The Reports window opens.2 Right-click the Shoe Sales 2008.xlsx workbook and select Add to Favorites.
The Add to SAS Favorites window opens.3 Select the folder where you want to save this workbook and click OK.

Next Steps: A Quick Look at Additional Features � About Sending Results from Excel 45
Run the Favorite for the Shoe Sales 2008 WorkbookTo open the Shoe Sales 2008 workbook that you added to your list of favorites, follow
these steps:
1 In the Analyze Data & Report group, click SAS Favorites.
2 Select Shoe Sales 2008.
The Shoe Sales 2008 workbook opens in Excel.
Sending Results to Microsoft Word or Microsoft PowerPoint
About Sending Results from ExcelAfter you performed your initial analysis of the company’s 2008 sales data in Excel,
your managers asked you to create a short presentation for the yearly sales meeting.This presentation should include the following data:
� the total sales for each product
� the average sales, inventory, and returns for each product
From Excel, you can select the results from the Shoe Sales 2008 workbook to send toWord or to PowerPoint. When you select the SAS content to send, the current resultsfor that analysis are automatically displayed in Word or PowerPoint. To make sure thatthe most up-to-date results are displayed in Word or PowerPoint, you should refresh theanalysis after the results are sent to these applications.
Note: You can send only SAS content from Excel to Word or PowerPoint. Anyformatting or text changes that you made to the SAS content are not sent. Only theresults are re-opened in Word or PowerPoint.
You cannot send a SAS data source or data in an Excel worksheet. Word andPowerPoint are unable to open and read an Excel data source. Additionally, you cannotsend a PivotTable report to Word or PowerPoint. �
46 Send Results from the Sales Workbook to Microsoft PowerPoint � Chapter 6
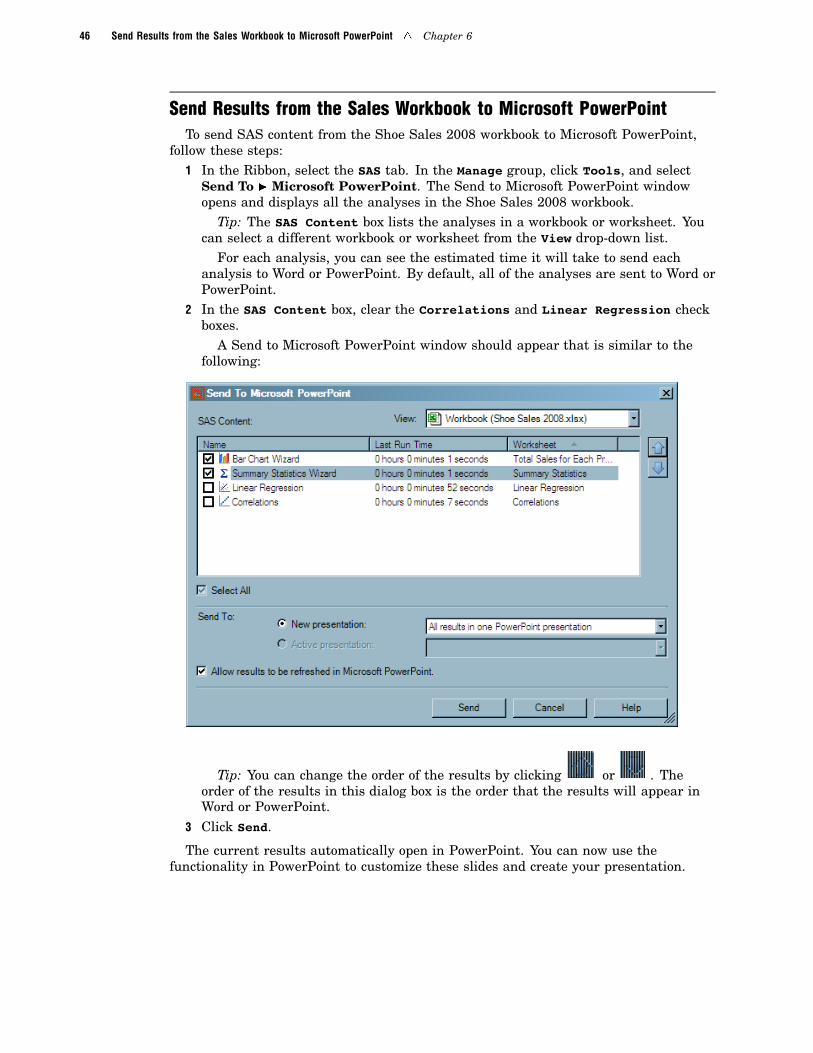
Send Results from the Sales Workbook to Microsoft PowerPointTo send SAS content from the Shoe Sales 2008 workbook to Microsoft PowerPoint,
follow these steps:1 In the Ribbon, select the SAS tab. In the Manage group, click Tools, and select
Send To � Microsoft PowerPoint. The Send to Microsoft PowerPoint windowopens and displays all the analyses in the Shoe Sales 2008 workbook.
Tip: The SAS Content box lists the analyses in a workbook or worksheet. Youcan select a different workbook or worksheet from the View drop-down list.
For each analysis, you can see the estimated time it will take to send eachanalysis to Word or PowerPoint. By default, all of the analyses are sent to Word orPowerPoint.
2 In the SAS Content box, clear the Correlations and Linear Regression checkboxes.
A Send to Microsoft PowerPoint window should appear that is similar to thefollowing:
Tip: You can change the order of the results by clicking or . Theorder of the results in this dialog box is the order that the results will appear inWord or PowerPoint.
3 Click Send.
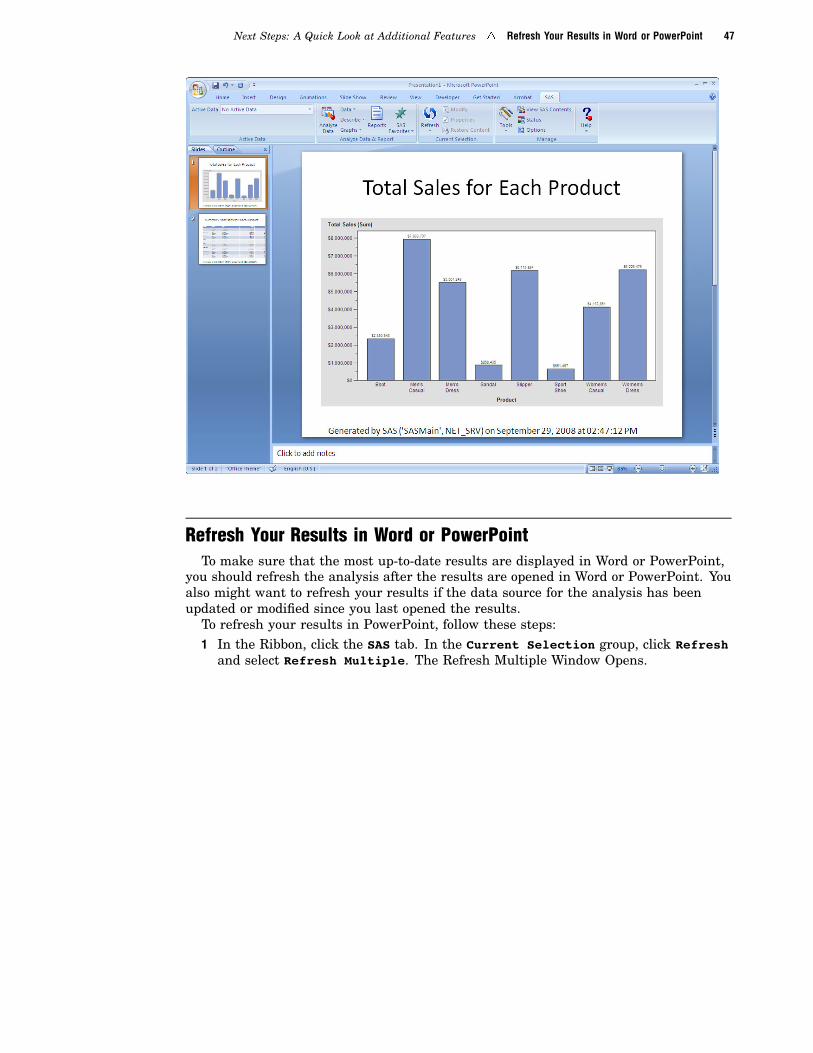
The current results automatically open in PowerPoint. You can now use thefunctionality in PowerPoint to customize these slides and create your presentation.
Next Steps: A Quick Look at Additional Features � Refresh Your Results in Word or PowerPoint 47
Refresh Your Results in Word or PowerPointTo make sure that the most up-to-date results are displayed in Word or PowerPoint,
you should refresh the analysis after the results are opened in Word or PowerPoint. Youalso might want to refresh your results if the data source for the analysis has beenupdated or modified since you last opened the results.
To refresh your results in PowerPoint, follow these steps:1 In the Ribbon, click the SAS tab. In the Current Selection group, click Refresh
and select Refresh Multiple. The Refresh Multiple Window Opens.

48 Refresh Your Results in Word or PowerPoint � Chapter 6
2 Click Refresh.
The SAS add-in refreshes all of the analyses in your presentation.Tip: You can also use the Refresh Multiple window to select which analysis to
refresh. For each analysis, the estimated time to run this analysis and the slidenumber of this content is listed. By default, all of the analyses are refreshed.

49
C H A P T E R
7Recommended Reading
Recommended Reading 49
Recommended ReadingHere is the recommended reading list for this title:� the online Help for the SAS Add-In 4.2 for Microsoft Office� SAS offers instructor-led training and self-paced e-learning courses to help you get
started with the SAS add-in, learn how the SAS add-in works with the otherproducts in the SAS Enterprise Intelligence Platform, and learn how to run storedprocesses in the SAS add-in. For more information about the courses available, seesupport.sas.com/training.
For a complete list of SAS publications, go to support.sas.com/bookstore. If youhave questions about which titles you need, please contact a SAS Publishing SalesRepresentative at:
SAS Publishing SalesSAS Campus DriveCary, NC 27513Telephone: 1-800-727-3228Fax: 1-919-531-9439E-mail: [email protected] address: support.sas.com/bookstore
Customers outside the United States and Canada, please contact your local SAS officefor assistance.

50

51
Glossary
active data sourcean Excel data source or a SAS data source that you specify to run all tasks on.Specifying an active data source enables you to perform multiple analyses on thesame data source without having to specify that data source each time you run atask. See also SAS data source and task.
analysisa statistical calculation that is generated by either a task or a stored process. Seealso task and stored process.
default metadata serverthe metadata server that you are automatically connected to when you startMicrosoft Word, Microsoft Excel, or Microsoft PowerPoint. See also metadata andmetadata server.
default serverthe SAS server that is automatically used to execute any tasks that use a MicrosoftExcel worksheet or local data as the data source, unless an active data source thatexists on a different server has been specified. See also active data source.
execution serverthe server where the data is refreshed or the analysis is run.
favoritein the SAS Add-In for Microsoft Office, a report, SAS task, stored process, orpublished document that you can quickly access.
filtera program or section of a program that processes or forwards only the subset of adata source that meets specific criteria.
impact analysisa search that enables you to track data sources and stored processes to see wherethey are used. For example, you can use a tool like SAS Data Integration Studio todetermine what Microsoft Office documents are using a particular data source. Thishelps you to understand what items will be impacted if you delete or rename thatdata source.
metadataa description or definition of data or information.

52 Glossary
metadata configuration filea file that enables users to specify which SAS metadata server they want to connectto by default. The connection to the metadata server enables users to access and runstored processes and to access SAS data sources on remote computers.
metadata repositorya collection of related metadata objects, such as the metadata for a set of tables andcolumns that are maintained by an application.
metadata servera server that stores information about servers, users, and stored processes and thatprovides this information to one or more client applications.
observationa row in a SAS data set. All of the data values in an observation are associated witha single entity such as a customer or a state. Each observation contains either onedata value or a missing-value indicator for each variable.
PivotTablean interactive table that analyzes and summarizes data in Microsoft Excel. You canrotate the rows and columns in the table to see different views of the data.
published documenta Microsoft Office document that is saved to a central repository. This workbook,document, or presentation can be opened with the appropriate Microsoft Officeapplication.
SAS data sourcea data file that contains SAS data. See also active data source.
SAS librarya collection of one or more files that are recognized by SAS and that are referencedand stored as a unit. Each file is a member of the library.
stored processa SAS program that is stored on a server and which can be executed as requested byclient applications. Stored processes are often used to create reports.
taska program that generates and executes SAS programming code that performs aparticular type of statistical analysis on the active data source that you havespecified. A wizard prompts you for the information that is required in order toexecute the task. See also analysis and active data source.
variablea column in a SAS data set or in a SAS data view. The data values for each variabledescribe a single characteristic for all observations.

53
Index
Aaccessiblity features 3
active data sources 11
analyzing data 3, 5
Bbar charts 11
CChoose Location dialog box 15, 20, 25, 28
correlation 21
Ddata sources
accessing 1, 6
copying 2
filtering 34
opening in an Excel worksheet 7
opening into PivotTable report 33
record limits 2
selecting variables for output 8
sorting output 9
specifying output location 9
Ffavorites 43
adding 43
running 44
HHelp 6
Iimpact analysis 41
Llinear regression 26
Mmetadata configuration file 6Microsoft Office 2000-2003 1Modify Data Source window 8, 34
Filter tab 34Output Location tab 9, 35Sort tab 9Variables tab 8, 34
OOpen Data Source window 33
PPivotTable reports 33
columns 37creating 36data items 37drilling down to detail 38rows 36
prerequisites 6published documents 2, 41
benefits 41impact analysis 41opening 43publishing 41
QQuick Access Toolbar 31, 40
RRefresh Multiple Window 47refreshing results 2, 47
in Microsoft PowerPoint 47
SSAS Add-In for Microsoft Office 1
benefits 1online Help 6
SAS Enterprise Guide 2SAS Enterprise Intelligence Platform 6SAS menu 1SAS Metadata Server 6SAS Stored Processes 2

54 Index
SAS tab 1, 2
SAS tasks 1, 5
Bar Chart Wizard 11
Correlation task 21
Linear Regression task 26
Summary Statistics Wizard 16
SAS Web Report Studio 2, 41
SASHELP library 6
saving workbooks 10, 31, 40
scenario 5
sending results 2, 45
to Microsoft PowerPoint 45
SHOES data set 6
summary statistics 16

Your Turn
We welcome your feedback.� If you have comments about this book, please send them to [email protected].
Include the full title and page numbers (if applicable).� If you have comments about the software, please send them to [email protected].
