sap services capability
DESCRIPTION
SAP-services-capabilityTRANSCRIPT

Capture Share Report – Asia
Pacific SAP Services Providers
October, 2012 Authored by
Phil Hassey: - Founder capioIT

Capture Share– Asia Pacific SAP
Services Providers
Executive Summary 3
Top-line Methodology 6
Core Findings 10
SAP Capture Share - Vendor Breakdown 22
AP SAP Services Capture Share Final Takeaways 40
Detailed Methodology 43
2 Prepared by capioIT 2/01/2013

Executive Summary
• The capioIT Asia Pacific SAP Services Capture Share report
highlights overall key strengths and weaknesses of 15 leading SAP
services providers in the Asia Pacific region.
• The report highlights that whilst there is a diverse range of SAP
services providers with a range of skills and capabilities, leadership
for AP SAP Services sits with Accenture followed by IBM. Indian
based providers, particularly Infosys and TCS are the biggest
movers in the rankings as their individual capability and service
delivery outcomes rise.
• It is anticipated that the SAP Services market in the Asia Pacific
region will become even more competitive in the next 24 months.
capioIT has observed greater focus on Asia from the likes of Atos,
as well as NTT Data as well as the arrival of Cognizant.
3 Prepared by capioIT 2/01/2013

Executive Summary
• Furthermore the Chinese providers such as Vanceinfo will continue
to emerge, firstly in China, but more broadly as they look to replicate
the Indian provider market.
• Competition is also going to be enhanced by the changing dynamic
of the SAP application portfolio. As this expands through cloud
adoption of existing offerings and acquisitions, it is clear that the
services delivery environment will be particularly disruptive.
• SAP is going to have to work closely with the partners to ensure that
they can maintain the pace of change that is impacting the overall IT
space in the Asia Pacific region. This will be particularly true for
dissemination of IP and R&D as well as optimisation of account and
opportunity management.
4 Prepared by capioIT 2/01/2013

Capture Share– Asia Pacific SAP
Services Providers
Executive Summary 3
Top-line Methodology 6
Core Findings 10
SAP Capture Share - Vendor Breakdown 22
AP SAP Services Capture Share Final Takeaways 40
Detailed Methodology 43
5 Prepared by capioIT 2/01/2013

Top-line Methodology
• Capture Share reports are based on the analysis of 17 key
capabilities and attributes of services providers. These attributes are
focused in two key areas, Transform and Leverage.
• In order to undertake the appropriate level of analysis and data
integrity, the individual attributes are weighted in percentage terms
on the basis of the overall influence for the Transform and Leverage
capabilities.
• Clearly data and process integrity are a critical component of a
report of this type. It is fundamental that the data be valid and
untarnished. To help ensure this, all information for the
measurement and assessment of these attributes comes from a
range of sources to ensure a range of opinions. Sources of
information include vendor briefings and meetings, media sources,
the IT services ecosystem and specific end-user feedback.
• A full methodology is highlighted at the end of this report.
6 Prepared by capioIT 2/01/2013

Methodology – Transform Attributes
• There has been nine attributes
identified by capioIT that
contribute to the measurement
of IT Services providers ability
to transform clients SAP
requirements and provide
leadership in a market.
• As mentioned these attributes
are all weighted to determine
their overall importance. The
weighting is highlighted in the
accompanying table .
• The following section defines
each Transform attribute
2/01/2013 Prepared by capioIT 7
Attribute Weighting
Internal R&D 10%
Leverage SAP R&D 15%
SAP Ecosystem Partnership 8%
Global Solution Development 10%
Industry Solution Development 10%
Country Solution Development 10%
SAP Infrastructure
Implementation 20%
Strength of Brand 7%
Ability to Influence External
Market 10%
Total 100%

Methodology – Leverage Attributes
• There are 8 attributes that
contribute to the measurement
of a IT Services providers
ability to leverage capabilities
to provide scale and efficiency
to clients.
• These attributes are all
weighted to highlight their
overall importance. The
weighting is highlighted below.
• The following section defines
each Leverage attribute
2/01/2013 Prepared by capioIT 8
Attribute Weighting
Asia Pacific SAP Services
Revenue 14%
Portfolio Depth 18%
Dedicated SAP Services
headcount 11%
In Country Strength 15%
Salesforce Strength 11%
Delivery Partnerships 10%
In Country Geographic Reach 8%
Country Localisation 13%
Total 100%
Capture Share– Asia Pacific SAP
Services Providers
Executive Summary 3
Top-line Methodology 6
Core Findings 10
SAP Capture Share - Vendor Breakdown 22
AP SAP Services Capture Share Final Takeaways 40
Detailed Methodology 43
9 Prepared by capioIT 2/01/2013

SAP Capture Share – 2012 Findings
10 Prepared by capioIT 2/01/2013
IBM
HP
CSC
Atos
Accenture
Fujitsu
UXC
Wipro
Cognizant
TCS
Deloitte
Infosys
HCL
Capgemini
Vanceinfo
Tra
ns
form
Leverage
Transform Focus
Leverage Focus
Market Maker
Market Developer

SAP Capture Share Leverage Findings
2/01/2013 Prepared by capioIT 11
• This section highlights the results of each leverage attribute for the AP SAP Services market.
• Clearly the region can be considered to have an inconsistent level of maturity and scale from the provider perspective. As a result there is no surprise that AP SAP Services Revenue is the weakest attribute.
• Revenue aside, Overall the results largely cluster. Whilst this is in part due to the number being an average, it does highlight that differentiation comes from doing specific measures well. This could include delivery partnerships or country localisation..
Leverage Attribute Average Score
Asia Pacific SAP Services
Revenue
5.4
Portfolio Depth 6.7
No. of dedicated SAP
Services headcount
6.2
Country Strength 6.5
Salesforce strength 6.4
Delivery Partnerships 6.4
In Country Geographic Reach 6.3
Country localisation 6.3

SAP Capture Share Leverage Findings for
Vendors
2/01/2013 Prepared by capioIT 12
• The average scores for leverage for the vendors is highlighted. The average score or rating is 6.3. Accenture had the highest score at 7.5. It was closely followed by IBM at 7.4. This highlights the overall scale and volume that these two vendors are able to provide comparatively consistently across the region.
• Atos was identified as having the most limited capability for leverage. It’s average score was 4.9.
• HCL was the most limited of the Indian providers with an average score of 6.3.
• The results reinforce that the scale for delivery in the region is helped by a core global delivery infrastructure.
Vendor
Vendor
Leverage
Rating
Accenture 7.5
IBM 7.4
TCS 7.0
Infosys 6.8
HP 6.7
Wipro 6.6
Fujitsu 6.6
CSC 6.4
Capgemini 6.3
HCL 6.3
UXC 5.9
Deloitte 5.8
Cognizant 5.3
Vanceinfo 5.0
Atos 4.9
Average Rating 6.3

SAP Capture Share Transform Findings
2/01/2013 Prepared by capioIT 13
• This section highlights the results of each transform attribute for the AP SAP Services market.
• The strongest attribute was the ability to leverage SAP R&D. This is not surprising and reflects on both SAP and the partner environment. However, work needs to be done by vendors focusing on developing their own R&D.
• Whilst the global and industry solution development results are strong, there is a real need to focus more energy on developing solutions that are country specific. This is still a high customer demand area.
Transform Average Score
Internal R&D 6.2
Leverage SAP R&D 6.8
SAP Ecosystem Partnership 6.6
Global Solution Development 6.7
Industry Solution
Development 6.7
Country Solution
Development 6.3
SAP Infrastructure
Implementation 6.1
Strength of Brand 6.2
Ability to influence external
market 6.2
SAP Capture Share Transform Findings
2/01/2013 Prepared by capioIT 14
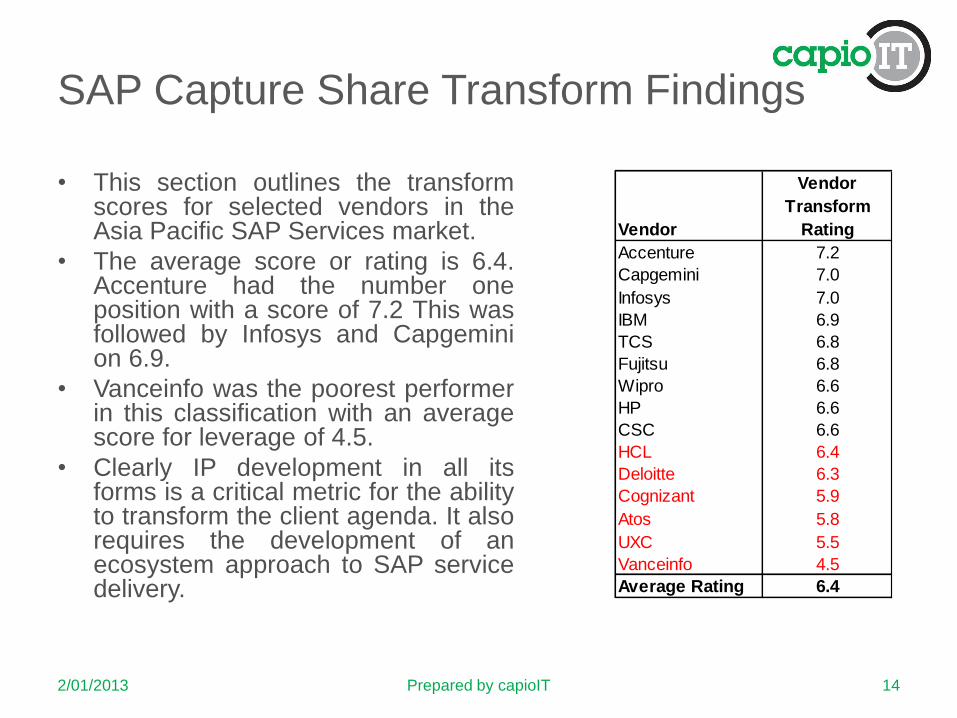
• This section outlines the transform scores for selected vendors in the Asia Pacific SAP Services market.
• The average score or rating is 6.4. Accenture had the number one position with a score of 7.2 This was followed by Infosys and Capgemini on 6.9.
• Vanceinfo was the poorest performer in this classification with an average score for leverage of 4.5.
• Clearly IP development in all its forms is a critical metric for the ability to transform the client agenda. It also requires the development of an ecosystem approach to SAP service delivery.
Vendor
Vendor
Transform
Rating
Accenture 7.2
Capgemini 7.0
Infosys 7.0
IBM 6.9
TCS 6.8
Fujitsu 6.8
Wipro 6.6
HP 6.6
CSC 6.6
HCL 6.4
Deloitte 6.3
Cognizant 5.9
Atos 5.8
UXC 5.5
Vanceinfo 4.5
Average Rating 6.4

Leverage to Transform Ratio
2/01/2013 Prepared by capioIT 15
• The Leverage To Transform Ratio
is another way to test the relative
strengths of a services provider.
• A negative delta indicates firms
have a stronger transform
capability. Conversely, a positive
delta indicates a stronger leverage
capability.
• A high delta percentage indicates
an imbalanced capability between
the ability to transform a client and
leverage capabilities.
• capioIT believe that a believe that a
delta score of > +/-7.5% is of
concern for a vendor.
Vendor
Leverage to
Transform Ratio
Vanceinfo 9.7%
UXC 7.2%
IBM 6.5%
Accenture 5.2%
TCS 1.9%
HP 1.1%
Wipro -0.4%
HCL -1.6%
Infosys -2.5%
Fujitsu -3.1%
CSC -3.6%
Deloitte -7.8%
Cognizant -8.9%
Capgemini -10.0%
Atos -15.3%
Total 2.8%

SAP Capture Share Overall Findings -
Market Makers
Accenture
• Accenture is the leader in the Asia
Pacific SAP Services marketplace.
It is consistently strong and has
provided a deep level of client
capability for several years and
across the region.
• It leads in a range of categories
from portfolio depth, sales force
strength, industry solution
development and the ability to
influence the market.
IBM
• IBM has a large level and depth of
capability in SAP services across
the region. As the analysis
indicates, it was very close call for
leadership in this market.
• It has leadership in the strength of
the brand for SAP services as well
as for SAP Infrastructure
Implementations
2/01/2013 Prepared by capioIT 16

SAP Capture Share Overall Findings -
Market Makers
Infosys • Infosys has had particular focus
on enhancing the “transform”
capability in the past 12-24
months for SAP Services. This
has created the capability that
means It is not just a scale
provider.
• It has made considerable
progress in developing asset
based solutions for customers.
This has been undertaken with a
focus on internal R&D integrated
with SAP R&D.
TCS
• TCS has matured with a strong pan regional approach to SAP capability. It has strong presence in three of the five major regions.
• It has also driven an increase focus on IP not just delivery scale.
• It also enjoys broader in country geographic reach than many of the other Indian based provider.
2/01/2013 Prepared by capioIT 17
SAP Capture Share Overall Findings
Market Makers
• SAP – SAP has to draw a fine balance between its own capabilities
in services and not cannibalising partner revenue. Clearly the
strength for it is in consulting and emerging SAP solutions.
• Capgemini – Clearly Capgemini does not have the scale in the Asia
Pacific region it has in Europe, but it has strength particularly from a
transformational perspective. It needs further scale to reach
potential in the region.
• Fujitsu – Fujitsu has a long history and has made acquisitions
particularly in Australia to enhance its SAP presence. However
capability is not consistent across the Asia Pacific region.
2/01/2013 Prepared by capioIT 18

SAP Capture Share Overall Findings
Leverage Focus
• HP – HP has a slight leverage focus. The overall SAP practice post
EDS acquisition has deteriorated. It has a lack of industry focus and
is reliant upon capability being driven from the strength it has in
delivery of SAP infrastructure on the HP platform. It needs to invest
in industry capability and R&D to re-capture the strength the EDS
and HP components used to provide customers.
• Wipro – Wipro is increasing, but needs to shift the perception that it
has a “body shop” focus to a more strategic capability. Increased
investment in SAP consulting will be critical for driving this.
2/01/2013 Prepared by capioIT 19

SAP Capture Share Overall Findings
Transform Focus
• Capgemini – Capgemini leads in some key areas of the Asia Pacific
Services market for SAP. However, it lacks scale across the region,
and needs to invest more significantly to grow in capability.
• HCL – HCL have made investments in key markets through Axon.
They still need to grow in scale and capability but have made SAP a
corporate focus.
• CSC – Key investments by CSC in the Mining and Resources
industries in addition to Public Sector is important for its ongoing
success. The clear limitation is the lack of scale in Asia in general,
and for SAP in the region.
• Fujitsu – Fujitsu is really two business in the AP market (excluding
Japan). In Australia it is one of the leaders in the market. In the rest
of the region it lags behind other providers. Investment in AP is well
overdue across the offerings of Fujitsu, not just in SAP.
2/01/2013 Prepared by capioIT 20

SAP Capture Share Overall Findings
Market Developer Focus
• Market Developers include
– Cognizant
– Deloitte
– Vanceinfo
– UXC
– HCL
• The key challenge for the market developers is scale. Without it they
have limited Asia Pacific wide coverage and the ability to offer depth
in vertical markets.
• This applies to both local AP based providers such as Vanceinfo and
UXC as well as global players such as Atos and Deloitte.
2/01/2013 Prepared by capioIT 21
Capture Share– Asia Pacific SAP
Services Providers
Executive Summary 3
Top-line Methodology 6
Core Findings 10
SAP Capture Share - Vendor Breakdown 22
AP SAP Services Capture Share Final Takeaways 40
Detailed Methodology 43
22 Prepared by capioIT 2/01/2013

SAP Capture Share - Vendor
Breakdown
• The following section highlights the performance of key vendors to
further understand their strengths and weaknesses.
• Analysis of the strengths and weaknesses is undertaken to
determine the core requirements from a competitive point of view.
• The relative capability is also highlighted. For firms that score above
the overall average, this is highlighted by a +
• Conversely, firms that score below the average are highlighted by a
–
• Where firms scores can not be split, indication of relative strength or
weakness is highlighted by the distance from the average for all
firms. That is, relatively higher scores are indicated as strengths.
Relatively lower scores are indicated as weaknesses.
2/01/2013 Prepared by capioIT 23

SAP Capture Share - Vendor
Breakdown
• If this provides identical results, values are then weighted by the
overall importance of each attribute. For example, if a firm has
identical scores for Strength of Brand and Ability to Influence the
External Market, the weighting of Ability to Influence the External
Market at 10%, vs. 6% for Strength of Brand will indicate that Ability
to Influence the External Market would be listed as a strength or
weakness.
2/01/2013 Prepared by capioIT 24

Accenture AP SAP Services Capability
Top Three Leverage Strengths
• Salesforce Strength +
• Asia Pacific SAP Services
Revenue +
• Dedicated SAP headcount +
Top Three Transform
Weaknesses
• Country Solution Development -
• SAP Ecosystem Partnerships +
• SAP Infrastructure Implementation +
2/01/2013 Prepared by capioIT 25
Top Three Leverage
Weaknesses
• Delivery Partnerships -
• In Country Geographic Reach +
• Country Localisation +
Top Three Transform Strengths
• Ability to Influence External
Market +
• Global Solution Development +
• Industry Solution Development +
Note + indicates a capability rated above the average
- indicates a capability rated below the average
Bold indicates Market Leader

IBM AP SAP Services Capability
Top Three Leverage Strengths
• Number of Dedicated SAP
Services Headcount +
• Portfolio Depth+
• Asia Pacific SAP Services
Revenue +
Top Three Transform
Weaknesses
• Country Solution Development +
• Leverage SAP R&D -
• SAP Ecosystem Partnerships -
2/01/2013 Prepared by capioIT 26
Top Three Leverage
Weaknesses
• Delivery Partnerships -
• In Country Geographic Reach +
• Country Localisation +
Top Three Transform Strengths
• SAP Infrastructure
Implementation +
• Industry Solution Development +
• Ability to Influence External Market
+
Note + indicates a capability rated above the average
- indicates a capability rated below the average
Bold indicates Market Leader

Infosys AP SAP Services Capability
Top Three Leverage Strengths
• Asia Pacific SAP Services Revenue +
• Dedicated SAP Services Headcount +
• Salesforce Strength +
Top Three Transform Weaknesses
• SAP Ecosystem Partnerships +
• Country Solution Development +
• SAP Infrastructure Implementation
+
2/01/2013 Prepared by capioIT 27
Top Three Leverage
Weaknesses
• In Country Geographic Reach –
• Country Localisation +
• Portfolio Depth +
Top Three Transform Strengths
• Internal R&D +
• Strength of Brand +
• Ability to Influence the Market +
Note + indicates a capability rated above the average
- indicates a capability rated below the average
Bold indicates Market Leader

TCS AP SAP Services Capability
Top Three Leverage Strengths
• No. Of Dedicated SAP Services Headcount +
• Asia Pacific SAP Services Revenue +
• Salesforce Strength +
Top Three Transform Weaknesses
• Country Solutions Development +
• Leverage SAP R&D +
• SAP Infrastructure Implementation
–
2/01/2013 Prepared by capioIT 28
Top Three Leverage Weaknesses
• In Country Geographic Reach +
• Portfolio Depth +
• Country Localisation +
Top Three Transform Strengths
• Internal R&D +
• Ability to Influence the External Market
+
• Strength of Brand +
Note + indicates a capability rated above the average
- indicates a capability rated below the average
Bold indicates Market Leader

Wipro AP SAP Services Capability
Top Three Leverage Strengths
• Asia Pacific SAP Services Revenue +
• No. Of Dedicated SAP Services Headcount +
• Country Strength +
Top Three Transform Weaknesses
• Country Solution Development –
• SAP Ecosystem Partnerships –
• Ability to Influence the External
Market –
2/01/2013 Prepared by capioIT 29
Top Three Leverage
Weaknesses
• In Country Geographic Reach –
• Country Localisation –
• Salesforce Strength –
Top Three Transform Strengths
• Internal SAP R&D +
• Strength of Brand +
• Industry Solution Development +
Note + indicates a capability rated above the average
- indicates a capability rated below the average
Bold indicates Market Leader

HP AP SAP Services Capability
Top Three Leverage Strengths
• Delivery Partnerships +
• Country Strength +
• In Country Geographic Reach +
Top Three Transform Weaknesses
• Industry Solution Development –
• Strength of Brand -
• Global Solution Development -
2/01/2013 Prepared by capioIT 30
Top Three Leverage Weaknesses
• Salesforce Strength +
• Country Localisation +
• Portfolio Depth +/-
Top Three Transform Strengths
• SAP Ecosystem +
• Internal R&D +
• SAP Infrastructure
implementation +
Note + indicates a capability rated above the average
- indicates a capability rated below the average
Bold indicates Market Leader

Fujitsu AP SAP Services Capability
Top Three Leverage Strengths
• Asia Pacific SAP Services Revenue+
• In Country Geographic Reach +
• No. Of Dedicated SAP Services Headcount +
Top Three Transform Weaknesses
• Ability to Influence Market -
Industry Solution -
• Global Solution +
2/01/2013 Prepared by capioIT 31
Top Three Leverage Weaknesses
• Portfolio Depth +/ –
• Country Strength –
• Salesforce Strength –
Top Three Transform Strengths
• SAP Infrastructure Implementation +
• Country Solution Development +
• SAP Ecosystem Partnership +
Note + indicates a capability rated above the average
- indicates a capability rated below the average
Bold indicates Market Leader

Capgemini AP SAP Services Capability
Top Three Leverage Strengths
• Delivery Partnerships +
• Portfolio Depth +
• Salesforce Strength +
Top Three Transform Weaknesses
• Strength of Brand +
• Internal SAP R&D +
• Country Solutions +
2/01/2013 Prepared by capioIT 32
Top Three Leverage
Weaknesses
• Country Strength –
• Asia Pacific SAP Services
Revenue –
• In Country Geographic Reach –
Top Three Transform Strengths
Note + indicates a capability rated above the average
- indicates a capability rated below the average
Bold indicates Market Leader
• Industry Solutions +
• Ability to Influence External Market
+
• Global Solutions +

CSC AP SAP Services Capability
Top Three Leverage Strengths
• Asia Pacific SAP Services Revenue +
• Portfolio Depth +
• Delivery Partnerships +
Top Three Transform
Weaknesses
• SAP Ecosystem Partnership -
• Strength of Brand -
• Internal R&D -
2/01/2013 Prepared by capioIT 33
Top Three Leverage
Weaknesses
• Number of Dedicated SAP
Services Headcount -
• In Country Geographic Reach -
• Country Strength -
Top Three Transform Strengths
• SAP Infrastructure Implementation
+
• Country Solutions +
• Industry Solutions +
Note + indicates a capability rated above the average
- indicates a capability rated below the average
Bold indicates Market Leader

Deloitte AP SAP Services Capability
Top Three Leverage Strengths
• Salesforce Strength +
• Country Localisation +
• Portfolio Depth +/-
Top Three Transform Weaknesses
• SAP Infrastructure Implementation
–
• Country Solutions –
• SAP Ecosystem Partnerships –
2/01/2013 Prepared by capioIT 34
Top Three Leverage
Weaknesses
• AP SAP Services Revenue –
• Country Strength –
• Delivery Partnerships –
Top Three Transform Strengths
• Strength of Brand +
• Internal SAP R&D +
• Industry Solution Development +
Note + indicates a capability rated above the average
- indicates a capability rated below the average
Bold indicates Market Leader
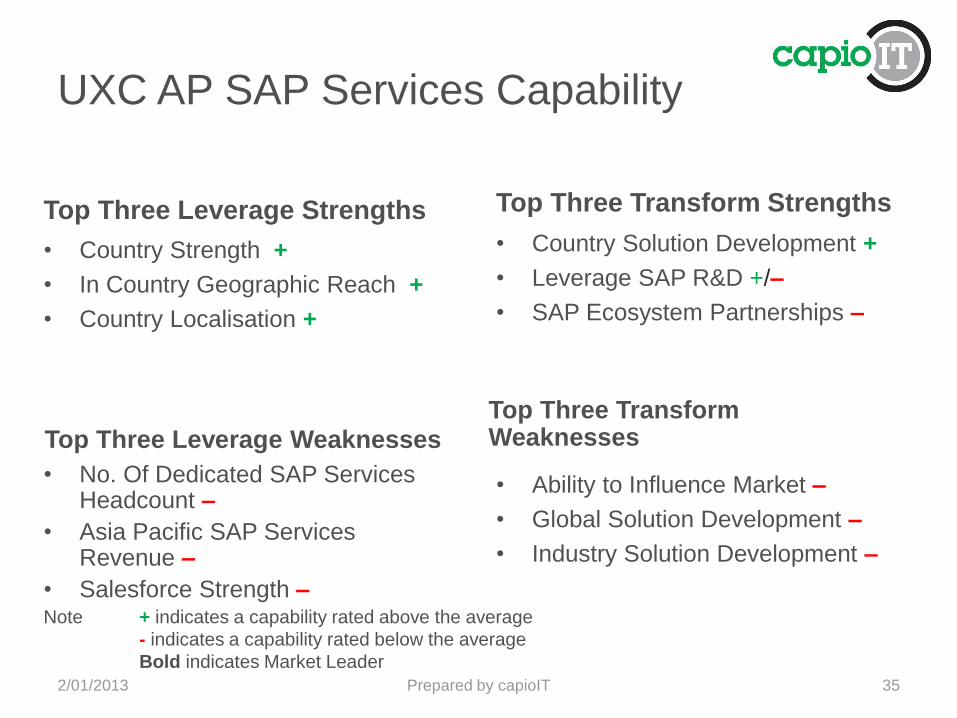
UXC AP SAP Services Capability
Top Three Leverage Strengths
• Country Strength +
• In Country Geographic Reach +
• Country Localisation +
Top Three Transform Weaknesses
• Ability to Influence Market –
• Global Solution Development –
• Industry Solution Development –
2/01/2013 Prepared by capioIT 35
Top Three Leverage Weaknesses
• No. Of Dedicated SAP Services Headcount –
• Asia Pacific SAP Services Revenue –
• Salesforce Strength –
Top Three Transform Strengths
• Country Solution Development +
• Leverage SAP R&D +/–
• SAP Ecosystem Partnerships –
Note + indicates a capability rated above the average
- indicates a capability rated below the average
Bold indicates Market Leader
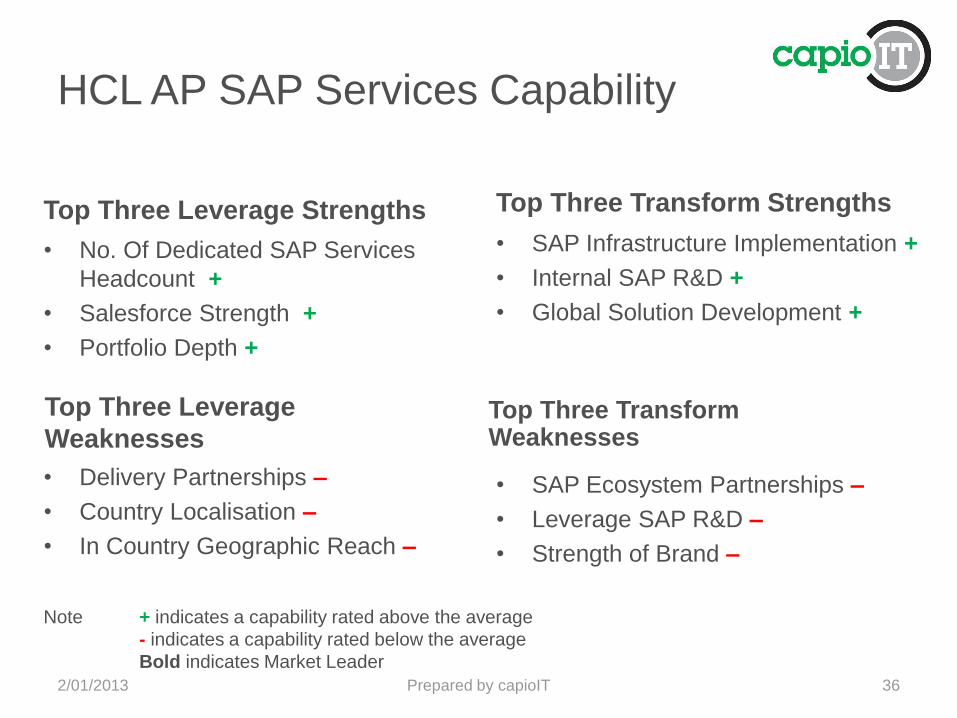
HCL AP SAP Services Capability
Top Three Leverage Strengths
• No. Of Dedicated SAP Services
Headcount +
• Salesforce Strength +
• Portfolio Depth +
Top Three Transform Weaknesses
• SAP Ecosystem Partnerships –
• Leverage SAP R&D –
• Strength of Brand –
2/01/2013 Prepared by capioIT 36
Top Three Leverage
Weaknesses
• Delivery Partnerships –
• Country Localisation –
• In Country Geographic Reach –
Top Three Transform Strengths
• SAP Infrastructure Implementation +
• Internal SAP R&D +
• Global Solution Development +
Note + indicates a capability rated above the average
- indicates a capability rated below the average
Bold indicates Market Leader
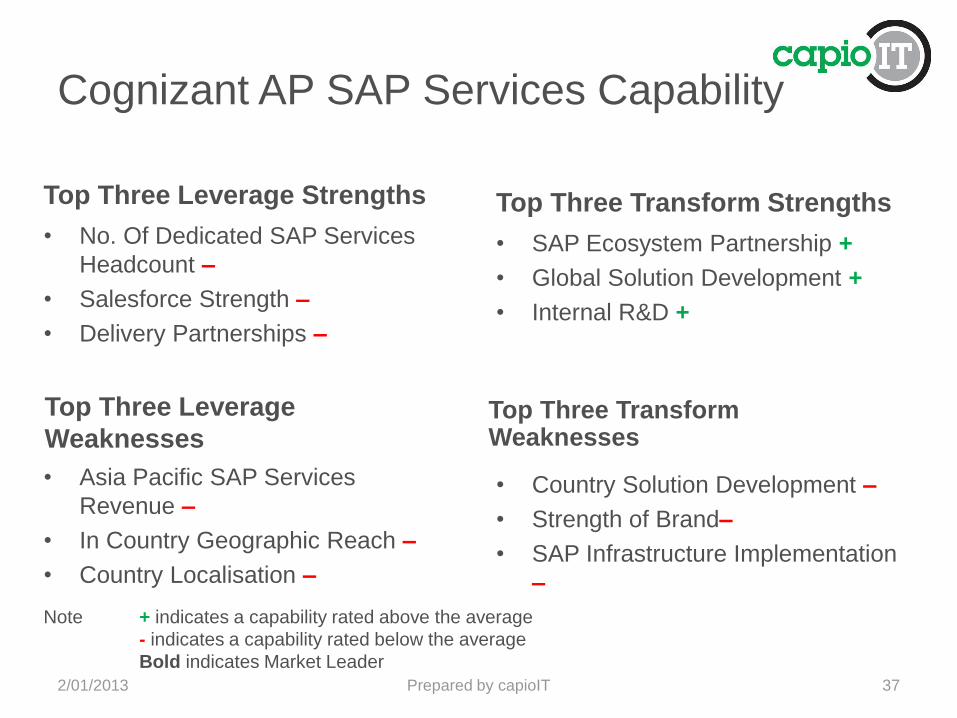
Cognizant AP SAP Services Capability
Top Three Leverage Strengths
• No. Of Dedicated SAP Services
Headcount –
• Salesforce Strength –
• Delivery Partnerships –
Top Three Transform Weaknesses
• Country Solution Development –
• Strength of Brand–
• SAP Infrastructure Implementation
–
2/01/2013 Prepared by capioIT 37
Top Three Leverage
Weaknesses
• Asia Pacific SAP Services
Revenue –
• In Country Geographic Reach –
• Country Localisation –
Top Three Transform Strengths
• SAP Ecosystem Partnership +
• Global Solution Development +
• Internal R&D +
Note + indicates a capability rated above the average
- indicates a capability rated below the average
Bold indicates Market Leader

Atos AP SAP Services Capability
Top Three Leverage Strengths
• In Country Geographic Reach –
• Country Localisation –
• Salesforce Strength –
Top Three Transform Weaknesses
• Internal R&D –
• Strength of Brand–
• Ability to Influence the External
Market –
2/01/2013 Prepared by capioIT 38
Top Three Leverage
Weaknesses
• Asia Pacific SAP Services Revenue –
• Number of Dedicated SAP Services Headcount –
• Country Strength –
Top Three Transform Strengths
• Leverage SAP R&D + /–
• Global Solution Development +
• Industry Solution Development +
Note + indicates a capability rated above the average
- indicates a capability rated below the average
Bold indicates Market Leader

Vanceinfo AP SAP Services Capability
Top Three Leverage Strengths
• Country Strength +
• Country Localisation +
• Delivery Partnerships –
Top Three Transform Weaknesses
• Internal R&D –
• Global Solution Development –
• Strength of Brand –
2/01/2013 Prepared by capioIT 39
Top Three Leverage
Weaknesses
• Asia Pacific SAP Services Revenue –
• Dedicated AP SAP Service Headcount –
• Portfolio Depth –
Top Three Transform Strengths
• SAP Ecosystem Partnership –
• Ability to Influence Market –
• Country Solution Development –
Note + indicates a capability rated above the average
- indicates a capability rated below the average
Bold indicates Market Leader

Capture Share– Asia Pacific SAP
Services Providers
Executive Summary 3
Top-line Methodology 6
Core Findings 10
SAP Capture Share - Vendor Breakdown 22
AP SAP Services Capture Share Final Takeaways 40
Detailed Methodology 43
40 Prepared by capioIT 2/01/2013
AP SAP Services Capture Share
Final Takeaways • Overall the SAP Services market in the Asia Pacific region is in a
healthy state of maturity. It varies by country of course, ANZ is the
strongest sub-region, with Singapore, China and Korea all key
geographies. India, the Philippines and China as well as Indonesia
represent key growth opportunities for SAP in the region.
• Accenture is the leading SAP Services provider in the Asia Pacific
region. It is closely followed by IBM. There is a gap to the next level
of contenders.
• Accenture and IBM’s success is due to more than just the scale
available for clients SAP requirements. They are able to develop
solutions for clients based on industry and geographic parameters
as well as driving SAP specific R&D into solutions. Opportunities
include working better with the SAP ecosystem, and a need to
improve geographic reach in smaller Indian and Chinese cities.
Prepared by capioIT 41 2/01/2013

• SAP has kept a reasonable balance in terms of services capabilities.
It needs to ensure that it is able to maintain this focus and balance
moving forward. It cannot afford to alienate partners in light of the
dramatic change to the market for procurement of ERP related
solutions. SAP needs to take the lead to help fast track SAP enabled
professionals to ensure that the skills gap is managed.
• HP has particular strength in SAP from an infrastructure point of
view. It needs to leverage EDS and the end to end HP capability
more strategically.
• Providers such as Fujitsu and CSC struggle with a lack of consistent
regional scale. They are strong in Australia, and patchy in other
markets.
• The Indian providers have not had the same success in the Asia
Pacific region that they have experienced in other markets. They
need to quickly leverage their strong reputation to scale in Asia
Pacific client delivery. Prepared by capioIT 42 2/01/2013
AP SAP Services Capture Share
Final Takeaways

Capture Share– Asia Pacific SAP
Services Providers
Executive Summary 3
Top-line Methodology 6
Core Findings 10
SAP Capture Share - Vendor Breakdown 22
AP SAP Services Capture Share Final Takeaways 40
Detailed Methodology 43
43 Prepared by capioIT 2/01/2013

Methodology – Transform Attributes
• There has been nine attributes
identified by capioIT that
contribute to the measurement
of IT Services providers ability
to transform clients SAP
requirements and provide
leadership in a market.
• As mentioned these attributes
are all weighted to determine
their overall importance. The
weighting is highlighted in the
accompanying table .
• The following section defines
each Transform attribute
2/01/2013 Prepared by capioIT 44
Attribute Weighting
Internal R&D 10%
Leverage SAP R&D 15%
SAP Ecosystem Partnership 8%
Global Solution Development 10%
Industry Solution Development 10%
Country Solution Development 10%
SAP Infrastructure
Implementation 20%
Strength of Brand 7%
Ability to Influence External
Market 10%
Total 100%

Methodology – Transform Attributes
• Internal SAP R&D
– The depth of investment by an enterprise in SAP related Research and
Development, linked with the successful development of solutions and
customer outcomes from the Research and Development
• Leverage SAP R&D
– The ability to leverage SAP Research and Development to both offer
solutions for the enterprise and for SAP. This requires development of
solutions and customer outcomes.
• SAP Ecosystem Partnership
– The ability to develop, maintain and maximise value of partnerships with
other SAP related entities to ensure that customer outcomes are
maximised.
• Global Solution Development
– Development of globally relevant and differentiated service or solution
offerings
45 Prepared by capioIT 2/01/2013

Methodology – Transform Attributes
• Industry Solution Development
– Development of industry based relevant and differentiated service or
solution offerings.
• Country Solution Development
– Development of country (or sub-region) based relevant and
differentiated service or solution offerings.
• SAP Infrastructure Implementation
– Ability to provide infrastructure solutions for SAP deployment based
upon a vendors, or partners hardware capabilities.
• Strength of Brand
– The strength and value of the brand to determine the scope of
awareness of the service provider and its offerings.
• Ability to influence external market
– The ability through thought leadership, executive engagement and
depth of proven delivery capability to influence the general and specific
direction of the SAP Services marketplace.
46 Prepared by capioIT 2/01/2013

Methodology – Leverage Attributes
• There are 8 attributes that
contribute to the measurement
of a IT Services providers
ability to leverage capabilities
to provide scale and efficiency
to clients.
• These attributes are all
weighted to highlight their
overall importance. The
weighting is highlighted below.
• The following section defines
each Leverage attribute
2/01/2013 Prepared by capioIT 47
Attribute Weighting
Asia Pacific SAP Services
Revenue 14%
Portfolio Depth 18%
Dedicated SAP Services
headcount 11%
In Country Strength 15%
Salesforce Strength 11%
Delivery Partnerships 10%
In Country Geographic Reach 8%
Country Localisation 13%
Total 100%

Methodology – Leverage Attributes
• Asia Pacific SAP Services Revenue
– Level of total revenue for IT related services in the Asia Pacific Region
• Portfolio Depth
– The depth of SAP services portfolio and capability. Key Services areas
include
• SAP Infrastructure Services
• SAP Application Management Services
• SAP Application Support and Integration Services
• SAP Hosted Services
• SAP Consulting
48 Prepared by capioIT 2/01/2013

Methodology – Leverage Attributes
• Dedicated SAP Services headcount
– The number of dedicated SAP services headcount in the region. These
are offshore and onshore resources as appropriate, but must be
focused on the region.
• In Country Strength
– SAP capability in the various markets of Asia Pacific at a country level,
key regions follow;
• ASEAN
• Australia and New Zealand
• Greater China
• India
• Korea
49 Prepared by capioIT 2/01/2013

Methodology – Leverage Attributes
• Salesforce Strength
– Depth of capability for the SAP service provider sales force. This is both from a commoditised services point of view as well as the higher order consultative sales capabilities.
• Delivery Partnerships
– The depth and capability of SAP delivery partnerships to ensure high quality of delivery capability for customers
• In country Geographic Reach
– The ability to deliver national capability across geographically dispersed markets. Key markets in Asia Pacific with this requirement are Australia, India and the PRC, but it is also relevant in markets such as Malaysia and Indonesia
• Country Localisation
– The ability to provide local capabilities in country to acknowledge local capabilities and requirements from a cultural, regulatory and governance perspective.
50 Prepared by capioIT 2/01/2013

For Further Information
Phil Hassey: - Founder capioIT
Blog – http://capioit.wordpress.com
Twitter - phassey
www.capioIT.com
Ph - +61 422 231 793