sap energy and environmental intelligence model reference ... · sap energy and environmental...
TRANSCRIPT

SAP Energy and Environmental IntelligenceDocument Version: 1.0.1 - 2013-12-16
SAP Energy and Environmental Intelligence Model Reference Guide

Table of Contents1 Model Concepts. . . . . . . . . . . . . . . . . . . . . . . . . . . . . . . . . . . . . . . . . . . . . . . . . . . . . . . . . . . . . . . 61.1 Data Model. . . . . . . . . . . . . . . . . . . . . . . . . . . . . . . . . . . . . . . . . . . . . . . . . . . . . . . . . . . . . . . . . . . . 61.2 Master Data, Attributes, and Dimensions. . . . . . . . . . . . . . . . . . . . . . . . . . . . . . . . . . . . . . . . . . . . . . .61.3 Time Profile. . . . . . . . . . . . . . . . . . . . . . . . . . . . . . . . . . . . . . . . . . . . . . . . . . . . . . . . . . . . . . . . . . . 71.4 Hierarchies. . . . . . . . . . . . . . . . . . . . . . . . . . . . . . . . . . . . . . . . . . . . . . . . . . . . . . . . . . . . . . . . . . . . 81.5 Planning Area. . . . . . . . . . . . . . . . . . . . . . . . . . . . . . . . . . . . . . . . . . . . . . . . . . . . . . . . . . . . . . . . . . 81.6 Measuring Point, Asset, and Allocation. . . . . . . . . . . . . . . . . . . . . . . . . . . . . . . . . . . . . . . . . . . . . . . . 9
1.6.1 Negative Allocation. . . . . . . . . . . . . . . . . . . . . . . . . . . . . . . . . . . . . . . . . . . . . . . . . . . . . . . 91.6.2 Dimension Relationships. . . . . . . . . . . . . . . . . . . . . . . . . . . . . . . . . . . . . . . . . . . . . . . . . . 10
1.7 Unit of Measure. . . . . . . . . . . . . . . . . . . . . . . . . . . . . . . . . . . . . . . . . . . . . . . . . . . . . . . . . . . . . . . . 101.7.1 Planning Objects. . . . . . . . . . . . . . . . . . . . . . . . . . . . . . . . . . . . . . . . . . . . . . . . . . . . . . . . 101.7.2 Material Type and UOM Conversion Factors. . . . . . . . . . . . . . . . . . . . . . . . . . . . . . . . . . . . . 111.7.3 Normalized Fields. . . . . . . . . . . . . . . . . . . . . . . . . . . . . . . . . . . . . . . . . . . . . . . . . . . . . . . .11
1.8 Currency. . . . . . . . . . . . . . . . . . . . . . . . . . . . . . . . . . . . . . . . . . . . . . . . . . . . . . . . . . . . . . . . . . . . . 11
2 Energy Concepts. . . . . . . . . . . . . . . . . . . . . . . . . . . . . . . . . . . . . . . . . . . . . . . . . . . . . . . . . . . . . . 132.1 Meters. . . . . . . . . . . . . . . . . . . . . . . . . . . . . . . . . . . . . . . . . . . . . . . . . . . . . . . . . . . . . . . . . . . . . . 132.2 Sub-meters. . . . . . . . . . . . . . . . . . . . . . . . . . . . . . . . . . . . . . . . . . . . . . . . . . . . . . . . . . . . . . . . . . . 132.3 Virtual Meters. . . . . . . . . . . . . . . . . . . . . . . . . . . . . . . . . . . . . . . . . . . . . . . . . . . . . . . . . . . . . . . . . 132.4 Delta Meters. . . . . . . . . . . . . . . . . . . . . . . . . . . . . . . . . . . . . . . . . . . . . . . . . . . . . . . . . . . . . . . . . . 142.5 Supply Meters. . . . . . . . . . . . . . . . . . . . . . . . . . . . . . . . . . . . . . . . . . . . . . . . . . . . . . . . . . . . . . . . . 14
3 Master Data. . . . . . . . . . . . . . . . . . . . . . . . . . . . . . . . . . . . . . . . . . . . . . . . . . . . . . . . . . . . . . . . . . 163.1 Assets (ASSET). . . . . . . . . . . . . . . . . . . . . . . . . . . . . . . . . . . . . . . . . . . . . . . . . . . . . . . . . . . . . . . . 163.2 Calendar Item (CALITEM). . . . . . . . . . . . . . . . . . . . . . . . . . . . . . . . . . . . . . . . . . . . . . . . . . . . . . . . . 173.3 Emissions (ET). . . . . . . . . . . . . . . . . . . . . . . . . . . . . . . . . . . . . . . . . . . . . . . . . . . . . . . . . . . . . . . . 183.4 Measuring Point (MP). . . . . . . . . . . . . . . . . . . . . . . . . . . . . . . . . . . . . . . . . . . . . . . . . . . . . . . . . . . .183.5 Organization (ORG). . . . . . . . . . . . . . . . . . . . . . . . . . . . . . . . . . . . . . . . . . . . . . . . . . . . . . . . . . . . . 203.6 Products (PROD). . . . . . . . . . . . . . . . . . . . . . . . . . . . . . . . . . . . . . . . . . . . . . . . . . . . . . . . . . . . . . . 213.7 Projects (PROJECT). . . . . . . . . . . . . . . . . . . . . . . . . . . . . . . . . . . . . . . . . . . . . . . . . . . . . . . . . . . . . 213.8 Rate Type (RATETYPE). . . . . . . . . . . . . . . . . . . . . . . . . . . . . . . . . . . . . . . . . . . . . . . . . . . . . . . . . . 243.9 Resources (RES). . . . . . . . . . . . . . . . . . . . . . . . . . . . . . . . . . . . . . . . . . . . . . . . . . . . . . . . . . . . . . . 243.10 Units. . . . . . . . . . . . . . . . . . . . . . . . . . . . . . . . . . . . . . . . . . . . . . . . . . . . . . . . . . . . . . . . . . . . . . . 25
3.10.1 Currency From (CURFR). . . . . . . . . . . . . . . . . . . . . . . . . . . . . . . . . . . . . . . . . . . . . . . . . . 253.10.2 Currency To (CURTO). . . . . . . . . . . . . . . . . . . . . . . . . . . . . . . . . . . . . . . . . . . . . . . . . . . . 253.10.3 Resource From Unit (RESFRUNIT). . . . . . . . . . . . . . . . . . . . . . . . . . . . . . . . . . . . . . . . . . . 253.10.4 Resource Unit To (RESUNIT). . . . . . . . . . . . . . . . . . . . . . . . . . . . . . . . . . . . . . . . . . . . . . . 263.10.5 Unit From (UNITFR). . . . . . . . . . . . . . . . . . . . . . . . . . . . . . . . . . . . . . . . . . . . . . . . . . . . . .263.10.6 Unit Type (UNIT_TYPE). . . . . . . . . . . . . . . . . . . . . . . . . . . . . . . . . . . . . . . . . . . . . . . . . . . 26
2 © 2013 SAP AG or an SAP affiliate company. All rights reserved.SAP Energy and Environmental Intelligence Model Reference Guide
Table of Contents
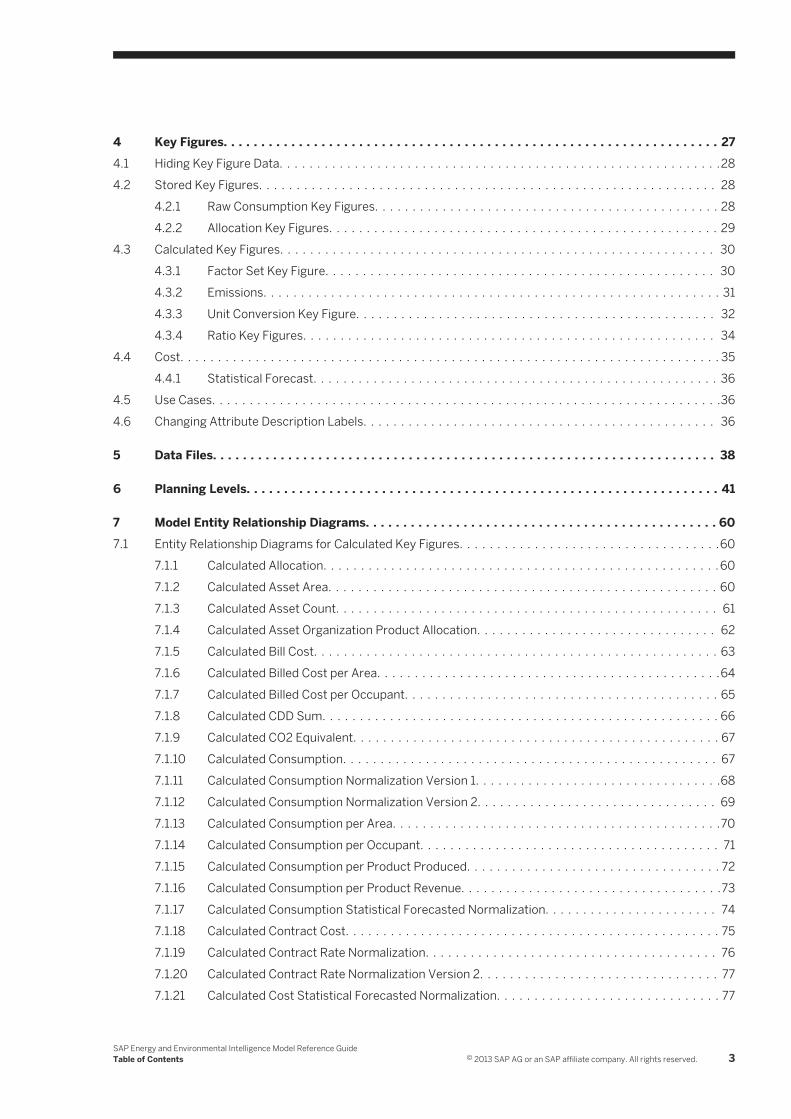
4 Key Figures. . . . . . . . . . . . . . . . . . . . . . . . . . . . . . . . . . . . . . . . . . . . . . . . . . . . . . . . . . . . . . . . . . 274.1 Hiding Key Figure Data. . . . . . . . . . . . . . . . . . . . . . . . . . . . . . . . . . . . . . . . . . . . . . . . . . . . . . . . . . .284.2 Stored Key Figures. . . . . . . . . . . . . . . . . . . . . . . . . . . . . . . . . . . . . . . . . . . . . . . . . . . . . . . . . . . . . 28
4.2.1 Raw Consumption Key Figures. . . . . . . . . . . . . . . . . . . . . . . . . . . . . . . . . . . . . . . . . . . . . . 284.2.2 Allocation Key Figures. . . . . . . . . . . . . . . . . . . . . . . . . . . . . . . . . . . . . . . . . . . . . . . . . . . . 29
4.3 Calculated Key Figures. . . . . . . . . . . . . . . . . . . . . . . . . . . . . . . . . . . . . . . . . . . . . . . . . . . . . . . . . . 304.3.1 Factor Set Key Figure. . . . . . . . . . . . . . . . . . . . . . . . . . . . . . . . . . . . . . . . . . . . . . . . . . . . 304.3.2 Emissions. . . . . . . . . . . . . . . . . . . . . . . . . . . . . . . . . . . . . . . . . . . . . . . . . . . . . . . . . . . . . 314.3.3 Unit Conversion Key Figure. . . . . . . . . . . . . . . . . . . . . . . . . . . . . . . . . . . . . . . . . . . . . . . . 324.3.4 Ratio Key Figures. . . . . . . . . . . . . . . . . . . . . . . . . . . . . . . . . . . . . . . . . . . . . . . . . . . . . . . 34
4.4 Cost. . . . . . . . . . . . . . . . . . . . . . . . . . . . . . . . . . . . . . . . . . . . . . . . . . . . . . . . . . . . . . . . . . . . . . . . 354.4.1 Statistical Forecast. . . . . . . . . . . . . . . . . . . . . . . . . . . . . . . . . . . . . . . . . . . . . . . . . . . . . . 36
4.5 Use Cases. . . . . . . . . . . . . . . . . . . . . . . . . . . . . . . . . . . . . . . . . . . . . . . . . . . . . . . . . . . . . . . . . . . .364.6 Changing Attribute Description Labels. . . . . . . . . . . . . . . . . . . . . . . . . . . . . . . . . . . . . . . . . . . . . . . 36
5 Data Files. . . . . . . . . . . . . . . . . . . . . . . . . . . . . . . . . . . . . . . . . . . . . . . . . . . . . . . . . . . . . . . . . . . 38
6 Planning Levels. . . . . . . . . . . . . . . . . . . . . . . . . . . . . . . . . . . . . . . . . . . . . . . . . . . . . . . . . . . . . . . 41
7 Model Entity Relationship Diagrams. . . . . . . . . . . . . . . . . . . . . . . . . . . . . . . . . . . . . . . . . . . . . . . 607.1 Entity Relationship Diagrams for Calculated Key Figures. . . . . . . . . . . . . . . . . . . . . . . . . . . . . . . . . . .60
7.1.1 Calculated Allocation. . . . . . . . . . . . . . . . . . . . . . . . . . . . . . . . . . . . . . . . . . . . . . . . . . . . . 607.1.2 Calculated Asset Area. . . . . . . . . . . . . . . . . . . . . . . . . . . . . . . . . . . . . . . . . . . . . . . . . . . . 607.1.3 Calculated Asset Count. . . . . . . . . . . . . . . . . . . . . . . . . . . . . . . . . . . . . . . . . . . . . . . . . . . 617.1.4 Calculated Asset Organization Product Allocation. . . . . . . . . . . . . . . . . . . . . . . . . . . . . . . . 627.1.5 Calculated Bill Cost. . . . . . . . . . . . . . . . . . . . . . . . . . . . . . . . . . . . . . . . . . . . . . . . . . . . . . 637.1.6 Calculated Billed Cost per Area. . . . . . . . . . . . . . . . . . . . . . . . . . . . . . . . . . . . . . . . . . . . . .647.1.7 Calculated Billed Cost per Occupant. . . . . . . . . . . . . . . . . . . . . . . . . . . . . . . . . . . . . . . . . . 657.1.8 Calculated CDD Sum. . . . . . . . . . . . . . . . . . . . . . . . . . . . . . . . . . . . . . . . . . . . . . . . . . . . . 667.1.9 Calculated CO2 Equivalent. . . . . . . . . . . . . . . . . . . . . . . . . . . . . . . . . . . . . . . . . . . . . . . . . 677.1.10 Calculated Consumption. . . . . . . . . . . . . . . . . . . . . . . . . . . . . . . . . . . . . . . . . . . . . . . . . . 677.1.11 Calculated Consumption Normalization Version 1. . . . . . . . . . . . . . . . . . . . . . . . . . . . . . . . .687.1.12 Calculated Consumption Normalization Version 2. . . . . . . . . . . . . . . . . . . . . . . . . . . . . . . . 697.1.13 Calculated Consumption per Area. . . . . . . . . . . . . . . . . . . . . . . . . . . . . . . . . . . . . . . . . . . .707.1.14 Calculated Consumption per Occupant. . . . . . . . . . . . . . . . . . . . . . . . . . . . . . . . . . . . . . . . 717.1.15 Calculated Consumption per Product Produced. . . . . . . . . . . . . . . . . . . . . . . . . . . . . . . . . . 727.1.16 Calculated Consumption per Product Revenue. . . . . . . . . . . . . . . . . . . . . . . . . . . . . . . . . . .737.1.17 Calculated Consumption Statistical Forecasted Normalization. . . . . . . . . . . . . . . . . . . . . . . 747.1.18 Calculated Contract Cost. . . . . . . . . . . . . . . . . . . . . . . . . . . . . . . . . . . . . . . . . . . . . . . . . . 757.1.19 Calculated Contract Rate Normalization. . . . . . . . . . . . . . . . . . . . . . . . . . . . . . . . . . . . . . . 767.1.20 Calculated Contract Rate Normalization Version 2. . . . . . . . . . . . . . . . . . . . . . . . . . . . . . . . 777.1.21 Calculated Cost Statistical Forecasted Normalization. . . . . . . . . . . . . . . . . . . . . . . . . . . . . . 77
SAP Energy and Environmental Intelligence Model Reference GuideTable of Contents © 2013 SAP AG or an SAP affiliate company. All rights reserved. 3

7.1.22 Calculated Currency Conversion Factor. . . . . . . . . . . . . . . . . . . . . . . . . . . . . . . . . . . . . . . .787.1.23 Calculated Currency Conversion Factor To. . . . . . . . . . . . . . . . . . . . . . . . . . . . . . . . . . . . . 797.1.24 Calculated Derived Cost. . . . . . . . . . . . . . . . . . . . . . . . . . . . . . . . . . . . . . . . . . . . . . . . . . . 797.1.25 Calculated Emission. . . . . . . . . . . . . . . . . . . . . . . . . . . . . . . . . . . . . . . . . . . . . . . . . . . . . 807.1.26 Calculated HDD Sum. . . . . . . . . . . . . . . . . . . . . . . . . . . . . . . . . . . . . . . . . . . . . . . . . . . . . 817.1.27 Calculated HHV Equivalent. . . . . . . . . . . . . . . . . . . . . . . . . . . . . . . . . . . . . . . . . . . . . . . . . 827.1.28 Calculated Normalized Emission. . . . . . . . . . . . . . . . . . . . . . . . . . . . . . . . . . . . . . . . . . . . .827.1.29 Calculated on Peak Demand. . . . . . . . . . . . . . . . . . . . . . . . . . . . . . . . . . . . . . . . . . . . . . . . 837.1.30 Calculated Production Produced. . . . . . . . . . . . . . . . . . . . . . . . . . . . . . . . . . . . . . . . . . . . .847.1.31 Calculated Project Allocation. . . . . . . . . . . . . . . . . . . . . . . . . . . . . . . . . . . . . . . . . . . . . . . 857.1.32 Calculated Raw Asset Area. . . . . . . . . . . . . . . . . . . . . . . . . . . . . . . . . . . . . . . . . . . . . . . . .867.1.33 Calculated Raw Consumption. . . . . . . . . . . . . . . . . . . . . . . . . . . . . . . . . . . . . . . . . . . . . . . 877.1.34 Calculated Raw Consumption Normalization. . . . . . . . . . . . . . . . . . . . . . . . . . . . . . . . . . . . 887.1.35 Calculated Raw Peak on Demand. . . . . . . . . . . . . . . . . . . . . . . . . . . . . . . . . . . . . . . . . . . . 897.1.36 Calculated Raw Product Produced. . . . . . . . . . . . . . . . . . . . . . . . . . . . . . . . . . . . . . . . . . . 907.1.37 Calculated Raw Product Revenue. . . . . . . . . . . . . . . . . . . . . . . . . . . . . . . . . . . . . . . . . . . . 917.1.38 Calculated Raw Stored Emission. . . . . . . . . . . . . . . . . . . . . . . . . . . . . . . . . . . . . . . . . . . . . 917.1.39 Calculated Resource Conversion Factor. . . . . . . . . . . . . . . . . . . . . . . . . . . . . . . . . . . . . . . 927.1.40 Calculated Resource Conversion Factor DEN. . . . . . . . . . . . . . . . . . . . . . . . . . . . . . . . . . . . 937.1.41 Calculated Resource Conversion Factor NUM. . . . . . . . . . . . . . . . . . . . . . . . . . . . . . . . . . . 947.1.42 Calculated Savings Unit. . . . . . . . . . . . . . . . . . . . . . . . . . . . . . . . . . . . . . . . . . . . . . . . . . . 947.1.43 Calculated Savings Currency. . . . . . . . . . . . . . . . . . . . . . . . . . . . . . . . . . . . . . . . . . . . . . . 957.1.44 Calculated Standard Rate Normalization. . . . . . . . . . . . . . . . . . . . . . . . . . . . . . . . . . . . . . . 967.1.45 Calculated Stored Emission. . . . . . . . . . . . . . . . . . . . . . . . . . . . . . . . . . . . . . . . . . . . . . . . 977.1.46 Calculated Total Project Budget. . . . . . . . . . . . . . . . . . . . . . . . . . . . . . . . . . . . . . . . . . . . . 987.1.47 Calculated Total Project Cost. . . . . . . . . . . . . . . . . . . . . . . . . . . . . . . . . . . . . . . . . . . . . . . 98
7.2 Entity Relationship for Input Key Figures. . . . . . . . . . . . . . . . . . . . . . . . . . . . . . . . . . . . . . . . . . . . . . 997.2.1 Input Asset Area. . . . . . . . . . . . . . . . . . . . . . . . . . . . . . . . . . . . . . . . . . . . . . . . . . . . . . . . 997.2.2 Input Asset Head Count. . . . . . . . . . . . . . . . . . . . . . . . . . . . . . . . . . . . . . . . . . . . . . . . . . 1007.2.3 Input Asset Organization Allocation. . . . . . . . . . . . . . . . . . . . . . . . . . . . . . . . . . . . . . . . . . 1007.2.4 Input Asset Product Allocation. . . . . . . . . . . . . . . . . . . . . . . . . . . . . . . . . . . . . . . . . . . . . .1017.2.5 Input Calendar Item Assignment. . . . . . . . . . . . . . . . . . . . . . . . . . . . . . . . . . . . . . . . . . . . 1017.2.6 Input Contract Rate. . . . . . . . . . . . . . . . . . . . . . . . . . . . . . . . . . . . . . . . . . . . . . . . . . . . . 1017.2.7 Input Currency Inverted Normalization Factor. . . . . . . . . . . . . . . . . . . . . . . . . . . . . . . . . . 1027.2.8 Input Currency Normalization Factor. . . . . . . . . . . . . . . . . . . . . . . . . . . . . . . . . . . . . . . . . 1027.2.9 Input Measuring Point Asset Allocation. . . . . . . . . . . . . . . . . . . . . . . . . . . . . . . . . . . . . . . 1037.2.10 Input Measuring Point HHV Factor. . . . . . . . . . . . . . . . . . . . . . . . . . . . . . . . . . . . . . . . . . .1037.2.11 Input Measuring Point Rate Type Assignment. . . . . . . . . . . . . . . . . . . . . . . . . . . . . . . . . . .1047.2.12 Input Measuring Point CO2EFactor. . . . . . . . . . . . . . . . . . . . . . . . . . . . . . . . . . . . . . . . . . 1057.2.13 Input Normalization Factor DEN. . . . . . . . . . . . . . . . . . . . . . . . . . . . . . . . . . . . . . . . . . . . 1057.2.14 Input Normalization Factor Inverted DEN. . . . . . . . . . . . . . . . . . . . . . . . . . . . . . . . . . . . . . 106
4 © 2013 SAP AG or an SAP affiliate company. All rights reserved.SAP Energy and Environmental Intelligence Model Reference Guide
Table of Contents
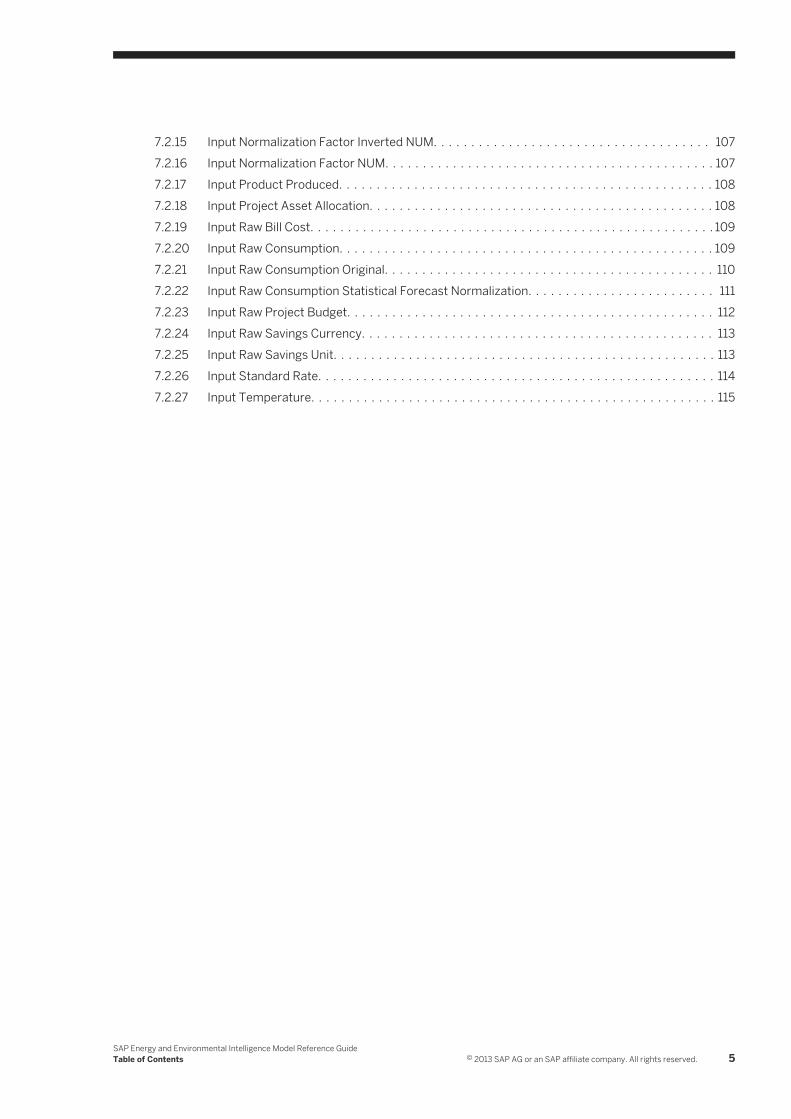
7.2.15 Input Normalization Factor Inverted NUM. . . . . . . . . . . . . . . . . . . . . . . . . . . . . . . . . . . . . 1077.2.16 Input Normalization Factor NUM. . . . . . . . . . . . . . . . . . . . . . . . . . . . . . . . . . . . . . . . . . . . 1077.2.17 Input Product Produced. . . . . . . . . . . . . . . . . . . . . . . . . . . . . . . . . . . . . . . . . . . . . . . . . . 1087.2.18 Input Project Asset Allocation. . . . . . . . . . . . . . . . . . . . . . . . . . . . . . . . . . . . . . . . . . . . . . 1087.2.19 Input Raw Bill Cost. . . . . . . . . . . . . . . . . . . . . . . . . . . . . . . . . . . . . . . . . . . . . . . . . . . . . . 1097.2.20 Input Raw Consumption. . . . . . . . . . . . . . . . . . . . . . . . . . . . . . . . . . . . . . . . . . . . . . . . . . 1097.2.21 Input Raw Consumption Original. . . . . . . . . . . . . . . . . . . . . . . . . . . . . . . . . . . . . . . . . . . . 1107.2.22 Input Raw Consumption Statistical Forecast Normalization. . . . . . . . . . . . . . . . . . . . . . . . . 1117.2.23 Input Raw Project Budget. . . . . . . . . . . . . . . . . . . . . . . . . . . . . . . . . . . . . . . . . . . . . . . . . 1127.2.24 Input Raw Savings Currency. . . . . . . . . . . . . . . . . . . . . . . . . . . . . . . . . . . . . . . . . . . . . . . 1137.2.25 Input Raw Savings Unit. . . . . . . . . . . . . . . . . . . . . . . . . . . . . . . . . . . . . . . . . . . . . . . . . . . 1137.2.26 Input Standard Rate. . . . . . . . . . . . . . . . . . . . . . . . . . . . . . . . . . . . . . . . . . . . . . . . . . . . . 1147.2.27 Input Temperature. . . . . . . . . . . . . . . . . . . . . . . . . . . . . . . . . . . . . . . . . . . . . . . . . . . . . . 115
SAP Energy and Environmental Intelligence Model Reference GuideTable of Contents © 2013 SAP AG or an SAP affiliate company. All rights reserved. 5
1 Model ConceptsSAP Energy and Environmental Intelligence (SAP EEI)includes an out-of-the-box, comprehensive data model that represents both how and what companies typically track for enterprise energy management.
Data modeling defines how you refine, or slice and dice, data in database tables by creating views to depict a business scenario. You can use these views for reporting or decision making. The modeling process involves the simulation of entities such as asset, resources, and measuring points, and the relationships between them. These related entities can be used in analytics applications such as SAP EEI.
1.1 Data Model
A data model is a collection of master data and input data.
The data model is a master plan that defines how your information is stored and aggregated in the system. The key component of this model is the planning area, which contains all of the elements that represent the data's key structure, and is directly tied to a timeline.
It contains the following components:
● Attributes
● Master Data Objects (also known as planning objects)
● Time Profiles
● Planning Areas
● Planning Levels
● Key Figures
● Calculations
1.2 Master Data, Attributes, and Dimensions
Master data, also known as planning objects, is the part of an application data model that represents the structure of relevant business context in terms of central and “stable” business objects.
Planning objects represent your master data. SAP EEI models dimensions, which are master data in the system, as planning objects. Dimensions include things such as assets, organizations, and measuring point hierarchies, which are some of the main data categories within the SAP EEI data model. Resources are also modeled as planning objects, such as electricity and natural gas.. These master data objects are simple. You can create compound master data objects by combining two or more simple master data objects, for example Project Allocation. In addition, there are reference master data objects, which are master data objects that refer to another existing master data object. This simplifies data maintenance.
You can load data into simple and compound master data objects, but you cannot load data into reference master data objects.
6 © 2013 SAP AG or an SAP affiliate company. All rights reserved.SAP Energy and Environmental Intelligence Model Reference Guide
Model Concepts
Master data objects can have many attributes or supporting data. For example, attributes of the measuring point master data object could be supplier and type, etc. Attributes are characteristics of master data objects, which can be numeric or non-numeric.
1.3 Time Profile
A time profile is the time component of a dimension; it defines the various levels of time buckets, each with a unique ID (an integer), in which data can be managed.
The timeline is an ordered, linear sequence of non-overlapping buckets or periods. These periods do not have to be continuous. A Time Profile has a unique ID (an integer), which increases with time for each time profile level, and each Period has a defined duration (from start to end time). Examples of Time Profile levels are Years, Quarters, Months, Weeks, and 15-minute increments. These are customizable, which gives you the flexibility to organize your data.
You can define hierarchies for Time Profiles, beginning by defining the lowest node, for example daily, and moving to the higher ones, for example weekly, monthly, quarterly, yearly, etc. The most granular level has an ID of 1, and then they go up to 2, 3, 4, 5, etc.
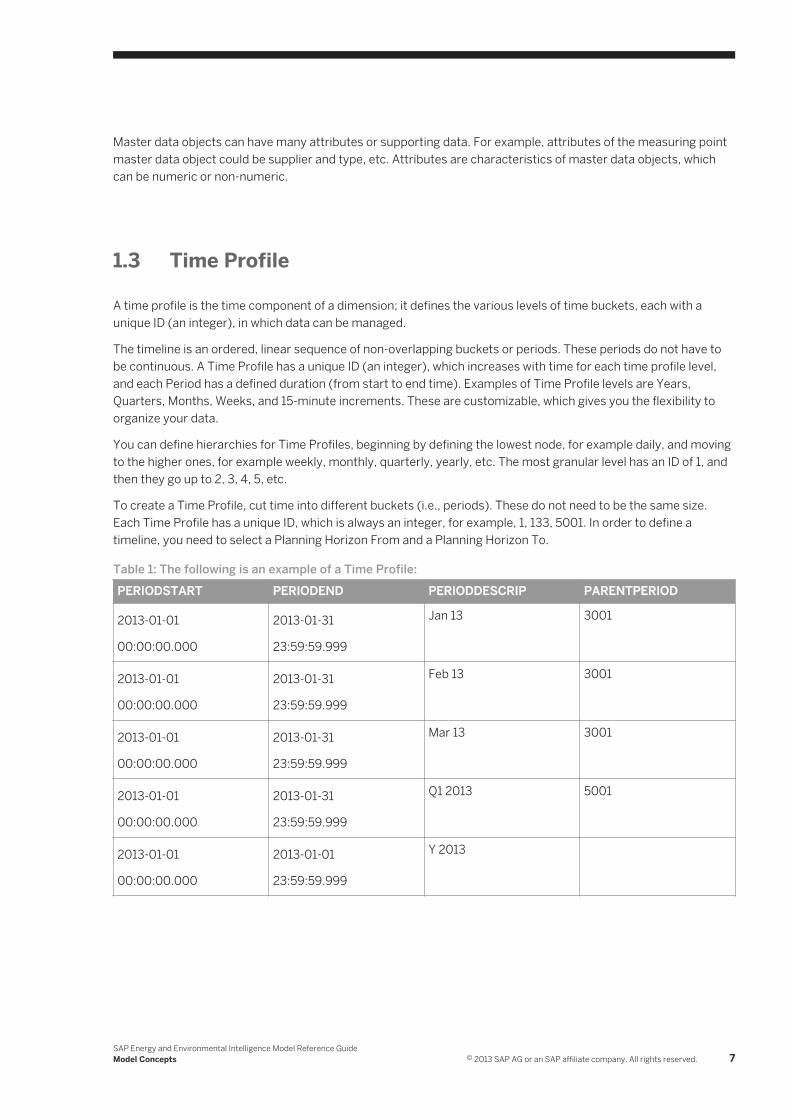
To create a Time Profile, cut time into different buckets (i.e., periods). These do not need to be the same size. Each Time Profile has a unique ID, which is always an integer, for example, 1, 133, 5001. In order to define a timeline, you need to select a Planning Horizon From and a Planning Horizon To.
Table 1: The following is an example of a Time Profile:PERIODSTART PERIODEND PERIODDESCRIP PARENTPERIOD
2013-01-01
00:00:00.000
2013-01-31
23:59:59.999
Jan 13 3001
2013-01-01
00:00:00.000
2013-01-31
23:59:59.999
Feb 13 3001
2013-01-01
00:00:00.000
2013-01-31
23:59:59.999
Mar 13 3001
2013-01-01
00:00:00.000
2013-01-31
23:59:59.999
Q1 2013 5001
2013-01-01
00:00:00.000
2013-01-01
23:59:59.999
Y 2013
SAP Energy and Environmental Intelligence Model Reference GuideModel Concepts © 2013 SAP AG or an SAP affiliate company. All rights reserved. 7

1.4 Hierarchies
The model data is hierarchical in nature; the levels are not fixed, and you can define as many levels as necessary.
You need to assign allocations to measure and roll over your values. The following illustration shows a multi-level, parent-child hierarchy.
In this tree, the Embarcadero facility comprises two buildings and a parking lot. The Embarcadero and SOMA facilities combine to create the San Francisco complex, which belongs to the USA unit; this in turn belongs to the company’s global operations.
1.5 Planning Area
A planning area describes the structure of an SAP EEI plan and is defined by a set of configuration elements that include attributes, Time profile, planning levels, key figures, and scenarios.
In the SAP EEI solution you can generate tables to visualize information viaplanning views and support the SAP EEI process. These planning areas may contain many plan datasets - one actual dataset and many scenario
8 © 2013 SAP AG or an SAP affiliate company. All rights reserved.SAP Energy and Environmental Intelligence Model Reference Guide
Model Concepts
datasets. This is the same as different versions of data to perform energy analysis. A company may have multiple planning areas to enable the process of energy management in different business units.
A planning area comprises:
● ID
● Description
● Time profile
○ Time profile storage level (for example, 1 or 2)
● Planning horizon
● List of available attributes (and which master data type they come from)
● Planning level
● Key figures
● Scenarios
1.6 Measuring Point, Asset, and Allocation
The main master data type is the measuring point, which is a value that is allocated.
The measuring point functions much like a monthly utilities bill, or an electricity counter attached to your house. An asset is the entity to which the measuring point is allocated. Measuring points and assets are separate. While an asset represents a physical hierarchy (for example, three buildings are physical structures), a measuring point represents, for example, the natural gas purchased for an entire complex of buildings (as opposed to one, specific building), or the natural gas used by cafeterias that are parts of different buildings in a complex.
Measuring points are not necessarily aligned with asset hierarchy; they allow you to capture data, while asset hierarchies allow you to break up assets logically (for example, identifying separate, physical buildings from a facilities management perspective).
Normally, a measuring point is assigned to only one asset, but there are some instances in which multiple measuring points are assigned to multiple assets. For example, you can assign natural gas to multiple buildings, or water for Building 1 and 2 could be on a single counter, or a single utilities bill.
In order to determine the assignment of measuring points to assets, you need allocation, which determines how the measuring points and assets are connected. For example, measuring point A could be allocated 20% in Building 1 and 80% in Building 2. This allocation might change over time, so EERM allows you to change this master data every month. Until the data changes, you can use the data duplication feature to replicate the data going forward.
1.6.1 Negative Allocation
Allocation can be negative; it does not necessarily add up to 1, which represents 100% in the model.
For example, if you measure electricity consumption for lighting in a parking area attached to Building 1, you need to separate the electricity consumed in the parking area from that consumed in Building 1. For example, the
SAP Energy and Environmental Intelligence Model Reference GuideModel Concepts © 2013 SAP AG or an SAP affiliate company. All rights reserved. 9
facilities team might begin by estimating parking area electricity consumption based on a number of factors, including number of light bulbs, seasons, time of day, etc. Using the measuring point, facilities could assign 100% of the electricity consumption to building 1, and then subtract the estimated parking area consumption from building 1. This results in a negative allocation.
1.6.2 Dimension Relationships
Measuring points are hierarchical.
This hierarchy is related to the way you measure energy with a meter structure comprised of master meters, sub-meters, and virtual meters. The meter structure allows you to install internal meters and break down your energy consumption and costs, so that you can better manage your energy resources and consumption.
The facilities structure determines how you manage your assets. This is not necessarily related to the meter structure, although the two structures are often close to each other because they are physical. There is no one-to-one correlation between the two structures.
1.7 Unit of Measure
Multiple key figures require unit of measure (UOM) conversions, the most important of which is resource consumption, which permeates the whole application with the derived field from consumption values.
Other fields that need unit conversions are asset area, and additional key figures for ratio KPI. The UOM conversion for consumption field is different than the standard unit conversion, due to the material type requirement, which allows conversions across unit type (for example, from volumes unit to energy unit).
1.7.1 Planning Objects
RESUNIT and RESFRUNIT are two important planning objects in the data model.
● RESFRUNITUsed to load data into the system. This allows you to display on the user interface the original unit used to load the data, as well as troubleshoot any issues.
● RESUNITAllows you to select the unit to display key figures that are associated with UOMs. In order to correctly display key figures associated with UOMs, you need to select/filter by UOMs. Otherwise, incorrect data will be displayed.
These two planning objects are aliases of the planning object UNIT.
10 © 2013 SAP AG or an SAP affiliate company. All rights reserved.SAP Energy and Environmental Intelligence Model Reference Guide
Model Concepts
1.7.2 Material Type and UOM Conversion Factors
There is a material type field in the environmental resource planning objects.
Note that multiple environmental resources can be of the same material type. For each material type, UOM conversion factors are loaded. These conversion factors can work across unit types (for example, from KGs to BTUs) depending on the material properties For each material type a normalized UOM is defined.
This unit has two roles in the model:
● Pivoting unitYou only need to load conversions factor from and to the normalized unit, instead of across products from all source units to all possible target units. For example, the normalized unit for material type General Energy is KWH. If consumption with General Energy is loaded in MWH, then this is converted into KWH and can be consumed by other calculations that require consumption as an input.
● Normalized field computationThese are the bases of other calculations, for example, computing the cost as rate*normalized consumption.
To prevent decimal precision loss, the conversions factors are loaded as a fraction. You load the numerator and the denominator values using CSV files. For example, the conversion factor from seconds to minutes is 1/60. You load the numerator of 1, and denominator of 60 in the CSV file. The alternative is to load the factor as a decimal expression 0.016667, which results in rounding issues in the system. For example, if you convert 3600 seconds to minutes using this factor, the result is 60.0012. However, using the fraction approach 3600*Numerator(1)/Denominator(60) produces a correct value of 60.0000.
1.7.3 Normalized Fields
Normalized fields exist for key figures for the main UOM-driven key figures (for example, consumption).
In order to calculate emission outputs, key figures such as consumption need to be multiplied by emission factors. The emission factors are expressed as normalized units; therefore, in order to calculate correctly, you also need to normalize the consumption with the same normalized unit.
For example, the CO2e emission factor for electricity is 0.12 MT CO2E/KWH. If you load electricity consumption in MWH, the system needs to convert the electricity consumption to the normalized unit of KWH before calculating the CO2E emissions as the indicated factor.
1.8 Currency
Currency uses the concept of normalized currency for calculation purposes similar to those of UOM.
The following two master data objects are particularly important to currency:
● Currency From (CURRFR)Loads monetary data
● Currency To (CURRTO)Displays monetary data
SAP Energy and Environmental Intelligence Model Reference GuideModel Concepts © 2013 SAP AG or an SAP affiliate company. All rights reserved. 11

For currency, there is no conversion across unit types. For example, this is not supported to convert from U.S. dollars to kilowatt-hours); therefore the concept of material type is not needed.
As in the case of UOM, you need to select a currency from the TO field in the application to correctly display monetary key figures.
12 © 2013 SAP AG or an SAP affiliate company. All rights reserved.SAP Energy and Environmental Intelligence Model Reference Guide
Model Concepts
2 Energy Concepts
2.1 Meters
Physical and virtual meters allow you to track energy consumption and, in some cases, energy supply.
Installed meters allow you to pinpoint and track specific consumption areas within a facility. Physical meters can include sub-meters or utility meters, and they are modeled as measuring points.
2.2 Sub-meters
You can use the hierarchical nature of measuring points to create sub-meters, which are internally installed meters that allow you to pinpoint and track specific consumption areas within a facility.
For example, if your company’s electricity bill is high and you want to determine the cause, you can install sub-meters on each production line in a building. You might connect that sub-meter to special equipment, for example, a boiler or air conditioning unit. In this example, a single input is connected to a transformer bank for your building complex, and from there you get an output to the individual buildings in that complex.
The utilities contractor can send your company separate bills for different kinds of usage. If you want a single bill for your San Francisco complex, for example, you can install in-house sub-meters for internal accounting purposes, to monitor consumption within the separate facilities in the complex.
The sub-meters themselves are hierarchical and have multiple levels, which allows you to break down a parent into smaller child entities. For example, you can have a sub-meter for building 1 in your complex, a sub-meter for buildings 2 and 3, and another assigned to the parking area. The consumption of all the sub-meters must equal the parent, in this case your building complex.
2.3 Virtual Meters
Virtual meters are measuring points that are calculated by rules; they are neither physical nor manually entered meters.
Virtual meters are used when the installation of physical meters is not possible or, as is most often the case, physical meters are not cost-effective. They are modeled as a measuring point of type Virtual. For regulatory reporting, the reports need to explain which portion of the overall figures are based on virtual meters and are consequently only approximations.
Virtual meters account for energy tracking not covered by sub-meters; they represent the difference between the total of the sub-meters and the master meter or parent. For example, if the air conditioning in building 7 of your office complex consumes too much energy, you can install a sub-meter to track the air conditioning consumption. If the rest of the building consumes normal amounts of energy, you do not need to install other sub-meters. If, for example, the air conditioning consumes 30,000 kilowatts of electricity and total electricity consumption for the building is 100,000, the difference is 70,000, which represents the virtual meter.
SAP Energy and Environmental Intelligence Model Reference GuideEnergy Concepts © 2013 SAP AG or an SAP affiliate company. All rights reserved. 13
You can associate a virtual meter with any master meter or parent. The sum of the children or sub-meters, plus the virtual meter, must equal the parent. The virtual meter represents the difference between the parent and the sum of the children.
A virtual meter behaves in the system like other meters modeled as measuring points in the following ways:
● You can assign a virtual meter to an asset hierarchy node (or to any other EA object where a “real” measuring point can be assigned)
● A virtual meter is aggregated throughout any asset, organization, or other reporting hierarchy or structure (i.e., product)
● You can drill down to the single values of a virtual meter
● You can define thresholds based on a virtual meter
2.4 Delta Meters
To measure the difference between a specified number of physical meters, the system supports delta meters, which are a special kind of virtual meter.
The meters used in the calculation of a delta meter can have different types associated with them, for example, manual, automatic, or virtual. A delta meter is the result of sub-metering. When there are several higher level meters and, logically, one or more sub-meters below, there will be a difference between the sum of the higher level meters and the sum of the sub-meters. This difference occurs due to energy losses from electrical resistance, for example, or because sub-metering is incomplete and there are energy consumers measured only by the higher level meters and are not "behind" a sub-meter.
2.5 Supply Meters
For companies that measure their own energy output or the energy supply from a utility company at points of delivery (POD), SAP EEI provides supply meters.
These meters allow the system to calculate virtual delta meters by taking the difference across siblings in a branch of the measuring point hierarchy.
The pre-defined model in SAP EEI supports two different approaches that allow you to leverage delta meters for supply scenarios:
In use case A, the following occurs:
● The customer sets up the virtual delta meter as a measuring point with type virtual.
● The system assumes that a measuring point of type virtual is calculated by taking the measuring point’s parent and subtracting all children of type Real or Estimated
An example of this is as follows:
● Parent 1: type Estimated
○ Child 11: type Real
14 © 2013 SAP AG or an SAP affiliate company. All rights reserved.SAP Energy and Environmental Intelligence Model Reference Guide
Energy Concepts

○ Child 12: type Real○ Child 13: type Virtual
In use case B, The system must calculate virtual delta meters by taking the difference across siblings in a branch of the measuring point hierarchy.
An example of use case B is as follows:
● Parent 1: type Placeholder
○ Child 11: type Consumption Placeholder
○ Child 111: type Real○ Child 112: type Real○ Child 113: type Real
○ Child 12: type Supply Placeholder
○ Child 121: type Real○ Child 122: type Real○ Child 123: type Real
○ Child 13: type Virtual
When preparing the data set, the load files contain a flag/field called Rollup in Meter master data. If that value is set to 1, data will roll up; if it is set to 0, data will not roll up. The following table demonstrates how both virtual meter use cases are supported by the data model.
In use case A, Virtual Delta Meter 1 = 200 - 150 = 50
In use case B, Virtual Delta Meter 2= 200 - 130 = 70
SAP Energy and Environmental Intelligence Model Reference GuideEnergy Concepts © 2013 SAP AG or an SAP affiliate company. All rights reserved. 15
3 Master Data
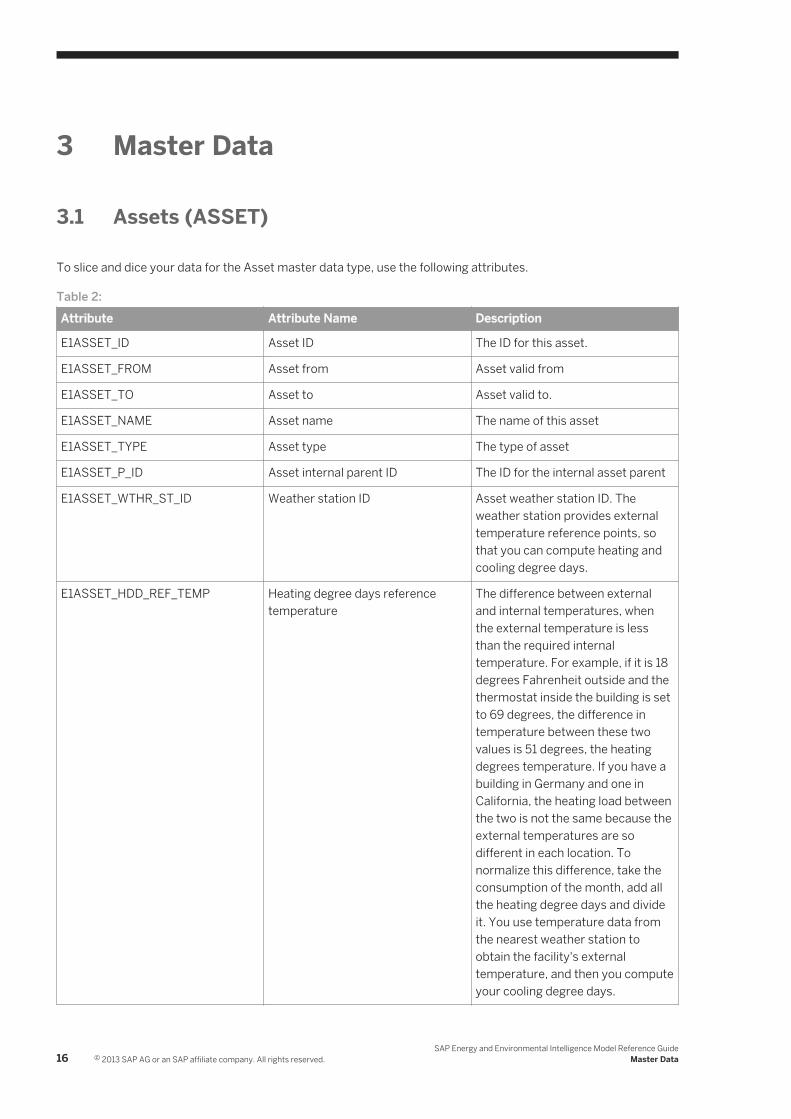
3.1 Assets (ASSET)
To slice and dice your data for the Asset master data type, use the following attributes.
Table 2:Attribute Attribute Name Description
E1ASSET_ID Asset ID The ID for this asset.
E1ASSET_FROM Asset from Asset valid from
E1ASSET_TO Asset to Asset valid to.
E1ASSET_NAME Asset name The name of this asset
E1ASSET_TYPE Asset type The type of asset
E1ASSET_P_ID Asset internal parent ID The ID for the internal asset parent
E1ASSET_WTHR_ST_ID Weather station ID Asset weather station ID. The weather station provides external temperature reference points, so that you can compute heating and cooling degree days.
E1ASSET_HDD_REF_TEMP Heating degree days reference temperature
The difference between external and internal temperatures, when the external temperature is less than the required internal temperature. For example, if it is 18 degrees Fahrenheit outside and the thermostat inside the building is set to 69 degrees, the difference in temperature between these two values is 51 degrees, the heating degrees temperature. If you have a building in Germany and one in California, the heating load between the two is not the same because the external temperatures are so different in each location. To normalize this difference, take the consumption of the month, add all the heating degree days and divide it. You use temperature data from the nearest weather station to obtain the facility's external temperature, and then you compute your cooling degree days.
16 © 2013 SAP AG or an SAP affiliate company. All rights reserved.SAP Energy and Environmental Intelligence Model Reference Guide
Master Data
Attribute Attribute Name Description
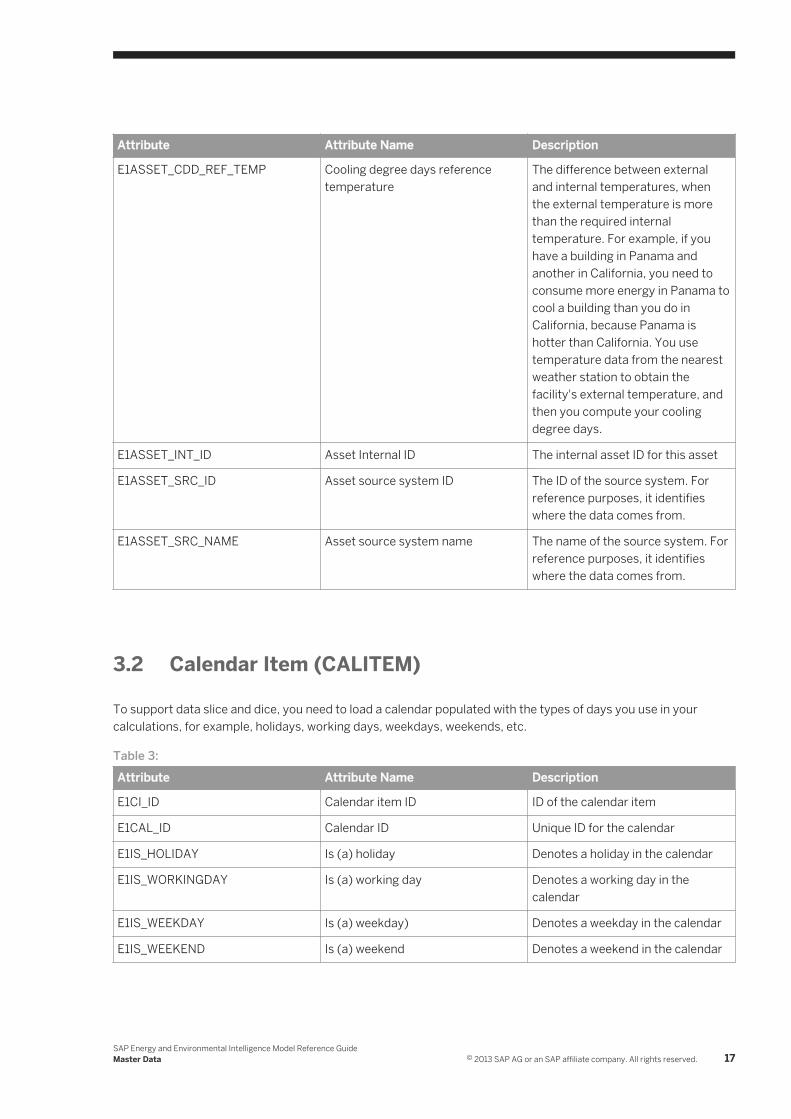
E1ASSET_CDD_REF_TEMP Cooling degree days reference temperature
The difference between external and internal temperatures, when the external temperature is more than the required internal temperature. For example, if you have a building in Panama and another in California, you need to consume more energy in Panama to cool a building than you do in California, because Panama is hotter than California. You use temperature data from the nearest weather station to obtain the facility's external temperature, and then you compute your cooling degree days.
E1ASSET_INT_ID Asset Internal ID The internal asset ID for this asset
E1ASSET_SRC_ID Asset source system ID The ID of the source system. For reference purposes, it identifies where the data comes from.
E1ASSET_SRC_NAME Asset source system name The name of the source system. For reference purposes, it identifies where the data comes from.
3.2 Calendar Item (CALITEM)
To support data slice and dice, you need to load a calendar populated with the types of days you use in your calculations, for example, holidays, working days, weekdays, weekends, etc.
Table 3:Attribute Attribute Name Description
E1CI_ID Calendar item ID ID of the calendar item
E1CAL_ID Calendar ID Unique ID for the calendar
E1IS_HOLIDAY Is (a) holiday Denotes a holiday in the calendar
E1IS_WORKINGDAY Is (a) working day Denotes a working day in the calendar
E1IS_WEEKDAY Is (a) weekday) Denotes a weekday in the calendar
E1IS_WEEKEND Is (a) weekend Denotes a weekend in the calendar
SAP Energy and Environmental Intelligence Model Reference GuideMaster Data © 2013 SAP AG or an SAP affiliate company. All rights reserved. 17
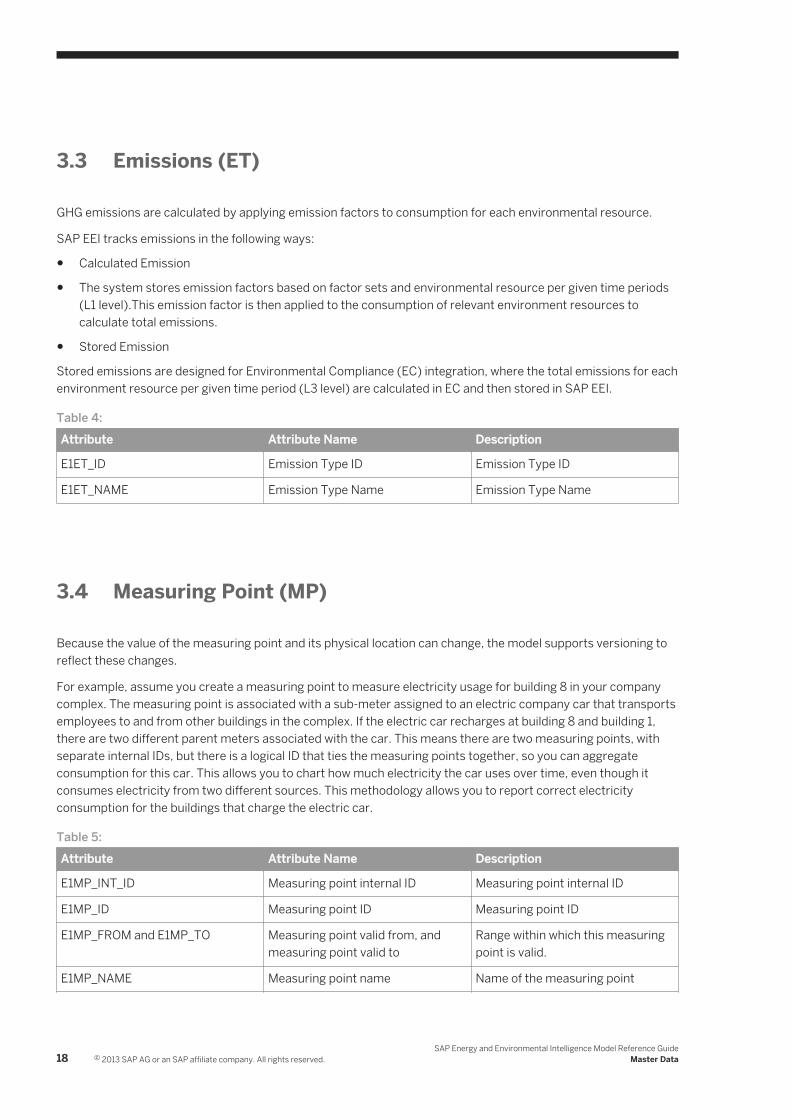
3.3 Emissions (ET)
GHG emissions are calculated by applying emission factors to consumption for each environmental resource.
SAP EEI tracks emissions in the following ways:
● Calculated Emission
● The system stores emission factors based on factor sets and environmental resource per given time periods (L1 level).This emission factor is then applied to the consumption of relevant environment resources to calculate total emissions.
● Stored Emission
Stored emissions are designed for Environmental Compliance (EC) integration, where the total emissions for each environment resource per given time period (L3 level) are calculated in EC and then stored in SAP EEI.
Table 4:Attribute Attribute Name Description
E1ET_ID Emission Type ID Emission Type ID
E1ET_NAME Emission Type Name Emission Type Name
3.4 Measuring Point (MP)
Because the value of the measuring point and its physical location can change, the model supports versioning to reflect these changes.
For example, assume you create a measuring point to measure electricity usage for building 8 in your company complex. The measuring point is associated with a sub-meter assigned to an electric company car that transports employees to and from other buildings in the complex. If the electric car recharges at building 8 and building 1, there are two different parent meters associated with the car. This means there are two measuring points, with separate internal IDs, but there is a logical ID that ties the measuring points together, so you can aggregate consumption for this car. This allows you to chart how much electricity the car uses over time, even though it consumes electricity from two different sources. This methodology allows you to report correct electricity consumption for the buildings that charge the electric car.
Table 5:Attribute Attribute Name Description
E1MP_INT_ID Measuring point internal ID Measuring point internal ID
E1MP_ID Measuring point ID Measuring point ID
E1MP_FROM and E1MP_TO Measuring point valid from, and measuring point valid to
Range within which this measuring point is valid.
E1MP_NAME Measuring point name Name of the measuring point
18 © 2013 SAP AG or an SAP affiliate company. All rights reserved.SAP Energy and Environmental Intelligence Model Reference Guide
Master Data
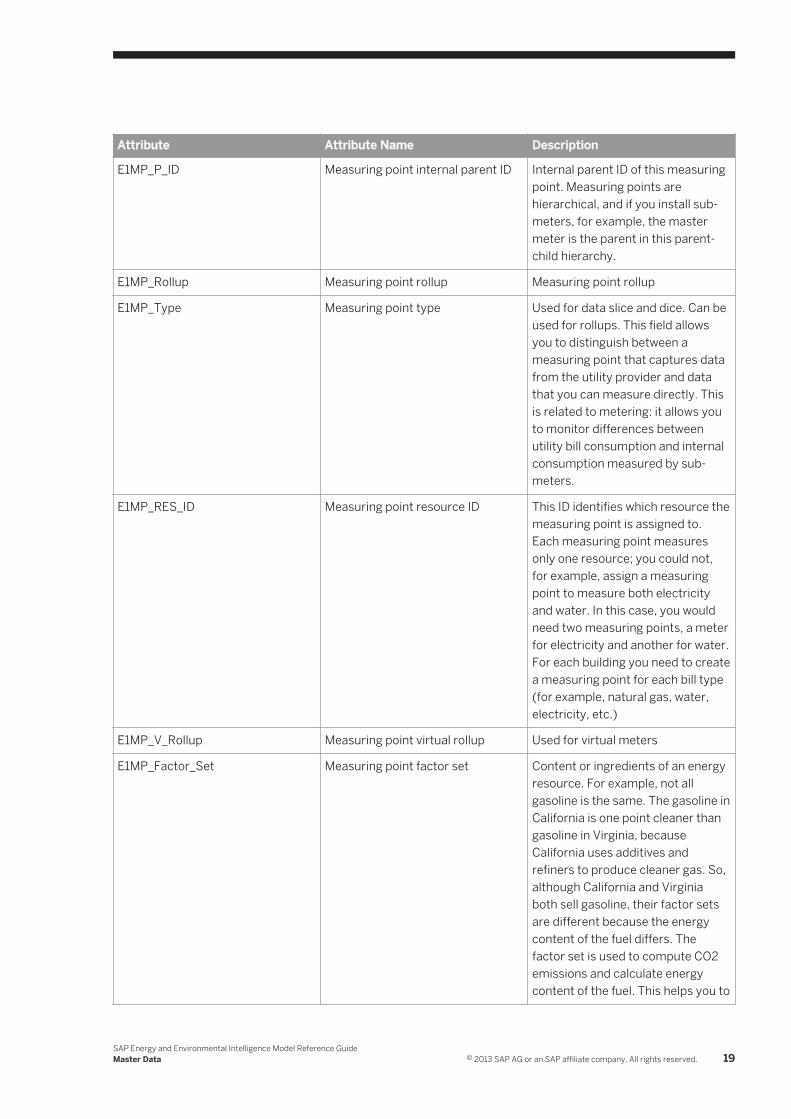
Attribute Attribute Name Description
E1MP_P_ID Measuring point internal parent ID Internal parent ID of this measuring point. Measuring points are hierarchical, and if you install sub-meters, for example, the master meter is the parent in this parent-child hierarchy.
E1MP_Rollup Measuring point rollup Measuring point rollup
E1MP_Type Measuring point type Used for data slice and dice. Can be used for rollups. This field allows you to distinguish between a measuring point that captures data from the utility provider and data that you can measure directly. This is related to metering: it allows you to monitor differences between utility bill consumption and internal consumption measured by sub-meters.
E1MP_RES_ID Measuring point resource ID This ID identifies which resource the measuring point is assigned to. Each measuring point measures only one resource; you could not, for example, assign a measuring point to measure both electricity and water. In this case, you would need two measuring points, a meter for electricity and another for water. For each building you need to create a measuring point for each bill type (for example, natural gas, water, electricity, etc.)
E1MP_V_Rollup Measuring point virtual rollup Used for virtual meters
E1MP_Factor_Set Measuring point factor set Content or ingredients of an energy resource. For example, not all gasoline is the same. The gasoline in California is one point cleaner than gasoline in Virginia, because California uses additives and refiners to produce cleaner gas. So, although California and Virginia both sell gasoline, their factor sets are different because the energy content of the fuel differs. The factor set is used to compute CO2 emissions and calculate energy content of the fuel. This helps you to
SAP Energy and Environmental Intelligence Model Reference GuideMaster Data © 2013 SAP AG or an SAP affiliate company. All rights reserved. 19
Attribute Attribute Name Description
identify and respond to greenhouse gases impacts.
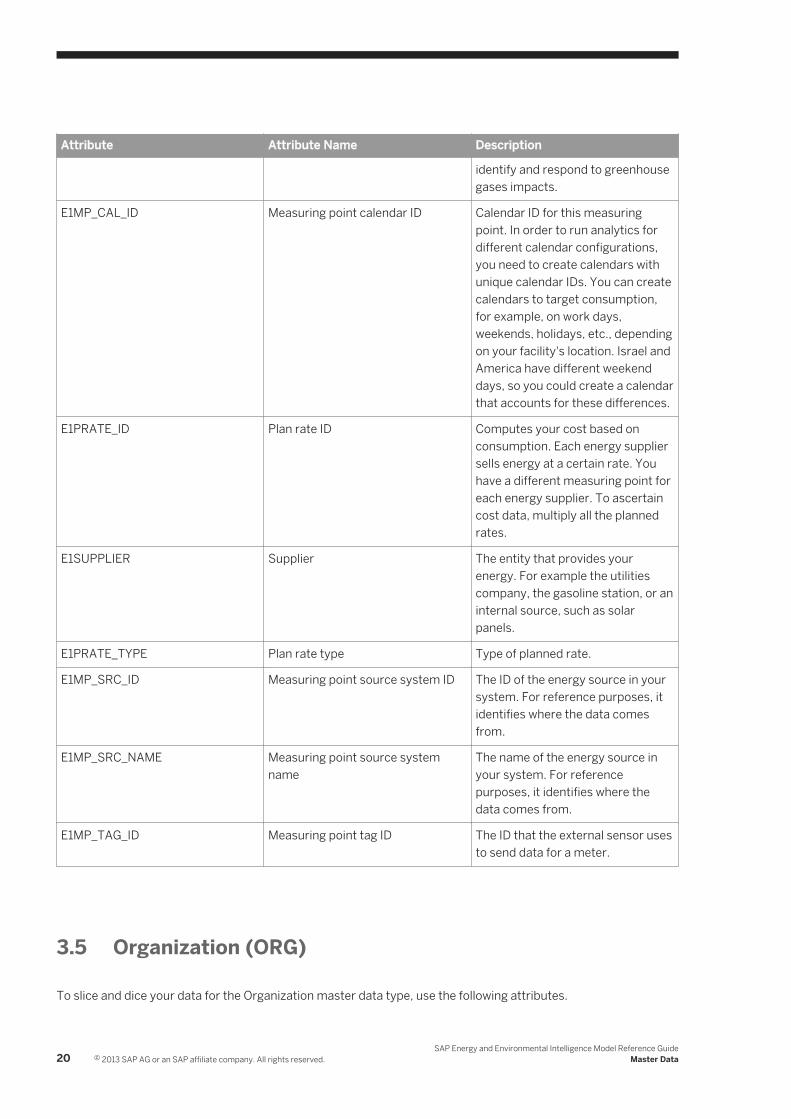
E1MP_CAL_ID Measuring point calendar ID Calendar ID for this measuring point. In order to run analytics for different calendar configurations, you need to create calendars with unique calendar IDs. You can create calendars to target consumption, for example, on work days, weekends, holidays, etc., depending on your facility's location. Israel and America have different weekend days, so you could create a calendar that accounts for these differences.
E1PRATE_ID Plan rate ID Computes your cost based on consumption. Each energy supplier sells energy at a certain rate. You have a different measuring point for each energy supplier. To ascertain cost data, multiply all the planned rates.
E1SUPPLIER Supplier The entity that provides your energy. For example the utilities company, the gasoline station, or an internal source, such as solar panels.
E1PRATE_TYPE Plan rate type Type of planned rate.
E1MP_SRC_ID Measuring point source system ID The ID of the energy source in your system. For reference purposes, it identifies where the data comes from.
E1MP_SRC_NAME Measuring point source system name
The name of the energy source in your system. For reference purposes, it identifies where the data comes from.
E1MP_TAG_ID Measuring point tag ID The ID that the external sensor uses to send data for a meter.
3.5 Organization (ORG)
To slice and dice your data for the Organization master data type, use the following attributes.
20 © 2013 SAP AG or an SAP affiliate company. All rights reserved.SAP Energy and Environmental Intelligence Model Reference Guide
Master Data

Table 6:Attribute Attribute Name Description
E1ORG_INT_ID Organization internal ID Internal organization ID
E1ORG_ID Organization ID ID for this organization
E1ORG_FROM and E1ORG_TO Organization valid from and organization valid to
The range within which this asset is valid.
E1ORG_NAME Name Organization name
E1ORG_TYPE Type Organization type
E1ORG_P_ID Organization internal parent ID Internal parent ID for this organization
E1ORG_SRC_ID Organization source system ID ID of the source system. For reference purposes, it identifies where the data comes from.
E1ORG_SRC_NAME Organization source system name Name of the source system. For reference purposes, it identifies where the data comes from.
3.6 Products (PROD)
To slice and dice your data, use the following attributes.
Table 7:Attribute Attribute Name Description
E1PROD_ID Product ID Unique identifier generated by the system
E1PROD_NAME Product name Name of the product
E1PROD_TYPE Product type The kind of product
E1PROD_FAMILY Product family
3.7 Projects (PROJECT)
A project is an abatement venture, developed to reduce or mitigate an energy impact for environmental and/or economic reasons.
Each project helps companies make capital-based decisions, for example, determining if an investment is profitable, whether to open a new branch or develop a new product, etc. Companies leverage projects to analyze financial and environmental decisions.
SAP Energy and Environmental Intelligence Model Reference GuideMaster Data © 2013 SAP AG or an SAP affiliate company. All rights reserved. 21
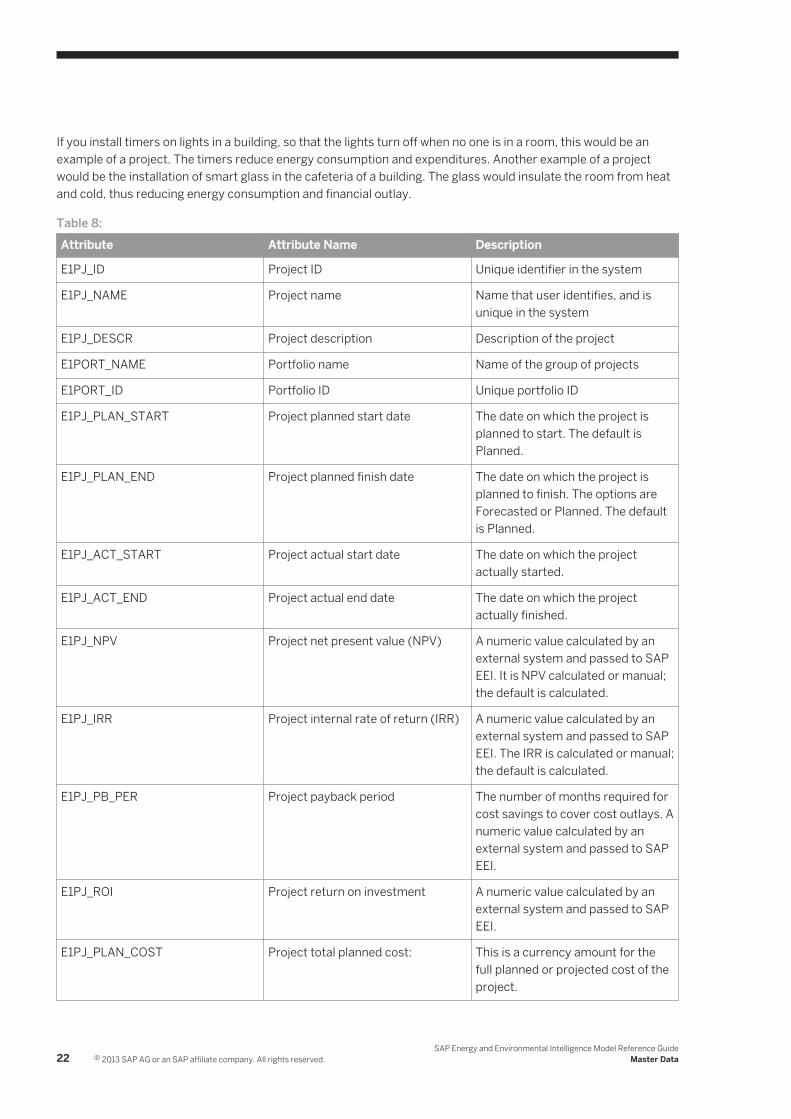
If you install timers on lights in a building, so that the lights turn off when no one is in a room, this would be an example of a project. The timers reduce energy consumption and expenditures. Another example of a project would be the installation of smart glass in the cafeteria of a building. The glass would insulate the room from heat and cold, thus reducing energy consumption and financial outlay.
Table 8:Attribute Attribute Name Description
E1PJ_ID Project ID Unique identifier in the system
E1PJ_NAME Project name Name that user identifies, and is unique in the system
E1PJ_DESCR Project description Description of the project
E1PORT_NAME Portfolio name Name of the group of projects
E1PORT_ID Portfolio ID Unique portfolio ID
E1PJ_PLAN_START Project planned start date The date on which the project is planned to start. The default is Planned.
E1PJ_PLAN_END Project planned finish date The date on which the project is planned to finish. The options are Forecasted or Planned. The default is Planned.
E1PJ_ACT_START Project actual start date The date on which the project actually started.
E1PJ_ACT_END Project actual end date The date on which the project actually finished.
E1PJ_NPV Project net present value (NPV) A numeric value calculated by an external system and passed to SAP EEI. It is NPV calculated or manual; the default is calculated.
E1PJ_IRR Project internal rate of return (IRR) A numeric value calculated by an external system and passed to SAP EEI. The IRR is calculated or manual; the default is calculated.
E1PJ_PB_PER Project payback period The number of months required for cost savings to cover cost outlays. A numeric value calculated by an external system and passed to SAP EEI.
E1PJ_ROI Project return on investment A numeric value calculated by an external system and passed to SAP EEI.
E1PJ_PLAN_COST Project total planned cost: This is a currency amount for the full planned or projected cost of the project.
22 © 2013 SAP AG or an SAP affiliate company. All rights reserved.SAP Energy and Environmental Intelligence Model Reference Guide
Master Data

Attribute Attribute Name Description
E1PJ_PLAN_COST_SAV Project total planned cost savings This is the planned or projected amount of costs that the project will save, expressed as a currency.
E1PJ_PLAN_ER_SAV Project total planned environmental resource savings
This is the planned or projected amount of the environmental resource saved (for example, coal, electricity, etc.) due to this project.
E1PJ_ACT_ER_SAVINGS Project total actual envionrmental resource savings
The actual amount of the environmental resource saved (for example, coal, electricity, etc.) due to the project.
E1PJ_ACT_COST Project total actual cost This is the actual amount that the project cost, expressed in a currency.
E1PJ_ACT_COST_SAV Project total actual cost savings This is the actual amount of costs that the project saved, expressed in a currency.
E1PJ_CUR Project currency Currency related to actual revenue.
E1PJ_ER Project environmental resource This is the main environmental resource that is affected by this project.
E1PJ_ER_UNIT Project environmental resource unit Normalized units used for environmental resource figures, such as Actual Total Energy Savings
E1PJ_RES_CTR Project environmental resource center
Once you choose a project, you need to tie the project to a resource center for monitoring. There are three use cases:
● Energy efficiency
● Project progress at a plant level
● Equipment optimization
E1PJ_STS_ID Project status ID This information is supplied by Product Portfoli Management (PPM).
E1PJ_STS_NAME Project status name This information is supplied by Product Portfoli Management (PPM).
E1PJ_EXC_STS Project status in process flag This information is supplied by Product Portfoli Management (PPM).
SAP Energy and Environmental Intelligence Model Reference GuideMaster Data © 2013 SAP AG or an SAP affiliate company. All rights reserved. 23
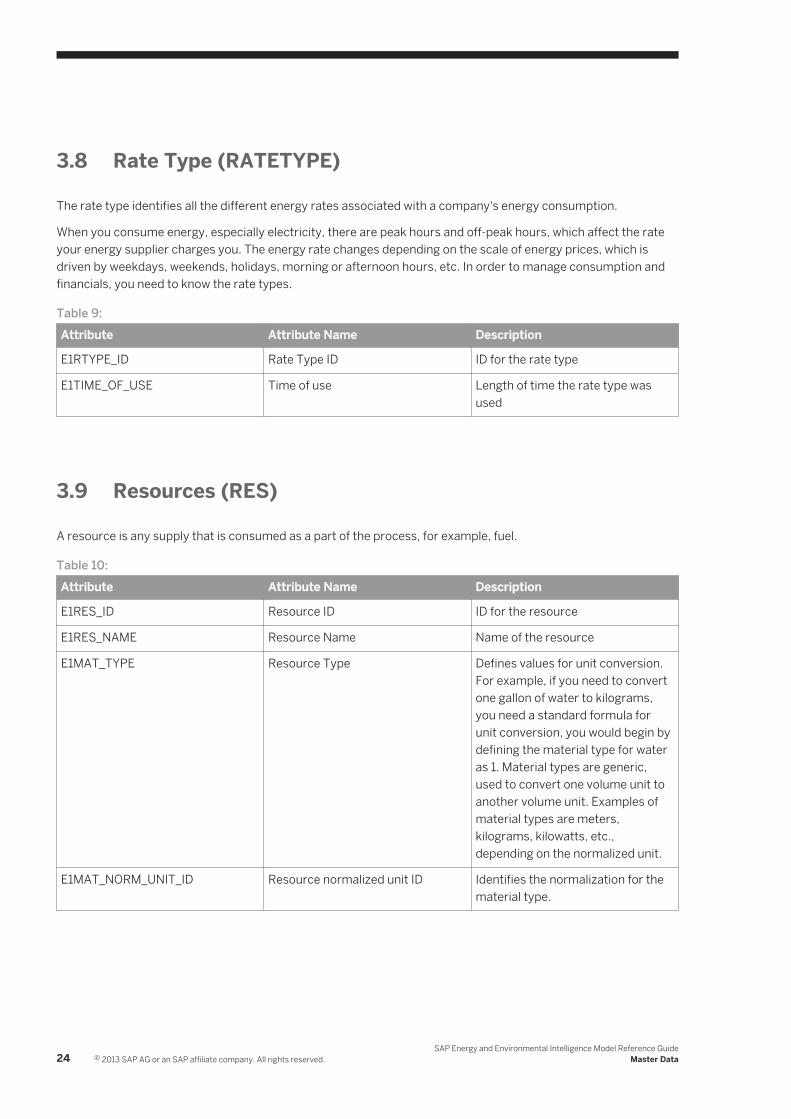
3.8 Rate Type (RATETYPE)
The rate type identifies all the different energy rates associated with a company's energy consumption.
When you consume energy, especially electricity, there are peak hours and off-peak hours, which affect the rate your energy supplier charges you. The energy rate changes depending on the scale of energy prices, which is driven by weekdays, weekends, holidays, morning or afternoon hours, etc. In order to manage consumption and financials, you need to know the rate types.
Table 9:Attribute Attribute Name Description
E1RTYPE_ID Rate Type ID ID for the rate type
E1TIME_OF_USE Time of use Length of time the rate type was used
3.9 Resources (RES)
A resource is any supply that is consumed as a part of the process, for example, fuel.
Table 10:Attribute Attribute Name Description
E1RES_ID Resource ID ID for the resource
E1RES_NAME Resource Name Name of the resource
E1MAT_TYPE Resource Type Defines values for unit conversion. For example, if you need to convert one gallon of water to kilograms, you need a standard formula for unit conversion, you would begin by defining the material type for water as 1. Material types are generic, used to convert one volume unit to another volume unit. Examples of material types are meters, kilograms, kilowatts, etc., depending on the normalized unit.
E1MAT_NORM_UNIT_ID Resource normalized unit ID Identifies the normalization for the material type.
24 © 2013 SAP AG or an SAP affiliate company. All rights reserved.SAP Energy and Environmental Intelligence Model Reference Guide
Master Data
3.10 Units
To slice and dice your Units master data, use the following attributes.
Table 11:Attribute Attribute Name Description
E1UNIT_ID To unit ID ID for the unit
E1UNIT_NAME To unit name Name of the unit
3.10.1 Currency From (CURFR)
To slice and dice your data for the Currency From master data type, use the following attributes.
Table 12:Attribute Attribute Name Description
E1CURRFR_ID Currency from ID ID of the currency
E1CURRFR_NAME Currency from name Name of the currency
3.10.2 Currency To (CURTO)
To slice and dice your data for the Currency To master data type, use the following attributes.
Table 13:Attribute Attribute Name Description
E1CUR_ID Currency ID ID of Currency To
E1CUR_NAME Currency Name Name of Currency To
3.10.3 Resource From Unit (RESFRUNIT)
SAP EEI provides this as an alias of the units, which determines how you load the units into the system.
You can use units in the following contexts: the first spreads how you input information, for example, 200 kilograms of water that comes with the csv file when you load the data. The other, ResUnit, determines how you display information on the screen or in the report, etc.
SAP Energy and Environmental Intelligence Model Reference GuideMaster Data © 2013 SAP AG or an SAP affiliate company. All rights reserved. 25

Table 14:Attribute Attribute Name Description
E1RESFRUNIT_ID Resource Unit ID Resource From Unit ID for Resource From
E1RESFRUNIT_NAME Resource From Unit Name Unit name for Resource From
3.10.4 Resource Unit To (RESUNIT)
Resource Unit To is an alias of units. It determines how you display the unit on the screen, in the report, etc.
Table 15:Attribute Attribute Name Description
E1RESUNIT_ID Unit ID for Resource To Unit ID for Resource To
E1RESUNIT_NAME Unit name Resource To Unit name for Resource To
3.10.5 Unit From (UNITFR)
To slice and dice your Unit From master data, use the following attributes.
Table 16:Attribute Attribute Name Description
E1UNITFR_ID Unit from ID ID for this Unit From master data type
E1UNITFR_NAME Unit from name Name for this Unit From master data type
3.10.6 Unit Type (UNIT_TYPE)
To slice and dice your Unit Type master data, use the folllowing attributes.
Attribute Attribute Name Description
E1UNIT_TYPE Unit Type Type of unit
E1UNIT_TYPE_NAME Unit Type Name Name of this unit type
26 © 2013 SAP AG or an SAP affiliate company. All rights reserved.SAP Energy and Environmental Intelligence Model Reference Guide
Master Data
4 Key FiguresKey figures are series of numbers over time, where each number corresponds to a particular time period value.
They are associated with a key, which is a combination of attributes from one or more master data objects. Key figures are sometimes also called measures, and they hold transactional data. They represent variables that are associated with attributes (dimensions), and can be imported into the EERM system, calculated, and/or manually edited. Some examples of key figures include Sales Forecast, Marketing Forecast, Consensus Demand Plan, Projected Inventory, Capacity Plans or actual data such as Sales Orders and Shipment History.
Types of Key Figures
● Stored Key Figures: Data is stored in this type of key figure at a defined base planning level. All stored key figures are editable or are imported into the system, for example, MP_ASSET_ORG_ALLOCATION and MP_ASSET_PRODUCT_ALLOCATION.
● Calculated Key Figures: Values in this type of key figure are always calculated based on user defined formulae. This type of key figure is usually not editable. However, to support use cases, such as defaulting, a key figure can be both editable and stored. For example, MPORGASSETPRODCIRTRESUFRUTO contains the following ten dimensions, including time: measuring point, organization, asset, product, calendar item, rate type, resource, unit frm, and unit to.
● Alert Key Figures: These are key figures with user-defined criteria that monitor and manage the execution of business plans, for example, thresholds. They can only have values of 0 or 1, meaning that the alert itself is either ON or OFF. Alerts typically check conditions on other key figures.
Planning Levels are a set of attributes that enable users to analyze and plan at different levels. As an example, ASSETALLOC Planning Level is defined as Asset-Allocation, and allows for data analysis that is tied to both the Asset and also the Allocation or combinations of both and their attributes.
Key figure calculations (calculated key figures) are done at a defined planning level, which can be different from the level that a user requests to view the key figure. An EERM planning area can include key figures of multiple planning levels.
Planning levels serve us to set boundaries for the system to generate usable information tables. The Planning Level can be based on any set of attributes, for example, Asset and Allocation, which provide specific information for different product and customer combinations (e.g., Asset1-Allocation1, Asset1-Allocation2, Asset2-Allocation2, Asset2-Allocation2, etc.).
SAP Energy and Environmental Intelligence Model Reference GuideKey Figures © 2013 SAP AG or an SAP affiliate company. All rights reserved. 27
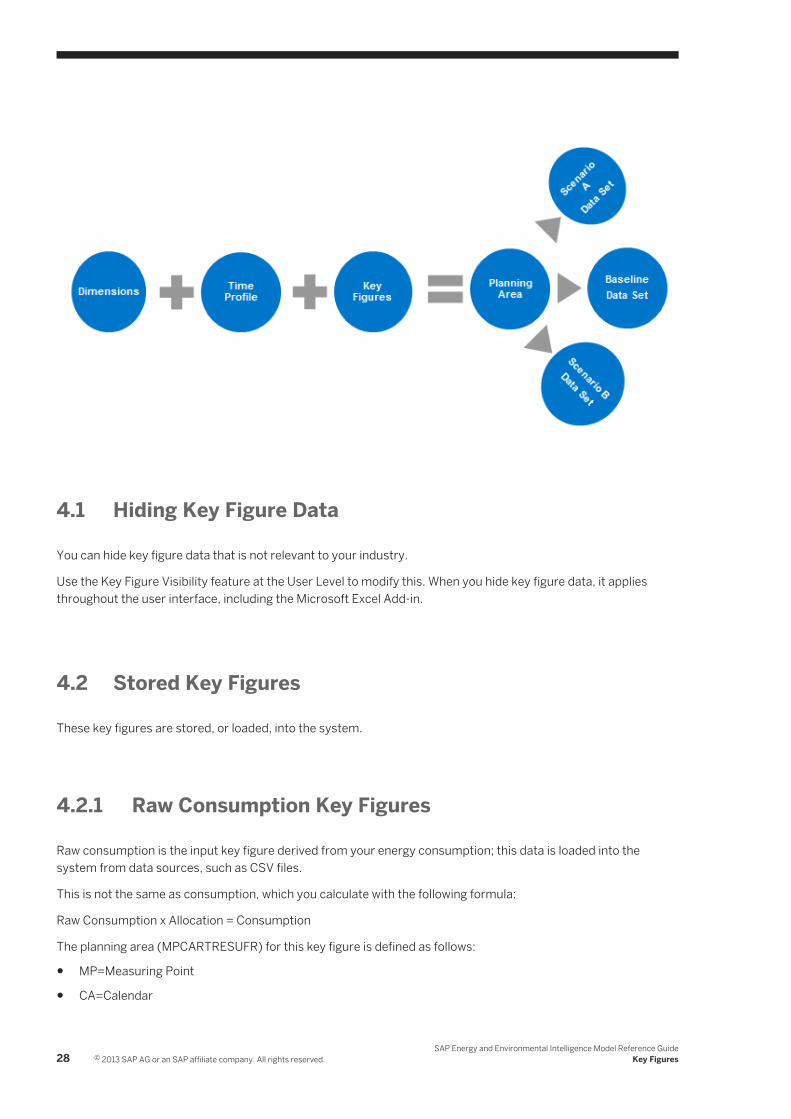
4.1 Hiding Key Figure Data
You can hide key figure data that is not relevant to your industry.
Use the Key Figure Visibility feature at the User Level to modify this. When you hide key figure data, it applies throughout the user interface, including the Microsoft Excel Add-in.
4.2 Stored Key Figures
These key figures are stored, or loaded, into the system.
4.2.1 Raw Consumption Key Figures
Raw consumption is the input key figure derived from your energy consumption; this data is loaded into the system from data sources, such as CSV files.
This is not the same as consumption, which you calculate with the following formula:
Raw Consumption x Allocation = Consumption
The planning area (MPCARTRESUFR) for this key figure is defined as follows:
● MP=Measuring Point
● CA=Calendar
28 © 2013 SAP AG or an SAP affiliate company. All rights reserved.SAP Energy and Environmental Intelligence Model Reference Guide
Key Figures

● RT=Rate Type
● RES=Resource
● UFR=Unit From
Raw consumption is the key figure, a cube with six dimensions, which contain their own attributes.
When you use raw consumption, you can use any of the associated attributes for slicing and dicing or filtering your data. You can specify that you want to display raw consumption by resource name or resource type (for example, fuel). This data needs to be aggregated.
4.2.2 Allocation Key Figures
Allocation key figures define which allocation is attached to a measuring point.
Allocation can change over time, for example, today the measuring point is assigned to building 7 in your complex, but next month it might be reassigned to building 8. This data is loaded monthly.
To account for multiple allocations, they are assigned a value, where 1=100%, 0.01=1%, etc. For example, measuring point A belongs to Asset X with 100% allocation, with 50% of the allocation dedicated to your Palo alto business complex, 30% assigned to your San Francisco complex, and 20% to your Germany complex.
MP_ASSET_ALLOCATION is the planning area associated with this key figure. It gives you a way of moving consumption from measuring points to assets. For MPASSETL3 (where MP=measuring point, ASSET=asset, and L3=Month), the time join is by month. This means that when you load data, you only load one allocation per month. For each ID you have many attributes, and you can filter by roles, values, standard facts and measurements, etc.
L3 derives from a time profile, which has the following standard levels:
● L0 = 15 minutes
● L4 = Daily
● L3 = Monthly
● L2 = Quarterly
● L1 = Yearly
You can define a subset of this time dimension so that it contains only a subset of the complete list of time values.
4.2.2.1 MP_ASSET_ORG_ALLOCATION and MP_ASSET_PRODUCT_ALLOCATION
You can move assets to Organization or Products.
For example, if you have a measuring point for water and you assign 50% to building 7 of your office complex, 40% to building 8 and 10% to building, you now have three allocations and a single water bill for all three allocations. Now, assume you have three cost centers (assets) assigned to building 7: Ted's team, Janet's team, and Jamie's team. Ted's team uses 20% of building 7. You need to determine what percentage of the building each team is using. 50% of the water consumption measuring point is assigned to building 7, and Ted's team uses
SAP Energy and Environmental Intelligence Model Reference GuideKey Figures © 2013 SAP AG or an SAP affiliate company. All rights reserved. 29

20% of that assigned 50%. By multiplying allocations and raw consumption you can break down consumption into smaller pieces, which allows you to slice and dice data by dimensions (for example, assets, products, etc.). Allocation provides a way of expressing the relationship between raw consumption and assets (in this case, buildings). And because this relationship changes over time, the data is loaded monthly.
4.2.2.1.1 Emissions
The Emissions stored key figures are as follows:
● ET_FACTOR_NORM Emission Type Normalized Factor
● RAW_ET_EMSRaw Emission Stored
4.3 Calculated Key Figures
There are four base (BS) dimensions in the planning area: measuring point, asset, organization, and product.
A planning area is a set of the following configuration elements that together define the structure of your planning process:
● Dimensions and attributes
● Time profile
● Key figures and calculations
A planning area always contains a baseline dataset and can additionally contain many scenario datasets. They can be understood as different versions of data to carry out forecast analysis.
A company can have multiple planning areas to enable planning in different business units or different types of planning. However, it is not possible to plan across planning areas.
Calculated key figures are created with formulas, by multiplying entities. For example, in the case of raw consumption, you get the measuring point and all possible allocations, multiply for each pair, and create the allocation key figure. There is only one raw consumption for the water measuring point, but if there are different measuring points and associated allocations, they must all add up to 1 (100%).
MPORGASSETPRODCIRTRESUFRUTO contains ten dimensions, including time: – measuring point, organization, asset, product, calendar item, rate type, resource, unit from, and unit to.
4.3.1 Factor Set Key Figure
For each measuring point there is a defined factor set, which determines the characteristic of the resource that is being consumed.
30 © 2013 SAP AG or an SAP affiliate company. All rights reserved.SAP Energy and Environmental Intelligence Model Reference Guide
Key Figures
For example, a factor could define the energy content of each gallon of diesel you consume, or how much CO2 is emitted for every kilowatt hour of electricity that the utilities company sells you. These factors are related to consumption. If you multiply your consumption by the factor, for example, you derive the CO2 equivalent (i.e., greenhouse gases), or the energy content.
You can use factor key figures to determine how much energy you are using, even if the measurements are different. For example, if the gasoline you use is computed in gallons and your electricity usage is expressed in kilowatts, you convert the resources to a common energy unit and add the energy from each resource to get a total energy consumption value. Energy content is the factor in common.
Two important factor set concepts are high heating value (HHV) and low heating value (LHV). In a high heating value, you determine how many BTUs were produced after burning a fuel (for example, by how many degrees did your thermostat increase?). The low heating value represents the energy released from an energy conversion, for example, when you convert water into vapor, energy is released.
4.3.1.1 Factor Set Loading
When you work with a factor set, you can only work with factors, not other attributes of the measuring point.
When you use the planning level FSRESL1 (Factor Set Resource Yearly), for example, the factor set is an attribute of the measuring point; therefore, there is no factor set in the dimension itself, just the measuring point. The other key figures in this planning level are the C02E and HHVE factors.
It is important to note that factors can change over time, since energy sources can be altered.
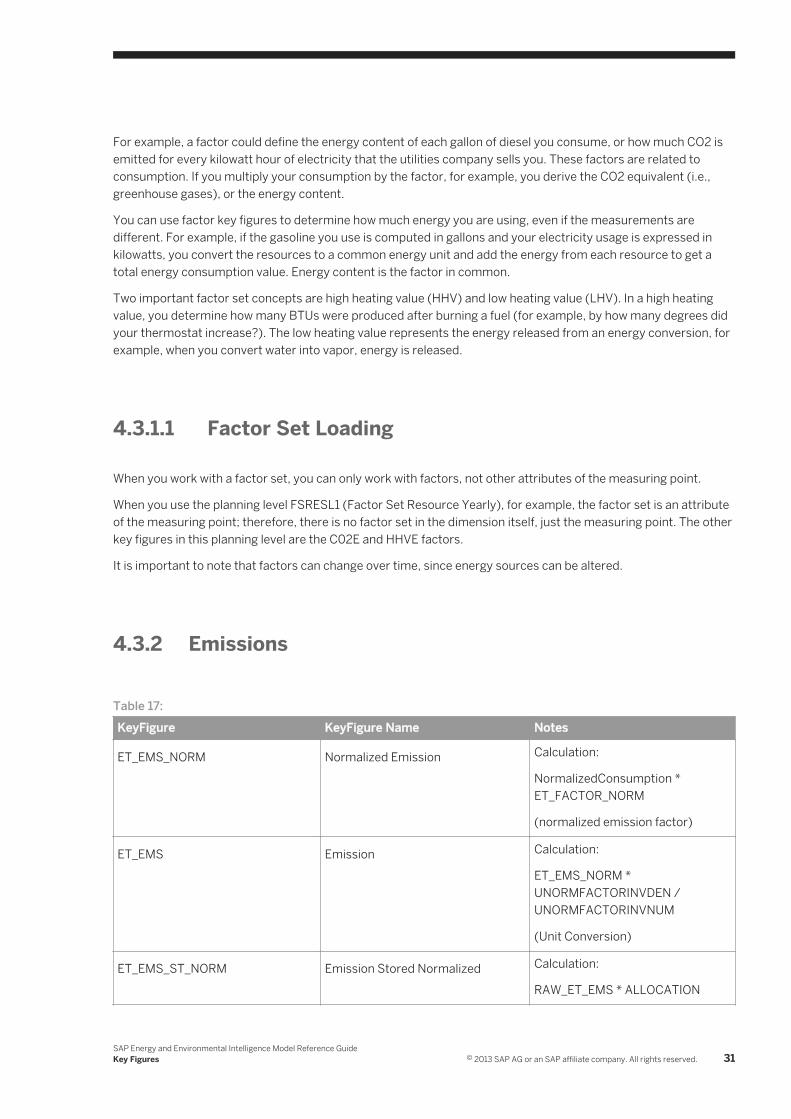
4.3.2 Emissions
Table 17:KeyFigure KeyFigure Name Notes
ET_EMS_NORM Normalized Emission Calculation:
NormalizedConsumption * ET_FACTOR_NORM
(normalized emission factor)
ET_EMS Emission Calculation:
ET_EMS_NORM * UNORMFACTORINVDEN / UNORMFACTORINVNUM
(Unit Conversion)
ET_EMS_ST_NORM Emission Stored Normalized Calculation:
RAW_ET_EMS * ALLOCATION
SAP Energy and Environmental Intelligence Model Reference GuideKey Figures © 2013 SAP AG or an SAP affiliate company. All rights reserved. 31
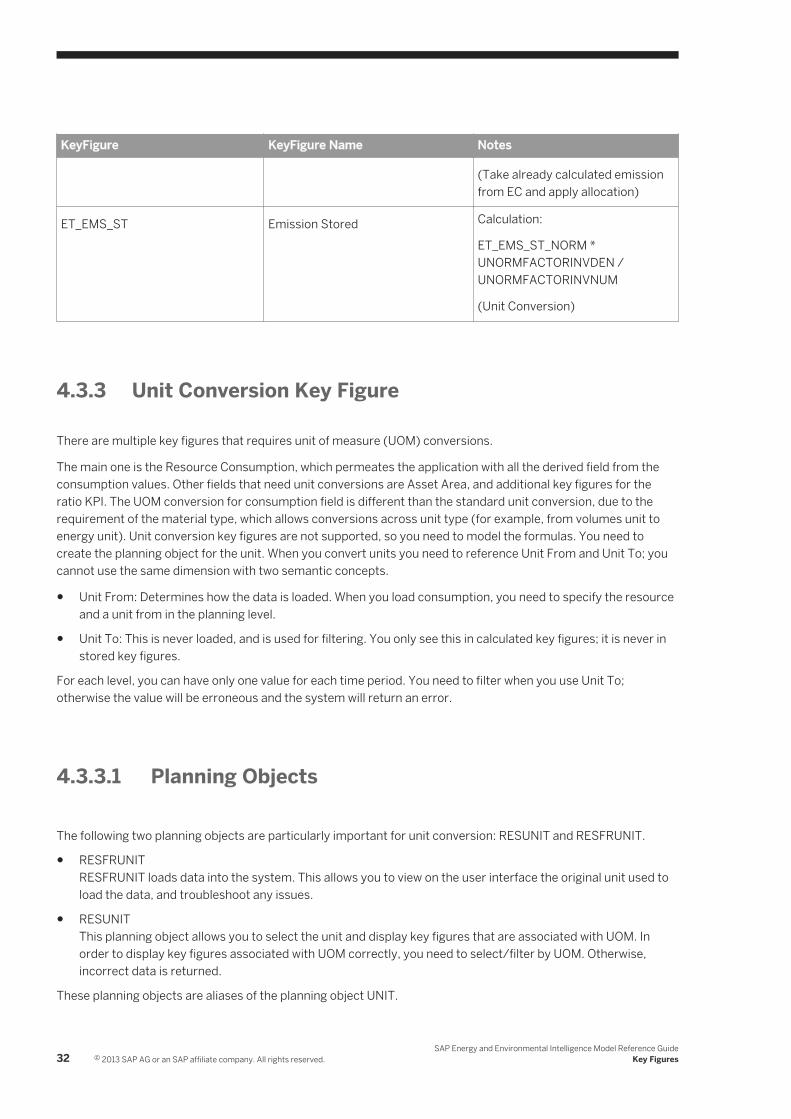
KeyFigure KeyFigure Name Notes
(Take already calculated emission from EC and apply allocation)
ET_EMS_ST Emission Stored Calculation:
ET_EMS_ST_NORM * UNORMFACTORINVDEN / UNORMFACTORINVNUM
(Unit Conversion)
4.3.3 Unit Conversion Key Figure
There are multiple key figures that requires unit of measure (UOM) conversions.
The main one is the Resource Consumption, which permeates the application with all the derived field from the consumption values. Other fields that need unit conversions are Asset Area, and additional key figures for the ratio KPI. The UOM conversion for consumption field is different than the standard unit conversion, due to the requirement of the material type, which allows conversions across unit type (for example, from volumes unit to energy unit). Unit conversion key figures are not supported, so you need to model the formulas. You need to create the planning object for the unit. When you convert units you need to reference Unit From and Unit To; you cannot use the same dimension with two semantic concepts.
● Unit From: Determines how the data is loaded. When you load consumption, you need to specify the resource and a unit from in the planning level.
● Unit To: This is never loaded, and is used for filtering. You only see this in calculated key figures; it is never in stored key figures.
For each level, you can have only one value for each time period. You need to filter when you use Unit To; otherwise the value will be erroneous and the system will return an error.
4.3.3.1 Planning Objects
The following two planning objects are particularly important for unit conversion: RESUNIT and RESFRUNIT.
● RESFRUNITRESFRUNIT loads data into the system. This allows you to view on the user interface the original unit used to load the data, and troubleshoot any issues.
● RESUNITThis planning object allows you to select the unit and display key figures that are associated with UOM. In order to display key figures associated with UOM correctly, you need to select/filter by UOM. Otherwise, incorrect data is returned.
These planning objects are aliases of the planning object UNIT.
32 © 2013 SAP AG or an SAP affiliate company. All rights reserved.SAP Energy and Environmental Intelligence Model Reference Guide
Key Figures
4.3.3.2 Material Type and UOM Conversions Factor
There is a Material Type field in the Environmental Resource Planning Object
Multiple environmental resources can have the same material type.
UOM conversion factors are loaded for each material type. This conversion factor can go across unit type (for example, from kilograms to BTUs) depending on the material properties. For each material type, a normalized UOM is defined. This unit has two roles in the model:
● Pivoting unitYou only need to load conversions factor from and to the normalized unit, instead of across the product from all source units to all possible target units. For example, assume that the normalized unit for material type General Energy is expressed in kilowatt hours (KWH). If consumption with General Energy is loaded in megawatt hours (MWH), then this is converted into KWH and can be consumed by other calculations that require consumption as one of the inputs.
● Normalized fields computationThe unit is used to compute normalized fields, which are the bases of other calculations (e.g. to compute the cost as rate*Normalized Consumption).
To avoid decimal precision loss, the conversions factors are loaded as a fraction. You need to load the numerator and the denominator values using CSV files.
For example, the conversion factor from seconds to minutes is 1/60. You load the numerator 1, and the denominator 60 in the CSV file. The alternative is to load the factor as a decimal expression 0.016667, which results in rounding issues in the system. For example, if you convert 3600 seconds to minutes using this factor, the result is 60.0012, but using the fraction approach 3600*Numerator(1)/Denominator(60) the correct value is 60.0000.
4.3.3.3 Normalized Fields
There are normalized fields for key figures for the main UOM-driven key figures, for example, consumption.
In order to calculate emission output, key figures such as consumption need to be multiplied by emission factors. The emission factors are expressed in normalized units; therefore, in order to calculate correctly, the consumption needs to be normalized with the same normalized unit.
For example, the CO2e emission factor for electricity is 0.12 MT CO2E/KWH. If you load electricity consumption in MWH, the system needs to convert the electricity consumption to the normalized unit of KWH before calculating the CO2E emissions, which is the indicated factor.
4.3.3.4 Pivoting
SAP EEI uses pivoting (RESCONVFACTORNUM ) for conversion factors.
This means you take the normalized factors and compute the conversion factors dividing one by the other. For each pair of Unit From and Unit To, the conversion factor is expressed as a fraction. You always need to enter these two factors.
SAP Energy and Environmental Intelligence Model Reference GuideKey Figures © 2013 SAP AG or an SAP affiliate company. All rights reserved. 33
For each resource, you need a normalized unit. If your resource is gasoline, for example, you need to specify your unit of measurement (for example, gallons). This is your normalized unit. If you have a gasoline resource expressed in liters, you need to convert the liters to gallons. This factor is 1/3.86. You multiply value X by 128 to express that value in gallons, then you divide by the liter factor (in this example, 1/3.86). These combine to create a conversion factor. You are pivoting the normalized unit.
When you load unit factors, you load the unit and the material type; this allows you to convert water from cubic feet to kilograms, for example. You are moving from one mass unit to another. When you associate the material type with each unit, you can have multiple factors for cubic meters depending on that material type. You will have the material type of generic volume and another for water. In this model, you convert before you aggregate.
4.3.4 Ratio Key Figures
In the system, ratio key figures are calculated by bringing two separate key figures to the same base level. Then at the request level, the system performs ratio calculations.
The following analysis of the calculation for the ratio key figure, Consumption per Product Produced, illustrates this concept.
The key figure Consumption per Product Produced is calculated by dividing the Consumption key figure by another key figure, Product Produced.
First, the Consumption key figure base level is defined with following objects:
● Measuring Point
● Asset
● Org
● Resource
● Calendar Item
● Rate Type
The Product Produced key figure base level is defined with the following objects:
● Asset
● Org
In order to support data slice and dice capabilities, Consumption per Product Produced's base level is done with the following objects:
● Asset
● Org
● Resource
In order to perform the ratio calculation in this example, Consumption / Product Produced, the system requires both key figures to be at the same level.
In order to achieve this, the following non-essential objects for this calculation are dropped from Consumption:
● Measuring Point
● Calendar Item
34 © 2013 SAP AG or an SAP affiliate company. All rights reserved.SAP Energy and Environmental Intelligence Model Reference Guide
Key Figures

● Rate Type
For Product Produced, the object Resource is added.
NoteIn order to add Resource level to the Product Produce key figure, the system provides a helper calculation, in which Consumption, with Resource already added, is joined to Product Produced at the Asset and Org levels. This brings Consumption and Produce Produced to the same level as the following objects:
● Asset
● Org
● Resource
The consequence of this ratio key figure calculation is that now these two key figures intersect only at these three objects. This means that the ratio key figure will calculate only at this level.
If you try to verify the ratio key figure by manually comparing Consumption and Product Produced separately, you will not get the following result:
Here, Consumption, Product Produced key figures are not at the same base level as the one that the system uses to calculate the Ratio Consumption per Product Produced key figure.
Therefore, if you try to manually calculate by dividing Consumption by Product Produced, you will not get the same result as shown above.
If you want to manually calculate these figures to verify the numbers then you will need to manually bring these two figures to the same level as the system calculates, which means that you either need to filter by specific Asset, Org, Resource, or you need to do Group By using these attributes.
The following screen shot shows values after Group By:
As seen in the above screen shot, you can now manually divide Consumption by Product Produced, and the result will match the ratio key figure.
Another option is to use filters, as demonstrated in the following screen shot:
The following is a list of ratio key figures and their levels:
4.4 Cost
The data model helps you to assess your energy related costs.
There are three different types of cost in the data model:
● Bill cost
SAP Energy and Environmental Intelligence Model Reference GuideKey Figures © 2013 SAP AG or an SAP affiliate company. All rights reserved. 35
Represents what is billed to you (for example, your utility bill), which is entered as an input. Bill cost is entered at the level of the measuring point with Currency From, which indicates the bill from the previous billing period.
● Contract costThe cost of the energy supplier contract. The contract rate is calculated using planned rate, resource unit from, and currency. You multiply the contract rate by consumption, then do a unit conversion, to calculate the contract cost. From a modeling perspective, forecasted cost is covered by contract cost. HANA takes the forecasted consumption (i.e., stored key figure) and multiplies it by the contract rate. There is no separate forecasted cost key figure.
● Standard costWhat the company charges internally for a resource, which includes overhead. You can use BSRTRESCURRFROMCURRTO to slice and dice this data.
These costs allow you to compare your energy bill with the costing information and validate the bill's accuracy. You can also see your consumption by cost.
4.4.1 Statistical Forecast
Statistical forecast allows you to predict your energy bill based on raw consumption inputs.
You begin by forecasting consumption before the month starts, then you compute actual consumption at month's end. Then you do a comparison. If there is a discrepancy between the two, you need to determine the cause.
Raw consumption is entered as measuring point. Using the allocation key figure, you can assign consumption to the assets, organization, and product planning levels. This allocates forecast consumption, which you can compare to your actuals. Based on the statistical forecast and the contract rate, you can forecast your energy bill.
4.5 Use Cases
The data model covers a wide range of use cases to help you do your job.
For example, if you are a facilities manager, you can determine your consumption in a building by comparing the forecast against the actuals. You can also normalize data to convert the current month to a previous month, or you can calculate cost information, which validate your utilities bill. You can also calculate the CO2 equivalent and its resource origins.
4.6 Changing Attribute Description Labels
The well-defined domain of energy management makes the standard data model a good starting point for your work.
However, if needed, you can use SAP HANA Studio to change the model's description labels.
36 © 2013 SAP AG or an SAP affiliate company. All rights reserved.SAP Energy and Environmental Intelligence Model Reference Guide
Key Figures

NoteYou can change the labels for the model, but you cannot modify the model itself.
To change attribute descriptions using SAP HANA Studio:
1. In SAP HANA Studio, launch the SQL editor.2. To display all the attribute names and descriptions, enter: select * from SAPSOP.SOPDM_ATTRIBUTE_T3. 3Use the UPDATE command on the table SAPSOP.SPODM_ATTRIBUTE_T. For example:update
SAPSOP.SOPDM_ATTRIBUTE_T set descr = 'MP Resource ID modified text' where attr = 'OP7MP_RES_ID';where: descr is the attribute description; attr is the attribute name; modified text is the changed, added, or deleted text in the attribute description.
4. Execute the command.
SAP Energy and Environmental Intelligence Model Reference GuideKey Figures © 2013 SAP AG or an SAP affiliate company. All rights reserved. 37
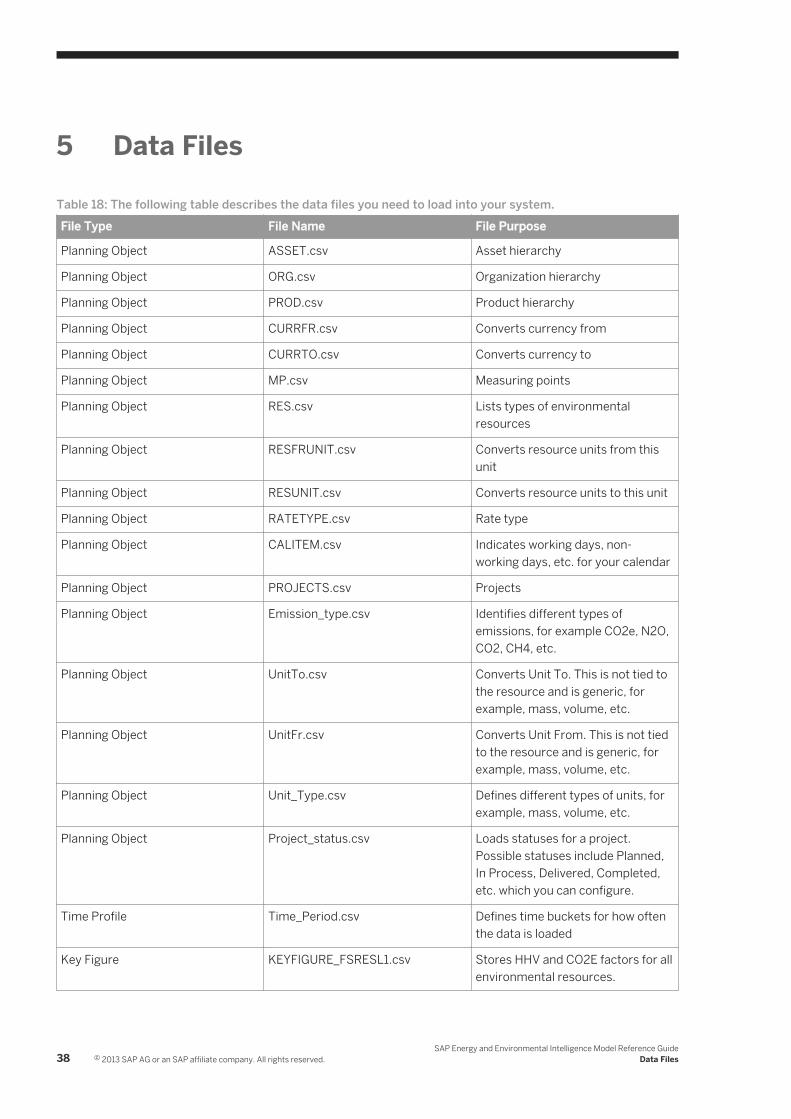
5 Data Files
Table 18: The following table describes the data files you need to load into your system.File Type File Name File Purpose
Planning Object ASSET.csv Asset hierarchy
Planning Object ORG.csv Organization hierarchy
Planning Object PROD.csv Product hierarchy
Planning Object CURRFR.csv Converts currency from
Planning Object CURRTO.csv Converts currency to
Planning Object MP.csv Measuring points
Planning Object RES.csv Lists types of environmental resources
Planning Object RESFRUNIT.csv Converts resource units from this unit
Planning Object RESUNIT.csv Converts resource units to this unit
Planning Object RATETYPE.csv Rate type
Planning Object CALITEM.csv Indicates working days, non-working days, etc. for your calendar
Planning Object PROJECTS.csv Projects
Planning Object Emission_type.csv Identifies different types of emissions, for example CO2e, N2O, CO2, CH4, etc.
Planning Object UnitTo.csv Converts Unit To. This is not tied to the resource and is generic, for example, mass, volume, etc.
Planning Object UnitFr.csv Converts Unit From. This is not tied to the resource and is generic, for example, mass, volume, etc.
Planning Object Unit_Type.csv Defines different types of units, for example, mass, volume, etc.
Planning Object Project_status.csv Loads statuses for a project. Possible statuses include Planned, In Process, Delivered, Completed, etc. which you can configure.
Time Profile Time_Period.csv Defines time buckets for how often the data is loaded
Key Figure KEYFIGURE_FSRESL1.csv Stores HHV and CO2E factors for all environmental resources.
38 © 2013 SAP AG or an SAP affiliate company. All rights reserved.SAP Energy and Environmental Intelligence Model Reference Guide
Data Files
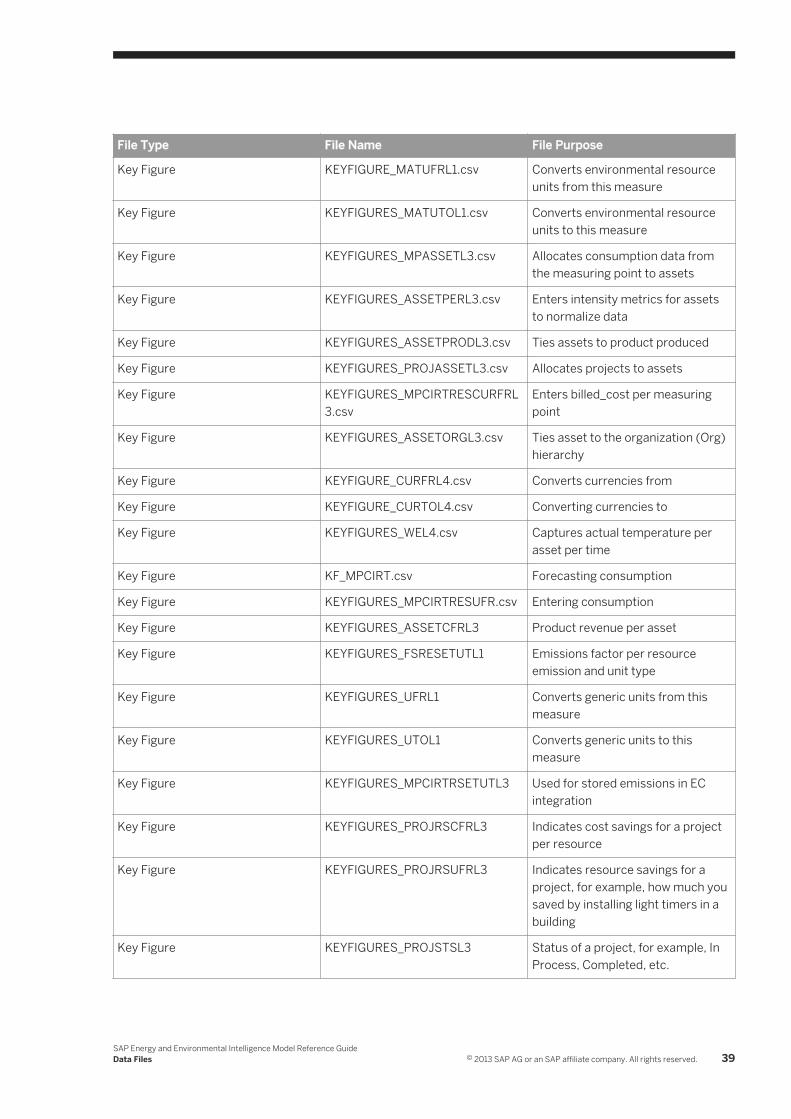
File Type File Name File Purpose
Key Figure KEYFIGURE_MATUFRL1.csv Converts environmental resource units from this measure
Key Figure KEYFIGURES_MATUTOL1.csv Converts environmental resource units to this measure
Key Figure KEYFIGURES_MPASSETL3.csv Allocates consumption data from the measuring point to assets
Key Figure KEYFIGURES_ASSETPERL3.csv Enters intensity metrics for assets to normalize data
Key Figure KEYFIGURES_ASSETPRODL3.csv Ties assets to product produced
Key Figure KEYFIGURES_PROJASSETL3.csv Allocates projects to assets
Key Figure KEYFIGURES_MPCIRTRESCURFRL3.csv
Enters billed_cost per measuring point
Key Figure KEYFIGURES_ASSETORGL3.csv Ties asset to the organization (Org) hierarchy
Key Figure KEYFIGURE_CURFRL4.csv Converts currencies from
Key Figure KEYFIGURE_CURTOL4.csv Converting currencies to
Key Figure KEYFIGURES_WEL4.csv Captures actual temperature per asset per time
Key Figure KF_MPCIRT.csv Forecasting consumption
Key Figure KEYFIGURES_MPCIRTRESUFR.csv Entering consumption
Key Figure KEYFIGURES_ASSETCFRL3 Product revenue per asset
Key Figure KEYFIGURES_FSRESETUTL1 Emissions factor per resource emission and unit type
Key Figure KEYFIGURES_UFRL1 Converts generic units from this measure
Key Figure KEYFIGURES_UTOL1 Converts generic units to this measure
Key Figure KEYFIGURES_MPCIRTRSETUTL3 Used for stored emissions in EC integration
Key Figure KEYFIGURES_PROJRSCFRL3 Indicates cost savings for a project per resource
Key Figure KEYFIGURES_PROJRSUFRL3 Indicates resource savings for a project, for example, how much you saved by installing light timers in a building
Key Figure KEYFIGURES_PROJSTSL3 Status of a project, for example, In Process, Completed, etc.
SAP Energy and Environmental Intelligence Model Reference GuideData Files © 2013 SAP AG or an SAP affiliate company. All rights reserved. 39

File Type File Name File Purpose
Key Figure KEYFIGURES_PRATERESCURFR.csv
Rates for each environmental resource
40 © 2013 SAP AG or an SAP affiliate company. All rights reserved.SAP Energy and Environmental Intelligence Model Reference Guide
Data Files
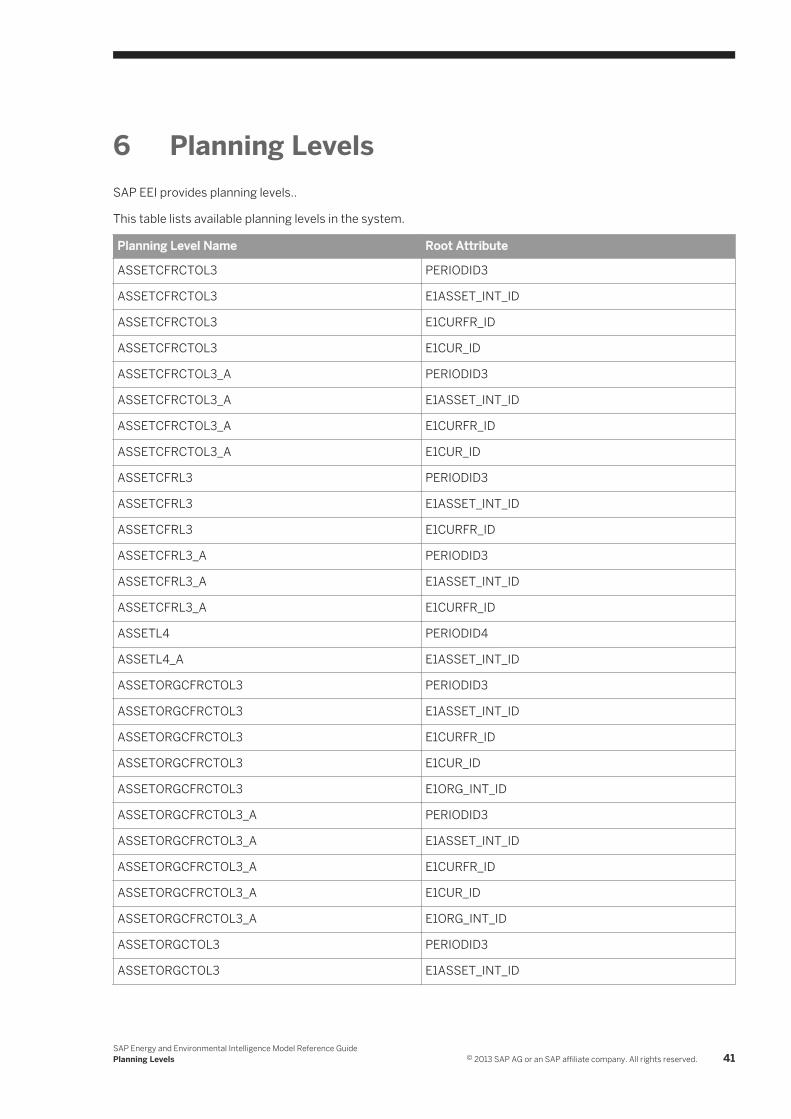
6 Planning LevelsSAP EEI provides planning levels..
This table lists available planning levels in the system.
Planning Level Name Root Attribute
ASSETCFRCTOL3 PERIODID3
ASSETCFRCTOL3 E1ASSET_INT_ID
ASSETCFRCTOL3 E1CURFR_ID
ASSETCFRCTOL3 E1CUR_ID
ASSETCFRCTOL3_A PERIODID3
ASSETCFRCTOL3_A E1ASSET_INT_ID
ASSETCFRCTOL3_A E1CURFR_ID
ASSETCFRCTOL3_A E1CUR_ID
ASSETCFRL3 PERIODID3
ASSETCFRL3 E1ASSET_INT_ID
ASSETCFRL3 E1CURFR_ID
ASSETCFRL3_A PERIODID3
ASSETCFRL3_A E1ASSET_INT_ID
ASSETCFRL3_A E1CURFR_ID
ASSETL4 PERIODID4
ASSETL4_A E1ASSET_INT_ID
ASSETORGCFRCTOL3 PERIODID3
ASSETORGCFRCTOL3 E1ASSET_INT_ID
ASSETORGCFRCTOL3 E1CURFR_ID
ASSETORGCFRCTOL3 E1CUR_ID
ASSETORGCFRCTOL3 E1ORG_INT_ID
ASSETORGCFRCTOL3_A PERIODID3
ASSETORGCFRCTOL3_A E1ASSET_INT_ID
ASSETORGCFRCTOL3_A E1CURFR_ID
ASSETORGCFRCTOL3_A E1CUR_ID
ASSETORGCFRCTOL3_A E1ORG_INT_ID
ASSETORGCTOL3 PERIODID3
ASSETORGCTOL3 E1ASSET_INT_ID
SAP Energy and Environmental Intelligence Model Reference GuidePlanning Levels © 2013 SAP AG or an SAP affiliate company. All rights reserved. 41
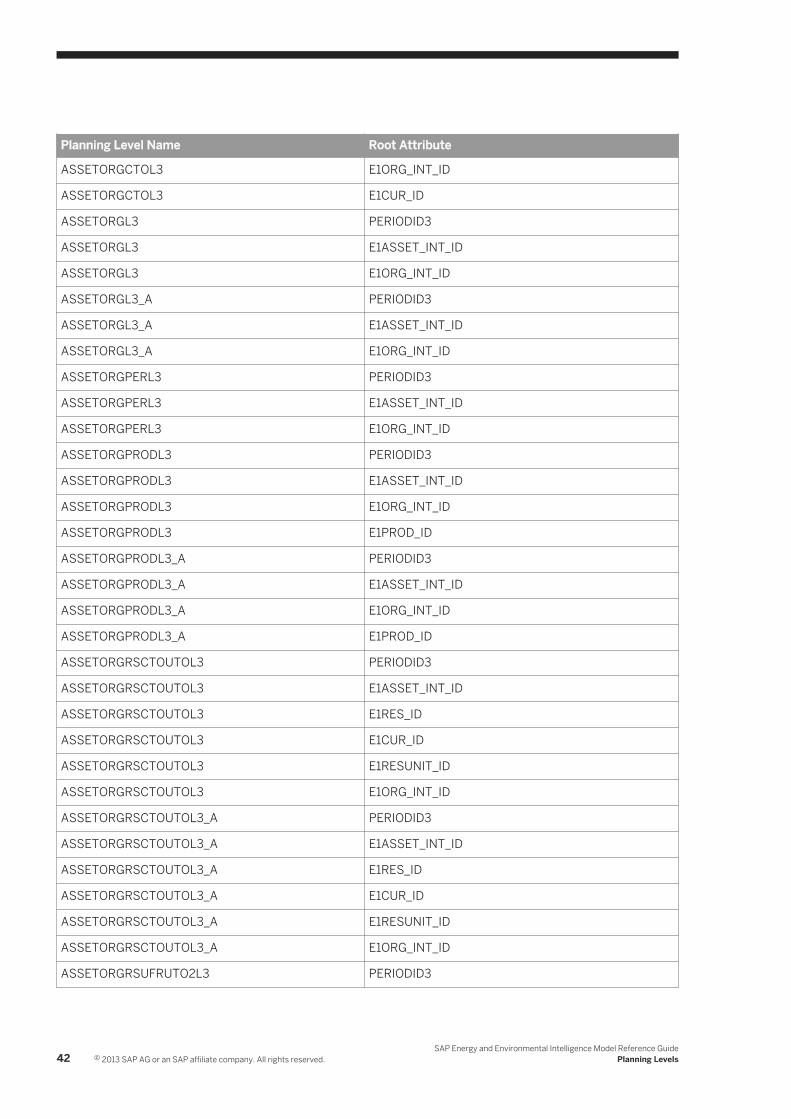
Planning Level Name Root Attribute
ASSETORGCTOL3 E1ORG_INT_ID
ASSETORGCTOL3 E1CUR_ID
ASSETORGL3 PERIODID3
ASSETORGL3 E1ASSET_INT_ID
ASSETORGL3 E1ORG_INT_ID
ASSETORGL3_A PERIODID3
ASSETORGL3_A E1ASSET_INT_ID
ASSETORGL3_A E1ORG_INT_ID
ASSETORGPERL3 PERIODID3
ASSETORGPERL3 E1ASSET_INT_ID
ASSETORGPERL3 E1ORG_INT_ID
ASSETORGPRODL3 PERIODID3
ASSETORGPRODL3 E1ASSET_INT_ID
ASSETORGPRODL3 E1ORG_INT_ID
ASSETORGPRODL3 E1PROD_ID
ASSETORGPRODL3_A PERIODID3
ASSETORGPRODL3_A E1ASSET_INT_ID
ASSETORGPRODL3_A E1ORG_INT_ID
ASSETORGPRODL3_A E1PROD_ID
ASSETORGRSCTOUTOL3 PERIODID3
ASSETORGRSCTOUTOL3 E1ASSET_INT_ID
ASSETORGRSCTOUTOL3 E1RES_ID
ASSETORGRSCTOUTOL3 E1CUR_ID
ASSETORGRSCTOUTOL3 E1RESUNIT_ID
ASSETORGRSCTOUTOL3 E1ORG_INT_ID
ASSETORGRSCTOUTOL3_A PERIODID3
ASSETORGRSCTOUTOL3_A E1ASSET_INT_ID
ASSETORGRSCTOUTOL3_A E1RES_ID
ASSETORGRSCTOUTOL3_A E1CUR_ID
ASSETORGRSCTOUTOL3_A E1RESUNIT_ID
ASSETORGRSCTOUTOL3_A E1ORG_INT_ID
ASSETORGRSUFRUTO2L3 PERIODID3
42 © 2013 SAP AG or an SAP affiliate company. All rights reserved.SAP Energy and Environmental Intelligence Model Reference Guide
Planning Levels

Planning Level Name Root Attribute
ASSETORGRSUFRUTO2L3 E1ASSET_INT_ID
ASSETORGRSUFRUTO2L3 E1ORG_INT_ID
ASSETORGRSUFRUTO2L3 E1RESFRUNIT_ID
ASSETORGRSUFRUTO2L3 E1RESUNIT_ID
ASSETORGRSUFRUTO2L3 E1RES_ID
ASSETORGRSUFRUTO2L3 E1UNITFR_ID
ASSETORGRSUFRUTO2L3 E1UNIT_ID
ASSETORGRSUFRUTO2L3 E1UNIT_TYPE
ASSETORGRSUFRUTO2L3AVG_A PERIODID3
ASSETORGRSUFRUTO2L3_A PERIODID3
ASSETORGRSUFRUTO2L3_A E1ASSET_INT_ID
ASSETORGRSUFRUTO2L3_A E1ORG_INT_ID
ASSETORGRSUFRUTO2L3_A E1RESFRUNIT_ID
ASSETORGRSUFRUTO2L3_A E1RESUNIT_ID
ASSETORGRSUFRUTO2L3_A E1RES_ID
ASSETORGRSUFRUTO2L3_A E1UNITFR_ID
ASSETORGRSUFRUTO2L3_A E1UNIT_ID
ASSETORGRSUFRUTO2L3_A E1UNIT_TYPE
ASSETORGRSUFRUTOL3 PERIODID3
ASSETORGRSUFRUTOL3 E1ASSET_INT_ID
ASSETORGRSUFRUTOL3 E1ORG_INT_ID
ASSETORGRSUFRUTOL3 E1RESFRUNIT_ID
ASSETORGRSUFRUTOL3 E1RESUNIT_ID
ASSETORGRSUFRUTOL3 E1RES_ID
ASSETORGRSUFRUTOL3AVG_A PERIODID3
ASSETORGRSUFRUTOL3_A PERIODID3
ASSETORGRSUFRUTOL3_A E1ASSET_INT_ID
ASSETORGRSUFRUTOL3_A E1ORG_INT_ID
ASSETORGRSUFRUTOL3_A E1RESFRUNIT_ID
ASSETORGRSUFRUTOL3_A E1RESUNIT_ID
ASSETORGRSUFRUTOL3_A E1RES_ID
ASSETORGRSUTOL3 PERIODID3
SAP Energy and Environmental Intelligence Model Reference GuidePlanning Levels © 2013 SAP AG or an SAP affiliate company. All rights reserved. 43
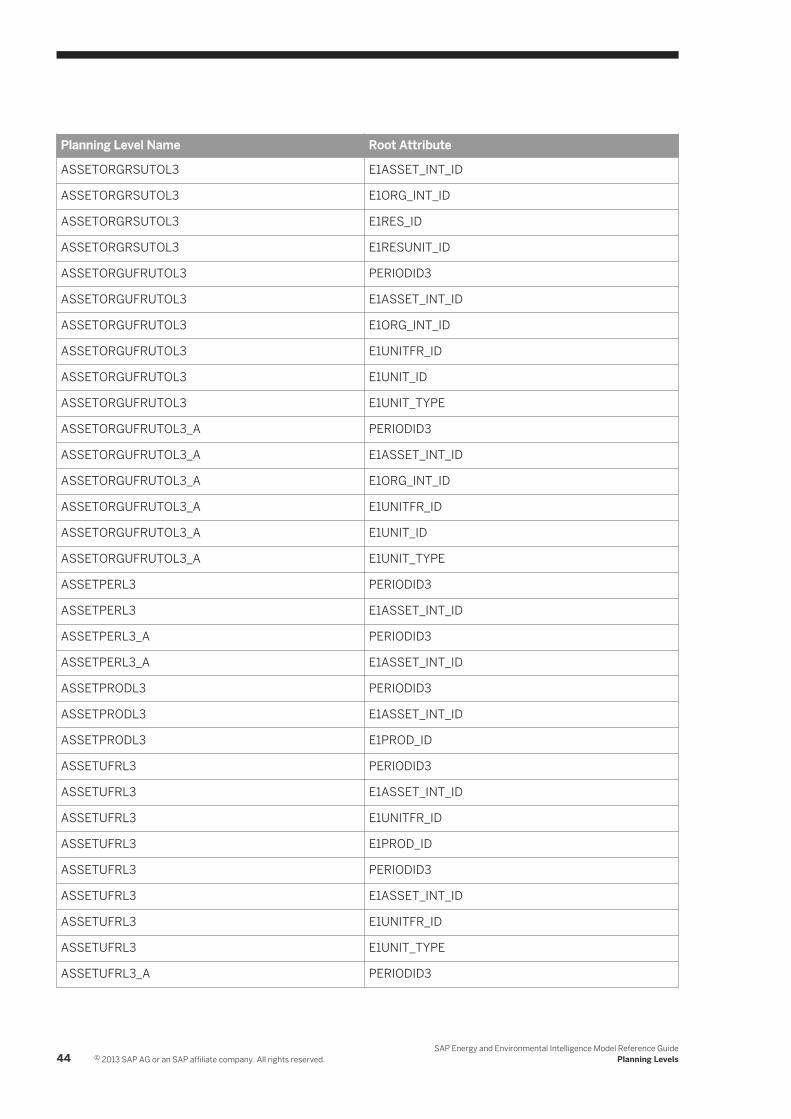
Planning Level Name Root Attribute
ASSETORGRSUTOL3 E1ASSET_INT_ID
ASSETORGRSUTOL3 E1ORG_INT_ID
ASSETORGRSUTOL3 E1RES_ID
ASSETORGRSUTOL3 E1RESUNIT_ID
ASSETORGUFRUTOL3 PERIODID3
ASSETORGUFRUTOL3 E1ASSET_INT_ID
ASSETORGUFRUTOL3 E1ORG_INT_ID
ASSETORGUFRUTOL3 E1UNITFR_ID
ASSETORGUFRUTOL3 E1UNIT_ID
ASSETORGUFRUTOL3 E1UNIT_TYPE
ASSETORGUFRUTOL3_A PERIODID3
ASSETORGUFRUTOL3_A E1ASSET_INT_ID
ASSETORGUFRUTOL3_A E1ORG_INT_ID
ASSETORGUFRUTOL3_A E1UNITFR_ID
ASSETORGUFRUTOL3_A E1UNIT_ID
ASSETORGUFRUTOL3_A E1UNIT_TYPE
ASSETPERL3 PERIODID3
ASSETPERL3 E1ASSET_INT_ID
ASSETPERL3_A PERIODID3
ASSETPERL3_A E1ASSET_INT_ID
ASSETPRODL3 PERIODID3
ASSETPRODL3 E1ASSET_INT_ID
ASSETPRODL3 E1PROD_ID
ASSETUFRL3 PERIODID3
ASSETUFRL3 E1ASSET_INT_ID
ASSETUFRL3 E1UNITFR_ID
ASSETUFRL3 E1PROD_ID
ASSETUFRL3 PERIODID3
ASSETUFRL3 E1ASSET_INT_ID
ASSETUFRL3 E1UNITFR_ID
ASSETUFRL3 E1UNIT_TYPE
ASSETUFRL3_A PERIODID3
44 © 2013 SAP AG or an SAP affiliate company. All rights reserved.SAP Energy and Environmental Intelligence Model Reference Guide
Planning Levels
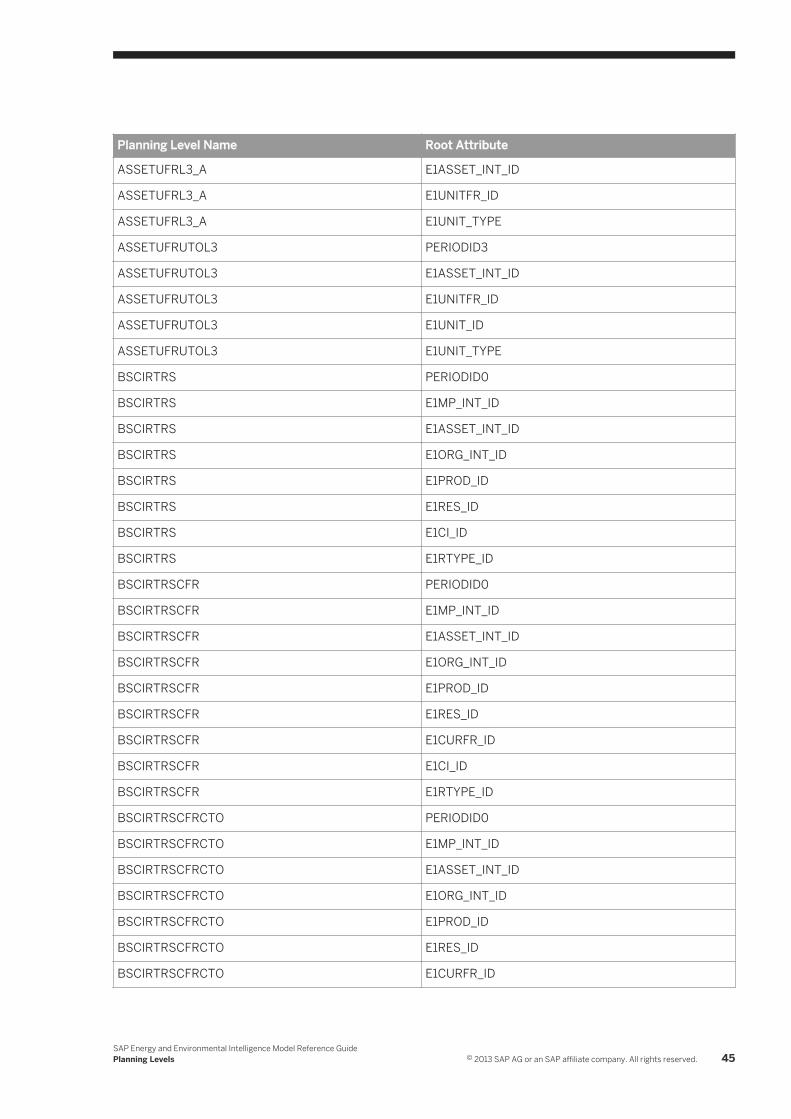
Planning Level Name Root Attribute
ASSETUFRL3_A E1ASSET_INT_ID
ASSETUFRL3_A E1UNITFR_ID
ASSETUFRL3_A E1UNIT_TYPE
ASSETUFRUTOL3 PERIODID3
ASSETUFRUTOL3 E1ASSET_INT_ID
ASSETUFRUTOL3 E1UNITFR_ID
ASSETUFRUTOL3 E1UNIT_ID
ASSETUFRUTOL3 E1UNIT_TYPE
BSCIRTRS PERIODID0
BSCIRTRS E1MP_INT_ID
BSCIRTRS E1ASSET_INT_ID
BSCIRTRS E1ORG_INT_ID
BSCIRTRS E1PROD_ID
BSCIRTRS E1RES_ID
BSCIRTRS E1CI_ID
BSCIRTRS E1RTYPE_ID
BSCIRTRSCFR PERIODID0
BSCIRTRSCFR E1MP_INT_ID
BSCIRTRSCFR E1ASSET_INT_ID
BSCIRTRSCFR E1ORG_INT_ID
BSCIRTRSCFR E1PROD_ID
BSCIRTRSCFR E1RES_ID
BSCIRTRSCFR E1CURFR_ID
BSCIRTRSCFR E1CI_ID
BSCIRTRSCFR E1RTYPE_ID
BSCIRTRSCFRCTO PERIODID0
BSCIRTRSCFRCTO E1MP_INT_ID
BSCIRTRSCFRCTO E1ASSET_INT_ID
BSCIRTRSCFRCTO E1ORG_INT_ID
BSCIRTRSCFRCTO E1PROD_ID
BSCIRTRSCFRCTO E1RES_ID
BSCIRTRSCFRCTO E1CURFR_ID
SAP Energy and Environmental Intelligence Model Reference GuidePlanning Levels © 2013 SAP AG or an SAP affiliate company. All rights reserved. 45

Planning Level Name Root Attribute
BSCIRTRSCFRCTO E1CUR_ID
BSCIRTRSCFRCTO E1CI_ID
BSCIRTRSCFRCTO E1RTYPE_ID
BSCIRTRSCFRCTOL3 PERIODID3
BSCIRTRSCFRCTOL3 E1MP_INT_ID
BSCIRTRSCFRCTOL3 E1ASSET_INT_ID
BSCIRTRSCFRCTOL3 E1ORG_INT_ID
BSCIRTRSCFRCTOL3 E1PROD_ID
BSCIRTRSCFRCTOL3 E1RES_ID
BSCIRTRSCFRCTOL3 E1CURFR_ID
BSCIRTRSCFRCTOL3 E1CUR_ID
BSCIRTRSCFRCTOL3 E1CI_ID
BSCIRTRSCFRCTOL3 E1RTYPE_ID
BSCIRTRSCFRCTOL3AVG_A PERIODID3
BSCIRTRSCFRCTOUFRUTO2L3 PERIODID3
BSCIRTRSCFRCTOUFRUTO2L3 E1MP_INT_ID
BSCIRTRSCFRCTOUFRUTO2L3 E1ASSET_INT_ID
BSCIRTRSCFRCTOUFRUTO2L3 E1ORG_INT_ID
BSCIRTRSCFRCTOUFRUTO2L3 E1PROD_ID
BSCIRTRSCFRCTOUFRUTO2L3 E1RES_ID
BSCIRTRSCFRCTOUFRUTO2L3 E1CURFR_ID
BSCIRTRSCFRCTOUFRUTO2L3 E1CUR_ID
BSCIRTRSCFRCTOUFRUTO2L3 E1CI_ID
BSCIRTRSCFRCTOUFRUTO2L3 E1RTYPE_ID
BSCIRTRSCFRCTOUFRUTO2L3 E1UNITFR_ID
BSCIRTRSCFRCTOUFRUTO2L3 E1UNIT_ID
BSCIRTRSCFRCTOUFRUTO2L3 E1UNIT_TYPE
BSCIRTRSCFRCTOUFRUTO2L3AVG_A PERIODID3
BSCIRTRSCFRCTOUFRUTO2L3_A PERIODID3
BSCIRTRSCFRCTOUFRUTO2L3_A E1MP_INT_ID
BSCIRTRSCFRCTOUFRUTO2L3_A E1ASSET_INT_ID
BSCIRTRSCFRCTOUFRUTO2L3_A E1ORG_INT_ID
46 © 2013 SAP AG or an SAP affiliate company. All rights reserved.SAP Energy and Environmental Intelligence Model Reference Guide
Planning Levels

Planning Level Name Root Attribute
BSCIRTRSCFRCTOUFRUTO2L3_A E1PROD_ID
BSCIRTRSCFRCTOUFRUTO2L3_A E1RES_ID
BSCIRTRSCFRCTOUFRUTO2L3_A E1CURFR_ID
BSCIRTRSCFRCTOUFRUTO2L3_A E1CUR_ID
BSCIRTRSCFRCTOUFRUTO2L3_A E1CI_ID
BSCIRTRSCFRCTOUFRUTO2L3_A E1RTYPE_ID
BSCIRTRSCFRCTOUFRUTO2L3_A E1UNITFR_ID
BSCIRTRSCFRCTOUFRUTO2L3_A E1UNIT_ID
BSCIRTRSCFRCTOUFRUTO2L3_A E1UNIT_TYPE
BSCIRTRSCFRCTOUFRUTOL3 PERIODID3
BSCIRTRSCFRCTOUFRUTOL3 E1MP_INT_ID
BSCIRTRSCFRCTOUFRUTOL3 E1ASSET_INT_ID
BSCIRTRSCFRCTOUFRUTOL3 E1ORG_INT_ID
BSCIRTRSCFRCTOUFRUTOL3 E1PROD_ID
BSCIRTRSCFRCTOUFRUTOL3 E1RES_ID
BSCIRTRSCFRCTOUFRUTOL3 E1CURFR_ID
BSCIRTRSCFRCTOUFRUTOL3 E1CUR_ID
BSCIRTRSCFRCTOUFRUTOL3 E1CI_ID
BSCIRTRSCFRCTOUFRUTOL3 E1RTYPE_ID
BSCIRTRSCFRCTOUFRUTOL3 E1RESUNIT_ID
BSCIRTRSCFRCTOUFRUTOL3 E1RESFRUNIT_ID
BSCIRTRSCFRCTOUFRUTOL3_A PERIODID3
BSCIRTRSCFRCTOUFRUTOL3_A E1MP_INT_ID
BSCIRTRSCFRCTOUFRUTOL3_A E1ASSET_INT_ID
BSCIRTRSCFRCTOUFRUTOL3_A E1ORG_INT_ID
BSCIRTRSCFRCTOUFRUTOL3_A E1PROD_ID
BSCIRTRSCFRCTOUFRUTOL3_A E1RES_ID
BSCIRTRSCFRCTOUFRUTOL3_A E1CURFR_ID
BSCIRTRSCFRCTOUFRUTOL3_A E1CUR_ID
BSCIRTRSCFRCTOUFRUTOL3_A E1CI_ID
BSCIRTRSCFRCTOUFRUTOL3_A E1RTYPE_ID
BSCIRTRSCFRCTOUFRUTOL3_A E1RESUNIT_ID
SAP Energy and Environmental Intelligence Model Reference GuidePlanning Levels © 2013 SAP AG or an SAP affiliate company. All rights reserved. 47
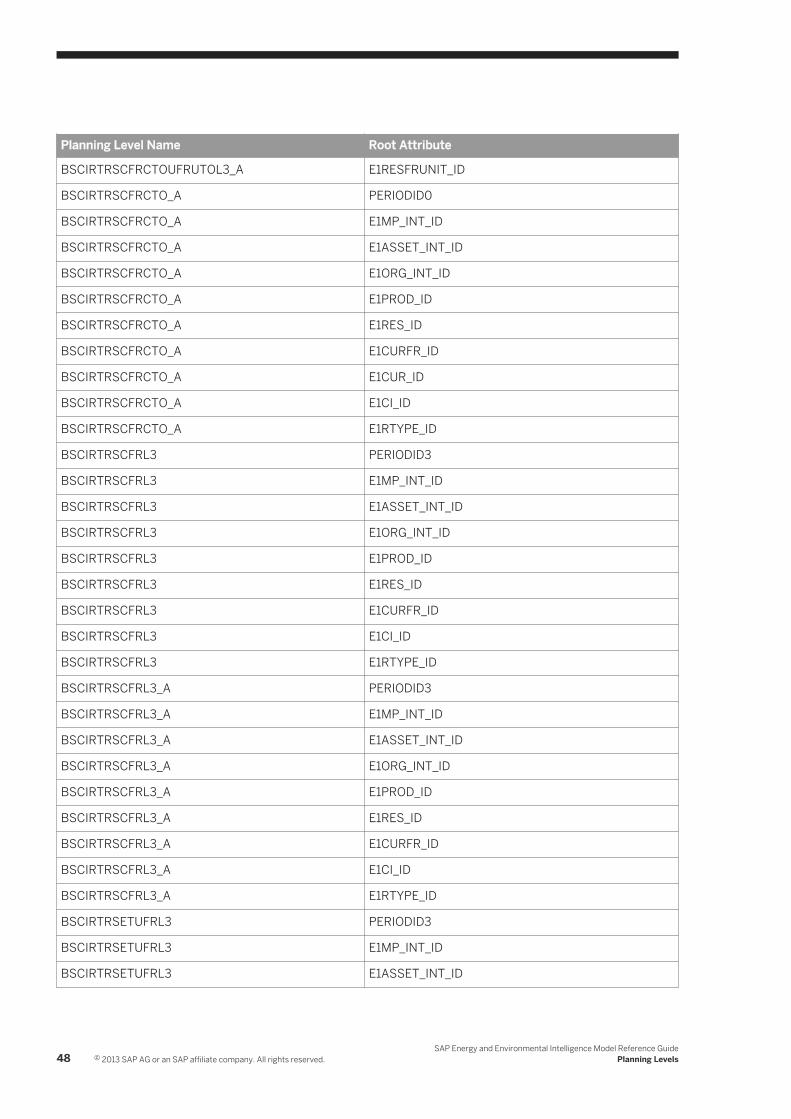
Planning Level Name Root Attribute
BSCIRTRSCFRCTOUFRUTOL3_A E1RESFRUNIT_ID
BSCIRTRSCFRCTO_A PERIODID0
BSCIRTRSCFRCTO_A E1MP_INT_ID
BSCIRTRSCFRCTO_A E1ASSET_INT_ID
BSCIRTRSCFRCTO_A E1ORG_INT_ID
BSCIRTRSCFRCTO_A E1PROD_ID
BSCIRTRSCFRCTO_A E1RES_ID
BSCIRTRSCFRCTO_A E1CURFR_ID
BSCIRTRSCFRCTO_A E1CUR_ID
BSCIRTRSCFRCTO_A E1CI_ID
BSCIRTRSCFRCTO_A E1RTYPE_ID
BSCIRTRSCFRL3 PERIODID3
BSCIRTRSCFRL3 E1MP_INT_ID
BSCIRTRSCFRL3 E1ASSET_INT_ID
BSCIRTRSCFRL3 E1ORG_INT_ID
BSCIRTRSCFRL3 E1PROD_ID
BSCIRTRSCFRL3 E1RES_ID
BSCIRTRSCFRL3 E1CURFR_ID
BSCIRTRSCFRL3 E1CI_ID
BSCIRTRSCFRL3 E1RTYPE_ID
BSCIRTRSCFRL3_A PERIODID3
BSCIRTRSCFRL3_A E1MP_INT_ID
BSCIRTRSCFRL3_A E1ASSET_INT_ID
BSCIRTRSCFRL3_A E1ORG_INT_ID
BSCIRTRSCFRL3_A E1PROD_ID
BSCIRTRSCFRL3_A E1RES_ID
BSCIRTRSCFRL3_A E1CURFR_ID
BSCIRTRSCFRL3_A E1CI_ID
BSCIRTRSCFRL3_A E1RTYPE_ID
BSCIRTRSETUFRL3 PERIODID3
BSCIRTRSETUFRL3 E1MP_INT_ID
BSCIRTRSETUFRL3 E1ASSET_INT_ID
48 © 2013 SAP AG or an SAP affiliate company. All rights reserved.SAP Energy and Environmental Intelligence Model Reference Guide
Planning Levels
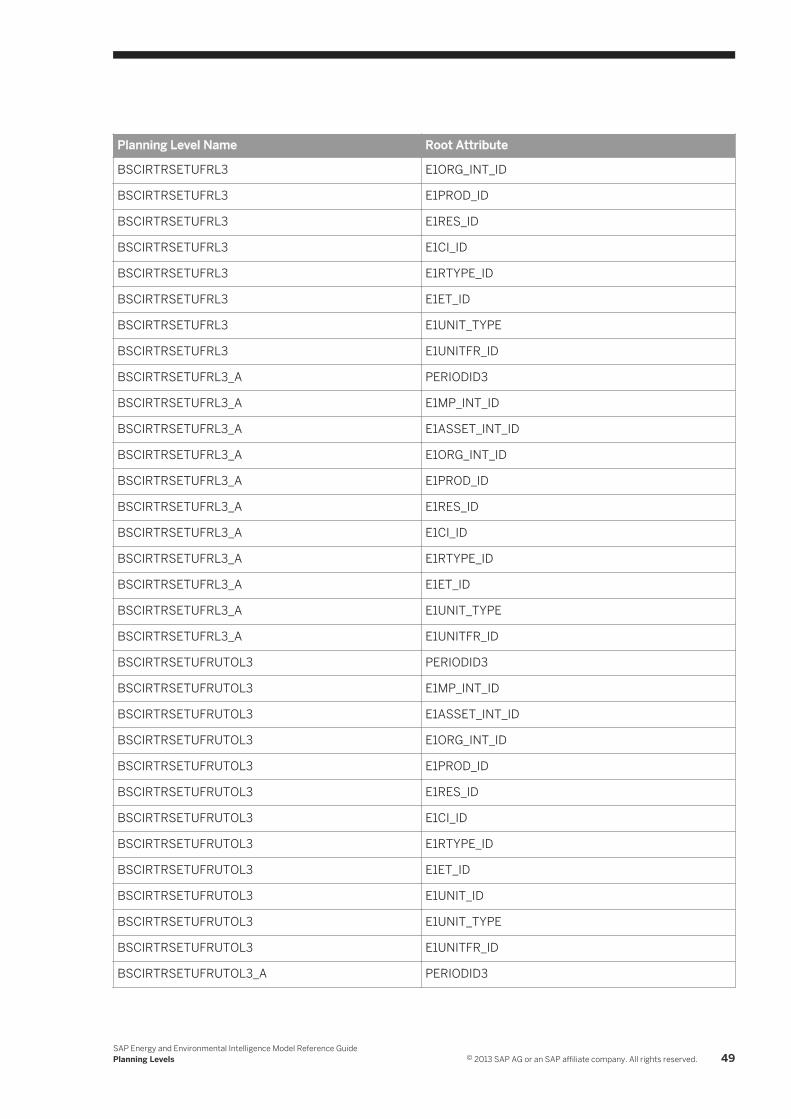
Planning Level Name Root Attribute
BSCIRTRSETUFRL3 E1ORG_INT_ID
BSCIRTRSETUFRL3 E1PROD_ID
BSCIRTRSETUFRL3 E1RES_ID
BSCIRTRSETUFRL3 E1CI_ID
BSCIRTRSETUFRL3 E1RTYPE_ID
BSCIRTRSETUFRL3 E1ET_ID
BSCIRTRSETUFRL3 E1UNIT_TYPE
BSCIRTRSETUFRL3 E1UNITFR_ID
BSCIRTRSETUFRL3_A PERIODID3
BSCIRTRSETUFRL3_A E1MP_INT_ID
BSCIRTRSETUFRL3_A E1ASSET_INT_ID
BSCIRTRSETUFRL3_A E1ORG_INT_ID
BSCIRTRSETUFRL3_A E1PROD_ID
BSCIRTRSETUFRL3_A E1RES_ID
BSCIRTRSETUFRL3_A E1CI_ID
BSCIRTRSETUFRL3_A E1RTYPE_ID
BSCIRTRSETUFRL3_A E1ET_ID
BSCIRTRSETUFRL3_A E1UNIT_TYPE
BSCIRTRSETUFRL3_A E1UNITFR_ID
BSCIRTRSETUFRUTOL3 PERIODID3
BSCIRTRSETUFRUTOL3 E1MP_INT_ID
BSCIRTRSETUFRUTOL3 E1ASSET_INT_ID
BSCIRTRSETUFRUTOL3 E1ORG_INT_ID
BSCIRTRSETUFRUTOL3 E1PROD_ID
BSCIRTRSETUFRUTOL3 E1RES_ID
BSCIRTRSETUFRUTOL3 E1CI_ID
BSCIRTRSETUFRUTOL3 E1RTYPE_ID
BSCIRTRSETUFRUTOL3 E1ET_ID
BSCIRTRSETUFRUTOL3 E1UNIT_ID
BSCIRTRSETUFRUTOL3 E1UNIT_TYPE
BSCIRTRSETUFRUTOL3 E1UNITFR_ID
BSCIRTRSETUFRUTOL3_A PERIODID3
SAP Energy and Environmental Intelligence Model Reference GuidePlanning Levels © 2013 SAP AG or an SAP affiliate company. All rights reserved. 49
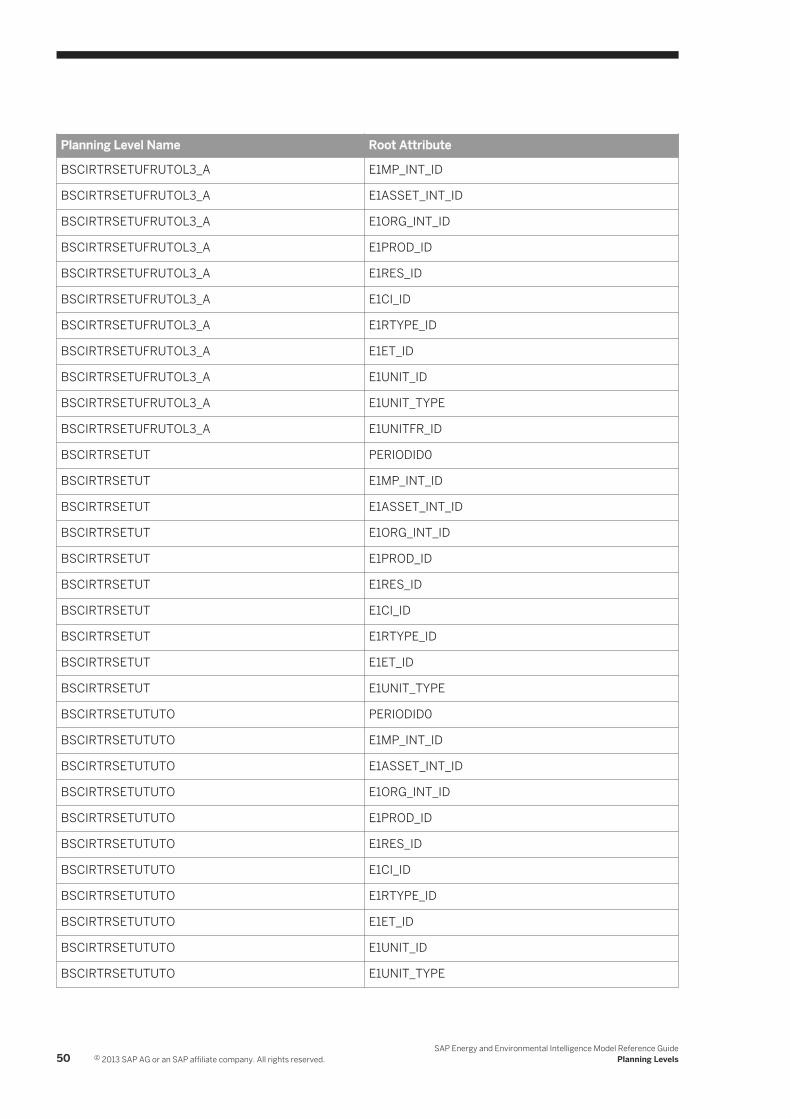
Planning Level Name Root Attribute
BSCIRTRSETUFRUTOL3_A E1MP_INT_ID
BSCIRTRSETUFRUTOL3_A E1ASSET_INT_ID
BSCIRTRSETUFRUTOL3_A E1ORG_INT_ID
BSCIRTRSETUFRUTOL3_A E1PROD_ID
BSCIRTRSETUFRUTOL3_A E1RES_ID
BSCIRTRSETUFRUTOL3_A E1CI_ID
BSCIRTRSETUFRUTOL3_A E1RTYPE_ID
BSCIRTRSETUFRUTOL3_A E1ET_ID
BSCIRTRSETUFRUTOL3_A E1UNIT_ID
BSCIRTRSETUFRUTOL3_A E1UNIT_TYPE
BSCIRTRSETUFRUTOL3_A E1UNITFR_ID
BSCIRTRSETUT PERIODID0
BSCIRTRSETUT E1MP_INT_ID
BSCIRTRSETUT E1ASSET_INT_ID
BSCIRTRSETUT E1ORG_INT_ID
BSCIRTRSETUT E1PROD_ID
BSCIRTRSETUT E1RES_ID
BSCIRTRSETUT E1CI_ID
BSCIRTRSETUT E1RTYPE_ID
BSCIRTRSETUT E1ET_ID
BSCIRTRSETUT E1UNIT_TYPE
BSCIRTRSETUTUTO PERIODID0
BSCIRTRSETUTUTO E1MP_INT_ID
BSCIRTRSETUTUTO E1ASSET_INT_ID
BSCIRTRSETUTUTO E1ORG_INT_ID
BSCIRTRSETUTUTO E1PROD_ID
BSCIRTRSETUTUTO E1RES_ID
BSCIRTRSETUTUTO E1CI_ID
BSCIRTRSETUTUTO E1RTYPE_ID
BSCIRTRSETUTUTO E1ET_ID
BSCIRTRSETUTUTO E1UNIT_ID
BSCIRTRSETUTUTO E1UNIT_TYPE
50 © 2013 SAP AG or an SAP affiliate company. All rights reserved.SAP Energy and Environmental Intelligence Model Reference Guide
Planning Levels
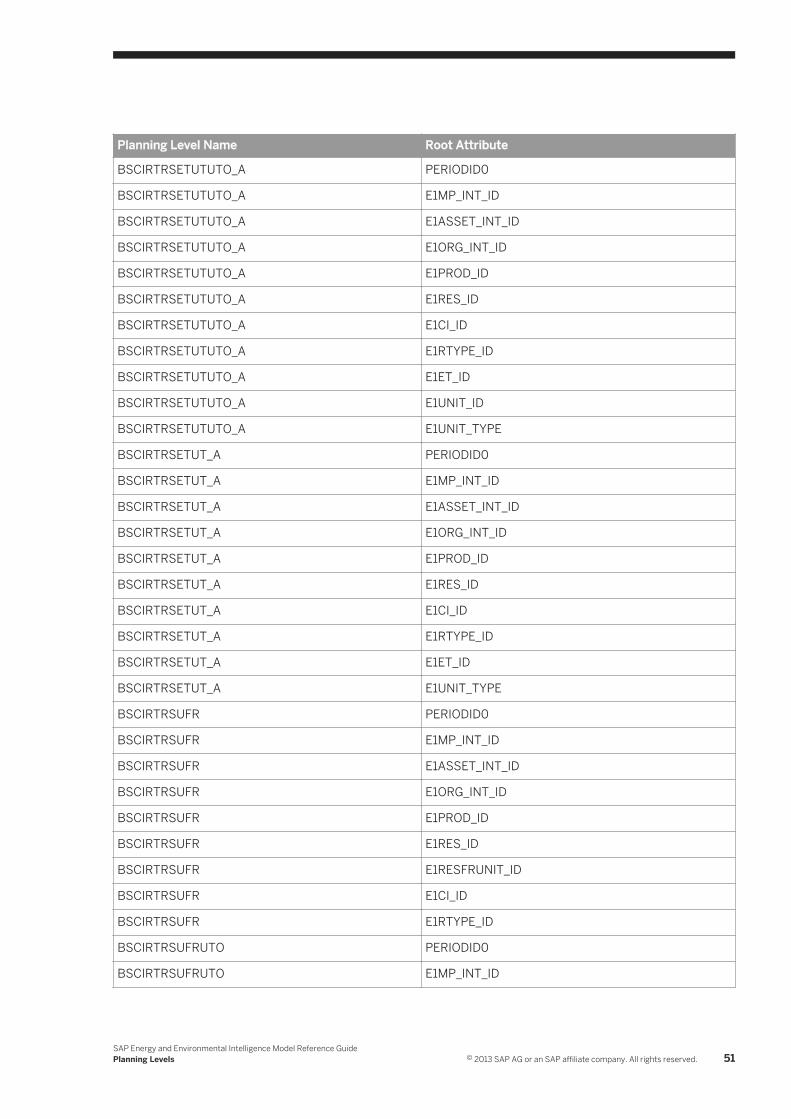
Planning Level Name Root Attribute
BSCIRTRSETUTUTO_A PERIODID0
BSCIRTRSETUTUTO_A E1MP_INT_ID
BSCIRTRSETUTUTO_A E1ASSET_INT_ID
BSCIRTRSETUTUTO_A E1ORG_INT_ID
BSCIRTRSETUTUTO_A E1PROD_ID
BSCIRTRSETUTUTO_A E1RES_ID
BSCIRTRSETUTUTO_A E1CI_ID
BSCIRTRSETUTUTO_A E1RTYPE_ID
BSCIRTRSETUTUTO_A E1ET_ID
BSCIRTRSETUTUTO_A E1UNIT_ID
BSCIRTRSETUTUTO_A E1UNIT_TYPE
BSCIRTRSETUT_A PERIODID0
BSCIRTRSETUT_A E1MP_INT_ID
BSCIRTRSETUT_A E1ASSET_INT_ID
BSCIRTRSETUT_A E1ORG_INT_ID
BSCIRTRSETUT_A E1PROD_ID
BSCIRTRSETUT_A E1RES_ID
BSCIRTRSETUT_A E1CI_ID
BSCIRTRSETUT_A E1RTYPE_ID
BSCIRTRSETUT_A E1ET_ID
BSCIRTRSETUT_A E1UNIT_TYPE
BSCIRTRSUFR PERIODID0
BSCIRTRSUFR E1MP_INT_ID
BSCIRTRSUFR E1ASSET_INT_ID
BSCIRTRSUFR E1ORG_INT_ID
BSCIRTRSUFR E1PROD_ID
BSCIRTRSUFR E1RES_ID
BSCIRTRSUFR E1RESFRUNIT_ID
BSCIRTRSUFR E1CI_ID
BSCIRTRSUFR E1RTYPE_ID
BSCIRTRSUFRUTO PERIODID0
BSCIRTRSUFRUTO E1MP_INT_ID
SAP Energy and Environmental Intelligence Model Reference GuidePlanning Levels © 2013 SAP AG or an SAP affiliate company. All rights reserved. 51

Planning Level Name Root Attribute
BSCIRTRSUFRUTO E1ASSET_INT_ID
BSCIRTRSUFRUTO E1ORG_INT_ID
BSCIRTRSUFRUTO E1PROD_ID
BSCIRTRSUFRUTO E1RES_ID
BSCIRTRSUFRUTO E1RESFRUNIT_ID
BSCIRTRSUFRUTO E1RESUNIT_ID
BSCIRTRSUFRUTO E1CI_ID
BSCIRTRSUFRUTO E1RTYPE_ID
BSCIRTRSUFRUTOL3 PERIODID3
BSCIRTRSUFRUTOL3 E1MP_INT_ID
BSCIRTRSUFRUTOL3 E1ASSET_INT_ID
BSCIRTRSUFRUTOL3 E1ORG_INT_ID
BSCIRTRSUFRUTOL3 E1PROD_ID
BSCIRTRSUFRUTOL3 E1RES_ID
BSCIRTRSUFRUTOL3 E1RESFRUNIT_ID
BSCIRTRSUFRUTOL3 E1RESUNIT_ID
BSCIRTRSUFRUTOL3 E1CI_ID
BSCIRTRSUFRUTOL3 E1RTYPE_ID
BSCIRTRSUFRUTO_A PERIODID0
BSCIRTRSUFRUTO_A E1MP_INT_ID
BSCIRTRSUFRUTO_A E1ASSET_INT_ID
BSCIRTRSUFRUTO_A E1ORG_INT_ID
BSCIRTRSUFRUTO_A E1PROD_ID
BSCIRTRSUFRUTO_A E1RES_ID
BSCIRTRSUFRUTO_A E1RESFRUNIT_ID
BSCIRTRSUFRUTO_A E1RESUNIT_ID
BSCIRTRSUFRUTO_A E1CI_ID
BSCIRTRSUFRUTO_A E1RTYPE_ID
BSCIRTRSUFR_A PERIODID0
BSCIRTRSUFR_A E1MP_INT_ID
BSCIRTRSUFR_A E1ASSET_INT_ID
BSCIRTRSUFR_A E1ORG_INT_ID
52 © 2013 SAP AG or an SAP affiliate company. All rights reserved.SAP Energy and Environmental Intelligence Model Reference Guide
Planning Levels

Planning Level Name Root Attribute
BSCIRTRSUFR_A E1PROD_ID
BSCIRTRSUFR_A E1RES_ID
BSCIRTRSUFR_A E1RESFRUNIT_ID
BSCIRTRSUFR_A E1CI_ID
BSCIRTRSUFR_A E1RTYPE_ID
BSCIRTRS_A PERIODID0
BSCIRTRS_A E1MP_INT_ID
BSCIRTRS_A E1ASSET_INT_ID
BSCIRTRS_A E1ORG_INT_ID
BSCIRTRS_A E1PROD_ID
BSCIRTRS_A E1RES_ID
BSCIRTRS_A E1CI_ID
BSCIRTRS_A E1RTYPE_ID
BSL3 PERIODID3
BSL3 E1MP_INT_ID
BSL3 E1ASSET_INT_ID
BSL3 E1ORG_INT_ID
BSL3 E1PROD_ID
BSL3_A PERIODID3
BSL3_A E1MP_INT_ID
BSL3_A E1ASSET_INT_ID
BSL3_A E1ORG_INT_ID
BSL3_A E1PROD_ID
CFRCTOL3 PERIODID3
CFRCTOL3 E1CURFR_ID
CFRCTOL3 E1CUR_ID
CFRCTOL4 PERIODID4
CFRCTOL4 E1CURFR_ID
CFRCTOL4 E1CUR_ID
CFRL4 PERIODID4
CFRL4 E1CURFR_ID
CI_PER PERIODID0
SAP Energy and Environmental Intelligence Model Reference GuidePlanning Levels © 2013 SAP AG or an SAP affiliate company. All rights reserved. 53

Planning Level Name Root Attribute
CI_PER E1CI_ID
CTOL4 PERIODID4
CTOL4 E1CUR_ID
FSRESETUTL1 PERIODID1
FSRESETUTL1 E1MP_FACTOR_SET
FSRESETUTL1 E1RES_ID
FSRESETUTL1 E1ET_ID
FSRESETUTL1 E1UNIT_TYPE
MATUFRL1 PERIODID1
MATUFRL1 E1MAT_TYPE
MATUFRL1 E1RESFRUNIT_ID
MATUFRUTOL1 PERIODID1
MATUFRUTOL1 E1MAT_TYPE
MATUFRUTOL1 E1RESFRUNIT_ID
MATUFRUTOL1 E1RESUNIT_ID
MATUTOL1 PERIODID1
MATUTOL1 E1MAT_TYPE
MATUTOL1 E1RESUNIT_ID
MPASSETL3 PERIODID3
MPASSETL3 E1MP_INT_ID
MPASSETL3 E1ASSET_INT_ID
MPCIRT PERIODID0
MPCIRT E1MP_INT_ID
MPCIRT E1RES_ID
MPCIRT E1CI_ID
MPCIRT E1RTYPE_ID
MPCIRTRSCFRL3 PERIODID3
MPCIRTRSCFRL3 E1MP_INT_ID
MPCIRTRSCFRL3 E1RES_ID
MPCIRTRSCFRL3 E1CURFR_ID
MPCIRTRSCFRL3 E1CI_ID
MPCIRTRSCFRL3 E1RTYPE_ID
54 © 2013 SAP AG or an SAP affiliate company. All rights reserved.SAP Energy and Environmental Intelligence Model Reference Guide
Planning Levels
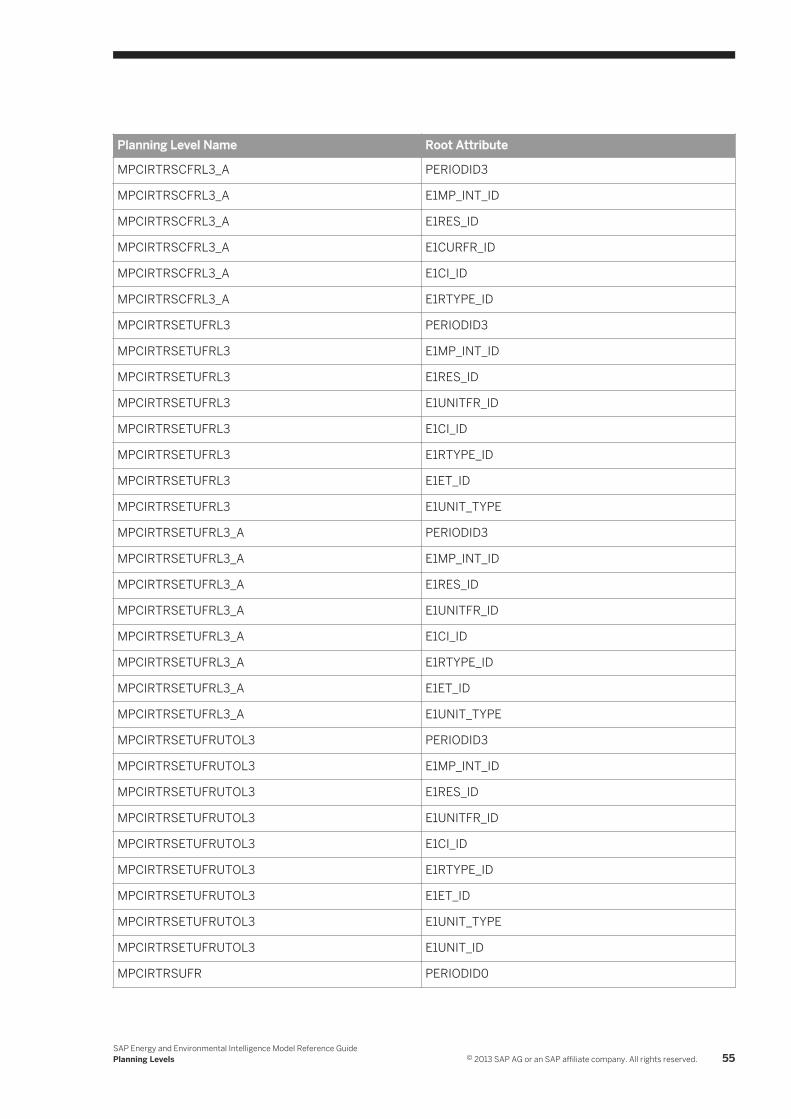
Planning Level Name Root Attribute
MPCIRTRSCFRL3_A PERIODID3
MPCIRTRSCFRL3_A E1MP_INT_ID
MPCIRTRSCFRL3_A E1RES_ID
MPCIRTRSCFRL3_A E1CURFR_ID
MPCIRTRSCFRL3_A E1CI_ID
MPCIRTRSCFRL3_A E1RTYPE_ID
MPCIRTRSETUFRL3 PERIODID3
MPCIRTRSETUFRL3 E1MP_INT_ID
MPCIRTRSETUFRL3 E1RES_ID
MPCIRTRSETUFRL3 E1UNITFR_ID
MPCIRTRSETUFRL3 E1CI_ID
MPCIRTRSETUFRL3 E1RTYPE_ID
MPCIRTRSETUFRL3 E1ET_ID
MPCIRTRSETUFRL3 E1UNIT_TYPE
MPCIRTRSETUFRL3_A PERIODID3
MPCIRTRSETUFRL3_A E1MP_INT_ID
MPCIRTRSETUFRL3_A E1RES_ID
MPCIRTRSETUFRL3_A E1UNITFR_ID
MPCIRTRSETUFRL3_A E1CI_ID
MPCIRTRSETUFRL3_A E1RTYPE_ID
MPCIRTRSETUFRL3_A E1ET_ID
MPCIRTRSETUFRL3_A E1UNIT_TYPE
MPCIRTRSETUFRUTOL3 PERIODID3
MPCIRTRSETUFRUTOL3 E1MP_INT_ID
MPCIRTRSETUFRUTOL3 E1RES_ID
MPCIRTRSETUFRUTOL3 E1UNITFR_ID
MPCIRTRSETUFRUTOL3 E1CI_ID
MPCIRTRSETUFRUTOL3 E1RTYPE_ID
MPCIRTRSETUFRUTOL3 E1ET_ID
MPCIRTRSETUFRUTOL3 E1UNIT_TYPE
MPCIRTRSETUFRUTOL3 E1UNIT_ID
MPCIRTRSUFR PERIODID0
SAP Energy and Environmental Intelligence Model Reference GuidePlanning Levels © 2013 SAP AG or an SAP affiliate company. All rights reserved. 55

Planning Level Name Root Attribute
MPCIRTRSUFR E1MP_INT_ID
MPCIRTRSUFR E1RES_ID
MPCIRTRSUFR E1RESFRUNIT_ID
MPCIRTRSUFR E1CI_ID
MPCIRTRSUFR E1RTYPE_ID
MPCIRTRSUFRUTO PERIODID0
MPCIRTRSUFRUTO E1MP_INT_ID
MPCIRTRSUFRUTO E1RES_ID
MPCIRTRSUFRUTO E1RESFRUNIT_ID
MPCIRTRSUFRUTO E1RESUNIT_ID
MPCIRTRSUFRUTO E1CI_ID
MPCIRTRSUFRUTO E1RTYPE_ID
MPCIRTRSUFRUTO_A PERIODID0
MPCIRTRSUFRUTO_A E1MP_INT_ID
MPCIRTRSUFRUTO_A E1RES_ID
MPCIRTRSUFRUTO_A E1RESFRUNIT_ID
MPCIRTRSUFRUTO_A E1RESUNIT_ID
MPCIRTRSUFRUTO_A E1CI_ID
MPCIRTRSUFRUTO_A E1RTYPE_ID
MPCIRTRSUFR_A PERIODID0
MPCIRTRSUFR_A E1MP_INT_ID
MPCIRTRSUFR_A E1RES_ID
MPCIRTRSUFR_A E1RESFRUNIT_ID
MPCIRTRSUFR_A E1CI_ID
MPCIRTRSUFR_A E1RTYPE_ID
MPCIRT_A PERIODID0
MPCIRT_A E1MP_INT_ID
MPCIRT_A E1RES_ID
MPCIRT_A E1CI_ID
MPCIRT_A E1RTYPE_ID
PJASSETL3 PERIODID3
PJASSETL3 E1PJ_ID
56 © 2013 SAP AG or an SAP affiliate company. All rights reserved.SAP Energy and Environmental Intelligence Model Reference Guide
Planning Levels
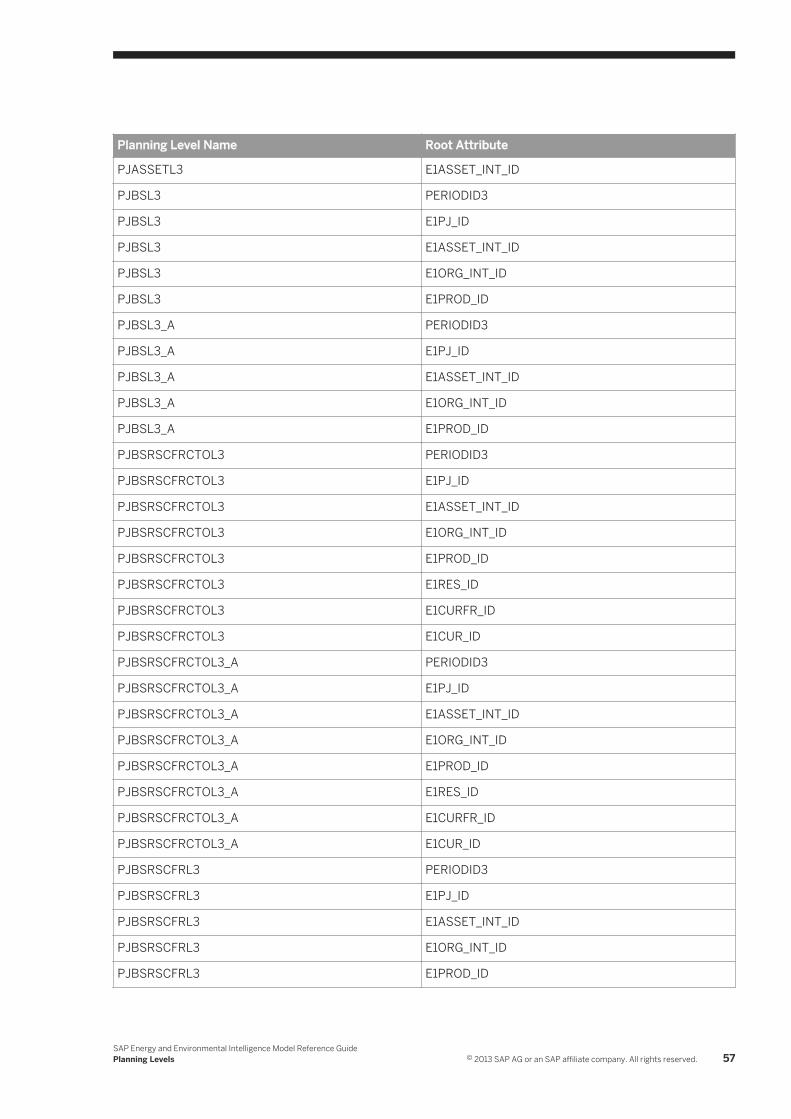
Planning Level Name Root Attribute
PJASSETL3 E1ASSET_INT_ID
PJBSL3 PERIODID3
PJBSL3 E1PJ_ID
PJBSL3 E1ASSET_INT_ID
PJBSL3 E1ORG_INT_ID
PJBSL3 E1PROD_ID
PJBSL3_A PERIODID3
PJBSL3_A E1PJ_ID
PJBSL3_A E1ASSET_INT_ID
PJBSL3_A E1ORG_INT_ID
PJBSL3_A E1PROD_ID
PJBSRSCFRCTOL3 PERIODID3
PJBSRSCFRCTOL3 E1PJ_ID
PJBSRSCFRCTOL3 E1ASSET_INT_ID
PJBSRSCFRCTOL3 E1ORG_INT_ID
PJBSRSCFRCTOL3 E1PROD_ID
PJBSRSCFRCTOL3 E1RES_ID
PJBSRSCFRCTOL3 E1CURFR_ID
PJBSRSCFRCTOL3 E1CUR_ID
PJBSRSCFRCTOL3_A PERIODID3
PJBSRSCFRCTOL3_A E1PJ_ID
PJBSRSCFRCTOL3_A E1ASSET_INT_ID
PJBSRSCFRCTOL3_A E1ORG_INT_ID
PJBSRSCFRCTOL3_A E1PROD_ID
PJBSRSCFRCTOL3_A E1RES_ID
PJBSRSCFRCTOL3_A E1CURFR_ID
PJBSRSCFRCTOL3_A E1CUR_ID
PJBSRSCFRL3 PERIODID3
PJBSRSCFRL3 E1PJ_ID
PJBSRSCFRL3 E1ASSET_INT_ID
PJBSRSCFRL3 E1ORG_INT_ID
PJBSRSCFRL3 E1PROD_ID
SAP Energy and Environmental Intelligence Model Reference GuidePlanning Levels © 2013 SAP AG or an SAP affiliate company. All rights reserved. 57
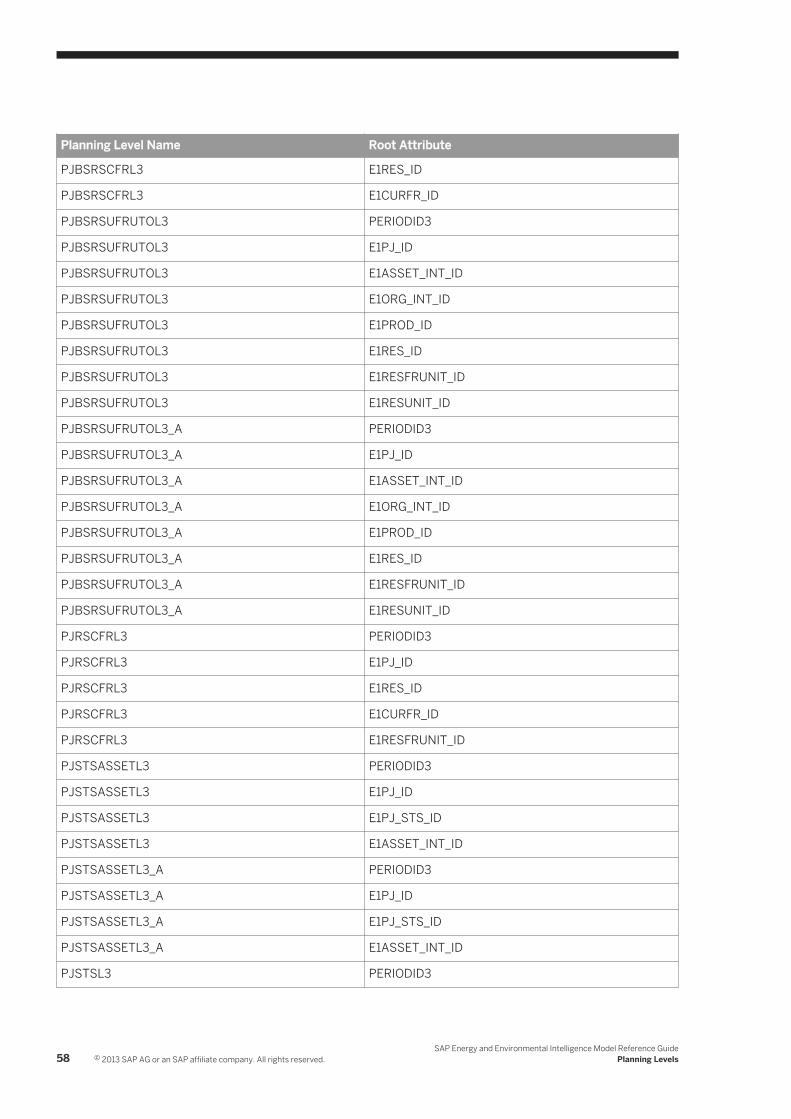
Planning Level Name Root Attribute
PJBSRSCFRL3 E1RES_ID
PJBSRSCFRL3 E1CURFR_ID
PJBSRSUFRUTOL3 PERIODID3
PJBSRSUFRUTOL3 E1PJ_ID
PJBSRSUFRUTOL3 E1ASSET_INT_ID
PJBSRSUFRUTOL3 E1ORG_INT_ID
PJBSRSUFRUTOL3 E1PROD_ID
PJBSRSUFRUTOL3 E1RES_ID
PJBSRSUFRUTOL3 E1RESFRUNIT_ID
PJBSRSUFRUTOL3 E1RESUNIT_ID
PJBSRSUFRUTOL3_A PERIODID3
PJBSRSUFRUTOL3_A E1PJ_ID
PJBSRSUFRUTOL3_A E1ASSET_INT_ID
PJBSRSUFRUTOL3_A E1ORG_INT_ID
PJBSRSUFRUTOL3_A E1PROD_ID
PJBSRSUFRUTOL3_A E1RES_ID
PJBSRSUFRUTOL3_A E1RESFRUNIT_ID
PJBSRSUFRUTOL3_A E1RESUNIT_ID
PJRSCFRL3 PERIODID3
PJRSCFRL3 E1PJ_ID
PJRSCFRL3 E1RES_ID
PJRSCFRL3 E1CURFR_ID
PJRSCFRL3 E1RESFRUNIT_ID
PJSTSASSETL3 PERIODID3
PJSTSASSETL3 E1PJ_ID
PJSTSASSETL3 E1PJ_STS_ID
PJSTSASSETL3 E1ASSET_INT_ID
PJSTSASSETL3_A PERIODID3
PJSTSASSETL3_A E1PJ_ID
PJSTSASSETL3_A E1PJ_STS_ID
PJSTSASSETL3_A E1ASSET_INT_ID
PJSTSL3 PERIODID3
58 © 2013 SAP AG or an SAP affiliate company. All rights reserved.SAP Energy and Environmental Intelligence Model Reference Guide
Planning Levels

Planning Level Name Root Attribute
PJSTSL3 E1PJ_ID
PJSTSL3 E1PJ_STS_ID
PRRS PERIODID0
PRRS E1PRATE_ID
PRRS E1RES_ID
PRRSCFR PERIODID0
PRRSCFR E1PRATE_ID
PRRSCFR E1RES_ID
PRRSCFR E1CURFR_ID
PRRTRS PERIODID0
PRRTRS E1PRATE_ID
PRRTRS E1RES_ID
PRRTRS E1RTYPE_ID
UFRL1 PERIODID1
UFRL1 E1UNITFR_ID
UFRL1 E1UNIT_TYPE
UFRUTOL1 PERIODID1
UFRUTOL1 E1UNIT_ID
UFRUTOL1 E1UNITFR_ID
UFRUTOL1 E1UNIT_TYPE
UTOL1 PERIODID1
UTOL1 E1UNIT_ID
UTOL1 E1UNIT_TYPE
WEL4 PERIODID4
WEL4 E1ASSET_WTHR_ST_ID
SAP Energy and Environmental Intelligence Model Reference GuidePlanning Levels © 2013 SAP AG or an SAP affiliate company. All rights reserved. 59
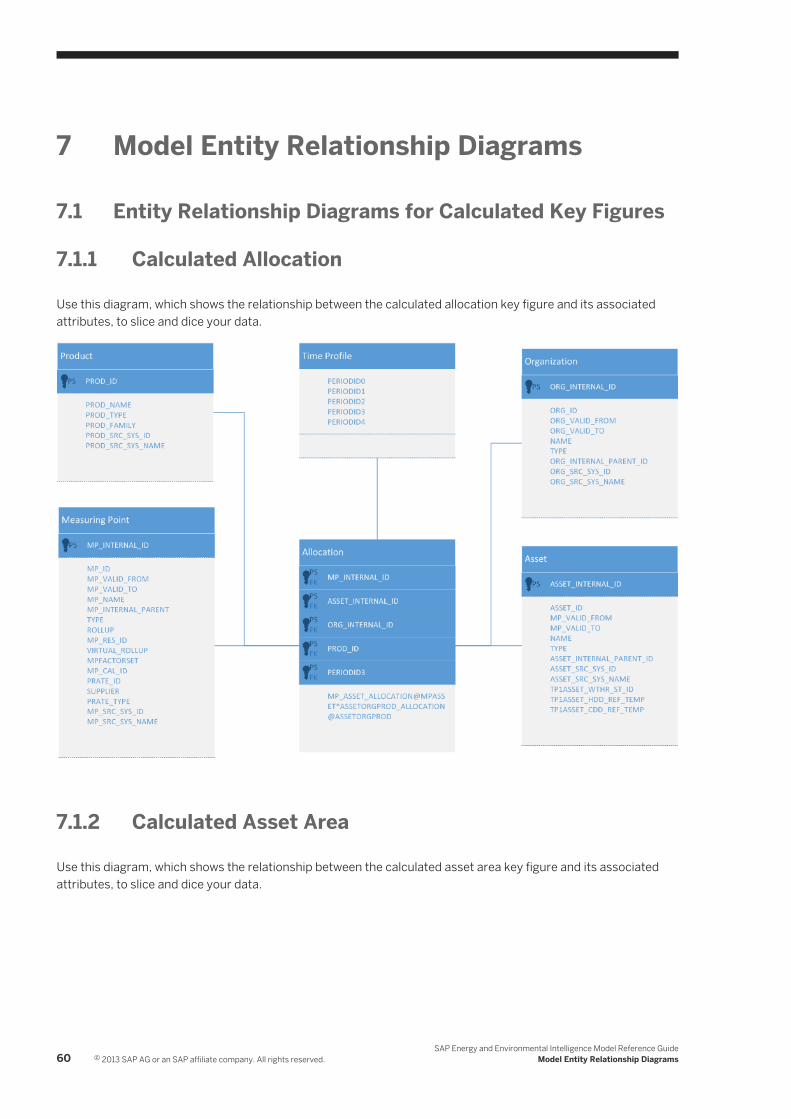
7 Model Entity Relationship Diagrams
7.1 Entity Relationship Diagrams for Calculated Key Figures
7.1.1 Calculated Allocation
Use this diagram, which shows the relationship between the calculated allocation key figure and its associated attributes, to slice and dice your data.
7.1.2 Calculated Asset Area
Use this diagram, which shows the relationship between the calculated asset area key figure and its associated attributes, to slice and dice your data.
60 © 2013 SAP AG or an SAP affiliate company. All rights reserved.SAP Energy and Environmental Intelligence Model Reference Guide
Model Entity Relationship Diagrams
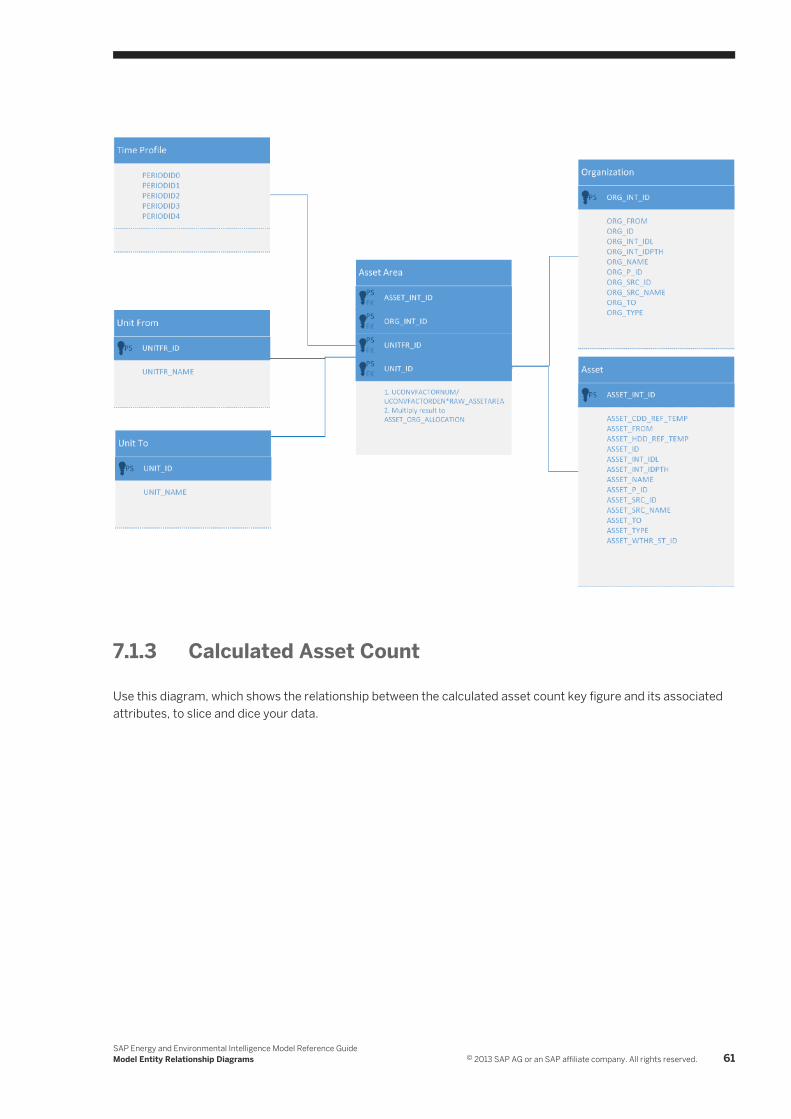
7.1.3 Calculated Asset Count
Use this diagram, which shows the relationship between the calculated asset count key figure and its associated attributes, to slice and dice your data.
SAP Energy and Environmental Intelligence Model Reference GuideModel Entity Relationship Diagrams © 2013 SAP AG or an SAP affiliate company. All rights reserved. 61
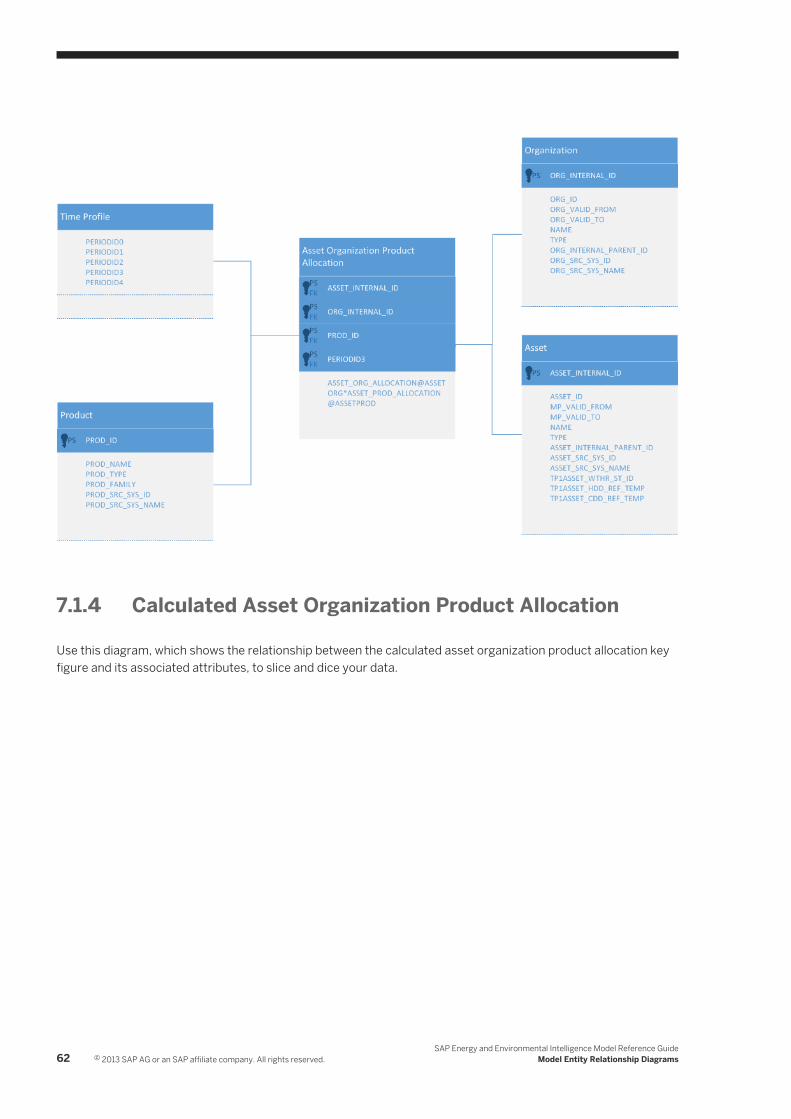
7.1.4 Calculated Asset Organization Product Allocation
Use this diagram, which shows the relationship between the calculated asset organization product allocation key figure and its associated attributes, to slice and dice your data.
62 © 2013 SAP AG or an SAP affiliate company. All rights reserved.SAP Energy and Environmental Intelligence Model Reference Guide
Model Entity Relationship Diagrams
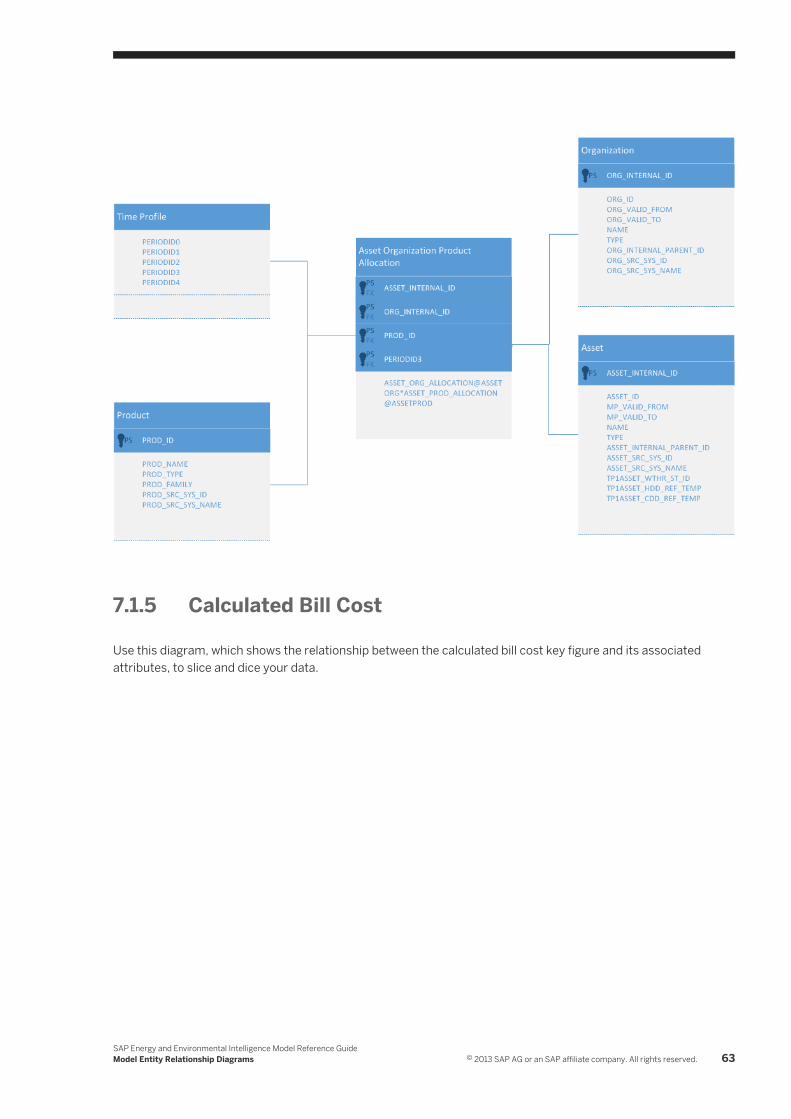
7.1.5 Calculated Bill Cost
Use this diagram, which shows the relationship between the calculated bill cost key figure and its associated attributes, to slice and dice your data.
SAP Energy and Environmental Intelligence Model Reference GuideModel Entity Relationship Diagrams © 2013 SAP AG or an SAP affiliate company. All rights reserved. 63
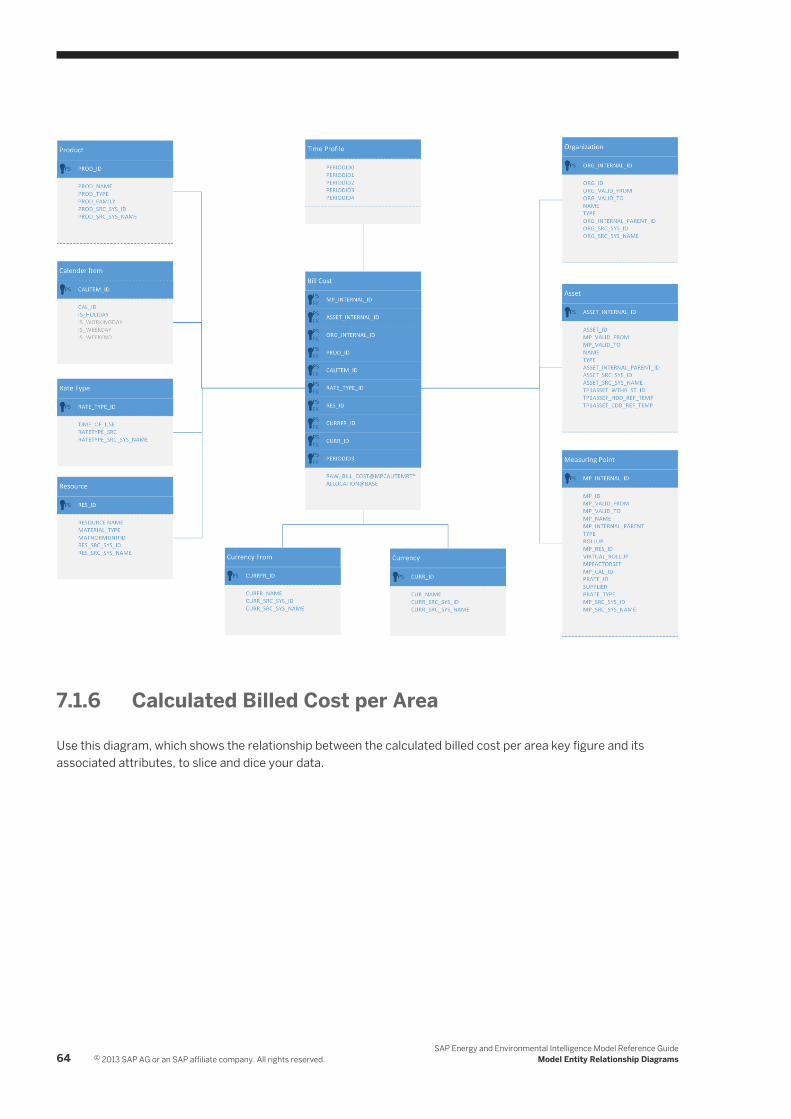
7.1.6 Calculated Billed Cost per Area
Use this diagram, which shows the relationship between the calculated billed cost per area key figure and its associated attributes, to slice and dice your data.
64 © 2013 SAP AG or an SAP affiliate company. All rights reserved.SAP Energy and Environmental Intelligence Model Reference Guide
Model Entity Relationship Diagrams

7.1.7 Calculated Billed Cost per Occupant
Use this diagram, which shows the relationship between the calculated billed cost per occupant key figure and its associated attributes, to slice and dice your data.
SAP Energy and Environmental Intelligence Model Reference GuideModel Entity Relationship Diagrams © 2013 SAP AG or an SAP affiliate company. All rights reserved. 65
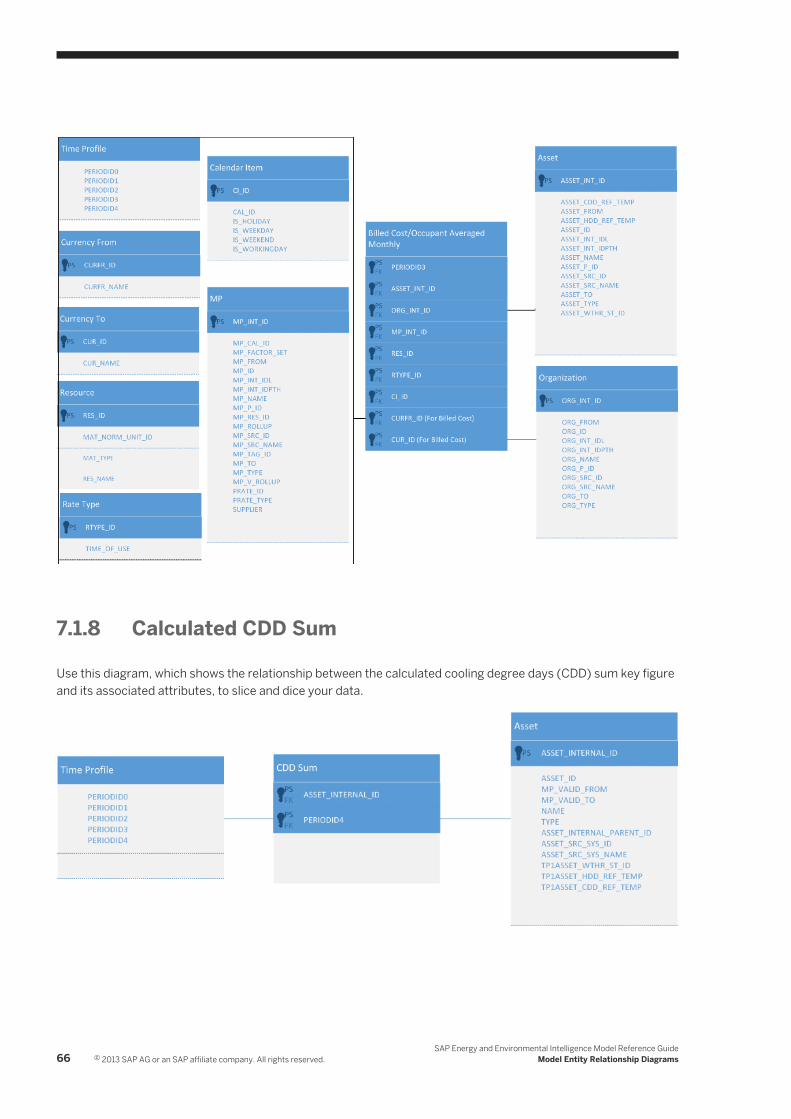
7.1.8 Calculated CDD Sum
Use this diagram, which shows the relationship between the calculated cooling degree days (CDD) sum key figure and its associated attributes, to slice and dice your data.
66 © 2013 SAP AG or an SAP affiliate company. All rights reserved.SAP Energy and Environmental Intelligence Model Reference Guide
Model Entity Relationship Diagrams
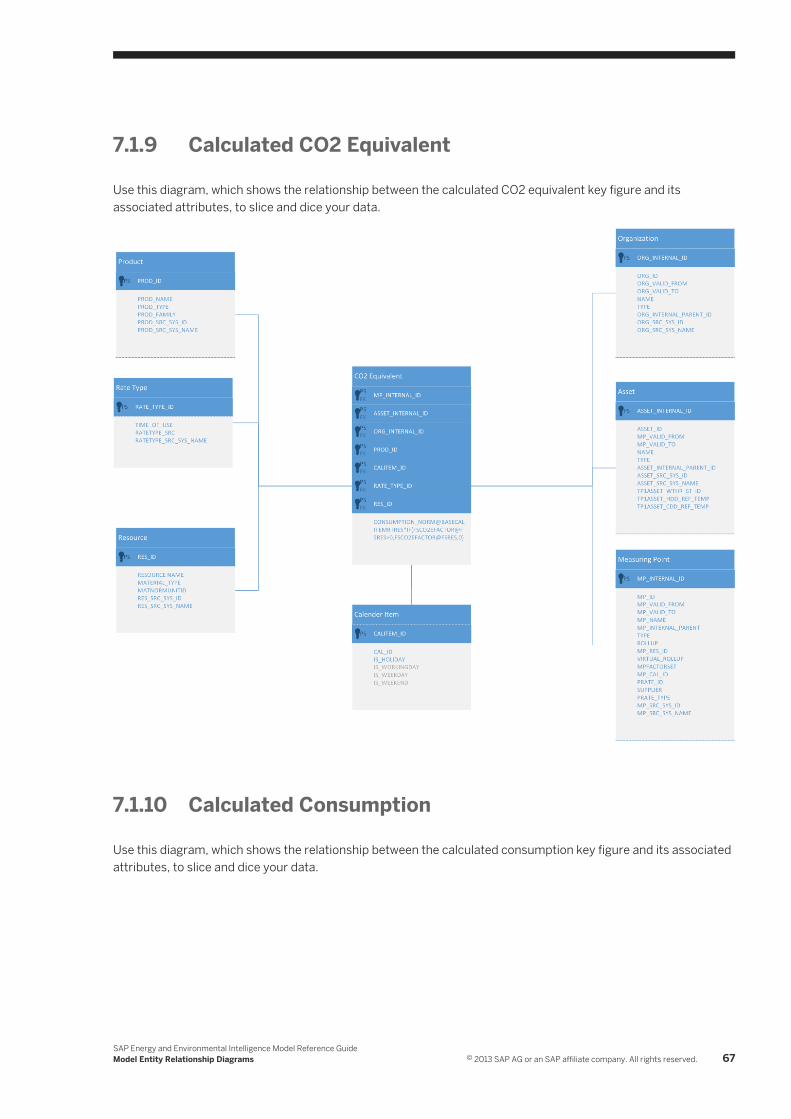
7.1.9 Calculated CO2 Equivalent
Use this diagram, which shows the relationship between the calculated CO2 equivalent key figure and its associated attributes, to slice and dice your data.
7.1.10 Calculated Consumption
Use this diagram, which shows the relationship between the calculated consumption key figure and its associated attributes, to slice and dice your data.
SAP Energy and Environmental Intelligence Model Reference GuideModel Entity Relationship Diagrams © 2013 SAP AG or an SAP affiliate company. All rights reserved. 67
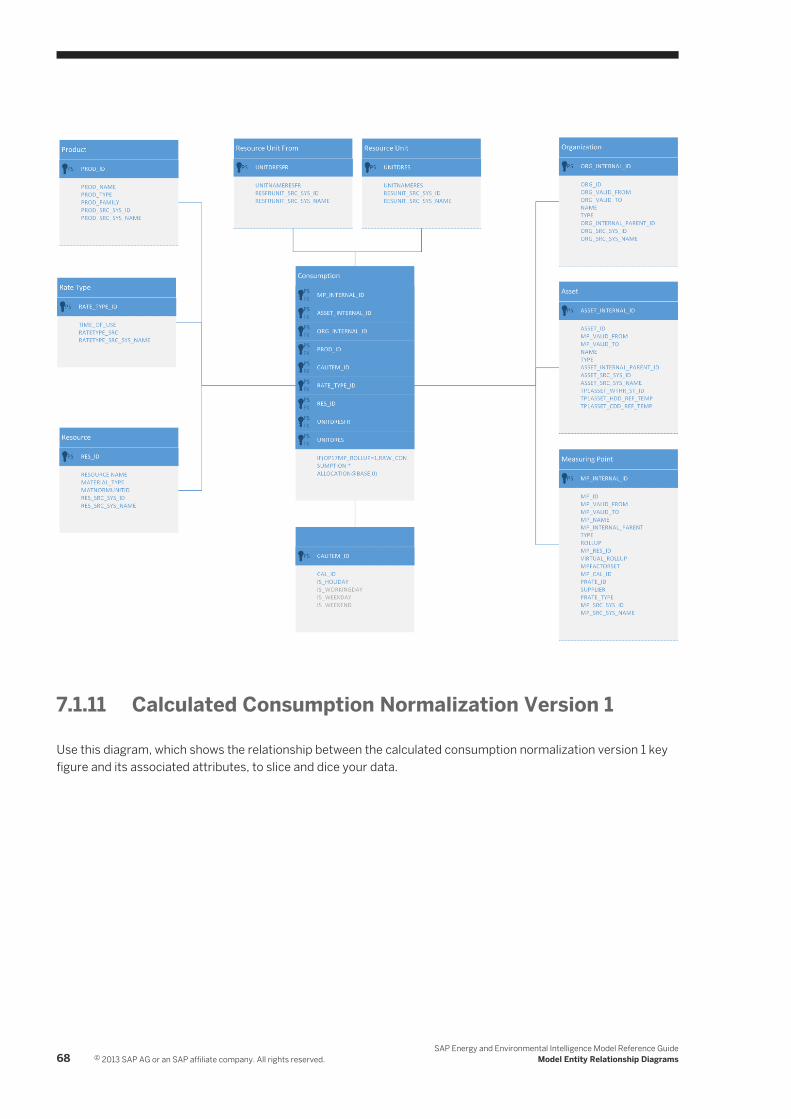
7.1.11 Calculated Consumption Normalization Version 1
Use this diagram, which shows the relationship between the calculated consumption normalization version 1 key figure and its associated attributes, to slice and dice your data.
68 © 2013 SAP AG or an SAP affiliate company. All rights reserved.SAP Energy and Environmental Intelligence Model Reference Guide
Model Entity Relationship Diagrams

7.1.12 Calculated Consumption Normalization Version 2
Use this diagram, which shows the relationship between the calculated consumption normalization version 2 key figure and its associated attributes, to slice and dice your data.
SAP Energy and Environmental Intelligence Model Reference GuideModel Entity Relationship Diagrams © 2013 SAP AG or an SAP affiliate company. All rights reserved. 69
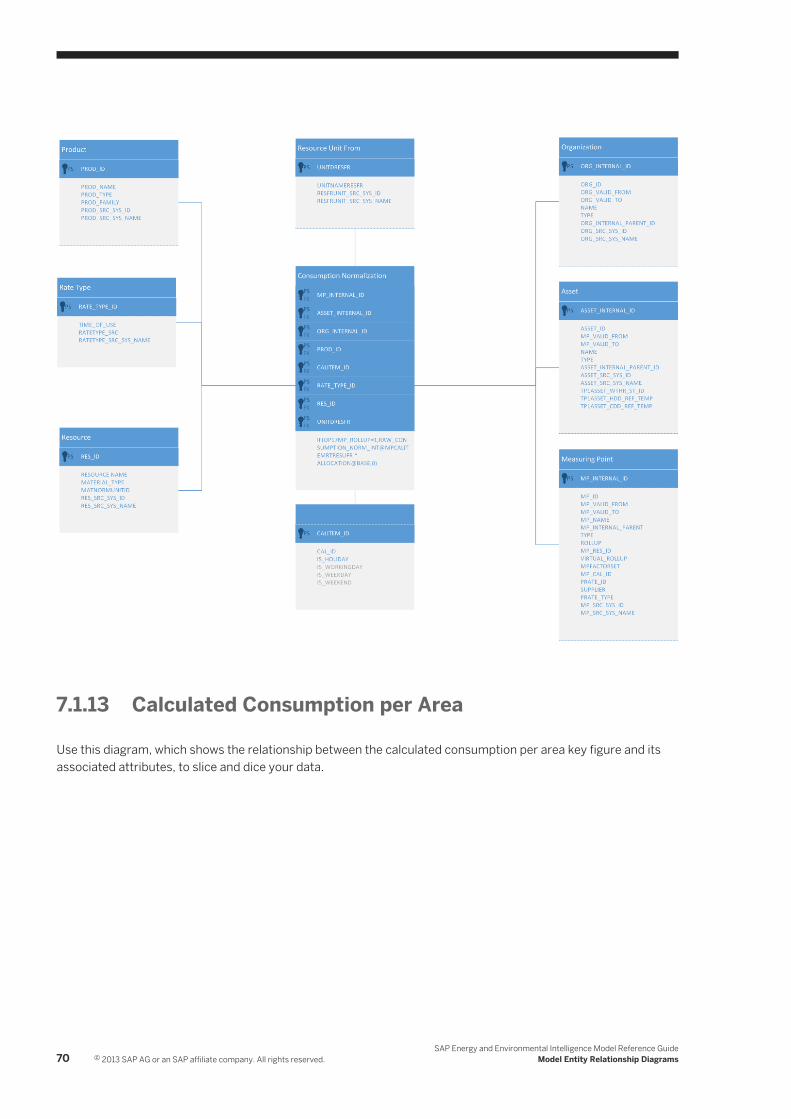
7.1.13 Calculated Consumption per Area
Use this diagram, which shows the relationship between the calculated consumption per area key figure and its associated attributes, to slice and dice your data.
70 © 2013 SAP AG or an SAP affiliate company. All rights reserved.SAP Energy and Environmental Intelligence Model Reference Guide
Model Entity Relationship Diagrams
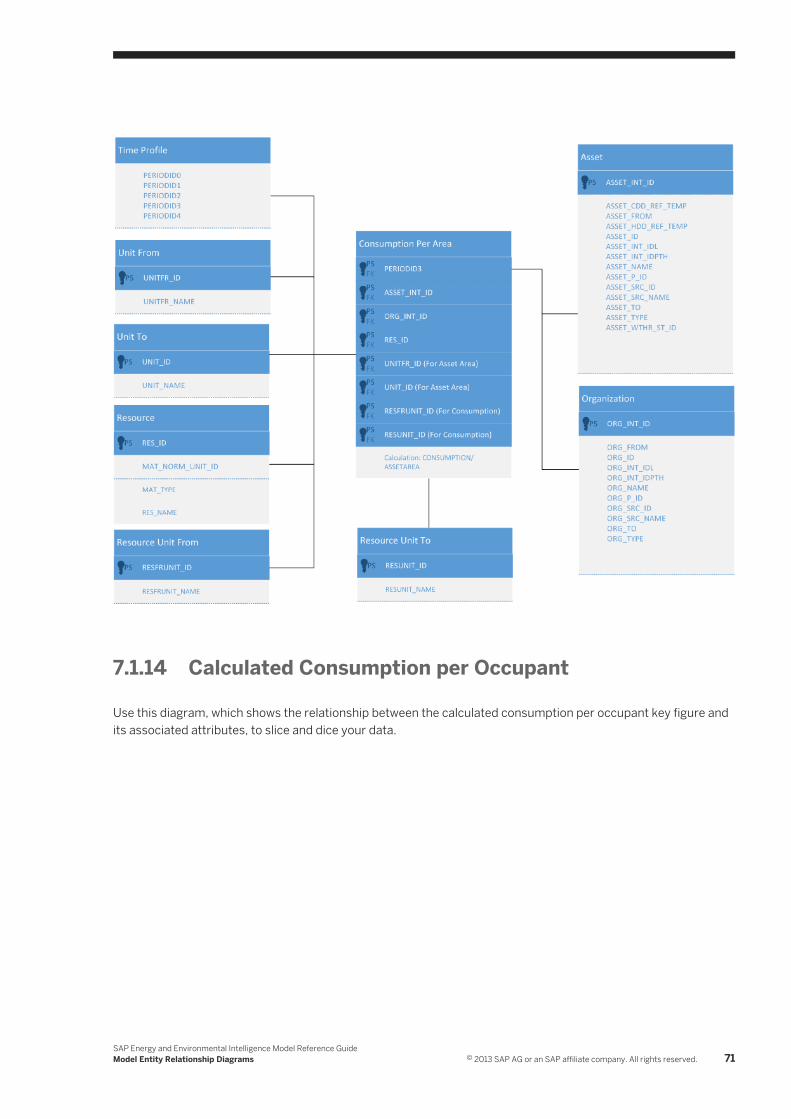
7.1.14 Calculated Consumption per Occupant
Use this diagram, which shows the relationship between the calculated consumption per occupant key figure and its associated attributes, to slice and dice your data.
SAP Energy and Environmental Intelligence Model Reference GuideModel Entity Relationship Diagrams © 2013 SAP AG or an SAP affiliate company. All rights reserved. 71
7.1.15 Calculated Consumption per Product Produced
Use this diagram, which shows the relationship between the calculated consumption per product produced key figure and its associated attributes, to slice and dice your data.
72 © 2013 SAP AG or an SAP affiliate company. All rights reserved.SAP Energy and Environmental Intelligence Model Reference Guide
Model Entity Relationship Diagrams
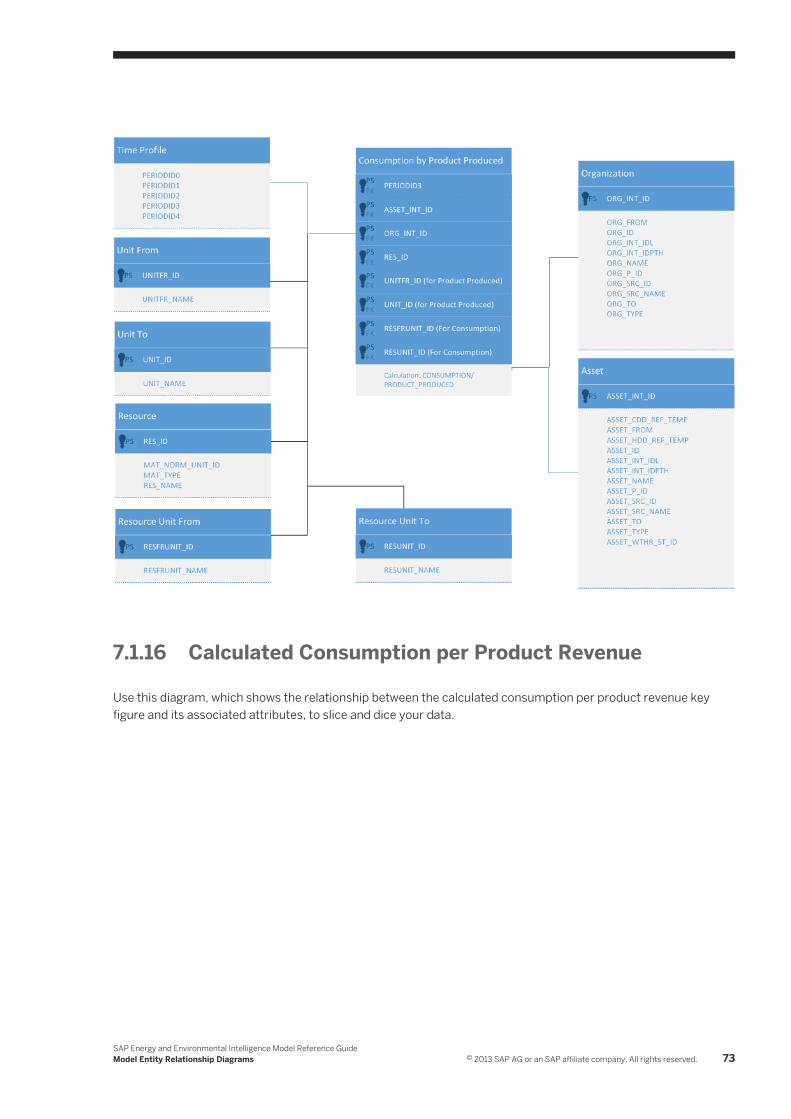
7.1.16 Calculated Consumption per Product Revenue
Use this diagram, which shows the relationship between the calculated consumption per product revenue key figure and its associated attributes, to slice and dice your data.
SAP Energy and Environmental Intelligence Model Reference GuideModel Entity Relationship Diagrams © 2013 SAP AG or an SAP affiliate company. All rights reserved. 73
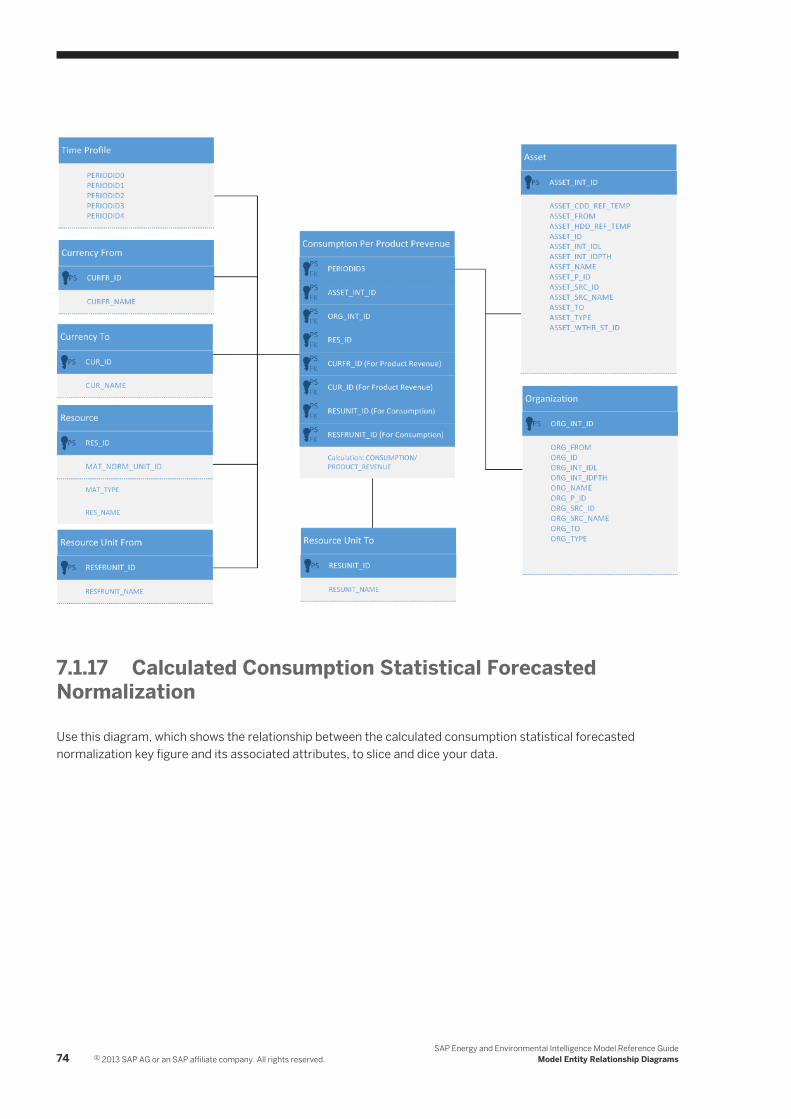
7.1.17 Calculated Consumption Statistical Forecasted Normalization
Use this diagram, which shows the relationship between the calculated consumption statistical forecasted normalization key figure and its associated attributes, to slice and dice your data.
74 © 2013 SAP AG or an SAP affiliate company. All rights reserved.SAP Energy and Environmental Intelligence Model Reference Guide
Model Entity Relationship Diagrams
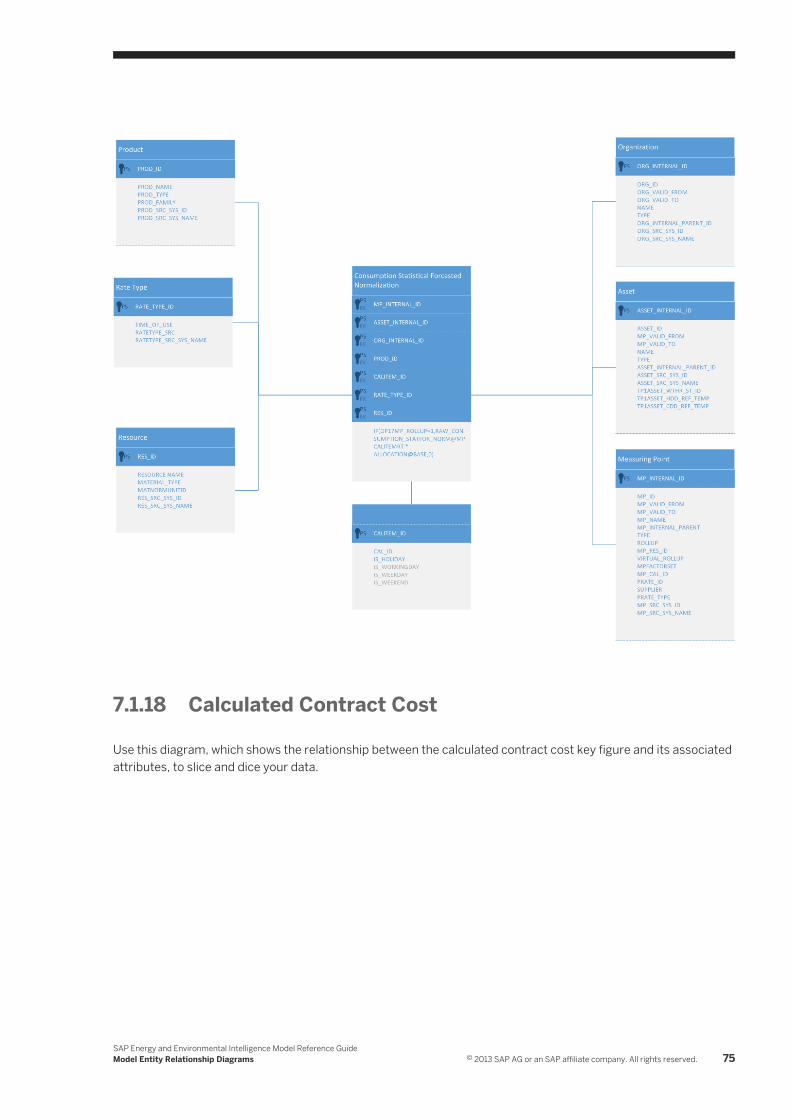
7.1.18 Calculated Contract Cost
Use this diagram, which shows the relationship between the calculated contract cost key figure and its associated attributes, to slice and dice your data.
SAP Energy and Environmental Intelligence Model Reference GuideModel Entity Relationship Diagrams © 2013 SAP AG or an SAP affiliate company. All rights reserved. 75
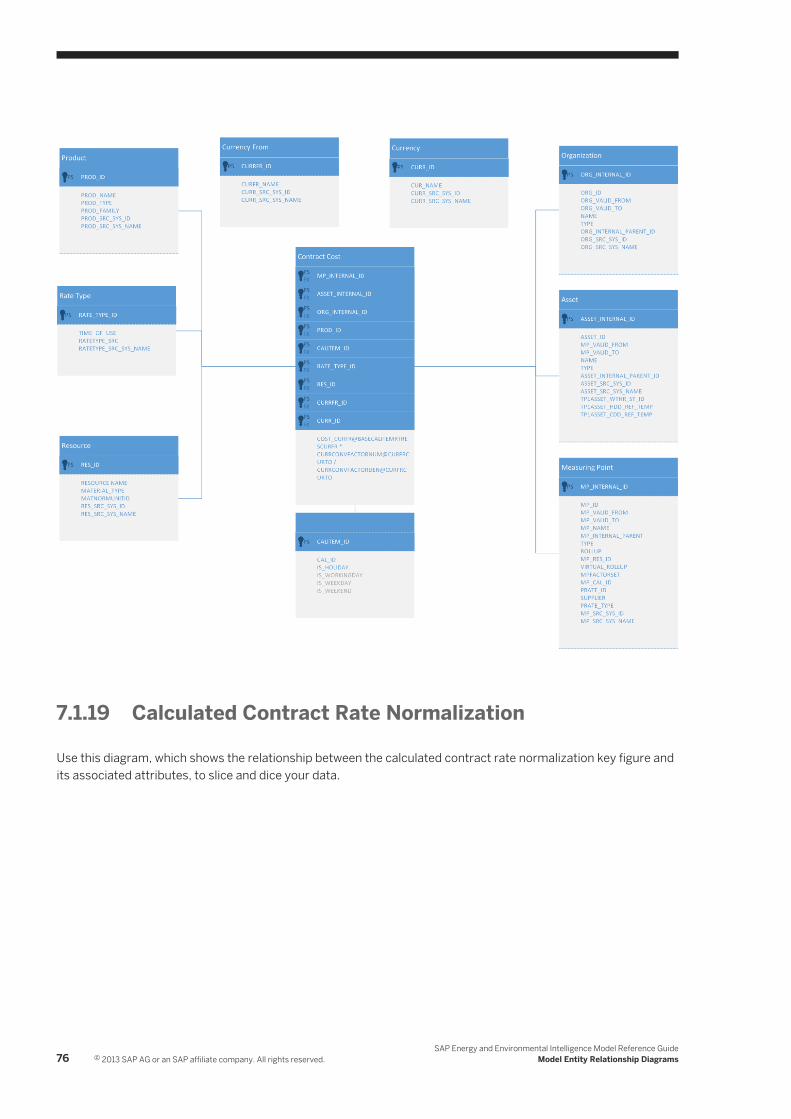
7.1.19 Calculated Contract Rate Normalization
Use this diagram, which shows the relationship between the calculated contract rate normalization key figure and its associated attributes, to slice and dice your data.
76 © 2013 SAP AG or an SAP affiliate company. All rights reserved.SAP Energy and Environmental Intelligence Model Reference Guide
Model Entity Relationship Diagrams
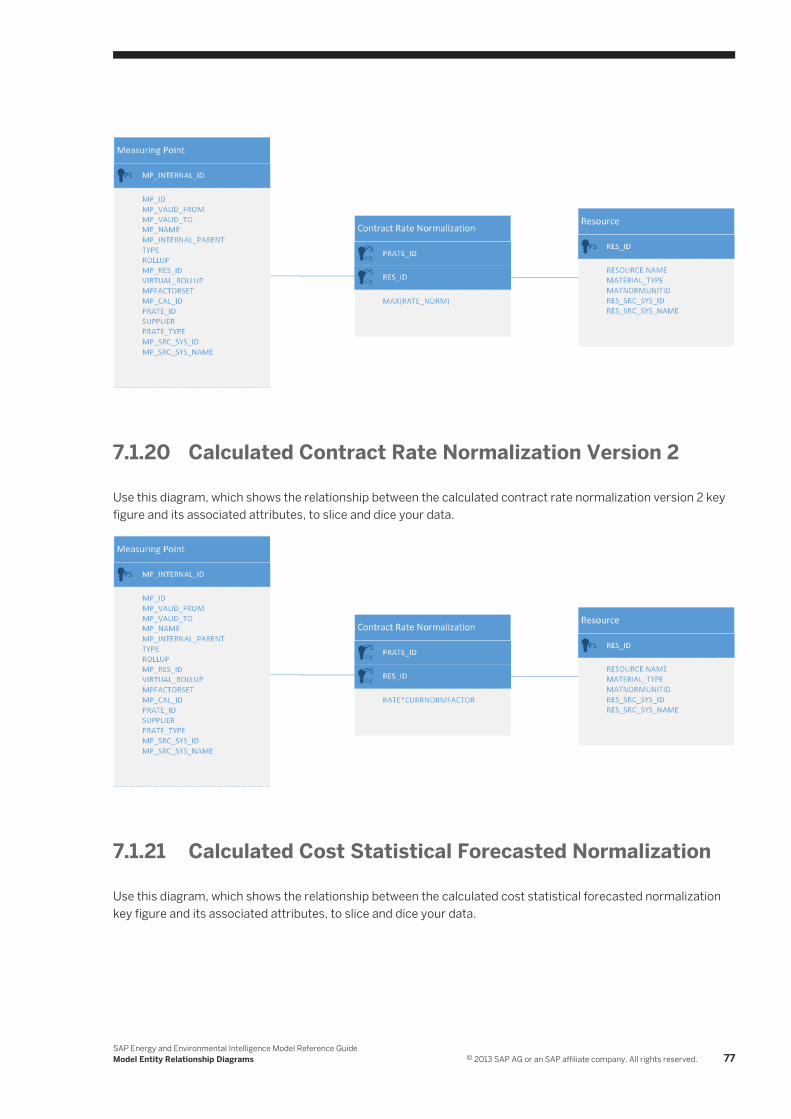
7.1.20 Calculated Contract Rate Normalization Version 2
Use this diagram, which shows the relationship between the calculated contract rate normalization version 2 key figure and its associated attributes, to slice and dice your data.
7.1.21 Calculated Cost Statistical Forecasted Normalization
Use this diagram, which shows the relationship between the calculated cost statistical forecasted normalization key figure and its associated attributes, to slice and dice your data.
SAP Energy and Environmental Intelligence Model Reference GuideModel Entity Relationship Diagrams © 2013 SAP AG or an SAP affiliate company. All rights reserved. 77

7.1.22 Calculated Currency Conversion Factor
Use this diagram, which shows the relationship between the calculated currency conversion factor key figure and its associated attributes, to slice and dice your data.
78 © 2013 SAP AG or an SAP affiliate company. All rights reserved.SAP Energy and Environmental Intelligence Model Reference Guide
Model Entity Relationship Diagrams
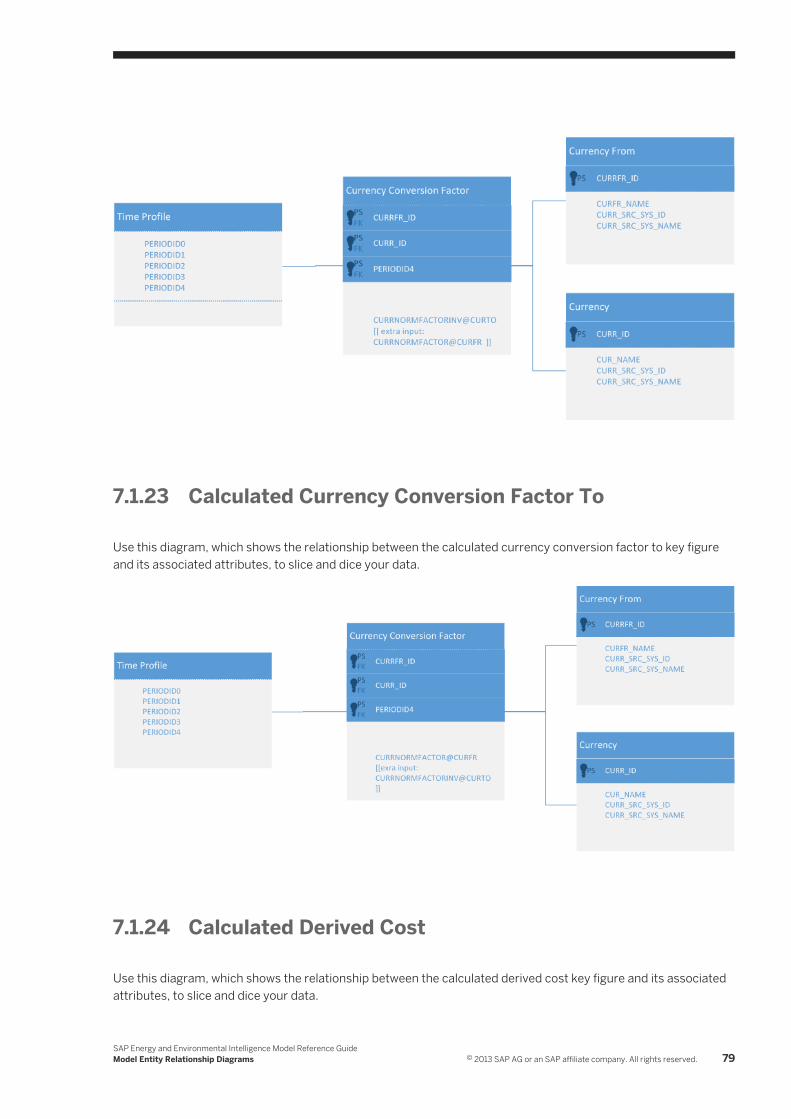
7.1.23 Calculated Currency Conversion Factor To
Use this diagram, which shows the relationship between the calculated currency conversion factor to key figure and its associated attributes, to slice and dice your data.
7.1.24 Calculated Derived Cost
Use this diagram, which shows the relationship between the calculated derived cost key figure and its associated attributes, to slice and dice your data.
SAP Energy and Environmental Intelligence Model Reference GuideModel Entity Relationship Diagrams © 2013 SAP AG or an SAP affiliate company. All rights reserved. 79
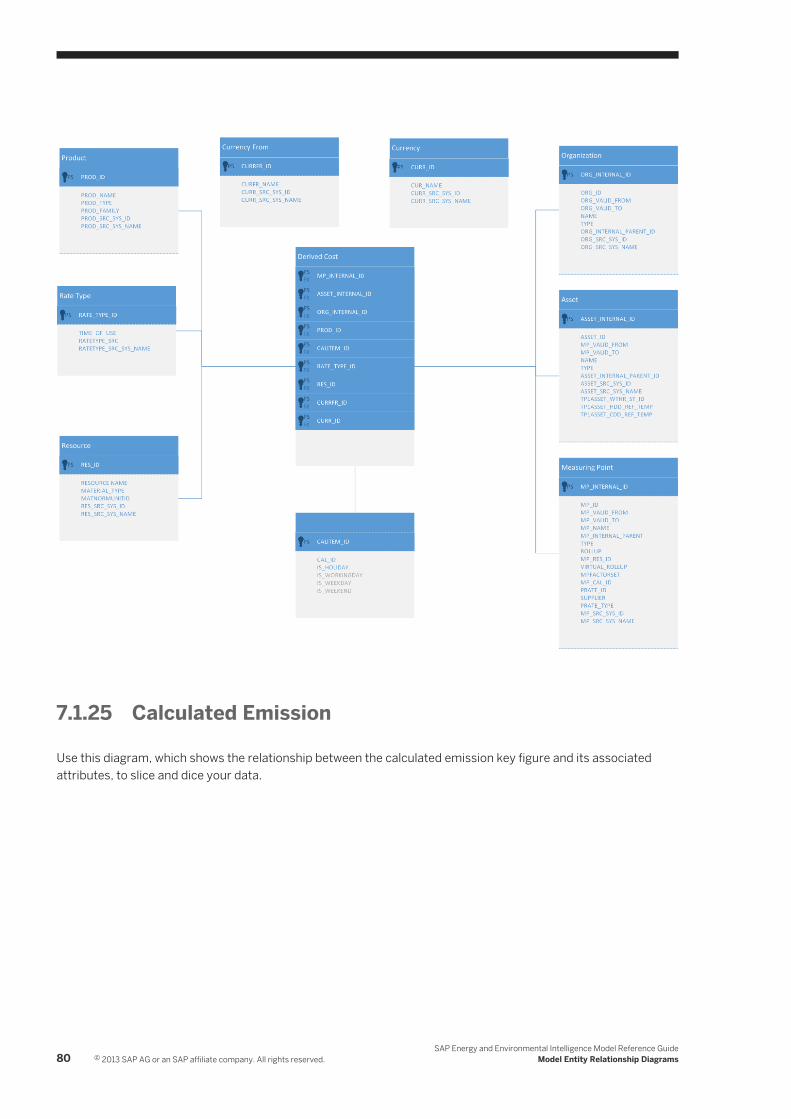
7.1.25 Calculated Emission
Use this diagram, which shows the relationship between the calculated emission key figure and its associated attributes, to slice and dice your data.
80 © 2013 SAP AG or an SAP affiliate company. All rights reserved.SAP Energy and Environmental Intelligence Model Reference Guide
Model Entity Relationship Diagrams

7.1.26 Calculated HDD Sum
Use this diagram, which shows the relationship between the calculated heating degree days (HDD) sum key figure and its associated attributes, to slice and dice your data.
SAP Energy and Environmental Intelligence Model Reference GuideModel Entity Relationship Diagrams © 2013 SAP AG or an SAP affiliate company. All rights reserved. 81

7.1.27 Calculated HHV Equivalent
Use this diagram, which shows the relationship between the calculated high heating value (HHV) equivalent key figure and its associated attributes, to slice and dice your data.
7.1.28 Calculated Normalized Emission
Use this diagram, which shows the relationship between the calculated normalized emission key figure and its associated attributes, to slice and dice your data.
82 © 2013 SAP AG or an SAP affiliate company. All rights reserved.SAP Energy and Environmental Intelligence Model Reference Guide
Model Entity Relationship Diagrams

7.1.29 Calculated on Peak Demand
Use this diagram, which shows the relationship between the calculated on peak demand key figure and its associated attributes, to slice and dice your data.
SAP Energy and Environmental Intelligence Model Reference GuideModel Entity Relationship Diagrams © 2013 SAP AG or an SAP affiliate company. All rights reserved. 83
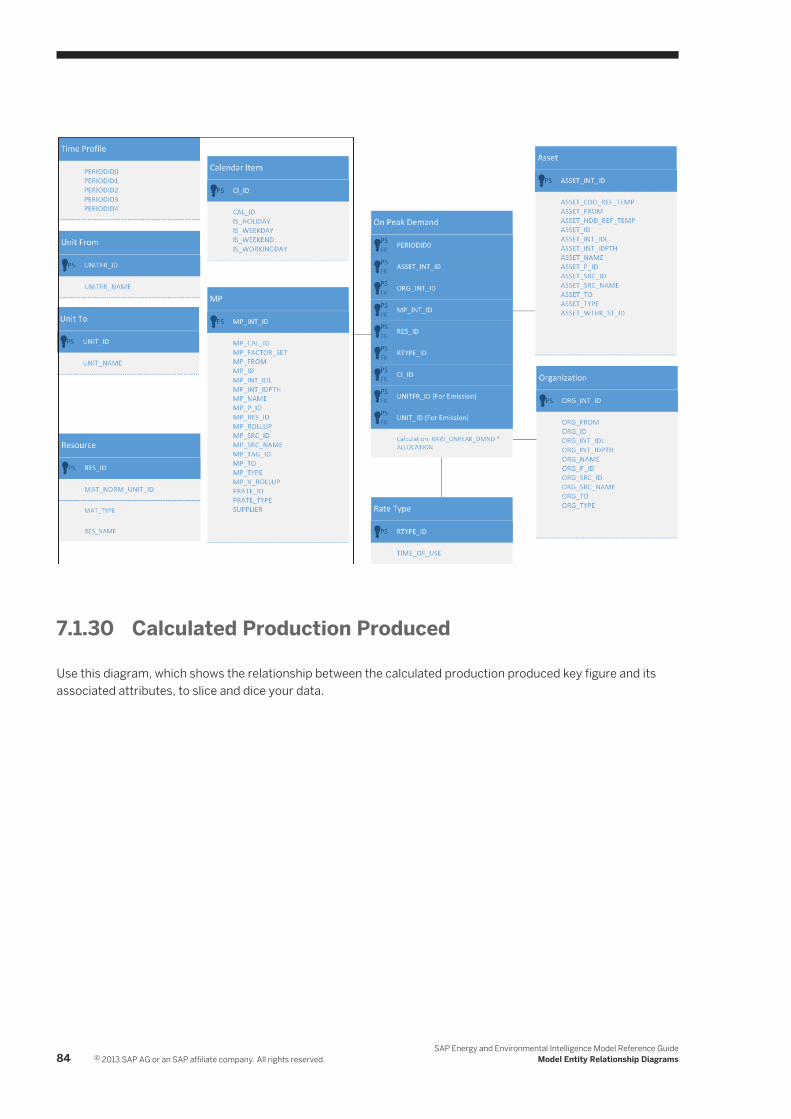
7.1.30 Calculated Production Produced
Use this diagram, which shows the relationship between the calculated production produced key figure and its associated attributes, to slice and dice your data.
84 © 2013 SAP AG or an SAP affiliate company. All rights reserved.SAP Energy and Environmental Intelligence Model Reference Guide
Model Entity Relationship Diagrams
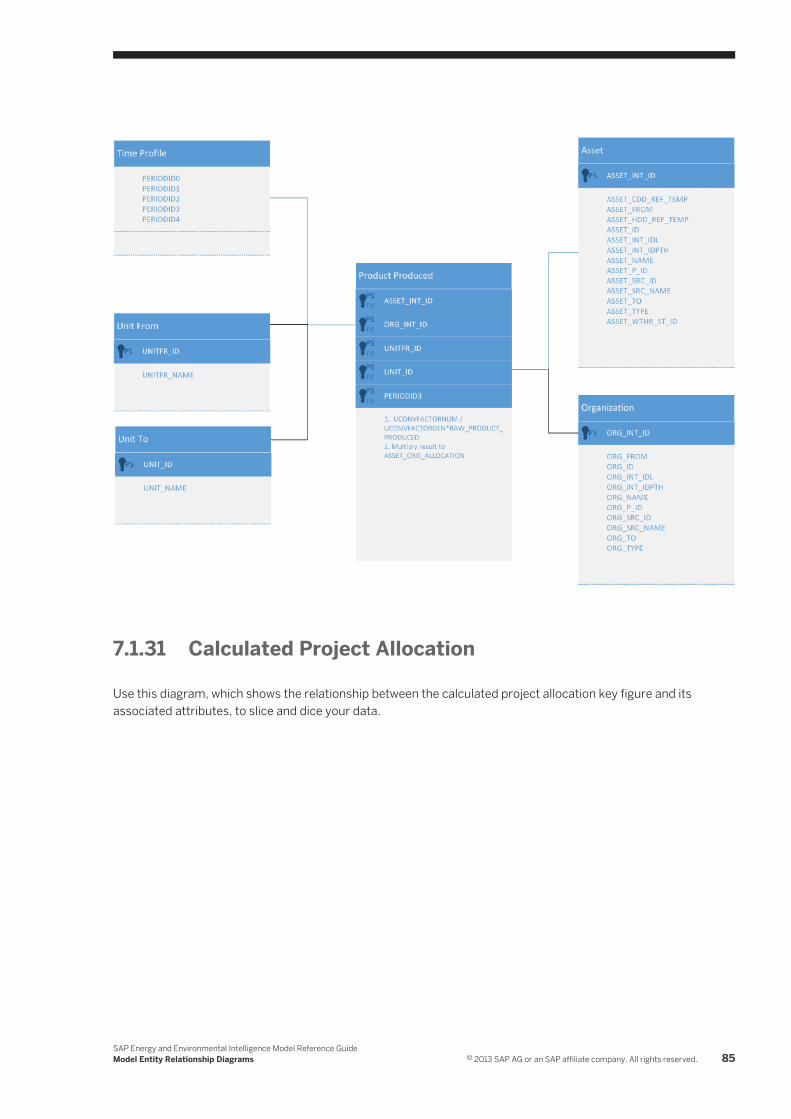
7.1.31 Calculated Project Allocation
Use this diagram, which shows the relationship between the calculated project allocation key figure and its associated attributes, to slice and dice your data.
SAP Energy and Environmental Intelligence Model Reference GuideModel Entity Relationship Diagrams © 2013 SAP AG or an SAP affiliate company. All rights reserved. 85
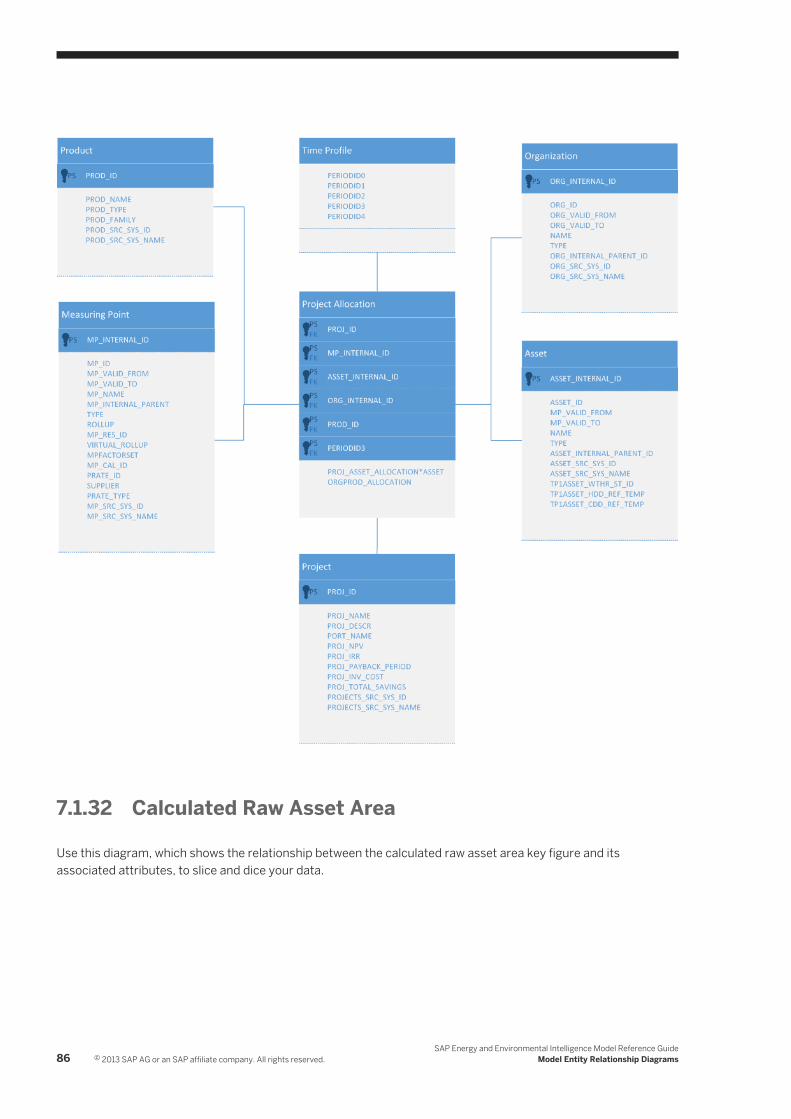
7.1.32 Calculated Raw Asset Area
Use this diagram, which shows the relationship between the calculated raw asset area key figure and its associated attributes, to slice and dice your data.
86 © 2013 SAP AG or an SAP affiliate company. All rights reserved.SAP Energy and Environmental Intelligence Model Reference Guide
Model Entity Relationship Diagrams
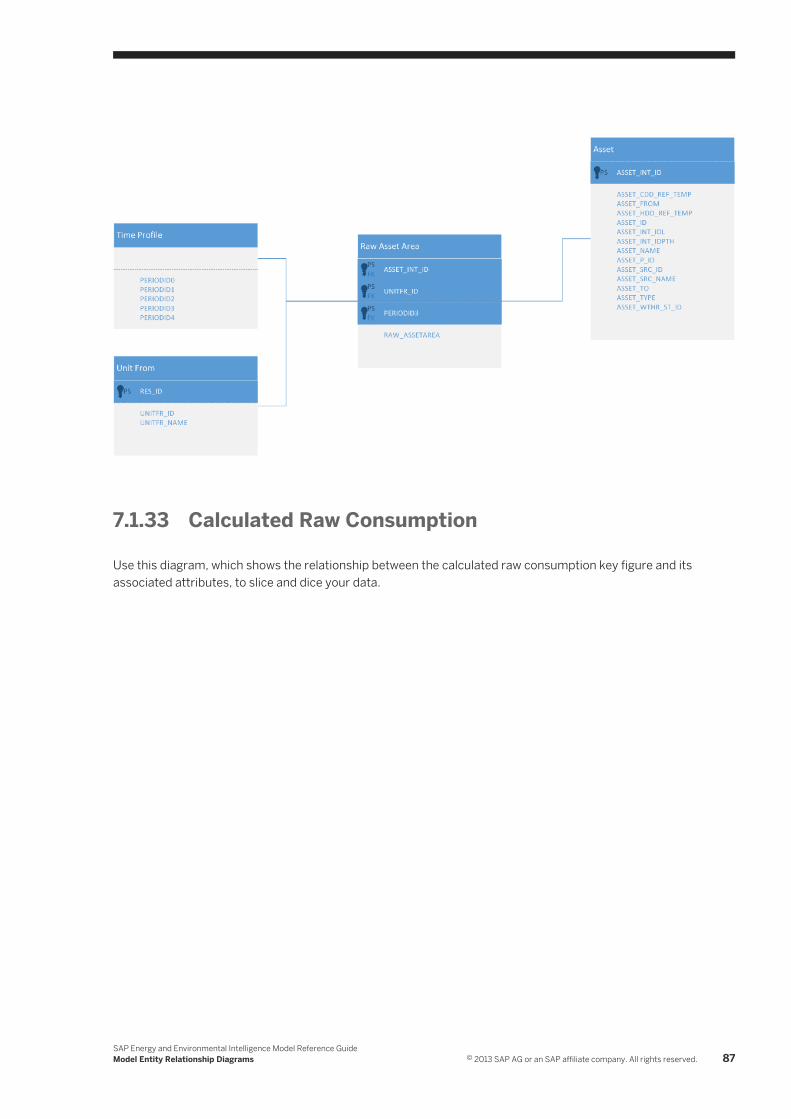
7.1.33 Calculated Raw Consumption
Use this diagram, which shows the relationship between the calculated raw consumption key figure and its associated attributes, to slice and dice your data.
SAP Energy and Environmental Intelligence Model Reference GuideModel Entity Relationship Diagrams © 2013 SAP AG or an SAP affiliate company. All rights reserved. 87
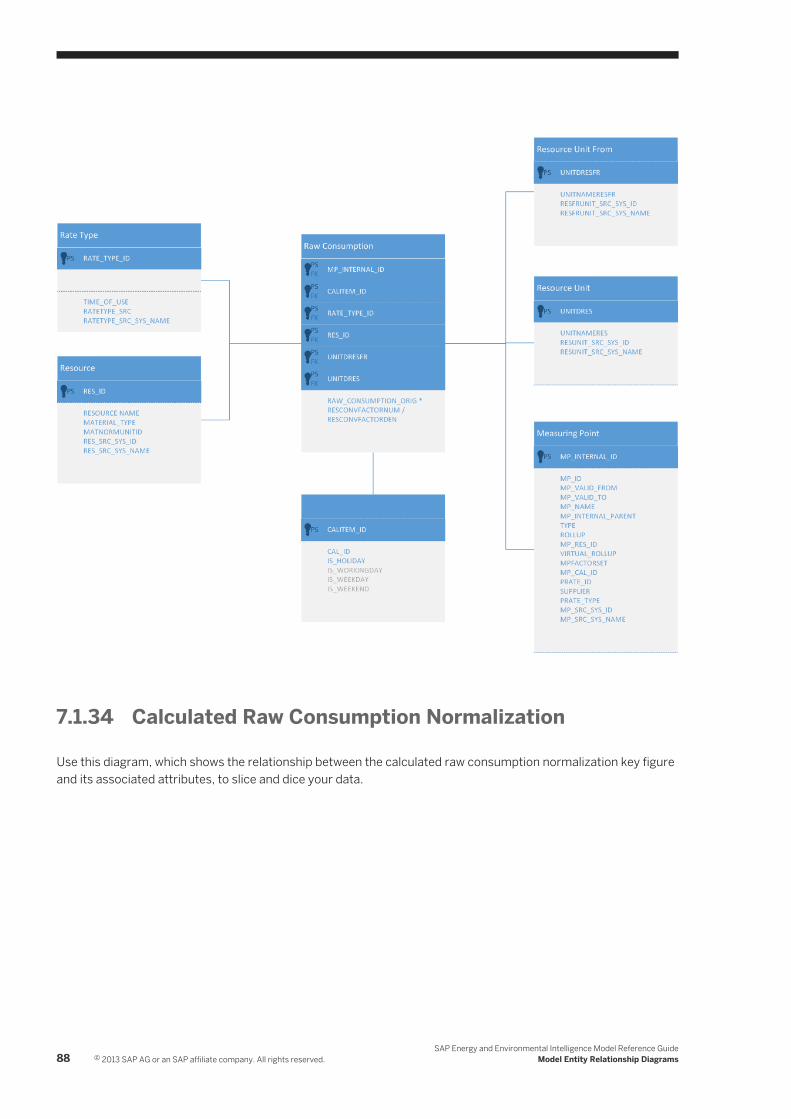
7.1.34 Calculated Raw Consumption Normalization
Use this diagram, which shows the relationship between the calculated raw consumption normalization key figure and its associated attributes, to slice and dice your data.
88 © 2013 SAP AG or an SAP affiliate company. All rights reserved.SAP Energy and Environmental Intelligence Model Reference Guide
Model Entity Relationship Diagrams
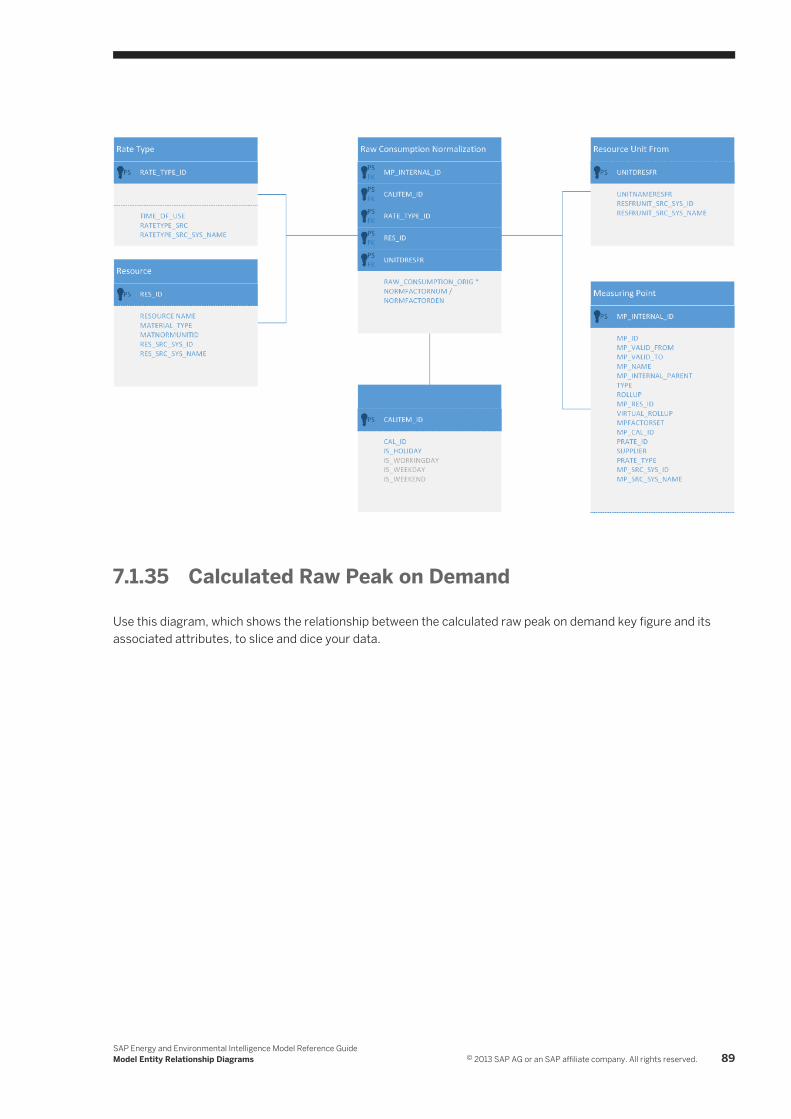
7.1.35 Calculated Raw Peak on Demand
Use this diagram, which shows the relationship between the calculated raw peak on demand key figure and its associated attributes, to slice and dice your data.
SAP Energy and Environmental Intelligence Model Reference GuideModel Entity Relationship Diagrams © 2013 SAP AG or an SAP affiliate company. All rights reserved. 89

7.1.36 Calculated Raw Product ProducedUse this diagram, which shows the relationship between the calculated raw product produced key figure and its associated attributes, to slice and dice your data.
90 © 2013 SAP AG or an SAP affiliate company. All rights reserved.SAP Energy and Environmental Intelligence Model Reference Guide
Model Entity Relationship Diagrams
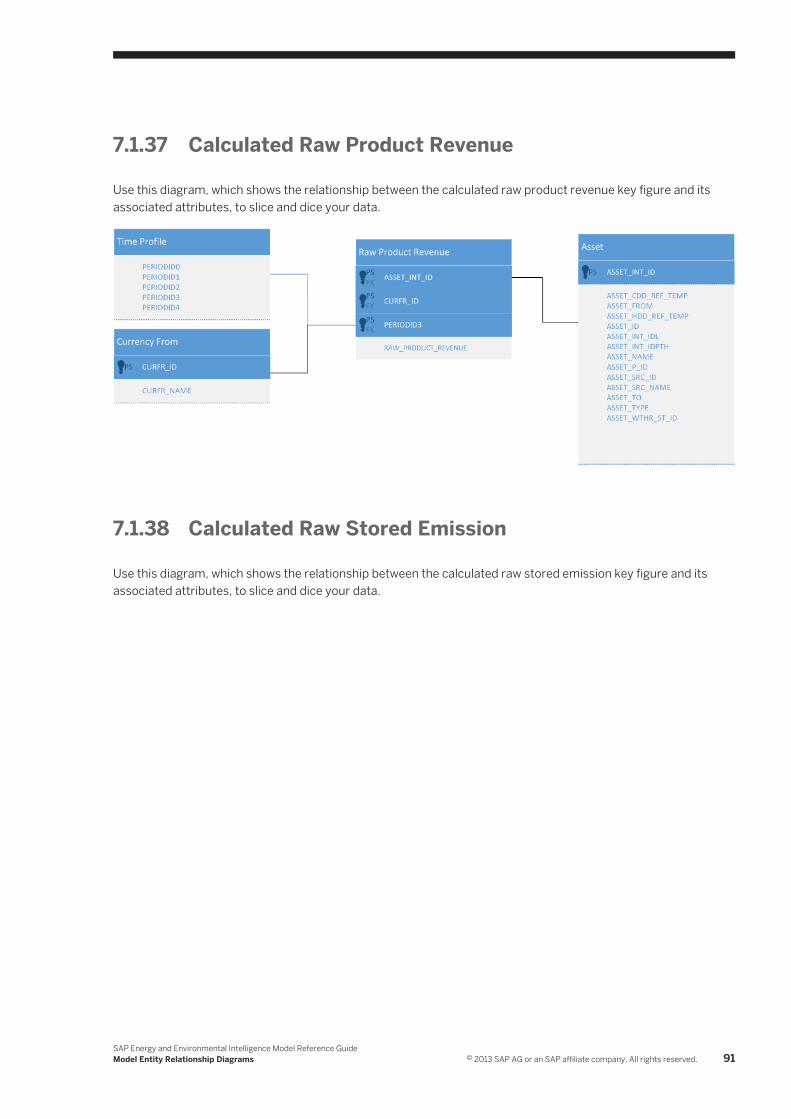
7.1.37 Calculated Raw Product Revenue
Use this diagram, which shows the relationship between the calculated raw product revenue key figure and its associated attributes, to slice and dice your data.
7.1.38 Calculated Raw Stored Emission
Use this diagram, which shows the relationship between the calculated raw stored emission key figure and its associated attributes, to slice and dice your data.
SAP Energy and Environmental Intelligence Model Reference GuideModel Entity Relationship Diagrams © 2013 SAP AG or an SAP affiliate company. All rights reserved. 91

7.1.39 Calculated Resource Conversion Factor
Use this diagram, which shows the relationship between the calculated resource conversion factor key figure and its associated attributes, to slice and dice your data.
92 © 2013 SAP AG or an SAP affiliate company. All rights reserved.SAP Energy and Environmental Intelligence Model Reference Guide
Model Entity Relationship Diagrams
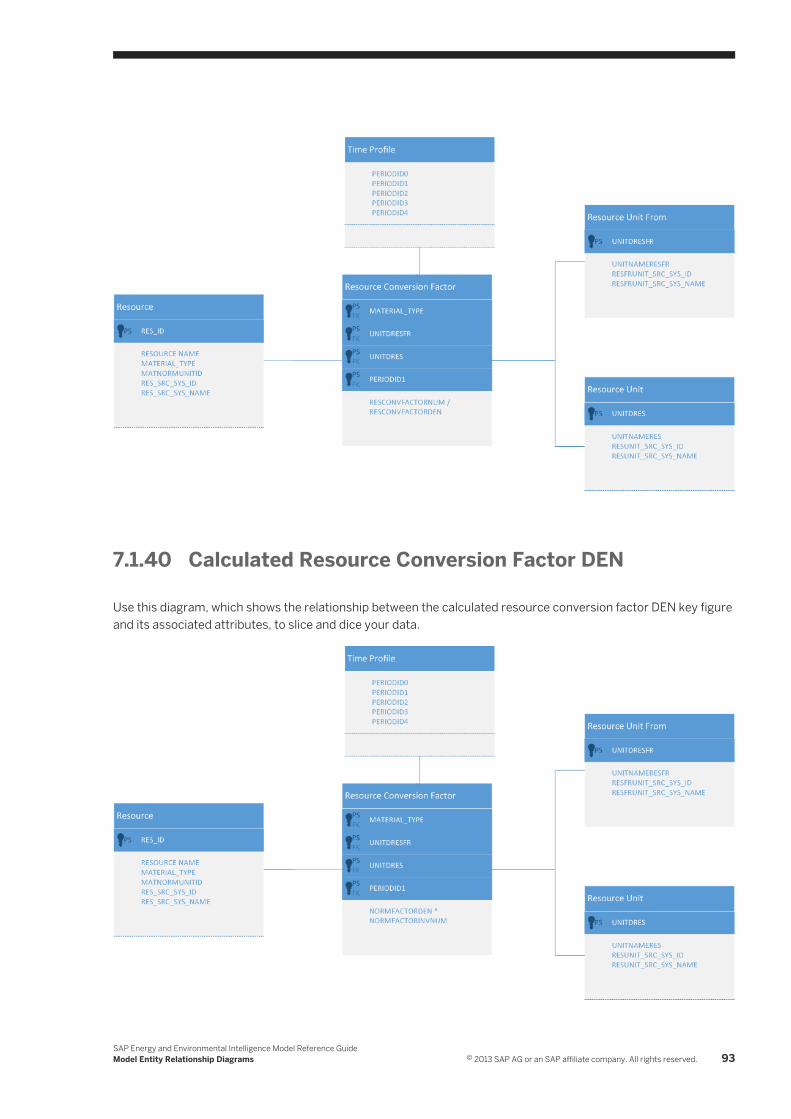
7.1.40 Calculated Resource Conversion Factor DEN
Use this diagram, which shows the relationship between the calculated resource conversion factor DEN key figure and its associated attributes, to slice and dice your data.
SAP Energy and Environmental Intelligence Model Reference GuideModel Entity Relationship Diagrams © 2013 SAP AG or an SAP affiliate company. All rights reserved. 93
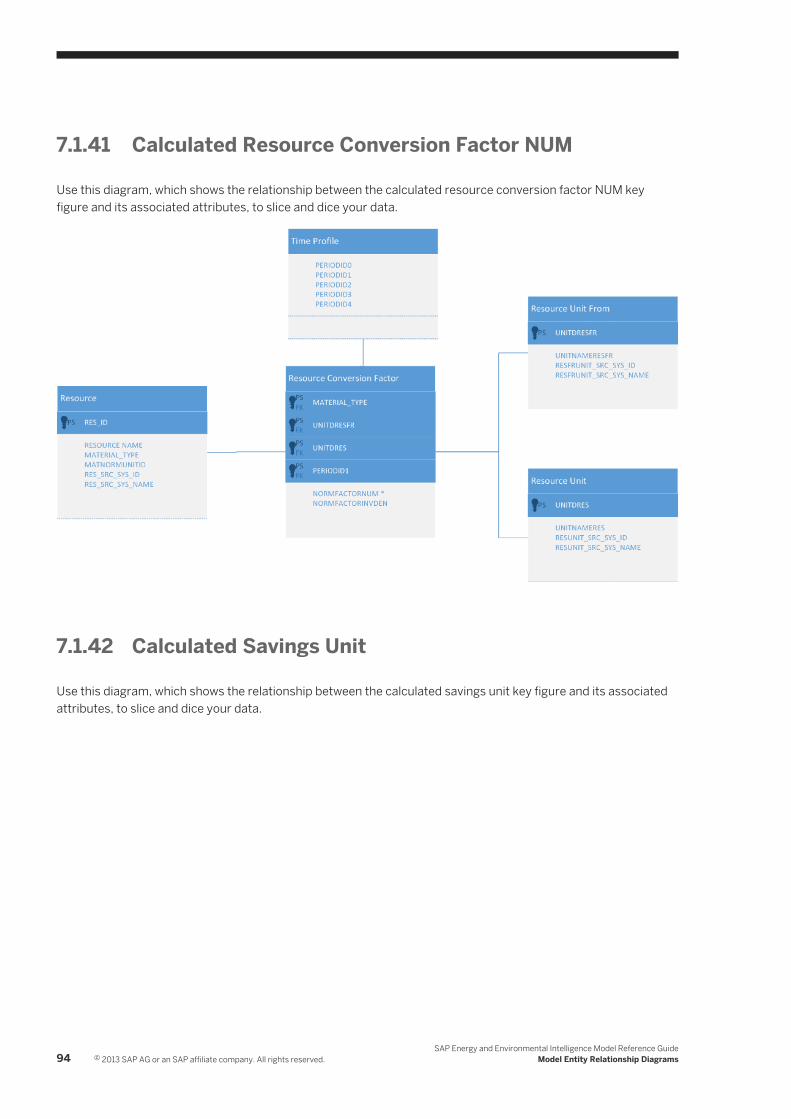
7.1.41 Calculated Resource Conversion Factor NUM
Use this diagram, which shows the relationship between the calculated resource conversion factor NUM key figure and its associated attributes, to slice and dice your data.
7.1.42 Calculated Savings Unit
Use this diagram, which shows the relationship between the calculated savings unit key figure and its associated attributes, to slice and dice your data.
94 © 2013 SAP AG or an SAP affiliate company. All rights reserved.SAP Energy and Environmental Intelligence Model Reference Guide
Model Entity Relationship Diagrams
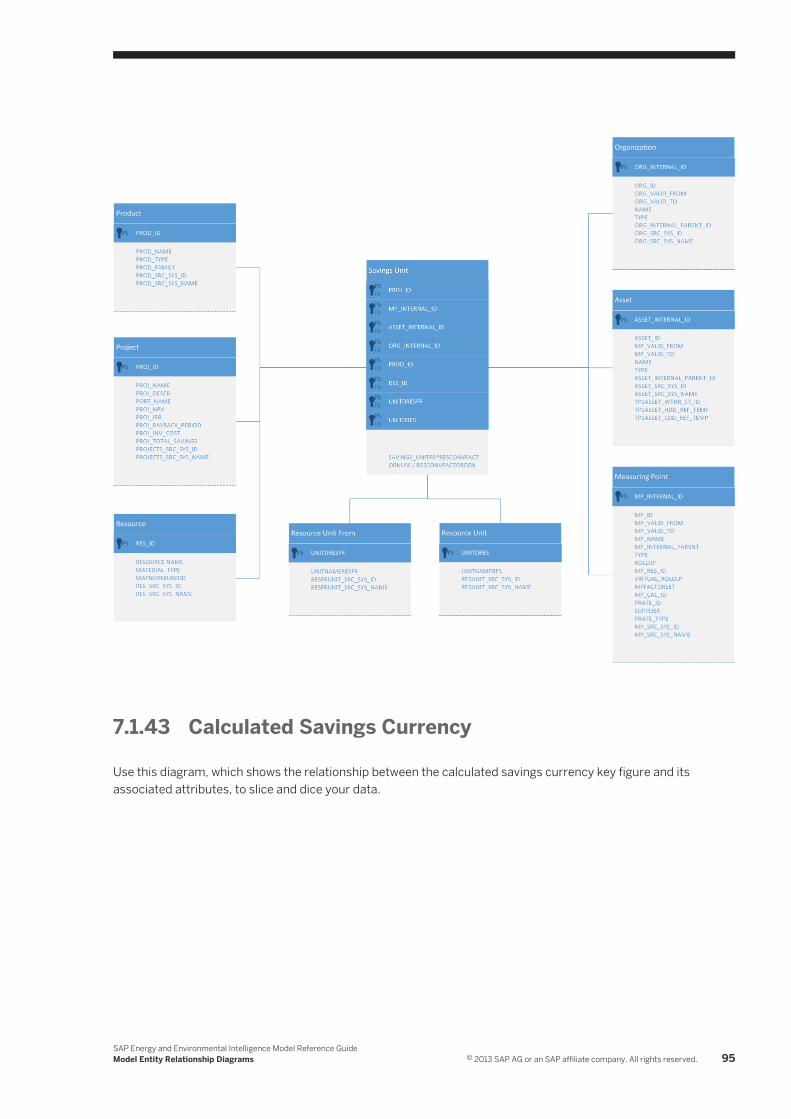
7.1.43 Calculated Savings Currency
Use this diagram, which shows the relationship between the calculated savings currency key figure and its associated attributes, to slice and dice your data.
SAP Energy and Environmental Intelligence Model Reference GuideModel Entity Relationship Diagrams © 2013 SAP AG or an SAP affiliate company. All rights reserved. 95

7.1.44 Calculated Standard Rate Normalization
Use this diagram, which shows the relationship between the calculated standard rate normalization key figure and its associated attributes, to slice and dice your data.
96 © 2013 SAP AG or an SAP affiliate company. All rights reserved.SAP Energy and Environmental Intelligence Model Reference Guide
Model Entity Relationship Diagrams

7.1.45 Calculated Stored Emission
Use this diagram, which shows the relationship between the calculated stored emission key figure and its associated attributes, to slice and dice your data.
SAP Energy and Environmental Intelligence Model Reference GuideModel Entity Relationship Diagrams © 2013 SAP AG or an SAP affiliate company. All rights reserved. 97
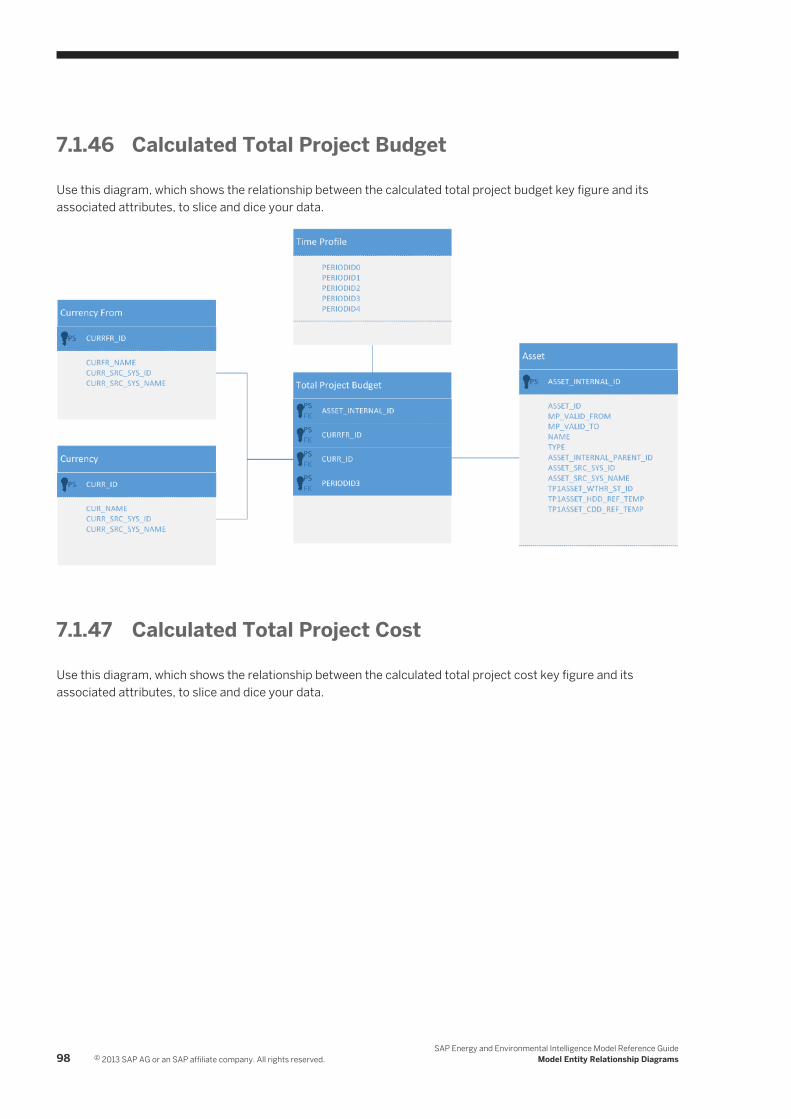
7.1.46 Calculated Total Project Budget
Use this diagram, which shows the relationship between the calculated total project budget key figure and its associated attributes, to slice and dice your data.
7.1.47 Calculated Total Project Cost
Use this diagram, which shows the relationship between the calculated total project cost key figure and its associated attributes, to slice and dice your data.
98 © 2013 SAP AG or an SAP affiliate company. All rights reserved.SAP Energy and Environmental Intelligence Model Reference Guide
Model Entity Relationship Diagrams
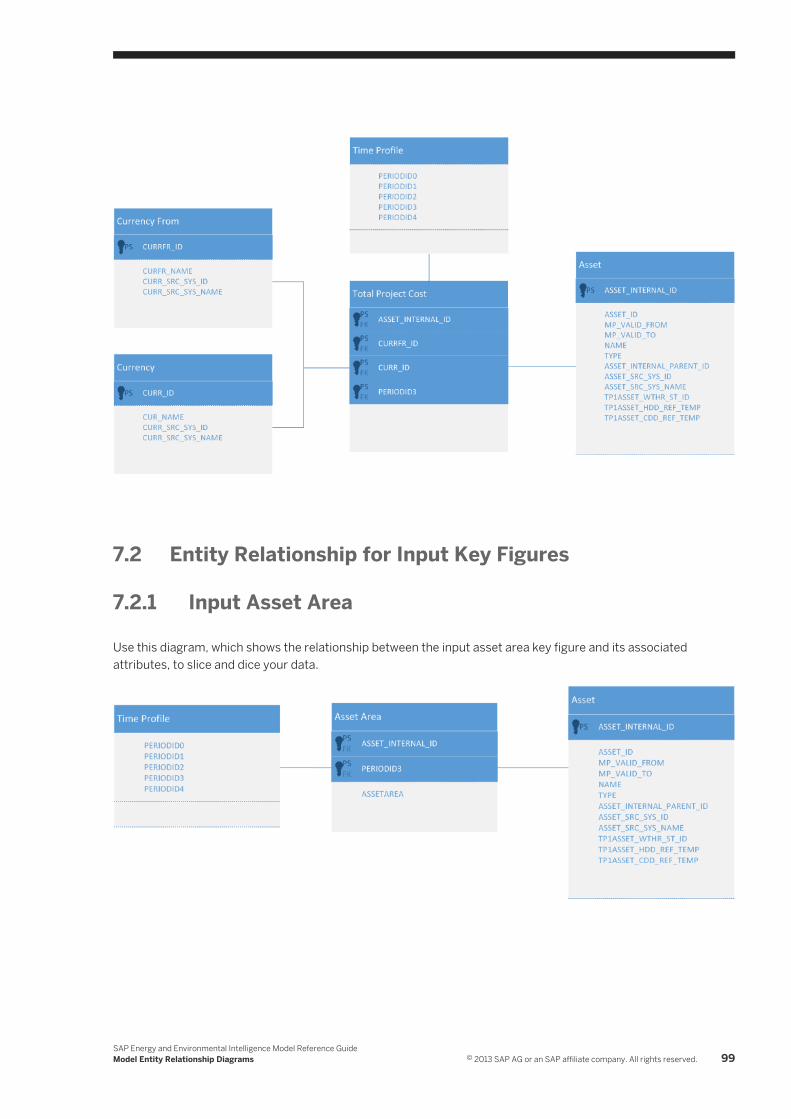
7.2 Entity Relationship for Input Key Figures
7.2.1 Input Asset Area
Use this diagram, which shows the relationship between the input asset area key figure and its associated attributes, to slice and dice your data.
SAP Energy and Environmental Intelligence Model Reference GuideModel Entity Relationship Diagrams © 2013 SAP AG or an SAP affiliate company. All rights reserved. 99
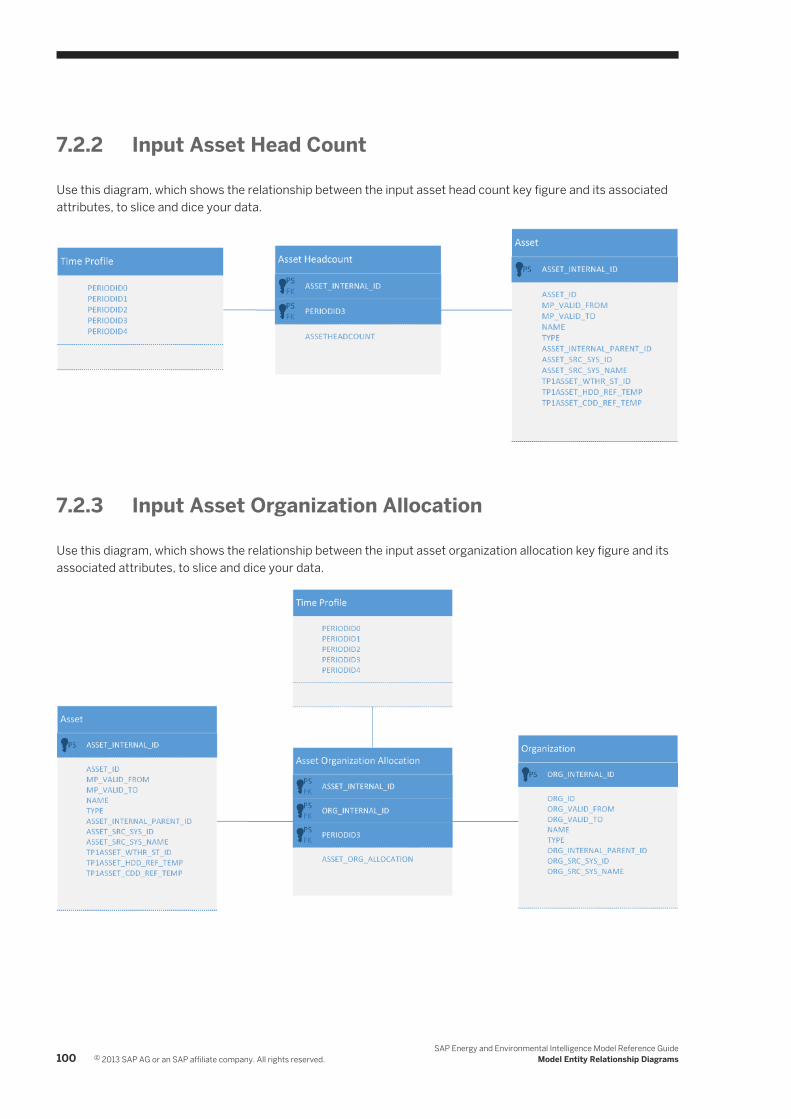
7.2.2 Input Asset Head Count
Use this diagram, which shows the relationship between the input asset head count key figure and its associated attributes, to slice and dice your data.
7.2.3 Input Asset Organization Allocation
Use this diagram, which shows the relationship between the input asset organization allocation key figure and its associated attributes, to slice and dice your data.
100 © 2013 SAP AG or an SAP affiliate company. All rights reserved.SAP Energy and Environmental Intelligence Model Reference Guide
Model Entity Relationship Diagrams
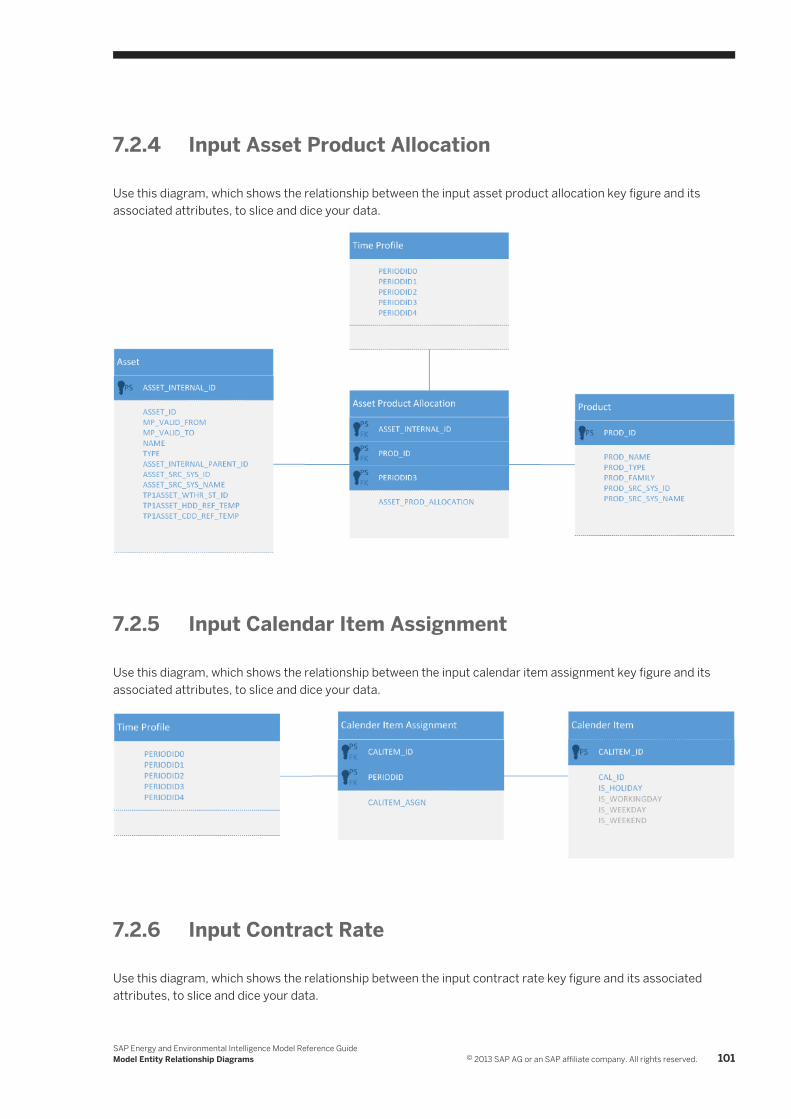
7.2.4 Input Asset Product Allocation
Use this diagram, which shows the relationship between the input asset product allocation key figure and its associated attributes, to slice and dice your data.
7.2.5 Input Calendar Item Assignment
Use this diagram, which shows the relationship between the input calendar item assignment key figure and its associated attributes, to slice and dice your data.
7.2.6 Input Contract Rate
Use this diagram, which shows the relationship between the input contract rate key figure and its associated attributes, to slice and dice your data.
SAP Energy and Environmental Intelligence Model Reference GuideModel Entity Relationship Diagrams © 2013 SAP AG or an SAP affiliate company. All rights reserved. 101
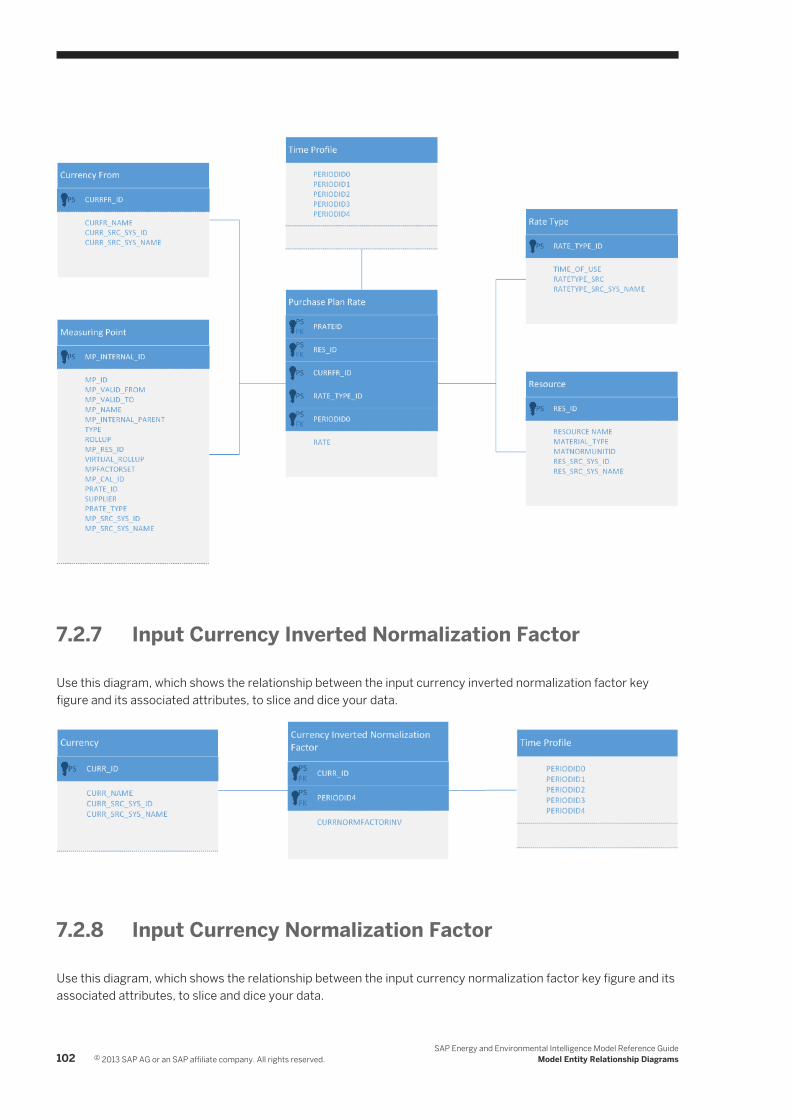
7.2.7 Input Currency Inverted Normalization Factor
Use this diagram, which shows the relationship between the input currency inverted normalization factor key figure and its associated attributes, to slice and dice your data.
7.2.8 Input Currency Normalization Factor
Use this diagram, which shows the relationship between the input currency normalization factor key figure and its associated attributes, to slice and dice your data.
102 © 2013 SAP AG or an SAP affiliate company. All rights reserved.SAP Energy and Environmental Intelligence Model Reference Guide
Model Entity Relationship Diagrams

7.2.9 Input Measuring Point Asset Allocation
Use this diagram, which shows the relationship between the input measuring point asset allocation key figure and its associated attributes, to slice and dice your data.
7.2.10 Input Measuring Point HHV Factor
Use this diagram, which shows the relationship between the input measuring point high heating value (HHV) key figure and its associated attributes, to slice and dice your data.
SAP Energy and Environmental Intelligence Model Reference GuideModel Entity Relationship Diagrams © 2013 SAP AG or an SAP affiliate company. All rights reserved. 103
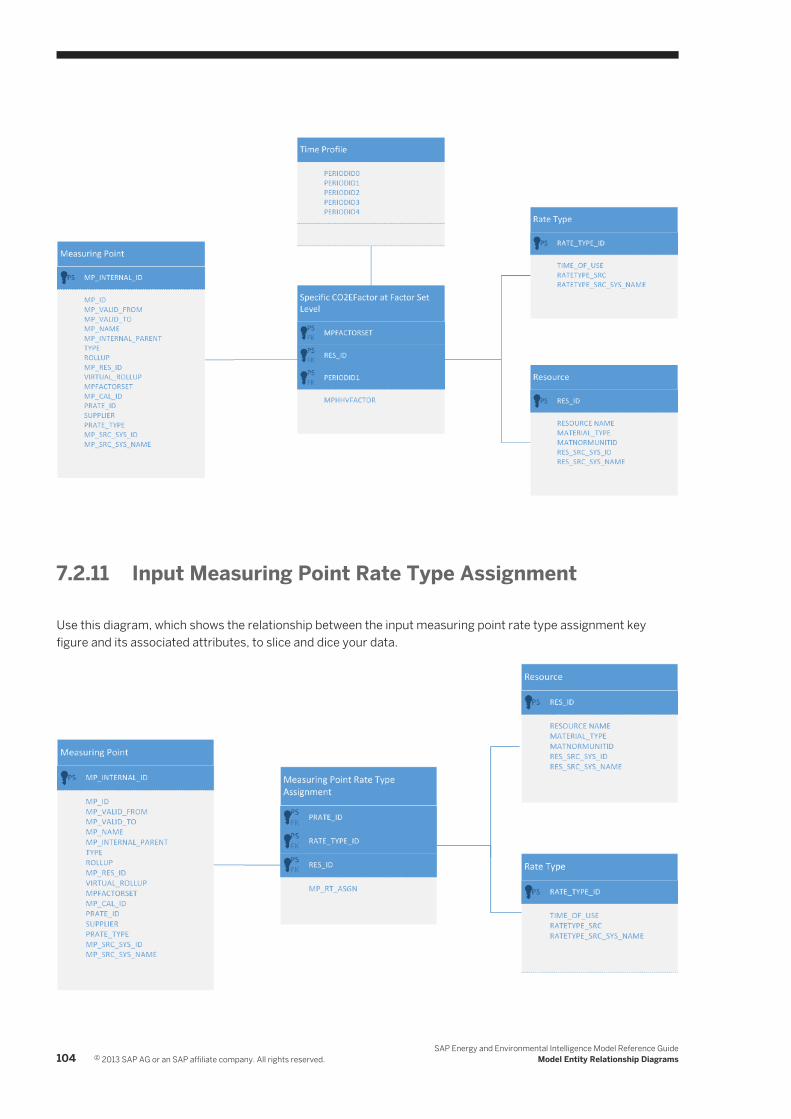
7.2.11 Input Measuring Point Rate Type Assignment
Use this diagram, which shows the relationship between the input measuring point rate type assignment key figure and its associated attributes, to slice and dice your data.
104 © 2013 SAP AG or an SAP affiliate company. All rights reserved.SAP Energy and Environmental Intelligence Model Reference Guide
Model Entity Relationship Diagrams

7.2.12 Input Measuring Point CO2EFactor
Use this diagram, which shows the relationship between the input measuring point CO2 E factor key figure and its associated attributes, to slice and dice your data.
7.2.13 Input Normalization Factor DEN
Use this diagram, which shows the relationship between the input normalization factor DEN key figure and its associated attributes, to slice and dice your data.
SAP Energy and Environmental Intelligence Model Reference GuideModel Entity Relationship Diagrams © 2013 SAP AG or an SAP affiliate company. All rights reserved. 105
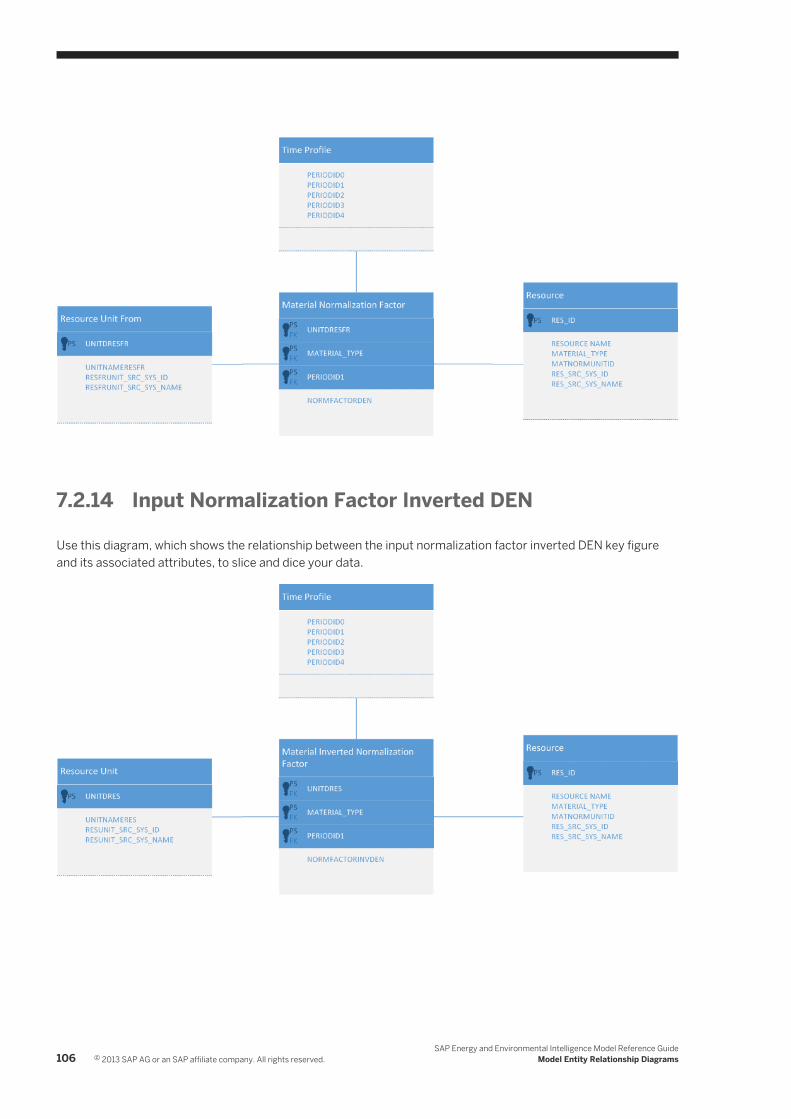
7.2.14 Input Normalization Factor Inverted DEN
Use this diagram, which shows the relationship between the input normalization factor inverted DEN key figure and its associated attributes, to slice and dice your data.
106 © 2013 SAP AG or an SAP affiliate company. All rights reserved.SAP Energy and Environmental Intelligence Model Reference Guide
Model Entity Relationship Diagrams
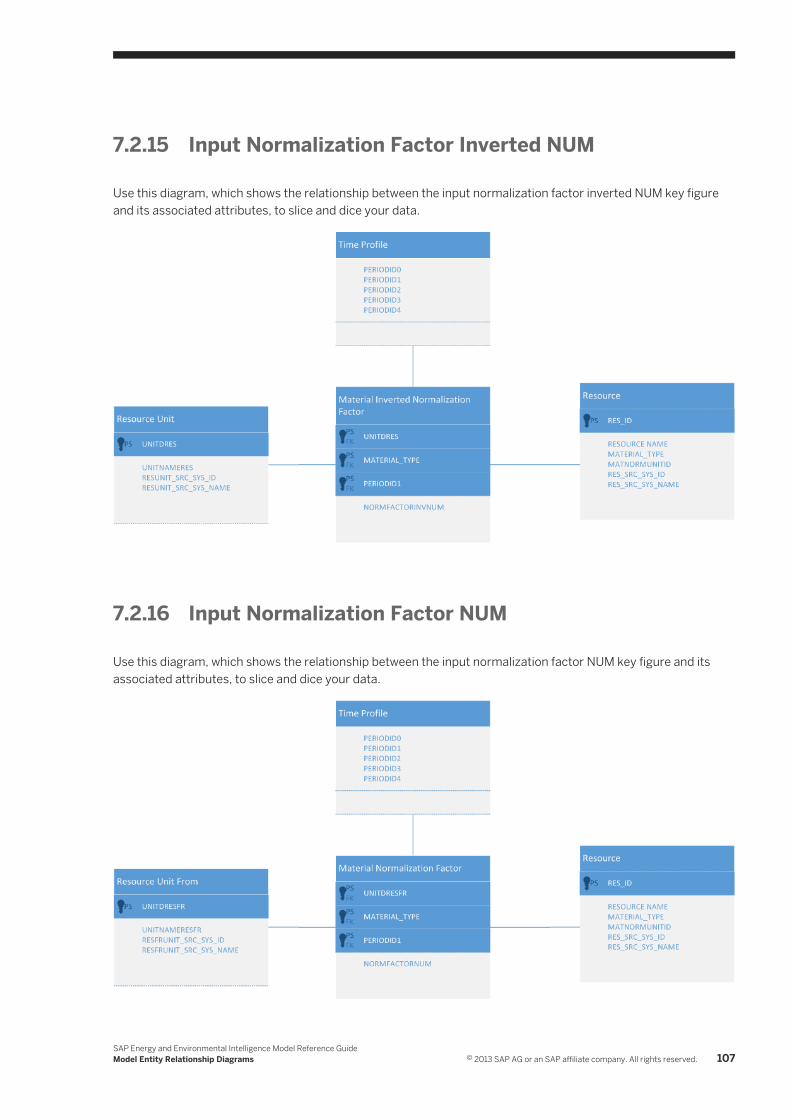
7.2.15 Input Normalization Factor Inverted NUM
Use this diagram, which shows the relationship between the input normalization factor inverted NUM key figure and its associated attributes, to slice and dice your data.
7.2.16 Input Normalization Factor NUM
Use this diagram, which shows the relationship between the input normalization factor NUM key figure and its associated attributes, to slice and dice your data.
SAP Energy and Environmental Intelligence Model Reference GuideModel Entity Relationship Diagrams © 2013 SAP AG or an SAP affiliate company. All rights reserved. 107
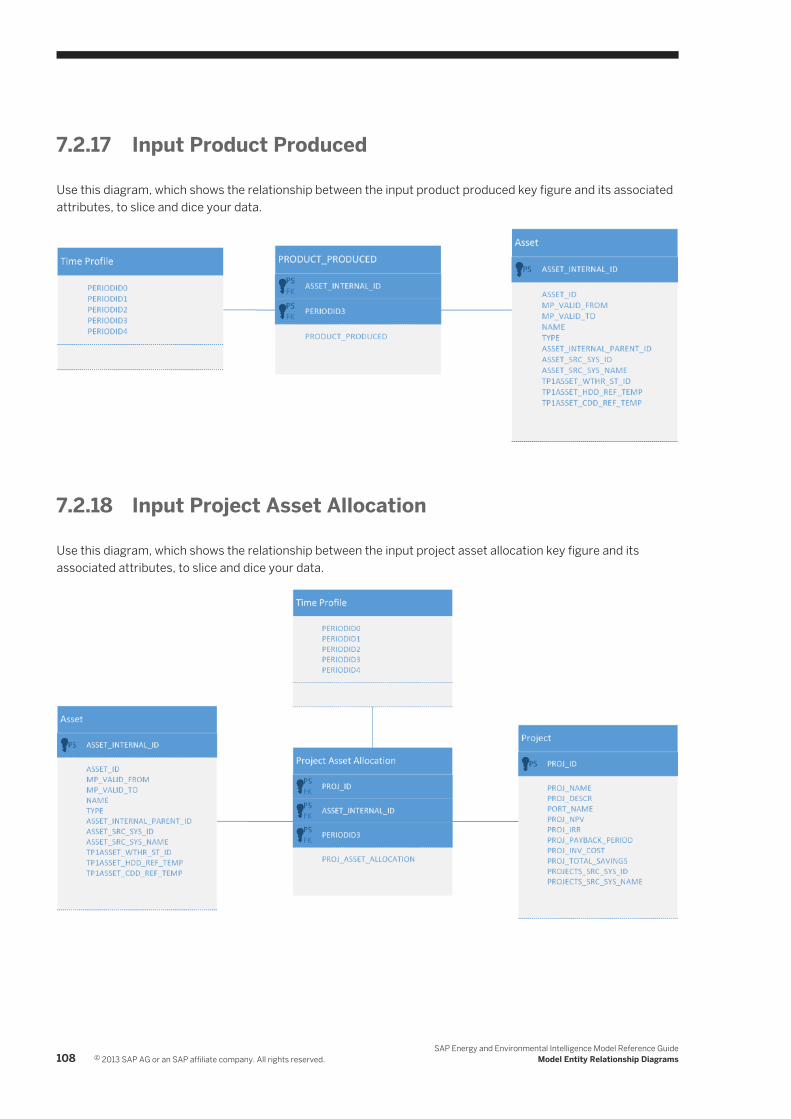
7.2.17 Input Product Produced
Use this diagram, which shows the relationship between the input product produced key figure and its associated attributes, to slice and dice your data.
7.2.18 Input Project Asset Allocation
Use this diagram, which shows the relationship between the input project asset allocation key figure and its associated attributes, to slice and dice your data.
108 © 2013 SAP AG or an SAP affiliate company. All rights reserved.SAP Energy and Environmental Intelligence Model Reference Guide
Model Entity Relationship Diagrams
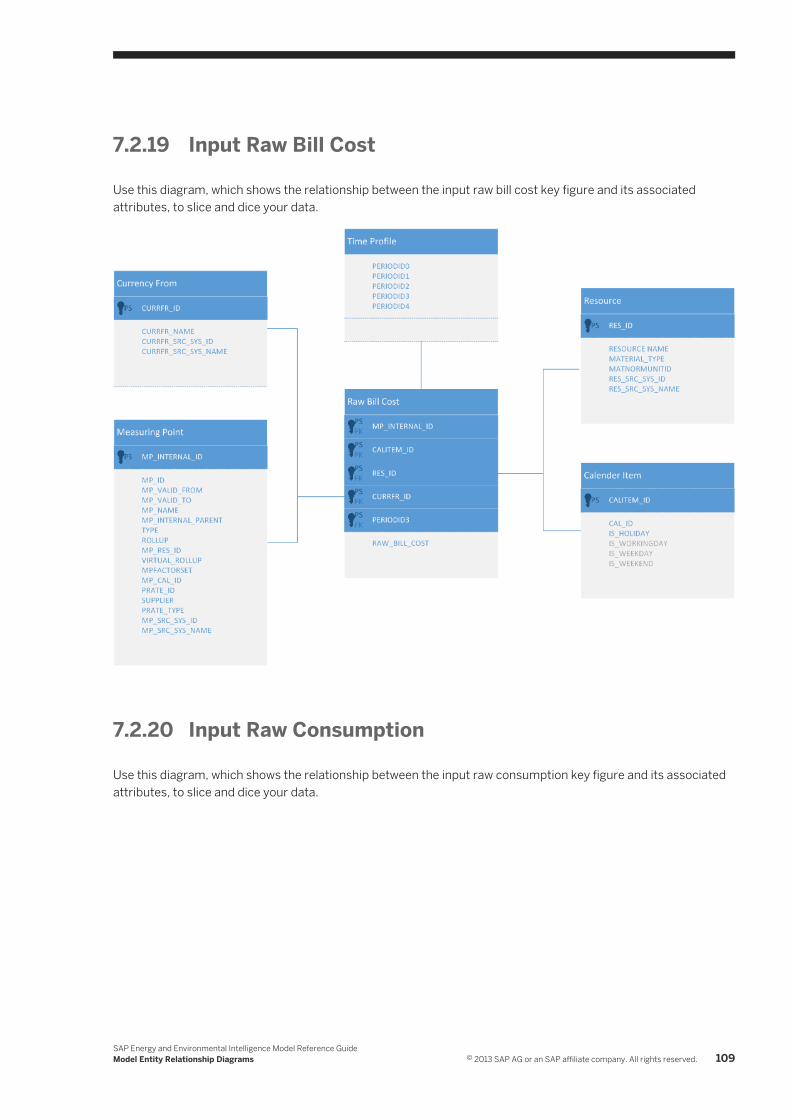
7.2.19 Input Raw Bill Cost
Use this diagram, which shows the relationship between the input raw bill cost key figure and its associated attributes, to slice and dice your data.
7.2.20 Input Raw Consumption
Use this diagram, which shows the relationship between the input raw consumption key figure and its associated attributes, to slice and dice your data.
SAP Energy and Environmental Intelligence Model Reference GuideModel Entity Relationship Diagrams © 2013 SAP AG or an SAP affiliate company. All rights reserved. 109
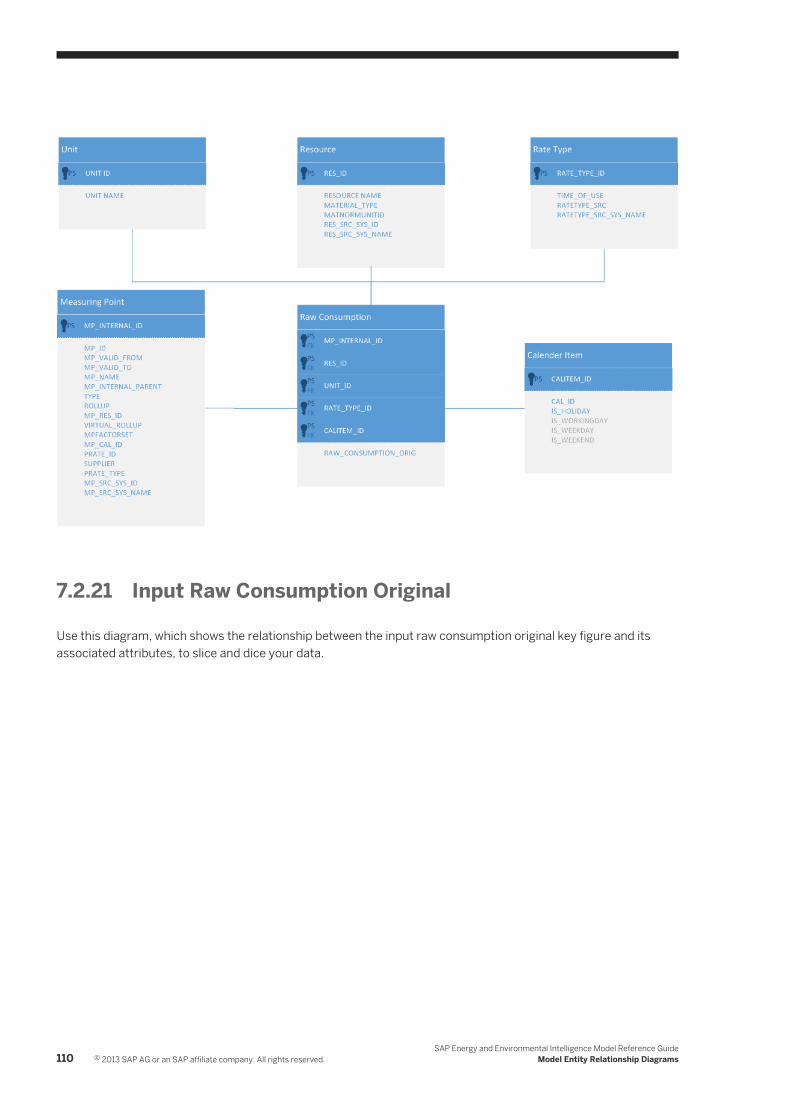
7.2.21 Input Raw Consumption Original
Use this diagram, which shows the relationship between the input raw consumption original key figure and its associated attributes, to slice and dice your data.
110 © 2013 SAP AG or an SAP affiliate company. All rights reserved.SAP Energy and Environmental Intelligence Model Reference Guide
Model Entity Relationship Diagrams

7.2.22 Input Raw Consumption Statistical Forecast Normalization
Use this diagram, which shows the relationship between the input raw consumption statistical forecast normalization key figure and its associated attributes, to slice and dice your data.
SAP Energy and Environmental Intelligence Model Reference GuideModel Entity Relationship Diagrams © 2013 SAP AG or an SAP affiliate company. All rights reserved. 111
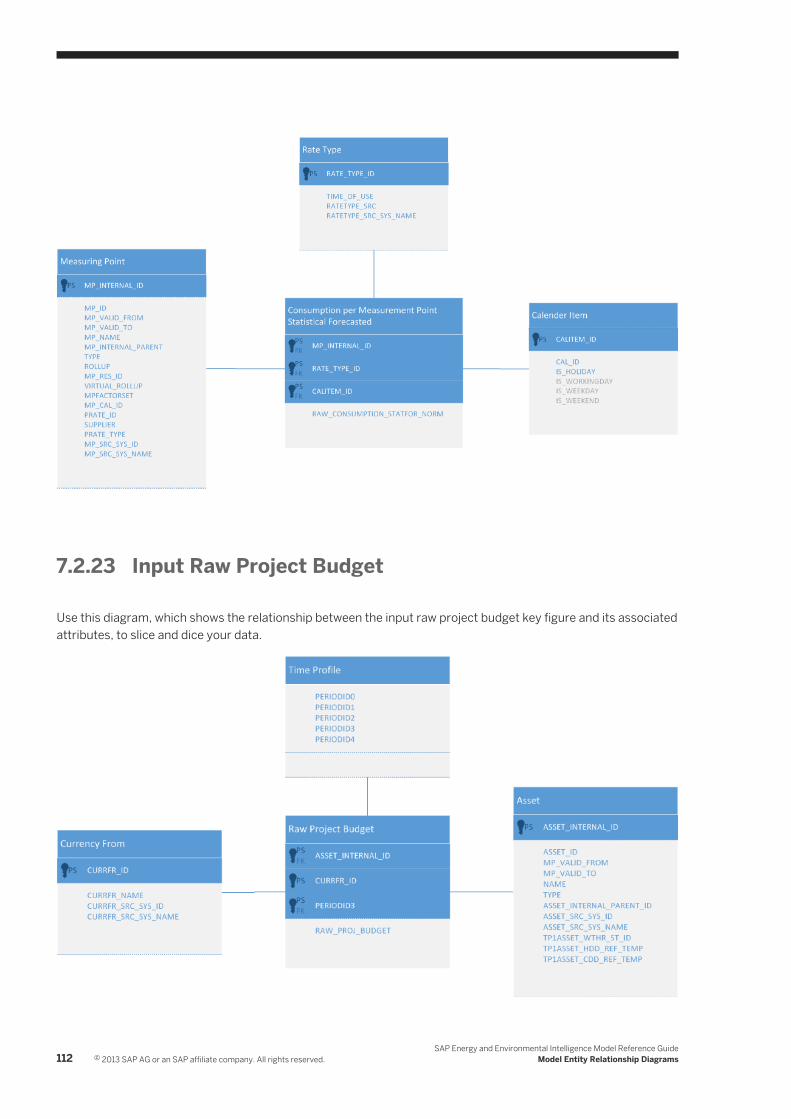
7.2.23 Input Raw Project Budget
Use this diagram, which shows the relationship between the input raw project budget key figure and its associated attributes, to slice and dice your data.
112 © 2013 SAP AG or an SAP affiliate company. All rights reserved.SAP Energy and Environmental Intelligence Model Reference Guide
Model Entity Relationship Diagrams

7.2.24 Input Raw Savings Currency
Use this diagram, which shows the relationship between the input raw savings currency key figure and its associated attributes, to slice and dice your data.
7.2.25 Input Raw Savings Unit
Use this diagram, which shows the relationship between the input raw savings unit key figure and its associated attributes, to slice and dice your data.
SAP Energy and Environmental Intelligence Model Reference GuideModel Entity Relationship Diagrams © 2013 SAP AG or an SAP affiliate company. All rights reserved. 113
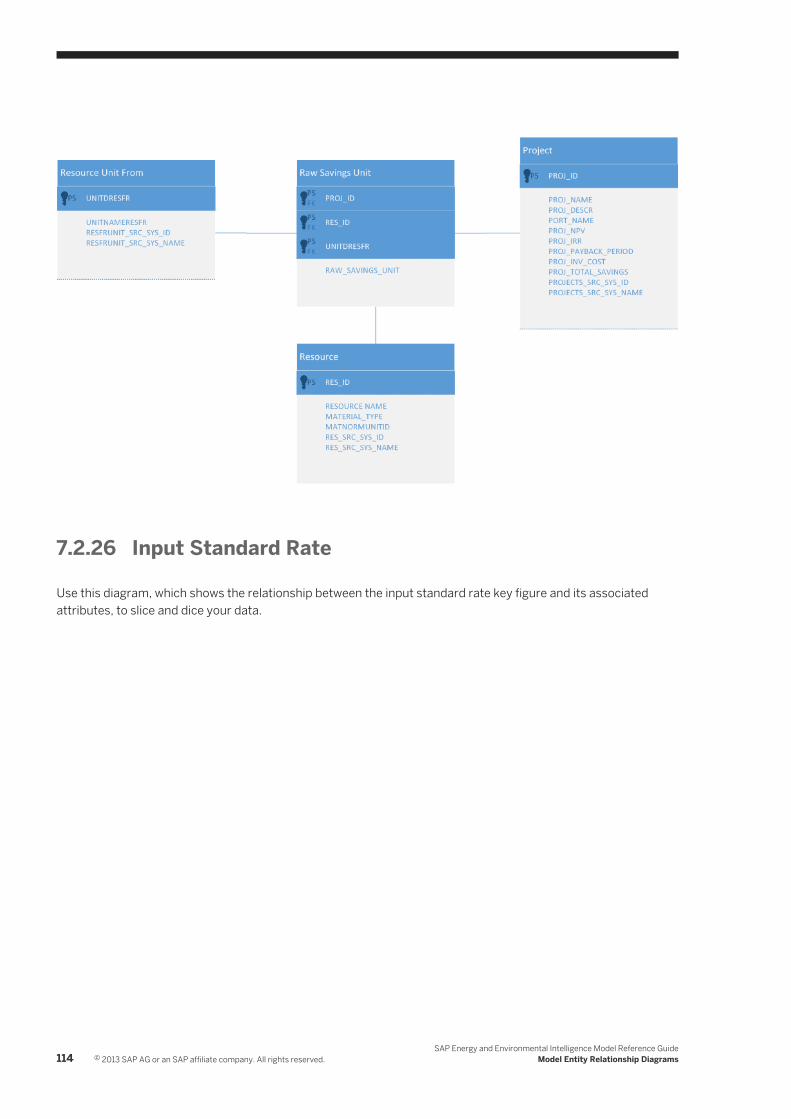
7.2.26 Input Standard Rate
Use this diagram, which shows the relationship between the input standard rate key figure and its associated attributes, to slice and dice your data.
114 © 2013 SAP AG or an SAP affiliate company. All rights reserved.SAP Energy and Environmental Intelligence Model Reference Guide
Model Entity Relationship Diagrams

7.2.27 Input Temperature
Use this diagram, which shows the relationship between the input temperature key figure and its associated attributes, to slice and dice your data.
SAP Energy and Environmental Intelligence Model Reference GuideModel Entity Relationship Diagrams © 2013 SAP AG or an SAP affiliate company. All rights reserved. 115

www.sap.com/contactsap
© 2013 SAP AG or an SAP affiliate company. All rights reserved.No part of this publication may be reproduced or transmitted in any form or for any purpose without the express permission of SAP AG. The information contained herein may be changed without prior notice.Some software products marketed by SAP AG and its distributors contain proprietary software components of other software vendors. National product specifications may vary.These materials are provided by SAP AG and its affiliated companies ("SAP Group") for informational purposes only, without representation or warranty of any kind, and SAP Group shall not be liable for errors or omissions with respect to the materials. The only warranties for SAP Group products and services are those that are set forth in the express warranty statements accompanying such products and services, if any. Nothing herein should be construed as constituting an additional warranty.SAP and other SAP products and services mentioned herein as well as their respective logos are trademarks or registered trademarks of SAP AG in Germany and other countries.Please see http://www.sap.com/corporate-en/legal/copyright/index.epx for additional trademark information and notices.