são paulo, 22 de julho de 2015 a comentário de desempenho ... release 2t15.pdf · comentário de...
TRANSCRIPT

Comentário de Desempenho 2T15
0
São Paulo, 22 de julho de 2015 – A
Natura Cosméticos S.A. (BM&FBOVESPA:
NATU3) anuncia hoje os resultados do
segundo trimestre de 2015 (2T15).
As informações financeiras e operacionais
a seguir, exceto onde indicado o
contrário, são apresentadas em base
consolidada, de acordo com as normas
internacionais de relatório financeiro
IFRS.

Comentário de Desempenho 2T15
1
Introdução
No segundo trimestre de 2015 a receita líquida consolidada da Natura foi de R$ 1.929 milhão
(+7% vs. 2T14), o Ebitda consolidado R$ 357 milhões (+1,4% vs. 2T14), o lucro líquido R$
117 milhões (-33,7% vs. 2T14) e a geração de caixa livre R$ 281 milhões (+91% vs. 2T14). A
retração do lucro liquido explica-se em grande parte pelo efeito contábil do ajuste do saldo
remanescente para aquisição da Aesop, sobre o qual daremos mais detalhes nas próximas
páginas.
No Brasil, diante de um contexto desafiador, nossa receita líquida decresceu 4,6% frente ao
2T14, sendo também impactada pelo aumento da carga tributária. Mesmo com a retração das
vendas, observamos uma leve melhora da frequência de compra das nossas consultoras, fruto
das iniciativas implantadas ao longo dos últimos meses que buscam dar maior robustez ao
modelo comercial e melhorar a produtividade das consultoras, como a nova politica de crédito
individualizado e as ações segmentadas no canal de venda direta.
Em maio, lançamos na linha Natura EKOS um novo ativo da Amazônia pouco conhecido pelo
consumidor: Ucuuba. Sua semente é fonte de uma manteiga leve, com alto poder hidratante e
reparador, proporcionando poderosa hidratação com textura leve, aveludada e de rápida
absorção. Destaque também para o hidratante sem fragrância e sem corantes para todos os
tipos de pele lançado na linha SOU, e na categoria perfumaria para o lançamento do Kaiak
Expedição.
Demos também continuidade à expansão da Rede Natura, que encerrou o trimestre com 48 mil
CNDs1 (32 mil em mar/15 e 15 mil em dez/14). Desde novembro de 2014 somos certificados
como Loja Diamante no E-bit.
Adicionalmente, a partir do ciclo 12 (ago/15) as consultoras no Brasil poderão adquirir um Chip
Natura, terão acesso a um novo aplicativo para fazerem pedidos em celulares e tablets e
poderão contratar um leitor de cartão para receberem pagamentos de cartões de débito e
crédito.
Já nas Operações Internacionais2, que representaram 27% da receita líquida consolidada (18%
no 2T14), mantivemos o ritmo acelerado de crescimento em moeda local, 29,4% na Latam e
47,8% na Aesop.
A Aesop encerrou o trimestre com 112 lojas em 16 países (89 lojas em 11 países no 2T14).
Nesse trimestre abrimos a primeira loja da Aesop no Brasil, na rua Oscar Freire, na cidade de
São Paulo.
1 CND: Consultora Natura Digital 2 Operações Internacionais incluem Natura Latam, Aesop e Natura França.

Comentário de Desempenho 2T15
2
A expansão de 1,4% do Ebitda consolidado no trimestre foi fruto de uma gestão orçamentária
mais rigorosa, da redução da inadimplência e do aumento da margem Ebitda no conjunto de
nossas operações internacionais (9,9% no 2T15 vs. 6,3% no 2T14)3, o que nos permitiu
compensar os efeitos de um contexto mais difícil no Brasil, com aumento de carga tributária,
mercado retraído e desvalorização do Real.
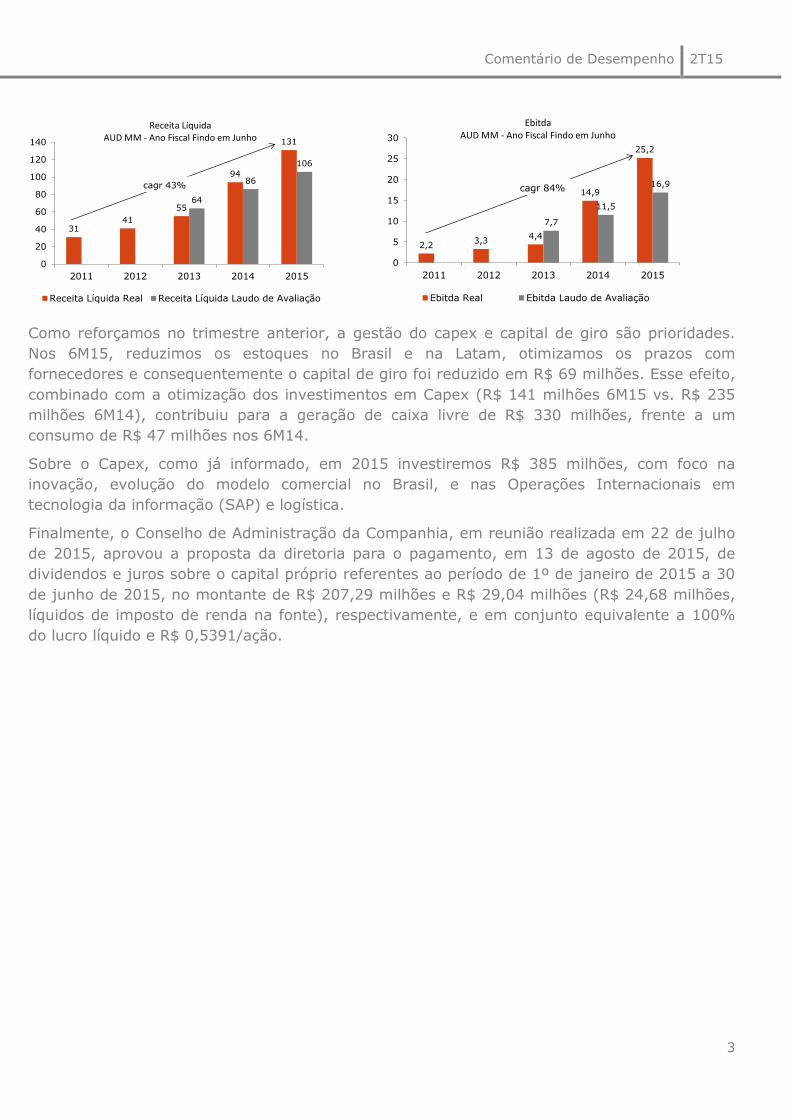
A retração de 33,7% do lucro líquido deu-se principalmente pelo ajuste de R$ 50 milhões na
provisão para aquisição da parcela remanescente de 28,66% da Aesop, cujo fato gerador foi a
performance operacional acima do planejado. Ao excluirmos esse ajuste a retração do lucro
líquido seria de 15,4%4. Conforme o contrato de aquisição da Aesop, o valor do saldo
remanescente é calculado aplicando-se um múltiplo no EBITDA da operação. Como destacado
nos quadros abaixo, o Ebitda e a Receita Líquida da Aesop tem superado as expectativas que
tínhamos à época da aquisição, ao mesmo tempo em que a Operação manteve os
investimentos necessários para a abertura de novas lojas.
3 Essas margens consideram: Argentina, Chile, Peru, Colômbia, México, França, Corporativo Latam e Aesop. 4 Excluindo-se também o efeito não-caixa da marcação a mercado dos derivativos atrelados à dívida em moeda estrangeira a retração do lucro
líquido seria 13,6%.
Valores em R$ milhões 2T15 2T14 1S15 1S14
Receita Bruta Brasil 1.979,2 2.017,4 -1,9 3.682,9 3.752,1 -1,8
Receita Bruta Internacionais 658,1 404,2 62,8 1.160,2 754,7 53,7
Receita Bruta Consolidada 2.637,3 2.421,6 8,9 4.843,2 4.506,8 7,5
Receita Líquida Brasil 1.408,9 1.476,8 -4,6 2.651,7 2.747,3 -3,5
Receita Líquida Internacionais* 520,1 325,8 59,6 918,9 611,5 50,3
Receita Líquida Consolidada 1.928,9 1.802,7 7,0 3.570,7 3.358,9 6,3
% Participação Receita Líquida Internacionais 27,0% 18,1% 8,9 pp 25,7% 18,2% 7,5 pp
EBITDA Brasil pró-forma 305,7 331,9 (7,9) 574,2 601,8 (4,6)
% Margem EBITDA Brasil 21,7% 22,5% (0,8) pp 21,7% 21,9% (0,3) pp
EBITDA Internacionais pró-forma 51,5 20,4 152,3 68,9 34,1 101,9
% Margem EBITDA Internacionais 9,9% 6,3% 3,6 pp 7,5% 5,6% 1,9 pp
EBITDA Consolidado 357,2 352,3 1,4 643,1 635,9 1,1
% Margem EBITDA Consolidada 18,5% 19,5% (1,0) pp 18,0% 18,9% (0,9) pp
Lucro Líquido Consolidado 116,7 175,8 (33,6) 236,3 293,0 (19,3)
% Margem Líquida Consolidada 6,0% 9,8% (3,8) pp 6,6% 8,7% (2,1) pp
Geração Interna de Caixa 215,2 215,6 (0,2) 401,8 391,9 2,5
Geração de Caixa Livre 281,3 147,3 91,0 329,7 (47,6) n/a
Dívida Líquida / EBITDA n/a n/a 1,17 1,15
*Crescimento em Moeda Local ex Aesop: 29,4% em 2T15 vs. 2T14 e 28,2% em 1S15 vs. 1S14
Comentário de Desempenho 2T15
3
Como reforçamos no trimestre anterior, a gestão do capex e capital de giro são prioridades.
Nos 6M15, reduzimos os estoques no Brasil e na Latam, otimizamos os prazos com
fornecedores e consequentemente o capital de giro foi reduzido em R$ 69 milhões. Esse efeito,
combinado com a otimização dos investimentos em Capex (R$ 141 milhões 6M15 vs. R$ 235
milhões 6M14), contribuiu para a geração de caixa livre de R$ 330 milhões, frente a um
consumo de R$ 47 milhões nos 6M14.
Sobre o Capex, como já informado, em 2015 investiremos R$ 385 milhões, com foco na
inovação, evolução do modelo comercial no Brasil, e nas Operações Internacionais em
tecnologia da informação (SAP) e logística.
Finalmente, o Conselho de Administração da Companhia, em reunião realizada em 22 de julho
de 2015, aprovou a proposta da diretoria para o pagamento, em 13 de agosto de 2015, de
dividendos e juros sobre o capital próprio referentes ao período de 1º de janeiro de 2015 a 30
de junho de 2015, no montante de R$ 207,29 milhões e R$ 29,04 milhões (R$ 24,68 milhões,
líquidos de imposto de renda na fonte), respectivamente, e em conjunto equivalente a 100%
do lucro líquido e R$ 0,5391/ação.
3141
55
94
131
64
86
106
0
20
40
60
80
100
120
140
2011 2012 2013 2014 2015
Receita Líquida Real Receita Líquida Laudo de Avaliação
cagr 43%
Receita Líquida AUD MM - Ano Fiscal Findo em Junho
2,23,3
4,4
14,9
25,2
7,7
11,5
16,9
0
5
10
15
20
25
30
2011 2012 2013 2014 2015
Ebitda Real Ebitda Laudo de Avaliação
cagr 84%
EbitdaAUD MM - Ano Fiscal Findo em Junho
Comentário de Desempenho 2T15
4
1. mercado de higiene pessoal, perfumaria e cosméticos (HPPC)
Sobre os dados de mercado da SIPATESP/ABHIPEC5, desde o 3T14 algumas empresas
relevantes deixaram de reportar suas informações à associação, podendo comprometer
significativamente a qualidade dos números. Por esse motivo, optamos pela não divulgação
dessas informações até que a situação se normalize.
2. destaques socioambientais
Como estratégia fundamental de nossa Visão de Sustentabilidade 2050, nos últimos meses
ampliamos a nossa atuação na região Amazônica por meio do fomento a uma economia
baseada no uso sustentável de seus produtos e serviços.
Para a produção da linha Natura EKOS Ucuuba, comentada anteriormente, o uso da semente
como matéria-prima cosmética possibilita o manejo sustentável e evita o desmatamento. A
cada ano, a renda que uma comunidade obtém com uma árvore preservada é três vezes
maior do que aquela obtida com a exploração madeireira. Enquanto a árvore é derrubada
apenas uma vez, os frutos são colhidos por no mínimo dez anos, transformando a Ucuuba
em uma espécie valorizada.
Em maio, o complexo industrial Ecoparque (Benevides, PA), que hoje abriga nossa produção
de sabonetes, recebeu sua primeira empresa parceira, a casa de fragrâncias Symrise.
Lançado em 2014, o objetivo do Ecoparque é criar uma cadeia produtiva integrada, em que
insumos produzidos ou descartados por uma empresa possam ser utilizados na produção de
outra.
A Natura e a Coca-Cola Brasil, com apoio técnico da Ipsos desenvolveram o IPS
Comunidades, um mapeamento social inédito de comunidades da Amazônia Brasileira. O
índice que mensura o desenvolvimento socioambiental, foi desenvolvido e implantado a
partir da metodologia do Índice de Progresso Social, concebido pelo economista americano
Michael Porter e pela AVINA6.
A localidade escolhida para o mapeamento foi o Médio Juruá, que compreende mais de 50
comunidades ribeirinhas e já conta com projetos da Natura e da Coca-Cola Brasil,
fomentando cadeias de fornecimento sustentáveis de ativos da biodiversidade local.
Por fim, a Natura ingressou no novo índice da Euronext (Euronext Vigeo – Emerging Markets
70), formado por 70 empresas de mercados emergentes que atingiram os mais altos
padrões de desempenho Ambiental, Social e Governança Corporativa, conforme os critérios
definidos e analisados pela Vigeo. 5 Sipatesp/Abihpec:Sindicato da Indústria de Perfumarias de Artigos de Toucador no Estado de São Paulo / Associação Brasileira da Indústria de
Higiene Pessoal, Perfumaria e Cosméticos. 6 A Avina foi fundada em 1994 pelo empresário suíço Stephan Schmidheiny, que inspirou a visão e os valores que orientam a organização. A
Fundación Avina é mantida pela VIVA Trust, fideicomisso criado por Stephan Schmidheiny para promover o desenvolvimento sustentável por meio de
uma parceira entre empresas bem-sucedidas e responsáveis e as organizações filantrópicas que promovem a liderança e a inovação.
http://www.avina.net/por/sobre-avina/que-hacemos/#1

Comentário de Desempenho 2T15
5
Emissão relativa de carbono (escopo 1, 2 e 3): Crescimento de emissão relativa
ocasionada pelo menor volume de vendas e pela maior representatividade no mix de vendas
de produtos de maior emissão no Brasil.
% material reciclado pós-consumo: Aumento significativo em função de mix de vendas
do portfólio composto por vidro reciclado que passou a compor perfumaria Natura a partir de
janeiro 2015.
% reciclabilidade de produto: Mix de vendas favorecido por produtos que contem
materiais recicláveis, principalmente da categoria perfumaria.
Embalagens ecoeficientes: Mix de vendas não foi favorecido por produtos que contém
plástico renovável, material reciclado pós consumo ou menor massa de material em relação
ao ano de 2014.
Volume acumulado de negócios na região PAM Amazônica: Resultado alinhado com
expectativa de compra de insumos da região Amazônica e investimentos no Ecoparque.
Indicador
1 Valores referentes ao 1T15
5 Valores acumulados desde 2011.
Consumo de água
Penetração Crer para Ver - Brasil % ativas
Emissão relativa de carbono (escopo 1, 2 e 3)
% material reciclado pós consumo2
% reciclabilidade de produto3
Unidade
litros / unidades
produzidas
25,0
659,6
% (g mat reciclado/g
emb.)
% (g mat reciclado/g
emb.)
kg CO2/kg prod
faturado
% (unid. Faturadas
emb. Ecoef/unid fat.
Totais)
MM R$
29,0
582,1
Resultado 2014
2,99
1,2
57,5
0,45
20,0
Resultado 1S15 Ambição 2020
3,19 1
3,4
0,32
24,0
2,15
10,0
74,0
40,0
1.000,0
2 O indicador considera o % de materiais de embalagens que provêm de reciclagem pós-consumo em relação ao total de massa de
embalagem faturada. 3 O indicador considera o % de materiais de embalagens que posseum potencial para reciclagem em relação ao total de massa de
embalagem faturada. 4 Indicador de embalagems ecoeficientes são aquelas que apresentam redução de no mínimo 50% de peso em relação a embalagem
regular/similar; ou que apresentam 50% de sua composição com MRPC e/ou material renovável desde que não apresentam aumento de
massa.
0,51
21,6
Volume acumulado de negócios na região PAM
Amazônica5
Embalagens ecoeficientes4
61,7

Comentário de Desempenho 2T15
6
Consumo relativo de água: processos industriais readequados para atendimento da
demanda de mercado resultou maior consumo maior de água no site de Cajamar.
Arrecadação Crer para Ver (Educação): Resultado continua consistente com a estratégia
de portfólio desenvolvida em 2014, mostrando a alta alavancagem obtida em relação ao 1º
semestre de 2014.

Comentário de Desempenho 2T15
7
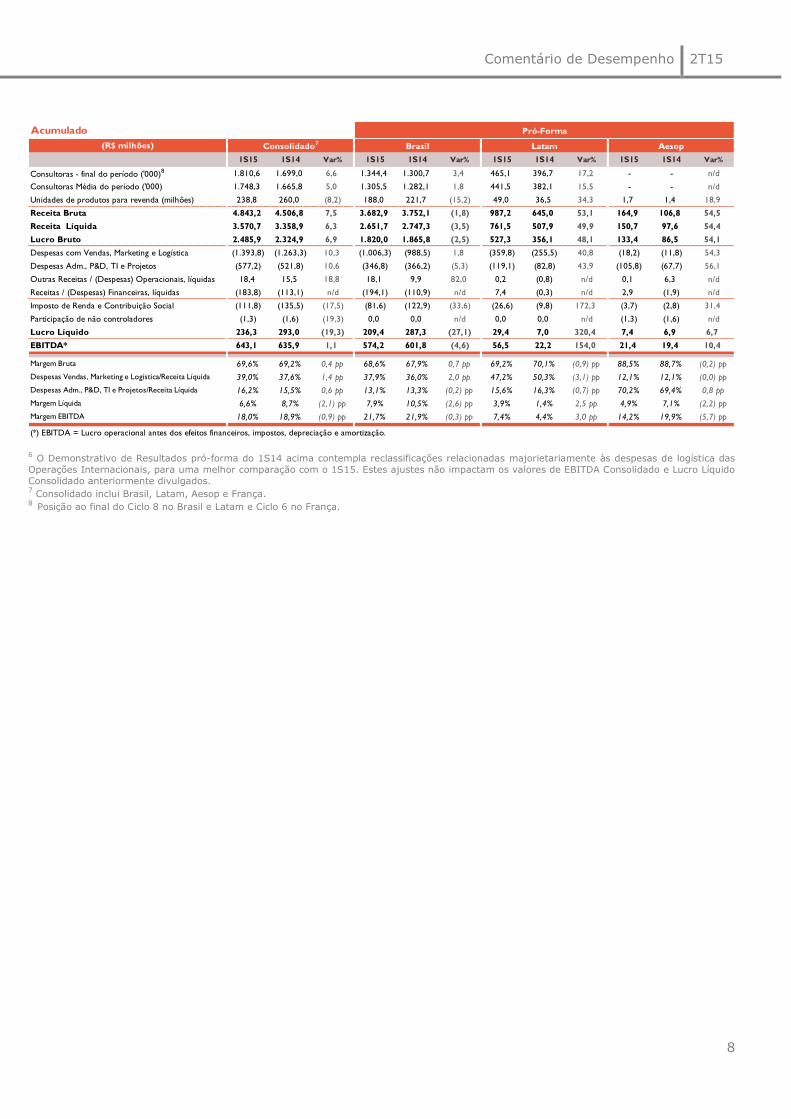
3. desempenho econômico-financeiro789
A partir desse trimestre alteramos a apresentação dos segmentação de negócios, adotando
um formato que condiz com a maturidade de cada um dos segmentos.
Até 31 de março de 2015, data da última divulgação das informações financeiras
intermediárias, as informações por segmentos incluíam a seguinte segregação: Brasil
(“Operação Brasil”), América Latina (“LATAM”) e demais países (“Outros”), sendo nesta
última incluída as operações da França, Corporativo LATAM e Emeis Holding Pty Ltd
(“Aesop”). Além disso, a LATAM era analisada em dois grupos: (a) Argentina, Chile e Peru
(“Operações em Consolidação”); e (b) México e Colômbia (“Operações em Implantação”).
A partir da divulgação das informações intermediárias de 30 de junho de 2015, a Sociedade
optou por divulgar a seguinte segregação: Brasil (“Operação Brasil”), América Latina
(“Operação LATAM”, incluindo o Corporativo LATAM), Aesop (inclui os resultados das
Holdings Natura Brasil Pty Ltd. e Natura Cosmetics Australia Pty Ltd.) e França (“Operação
França”).
Disponibilizamos a série histórica desde 2011 no novo formato no link abaixo:
http://natu.infoinvest.com.br/ptb/s-7-ptb.html?idioma=ptb
7 O Demonstrativo de Resultados pró-forma do 2T14 acima contempla reclassificações relacionadas majorietariamente às despesas de logística das
Operações Internacionais, para uma melhor comparação com o 2T15. Estes ajustes não impactam os valores de EBITDA Consolidado e Lucro Líquido
Consolidado anteriormente divulgados. 8 Consolidado inclui Brasil, Latam, Aesop e França.
9 Posição ao final do Ciclo 8 no Brasil e Latam e Ciclo 6 no França.
Trimestre Pró-Forma Pró-Forma
(R$ milhões) Consolidado7 Brasil Latam Aesop Novos Negócios
2T15 2T14 Var% 2T15 2T14 Var% 2T15 2T14 Var% 2T15 2T14 Var%
Consultoras - final do período ('000)8 1.810,6 1.699,0 6,6 1.344,4 1.300,7 3,4 465,1 396,7 17,2 - - n/d
Consultoras Média do período ('000) 1.781,4 1.692,0 5,3 1.326,8 1.303,2 1,8 453,4 387,2 17,1 - - n/d
Unidades de produtos para revenda (milhões) 120,3 131,6 (8,6) 94,8 111,5 (15,0) 24,5 19,0 29,3 0,9 0,8 9,7
Receita Bruta 2.637,3 2.421,6 8,9 1.979,2 2.017,4 (1,9) 561,6 343,8 63,4 91,8 56,1 63,7
Receita Líquida 1.928,9 1.802,6 7,0 1.408,9 1.476,8 (4,6) 431,7 271,0 59,3 84,5 51,3 64,7
Lucro Bruto 1.339,2 1.230,5 8,8 963,6 992,1 (2,9) 297,2 191,0 55,6 75,5 44,8 68,6
Despesas com Vendas, Marketing e Logística (745,8) (660,7) 12,9 (530,7) (517,4) 2,6 (199,2) (134,8) 47,8 (10,5) (4,6) 130,8
Despesas Adm., P&D, TI e Projetos (298,8) (258,0) 15,8 (180,2) (177,0) 1,9 (59,7) (42,3) 41,1 (56,3) (36,0) 56,5
Outras Receitas / (Despesas) Operacionais, líquidas 9,9 4,2 135,0 9,6 4,4 120,0 0,1 (0,2) n/d 0,2 0,1 n/d
Receitas / (Despesas) Financeiras, líquidas (129,1) (61,2) n/d (124,8) (59,0) n/d (4,7) (0,4) n/d 0,3 (1,8) n/d
Imposto de Renda e Contribuição Social (57,0) (78,4) (27,3) (38,4) (70,7) (45,7) (15,7) (5,1) n/d (3,0) (2,6) 15,9
Participação dos minoritários (1,7) (0,7) 146,5 0,0 0,0 n/d 0,0 0,0 n/d (1,7) (0,7) n/d
Lucro Líquido 116,7 175,8 (33,7) 99,2 172,5 (42,5) 18,0 8,1 121,9 4,4 (0,8) n/d
EBITDA* 357,2 352,3 1,4 305,7 331,9 (7,9) 42,8 16,4 160,9 13,3 7,7 73,3
Margem Bruta 69,4% 68,3% 1,2 pp 68,4% 67,2% 1,2 pp 68,8% 70,4% (1,6) pp 89,3% 87,3% 2,0 pp
Despesas Vendas, Marketing e Logística/Receita Líquida 38,7% 36,7% 2,0 pp 37,7% 35,0% 2,6 pp 46,1% 49,7% (3,6) pp 12,5% 8,9% 3,6 pp
Despesas Adm., P&D, TI e Projetos/Receita Líquida 15,5% 14,3% 1,2 pp 12,8% 12,0% 0,8 pp 13,8% 15,6% (1,8) pp 66,6% 70,2% (3,5) pp
Margem Líquida 6,0% 9,8% (3,7) pp 7,0% 11,7% (4,6) pp 4,2% 3,0% 1,2 pp 5,3% (1,5)% 6,8 pp
Margem EBITDA 18,5% 19,5% (1,0) pp 21,7% 22,5% (0,8) pp 9,9% 6,0% 3,9 pp 15,7% 14,9% 0,8 pp
(*) EBITDA = Lucro operacional antes dos efeitos financeiros, impostos, depreciação e amortização.
Comentário de Desempenho 2T15
8
6 O Demonstrativo de Resultados pró-forma do 1S14 acima contempla reclassificações relacionadas majorietariamente às despesas de logística das
Operações Internacionais, para uma melhor comparação com o 1S15. Estes ajustes não impactam os valores de EBITDA Consolidado e Lucro Líquido
Consolidado anteriormente divulgados. 7 Consolidado inclui Brasil, Latam, Aesop e França.
8 Posição ao final do Ciclo 8 no Brasil e Latam e Ciclo 6 no França.
Acumulado Pró-Forma Pró-Forma
(R$ milhões) Consolidado7
Brasil Latam Aesop Novos Negócios
1S15 1S14 Var% 1S15 1S14 Var% 1S15 1S14 Var% 1S15 1S14 Var%
Consultoras - final do período ('000)8 1.810,6 1.699,0 6,6 1.344,4 1.300,7 3,4 465,1 396,7 17,2 - - n/d
Consultoras Média do período ('000) 1.748,3 1.665,8 5,0 1.305,5 1.282,1 1,8 441,5 382,1 15,5 - - n/d
Unidades de produtos para revenda (milhões) 238,8 260,0 (8,2) 188,0 221,7 (15,2) 49,0 36,5 34,3 1,7 1,4 18,9
Receita Bruta 4.843,2 4.506,8 7,5 3.682,9 3.752,1 (1,8) 987,2 645,0 53,1 164,9 106,8 54,5
Receita Líquida 3.570,7 3.358,9 6,3 2.651,7 2.747,3 (3,5) 761,5 507,9 49,9 150,7 97,6 54,4
Lucro Bruto 2.485,9 2.324,9 6,9 1.820,0 1.865,8 (2,5) 527,3 356,1 48,1 133,4 86,5 54,1
Despesas com Vendas, Marketing e Logística (1.393,8) (1.263,3) 10,3 (1.006,3) (988,5) 1,8 (359,8) (255,5) 40,8 (18,2) (11,8) 54,3
Despesas Adm., P&D, TI e Projetos (577,2) (521,8) 10,6 (346,8) (366,2) (5,3) (119,1) (82,8) 43,9 (105,8) (67,7) 56,1
Outras Receitas / (Despesas) Operacionais, líquidas 18,4 15,5 18,8 18,1 9,9 82,0 0,2 (0,8) n/d 0,1 6,3 n/d
Receitas / (Despesas) Financeiras, líquidas (183,8) (113,1) n/d (194,1) (110,9) n/d 7,4 (0,3) n/d 2,9 (1,9) n/d
Imposto de Renda e Contribuição Social (111,8) (135,5) (17,5) (81,6) (122,9) (33,6) (26,6) (9,8) 172,3 (3,7) (2,8) 31,4
Participação de não controladores (1,3) (1,6) (19,3) 0,0 0,0 n/d 0,0 0,0 n/d (1,3) (1,6) n/d
Lucro Líquido 236,3 293,0 (19,3) 209,4 287,3 (27,1) 29,4 7,0 320,4 7,4 6,9 6,7
EBITDA* 643,1 635,9 1,1 574,2 601,8 (4,6) 56,5 22,2 154,0 21,4 19,4 10,4
Margem Bruta 69,6% 69,2% 0,4 pp 68,6% 67,9% 0,7 pp 69,2% 70,1% (0,9) pp 88,5% 88,7% (0,2) pp
Despesas Vendas, Marketing e Logística/Receita Líquida 39,0% 37,6% 1,4 pp 37,9% 36,0% 2,0 pp 47,2% 50,3% (3,1) pp 12,1% 12,1% (0,0) pp
Despesas Adm., P&D, TI e Projetos/Receita Líquida 16,2% 15,5% 0,6 pp 13,1% 13,3% (0,2) pp 15,6% 16,3% (0,7) pp 70,2% 69,4% 0,8 pp
Margem Líquida 6,6% 8,7% (2,1) pp 7,9% 10,5% (2,6) pp 3,9% 1,4% 2,5 pp 4,9% 7,1% (2,2) pp
Margem EBITDA 18,0% 18,9% (0,9) pp 21,7% 21,9% (0,3) pp 7,4% 4,4% 3,0 pp 14,2% 19,9% (5,7) pp
(*) EBITDA = Lucro operacional antes dos efeitos financeiros, impostos, depreciação e amortização.
Comentário de Desempenho 2T15
9
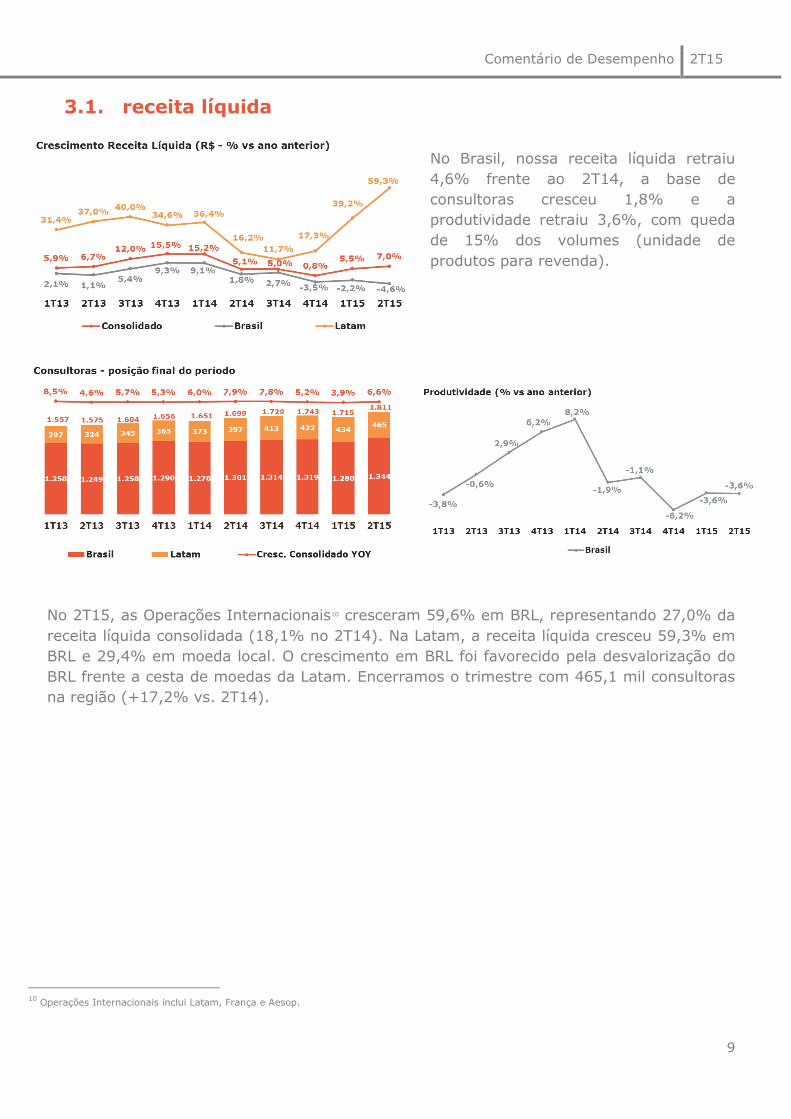
3.1. receita líquida
No Brasil, nossa receita líquida retraiu
4,6% frente ao 2T14, a base de
consultoras cresceu 1,8% e a
produtividade retraiu 3,6%, com queda
de 15% dos volumes (unidade de
produtos para revenda).
No 2T15, as Operações Internacionais10 cresceram 59,6% em BRL, representando 27,0% da
receita líquida consolidada (18,1% no 2T14). Na Latam, a receita líquida cresceu 59,3% em
BRL e 29,4% em moeda local. O crescimento em BRL foi favorecido pela desvalorização do
BRL frente a cesta de moedas da Latam. Encerramos o trimestre com 465,1 mil consultoras
na região (+17,2% vs. 2T14).
10
Operações Internacionais inclui Latam, França e Aesop.

Comentário de Desempenho 2T15
10
3.2. inovação & produtos
O índice de inovação11, com base nos
últimos 12 meses findos em junho de
2015 foi de 65,5% frente a 61,0% do
mesmo período do ano anterior, dentro
do patamar esperado (entre 60% e
70%).
A evolução no índice frente ao 2T14
deve-se aos lançamentos de perfumaria
(#Urbano, Luna e Humor Perfeito) e
relançamento de sabonetes (Tododia Sortidos, Macadâmia e Alecrim). Adicionalmente, como
comentado na introdução deste documento, tivemos lançamentos importantes nos últimos
meses: Natura EKOS Ucuuba, hidratante SOU sem fragrância e Kaiak Expedição.
3.3. margem bruta
No 2T15, a margem bruta consolidada teve leve expansão frente ao mesmo período do ano
anterior (+1,2pp). No Brasil, onde tivemos expansão de 1,2pp na margem bruta, os
reajustes de preços praticados nos últimos 12 meses e o uso dos estoques constituídos no
ano passado foram suficientes para mitigar os impactos recentes de inflação e câmbio em
nossos custos de produção.
O quadro abaixo exibe o custo aberto em seus principais componentes:
11
Índice de Inovação: participação nos últimos 12 meses da venda dos produtos lançados nos últimos 24 meses.
2T15 2T14 1S15 1S14
80,1 83,3 78,4 80,5
9,1 9,4 9,9 9,8
2,9 2,0 3,4 2,7
7,9 5,4 8,2 7,0
Total 100,0 100,0 100,0 100,0
*Matéria - Prima, Material de Embalagem e Produto Acabado
MP / ME / PA*
Mão de Obra
Depreciação
Outros
Comentário de Desempenho 2T15
11
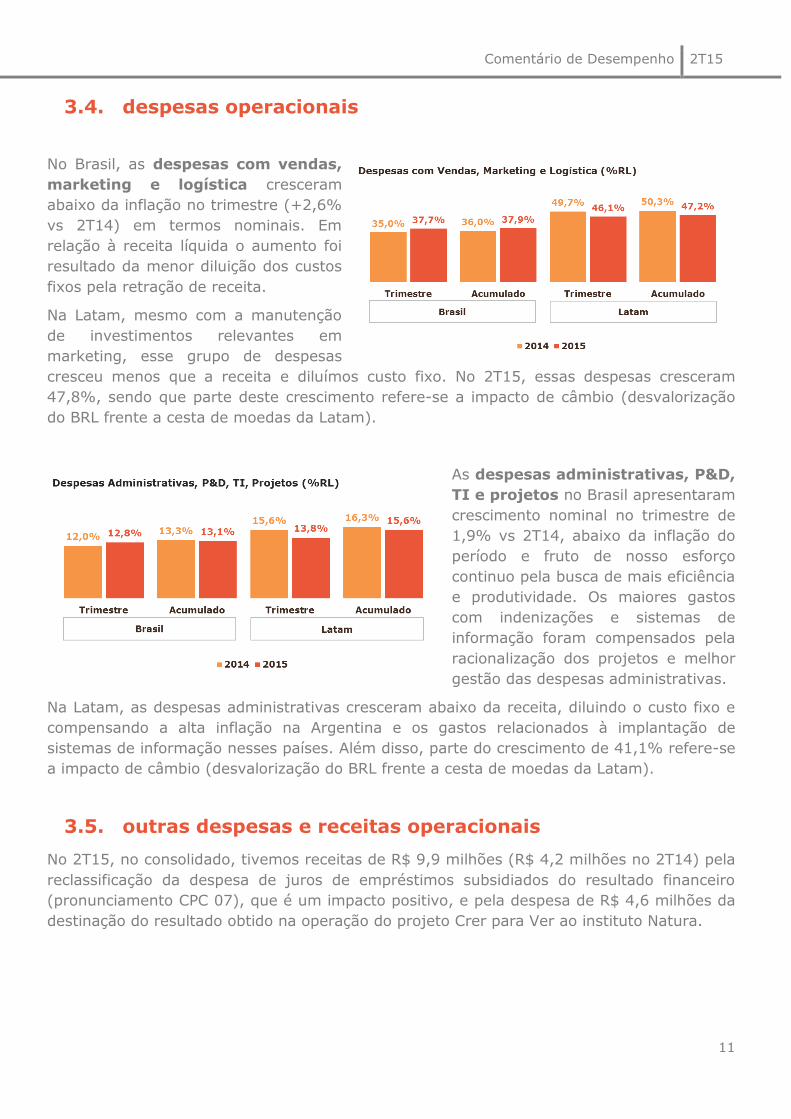
3.4. despesas operacionais
No Brasil, as despesas com vendas,
marketing e logística cresceram
abaixo da inflação no trimestre (+2,6%
vs 2T14) em termos nominais. Em
relação à receita líquida o aumento foi
resultado da menor diluição dos custos
fixos pela retração de receita.
Na Latam, mesmo com a manutenção
de investimentos relevantes em
marketing, esse grupo de despesas
cresceu menos que a receita e diluímos custo fixo. No 2T15, essas despesas cresceram
47,8%, sendo que parte deste crescimento refere-se a impacto de câmbio (desvalorização
do BRL frente a cesta de moedas da Latam).
As despesas administrativas, P&D,
TI e projetos no Brasil apresentaram
crescimento nominal no trimestre de
1,9% vs 2T14, abaixo da inflação do
período e fruto de nosso esforço
continuo pela busca de mais eficiência
e produtividade. Os maiores gastos
com indenizações e sistemas de
informação foram compensados pela
racionalização dos projetos e melhor
gestão das despesas administrativas.
Na Latam, as despesas administrativas cresceram abaixo da receita, diluindo o custo fixo e
compensando a alta inflação na Argentina e os gastos relacionados à implantação de
sistemas de informação nesses países. Além disso, parte do crescimento de 41,1% refere-se
a impacto de câmbio (desvalorização do BRL frente a cesta de moedas da Latam).
3.5. outras despesas e receitas operacionais
No 2T15, no consolidado, tivemos receitas de R$ 9,9 milhões (R$ 4,2 milhões no 2T14) pela
reclassificação da despesa de juros de empréstimos subsidiados do resultado financeiro
(pronunciamento CPC 07), que é um impacto positivo, e pela despesa de R$ 4,6 milhões da
destinação do resultado obtido na operação do projeto Crer para Ver ao instituto Natura.
Comentário de Desempenho 2T15
12
3.6. outros investimentos internacionais 2.
A partir desse trimestre a Companhia optou por alterar o disclosure da segmentação de
negócios.
Os detalhes que antes compunham esse capítulo (Aesop, Corporativo Latam e França) estão
reportados separadamente nas páginas 8 e 9 e/ou nas demonstrações financeiras do
exercício.
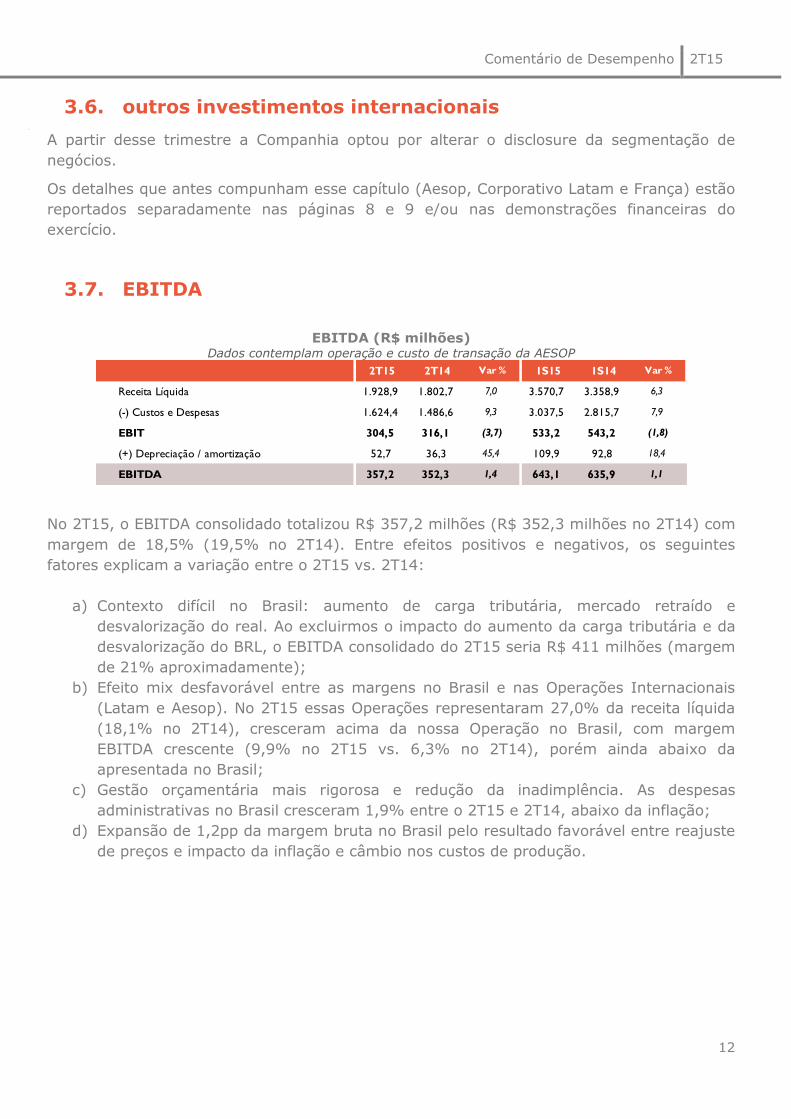
3.7. EBITDA
EBITDA (R$ milhões) Dados contemplam operação e custo de transação da AESOP
No 2T15, o EBITDA consolidado totalizou R$ 357,2 milhões (R$ 352,3 milhões no 2T14) com
margem de 18,5% (19,5% no 2T14). Entre efeitos positivos e negativos, os seguintes
fatores explicam a variação entre o 2T15 vs. 2T14:
a) Contexto difícil no Brasil: aumento de carga tributária, mercado retraído e
desvalorização do real. Ao excluirmos o impacto do aumento da carga tributária e da
desvalorização do BRL, o EBITDA consolidado do 2T15 seria R$ 411 milhões (margem
de 21% aproximadamente);
b) Efeito mix desfavorável entre as margens no Brasil e nas Operações Internacionais
(Latam e Aesop). No 2T15 essas Operações representaram 27,0% da receita líquida
(18,1% no 2T14), cresceram acima da nossa Operação no Brasil, com margem
EBITDA crescente (9,9% no 2T15 vs. 6,3% no 2T14), porém ainda abaixo da
apresentada no Brasil;
c) Gestão orçamentária mais rigorosa e redução da inadimplência. As despesas
administrativas no Brasil cresceram 1,9% entre o 2T15 e 2T14, abaixo da inflação;
d) Expansão de 1,2pp da margem bruta no Brasil pelo resultado favorável entre reajuste
de preços e impacto da inflação e câmbio nos custos de produção.
2T15 2T14 Var % 1S15 1S14 Var %
Receita Líquida 1.928,9 1.802,7 7,0 3.570,7 3.358,9 6,3
(-) Custos e Despesas 1.624,4 1.486,6 9,3 3.037,5 2.815,7 7,9
EBIT 304,5 316,1 (3,7) 533,2 543,2 (1,8)
(+) Depreciação / amortização 52,7 36,3 45,4 109,9 92,8 18,4
EBITDA 357,2 352,3 1,4 643,1 635,9 1,1

Comentário de Desempenho 2T15
13
3.8. lucro líquido
O lucro líquido consolidado decresceu
33,7% no período e a margem líquida
passou de 9,8% no 2T14 para 6,0% no
2T15. Esse resultado é produto
principalmente do ajuste desfavorável
da provisão para aquisição da parcela
remanescente de 28,66% da Aesop12.
Ao excluirmos esse ajuste a retração
seria de 15,4%. Os outros 18,3% são explicados principalmente pelo aumento da taxa
básica de juros em nossa dívida, pelo aumento do saldo médio de endividamento e pelo
efeito não-caixa referente à marcação a mercado dos derivativos atrelados à dívida em
moeda estrangeira.
Excluindo-se também o efeito não-caixa da marcação a mercado dos derivativos atrelados à
dívida em moeda estrangeira a retração do lucro líquido teria sido de 13,6%.
12
Refere-se a atualização no montante de R$ 50,1 milhões referente a provisão para aquisição de participação de não controladores, conforme nota
explicativa número 19(a) das Demonstrações Financeiras do 2T15.
Valores em R$ milhões 2T15 2T14 Var. R$ 1S15 1S14 Var. R$
Receitas / (Despesas) Financeiras, líquidas (129,1) (61,2) (68,0) (183,8) (113,1) (70,7)
Ajuste de Marcação ao Mercado 7,3 13,7 (6,5) 17,6 13,4 4,2
Receitas / (Despesas) Financeiras ex. Marcação
a Mercado, líquidas (136,4) (74,9) (61,5) (201,3) (126,5) (74,9)
Comentário de Desempenho 2T15
14
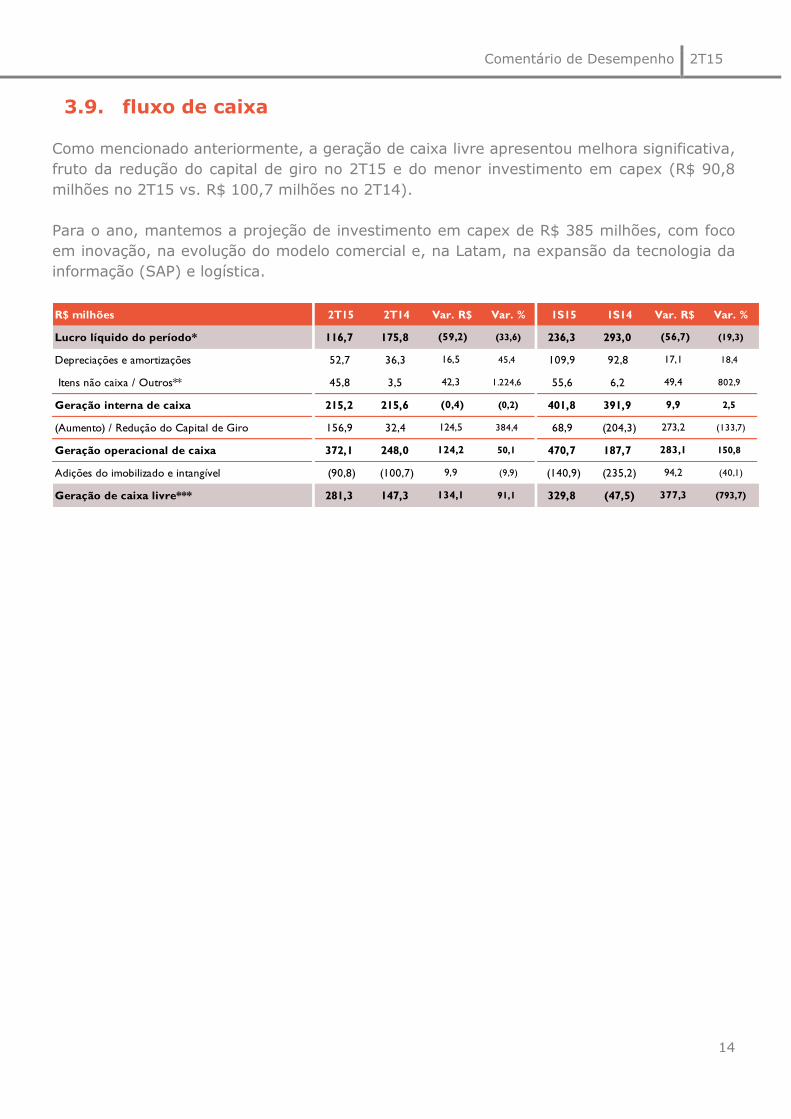
3.9. fluxo de caixa
Como mencionado anteriormente, a geração de caixa livre apresentou melhora significativa,
fruto da redução do capital de giro no 2T15 e do menor investimento em capex (R$ 90,8
milhões no 2T15 vs. R$ 100,7 milhões no 2T14).
Para o ano, mantemos a projeção de investimento em capex de R$ 385 milhões, com foco
em inovação, na evolução do modelo comercial e, na Latam, na expansão da tecnologia da
informação (SAP) e logística.
R$ milhões 2T15 2T14 Var. R$ Var. % 1S15 1S14 Var. R$ Var. %
Lucro líquido do período* 116,7 175,8 (59,2) (33,6) 236,3 293,0 (56,7) (19,3)
Depreciações e amortizações 52,7 36,3 16,5 45,4 109,9 92,8 17,1 18,4
Itens não caixa / Outros** 45,8 3,5 42,3 1.224,6 55,6 6,2 49,4 802,9
Geração interna de caixa 215,2 215,6 (0,4) (0,2) 401,8 391,9 9,9 2,5
(Aumento) / Redução do Capital de Giro 156,9 32,4 124,5 384,4 68,9 (204,3) 273,2 (133,7)
Geração operacional de caixa 372,1 248,0 124,2 50,1 470,7 187,7 283,1 150,8
Adições do imobilizado e intangível (90,8) (100,7) 9,9 (9,9) (140,9) (235,2) 94,2 (40,1)
Geração de caixa livre*** 281,3 147,3 134,1 91,1 329,8 (47,5) 377,3 (793,7)
Comentário de Desempenho 2T15
15
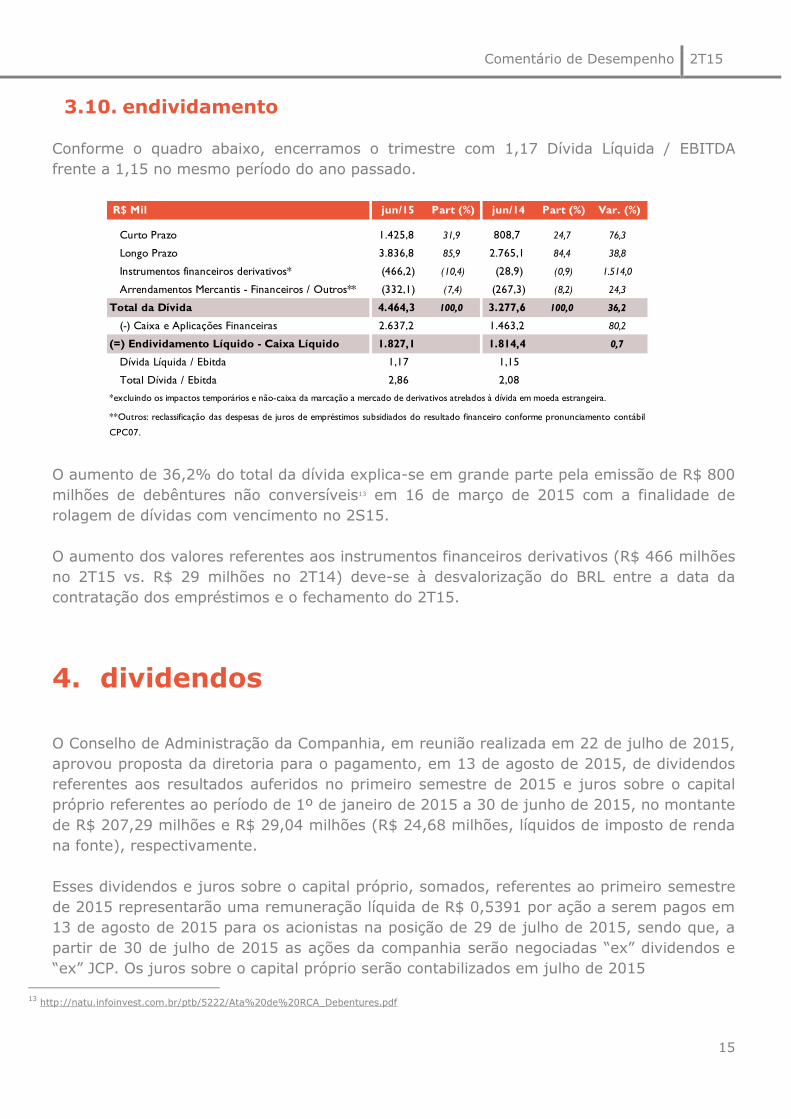
3.10. endividamento
Conforme o quadro abaixo, encerramos o trimestre com 1,17 Dívida Líquida / EBITDA
frente a 1,15 no mesmo período do ano passado.
O aumento de 36,2% do total da dívida explica-se em grande parte pela emissão de R$ 800
milhões de debêntures não conversíveis13 em 16 de março de 2015 com a finalidade de
rolagem de dívidas com vencimento no 2S15.
O aumento dos valores referentes aos instrumentos financeiros derivativos (R$ 466 milhões
no 2T15 vs. R$ 29 milhões no 2T14) deve-se à desvalorização do BRL entre a data da
contratação dos empréstimos e o fechamento do 2T15.
4. dividendos
O Conselho de Administração da Companhia, em reunião realizada em 22 de julho de 2015,
aprovou proposta da diretoria para o pagamento, em 13 de agosto de 2015, de dividendos
referentes aos resultados auferidos no primeiro semestre de 2015 e juros sobre o capital
próprio referentes ao período de 1º de janeiro de 2015 a 30 de junho de 2015, no montante
de R$ 207,29 milhões e R$ 29,04 milhões (R$ 24,68 milhões, líquidos de imposto de renda
na fonte), respectivamente.
Esses dividendos e juros sobre o capital próprio, somados, referentes ao primeiro semestre
de 2015 representarão uma remuneração líquida de R$ 0,5391 por ação a serem pagos em
13 de agosto de 2015 para os acionistas na posição de 29 de julho de 2015, sendo que, a
partir de 30 de julho de 2015 as ações da companhia serão negociadas “ex” dividendos e
“ex” JCP. Os juros sobre o capital próprio serão contabilizados em julho de 2015
13
http://natu.infoinvest.com.br/ptb/5222/Ata%20de%20RCA_Debentures.pdf
R$ Mil jun/15 Part (%) jun/14 Part (%) Var. (%)
Curto Prazo 1.425,8 31,9 808,7 24,7 76,3
Longo Prazo 3.836,8 85,9 2.765,1 84,4 38,8
Instrumentos financeiros derivativos* (466,2) (10,4) (28,9) (0,9) 1.514,0
Arrendamentos Mercantis - Financeiros / Outros** (332,1) (7,4) (267,3) (8,2) 24,3
Total da Dívida 4.464,3 100,0 3.277,6 100,0 36,2
(-) Caixa e Aplicações Financeiras 2.637,2 1.463,2 80,2
(=) Endividamento Líquido - Caixa Líquido 1.827,1 1.814,4 0,7
Dívida Líquida / Ebitda 1,17 1,15
Total Dívida / Ebitda 2,86 2,08
*excluindo os impactos temporários e não-caixa da marcação a mercado de derivativos atrelados à dívida em moeda estrangeira.
**Outros: reclassificação das despesas de juros de empréstimos subsidiados do resultado financeiro conforme pronunciamento contábil
CPC07.

Comentário de Desempenho 2T15
16
5. desempenho NATU3
No 2T15, as ações da Natura tiveram uma desvalorização de 12,5% frente a 31 de
dezembro de 2014, enquanto o Ibovespa se valorizou em 4,7%. O volume médio diário
negociado no 2T15 foi de R$ 32,8 milhões, frente a R$ 51,7 milhões no mesmo período do
ano anterior.
No acumulado, nossa posição média no Índice de Negociabilidade da BOVESPA foi de 49º.
O gráfico abaixo demostra o desempenho das ações Natura desde o seu lançamento (IPO):
Comentário de Desempenho 2T15
17
teleconferência & webcast
PORTUGUÊS: Quinta-feira, 23 de julho de 2015
10h00 – horário de Brasília
INGLÊS: Quinta-feira, 23 de julho de 2015
10h00 – horário de Brasília (tradução simultânea)
Participantes do Brasil: +55 11 3193 1001 /+55 11 2820 4001
Participantes dos EUA: Toll Free + 1 888 700 0802
Participantes de outros países: +1 786 924 6977
Senha para os participantes: Natura
Transmissão ao vivo pela internet:
www.natura.net/investidor
relações com investidores
Telefone: (11) 4571-7786
Fabio Cefaly, [email protected]
Tatiana Carvalho, [email protected]
Francisco Petroni, [email protected]
Julia Villas Bôas, [email protected]

Comentário de Desempenho 2T15
18
balanços patrimoniais
em junho de 2015 e dezembro de 2014 (em milhões de reais - R$)
ATIVO jun-15 dez-14 PASSIVO E PATRIMÔNIO LÍQUIDO jun-15 dez-14
CIRCULANTES CIRCULANTES
Caixa e equivalentes de caixa 1.813,0 1.164,2 Empréstimos e financiamentos 1.425,8 1.466,6
Títulos e valores mobiliários 824,2 531,8 Fornecedores e outras contas a pagar 717,1 599,6
Contas a receber de clientes 886,8 847,5 Salários, participações nos resultados e encargos sociais 211,4 210,5
Estoques 867,0 890,0 Obrigações tributárias 740,6 715,5
Impostos a recuperar 299,5 240,3 Provisão para aquisição de participação de não controladores 82,2 48,2
Instrumentos financeiros derivativos 412,1 317,0 Outras obrigações 98,8 78,6
Outros ativos circulantes 298,5 248,5 Total dos passivos circulantes 3.275,8 3.119,0
Total dos ativos circulantes 5.401,2 4.239,3
NÃO CIRCULANTES NÃO CIRCULANTES
Empréstimos e financiamentos 3.836,8 2.514,6
Impostos a recuperar 193,0 182,7 Obrigações tributárias 117,8 99,0
Depósitos judiciais 276,9 263,3 Provisão para aquisição de participação de não controladores 131,1 97,2
Outros ativos não circulantes 48,4 85,7 Outras provisões 132,6 145,8
Imobilizado 1.727,0 1.672,1 Total dos passivos não circulantes 4.289,9 2.932,4
Intangível 712,5 609,2
Total dos ativos não circulantes 3.146,5 2.960,8 PATRIMÔNIO LÍQUIDO
Capital social 427,1 427,1
Reservas de lucros 425,6 189,3
Ações em tesouraria (37,9) (37,9)
Dividendo adicional proposto 0,0 449,3
Ajuste Avaliação Patrimonial (9,4) (41,4)
Total do patrimônio líquido - acionistas controladores 935,5 1.123,7
Participação dos acionistas não controladores no 46,4 25,0
patrimônio líquido das controladas
Total do patrimônio líquido 981,9 1.148,7
TOTAL DO ATIVO 8.547,6 7.200,1 TOTAL DO PASSIVO E PATRIMÔNIO LÍQUIDO 8.547,6 7.200,1
Comentário de Desempenho 2T15
19
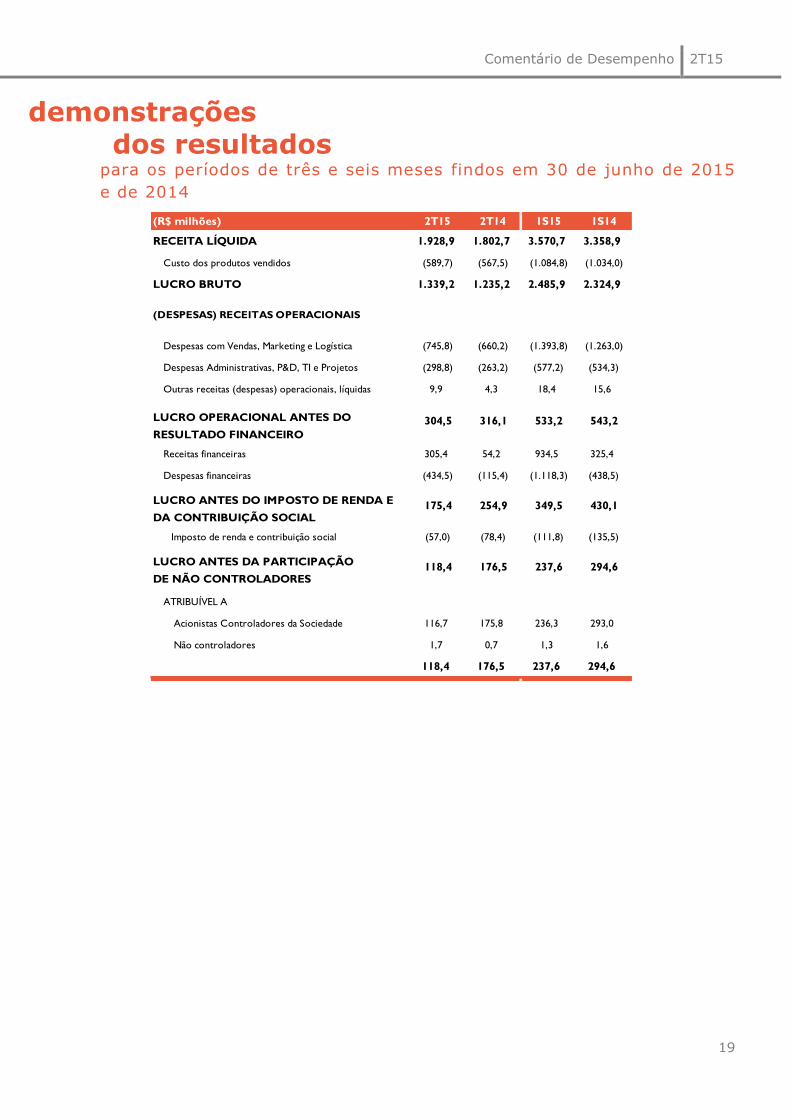
demonstrações dos resultados
para os períodos de três e seis meses findos em 30 de junho de 2015
e de 2014
(R$ milhões) 2T15 2T14 1S15 1S14
RECEITA LÍQUIDA 1.928,9 1.802,7 3.570,7 3.358,9
Custo dos produtos vendidos (589,7) (567,5) (1.084,8) (1.034,0)
LUCRO BRUTO 1.339,2 1.235,2 2.485,9 2.324,9
(DESPESAS) RECEITAS OPERACIONAIS
Despesas com Vendas, Marketing e Logística (745,8) (660,2) (1.393,8) (1.263,0)
Despesas Administrativas, P&D, TI e Projetos (298,8) (263,2) (577,2) (534,3)
Outras receitas (despesas) operacionais, líquidas 9,9 4,3 18,4 15,6
Receitas financeiras 305,4 54,2 934,5 325,4
Despesas financeiras (434,5) (115,4) (1.118,3) (438,5)
Imposto de renda e contribuição social (57,0) (78,4) (111,8) (135,5)
ATRIBUÍVEL A
Acionistas Controladores da Sociedade 116,7 175,8 236,3 293,0
Não controladores 1,7 0,7 1,3 1,6
118,4 176,5 237,6 294,6
349,5
LUCRO ANTES DA PARTICIPAÇÃO
DE NÃO CONTROLADORES118,4 176,5
543,2LUCRO OPERACIONAL ANTES DO
RESULTADO FINANCEIRO
304,5 316,1 533,2
254,9175,4 430,1LUCRO ANTES DO IMPOSTO DE RENDA E
DA CONTRIBUIÇÃO SOCIAL
237,6 294,6

Comentário de Desempenho 2T15
20
demonstrações dos fluxos de caixa
para os períodos de seis meses findos em 30 de junho de 2015 e de
2014
(R$ milhões) 1S15 1S14
FLUXO DE CAIXA DAS ATIVIDADES OPERACIONAIS
Lucro líquido do período 237,6 294,6
Depreciações e amortizações 109,9 92,8
Provisão (Reversão) decorrente dos contratos de operações com derivativos "swap" e "forward" (315,1) 193,6
Provisão (Reversão) para riscos tributários, cíveis e trabalhistas (0,9) 7,8
Atualização monetária de depósitos judiciais (9,8) (13,0)
Imposto de renda e contribuição social 111,8 135,5
Resultado na venda e baixa de ativo imobilizado e intangível (1,2) 29,3
Provisão para perdas com imobilizado (0,7) 0,0
Juros e variação cambial sobre empréstimos e financiamentos 425,3 (109,7)
Variação cambial sobre outros ativos e passivos 9,5 (39,0)
Provisão (Reversão) com planos de outorga de opções de compra de ações (7,2) 4,0
Provisão (Reversão) para créditos de liquidação duvidosa (14,9) 16,3
Reversão para perdas nos estoques (0,2) (9,3)
Resultado líquido do período atribuível a não controladores (1,3) (1,6)
Provisão com plano de assistência médica e créditos de carbono 2,0 2,4
Reconhecimento de crédito tributário extemporâneo 0,0 (13,5)
Provisão para aquisição de participação de não controladores 67,8 6,4
612,5 596,6
(AUMENTO) REDUÇÃO DOS ATIVOS
Contas a receber de clientes (24,5) 31,5
Estoques 23,2 (139,1)
Impostos a recuperar (69,5) (4,9)
Outros ativos (1,1) 25,6
Subtotal (72,0) (86,9)
AUMENTO (REDUÇÃO) DOS PASSIVOS
Fornecedores nacionais e estrangeiros 119,2 (43,5)
Salários, participações nos resultados e encargos sociais, líquidos 0,9 5,8
Obrigações tributárias (82,5) (33,0)
Outros passivos 4,4 (22,3)
Provisão para riscos tributários, cíveis e trabalhistas (3,3) (3,2)
Subtotal 38,7 (96,2)
CAIXA GERADO PELAS ATIVIDADES OPERACIONAIS 579,3 413,5
Ajustes para reconciliar o lucro líquido do período com o caixa líquido gerado pelas atividades operacionais:
Comentário de Desempenho 2T15
21
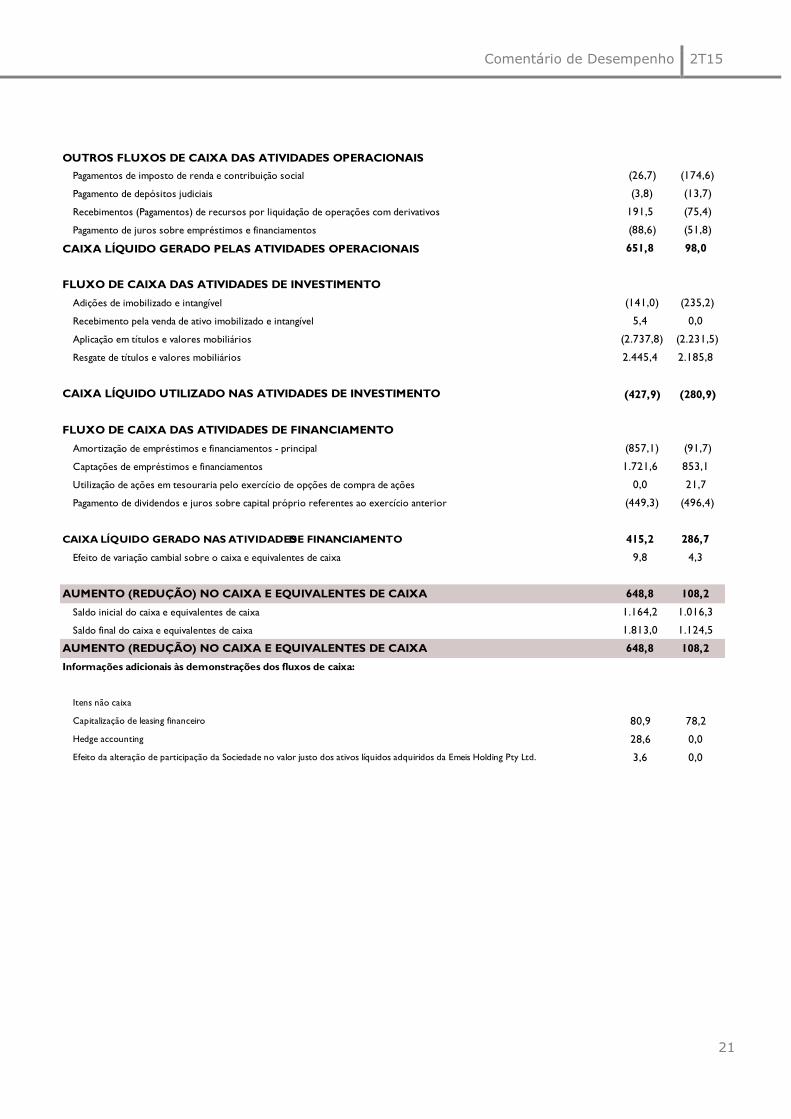
OUTROS FLUXOS DE CAIXA DAS ATIVIDADES OPERACIONAIS
Pagamentos de imposto de renda e contribuição social (26,7) (174,6)
Pagamento de depósitos judiciais (3,8) (13,7)
Recebimentos (Pagamentos) de recursos por liquidação de operações com derivativos 191,5 (75,4)
Pagamento de juros sobre empréstimos e financiamentos (88,6) (51,8)
CAIXA LÍQUIDO GERADO PELAS ATIVIDADES OPERACIONAIS 651,8 98,0
FLUXO DE CAIXA DAS ATIVIDADES DE INVESTIMENTO
Adições de imobilizado e intangível (141,0) (235,2)
Recebimento pela venda de ativo imobilizado e intangível 5,4 0,0
Aplicação em títulos e valores mobiliários (2.737,8) (2.231,5)
Resgate de títulos e valores mobiliários 2.445,4 2.185,8
CAIXA LÍQUIDO UTILIZADO NAS ATIVIDADES DE INVESTIMENTO (427,9) (280,9)
FLUXO DE CAIXA DAS ATIVIDADES DE FINANCIAMENTO
Amortização de empréstimos e financiamentos - principal (857,1) (91,7)
Captações de empréstimos e financiamentos 1.721,6 853,1
Utilização de ações em tesouraria pelo exercício de opções de compra de ações 0,0 21,7
Pagamento de dividendos e juros sobre capital próprio referentes ao exercício anterior (449,3) (496,4)
CAIXA LÍQUIDO GERADO NAS ATIVIDADES DE FINANCIAMENTO 415,2 286,7
Efeito de variação cambial sobre o caixa e equivalentes de caixa 9,8 4,3
AUMENTO (REDUÇÃO) NO CAIXA E EQUIVALENTES DE CAIXA 648,8 108,2
Saldo inicial do caixa e equivalentes de caixa 1.164,2 1.016,3
Saldo final do caixa e equivalentes de caixa 1.813,0 1.124,5
AUMENTO (REDUÇÃO) NO CAIXA E EQUIVALENTES DE CAIXA 648,8 108,2
Informações adicionais às demonstrações dos fluxos de caixa:
Itens não caixa
Capitalização de leasing financeiro 80,9 78,2
Hedge accounting 28,6 0,0
Efeito da alteração de participação da Sociedade no valor justo dos ativos líquidos adquiridos da Emeis Holding Pty Ltd. 3,6 0,0

Comentário de Desempenho 2T15
22
glossário
_CDI: Certificado de depósito interbancário.
_CN: Revendedoras autônomas, que não têm relação de emprego com a Natura, também chamadas Consultoras Natura.
_CNO: Revendedoras autônomas, que não têm relação de emprego conosco, e apoiam as Gerentes de Relacionamento em
suas atividades, também chamadas de Consultoras Natura Orientadoras.
_Comunidades Fornecedoras: Comunidades de agricultores familiares e extrativistas de diversas localidades do Brasil –
majoritariamente da Região Amazônica que extraem de forma sustentável insumos da sociobiodiversidade utilizados em nossos
produtos. Estabelecemos com essas comunidades cadeias produtivas que se pautam pelo preço justo, repartição de benefícios
pelo acesso ao patrimônio genético e aos conhecimentos tradicionais associados e apoio a projetos de desenvolvimento
sustentável local. Esse modelo de negócio tem se mostrado efetivo na geração de valor social, econômico e ambiental para a
Natura e para as comunidades.
_GEE: Gases de Efeito Estufa.
_Índice de Inovação: Participação nos últimos 12 meses da venda dos produtos lançados nos últimos 24 meses.
_Instituto Natura: é uma organização sem fins lucrativos criada em 2010 para fortalecer e ampliar nossas iniciativas de
Investimento Social Privado. Sua criação nos permitiu potencializar os esforços e investimentos em ações que contribuam para
a melhoria da qualidade do ensino público.
_Mercado Alvo: Referente aos dados de mercado alvo da SIPATESP/Abihpec. Considera somente os segmentos nos quais a
Natura opera. Exclui fraldas, itens de higiene oral, tintura para cabelo, esmaltes, absorventes dentre outros.
_PLR: Participação nos Lucros e Resultados.
_Programa Natura Crer Para Ver: Linha especial de produtos não cosméticos, cujo lucro é revertido para o Instituto Natura,
no Brasil, e investido pela Natura em ações sociais nos demais países onde operamos. Nossas consultoras e consultores se
engajam nas vendas em prol de seu benefício social, sem obter ganhos.
_Rede de Relações Sustentáveis: Modelo Comercial adotado no México que contempla oito etapas de avanço da consultora:
Consultora Natura, Consultora Natura Empreendedora, Formadora Natura 1 e 2, Transformadora Natura 1 e 2, Inspiradora
Natura e Associada Natura. Para ascender na atividade, é preciso atender a critérios de volume de vendas, atração de novas
consultoras e – como diferencial dos demais modelos existentes no país – desenvolvimento pessoal e de relações
socioambientais na comunidade.
_Repartição de Benefícios: Com base na Política Natura de Uso Sustentável da Biodiversidade e do Conhecimento
Tradicional Associado, é utilizada a premissa de repartir benefícios sempre que percebermos diferentes formas de valor nos
acessos que realizamos. Sendo assim, uma das práticas que definem a forma como esses recursos serão divididos é associar
pagamentos ao número de matérias-primas produzidas a partir de cada planta e ao sucesso comercial dos produtos para os
quais essas matérias-primas servem de insumo.
_Sipatesp/Abihpec: Sindicato da Indústria de Perfumarias de Artigos de Toucador do Estado de São Paulo / Associação
Brasileira da Indústria de Higiene Pessoal, Perfumaria e Cosméticos.
reapresentações
_Demonstrativos de Resultados pró-forma do 2T14 e do 1S14: contemplam reclassificações relacionadas majorietariamente às despesas de logística das Operações Internacionais, para uma melhor comparação com o 2T15. Estes ajustes não impactam os valores de EBITDA Consolidado e Lucro Líquido Consolidado anteriormente divulgados.

Comentário de Desempenho 2T15
23
O EBITDA não é uma medida utilizada nas práticas contábeis adotadas no Brasil, não representando o
fluxo de caixa para os períodos apresentados. Também não deve ser considerado como uma
alternativa ao lucro líquido na qualidade de indicador do desempenho operacional ou uma alternativa
ao fluxo de caixa na qualidade de indicador de liquidez. O EBITDA não tem um significado
padronizado e sua definição na Sociedade, eventualmente, pode não ser comparável ao LAJIDA ou
EBITDA definido por outras companhias. Ainda que o EBITDA não forneça, de acordo com as práticas
contábeis adotadas no Brasil, uma medida do fluxo de caixa, a Administração o utiliza para mensurar
o desempenho operacional da Sociedade. Adicionalmente, entendemos que determinados investidores
e analistas financeiros utilizam o EBITDA como indicador do desempenho operacional de uma
companhia e/ou de seu fluxo de caixa.
Este relatório contém informações futuras. Tais informações não são apenas fatos históricos, mas
refletem os desejos e as expectativas da direção da Natura. As palavras “antecipa”, “deseja”,
“espera”, “prevê”, “pretende”, “planeja”, “prediz”, “projeta”, “almeja” e similares, pretendem
identificar afirmações que, necessariamente, envolvem riscos conhecidos e desconhecidos. Riscos
conhecidos incluem incertezas, que não são limitadas ao impacto da competitividade dos preços e
produtos, aceitação dos produtos no mercado, transições de produto da Companhia e seus
competidores, aprovação regulamentar, moeda, flutuação da moeda, dificuldades de fornecimento e
produção e mudanças na venda de produtos, dentre outros riscos. Este relatório também contém
algumas informações “pró-forma”, elaboradas pela Companhia a título exclusivo de informação e
referência, portanto, são grandezas não auditadas. Este relatório está atualizado até a presente data
e a Natura não se obriga a atualizá-lo mediante novas informações e/ou acontecimentos futuros.

Earnings Release 2Q15
0
São Paulo, July 22, 2015 – Natura
Cosméticos S.A. (BM&FBOVESPA: NATU3)
announces today its results for the second
quarter of 2015 (2Q15). Except where
stated otherwise, the financial and
operating information in this release is
presented on a consolidated basis, in
accordance with International Financial
Reporting Standards (IFRS).

Earnings Release 2Q15
1
Introduction
In the second quarter of 2015, Natura posted consolidated net revenue of R$1,929 million
(+7% vs. 2Q14), consolidated EBITDA of R$357 million (+1.4% vs. 2Q14), net income of R$
117 million (-33.7% vs. 2Q14) and free cash flow of R$ 281 million (+91% vs. 2Q14). The
contraction in net income is explained in large part by the accounting effect from the
adjustment of the provision for acquiring the remaining interest in Aesop, which we will detail
below.
In Brazil, in view of the highly challenging scenario, net revenue decreased 4.6% from 2Q14,
impacted also by the higher tax burden. Despite the contraction in sales, the buying frequency
of our consultants registered slight improvement due to the initiatives implemented over the
past few months to improve the robustness of the business model and the productivity of
consultants, which included the new customized credit policy and the segmentation actions in
the direct selling channel.
In May, we launched a new active ingredient from the Amazon within the Natura EKOS line
that is little known by consumers: ucuuba. Its seeds are the source of a soft butter with
exceptional moisturizing and restorative powers, providing excellent hydration with a light,
smooth texture and rapid absorption. Other highlights included the launches of a new
moisturizer free of fragrances or dyes for all skin types in the SOU line and of the new
fragrance Kaiak Expedição.
We also made progress on expanding the Natura Network, which ended the quarter with
48,000 CNDs1 (32,000 in March 2015 and 15,000 in December 2014). Since November 2014,
we are certified by E-bit as a Diamond Store.
In addition, starting in Cycle 12 (August 2015), consultants in Brazil will be able to acquire a
Natura SIM Card and use a new application for placing orders on smartphones and tablets and
to lease card terminals for receiving payment via debit and credit cards.
In the International Operations2, which accounted for 27% of consolidated net revenue (18%
in 2Q14), we maintained the accelerated revenue growth in local currency with growth rates of
29.4% in Latam and 47.8% in Aesop.
Aesop ended the quarter with 112 stores in 16 countries (89 stores in 11 countries in 2Q14).
In this quarte we inaugurated the first Aesop store in Brazil, in the Oscar Freire street in São
Paulo.
1 CND: Natura Digital Consultant 2 International Operations include Natura Latam, Aesop and Natura France
Earnings Release 2Q15
2
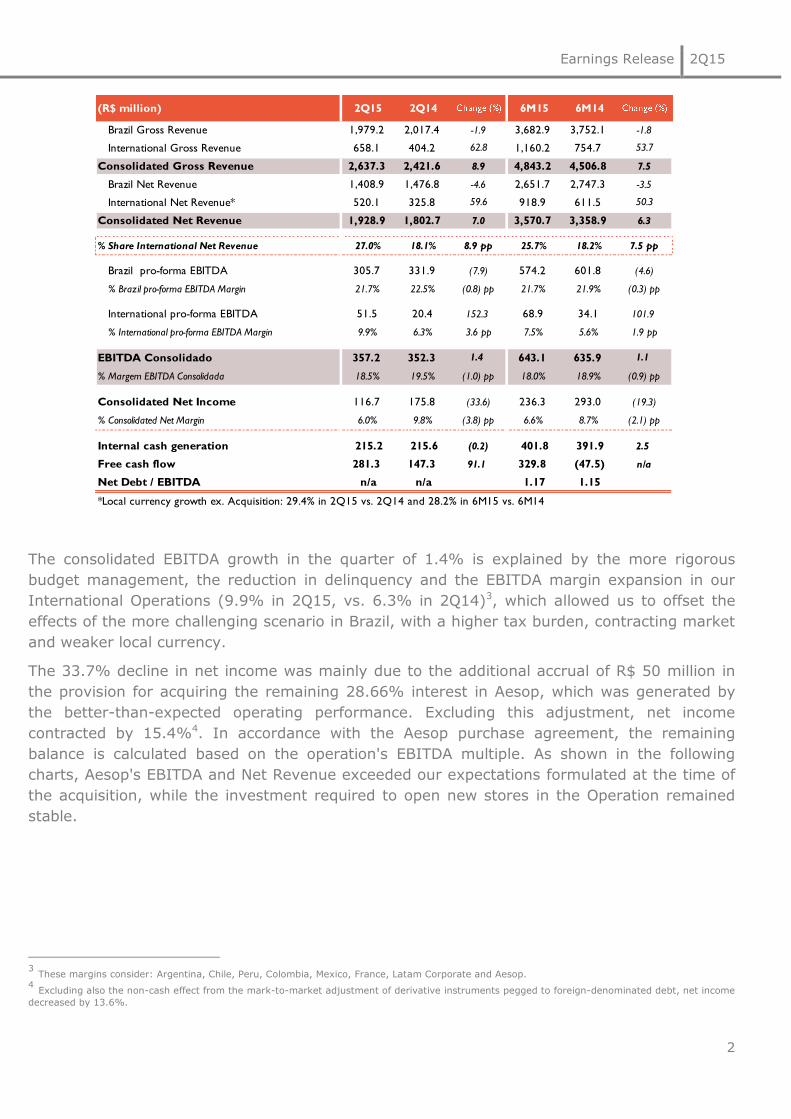
The consolidated EBITDA growth in the quarter of 1.4% is explained by the more rigorous
budget management, the reduction in delinquency and the EBITDA margin expansion in our
International Operations (9.9% in 2Q15, vs. 6.3% in 2Q14)3, which allowed us to offset the
effects of the more challenging scenario in Brazil, with a higher tax burden, contracting market
and weaker local currency.
The 33.7% decline in net income was mainly due to the additional accrual of R$ 50 million in
the provision for acquiring the remaining 28.66% interest in Aesop, which was generated by
the better-than-expected operating performance. Excluding this adjustment, net income
contracted by 15.4%4. In accordance with the Aesop purchase agreement, the remaining
balance is calculated based on the operation's EBITDA multiple. As shown in the following
charts, Aesop's EBITDA and Net Revenue exceeded our expectations formulated at the time of
the acquisition, while the investment required to open new stores in the Operation remained
stable.
3 These margins consider: Argentina, Chile, Peru, Colombia, Mexico, France, Latam Corporate and Aesop. 4 Excluding also the non-cash effect from the mark-to-market adjustment of derivative instruments pegged to foreign-denominated debt, net income
decreased by 13.6%.
(R$ million) 2Q15 2Q14 6M15 6M14
Brazil Gross Revenue 1,979.2 2,017.4 -1.9 3,682.9 3,752.1 -1.8
International Gross Revenue 658.1 404.2 62.8 1,160.2 754.7 53.7
Consolidated Gross Revenue 2,637.3 2,421.6 8.9 4,843.2 4,506.8 7.5
Brazil Net Revenue 1,408.9 1,476.8 -4.6 2,651.7 2,747.3 -3.5
International Net Revenue* 520.1 325.8 59.6 918.9 611.5 50.3
Consolidated Net Revenue 1,928.9 1,802.7 7.0 3,570.7 3,358.9 6.3
% Share International Net Revenue 27.0% 18.1% 8.9 pp 25.7% 18.2% 7.5 pp
Brazil pro-forma EBITDA 305.7 331.9 (7.9) 574.2 601.8 (4.6)
% Brazil pro-forma EBITDA Margin 21.7% 22.5% (0.8) pp 21.7% 21.9% (0.3) pp
International pro-forma EBITDA 51.5 20.4 152.3 68.9 34.1 101.9
% International pro-forma EBITDA Margin 9.9% 6.3% 3.6 pp 7.5% 5.6% 1.9 pp
EBITDA Consolidado 357.2 352.3 1.4 643.1 635.9 1.1
% Margem EBITDA Consolidada 18.5% 19.5% (1.0) pp 18.0% 18.9% (0.9) pp
Consolidated Net Income 116.7 175.8 (33.6) 236.3 293.0 (19.3)
% Consolidated Net Margin 6.0% 9.8% (3.8) pp 6.6% 8.7% (2.1) pp
Internal cash generation 215.2 215.6 (0.2) 401.8 391.9 2.5
Free cash flow 281.3 147.3 91.1 329.8 (47.5) n/a
Net Debt / EBITDA n/a n/a 1.17 1.15
*Local currency growth ex. Acquisition: 29.4% in 2Q15 vs. 2Q14 and 28.2% in 6M15 vs. 6M14

Earnings Release 2Q15
3
As we emphasized last quarter, capex and working capital are also priorities. In 6M15, we
reduced inventories in Brazil and Latam and optimized supplier payment terms, which
consequently reduced our working capital needs by R$69 million. This effect, combined with
the optimization of our capex (R$ 141 million in 6M15, vs. R$ 235 million in 6M14), contributed
to free cash flow of R$ 330 million, compared to cash burn of R$ 47 million in 6M14.
With regard to capex, as previously informed, in 2015 we should invest R$385 million,
allocated primarily to innovation, optimizing the business model in Brazil, in the International
Operations in information technology (SAP) and logistics.
Lastly, the Board of Directors, in a meeting held on July 22, 2015 approved Management's
proposal for the payment, on August 13, 2015, of dividends and interest on equity for the
period from January 1, 2015 to June 30, 2015, in the amounts of R$ 207.29 million and R$
29.04 million (R$ 24.68 million, net of withholding tax), respectively, with the aggregate
amount corresponding to 100% of net income and earnings per share of R$0.5391.
3141
55
94
131
64
86
106
0
20
40
60
80
100
120
140
2011 2012 2013 2014 2015
Net Revenue Historical Net Revenue Valuation Report
cagr 43%
Net RevenueAUD MM - Year-end in June
2,23,3
4,4
14,9
25,2
7,7
11,5
16,9
0
5
10
15
20
25
30
2011 2012 2013 2014 2015
Ebitda Historical Ebitda Valuation Report
cagr 84%
EbitdaAUD MM - Year-end in June
Earnings Release 2Q15
4
1. cosmetics, fragrance and toiletries industry (CFT)
With regard to the industry data from SIPATESP/ABHIPEC5, since 3Q14, certain relevant
companies have stopped reporting their information to the association, which could
significantly affect the quality of the data. For this reason, we have opted not to report this
information until the situation normalizes.
2. social and environmental highlights
A fundamental part of the strategy for our Sustainability Vision 2050, over the past few
months, we have expanded our operations in the Amazon by fostering an economy based on
the sustainable use of the region's products and services.
For the production of the line Natura EKOS Ucuuba, as commented above, the use of this
seed as a cosmetics ingredient fosters sustainable forest stewardship and prevents
deforestation. Every year, the income earned by a community from a protected tree is three
times higher than that obtained from its commercial use as timber. While the tree is cut
down only once, the fruits are harvested for at least ten years, transforming ucuuba into a
prized species.
In May, the Ecoparque industrial complex in Benevides, Pará, which currently houses our
soap production, welcomed its first partner company, the fragrance producer Symrise.
Launched in 2014, Ecoparque aims to create an integrated production chain in which the
inputs produced or discarded by one company can be used as production inputs by other
companies.
Natura and Coca-Cola Brazil, with the technical support of Ipsos, developed the
Communities Social Progress Index (SPI), an unprecedented tool for the social mapping of
communities in the Brazilian Amazon. The index, which measures socio-environmental
development, was created and implemented based on the methodology of the Social
Progress Index developed by U.S. economist Michael Porter and by AVINA6.
The region chosen for the mapping was Médio Juruá, which comprises over 50 riverside
communities and is already supported by projects from Natura and Coca-Cola Brazil that
foster sustainable supply chains for active ingredients derived from local biodiversity.
Lastly, Natura was included in the Euronext Vigeo – Emerging Markets 70, a stock index that
tracks the performance of 70 emerging market companies that have attained the highest
standards of Environmental, Social and Corporate Governance performance, in accordance
with the criteria established and analyzed by Vigeo.
5 Sipatesp/Abihpec: São Paulo State Perfumery and Toiletries Association / Brazilian Cosmetics, Fragrances and Toiletries Industry Association. 6 Avina was founded in 1994 by Swiss entrepreneur Stephan Schmidheiny, who inspired the vision and values that guide the organization. Fundación
Avina receives financial support from VIVA Trust, an endowment created by Mr. Schmidheiny to foster sustainable development through alliances
between successful and responsible private businesses and philanthropic organizations, promoting leadership and innovation.
http://www.avina.net/por/sobre-avina/que-hacemos/#1
Earnings Release 2Q15
5
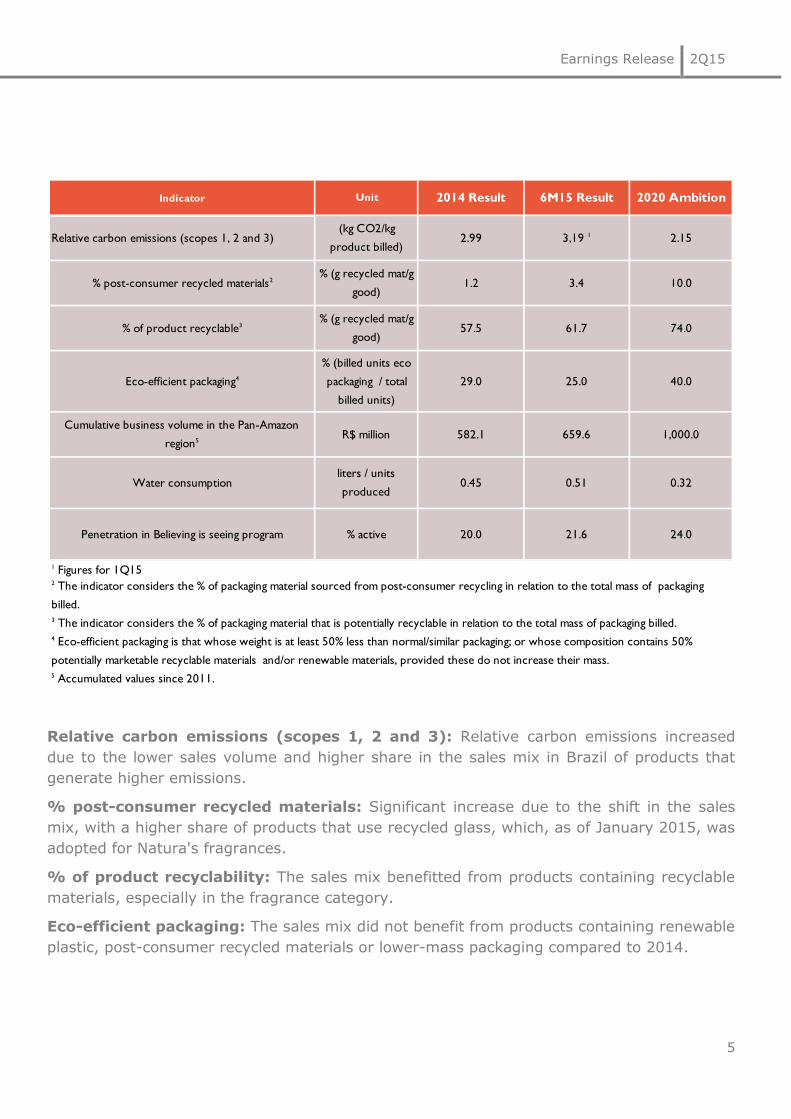
Relative carbon emissions (scopes 1, 2 and 3): Relative carbon emissions increased
due to the lower sales volume and higher share in the sales mix in Brazil of products that
generate higher emissions.
% post-consumer recycled materials: Significant increase due to the shift in the sales
mix, with a higher share of products that use recycled glass, which, as of January 2015, was
adopted for Natura's fragrances.
% of product recyclability: The sales mix benefitted from products containing recyclable
materials, especially in the fragrance category.
Eco-efficient packaging: The sales mix did not benefit from products containing renewable
plastic, post-consumer recycled materials or lower-mass packaging compared to 2014.
Indicator
1 Figures for 1Q15
3 The indicator considers the % of packaging material that is potentially recyclable in relation to the total mass of packaging billed.
5 Accumulated values since 2011.
2020 Ambition
2.15
10.0
74.0
40.0
1,000.0
0.32
24.0
2014 Result
2.99
1.2
57.5
29.0
% post-consumer recycled materials2% (g recycled mat/g
good)
% of product recyclable3% (g recycled mat/g
good)
Eco-efficient packaging4
% (billed units eco
packaging / total
billed units)
Cumulative business volume in the Pan-Amazon
region5R$ million
Unit
Relative carbon emissions (scopes 1, 2 and 3)(kg CO2/kg
product billed)
6M15 Result
3,19 1
582.1 659.6
25.0
3.4
61.7
Water consumptionliters / units
produced0.45 0.51
Penetration in Believing is seeing program % active 20.0 21.6
2 The indicator considers the % of packaging material sourced from post-consumer recycling in relation to the total mass of packaging
billed.
4 Eco-efficient packaging is that whose weight is at least 50% less than normal/similar packaging; or whose composition contains 50%
potentially marketable recyclable materials and/or renewable materials, provided these do not increase their mass.

Earnings Release 2Q15
6
Cumulative business volume in the Pan-Amazon region: The result was in line with the
expectations of input purchases from the Amazon region and the investments in Ecoparque.
Relative water consumption: The adjustment in industrial processes to meet market
demand led to higher water consumption at the Cajamar site.
Funding for Crer para Ver (Education) program: The result remains consistent with the
portfolio strategy formulated in 2014, showing the high leverage attained in relation to the
first six months of 2014.

Earnings Release 2Q15
7
3. economic performance789
Starting this quarter, we changed the reporting of business segmentation by adopting a new
format that is more compatible with the maturity of each segment.
Until March 31, 2015, the reporting date of the last interim financial information, the
segments were divided as follows: Brazil (“Brazil Operation”), Latin America (“LATAM”) and
other countries (“Other”), the latter including operations in France, Latam Corporate and
Emeis Holding Pty Ltd (“Aesop”). In addition, LATAM was analyzed in two groups:
(a) Argentina, Chile and Peru (“Operations in Consolidation”); and (b) Mexico and Colombia
(“Operations in Implementation”).
As from the disclosure of the interim information on June 30, 2015, the Company will adopt
the following business segmentation: Brazil (“Brazil Operation”), Latin America (“LATAM
Operation,” including LATAM Corporate), Aesop (including the results of Holdings Natura
Brasil Pty Ltd. and Natura Cosmetics Australia Pty Ltd.) and France (“France Operation”).
The historical data series since 2011 is available in the new format at the following link:
http://natu.infoinvest.com.br/enu/s-7-enu.html?idioma=enu
7 The above 2Q14 pro-forma Income Statement includes reclassifications mainly related to logistics expenses at the International Operations in order
to improve comparisons with 2Q15. These djustments do not impact the figures for Consolidated EBITDA and Consolidated Net Income previously
reported. 8 Consolidated figures include Brazil, Aesop, Latam and France.
9 Position at the end of Cycle 8 in Brazil and Latam and of Cycle 6 in France.
Quarter Pro-Forma Pro-Forma
(R$ million) Consolidated8
Brazil Latam Aesop Novos Negócios
2Q15 2Q14 Change% 2Q15 2Q14 Change% 2Q15 2Q14 Change% 2Q15 2Q14 Change%
Total Consultants - end of period ('000)9 1,810.6 1,699.0 6.6 1,344.4 1,300.7 3.4 465.1 396.7 17.2 - - n/a
Total Consultants - average of period ('000) 1,781.4 1,692.0 5.3 1,326.8 1,303.2 1.8 453.4 387.2 17.1 - - n/a
Units sold – items for resale 120.3 131.6 (8.6) 94.8 111.5 (15.0) 24.5 19.0 29.3 0.9 0.8 9.7
Gross Revenue 2,637.3 2,421.6 8.9 1,979.2 2,017.4 (1.9) 561.6 343.8 63.4 91.8 56.1 63.7
Net Revenue 1,928.9 1,802.7 7.0 1,408.9 1,476.8 (4.6) 431.7 271.0 59.3 84.5 51.3 64.7
Gross Profit 1,339.2 1,235.2 8.4 963.6 992.1 (2.9) 297.2 191.0 55.6 75.5 44.8 68.6
Selling, Marketing and Logistics Expenses (745.8) (660.7) 12.9 (530.7) (517.4) 2.6 (199.2) (134.8) 47.8 (10.5) (4.6) 130.8
General and Administrative Expenses (298.8) (258.0) 15.8 (180.2) (177.0) 1.9 (59.7) (42.3) 41.1 (56.3) (36.0) 56.5
Other Operating Income / (Expenses), net 9.9 4.2 135.0 9.6 4.4 120.0 0.1 (0.2) n/a 0.2 0.1 221.1
Financial Income / (Expenses), net (129.1) (61.2) n/a (124.8) (59.0) 111.6 (4.7) (0.4) n/a 0.3 (1.8) n/a
Income Tax and Social Contribution (57.0) (78.4) (27.3) (38.4) (70.7) (45.7) (15.7) (5.1) n/a (3.0) (2.6) 15.9
Noncontrolling (1.7) (0.7) 146.5 0.0 0.0 0.0 0.0 0.0 0.0 (1.7) (0.7) 146.5
Net Income 116.7 175.8 (33.6) 99.2 172.5 (42.5) 18.0 8.1 121.9 4.4 (0.8) n/a
EBITDA* 357.2 352.3 1.4 305.7 331.9 (7.9) 42.8 16.4 160.9 13.3 7.7 73.3
Gross Margin 69.4% 68.5% 0.9 pp 68.4% 67.2% 1.2 pp 68.8% 70.4% (1.6) pp 89.3% 87.3% 2.0 pp
Selling, Marketing and Logistics Expenses/Net Revenue 38.7% 36.6% 2.0 pp 37.7% 35.0% 2.6 pp 46.1% 49.7% (3.6) pp 12.5% 8.9% 3.6 pp
Administrative, R&D, IT and Projects Expenses/Net Revenue 15.5% 14.3% 1.2 pp 12.8% 12.0% 0.8 pp 13.8% 15.6% (1.8) pp 66.6% 70.2% (3.5) pp
Net Margin 6.0% 9.8% (3.7) pp 7.0% 11.7% (4.6) pp 4.2% 3.0% 1.2 pp 5.3% (1.5)% 6.8 pp
EBITDA Margin 18.5% 19.5% (1.0) pp 21.7% 22.5% (0.8) pp 9.9% 6.0% 3.9 pp 15.7% 14.9% 0.8 pp
(*) EBITDA = Income from operations before financial effects + depreciation & amortization.
Earnings Release 2Q15
8
7 The above 6M14 pro-forma Income Statement includes reclassifications mainly related to logistics expenses at the International Operations in order
to improve comparisons with 6M15. These djustments do not impact the figures for Consolidated EBITDA and Consolidated Net Income previously
reported. 8 Consolidated figures include Brazil, Aesop, Latam and France.
9 Position at the end of Cycle 8 in Brazil and Latam and of Cycle 6 in France.
Year to date Pro-Forma Pro-Forma
(R$ million) Consolidated8
Brazil Latam Aesop Novos Negócios
6M15 6M14 Change% 6M15 6M14 Change% 6M15 6M14 Change% 6M15 6M14 Change%
Total Consultants - end of period ('000)9 1,810.6 1,699.0 6.6 1,344.4 1,300.7 3.4 465.1 396.7 17.2 - - n/a
Total Consultants - average of period ('000) 1,748.3 1,665.8 5.0 1,305.5 1,282.1 1.8 441.5 382.1 15.5 - - n/a
Units sold – items for resale 238.8 260.0 (8.2) 188.0 221.7 (15.2) 49.0 36.5 34.3 1.7 1.4 18.9
Gross Revenue 4,843.2 4,506.8 7.5 3,682.9 3,752.1 (1.8) 987.2 645.0 53.1 164.9 106.8 54.5
Net Revenue 3,570.7 3,358.9 6.3 2,651.7 2,747.3 (3.5) 761.5 507.9 49.9 150.7 97.6 54.4
Gross Profit 2,485.9 2,324.9 6.9 1,820.0 1,865.8 (2.5) 527.3 356.1 48.1 133.4 86.5 54.1
Selling, Marketing and Logistics Expenses (1,393.8) (1,263.3) 10.3 (1,006.3) (988.5) 1.8 (359.8) (255.5) 40.8 (18.2) (11.8) 54.3
Administrative, R&D, IT and Projects Expenses (577.2) (521.8) 10.6 (346.8) (366.2) (5.3) (119.1) (82.8) 43.9 (105.8) (67.7) 56.1
Other Operating Income / (Expenses), net 18.4 15.5 18.8 18.1 9.9 82.0 0.2 (0.8) n/a 0.1 6.3 n/a
Financial Income / (Expenses), net (183.8) (113.1) n/a (194.1) (110.9) n/a 7.4 (0.3) n/a 2.9 (1.9) n/a
Income Tax and Social Contribution (111.8) (135.5) (17.5) (81.6) (122.9) (33.6) (26.6) (9.8) 172.3 (3.7) (2.8) 31.4
Noncontrolling (1.3) (1.6) (19.3) 0.0 0.0 0.0 0.0 0.0 0.0 (1.3) (1.6) (19.3)
Net Income 236.3 293.0 (19.3) 209.4 287.3 (27.1) 29.4 7.0 320.4 7.4 6.9 n/a
EBITDA* 643.1 635.9 1.1 574.2 601.8 (4.6) 56.5 22.2 154.0 21.4 19.4 10.4
Gross Margin 69.6% 69.2% 0.4 pp 68.6% 67.9% 0.7 pp 69.2% 70.1% (0.9) pp 88.5% 88.7% (0.2) pp
Selling, Marketing and Logistics Expenses/Net Revenue 39.0% 37.6% 1.4 pp 37.9% 36.0% 2.0 pp 47.2% 50.3% (3.1) pp 12.1% 12.1% (0.0) pp
Administrative, R&D, IT and Projects Expenses/Net Revenue 16.2% 15.5% 0.6 pp 13.1% 13.3% (0.2) pp 15.6% 16.3% (0.7) pp 70.2% 69.4% 0.8 pp
Net Margin 6.6% 8.7% (2.1) pp 7.9% 10.5% (2.6) pp 3.9% 1.4% 2.5 pp 4.9% 7.1% (2.2) pp
EBITDA Margin 18.0% 18.9% (0.9) pp 21.7% 21.9% (0.3) pp 7.4% 4.4% 3.0 pp 14.2% 19.9% (5.7) pp
(*) EBITDA = Income from operations before financial effects + depreciation & amortization.
Earnings Release 2Q15
9
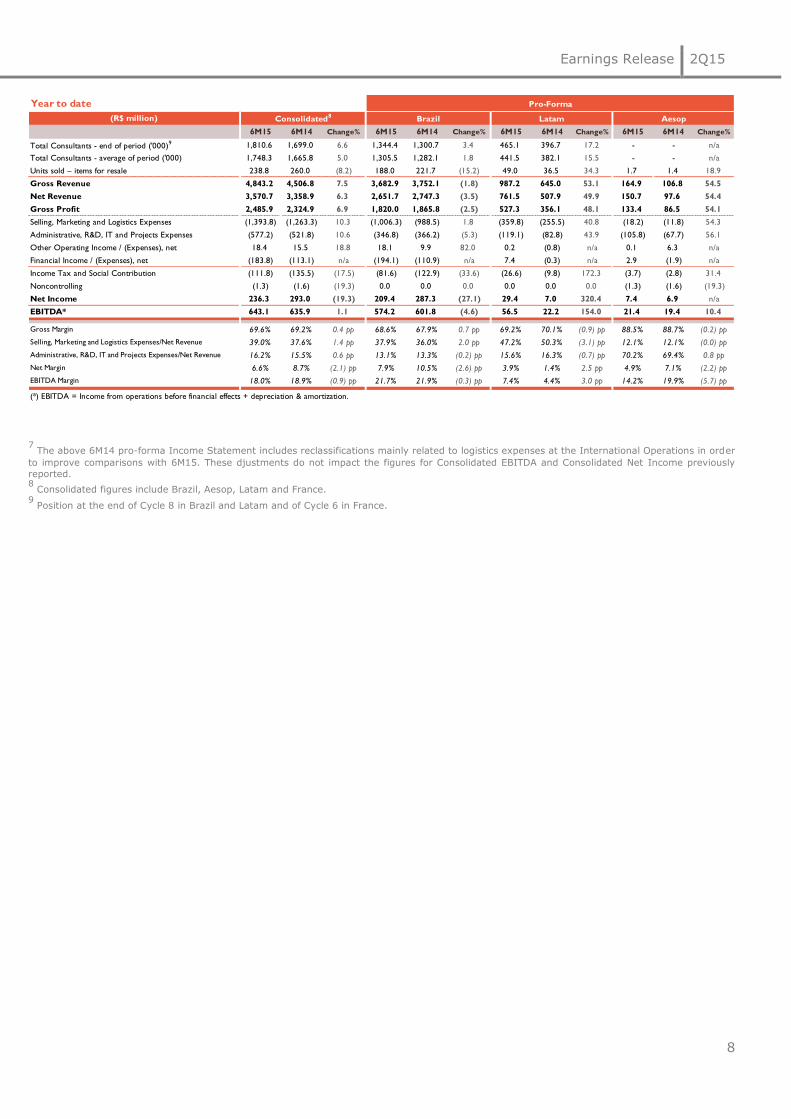
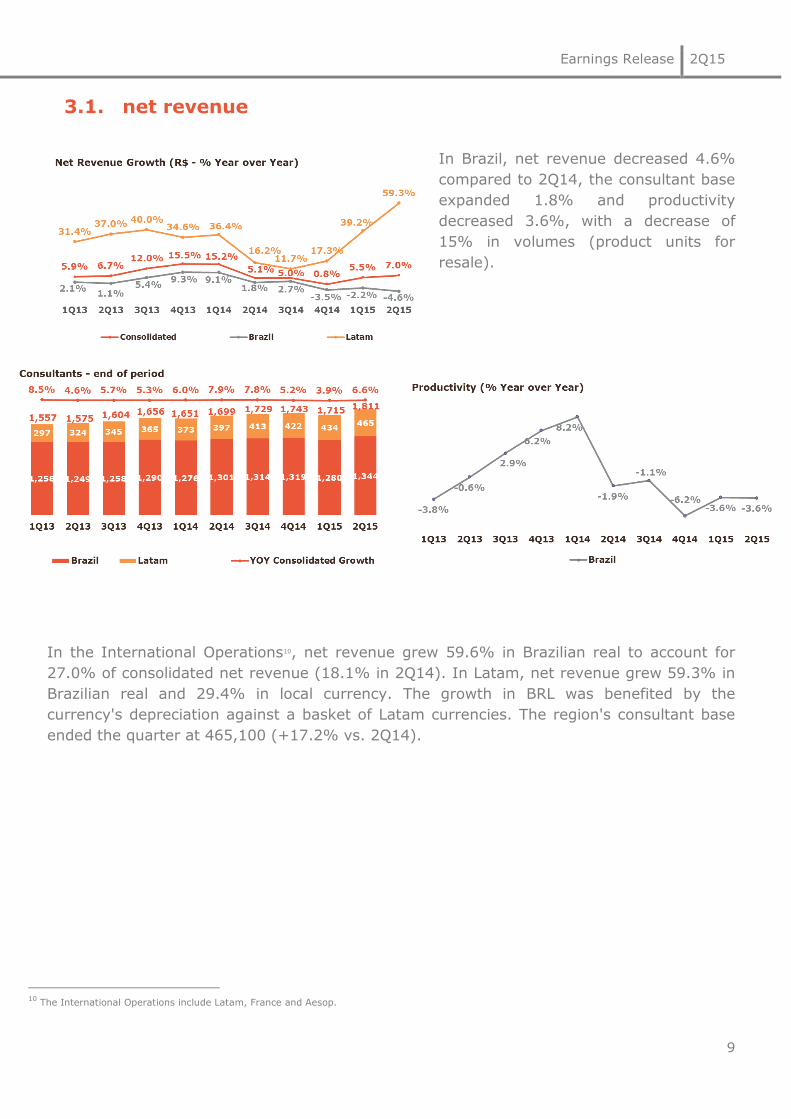
3.1. net revenue
In Brazil, net revenue decreased 4.6%
compared to 2Q14, the consultant base
expanded 1.8% and productivity
decreased 3.6%, with a decrease of
15% in volumes (product units for
resale).
In the International Operations10, net revenue grew 59.6% in Brazilian real to account for
27.0% of consolidated net revenue (18.1% in 2Q14). In Latam, net revenue grew 59.3% in
Brazilian real and 29.4% in local currency. The growth in BRL was benefited by the
currency's depreciation against a basket of Latam currencies. The region's consultant base
ended the quarter at 465,100 (+17.2% vs. 2Q14).
10
The International Operations include Latam, France and Aesop.
Earnings Release 2Q15
10
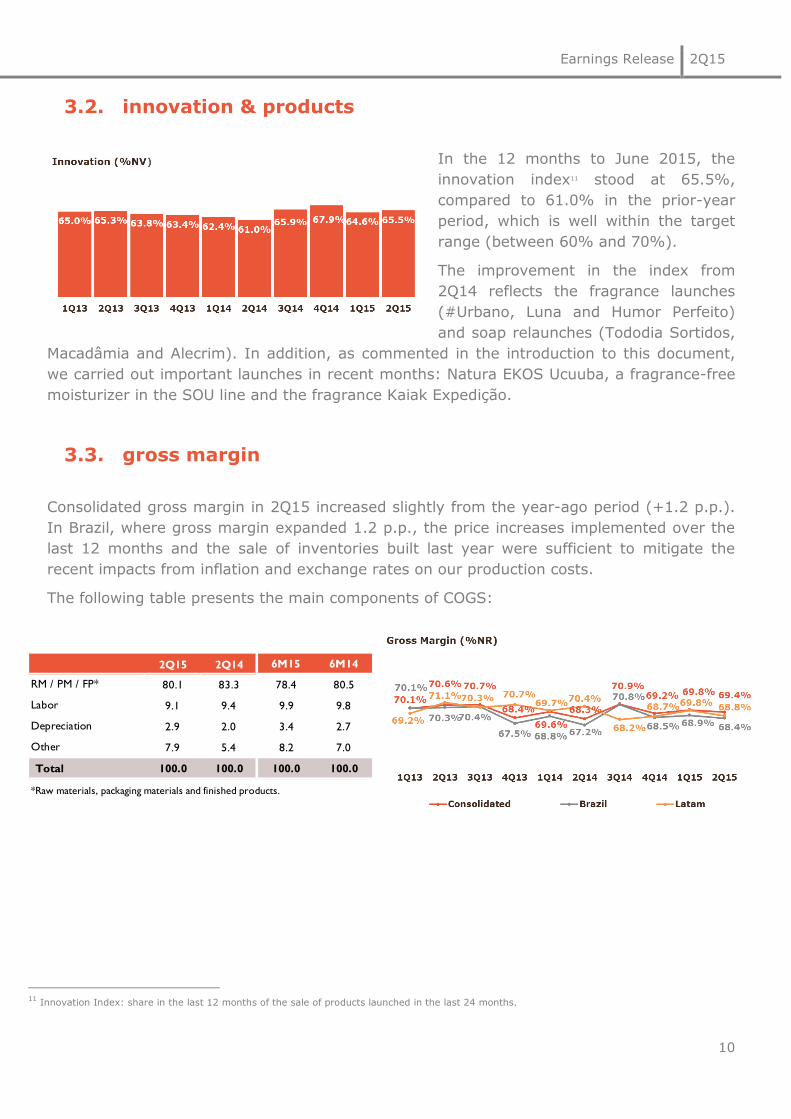
3.2. innovation & products
In the 12 months to June 2015, the
innovation index11 stood at 65.5%,
compared to 61.0% in the prior-year
period, which is well within the target
range (between 60% and 70%).
The improvement in the index from
2Q14 reflects the fragrance launches
(#Urbano, Luna and Humor Perfeito)
and soap relaunches (Tododia Sortidos,
Macadâmia and Alecrim). In addition, as commented in the introduction to this document,
we carried out important launches in recent months: Natura EKOS Ucuuba, a fragrance-free
moisturizer in the SOU line and the fragrance Kaiak Expedição.
3.3. gross margin
Consolidated gross margin in 2Q15 increased slightly from the year-ago period (+1.2 p.p.).
In Brazil, where gross margin expanded 1.2 p.p., the price increases implemented over the
last 12 months and the sale of inventories built last year were sufficient to mitigate the
recent impacts from inflation and exchange rates on our production costs.
The following table presents the main components of COGS:
11
Innovation Index: share in the last 12 months of the sale of products launched in the last 24 months.
2Q15 2Q14 6M15 6M14
80.1 83.3 78.4 80.5
9.1 9.4 9.9 9.8
2.9 2.0 3.4 2.7
7.9 5.4 8.2 7.0
Total 100.0 100.0 100.0 100.0
*Raw materials, packaging materials and finished products.
Depreciation
Other
RM / PM / FP*
Labor

Earnings Release 2Q15
11
3.4. operating expenses
In Brazil, the nominal increase (+2.6%
vs 2Q14) in selling, marketing and
logistics expenses lagged inflation in
the quarter. As a ratio of net revenue,
the increase in these expenses was due
to the weaker dilution of fixed costs
resulting from the contraction in
revenue.
In Latam, although the significant
investments in marketing were
maintained, the increase in this group
of expenses lagged revenue growth, accompanied by fixed cost dilution. In 2Q15, these
expenses increased 47.8%, with part of this growth associated with the impact from
exchange variation (BRL depreciation against a basket of Latam currencies).
In Brazil, administrative, R&D, IT
and project expenses posted a slight
nominal increase in the quarter (+1.9%
vs 2Q14), lagging inflation in the period
and reflecting our ongoing efforts to
capture efficiency and productivity
gains. The higher severance costs and
information systems were offset by the
streamlining of projects and the better
management of administrative
expenses.
In Latam, the increase in administrative expenses lagged revenue growth, which diluted
fixed costs and offset the high inflation in Argentina and the costs with implementing
information systems in the region's countries. In addition, part of this 41.1% growth is
associated with the impact from foreign exchange variation (BRL depreciation against a
basket of Latam currencies).
3.5. other operating income and expenses
In 2Q15, consolidated operating income came to R$ 9.9 million (R$4.2 million in 2Q14),
which was due to the reclassification of interest expenses on subsidized loans from financial
result (accounting pronouncement CPC 07), which is a positive impact, and to the expense
Earnings Release 2Q15
12
of R$4.6 million from the allocation of the operating result of the “Crer para Ver” program to
the Natura Institute.
3.6. other international investments 2.
Starting this quarter, the Company changed the reporting of its business segmentation.
The details previously presented in this chapter (Aesop, Latam Corporate and France) are
reported separately on page 13 and 14 and/or in the financial statements for the fiscal year.
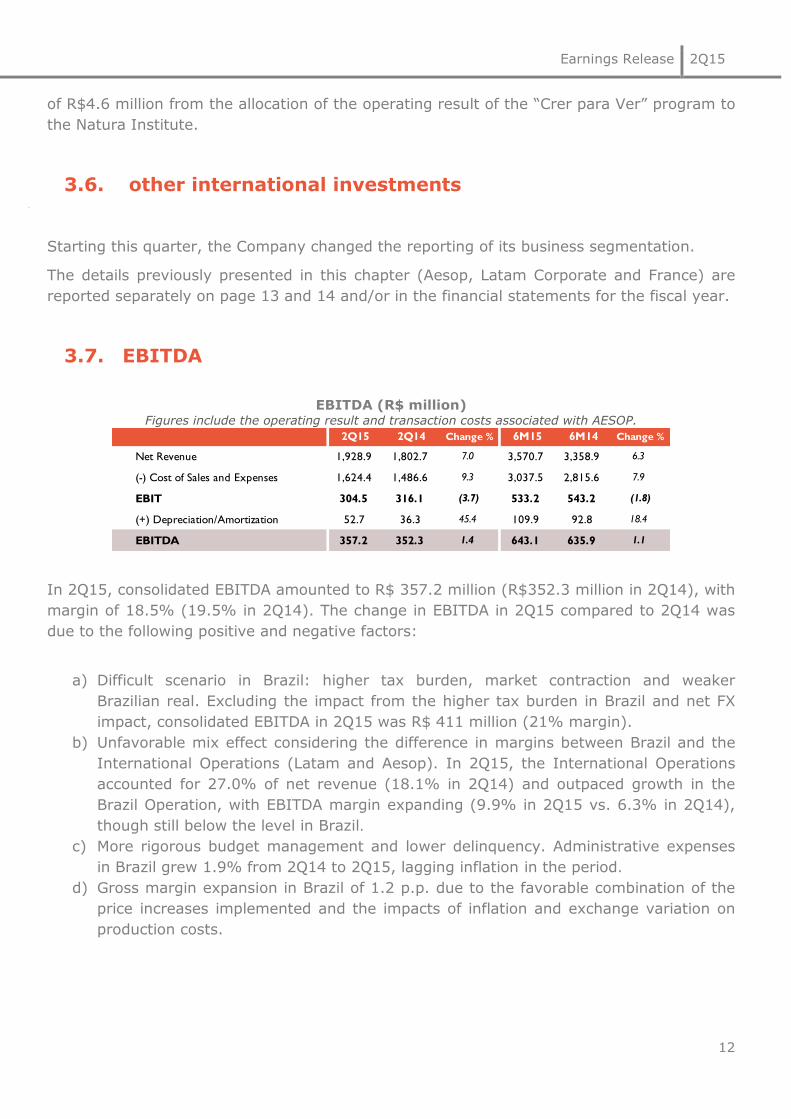
3.7. EBITDA
EBITDA (R$ million) Figures include the operating result and transaction costs associated with AESOP.
In 2Q15, consolidated EBITDA amounted to R$ 357.2 million (R$352.3 million in 2Q14), with
margin of 18.5% (19.5% in 2Q14). The change in EBITDA in 2Q15 compared to 2Q14 was
due to the following positive and negative factors:
a) Difficult scenario in Brazil: higher tax burden, market contraction and weaker
Brazilian real. Excluding the impact from the higher tax burden in Brazil and net FX
impact, consolidated EBITDA in 2Q15 was R$ 411 million (21% margin).
b) Unfavorable mix effect considering the difference in margins between Brazil and the
International Operations (Latam and Aesop). In 2Q15, the International Operations
accounted for 27.0% of net revenue (18.1% in 2Q14) and outpaced growth in the
Brazil Operation, with EBITDA margin expanding (9.9% in 2Q15 vs. 6.3% in 2Q14),
though still below the level in Brazil.
c) More rigorous budget management and lower delinquency. Administrative expenses
in Brazil grew 1.9% from 2Q14 to 2Q15, lagging inflation in the period.
d) Gross margin expansion in Brazil of 1.2 p.p. due to the favorable combination of the
price increases implemented and the impacts of inflation and exchange variation on
production costs.
2Q15 2Q14 Change % 6M15 6M14 Change %
Net Revenue 1,928.9 1,802.7 7.0 3,570.7 3,358.9 6.3
(-) Cost of Sales and Expenses 1,624.4 1,486.6 9.3 3,037.5 2,815.6 7.9
EBIT 304.5 316.1 (3.7) 533.2 543.2 (1.8)
(+) Depreciation/Amortization 52.7 36.3 45.4 109.9 92.8 18.4
EBITDA 357.2 352.3 1.4 643.1 635.9 1.1

Earnings Release 2Q15
13
3.8. net income
In 2Q15, consolidated net income
decreased 33.7% and net margin
decreased to 6.0%, compared to 9.8%
in 2Q14. This result mainly reflects the
negative impact from the accrual in the
provision for the acquisition of the
remaining 28.66% interest in Aesop12.
Excluding this accrual, net income
contracted by 15.4%. The remaining
18.3% is explained primarily by the impact from higher interest rates on our debt, the
higher average debt balance and the non-cash effect from the mark-to-market adjustment
of derivative instruments pegged to foreign-denominated debt.
Excluding also the non-cash effect from the mark-to-market adjustment of derivative
instruments pegged to foreign-denominated debt, net income decreased by 13.6%.
12
Refers to the restatement in the amount of R$50.1 million related to the provision for the acquisition of non-controlling interests, in accordance
with Note 19(a) to the 2Q15 Financial Statements.
(R$ million) 2Q15 2Q14 Change R$ 6M15 6M14 Change R$
Financial Income/ (Expenses), net (129.1) (61.2) (68.0) (183.8) (113.1) (70.7)
Mark-to-Market adjustment 7.3 13.7 (6.5) 17.6 13.4 4.2
Financial Income/ (Expenses) ex. Mark-to-Market, net (136.4) (74.9) (61.5) (201.3) (126.5) (74.9)

Earnings Release 2Q15
14
3.9. cash flow
As mentioned above, free cash flow generation improved significantly due to the decrease
in working capital in 2Q15 and to the reduction in the allocation to capex (R$ 90.8 million in
2Q15 vs. R$ 100.7 million in 2Q14).
For 2015, we are maintaining our capex projection of R$ 385 million, with investments
concentrated on optimizing the business model and, in Latin America, on expanding
information technology (SAP) and logistics.
Favorable/ (unfavorable)
R$ million 2Q15 2Q14Change
R$
Change
%6M15 6M14
Change
R$
Change
%
Net Income* 116.7 175.8 (59.2) (33.6) 236.3 293.0 (56.7) (19.3)
Depreciation and amortization 52.7 36.3 16.5 45.4 109.9 92.8 17.1 18.4
Non-cash / Other** 45.8 3.5 42.3 1,224.6 55.6 6.2 49.4 802.9
Internal cash generation 215.2 215.6 (0.4) (0.2) 401.8 391.9 9.9 2.5
Working Capital (Increase)/Decrease 156.9 32.4 124.5 384.4 68.9 (204.3) 273.2 (133.7)
Operating cash generation 372.1 248.0 124.2 50.1 470.7 187.7 283.1 150.8
CAPEX (90.8) (100.7) 9.9 (9.9) (140.9) (235.2) 94.2 (40.1)
Free cash flow*** 281.3 147.3 134.1 91.1 329.8 (47.5) 377.3 (793.7)
(***) (Internal cash generation) +/- (changes in working capital and long-term assets and liabilities) – (acquisitions of property, plant, and equipment).
(**) Some 2014 figures were adjusted for proper disclosure
(*) Net income attributable to owners of the Company
Earnings Release 2Q15
15
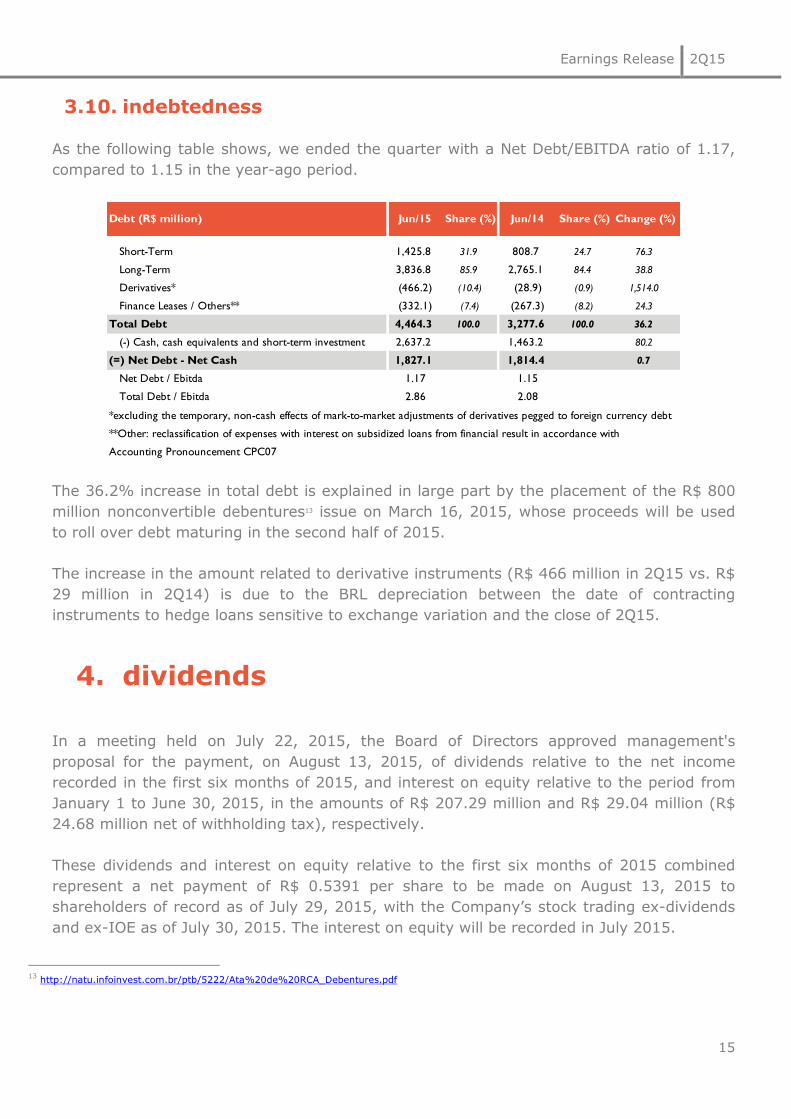
3.10. indebtedness
As the following table shows, we ended the quarter with a Net Debt/EBITDA ratio of 1.17,
compared to 1.15 in the year-ago period.
The 36.2% increase in total debt is explained in large part by the placement of the R$ 800
million nonconvertible debentures13 issue on March 16, 2015, whose proceeds will be used
to roll over debt maturing in the second half of 2015.
The increase in the amount related to derivative instruments (R$ 466 million in 2Q15 vs. R$
29 million in 2Q14) is due to the BRL depreciation between the date of contracting
instruments to hedge loans sensitive to exchange variation and the close of 2Q15.
4. dividends1415
In a meeting held on July 22, 2015, the Board of Directors approved management's
proposal for the payment, on August 13, 2015, of dividends relative to the net income
recorded in the first six months of 2015, and interest on equity relative to the period from
January 1 to June 30, 2015, in the amounts of R$ 207.29 million and R$ 29.04 million (R$
24.68 million net of withholding tax), respectively.
These dividends and interest on equity relative to the first six months of 2015 combined
represent a net payment of R$ 0.5391 per share to be made on August 13, 2015 to
shareholders of record as of July 29, 2015, with the Company’s stock trading ex-dividends
and ex-IOE as of July 30, 2015. The interest on equity will be recorded in July 2015.
13
http://natu.infoinvest.com.br/ptb/5222/Ata%20de%20RCA_Debentures.pdf
Debt (R$ million) Jun/15 Share (%) Jun/14 Share (%) Change (%)
Short-Term 1,425.8 31.9 808.7 24.7 76.3
Long-Term 3,836.8 85.9 2,765.1 84.4 38.8
Derivatives* (466.2) (10.4) (28.9) (0.9) 1,514.0
Finance Leases / Others** (332.1) (7.4) (267.3) (8.2) 24.3
Total Debt 4,464.3 100.0 3,277.6 100.0 36.2
(-) Cash, cash equivalents and short-term investment 2,637.2 1,463.2 80.2
(=) Net Debt - Net Cash 1,827.1 1,814.4 0.7
Net Debt / Ebitda 1.17 1.15
Total Debt / Ebitda 2.86 2.08
*excluding the temporary, non-cash effects of mark-to-market adjustments of derivatives pegged to foreign currency debt
**Other: reclassification of expenses with interest on subsidized loans from financial result in accordance with
Accounting Pronouncement CPC07

Earnings Release 2Q15
16
5. stock performance
In 2Q15, the price of Natura stock declined by 12.5% from December 31, 2014, while the
Bovespa Index (Ibovespa) rose 4.7%. Average daily trading volume in 2Q15 was R$32.8
million, compared to R$51.7 million in the prior-year period.
In the same period, our average ranking in the Bovespa Liquidity Index was 49th.
The following chart shows the performance of Natura stock since its IPO:

Earnings Release 2Q15
17
conference call & webcast
PORTUGUESE: Thursday, July 23, 2015
10:00 a.m. (Brasília time)
ENGLISH: Thursday, July 23, 2015
10:00 a.m. (Brasília time) (translation from Portuguese)
From Brazil: +55 11 3193 1001 /+55 11 2820 4001
From the USA: Toll Free +1 888 700 0802
From other countries: +1 786 924 6977
Code: Natura
Live webcast:
www.natura.net/investidor
investor relations
Tel: +55 (11) 4571-7786
Fabio Cefaly, [email protected]
Tatiana Carvalho, [email protected]
Francisco Petroni, [email protected]
Julia Villas Bôas, [email protected]
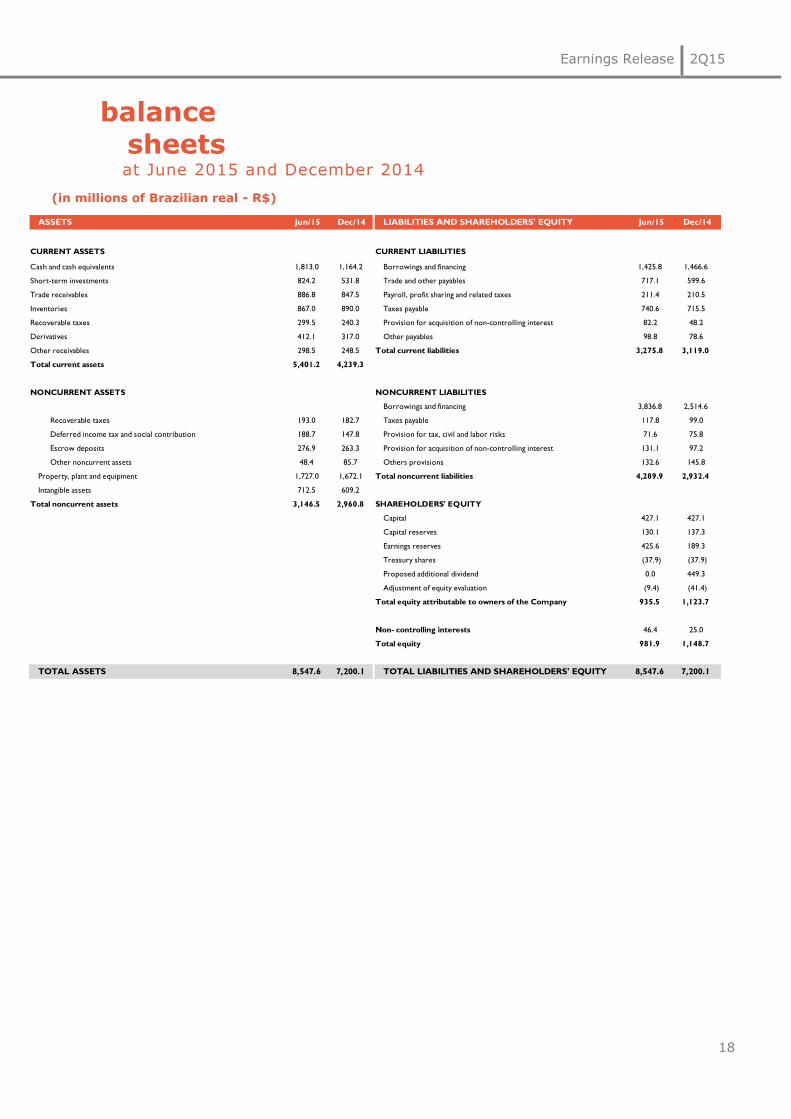
Earnings Release 2Q15
18
balance sheets
at June 2015 and December 2014 (in millions of Brazilian real - R$)
ASSETS Jun/15 Dec/14 LIABILITIES AND SHAREHOLDERS' EQUITY Jun/15 Dec/14
CURRENT ASSETS CURRENT LIABILITIES
Cash and cash equivalents 1,813.0 1,164.2 Borrowings and financing 1,425.8 1,466.6
Short-term investments 824.2 531.8 Trade and other payables 717.1 599.6
Trade receivables 886.8 847.5 Payroll, profit sharing and related taxes 211.4 210.5
Inventories 867.0 890.0 Taxes payable 740.6 715.5
Recoverable taxes 299.5 240.3 Provision for acquisition of non-controlling interest 82.2 48.2
Derivatives 412.1 317.0 Other payables 98.8 78.6
Other receivables 298.5 248.5 Total current liabilities 3,275.8 3,119.0
Total current assets 5,401.2 4,239.3
NONCURRENT ASSETS NONCURRENT LIABILITIES
Borrowings and financing 3,836.8 2,514.6
Recoverable taxes 193.0 182.7 Taxes payable 117.8 99.0
Deferred income tax and social contribution 188.7 147.8 Provision for tax, civil and labor risks 71.6 75.8
Escrow deposits 276.9 263.3 Provision for acquisition of non-controlling interest 131.1 97.2
Other noncurrent assets 48.4 85.7 Others provisions 132.6 145.8
Property, plant and equipment 1,727.0 1,672.1 Total noncurrent liabilities 4,289.9 2,932.4
Intangible assets 712.5 609.2
Total noncurrent assets 3,146.5 2,960.8 SHAREHOLDERS' EQUITY
Capital 427.1 427.1
Capital reserves 130.1 137.3
Earnings reserves 425.6 189.3
Treasury shares (37.9) (37.9)
Proposed additional dividend 0.0 449.3
Adjustment of equity evaluation (9.4) (41.4)
Total equity attributable to owners of the Company 935.5 1,123.7
Non- controlling interests 46.4 25.0
Total equity 981.9 1,148.7
TOTAL ASSETS 8,547.6 7,200.1 TOTAL LIABILITIES AND SHAREHOLDERS' EQUITY 8,547.6 7,200.1

Earnings Release 2Q15
19
cash flow statement for the 3 and 6 months period ended in June 30th, 2015 and 2014
Consolidated (R$ million) 2Q15 2Q14 6M15 6M14
NET REVENUE 1,928.9 1,802.7 3,570.7 3,358.9
Cost of sales (589.7) (567.5) (1,084.8) (1,034.0)
GROSS PROFIT 1,339.2 1,235.2 2,485.9 2,324.9
OPERATING (EXPENSES) INCOME
Selling expenses (745.8) (660.2) (1,393.8) (1,263.0)
General and administrative expenses (298.8) (263.2) (577.2) (534.3)
Other operating (expenses) income, net 9.9 4.3 18.4 15.6
Financial income 305.4 54.2 934.5 325.4
Financial expenses (434.5) (115.4) (1,118.3) (438.5)
Income tax and social contribution (57.0) (78.4) (111.8) (135.5)
Owners of the Company 116.7 175.8 236.3 293.0
Noncontrolling 1.7 0.7 1.3 1.6
118.4 176.5 237.6 294.6
543.2INCOME FROM OPERATIONS BEFORE
FINANCIAL INCOME (EXPENSES)
237.6 294.6
349.5 430.1
ATTRIBUTABLE TO
533.2
NET INCOME BEFORE NON-CONTROLLING
INTEREST118.4 176.5
175.4 254.9INCOME BEFORE INCOME TAX AND SOCIAL
CONTRIBUTION
304.5 316.1

Earnings Release 2Q15
20
income statement
for the 6 months period ended in June 30th, 2015 and 2014
Consolidated (R$ million) 6M15 6M14
CASH FLOW FROM OPERATING ACTIVITIES
Net income 237.6 294.6
Depreciation and amortization 109.9 92.8
Provision (reversal ) for losses on swap and forward transactions (315.1) 193.6
Provision (reversal) for tax, civil and labor contingencies (0.9) 7.8
Monetary restatement of escrow deposits (9.8) (13.0)
Income tax and social contribution 111.8 135.5
(Gain) loss on sale on property, plant and equipment and intangible assets (1.2) 29.3
Interest and exchange rate changes on borrowings and financing and other liabilities 425.3 (109.7)
Exchange rate changes on other assets and other liabilities 9.5 (39.0)
Provision ( reversal) related to the grant of options to purchase shares (7.2) 4.0
Provision (reversal ) for losses on inventories (0.7) 0.0
Allowance for inventory losses (0.2) (9.3)
Net income attributable to non-controlling shareholders (1.3) (1.6)
Provision of health care plan and carbon credits 2.0 2.4
Recognition of untimely used tax credits 0.0 (13.5)
Provision for acquisition of non-controlling interest 67.8 6.4
Provision ( reversal) for doubtful accounts (14.9) 16.3
612.6 596.7
(INCREASE) DECREASE IN ASSETS
Trade receivables (24.5) 31.5
Inventories 23.2 (139.1)
Recoverable taxes (69.5) (4.9)
Other receivables (1.1) 25.6
Subtotal (72.0) (86.9)
INCREASE (DECREASE) IN LIABILITIES
Domestic and foreign suppliers 119.2 (43.5)
Payroll, profit sharing and related taxes, net 0.9 5.8
Taxes payable (82.5) (33.0)
Other payables 4.4 (22.3)
Provision for tax, civil and labor contingencies (3.3) (3.2)
Subtotal 38.7 (96.2)
CASH GENERATED BY OPERATING ACTIVITIES 579.4 413.6
Adjustments to reconcile net income to net cash provided by operating
activities:
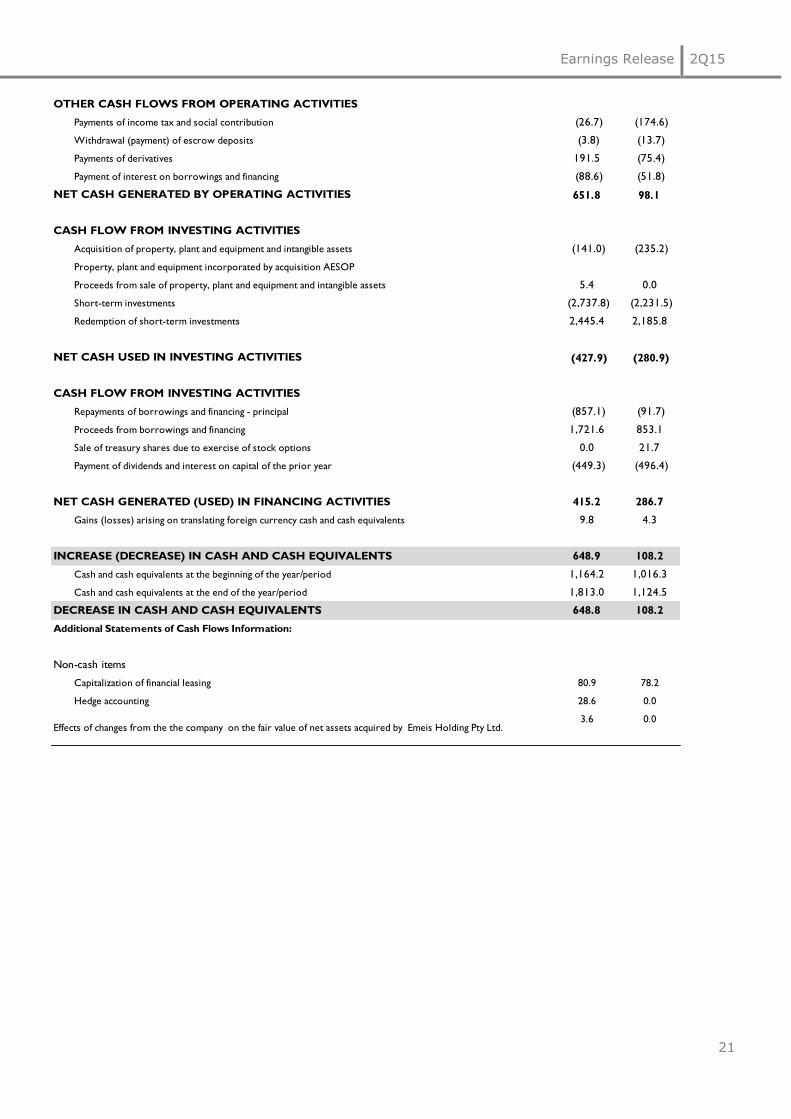
Earnings Release 2Q15
21
OTHER CASH FLOWS FROM OPERATING ACTIVITIES
Payments of income tax and social contribution (26.7) (174.6)
Withdrawal (payment) of escrow deposits (3.8) (13.7)
Payments of derivatives 191.5 (75.4)
Payment of interest on borrowings and financing (88.6) (51.8)
NET CASH GENERATED BY OPERATING ACTIVITIES 651.8 98.1
CASH FLOW FROM INVESTING ACTIVITIES
Acquisition of property, plant and equipment and intangible assets (141.0) (235.2)
Property, plant and equipment incorporated by acquisition AESOP
Proceeds from sale of property, plant and equipment and intangible assets 5.4 0.0
Short-term investments (2,737.8) (2,231.5)
Redemption of short-term investments 2,445.4 2,185.8
NET CASH USED IN INVESTING ACTIVITIES (427.9) (280.9)
CASH FLOW FROM INVESTING ACTIVITIES
Repayments of borrowings and financing - principal (857.1) (91.7)
Proceeds from borrowings and financing 1,721.6 853.1
Sale of treasury shares due to exercise of stock options 0.0 21.7
Payment of dividends and interest on capital of the prior year (449.3) (496.4)
NET CASH GENERATED (USED) IN FINANCING ACTIVITIES 415.2 286.7
Gains (losses) arising on translating foreign currency cash and cash equivalents 9.8 4.3
INCREASE (DECREASE) IN CASH AND CASH EQUIVALENTS 648.9 108.2
Cash and cash equivalents at the beginning of the year/period 1,164.2 1,016.3
Cash and cash equivalents at the end of the year/period 1,813.0 1,124.5
DECREASE IN CASH AND CASH EQUIVALENTS 648.8 108.2
Additional Statements of Cash Flows Information:
Non-cash items
Capitalization of financial leasing 80.9 78.2
Hedge accounting 28.6 0.0
3.6 0.0Effects of changes from the the company on the fair value of net assets acquired by Emeis Holding Pty Ltd.

Earnings Release 2Q15
22
glossary
_CDI: the overnight rate for interbank deposits.
_Natura Consultants (CN): self-employed resellers who do not have a formal labor relationship with Natura.
_Natura Consultant Advisors (CNO): self-employed resellers who do not have a formal labor relationship with Natura and
support the Relationship Managers in their activities.
_Supplier Communities: the communities of people involved in small–scale farming and extraction activities in a variety of
locations in Brazil, especially in the Amazon Region, who extract the inputs used in our products from the social and
biodiversity. We form production chains with these communities that are based on fair prices, the sharing of benefits gained
from access to the genetic heritage and associated traditional knowledge and support for local sustainable development
projects. This business model has proven effective in generating social, economic and environmental value for Natura and for
the communities.
_GHG: Greenhouse gases.
_Innovation Index: Share in the last 12 months of the sale of products launched in the last 24 months.
_Natura Institute: is a nonprofit organization created in 2010 to strengthen and expand our Private Social Investment
initiatives. The institute has enabled us to leverage our efforts and investments in actions that contribute to the quality of
public education.
_Target Market: refers to the market share data published by SIPATESP/ABIHPEC. Considers only the segments in which
Natura operates. Excludes diapers, oral hygiene products, hair dyes, nail polish, feminine hygiene products as well as other
products.
_Profit Sharing: the share of profit allocated to employees under the profit-sharing program.
_Natura Crer Para Ver Program: special line of non-cosmetic products whose profits are transferred to the Natura Institute,
in Brazil, and invested by Natura in social initiatives in the other countries where we operate. Our consultants promote these
sales to benefit society and do not obtain any gains.
_Sustainable Relations Network: sales model adopted in Mexico that features eight stages in a consultant’s development:
Natura Consultant, Entrepreneurial Natura Consultant, Natura Developer 1 and 2, Natura Transformer 1 and 2, Natura Inspirer
and Natura Associate. To rise up through the various stages, consultants must fulfill certain criteria based on sales volume,
attracting new consultants and (unlike the models adopted in other countries) personal development and social and
environmental relationships in the community.
_Benefit Sharing: in accordance with Natura’s Policy for the Sustainable Use of Biodiversity and Associated Traditional
Knowledge, benefits are shared whenever we perceive various forms of value in the access gained. Therefore, one of the
practices that define the way in which these resources are divided is to associate payments with the number of raw materials
produced from each plant as well as the commercial success of the products in which these raw materials are used.
_Sipatesp/Abihpec: São Paulo State Perfumery and Toiletries Association / Brazilian Cosmetics, Fragrances and Toiletries
Industry Association.
restated figures
_Pro-forma Income Statements for 2Q14 and 6M14: includes reclassifications mainly related to logistics expenses at the
International Operations in order to improve comparisons with 2Q15 and 6M15. These djustments do not impact the figures for
Consolidated EBITDA and Consolidated Net Income previously reported.

Earnings Release 2Q15
23
EBITDA is not a measure under BR GAAP and does not represent cash flow for the periods presented.
EBITDA should not be considered an alternative to net income as an indicator of operating
performance or an alternative to cash flow as an indicator of liquidity. EBITDA does not have a
standardized meaning and the definition of EBITDA used by Natura may not be comparable with that
used by other companies. Although EBITDA does not provide under BR GAAP a measure of cash flow,
Management has adopted its use to measure the Company’s operating performance. Natura also
believes that certain investors and financial analysts use EBITDA as an indicator of performance of its
operations and/or its cash flow.
This report contains forward-looking statements. These forward-looking statements are not historical
fact, but rather reflect the wishes and expectations of Natura’s management. Words such as
"anticipate," "wish," "expect," "foresee," "intend," "plan," "predict," "project," "desire" and similar
terms identify statements that necessarily involve known and unknown risks. Known risks include
uncertainties that are not limited to the impact of price and product competitiveness, the acceptance
of products by the market, the transitions of the Company’s products and those of its competitors,
regulatory approval, currency fluctuations, supply and production difficulties and changes in product
sales, among other risks. This report also contains certain pro forma data, which are prepared by the
Company exclusively for informational and reference purposes and as such are unaudited. This report
is updated up to the present date and Natura does not undertake to update it in the event of new
information and/or future events.