sampo bank plc annual report and … other notes 34 discontinued operations 35 net interest income...
TRANSCRIPT

SAMPO BANK PLC ANNUAL REPORT AND ACCOUNTS 2008

2
Contents 3 Sampo Bank plc Board of Directors´ Report 7 IFRS Financial Statements 7 Consolidated Income Statement 8 Consolidated Balance Sheet 9 Statement of Changes in Equity 10 Cash Flow Statement 12 Notes to the Financial Statements 12 Summary of Significant Accounting Policies 24 Segment Information 25 Risk Management 33 Business Combinations 34 Other Notes 34 Discontinued operations 35 Net interest income 35 Net income from financial transactions 36 Fee and commission income and expenses 36 Impairment on loans and receivables 36 Net income from investments 37 Staff costs 37 Other operating expenses 37 Financial assets and liabilities 38 Fair value 38 Cash and balances at central banks 39 Financial assets and liabilities at fair value through p/l 41 Loans and receivables 41 Investments 42 Investments in associates 43 Intangible assets 43 Property, plan and equipment 44 Other assets 44 Deferred tax assets and liabilities 45 Taxes 45 Amounts owed to credit institutions and customers 46 Debt securities in issue 46 Other liabilities 47 Provisions 47 Contingent liabilities and commitments 48 Employee benefits 48 Related party disclosures 49 Equity and reserves 50 Dividends 51 Sampo Bank plc Financial Statements (FAS) 51 Income Statement 52 Balance Sheet 54 Notes to the Financial Statements 54 Accounting policies 55 Other Notes to the Financial Statements 66 Sampo Bank plc Board of Directors´ proposal to the annual general meeting for the distribution of the profits of the parent company

3
SAMPO BANK PLC BOARD OF DIRECTORS´ REPORT 2008 Changes in Group structure Real Estate company Kiinteistö Oy Salon Örninkatu 15 was sold in February 2008 and associated company Primasoft Ltd (20 % of shares) in April 2008. ZAO Danske Bank (formerly ZAO Profibank) in Russia was sold in July 2008. Mandatum & Co Ltd and MDT Invest Ltd (formerly Mandatum Securities Ltd) were liquidated in July 2008. 3C Asset Management Ltd is now 100% owned subsidiary of Sampo Bank. Minority was bought out in October 2008. New associated company Arfin Ltd (33,3% of shares) was acquired in November 2008. Arvo Value Asset Management Ltd was merged to Sampo Bank in December 2008. Results of Mandatum & Co Ltd, MDT Invest Ltd and ZAO Danske Bank are presented in the income statement as discontinued operations. The changes in Group structure have effect on the comparability of the numbers. Changes in Accounting Policies and Presentation Sampo Bank Group is following generally accepted accounting policies of Danske Bank Group. Comparison figures for 2007 are not adjusted. Due to that the comparability of the periods presented in this annual report is affected. The changes and comparability are explained more detailed in Notes to the Financial Statements. Result Sampo Bank Group’s profit before taxes for 2008 was EUR 181.6 million (775.7). The amount contains the income from discontinued operations, altogether EUR 0.3 million (499.9). Return on equity after tax including discontinued operations was 6.9 per cent (44.8). Cost-to-income-ratio was 63.7 per cent (37.0). Balance sheet Loans and receivables increased by EUR 798.0 million from year-end 2007 and totalled EUR 26,090.8 million (25,292.8). Credit quality was satisfactory. Net impairment on loans and receivables was EUR 52.3 million (62.5). Deposits totalled EUR 13,006.7 million (12,775.5). Capital adequacy Sampo Bank Group’s capital adequacy ratio was 14.3 per cent (15.1) at the end of 2008 and the Tier 1 ratio was 12.4 per cent (12.9). The total capital included in capital adequacy calculations amounted to EUR 2,713.5 million at the end of December (2,633.6). The Group’s risk-weighted assets totalled EUR 18,998.5 million (17,404.3). Most significant changes in own funds from the end of 2007 were the profit after tax for 2008 EUR 133.4 million that is included in distributable reserves and the redemption of the Tier 2 debenture loan of EUR 50 million in December.

4
CAPITAL ADEQUACY DATA
2008 2007 2008 2007EURm
Tier 1 ¹) 2 363,5 2 239,3 2 379,0 2 150,1Share capital 106,0 106,0 106,0 106,0Share premiumReserves 271,1 271,1 261,7 261,7Capital securities 350,0 346,5 350,0 346,5Distributable capital 1 643,0 1 510,0 1 668,8 1 444,6Minority interests 1,2 14,4 0,0 0,0Intangible assets -7,8 -8,7 -7,4 -8,7Financial assets at fair value 0,0 0,0 0,0 0,0
Tier 2 350,0 394,3 350,0 394,3Subordinated liabilities 350,0 393,8 350,0 393,8Other 0,0 0,6 0,0 0,6
Tier 3 0,0 0,0 0,0 0,0
Deductions 2) 0,0 0,0 0,0 0,0
Total capital 2 713,5 2 633,6 2 729,0 2 544,5
Risk-weighted assets (on-balance sheetand off-balance sheet) 18 998,5 17 404,3 18 534,3 16 555,5
Capital requirement ( 8% of risk-weighted assets) 1 519,9 1 392,3 1 482,7 1 324,4Credit- and counterparty risk 1 360,8 1 352,1 1 324,2 1 283,1Market risk 59,5 40,2 59,5 41,4Operational risk 99,7 - 99,1 -
Capital adequacy ratio, %- total capital/risk-weighted assets 14,3% 15,1% 14,7% 15,4%- Tier 1 capital/risk-weighted assets 12,4% 12,9% 12,8% 13,0%
Group's capital adequacy ratio has been calculated in accordance with Credit Institutions Act Sect 5:44-48§ and 54-66§. For calculation of credit and operational risk's risk-weighted assets, Sampo Bank Group appliesstandard method.
Comparison figures for 2007 have been calculated in accordance with old Credit Institutions Act Sect 9:72-81§ and an Interpretation of Financial Supervision Authority on calculation of own funds of credit institutions 3/125/125,as enabled by transitional provision possibility in Credit Institutions Act Sect.12.
1) Tier 1 includes capital securities 15 % (15 %) in Sampo Bank Group and 15 % (16 %) in Sampo Bank plc.
2) On 16 March, 2007, the Financial Supervision Authority granted Sampo Bank an excemption, pursuant to the Act on Credit Institutions (48§,8), permitting the Bank not to deduct from its capital investments in companies whose main business area is investment activity. The redemption remains valid until 31 December, 2009.
Sampo Bank Group Sampo Bank plcAt 31 December At 31 December

5
Risk management The main objective of risk management is to ensure that the capital base is adequate in relation to the risks arising from the business activities. In addition to the statutory capital adequacy calculation, risks in Sampo Bank Group are described and assessed internally through economic capital, which describes the amount of capital needed to bear different kind of risks. The capital requirement is well covered by equity, capital securities and debenture loans. The major risks associated with Sampo Bank Group’s activities are credit risk, interest rate and liquidity risks of banking book, operational risks and various business risks such as changes in competition or customer behavior. Risk management is described in detail in the financial statements according to IFRS. Ratings Sampo Bank plc's credit ratings did not change during 2008. Standard & Poor's Ratings Services revised its outlook on Sampo Bank plc to negative from stable on October 22, 2008. At the same time, the AA- long-term and A-1+ short-term counterparty credit ratings were affirmed. Moody's placed Aa1 long-term debt and deposit ratings of Sampo Bank plc on review for a possible downgrade on November 12, 2008. Prime-1 short-term deposit rating was affirmed at the same time. The announcements were simultaneous with similar announcements for the parent company Danske Bank A/S. Administration Sampo Bank plc board members during 2008 have been Peter Straarup (Chairman), Sven Erik Lystbæk (Deputy chairman), Ilkka Hallavo, Teija Andersen, Tonny Thierry Andersen, Esko Mäkeläinen, Lars Stensgaard Mørch, Thomas Mitchell (until October 1, 2008), Maarit Näkyvä (until October 1, 2008), Georg Schubiger (as from October 2, 2008) and Risto Tornivaara (as from October 2, 2008). Ilkka Hallavo is the managing director of the Bank and Maarit Näkyvä was his deputy until October 1, 2008 and Risto Tornivaara as from October 2, 2008. The firm of authorised public accountants, Ernst & Young Oy, has acted as Auditor for Sampo Bank plc with Kunto Pekkala, APA, as the responsible auditor. Outlook for year 2009 Decreasing interest rates and deteriorating economic conditions will have a negative impact on the bank's profitability. Because of the extent of the financial and economic turbulence, bank cannot give a meaningful estimate of the profitability within a narrow range.

6
FINANCIAL HIGHLIGHTS
IFRS IFRS IFRS IFRS IFRS FASEUR m 2008 2007 2006 2005 2004 2004
Revenues 1 803 2 189 1 426 993 892 1 030Net interest income 481 460 447 398 363 374 % of revenue 26,7 21,0 31,3 40,1 40,7 36,4Profit before taxes 1) 182 776 354 252 232 240 % of revenue 10,1 35,4 24,8 25,4 26,0 23,3Total income 2) 742 1 330 817 643 606 615Total operating expenses 3) 508 492 461 394 384 398Cost to income ratio 63,7 37,0 56,5 61,2 63,4 64,7Total assets 29 592 28 152 26 627 23 207 19 819 19 775Equity 2 022 1 902 1 197 1 018 978 1 199Return on assets, % 4) 0,5 2,6 1,1 0,9 0,9 0,9Return on equity, % 4) 5) 6,9 44,8 24,5 18,5 16,6 17,9Equity/assets ratio, % 5) 6,8 6,8 4,5 4,4 5,0 5,0Capital adequacy ratio, % 6) 14,3 15,1 11,9 10,6 10,7 10,7Impairment on loans and receivables 7) 52 63 2 -3 -10 -13Off-balance sheet items 4 369 6 157 6 746 6 878 6 066 6 066Average number of staff 3 466 3 443 4 429 4 201 3 829 3 829
IFRS = International Financial Reporting Standards FAS = Finnish Accounting Standards
The financial highlights have been calculated as referred to in the regulations of the Finnish Financial Supervision Authority,taking into account renamed income statement and balance sheet items resulting from changes in the accounting practice.
1) Sampo Bank plc's profit from sales of its subsidiary banks in Baltics, MDT Invest plc, Mandatum & Co Ltd and ZAO Danske Bank as well as their operational result are included in the Group key figures; in the income statement they are presented as 'Discontinued operations'.2) Total income comprises the income in the formula for the cost to income ratio.3) Total operating expenses comprise the cost in the formula for the cost to income ratio.4) The change in fair value reserve in 2007 has been taken into account in return on assets and return on equity. Without the change in the fair value reserve the return on equity would have been 44,79 % for 2007. The equity for 2008 does not include fair value reserve.5) Capital securities have not been included in equity.6) Credit Institutions Act (121/2007) according to transitional provision possibility in Sect. 12: in old law 79 and 79a.7) Impairment on loans and receivables includes impairment losses, reversals of them, write-offs and recoveries. (-) net loss positive.
Formulas used in calculating the financial highlights
Revenues: interest income, net income from investments, fee and commission income,net income from financial transactions and other operating income.
Cost to income ratio, %: staff costs + other operating expenses x 100net interest income + net income from financial transactions + net fee and commission income +net income from investments + other operating income
Return on equity profit before taxes +/- change in fair value reserve - taxes x 100(at fair values), %: equity + minority interests ( average)
Return on assets profit before taxes +/- change in fair value reserve - taxes x 100(at fair values), %: average total assets
Equity/assets ratio equity + minority interests x 100(at fair values), %: total assets
7
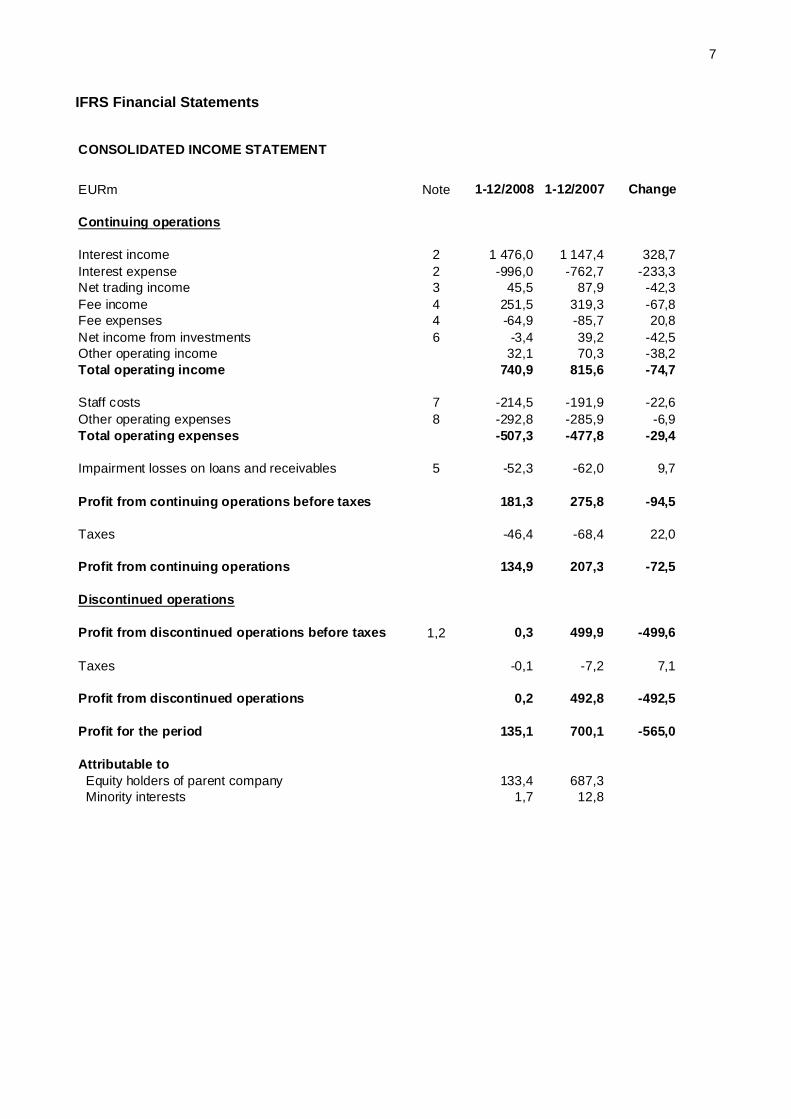
IFRS Financial Statements CONSOLIDATED INCOME STATEMENT
EURm Note 1-12/2008 1-12/2007 Change
Continuing operations
Interest income 2 1 476,0 1 147,4 328,7Interest expense 2 -996,0 -762,7 -233,3Net trading income 3 45,5 87,9 -42,3Fee income 4 251,5 319,3 -67,8Fee expenses 4 -64,9 -85,7 20,8Net income from investments 6 -3,4 39,2 -42,5Other operating income 32,1 70,3 -38,2Total operating income 740,9 815,6 -74,7
Staff costs 7 -214,5 -191,9 -22,6Other operating expenses 8 -292,8 -285,9 -6,9Total operating expenses -507,3 -477,8 -29,4
Impairment losses on loans and receivables 5 -52,3 -62,0 9,7
Profit from continuing operations before taxes 181,3 275,8 -94,5
Taxes -46,4 -68,4 22,0
Profit from continuing operations 134,9 207,3 -72,5
Discontinued operations
Profit from discontinued operations before taxes 1,2 0,3 499,9 -499,6
Taxes -0,1 -7,2 7,1
Profit from discontinued operations 0,2 492,8 -492,5
Profit for the period 135,1 700,1 -565,0
Attributable to Equity holders of parent company 133,4 687,3 Minority interests 1,7 12,8

8
CONSOLIDATED BALANCE SHEET
EURm Note 12/2008 12/2007
AssetsCash and balances at central banks 11 127,2 290,8Trading portfolio assets 12 2 830,7 1 429,2Financial assets at fair value through p/l 12 0,0 551,2Loans and receivables 13 26 090,8 25 292,8Investments 14 7,4 17,5Intangible assets 16 7,8 8,7Property, plant and equipment 17 100,1 90,2Other assets 18 404,4 439,9Tax assets 19 23,7 31,1Total assets 29 592,1 28 151,5
LiabilitiesFinancial liabilities at fair value through p/l 12 3 771,6 0,0Trading portfolio liabilities 1 243,6 671,0Amounts owed to credit institutions and customers 21 16 093,8 13 503,6Debt securities in issue 22 5 895,1 11 064,3Other liabilities 23 564,2 970,3Tax liabilities 19 2,2 40,0Total liabilities 27 570,5 26 249,2
EquityShare capital 28 106,0 106,0Reserves 28 271,1 271,7Retained earnings 28 1 643,2 1 510,2Equity attributable to parent company's equityholders 2 020,4 1 888,0Minority interests 1,2 14,4Total equity 2 021,6 1 902,4
Total equity and liabilities 29 592,1 28 151,5

9
STATEMENT OF CHANGES IN EQUITY
EURmShare capital
Legal reserve
Fair value
reserveRetained earnings Total
Minority interest Total
Equity at 1 Jan. 2007 106,0 271,1 -2,5 808,6 1.183,2 13,7 1.196,9
Cash flow hedges: - recognised in equity during the financial year - recognised in p/lFinancial assets available-for-sale - change in fair value 9,6 9,6 9,6 - recognised in p/l -6,4 -6,4 -6,4Exchange rate translation difference -0,2 -0,2 -0,2Danske Capital merger 14,6 14,6Profit for the f inancial year 687,3 687,3 12,8 700,1Total income and expensesrecognised for the period 3,2 701,7 704,9 12,8 717,7Dividends -12,2 -12,2Equity at 31 Dec. 2007 106,0 271,1 0,6 1.510,2 1.888,0 14,4 1.902,4
Cash flow hedges: - recognised in equity during the financial year - recognised in p/lFinancial assets available-for-sale - change in fair value - recognised in p/l -0,6 -0,6 -0,6Exchange rate translation differenceProfit for the f inancial year 133,4 133,4 1,7 135,1Total income and expensesrecognised for the period 0,0 0,0 -0,6 133,4 132,8 1,7 134,5Dividends -14,9 -14,9Equity at 31 Dec. 2008 106,0 271,1 0,0 1.643,2 2.020,4 1,2 2.021,6

10
CASH FLOW STATEMENT
EURm 2008 2007
Cash and cash equivalents at the beginningof the period 483 1 815Cash flows from/used in operating activities 3 845 -2 299Cash flows from/used in investing activities -38 446Cash flows from/used in financing activities -5 521Cash and cash equivalents at the end of the period 4 285 483
The net cash flows of discontinued operations 2008 2007Cash flows from/used in operating activities 0 30Cash flows from/used in investing activities 0 0Cash flows from/used in financing activities 0 -24Net cash flows total 0 6
The cash flow statement reports cash flows during the period classified by operating, investing and financing activities. Cash flows are reported by using the indirect method. Cash flows from operating activities derive primarily from the principal revenue-producing activities. Cash flows from investments in subsidiaries and associated undertakings and those from investments in intangible assets and property, plant and equipment are presented in investing activities. Financing activities include cash flows resulting from the changes in equity and borrowings in order to conduct the business. Cash and cash equivalents 2007 consist of cash and balances with central banks and loans and advances to credit institutions repayable on demand.
Cash flow statement for 2008 has been adjusted to Danske Bank Group -principles. Increase of cash is due to the new classification where below 3 month's due from credit institutions is also considered as cash. The adjustment is included in "Cash flow from/used in operating activities".

11
NOTE TO THE CASH FLOW STATEMENT
Acquisitions in 2008
On March 12, 2008 Sampo Bank plc bought the minority of Arvo Value Asset Management Ltd.Later during the year (December 31, 2008) Arvo Value Asset Management Ltd was merged to Sampo Bank plc.
On October 2, 2008 Sampo Bank plc bought the minority of 3C Asset Management Ltd. 3C Asset Management Ltd is now 100% subsidiary of Sampo Bank.
New associated company Arfin Ltd (33.3% of shares) was acquired on October 21, 2008.
Sales in 2008
Real Estate company Kiinteistö Oy Salon Örninkatu 15 was sold on February 22, 2008.
On April 11, 2008 Sampo Bank plc sold Primasoft Ltd, associated company, (20% of shares).
On July 31, 2008 Sampo Bank plc sold the Russian subsidiary, ZAO Danske Bank, to Danske Bank A/S.

12
NOTES TO THE FINANCIAL STATEMENTS
SUMMARY OF SIGNIFICANT ACCOUNTING POLICIES Sampo Bank Group is part of the Danske Bank Group. Sampo Bank Group has prepared the consolidated financial statements for 2008 in accordance with the International Financial Reporting Standards (IFRSs) as adopted by the EU and by Danske Bank Group. In preparing the financial statements, Sampo Bank has applied all the new or amended standards and interpretations relating to its business and effective at 31 December 2008 as the parent company. In preparing the notes to the consolidated financial statements, attention has also been paid to Finnish accounting and company legislation and applicable regulatory requirements. The introduction of the new or revised standards and interpretations in the 2008 financial year had effect on Sampo Bank’s accounting principles and the information presented in the financial statements. The Group has implemented IASB’s Improvement to IAS 16 already in 2008. The Improvement specifies the accounting treatment of a company which sells a lease asset upon expiry of the lease agreement as part of its normal business activities. Upon expiry of the lease agreement, the asset must be treated as inventory. Consequently, lease assets worth EUR 1.3 million (2007: EUR 2.0 million) were transferred from tangible assets to Other assets at the end of 2008. The financial statements have been prepared under the historical cost convention, modified by changes in fair value, amortization, depreciation or impairment losses, depending on the accounting treatment of the respective items. The consolidated financial statements are presented in euro (EUR), in million euros with one decimal, unless otherwise stated. CHANGES IN ACCOUNTING POLICIES AND PRESENTATION A group of financial liabilities, when managed and measured on a fair value basis, may be reported at fair value by applying Fair Value Option in IAS 39. Issued CD’s are classified into the category “Financial liabilities measured at fair value through profit and loss" since Q2/2008. The net change of fair values of debt securities was EUR 1.6 million of which the fair value change of issued CD’s was EUR -18.1 million. Balance sheet category ‘available for sale’ is no longer used and the securities were re-classified into trading. Commitment fees are presented as part of Net interest instead of Fee income. The effect for 2008 was a decrease of EUR 4.4 million on Fee income and a corresponding increase in Net interest. Interest on trading securities and derivatives is presented in Net interest. Net trading income for 2007 included EUR 67.7 million of income that in 2008 is presented in Net interest. Net interest income from investments (2007 EUR 2.1 million) is now presented in Net interest income. Net income from investments for 2007 included EUR 35.9 million of income that in 2008 is presented in Net trading income. Securities are presented in 2008 balance sheet according to the settlement date and in 2007 balance sheet according to the trade date. Profit and loss impact has been taken into account according to the trade date also in 2008. The table below (table 1.) shows the comparative figures for continued operations after the above mentioned transitions.

13
SAMPO BANK GROUP PROFIT FROM CONTINUING OPERATIONSAFTER TRANSITIONS
EURm 1-12/2008 1-12/2007 Change
Net interest income 480,0 456,2 23,9Net trading income 45,5 58,6 -13,1Net fee income 186,6 229,2 -42,6Net income from investments -3,4 1,4 -4,7Other operating income 32,1 70,3 -38,2Total operating income 740,9 815,6 -74,7
Staff costs -214,5 -191,9 -22,6Other operating expenses -292,8 -285,9 -6,9Total operating expenses -507,3 -539,9 -29,5
Impaiment losses on loans and receivables -52,3 -62,0 9,7
Profit before taxes 181,3 275,8 -94,5
Taxes -46,4 -68,5 22,0Profit for the period 134,9 207,3 -72,5 Table 1. CONSOLIDATION SUBSIDIARIES The consolidated financial statements combine the financial statements of Sampo Bank plc and all its subsidiaries. Entities qualify as subsidiaries if the Group has the controlling power. The Group exercises control if its shareholding is more than 50 per cent of the voting rights or it otherwise has the power to exercise control over the financial and operating policies of the entity. The consolidated financial statements are prepared by consolidating items of the same nature and eliminating intra-group transactions, accounts, and trading profits and losses. Undertakings acquired are included in the financial statements at the date of acquisition. The net assets of such undertakings (assets, including identifiable intangible assets, less liabilities and contingent liabilities) are included in the financial statements at their fair value on the date of acquisition according to the purchase method. If the cost of acquisition, including direct transaction costs, exceeds the fair value of the net assets acquired, the excess amount is recognised as goodwill. Goodwill is recognised in the functional currency of the undertaking acquired. If the fair value of the net assets exceeds the cost of acquisition (negative goodwill), the excess amount is recognised as income at the date of acquisition. Divested undertakings are included in the financial statements until the transfer date. ASSOCIATES Associated undertakings are businesses, other than subsidiaries, in which the Group has holdings and significant influence but not control. The Group generally classifies undertakings as associated undertakings if Sampo Bank plc, directly or indirectly, holds 20-50 % of the voting rights.

14
Holdings are recognised at cost at the time of acquisition and are subsequently measured according to the equity method. The proportionate share of the net profit and loss of the individual undertaking is included under Income from associated undertakings and based on data from financial statements with balance sheet dates that differ no more than three months from the balance sheet date of the Group. The proportionate share of the profit and loss on transactions between associated undertakings and group undertakings is eliminated. SPECIAL PURPOSE ENTITIES (SPE) The Group applies synthetic securitisation, by which Sampo Bank plc uses credit derivatives to transfer the credit risk of a loan portfolio in its balance sheet to the market. The derivatives are treated in the consolidated financial statements like guarantees. Sea Fort Securities plc, a special purpose entity funding part of the credit risk, has been established for this purpose. The loans continue to be included in Sampo Bank plc’s balance sheet. Sampo Bank plc has no controlling power or participation in the special purpose entity’s net assets, and the special purpose entity has not been consolidated. FOREIGN CURRENCY TRANSLATION The presentation currency of the consolidated financial statements is euro. The functional currency of each of the Group’s units is the currency of the country in which the unit is domiciled, as most income and expenses are recognised in the currency of that country. Transactions in foreign currency are translated at the exchange rate of the functional currency at the transaction date. Gains and losses on exchange rate differences arising between the transaction date and the settlement date are recognised in the income statement. Monetary assets and liabilities in foreign currency are translated at the exchange rates prevailing at the balance sheet date. Exchange rate adjustments of monetary assets and liabilities arising as a result of differences in the exchange rates applying at the transaction date and at the balance sheet date are recognised in the income statement. Non-monetary assets and liabilities in foreign currency that are subsequently revalued at fair value are translated at the exchange rates applying at the date of revaluation. Exchange rate adjustments are included in the revaluation of the fair value of an asset or liability. Other non-monetary items in foreign currency are translated at the exchange rates applying at the date of transaction. TRANSLATION OF FOREIGN UNITS Assets and liabilities of units outside Finland are translated into euro at the exchange rates applying at the balance sheet date. Income and expenses are translated at the exchange rates applying at the date of transaction. Exchange rate gains and losses arising at the translation of net investments in foreign units are recognised directly in shareholders’ equity. Net investments include the net assets and goodwill of the units as well as holdings in foreign units in the form of subordinated loan capital. Exchange rate adjustments of financial liabilities to hedge net investments in foreign units are also recognised directly in shareholders’ equity. The following exchange rates have been applied in the consolidated financial statements: Balance sheet date
1 euro (EUR) = exchange rate Average exchange rate Russian rouble (RUB) 41.3922 36.8328

15
SEGMENT REPORTING The segment reporting in Sampo Bank Group is based on internal business areas and on the organisational structure in 2008. Banking activities in Finland and other functions include segments private clients, corporate and institutional clients, markets operations and other as they were reported in the financial statements for 2007.The East European banking is presented in 2007 as discontinued operations and the profit from sales as well as the operational result are included in the Group results. The inter-segment pricing is based on market prices. In consolidated financial statements the inter-segment transactions, assets and liabilities have been eliminated. INTEREST AND DIVIDENDS Interest income and expenses arising from interest-bearing financial instruments carried at amortised cost are recognised in the income statement according to the effective yield method on the basis of the cost price of the individual financial instrument. Interest includes the amortisation of fees that are an integral part of the effective yield on a financial instrument, such as origination fees, and the amortisation of any other differences between cost price and redemption price. Interest income and expenses also includes interest on financial instruments carried at fair value. Interest on loans and receivables subject to individual impairment is recognised on the basis of the impaired value. FEES AND COMMISSIONS Fees and commissions which are an integral part of the effective interest rate of a financial instrument are deferred and treated as an adjustment to the effective interest rate. Such fees may be origination fees (including compensation for activities such as evaluating the borrower’s financial condition, evaluating and registering guarantees, collateral and other securities and documentation) and commitment fees, for example. If a commitment fee expires without an entity making a loan, the fee is recognised as revenue upon expiry. The fees and transaction costs of financial instruments measured at fair value through profit and loss are recognised in profit and loss when the instrument is initially recognised. Fees for other financial services include fees recognised as revenue when services are provided (e.g. those charged for servicing a loan). Fees earned upon the execution of a significant act are recognised as revenue when the act is completed. Such fees are e.g. syndication fees which are recognised in profit and loss when the syndication has been completed. NET TRADING INCOME Net trading income includes realised and unrealised capital gains and losses on trading portfolio assets and other securities as well as exchange rate adjustments and dividends. The effect on profit and loss of fair value hedge accounting is also recognised under Net trading income. FINANCIAL ASSETS AND LIABILITIES GENERAL Purchases and sales of financial instruments are measured at their fair value at the settlement date. The fair value is usually the same as the transaction price. Changes in the value of financial instruments are recognised up to the settlement date.

16
CLASSIFICATION At initial recognition, financial assets are divided into the following categories:
• trading portfolio measured at fair value • loans and receivables measured at amortised cost.
At initial recognition, financial liabilities are divided into the following categories:
• trading portfolio measured at fair value • financial liabilities designated at fair value with value adjustment through profit and loss • other financial liabilities measured at amortised cost.
FINANCIAL ASSETS AND FINANCIAL LIABILITIES AT FAIR VALUE THROUGH PROFIT AND LOSS Financial assets and liabilities at fair value through profit of loss comprise trading portfolio assets and liabilities and financial liabilities designated as at fair value through profit and loss. Trading portfolio The trading portfolio includes financial assets acquired and liabilities undertaken that the Group intends to sell or repurchase in the short term. The trading portfolio also contains financial assets and liabilities managed collectively for which a pattern of short-term profit taking exists. All derivatives, including separated embedded derivatives and derivatives designated as hedging derivatives, are part of the trading portfolio. Assets in the trading portfolio comprise the equities, bonds and derivatives with positive fair value held by the Group’s trading department. Liabilities in the trading portfolio consist of derivatives with negative fair value and obligations to deliver securities. At initial recognition, the trading portfolio is measured at fair value, excluding transaction costs. Subsequently, the portfolio is measured at fair value with value adjustments through profit and loss. FAIR VALUE OPTION – FINANCIAL LIABILITIES DESIGNATED AS AT FAIR VALUE THROUGH PROFIT AND LOSS Financial liabilities at fair value through profit and loss includes issued CD's (see also section "Changes in accounting policies"). Financial liabilities at fair value through profit and loss are measured at fair value. Interest income and expenses on financial instruments carried at fair value are presented in Net interest income, realised and unrealised capital gains and losses are included in Net trading income. DUE FROM CREDIT INSTITUTIONS AND CENTRAL BANKS Amounts due from credit institutions and central banks comprise amounts due from other credit institutions and time deposits with central banks. Reverse transactions are recognised as amounts due from credit institutions and central banks. Amounts due from credit institutions and central banks are measured at amortised cost, as described under Loans and receivables. LOANS AND RECEIVABLES Loans and receivables consist of loans and receivables disbursed directly to borrowers and loans and receivables acquired after disbursement. Loans and receivables include conventional bank loans; finance leases; mortgages and pledges; reverse transactions, except for transactions with credit institutions and central banks.

17
At initial recognition, loans and receivables are measured at fair value plus transaction costs and less origination fees, and other charges. Subsequently, they are measured at amortised cost, according to the effective interest method, with the deduction of any impairment charges. The difference between initial recognition and the nominal value is amortised over the term to maturity and carried under Interest income. If fixed-rate loans and receivables and amounts due are hedged efficiently by derivatives, the fair value of the hedged interest rate risk is added to the amortised cost of the assets. AMOUNTS DUE TO CREDIT INSTITUTIONS AND CENTRAL BANKS / DEPOSITS Amounts Due to credit institutions and central banks and Deposits include amounts received under repurchase transactions. Amounts Due to credit institutions and central banks and Deposits are measured at amortised cost plus the fair value of the hedged interest rate risk. OTHER ISSUED BONDS / SUBORDINATED DEBT Other issued bonds and Subordinated debt comprise the bonds issued by the Group. Subordinated debt is liabilities in the form of subordinated loan capital and other capital investments which, in case of voluntary or compulsory winding-up, will not be repaid until after the claims of ordinary creditors have been met. Other issued bonds and Subordinated debt are measured at amortised cost plus the fair value of the hedged interest rate risk. The yield on some issued bonds depends on an index that is not closely linked to the financial characteristics of the bonds, for example an equity index. Such embedded derivatives are separated and carried at their fair value in the trading portfolio. FAIR VALUE The fair value of financial assets and liabilities is measured on the basis of quoted market prices of financial instruments traded in active markets. If an active market exists, fair value is based on the most recently observed market price at the balance sheet date. If a financial instrument is quoted in a market that is not active, the Group bases its valuation on the most recent transaction price. It adjusts the price for subsequent changes in market conditions, for instance by including transactions in similar financial instruments that are motivated by normal business considerations. If an active market does not exist, the fair value of standard and simple financial instruments, such as interest rate and currency swaps and unlisted bonds, is measured according to generally accepted measurement methods. Market-based parameters are used to measure fair value. The fair value of more complex financial instruments, such as swaptions, interest rate caps and floors, and other OTC products, is measured on the basis of internal models, many of which are based on valuation techniques generally accepted within the industry. The results of calculations made on the basis of valuation techniques are often estimates, because exact values cannot be determined from market observations. Consequently, additional parameters, such as liquidity and counterparty risk, are sometimes used to measure fair value. If, at the time of acquisition, a difference arises between the value of a financial instrument calculated on the basis of non-observable inputs and actual cost [day-one profit and loss] and the difference is not the result of transaction costs, the Group calibrates the model parameters to the actual cost. IMPAIRMENT OF FINANCIAL ASSETS If objective evidence of impairment of a loan, an advance or an amount due exists, and the effect of the impairment event or events on the expected cash flow from the asset is reliably measurable, the Group determines the impairment loss individually. The impairment charge equals the difference between the carrying amount and the present value of the most likely future cash flow from the asset, including the realisation value of collateral. The present value of fixed-rate loans and receivables is calculated at the

18
original effective interest rate, whereas the present value of loans and receivables with a variable rate of interest is calculated at the current effective interest rate. Objective evidence of impairment of loans and receivables exists if at least one of the following events has occurred:
• the borrower is experiencing significant financial difficulty • the borrower’s actions, such as default on interest or principal payments, lead to a breach of contract • the Group, for reasons relating to the borrower’s financial difficulty, grants to the borrower a
concession that the Group would not otherwise have granted • it becomes probable that the borrower will enter bankruptcy or another type of financial
reorganisation Loans and receivables without objective evidence of impairment are considered in an assessment of collective impairment at portfolio level. Collective impairment is calculated for groups of loans and receivables with similar credit characteristics when impairment of expected future cash flows from the group has occurred. The Group’s models use downgrading of a customer’s rating as an indicator of impairment. The facilities are divided into groups according to their current ratings. The cash flows are specified by means of parameters used for the calculation of solvency requirements and historical loss data adjusted for use in the financial statements, among other things. The adjustment covers a loss identification period that, according to the Group’s empirical data, is the period from the first appearance of evidence of impairment to the determination of a loss at customer level. Collective impairment is calculated for each group as the net difference between the carrying amount of the loans and receivables of the portfolio and the present value of expected future cash flows. If the Group becomes aware that, at the balance sheet date, deteriorations or improvements have occurred that are not fully reflected in the assessments based on the models, it adjusts the impairment charge. Impairment charges are booked in an allowance account and set off against loans and receivables. Changes in the allowance account are recorded under Loan impairment charges in the income statement. If subsequent events show that impairment is not permanent, charges are reversed. Loans and receivables that are considered uncollectible are written off. Write-offs are debited to the allowance account. Loans and receivables are written off once the usual collection procedure has been completed and the loss on the individual loan or advance can be calculated. In accordance with the effective interest method, interest is recognised on the basis of the value of the loans and receivables less impairment charges. HEDGE ACCOUNTING The Group uses derivatives to hedge the interest rate risk on fixed-rate assets and fixed-rate liabilities carried at amortised cost. Hedged risks that meet specific criteria qualify for fair value hedge accounting and are treated accordingly. The interest rate risk on the hedged assets and liabilities is recognised at fair value as a value adjustment of the hedged items through profit and loss. If the hedge criteria cease to be met, the accumulated value adjustments of the hedged items are amortised over the term to maturity. LEASES GROUP AS LESSOR Finance leases Leases in which assets are leased out and substantially all the risks and rewards of ownership are transferred to the lessee are classified as finance leases. Finance leases are recognised as receivables in the balance sheet at an amount equal to the net investment in the lease. The lease payment is allocated
19
between the repayment of principal and interest income. The interest income is amortised over the lease period so as to achieve a constant periodic rate of return on the remaining net investment for the lease term. Finance leases are included in ‘Loans and receivables’ and interest in ‘Interest income’. Other leases Leases in which assets are leased out and the Group retains substantially all the risks and rewards of ownership are classified as operating leases. They are included in ‘Property, plant and equipment’ in the balance sheet. They are depreciated over their expected useful lives on a basis consistent with similar owned property, plant and equipment, and the impairment losses are recognised on the same basis as for these items. Rental income on assets held as operating leases is recognised on a straight-line basis over the lease term in profit and loss. GROUP AS LESSEE Finance leases
Leases of assets in which substantially all the risks and rewards of ownership are transferred to the Group are classified as finance leases. Finance leases are recognised at the lease’s inception at the lower of the fair value of the leased asset and the present value of the minimum lease payments. The corresponding obligation is included in ‘Other liabilities’ in the balance sheet. The assets acquired under finance leases are amortised or depreciated over the shorter of the asset’s useful life and the lease term. Each lease payment is allocated between the liability and the interest expense. The interest expense is amortised over the lease period to produce a constant periodic rate of interest on the remaining balance of the liability for each period. Other leases Assets in which the lessor retains substantially all the risks and rewards of ownership are classified as operating leases and they are included in the lessor’s balance sheet. Payments made on operating leases are recognised on a straight-line basis over the lease term as rental expenses in profit and loss. INTANGIBLE ASSETS GOODWILL Goodwill arises on the acquisition of undertakings and is calculated as the difference between the cost of an undertaking acquired and the fair value of its net assets, including contingent liabilities, at the time of acquisition. Goodwill on associated undertakings is carried under Holdings in associated undertakings. Goodwill is allocated to cash-generating units at the level at which management monitors its investment. Goodwill is not amortised; instead each cash-generating unit is tested for impairment at least once a year. All impairments tests are done by Danske Bank A/S. Goodwill is written down to its recoverable amount through profit and loss if the carrying amount of the net assets of the cash-generating unit exceeds the higher of the assets’ fair value less costs to sell and their value in use, which equals the present value of the future cash flows expected from the unit. OTHER INTANGIBLE ASSETS Software acquired is measured at cost, including the expenses incurred to make each software application ready for use. Software acquired is amortised over its expected useful life, which is usually three years, according to the straight-line method. Software developed by the Group is recognised if the cost of development is reliably measurable and analyses show that the future profit from using the individual software applications exceeds cost. Cost is defined as development costs incurred to make each software application ready for use. Once the software has been developed, the cost is amortised over the expected useful life, which is usually three years, according to the straight-line method. Development costs consist primarily of direct remuneration and other

20
development costs that may be attributed directly. Expenses incurred in the planning phase are not included; instead such expenses are booked when incurred. Identifiable intangible assets taken over on the acquisition of undertakings are recognised at the time of acquisition at their fair value and amortised over their expected useful lives, which are usually three years, according to the straight-line method. The value of intangible assets with indefinite useful lives is not amortised, but the assets are tested for impairment at least once a year according to the principles applicable to goodwill. Other intangible assets to be amortised are tested for impairment if indications suggest that impairment exists, and the assets are written down to their value in use. All impairment tests are done by Danske Bank A/S. Costs attributable to the maintenance of intangible assets are expensed in the year of maintenance. TANGIBLE ASSETS Tangible assets includes domicile property, machinery, furniture and fixtures. Machinery, furniture and fixtures cover equipment, vehicles, furniture, fixtures, leasehold improvements and lease assets. DOMICILE PROPERTY Domicile property is real property occupied by the Group’s administrative departments, branches and other service units. Real property with both domicile and investment property elements is allocated proportionally to the two categories if the elements are separately sellable. If that is not the case, such real property is classified as domicile property, unless the Group occupies less than 10% of the total floorage. Domicile property is measured at cost plus improvements and less depreciation and impairment charges. The straight-line depreciation of the property is based on the expected scrap value and an estimated useful life of 20 to 50 years. Real property held under long-term leases is depreciated on a progressive scale. Investment property which becomes domicile property because the Group starts using it for its own activities is recognised at its fair value at the time of reclassification. Domicile property which becomes investment property is recognised at its fair value at the time of reclassification. Any revaluation of domicile property is recognised directly in shareholders’ equity. Domicile property which, according to a publicly announced plan, the Group expects to sell within twelve months is carried as an asset held for sale. Real property taken over as part of the settlement of debt is recognised under Other assets. MACHINERY, FURNITURE AND FIXTURES Equipment, vehicles, furniture, fixtures and leasehold improvements are recognised at cost less depreciation and impairment. Assets are depreciated over their expected useful lives, which are usually three years, according to the straight-line method. Leasehold improvements are depreciated over the term of the lease, with a maximum of ten years. LEASE ASSETS Lease assets consist of assets, except real property, leased under operating leases with the Group as the lessor. They are measured using the same valuation technique as that applied by the Group to its other equipment, vehicles, furniture and fixtures. When, at the end of the lease period, lease assets are put up for sale, the assets are transferred to Other assets. IMPAIRMENT Tangible assets are tested for impairment if indications suggest that impairment exists. An impaired asset is written down to its recoverable amount, which is the higher of its fair value less costs to sell and its value in use. All impairment tests are done by Danske Bank A/S.

21
PROVISIONS A provision is recognised when the Group has a present legal or constructive obligation as a result of a past event, and it is probable that an outflow of resources embodying economic benefits will be required to settle the obligation and the Group can reliably estimate the amount of the obligation. If it is expected that some or all of the expenditure required to settle the provision will be reimbursed by another party, the reimbursement will be treated as a separate asset only when it is virtually certain that the Group will receive it. EMPLOYEE BENEFITS POST-EMPLOYMENT BENEFITS Post-employment benefits include pensions and life insurance. Sampo Bank Group does not have arranged defined benefit plans. The most significant defined contribution plan is that arranged through the Employees’ Pensions Act (TyEL) in Finland. In defined contribution plans, the Group pays fixed contributions to a pension insurance company and has no legal or constructive obligation to pay further contributions. The obligations arising from a defined contribution plan are recognised as an expense in the period that the obligation relates to. TERMINATION BENEFITS An obligation based on termination of employment is recognised as a liability when Sampo Bank Group is verifiably committed to terminate the employment of one or more persons before the normal retirement date or to grant benefits payable upon termination as a result of an offer to promote voluntary redundancy. As no economic benefit is expected to flow to the employer from these benefits in the future, they are recognised immediately as an expense. Obligations maturing more than 12 months later than the balance sheet date are discounted. The benefits payable upon termination at Sampo Bank Group are the monetary and pension packages related to redundancy. SHARE-BASED PAYMENTS The Danske Bank Group offers senior managers and selected employees’ incentive programmes that consist of share options and conditional shares. Incentive payments reflect individual performance and also depend on financial results and other measures of value creation. Issued options carry a right to buy Danske Bank shares that can be exercised between three and seven years after they are allotted provided that the employee has not resigned from the Group. The strike price of the options is computed as the average price of Danske Bank shares for 20 stock exchange days after the release of the Annual Report plus 10%. Rights to buy Danske Bank shares under the conditional share programme are allotted as a portion of the annual bonus earned. The shares become available after three years provided that the employee has not resigned from the Group. The fair value of the share options at the time of allotment is calculated according to a dividend-adjusted Black & Scholes formula based on the following assumptions at December 31, 2008: Share price: 179.76 (2007: 252.00). Dividend payout ratio: 3.9%. (2007: 3.1%). Rate of interest: 4.7% (2007: 4.0%), corresponding to the swap rate. Volatility: 19%. (2007: 18%). Average time of exercise: 5 years (2007: 5 years). The volatility is estimated on the basis of historical volatility. The fair value of the conditional shares at the time of allotment is calculated as the share price less the payments made by the employees. Intrinsic value is recognised in the year the share options and rights to conditional shares were earned, while time value is accrued over the remaining service period, corresponding to the vesting period of three years.

22
INCOME TAXES Item Tax expenses in the income statement comprise current and deferred tax. Tax expenses are recognised through profit and loss, except for items recognised directly in equity, in which case the tax effect will also be recognised in equity. Current tax is calculated based on the valid tax rate of each country. Tax is adjusted by any tax related to previous periods. Deferred tax is calculated on all temporary differences between the carrying amount of an asset or liability in the balance sheet and its tax base. Deferred tax is not recognised on non-deductible goodwill impairment, and nor is it recognised on the undistributed profits of subsidiaries to the extent that it is probable that the temporary difference will not reverse in the foreseeable future. Deferred tax is calculated by using the enacted tax rates prior to the balance sheet date. A deferred tax asset is recognised to the extent that it is probable that future taxable income will be available against which a temporary difference can be utilised. FIDUCIARY ACTIVITIES The fiduciary services supplied by Sampo Bank Group are discretionary asset management services, mutual fund services and securities custody services. In these activities, assets are held and placed on behalf of customers. These assets and the income arising thereon are excluded from these financial statements, as they are not asset of Sampo Bank Group. CASH AND CASH EQUIVALENTS Cash and cash equivalents comprise cash and balances with central banks, loans and receivables to credit institutions repayable on demand and short-term deposits (less than 3 months). Sampo Bank Group presents cash flows from operating activities using the indirect method in which the profit (loss) before taxation is adjusted for the effects of transactions of a non-cash nature, deferrals and accruals, and income and expense associated with investing or financing cash flows. In the cash flow statement, interest received and paid is presented in cash flows from operating activities. In addition, the dividends received are included in cash flows from operating activities. Dividends paid are presented in cash flows from financing. ACCOUNTING ESTIMATES AND ASSESSMENTS The preparation of the consolidated financial statements is based on the management's estimates and assessments of future events that will significantly affect the carrying amounts of assets and liabilities. The amounts most influenced by critical estimates and assessments are
• the fair value of financial instruments • impairment charges for loans and receivables • impairment charges for goodwill.
The estimates and assessments are based on assumptions that the management finds reasonable but that are inherently uncertain and unpredictable. The assumptions may be incomplete or inaccurate, and unexpected future events or situations may occur. Such estimates and assessments are therefore difficult to make and will always entail uncertainty, even under stable macroeconomic conditions, when they involve transactions with customers and other counterparties. Other people may make other estimates. FAIR VALUE OF FINANCIAL INSTRUMENTS Measurements of financial instruments for which prices are quoted in an active market or which are based on generally accepted models with observable market data are not subject to material estimates.
23
Measurements of financial instruments that are only to a limited extent based on observable market data, such as unlisted shares and certain bonds for which there is no longer an active market, are subject to estimates. More details on this can be found from Danske Bank A/S Annual accounts for 2008. MEASUREMENT OF LOANS AND RECEIVABLES The Group makes impairment charges to account for impairment of loans and receivables that occur after initial recognition. Impairment charges are based on a combination of individual and collective impairment and are subject to a number of estimates, including assessments of the loans or portfolios of loans that are impaired, expected future cash flows and the value of collateral. More information regarding this can be found from Danske Bank A/S Annual accounts for 2008. MEASUREMENT OF GOODWILL Goodwill on acquisition is tested for impairment once a year. All impairment tests are done by Danske Bank A/S. Impairment testing requires that the management estimate future cash flows of acquired units. A number of factors affect the value of such cash flows, including discount rates and growth which depends on changes on the real economy, customer behavior, competition and other factors. Impairment charges for goodwill were not required in 2008. More details on this can be found from Danske Bank A/S Annual accounts for 2008. APPLICATION OF NEW OR REVISED IFRSs AND INTERPRETATIONS The following standards and interpretations published by the IASB related to the Group’s business are taken into account:
– IFRIC 11 IFRS 2 - Group and Treasury Share transactions – IFRIC 12 Service Concession Arrangements – IFRIC 13 Customer Loyalty Programmes – IFRIC 14 IAS 19 – The Limit on a Defined Benefit Asset, Minimum Funding Requirements and
their Interaction – IFRS 8 Operating Segments – IAS 23 Expenses of liabilities – IAS16 Accounting for Sale of Leasing Assets
The view of Sampo Bank’s management is that the introduction of the above IFRIC interpretations will have no material effect on the Sampo Bank Group’s financial statements information, P/E ratio or accounting policies.

24
SEGMENT INFORMATION
The inter-segment pricing is based on market prices.
In consolidated financial statements the inter-segment transactions, assets and liabilities have been eliminated.
JANUARY-DECEMBER 2008
EURm
Banking in Finland and
other functions
Asset Management &
Funds in Finland
Integration EliminationsSampo Bank
Group
Net interest income 481,7 0,8 -1,3 0,0 481,2Other income (net) 245,4 56,1 -0,1 -40,5 261,0Total operating income 727,2 56,9 -1,4 -40,5 742,2Total operating expenses -405,2 -24,7 -78,6 0,2 -508,3Impairment losses on loans and receivables -52,3 -52,3Profit before taxes 269,7 32,2 -80,0 -40,3 181,6Sales profit from discontin. oper.
DECEMBER 31, 2008TOTAL ASSETS 30 033,8 67,0 -508,7 29 592,1of which loans and advances to credit inst. & cust. 26 341,3 75,3 -325,8 26 090,8TOTAL LIABILITIES 27 905,6 31,4 -366,5 27 570,5of which liabilities to credit inst. & customers 16 402,3 0,5 -308,9 16 093,8
JANUARY-DECEMBER 2007
EURm
Banking in Finland and
other functions
Asset Management &
Funds in Finland
Integration EliminationsSampo Bank
Group
Net interest income 387,4 1,3 1,3 390,0Other income (net) 965,3 65,4 -0,1 -90,3 940,3Total operating income 1 352,7 66,7 -0,1 -88,9 1 330,3Total operating expenses -427,1 -22,3 -49,4 6,6 -492,1Impairment losses on loans and receivables -62,5 -62,5Profit before taxes 863,1 44,4 -49,5 -82,3 775,7Sales profit from discontin. oper. 492,6
DECEMBER 31, 2007TOTAL ASSETS 28 650,9 60,7 -560,1 28 151,5of which loans and advances to credit inst. & cust. 25 539,3 46,2 -292,7 25 292,8TOTAL LIABILITIES 26 672,2 32,7 -455,8 26 249,2of which liabilities to credit inst. & customers 13 806,6 -303,0 13 503,6
The segment reporting of Sampo Bank Group is based on internal business areas and on the organisational structure in 2008.

25
SAMPO BANK RISK MANAGEMENT DISCLOSURES RISK MANAGEMENT GENERAL PRINCIPLES AND GOVERNANCE Risk is an essential part of Sampo Bank’s operating environment and business activities. Clearly defined strategies and responsibilities, together with strong commitment to the risk management process, are our tools to manage risks. The main objectives of the risk management processes are to ensure that risks are properly identified, risk measurement is independent and the capital base is adequate in relation to the risks. The risks related to the Sampo Bank Group’s activities and the sufficiency of the companies’ capitalization in relation to these risks is regularly evaluated. The Board of Directors of Sampo Bank plc, together with the Boards of Sampo Bank plc’s subsidiaries, is responsible for ensuring that the Sampo Bank Group’s risks are properly managed and controlled. The Sampo Bank plc Board sets the principles of risk management and provides guidance on the organization of risk management and internal control in the business areas. Sampo Bank Group Risk Management, which is an independent unit outside the business areas, monitors Sampo Bank Group’s risk position against principles and limits set by the Board of Sampo Bank plc. Risk management is also responsible for assessing the adequateness of the capital base of Sampo Bank Group against the risks taken. It is each business areas responsibility that all the principles and limits set by the Sampo Bank plc Board of Directors or Risk Management department are followed in the business processes and decision making. Principles and practices of Risk Management in Sampo Bank Group plc are carried out consistently with risk policies of Danske Bank Group and supported by corresponding Danske Bank Group functions. Additional information on Danske Bank Group level risks and Danske Bank Group’s risk approaches can be found in Danske Bank Group Annual accounts and Risk Management report for 2008. CAPITAL REQUIREMENTS AND MANAGEMENT MINIMUM REGULATORY CAPITAL Banking is a highly regulated business. There are formal rules for minimum capital and capital structure in capital adequacy regulation. Also banks largest exposures are limited based on capital included in the capital adequacy own funds. Credit Institutions Act gives multiple options for methods institutions may use in capital adequacy calculation. Sampo Bank Group applies standard method for credit- and operational risks. Market risks are calculated according to regulatory approaches; internal models are not used in regulatory reporting.
Capital adequacy is reported quarterly to Financial Supervision Authority (FIN-FSA). All Sampo Bank Group companies fulfilled the regulatory minimum capital requirements during 2008. Minimum capital requirements set by capital adequacy regulation are presented in the Risk Table 1 below. As Sampo Bank Group started to apply new capital adequacy regulation as of 1.1.2008, there is no comparison figures for capital requirement on portfolio level. Total minimum regulatory capital requirement compared to 31.12.2007 has increased with EUR 127.5 million and total own funds with EUR 79.9 million.

26
31.12.2008Ca pita l require ments for credit and counterpa rty cre dit risk 1 361Central governments and central banks 0A dminis trat ive bodies and non-comerc ial undertak ings 1Ins titut ions 122Corporates 673Retail 166Real es tate 353P ast due item s 14Item s belonging to regulatory high-risk categories 1Covered bonds 3O ther item s 12S ecuritisat ion Pos it ions 16
Ca pita l require ments for m arke t risk 59G eneral and spec ific risk 51Comm odity risk 8
Ca pita l require ment for o pe ra tiona l risk 100
T ota l cap ita l require m ent 1 520
T ota l o w n fund s 2 713 Risk Table 1. Sampo Bank Group minimum regulatory capital requirements by portfolio, EURm CAPITAL MANAGEMENT PROCESS
The basis of the Danske Bank Group’s capital management practices is the regulatory framework in the Capital Requirements Directive (CRD) with the ICAAP (Internal Capital Adequacy Assesment Process) in Pillar 2.
Sampo Bank Group’s ICAAP consists of evaluating all relevant risks that the Sampo Group is exposed to. Besides the Pillar I risk types – credit, market and operational risks – the bank sets capital aside for business risk as well. Liquidity risk is taken into account through stress testing.
The latest Sampo Bank Group ICAAP (Internal Capital Adequacy Assessment Process) report was prepared, approved by Sampo Bank plc Board and delivered to FIN-FSA in December 2008. The report includes assessment of all internal and external capital requirements Sampo Bank Group must fulfil. The requirements have been stressed with to reflect severe negative development in economic environment over a 3 – 5 years time horizon. The report shows that Sampo Bank Group is well capitalized and has adequate capital buffers against possible negative changes in market environment. MAIN RISK TYPES
The major risks associated with Sampo Bank Group’s activities are the credit risk arising from banking, interest rates and liquidity risk. Operational and business risks are inherent in all business areas.
The banking result mainly depends on loan and deposit margins, business volumes, the size and structure of the balance sheet, the general level of interest rates, impairment losses and cost efficiency. The margin between loans and deposits in banking, with a moderate interest rate and liquidity risk profile, changes slowly. Possible sources of result fluctuations are unexpected losses in the credit and operational risk areas. In banking and investment services, the fees gathered from customer business are also an important source of earnings. Because fees are exposed to changes in business volume, profitability is mostly exposed to changes in general economic activity and customer behaviour.
27
CREDIT RISK Credit risks refer to variations in results caused by customers or counterparties failing to meet their payments obligations. Credit risks include counterparty, country and settlement risks.
Sampo Bank Group’s guidelines lay down uniform principles for credit risk taking, with the aim of ensuring good quality in the credit process. Sampo Bank’s Board of Directors annually approves the credit risk policy. This sets the parameters for credit risk appetite, expressed by the distribution of exposures and collateral gap by rating and other quality measures. Lending is focused on customers operating in Finland. Limits are set for risk concentrations, measured by the ratio of a customer group’s nominal exposures to the Bank’s total capital. The risk concentration parameters are at a clearly lower level than official norms.
Sampo Bank’s board of Directors has all credit decisions authority delegated to Danske Bank Group Credit Committee, which has further delegated the authority to the Sampo Bank CEO and the management of the Sampo Bank Credit department, and to the authorised credit officers in the business areas. The amount of the authorisation varies according to customer rating, total exposure and the collateral level. All credit applications are initiated and prepared in the business area. Credit decisions are primarily based on the probability of default, exposures levels and collateral offered, maturity and acceptable risk-adjusted return on risk-adjusted capital. Credit risks of corporate customers All major corporate customers have a customer account officer who is familiar with the customer’s business and monitors its development. Customers with significant exposures are analyzed by credit analysts independent of the business area. Customers with smaller exposures are continuously assessed scoring models. Credit risk monitoring consists of continuous monitoring of macro-economy and business sector developments, on the one hand, and monitoring of customer creditworthiness, collateral values and covenants, on the other hand. Credit risks of business areas are reviewed systematically at least once a year. This credit review includes monitoring the appropriateness of credit decisions and implementation of action plans initiated in order to reduce the risks of the lowest rated customers. The evolution of new lending is monitored monthly against credit policy targets. Product limits are monitored daily as well as the delayed payments or arrears. During Eastern 2008 the Bank’s IT systems were migrated to Danske Bank Group systems. The Bank started to use Danske Bank Group’s rating model for corporate customers. A customer will be classified as defaulted, if it has interest or loan installments over 90 days past due, its loan must be restructured resulting in an economic loss to the bank or is forced into corporate restructuring or bankruptcy. The bank’s internal default data also forms the basis for loss given default estimates. Credit risks of retail customers
Retail customers are credit scored both by application scorecard and continuously monitored by behavioural scorecard. These scoring models utilize public and internal information on borrower payment behaviour e.g. education, employment and other factors as influential variables in forecasting customer creditworthiness.
Long-term loans to retail customers are mainly collateralised by housing company shares or residential real estate. Pricing of retail customer loans is risk sensitive, using probability of default, and loss given default estimates. The all incidents of excesses, overdrafts and past due payments are monitored continuously. Credit portfolio The figures in Risk Tables 2 to 5 show the exposures of customers of Sampo Bank Group. The internal receivables of Sampo Bank Group companies have been eliminated from these figures.
28
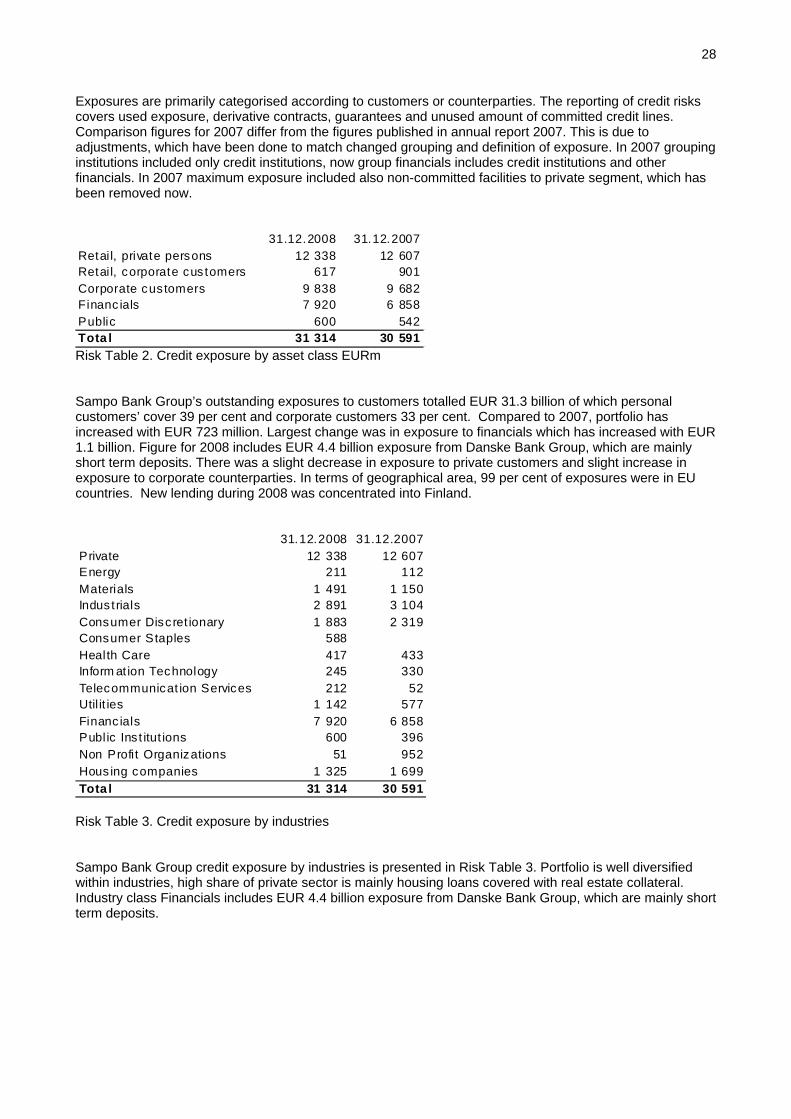
Exposures are primarily categorised according to customers or counterparties. The reporting of credit risks covers used exposure, derivative contracts, guarantees and unused amount of committed credit lines. Comparison figures for 2007 differ from the figures published in annual report 2007. This is due to adjustments, which have been done to match changed grouping and definition of exposure. In 2007 grouping institutions included only credit institutions, now group financials includes credit institutions and other financials. In 2007 maximum exposure included also non-committed facilities to private segment, which has been removed now. 31.12.2008 31.12.2007Retail, private persons 12 338 12 607Retail, corporate cus tomers 617 901Corporate customers 9 838 9 682Financ ials 7 920 6 858Public 600 542Tota l 31 314 30 591 Risk Table 2. Credit exposure by asset class EURm Sampo Bank Group’s outstanding exposures to customers totalled EUR 31.3 billion of which personal customers’ cover 39 per cent and corporate customers 33 per cent. Compared to 2007, portfolio has increased with EUR 723 million. Largest change was in exposure to financials which has increased with EUR 1.1 billion. Figure for 2008 includes EUR 4.4 billion exposure from Danske Bank Group, which are mainly short term deposits. There was a slight decrease in exposure to private customers and slight increase in exposure to corporate counterparties. In terms of geographical area, 99 per cent of exposures were in EU countries. New lending during 2008 was concentrated into Finland. 31.12.2008 31.12.2007Private 12 338 12 607Energy 211 112Materials 1 491 1 150Industrials 2 891 3 104Consumer Discret ionary 1 883 2 319Consumer Staples 588Health Care 417 433Inform at ion Technology 245 330Telecommunicat ion Services 212 52Util it ies 1 142 577Financ ials 7 920 6 858Public Inst itut ions 600 396Non Profit Organizations 51 952Hous ing companies 1 325 1 699Tota l 31 314 30 591
Risk Table 3. Credit exposure by industries Sampo Bank Group credit exposure by industries is presented in Risk Table 3. Portfolio is well diversified within industries, high share of private sector is mainly housing loans covered with real estate collateral. Industry class Financials includes EUR 4.4 billion exposure from Danske Bank Group, which are mainly short term deposits.
29
31.12.20081 72 5 93 3 94 5 05 5 46 4 47 3 58 1 59 2
10 11711 340
Tota l 31 314
030876251639534691
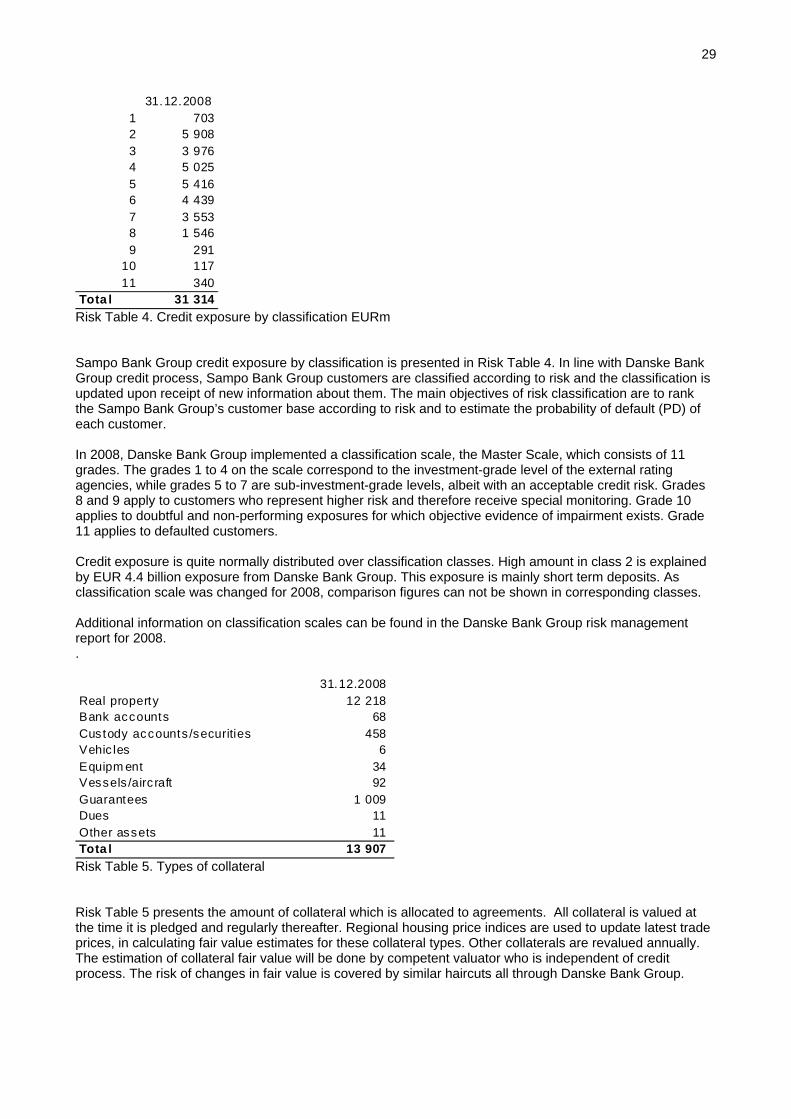
Risk Table 4. Credit exposure by classification EURm Sampo Bank Group credit exposure by classification is presented in Risk Table 4. In line with Danske Bank Group credit process, Sampo Bank Group customers are classified according to risk and the classification is updated upon receipt of new information about them. The main objectives of risk classification are to rank the Sampo Bank Group’s customer base according to risk and to estimate the probability of default (PD) of each customer. In 2008, Danske Bank Group implemented a classification scale, the Master Scale, which consists of 11 grades. The grades 1 to 4 on the scale correspond to the investment-grade level of the external rating agencies, while grades 5 to 7 are sub-investment-grade levels, albeit with an acceptable credit risk. Grades 8 and 9 apply to customers who represent higher risk and therefore receive special monitoring. Grade 10 applies to doubtful and non-performing exposures for which objective evidence of impairment exists. Grade 11 applies to defaulted customers. Credit exposure is quite normally distributed over classification classes. High amount in class 2 is explained by EUR 4.4 billion exposure from Danske Bank Group. This exposure is mainly short term deposits. As classification scale was changed for 2008, comparison figures can not be shown in corresponding classes. Additional information on classification scales can be found in the Danske Bank Group risk management report for 2008. . 31.12.2008Real property 12 218 Bank accounts 68 Custody accounts /securities 458 Vehic les 6 Equipm ent 34 Vessels /airc raft 92 Guarantees 1 009 Dues 11 Other assets 11 Tota l 13 907
Risk Table 5. Types of collateral Risk Table 5 presents the amount of collateral which is allocated to agreements. All collateral is valued at the time it is pledged and regularly thereafter. Regional housing price indices are used to update latest trade prices, in calculating fair value estimates for these collateral types. Other collaterals are revalued annually. The estimation of collateral fair value will be done by competent valuator who is independent of credit process. The risk of changes in fair value is covered by similar haircuts all through Danske Bank Group.

30
MARKET RISK Market risk is defined as the risk of losses because the fair value of the Bank’s assets and liabilities varies with changes in market conditions. Market risk consists of the following components:
• Interest rate risk: the risk of losses caused by changes in interest rates • Exchange rate risk: the risk of losses on foreign currency positions caused by changes in exchange
rates • Equity market risk: the risk of losses caused by changes in equity prices • Commodity risk: the risk of losses caused by changes in commodity prices
Furthermore, Bank defines liquidity risk as part of market risk. Sampo Bank’s Board of Directors sets out the risk policy and limits for all market risk types. The Board also decides on the general principles for managing and monitoring market risks based on the guidelines and allocated market risk limits provided by the Danske Bank Group. The managements of the individual business areas are responsible for the risks the areas incur and for actively managing these risks within the limits set. The Board of Directors delegates the market risk limits to the Chief Executive Officer of Sampo Bank. Market risk limits are allocated for trading activities and for the ALCO position. The structural interest rate risk on demand deposits is included in the ALCO position. The ALCO position is decided at regular Sampo Bank Group’s ALCO meetings and trades are executed by Danske Markets Finland, which is part of the Sampo Bank Group. The chart below illustrates the limit structure and hierarchy in Sampo Bank.
Board of Directors
Trading Positions
Limits: Trading Limits for Sampo Bank Responsible: Head of Danske Markets Finland
ALCO Positions
Limits: ALCO Limits for Sampo Bank Responsible: Sampo Bank Group’s ALCO
Chief Executive Officer
Measurement, monitoring and management reporting on market risks are carried out on a daily basis. The Bank calculates current market risk using a database that is integrated with its trading systems. In addition the Bank conducts intra-day spot checks of the risks in the individual business areas. The market risks are reported to the Board of Directors on monthly basis. Market risk exposure Market risks arise from the banking book positions and the trading activities. The main market risk is the interest rate risk of Sampo Bank’s banking book positions, which is mainly denominated in EUR. The Bank also has a structural interest rate risk exposure in its banking activities. This risk derives from demand deposits whose interest rate has been stable at a very low level over a considerable period. This portfolio has been and is expected to remain stable. The interest rate risk in the trading activities as well as equity and commodity risks is modest. The Risk Table 6 shows Sampo Bank Group’s market risk as of year end 2008 calculated according to conventional risk measures. Open currency positions are kept at very modest levels.

31
Equity Commodity1% parallel shift down
1% parallel shift up
10% fall in prices
10% fall in prices
Assets Cash 0 0Money market 1 -1Bonds 5 -5Equity and funds 0Loans and receivables 135 -128Other financial assets
Liabilities Deposits -54 52Money market -21 20Senior bonds -57 55Capital notes -7 7Subordinated bonds -1 1Other financial liabilities
Derivatives Net 21 -21 -123 -21 0 -133 -33 0 0
Risk EURmInterest rate
Total 2007Total 2008
Financial assets and liabilities, sensitivity to market changes
Risk Table 6. Market Risks by financial assets and liabilities The currency positions of the Bank are shown below in Risk Table 7.
EUR SEK NOK DKK EEK LVL LTL GBP USD RUB OTHERTotal 2008 EUR -1 0 -1 -7 -9 -14 1 0 -1 1Total 2007 EUR -1 1 -1 0 -15 -2 0 7 -9 0
Currency risk, open position EURm Banking and Investment Services
Foreign currency EURmHome ccy
Risk Table 7. Currency Risk exposure LIQUIDITY RISK Liquidity risk is defined as the risk of losses because
• The Bank’s funding costs increase disproportionately • Lack of funding prevents the Bank from establishing new business • Lack of funding will ultimately prevent the Bank from meeting its obligations
Taking on liquidity risks is an integral part of the Sampo Bank’s business strategy. Policies define the amount of liquidity risk that Sampo Bank wishes to accept. The Board of Directors has set limits for liquidity risks. Danske Markets Finland is responsible for ensuring that Sampo Bank observes the operational liquidity risk limits. Sampo Bank has implemented a contingency plan to ensure that it is ready to respond to unfavourable liquidity situations. Liquidity management is based on monitoring and management of the Bank’s short-term and long-term liquidity risks. The management of the Bank’s operational liquidity risk aims primarily at ensuring that the Bank always has a liquidity buffer that is able, in the short term, to absorb the net effects of current transactions and expected changes in liquidity. The Bank uses limits to manage operational liquidity risk. Liquidity is calculated on the basis of known future receipts and payments under current transactions. Structural liquidity risk is managed on the basis of considerations of the Bank’s long-term liquidity profile. The aim is to ensure that the Bank does not create an unnecessarily large need for funding in the future. Quantifying the structural liquidity risk is important when the Bank plans its funding activities. The structural liquidity risk is based on a breakdown by maturity of the Bank’s assets, liabilities and off-balance-sheet items. The Bank bases these calculations on the contractual due dates of individual products but takes into account that some balance sheet items have maturities that make their actual due dates deviate materially

32
from their contractual due dates. The maturities of such items are therefore modified to provide a more accurate view of the actual behaviour. The Bank monitors its funding mix to make sure that it is well diversified in terms of financing sources. Risk Table 8 presents Sampo Bank’s financial liabilities by maturity classes based on contractual maturities. Financial liabilities without contractual maturity are included in the maturity class ‘Less than 3 months’. Less than 3 months 3 - 12 months 1 - 5 years 5 - 10 years Over 10 years
2008 19 387 1 963 3 767 585 2422007 16 505 2 326 4 443 1 394 226
Risk Table 8. Maturity profile of financial liabilities based on contractual maturities, EUR million OPERATIONAL RISK Operational risks are defined as the risks of losses attributable to inadequate or defective internal processes and systems, people or external events. Operational risks also include legal and reputational risks. Risks can be divided into seven main classes:
• Internal fraud • External fraud • Deficiencies in personnel management • Deficiencies in practices concerning customers, products or business • Damage to physical assets • Business disruption and system failures • Deficiencies in execution, delivery and process management
Operational risks are reflected, for example, in costs, claims, loss of reputation, business disruptions or false information concerning positions, risks and results. The management of operational risks enhances the efficiency of the Group’s internal processes and decreases fluctuations in returns. The business areas are responsible for organising and monitoring operational risk. The centralised functions support the business units in their own expert areas. The risk management organisation develops methods to manage operational risks and co-ordinates the risk management operations of the business units. Internal auditing assesses the adequacy and efficiency of internal control and risk management. The compliance function supports the business units in operating in compliance with regulations, and is responsible for the validity of the released financial information. With respect to operational risks, internal loss incident data is collected systematically. Incidents with direct costs exceeding a fixed sum are reported to Group risk management. Incidents are classified into risk classes, and the event, control points and cost structure are analysed. At Easter 2008, Sampo Bank Finland migrated to the Danske Bank Group’s shared IT platform in one of the largest IT projects ever carried out in northern Europe. Operations and customer service at Sampo Bank subsequently experienced several challenges in the period until July, which caused the biggest operational risk event of the accounting period. In the second and third quarters Sampo Bank compensated the customers for the inconvenience caused by the migration with EUR 10 million uncharged fees and other compensations.

33
BUSINESS COMBINATIONS
Acquisitions during the year 2008
On March 12, 2008 Sampo Bank plc bought the minority of Arvo Value Asset Management Ltd.Later during the year (December 31, 2008) Arvo Value Asset Management Ltd was merged to Sampo Bank plc.
On October 2, 2008 Sampo Bank plc bought the minority of 3C Asset Management Ltd. 3C Asset Management Ltd is now 100% subsidiary of Sampo Bank.
New associated company Arfin Ltd (33.3% of shares) was acquired on October 21, 2008.
Sales during the year 2008
Real Estate company Kiinteistö Oy Salon Örninkatu 15 was sold on February 22, 2008.
On April 11, 2008 Sampo Bank plc sold Primasoft Ltd, associated company, (20% of shares).
On July 31, 2008 Sampo Bank plc sold the Russian subsidiary, ZAO Danske Bank, to Danske Bank A/S.
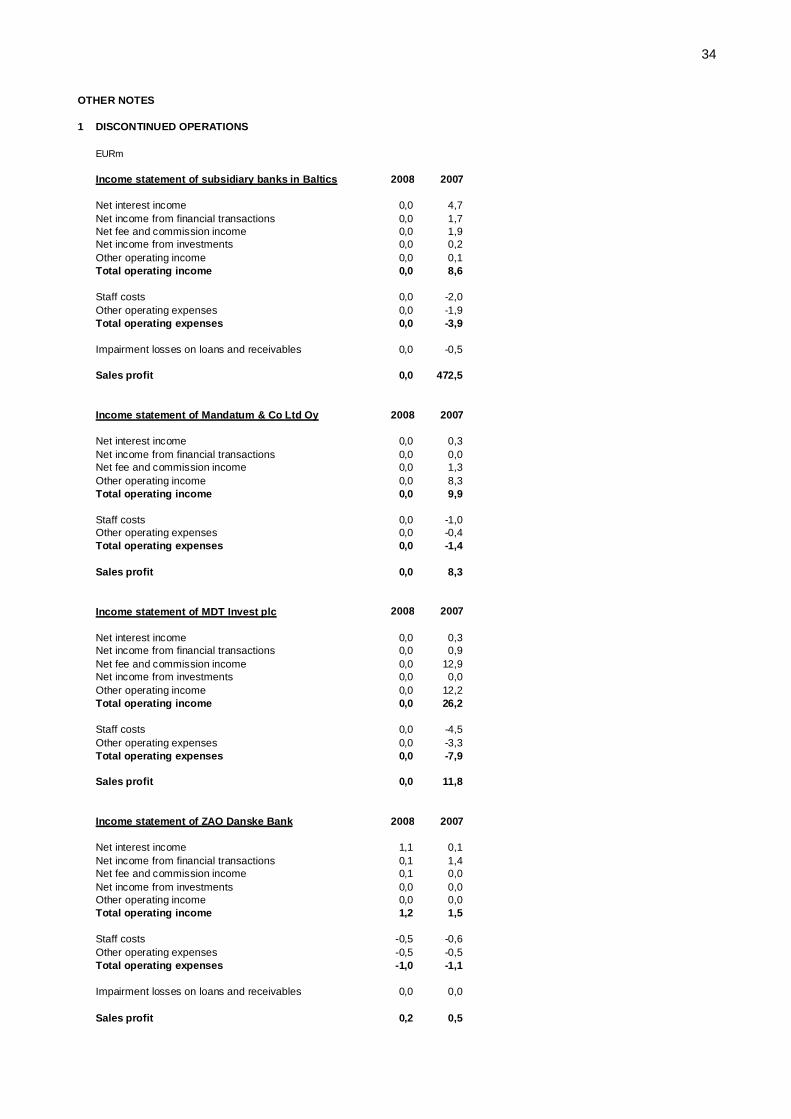
34
OTHER NOTES
1 DISCONTINUED OPERATIONS
EURm
Income statement of subsidiary banks in Baltics 2008 2007
Net interest income 0,0 4,7Net income from financial transactions 0,0 1,7Net fee and commission income 0,0 1,9Net income from investments 0,0 0,2Other operating income 0,0 0,1Total operating income 0,0 8,6
Staff costs 0,0 -2,0Other operating expenses 0,0 -1,9Total operating expenses 0,0 -3,9
Impairment losses on loans and receivables 0,0 -0,5
Sales profit 0,0 472,5
Income statement of Mandatum & Co Ltd Oy 2008 2007
Net interest income 0,0 0,3Net income from financial transactions 0,0 0,0Net fee and commission income 0,0 1,3Other operating income 0,0 8,3Total operating income 0,0 9,9
Staff costs 0,0 -1,0Other operating expenses 0,0 -0,4Total operating expenses 0,0 -1,4
Sales profit 0,0 8,3
Income statement of MDT Invest plc 2008 2007
Net interest income 0,0 0,3Net income from financial transactions 0,0 0,9Net fee and commission income 0,0 12,9Net income from investments 0,0 0,0Other operating income 0,0 12,2Total operating income 0,0 26,2
Staff costs 0,0 -4,5Other operating expenses 0,0 -3,3Total operating expenses 0,0 -7,9
Sales profit 0,0 11,8
Income statement of ZAO Danske Bank 2008 2007
Net interest income 1,1 0,1Net income from financial transactions 0,1 1,4Net fee and commission income 0,1 0,0Net income from investments 0,0 0,0Other operating income 0,0 0,0Total operating income 1,2 1,5
Staff costs -0,5 -0,6Other operating expenses -0,5 -0,5Total operating expenses -1,0 -1,1
Impairment losses on loans and receivables 0,0 0,0
Sales profit 0,2 0,5
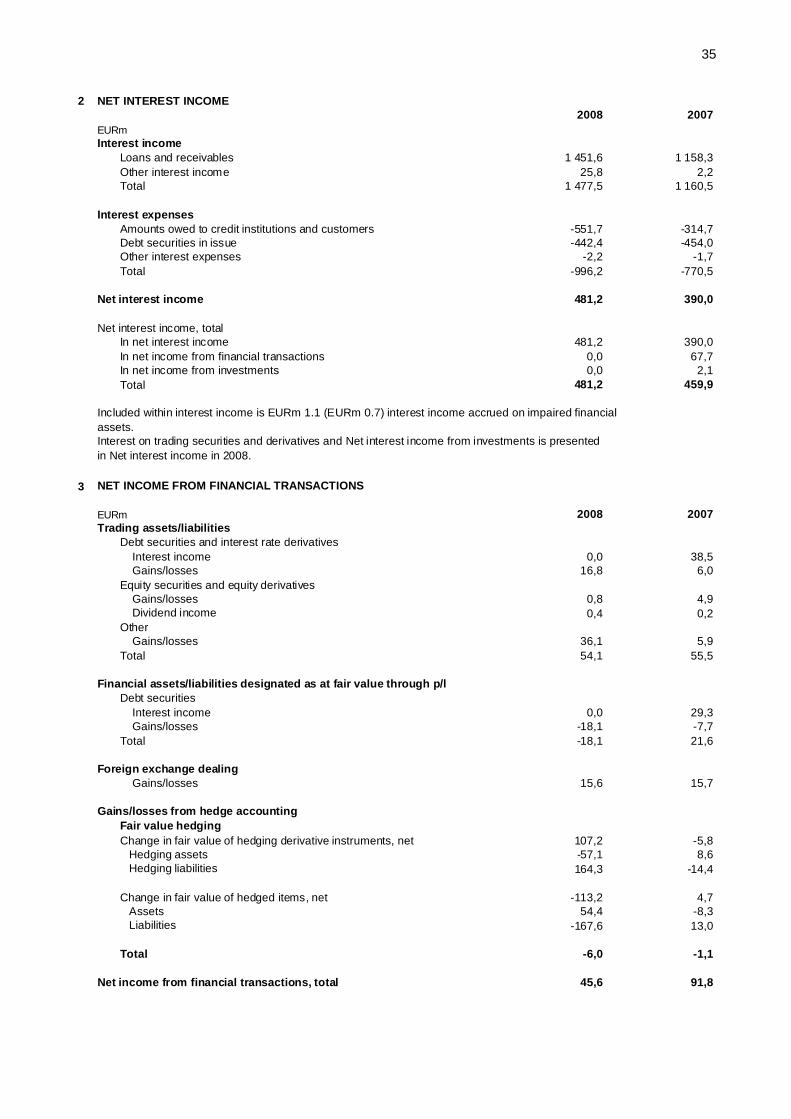
35
2 NET INTEREST INCOME2008 2007
EURmInterest income
Loans and receivables 1 451,6 1 158,3Other interest income 25,8 2,2Total 1 477,5 1 160,5
Interest expensesAmounts owed to credit institutions and customers -551,7 -314,7Debt securities in issue -442,4 -454,0Other interest expenses -2,2 -1,7Total -996,2 -770,5
Net interest income 481,2 390,0
Net interest income, totalIn net interest income 481,2 390,0In net income from financial transactions 0,0 67,7In net income from investments 0,0 2,1Total 481,2 459,9
Included within interest income is EURm 1.1 (EURm 0.7) interest income accrued on impaired financialassets. Interest on trading securities and derivatives and Net interest income from investments is presentedin Net interest income in 2008.
3
EURm 2008 2007Trading assets/liabilities
Debt securities and interest rate derivatives Interest income 0,0 38,5 Gains/losses 16,8 6,0Equity securities and equity derivatives Gains/losses 0,8 4,9 Dividend income 0,4 0,2Other Gains/losses 36,1 5,9Total 54,1 55,5
Debt securities Interest income 0,0 29,3 Gains/losses -18,1 -7,7Total -18,1 21,6
Foreign exchange dealing Gains/losses 15,6 15,7
Gains/losses from hedge accountingFair value hedgingChange in fair value of hedging derivative instruments, net 107,2 -5,8 Hedging assets -57,1 8,6 Hedging liabilities 164,3 -14,4
Change in fair value of hedged items, net -113,2 4,7 Assets 54,4 -8,3 Liabilities -167,6 13,0
Total -6,0 -1,1
Net income from financial transactions, total 45,6 91,8
NET INCOME FROM FINANCIAL TRANSACTIONS
Financial assets/liabilities designated as at fair value through p/l
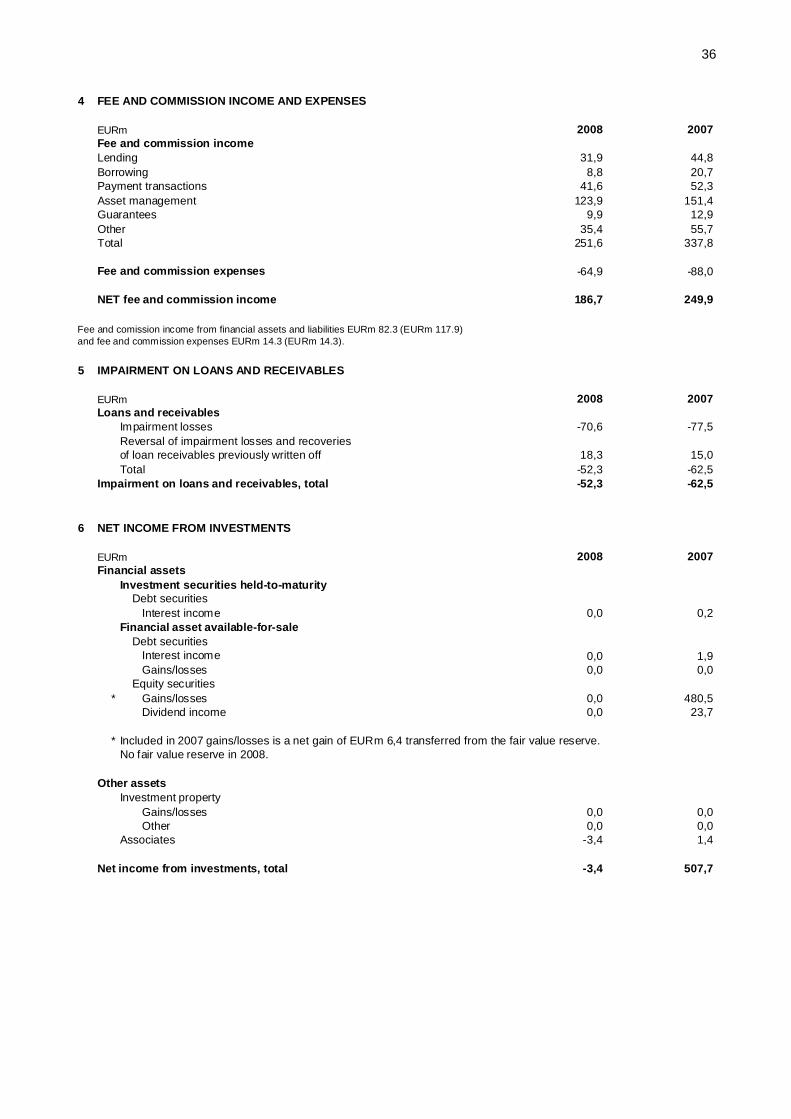
36
4 FEE AND COMMISSION INCOME AND EXPENSES
EURm 2008 2007Fee and commission incomeLending 31,9 44,8Borrowing 8,8 20,7Payment transactions 41,6 52,3Asset management 123,9 151,4Guarantees 9,9 12,9Other 35,4 55,7Total 251,6 337,8
Fee and commission expenses -64,9 -88,0
186,7 249,9NET fee and commission income Fee and comission income from financial assets and liabilities EURm 82.3 (EURm 117.9)and fee and commission expenses EURm 14.3 (EURm 14.3). 5 IMPAIRMENT ON LOANS AND RECEIVABLES
EURm 2008 2007Loans and receivables
Impairment losses -70,6 -77,5Reversal of impairment losses and recoveries of loan receivables previously written off 18,3 15,0Total -52,3 -62,5
Impairment on loans and receivables, total -52,3 -62,5
6 NET INCOME FROM INVESTMENTS
EURm 2008 2007Financial assets
Investment securities held-to-maturity Debt securities Interest income 0,0 0,2Financial asset available-for-sale Debt securities Interest income 0,0 1,9 Gains/losses 0,0 0,0 Equity securities
* Gains/losses 0,0 480,5 Dividend income 0,0 23,7
*No fair value reserve in 2008.
Other assetsInvestment property Gains/losses 0,0 0,0 Other 0,0 0,0Associates -3,4 1,4
Net income from investments, total -3,4 507,7
Included in 2007 gains/losses is a net gain of EURm 6,4 transferred from the fair value reserve.

37
7 STAFF COSTS
EURm 2008 2007Staff costs
Wages and salaries -156,8 -139,0Equity-settled share-based payments 0,0 0,0Cash-settled share-based payments -8,7 -20,6Pension costs - defined contribution plans -33,6 -25,2Other social security costs -15,9 -15,1
Staff costs, total -215,0 -199,9 8 OTHER OPERATING EXPENSES
2008 2007EURm
IT costs -94,8 -97,8Other staff costs -22,0 -7,5Marketing expenses -21,9 -17,7Postage and telephone expenses -13,9 -10,0Depreciation and amortisation -35,3 -65,6Rental expenses -42,8 -27,5Other -62,5 -66,1
Other operating expenses, total -293,3 -292,2
Other expenses includes auditing and supervision fees, insurance and memberships fees. 9 FINANCIAL ASSETS AND LIABILITIES
Financial assets and liabilities have been categorised in accordance with IAS 39.9. In the table are also included interest income and expenses, realised and unrealised gains and losses, impairment losses and dividend income arising from those assets and liabilities
EURm Carrying Interest Gains/ Impairment Dividend amount inc./exp. losses losses income
FINANCIAL ASSETS
Financial assets at fair value through p/lTrading assets and derivative f inancial instruments 2 830,7 21,4 40,3 - -Financial assets designated as at fair value through p/l - - - - -
Investment securities held-to-maturity 0,0 0,0 0,0 0,0 0,0
Loans and receivables 21 184,3 1 262,9 37,7 52,3 -
Financial assets available-for-sale - - - -
Other financial assets 5 041,1 179,5 - - -
Financial assets total 29 056,1 1 463,8 78,0 52,3 0,0
FINANCIAL LIABILITIES
Financial liabilities at fair value through p/lTrading liabilit ies and derivative financial instruments 1 243,6 - - - -Debt securities at fair value 3 771,6 -124,2 -18,1
Other financial liabilities 21 988,9 -878,9 -29,9 - -
Financial liabilities, total 27 004,1 -1 003,1 -48,0 0,0 0,0
2008
-

38
FINANCIAL ASSETS Carrying Interest Gains/ Impairment Dividend
amount inc./exp. losses losses incomeFinancial assets at fair value through p/lTrading assets and derivative financial instruments 1 429,2 39,4 6,0 - 0,2Financial assets designated as at fair value through p/l 551,2 29,3 -7,7 - -
Investment securities held-to-maturity 0,0 0,2 - - -
Loans and receivables 25 583,7 1 158,3 - 62,5 -
Financial assets available-for-sale 6,4 1,9 480,6 - 23,7
Financial assets total 27 570,5 1 229,0 478,9 62,5 23,9
FINANCIAL LIABILITIES
Financial liabilities at fair value through p/lTrading liabilities and derivative financial instruments 671,0 -0,9 - - -
Other financial liabilities 24 567,9 -768,7 - - -
Financial liabilities, total 25 238,9 -769,6 0,0 0,0 0,0
2007
10 FAIR VALUES
EURm Fair Carrying Fair Carryingvalue amount value amount
Financial assetsCash and balances at central banks 127,2 127,2 290,8 290,8Trading assets and derivative financial instruments 2 830,7 2 830,7 1 429,2 1 429,2Financial assets designated as at fair value through p/l 0,0 0,0 551,2 551,2Loans and receivables 21 105,4 21 184,3 25 269,5 25 292,8Investments 7,4 7,4 6,4 6,4Other f inancial assets 4 906,5 4 906,5Total financial assets 28 977,2 29 056,1 27 547,2 27 570,5
Financial liablitiesTrading liabilities and derivative financial instruments 1 243,6 1 243,6 671,0 671,0Amounts owed to credit institutions and customers 15 866,2 16 093,8 13 473,8 13 503,6Financial liabilities designated as at fair value through p/l 3 771,6 3 771,6Debt securities in issue 5 551,8 5 895,1 11 048,2 11 064,3Total financial liabilities 26 433,2 27 004,1 25 193,0 25 238,9
2008 2007
In the table above are presented fair values and carrying amounts of financial assets and liabilities, including values of those f inancial assets and liabilities which are carried at fair value. The detailed measurement bases of financial assets and liabilities are disclosed in Accounting policy.
Measurements of financial instruments for which prices are quoted in an active market of which are based on generally accepted models with observable market data are not subject to material estimates. Measurements of f inancial instruments that are only to a limited extend based on observable market data, such as unlisted shares and certain bonds for which there is no longer an active market, are subject to estimates.
11 CASH AND BALANCES AT CENTRAL BANKS
2008 2007EURm
Cash 25,2 26,8Balances with central banks 102,0 264,0Total 127,2 290,8

39
12
EURm Assets Liabilities Assets Liabilities
Assets/liabilities held for trading 1 572,8 0,0 912,2 78,2Derivative financial instruments 1 257,9 1 243,6 516,9 592,7Financial assets/liabilities designated as at fair value through p/l 0,0 3 771,6 551,2 -
Total 2 830,7 5 015,2 1 980,4 671,0
2008 2007
FINANCIAL ASSETS AND LIABILITIES AT FAIR VALUE THROUGH P/L
ASSETS HELD FOR TRADING 2008 2007
Debt securitiesTreasury bills and other eligible bills 1 187,8 781,0Other debt securities 378,6 125,7Issued by public bodies 26,4 18,0 Government bonds 6,1 5,4 Other 20,3 12,5Certificates of deposit issued by banks 15,4 49,7Other debt securities 336,8 58,0Total debt securities 1 566,4 906,7
Exchange traded debt securities EURm 1 529.1 (EURm 638.3) and other EURm 37.3 (EURm 268,4).
Equity securities- listed 1,0 0,0- unlisted 5,4 5,6Total equity securities 6,4 5,6
Total assets held for trading 1 572,8 912,2
Assets pledged as collateral for liabilities or contingent liabilities presented in note 25. DERIVATIVE FINANCIAL INSTRUMENTS
Contract/ Contract/
EURmnotional amount
notional amount
Assets Liabilities Assets Liabilities
Interest rate derivativesOTC derivativesInterest rate swaps 11 774,3 329,0 285,2 19 531,8 81,2 143,9Cross-currency interest rate swaps 663,6 160,2 145,7 350,0 5,8 17,2Forward rate agreements 144,9 0,6 1,0 6 159,5 1,6 2,0Interest rate options, bought and sold 1 845,2 30,1 29,9 5 179,4 20,6 21,7Total OTC derivatives 14 428,0 519,9 461,8 31 220,8 109,2 184,7Exchange traded derivativesInterest rate futures 261,1 7,5 12,0 212,4 0,1 0,2Interest rate options, bought and sold 37,8 40,2Total exchange traded derivatives 261,1 45,3 52,2 212,4 0,1 0,2Total interest rate derivatives 14 689,1 565,2 514,0 31 433,2 109,3 184,9
Foreign exchange derivativesOTC derivativesForward foreign exchange contracts 5 248,1 338,1 336,0 5 067,5 50,4 55,7Currency options, bought and sold 198,2 17,7 17,7 673,3 11,2 8,5Total OTC derivatives 5 446,3 355,8 353,7 5 740,8 61,7 64,2Total foreign exchange derivatives 5 446,3 355,8 353,7 5 740,8 61,7 64,2
Fair value
Derivatives held for trading
Fair value
2008 2007

40
Equity derivativesOTC derivativesEquity and equity index options, bought and sold 1 243,0 58,2 61,0 2 049,2 99,2 101,2Total OTC derivatives 1 243,0 58,2 61,0 2 049,2 99,2 101,2Exchange traded derivativesEquity index futures 0,0 0,0 0,0Total exchange trade derivatives 0,0 0,0 0,0 0,0 0,0 0,0Total equity derivatives 1 243,0 58,2 61,0 2 049,2 99,2 101,2
Other derivativesOTC derivativesCommodity forwards 208,2 41,7 32,5 1 864,9 62,8 133,8Total OTC derivatives 208,2 41,7 32,5 1 864,9 62,8 133,8Exchange traded derivativesCommodity futures 1 008,8 175,9 176,5 578,9 73,8 37,4Total exchange trade derivatives 1 008,8 175,9 176,5 578,9 73,8 37,4Total commodity derivatives 1 217,0 217,6 209,0 2 443,7 136,6 171,2
22 595,4 1 196,8 1 137,7 41 666,9 406,9 521,5Total derivatives held for trading Derivatives held for hedging
Derivatives designated as fair value hedgesInterest rate derivativesInterest rate swaps 4 480,0 61,0 71,0 4 238,0 21,7 32,2Cross-currency interest rate swaps 320,0 0,0 35,0 377,4 88,3 39,1Total interest rate derivatives 4 800,0 61,0 106,0 4 615,4 110,1 71,3
Foreign exchange derivativesCurrency options, bought and sold 0,0 0,0 0,0
Equity derivativesEquity and equity index options, bought and sold 0,0 0,0 0,0
Total derivatives designated as fair value hedges 4 800,0 61,0 106,0 4 615,4 110,1 71,3
Derivatives designated as cash flow hedgesInterest rate derivativesInterest rate swaps - - - - - -
Total derivatives designated as cash flow hedges 0,0 0,0 0,0 0,0 0,0 0,0
Total derivatives held for hedging 4 800,0 61,0 106,0 4 615,4 110,1 71,3
Total derivative financial instruments 27 395,4 1 257,8 1 243,7 46 282,3 516,9 592,7
The Group uses derivative instruments for trading and for hedging purposes. The derivatives used are foreign exchange, interest rate, equity, commodity and credit derivatives. Derivatives held for trading relate primarily to customer business and, to a lesser degree to proprietary trading. Derivatives held for hedging purposes are used for hedging loans and liabilities.
Interest rate and interest rate and cross currency interest rate swaps are designated as fair value hedges, using them as hedges against changes in market interest rates and foreign exchange rates.
EURm 2008 2007Debt securitiesTreasury bills and other eligible bills 0,0 542,8Other debt securities 0,0 8,4
Government bonds 0,0 8,4Total debt securities 0,0 551,2
All debt securities are exchange traded.
FINANCIAL ASSETS DESIGNATED AS AT FAIR VALUE THROUGH P/L
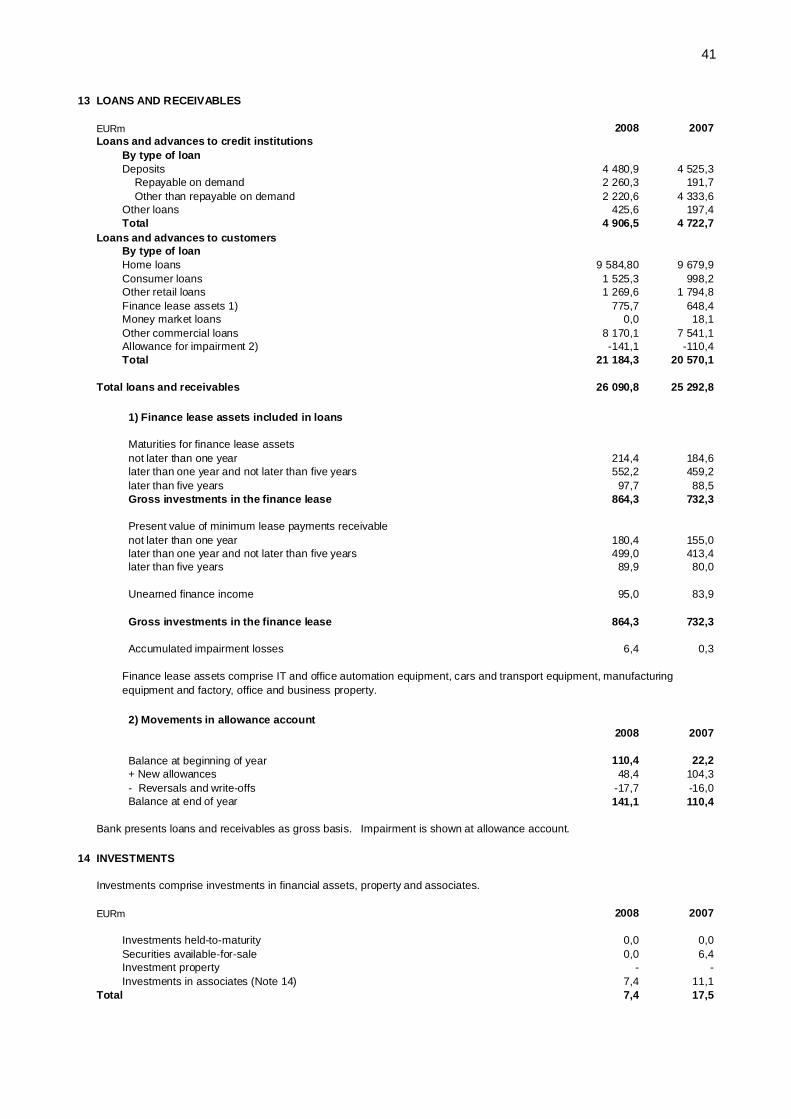
41
13 LOANS AND RECEIVABLES
EURm 2008 2007 Loans and advances to credit institutions
By type of loanDeposits 4 480,9 4 525,3 Repayable on demand 2 260,3 191,7 Other than repayable on demand 2 220,6 4 333,6Other loans 425,6 197,4Total 4 906,5 4 722,7
Loans and advances to customersBy type of loanHome loans 9 584,80 9 679,9Consumer loans 1 525,3 998,2Other retail loans 1 269,6 1 794,8Finance lease assets 1) 775,7 648,4Money market loans 0,0 18,1Other commercial loans 8 170,1 7 541,1Allowance for impairment 2) -141,1 -110,4Total 21 184,3 20 570,1
Total loans and receivables 26 090,8 25 292,8
1) Finance lease assets included in loans
Maturities for finance lease assets not later than one year 214,4 184,6 later than one year and not later than five years 552,2 459,2 later than five years 97,7 88,5 Gross investments in the finance lease 864,3 732,3
Present value of minimum lease payments receivable not later than one year 180,4 155,0 later than one year and not later than five years 499,0 413,4 later than five years 89,9 80,0
Unearned finance income 95,0 83,9
Gross investments in the finance lease 864,3 732,3
Accumulated impairment losses 6,4 0,3
Finance lease assets comprise IT and office automation equipment, cars and transport equipment, manufacturing equipment and factory, office and business property.
2) Movements in allowance account
2008 2007
Balance at beginning of year 110,4 22,2 + New allowances 48,4 104,3 - Reversals and write-offs -17,7 -16,0 Balance at end of year 141,1 110,4
Bank presents loans and receivables as gross basis. Impairment is shown at allowance account. 14 INVESTMENTS
Investments comprise investments in financial assets, property and associates.
EURm 2008 2007
Investments held-to-maturity 0,0 0,0Securities available-for-sale 0,0 6,4Investment property - -Investments in associates (Note 14) 7,4 11,1
Total 7,4 17,5

42
Financial assets 2008 2007
Investments held-to-maturityTreasury bills and other eligible bills - -Other debt securities 0,0 0,0Issued by public bodies Government bonds 0,0 0,0Other debt securities 0,0 0,0Total debt securities 0,0 0,0
All debt securities are exchange traded.
Total investments held-to-maturity 0,0 0,0
Securities available-for-saleDebt securitiesTreasury bills and other eligible bills 0,0 0,0Other debt securities 0,0 0,0 Government bonds - -Total debt securities 0,0 0,0
Equity securities- listed - -- unlisted 0,0 6,4Total 0,0 6,4
Total securities available-for-sale 0,0 6,4
Total investment securities 0,0 6,4
Investment property -
Investments in associates 7,4 11,1
TOTAL INVESTMENTS 7,4 17,5
Investments in financial assets were EURm 0.0 (EURm 6.4) and in other assets EURm 7.4 (EURm 11.1).
15 INVESTMENTS IN ASSOCIATES
EURm 2008 2007 At beginning of year 11,1 12,6Share of loss/profit -3,4 1,4Disposals -0,3 -2,9At end of year 7,4 11,1

43
Associates that have been accounted for by the equity method at 31 Dec. 2008
NameCarrying amount Fair value*)
% Interest held
Assets/ liabilities Revenue Profit/loss
MB Equity Fund Ky 0 0 20,91 0/0 1 1Automatia Pankkiautomaatit Oy 7 7 33,33 386/363 61 3Arfin Oy 0 0 33,33 39/39 0,5 0Tapio Technologies Oy 0 0 20,00 2/1 1,0 0 31.3.2008
*) If there is a published price quatation
Associates that have been accounted for by the equity method at 31 Dec. 2007
NameCarrying amount Fair value*)
% Interest held
Assets/ liabilities Revenue Profit/loss
MB Equity Fund Ky 0 0 20,91 0/0 0 0Automatia Pankkiautomaatit Oy 5 5 33,33 364/342 65 4Primasoft Oy 0 0 20,00 55/42 62 5
Associates not accounted for by the equity method at 31 Dec. 2007
Name Assets Liabilities Revenue Profit/lossTapio Technologies Oy 1,4 1 1 0 31.3.2007
16 INTANGIBLE ASSETS
Goodwill Other Total Goodwill Other Total
EURmintangible
assetsintangible
assetsAt 1 JanuaryCost 4,9 169,3 174,1 5,5 199,7 205,2Accumulated amortisation -165,4 -165,4 -140,5 -140,5Net carrying amount 4,9 3,9 8,7 5,5 59,2 64,7
Opening net carrying amount 4,9 3,9 8,8 5,5 59,2 64,7Additions 7,4 0,4 7,8 9,9 9,9Disposals 0,0 -0,6 -40,3 -40,9Amortisation charge -4,9 -3,9 -8,8 -24,9 -24,9Closing net carrying amount 7,4 0,4 7,8 4,9 3,9 8,7 At 31 DecemberCost 12,3 169,6 182,0 4,9 169,3 174,1Accumulated amortisation -4,9 -169,3 -174,2 -165,4 -165,4Net carrying amount at 31 December 7,4 0,4 7,8 4,9 3,9 8,7
Total intangible assets 7,4 0,4 7,8 4,9 3,9 8,7
Other intangible assets comprise mainly IT software. In 2007 goodwill consists of acquisition cost of banking licenceof ZAO Danske Bank. In 2008 goodwill consists mainly of Arvo Value Asset Management Ltd and 3C Asset Management Ltd.
2008 2007
In 2008 goodwill is tested for impairment by Danske Bank A/S. Impairment testing conducted did not indicate that goodwill and rights to names should be written down. Sensitivity analyses involving separate changes in the required rate of return and growth estimates did not produce results that affected this conclusion.

44
17 PROPERTY, PLANT AND EQUIPMENT
EURm Land and Land andbuildings Equipment Total buildings Equipment Total
At 1 JanuaryCost 3,6 87,6 91,2 11,2 79,4 90,6Accumulated depreciation -1,6 -64,5 -66,1 -1,6 -58,6 -60,2Accumulated impairment losses 0,0 0,0 0,0 0,0 0,0 0,0Net carrying amount 2,0 23,1 25,1 9,6 20,8 30,4
Opening net carrying amount 2,0 23,1 25,1 9,6 20,8 30,4Additions 0,0 6,9 6,9 0,0 9,2 9,2Disposals 0,0 -0,7 -0,7 -7,6 -1,1 -8,6Impairment losses recognised -0,4 0,0 -0,4 0,0 0,0 0,0Depreciations 0,0 -7,5 -7,5 -5,9 -5,9Closing net carrying amount 1,6 21,9 23,5 2,0 23,1 25,1 At 31 December Cost 3,6 93,9 97,5 3,6 87,6 91,2Accumulated depreciation -1,6 -72,0 -73,6 -1,6 -64,5 -66,1Accumulated impairment losses -0,4 0,0 -0,4 0,0 0,0 0,0Net carrying amount 1,6 21,9 23,5 2,0 23,1 25,1
Assets provided under operating lease contracts 76,6 65,1
Minimum lease payments under non-cancellable operating leasesnot later than one year 18,8 14,8later than one year and not later than five years 19,4 15,6Total 38,2 30,4
1,6 21,9 100,1 2,0 23,1 90,2
Equipment comprise IT equipment and furniture.
Total property, plant and equipment
2008 2007
18 OTHER ASSETS
EURm 2008 2007Other assets
Accrued interest 133,5 224,2Items in transit 0,0 0,3Other 270,8 215,4Total 404,4 439,9
Item Other includes i.e. sales and fee receivables and receivables from security transactions. 19 DEFERRED TAX ASSETS AND LIABILITIES
Changes in deferred tax during the financial year 2008
EURm At 1 Jan. 2008Recognised
in p/l accountRecognised
in equity At 31 Dec. 2008Deferred tax assets
Other deductible temporary differences 31,1 9,2 40,2Total deferred tax assets 31,1 9,2 0,0 40,2
Deferred tax liabilitiesDepreciation differences and untexed reserves 26,1 8,9 35,1Changes in fair values 0,2 -0,2 0,0Other taxable temporary differences 0,0 0,0Total deferred tax liabilities 26,3 9,0 -0,2 35,1
Deferred tax assets (-)/ tax liabilities (+), net -4,8 -0,2 -0,2 -5,1
If a deferred tax asset and a deferred tax liability relate to income taxes levied by the same taxation entity and the company has a legally enforceable right to set off current tax assets against current tax liabilities, deferred taxes have been offset.
Other tax assets EURm 16,37.Other tax liabilities EURm 0,0.

45
Changes in deferred tax during the financial year 2007
EURm At 1 Jan. 2007Recognised
in p/l accountRecognised
in equity At 31 Dec. 2007Deferred tax assets
Other deductible temporary differences 19,6 12,4 -1,0 31,1Total deferred tax assets 19,6 12,4 -1,0 31,1
Deferred tax liabilitiesDepreciation differences and untexed reserves 20,6 5,5 0,0 26,1Changes in fair values 0,0 0,0 0,2 0,2Other taxable temporary differences 0,0 0,0 0,0 0,0Total deferred tax liabilities 20,6 5,5 0,2 26,3
Deferred tax assets (-)/ tax liabilities (+), net 1,0 -7,0 1,2 -4,8
If a deferred tax asset and a deferred tax liability relate to income taxes levied by the same taxation entity and the company has a legally enforceable right to set off current tax assets against current tax liabilities, deferred taxes have been offset.
Other tax assets EURm 4.1.Other tax liabilities EURm 3.0.
20 TAXES
2008 2007EURm
Taxes on taxable income for the year 52,0 85,7Taxes arising from previous years 0,0 -2,7Deferred taxes -5,5 -7,4Taxes for the financial year total 46,5 75,6
Reconciliation between income taxes in income statement an taxescalculated at Finnish tax rate (26%)
Profit before taxes 181,6 775,7Taxes calculated at Finnish tax rate 47,2 201,7Different tax rates of foreign subsidiaries 0,0 0,1Tax-exempt income -45,5 -123,6Net profit from associates -0,9 -0,4Undeductible expenses 45,7 0,5Taxes arising from previous years 0,0 -2,7Taxes in Income statement 46,5 75,6
21 AMOUNTS OWED TO CREDIT INSTITUTIONS AND CUSTOMERS
EURm 2008 2007Amounts owed to credit institutions
Liabilities to central banks 350,8 15,4Deposits from credit insitutions 2 564,9 593,0Other liabilities owed to credit institutions 171,4 99,1Total 3 087,1 707,5
Amounts owed to customersDeposits
Demand deposits 2 081,3 2 358,1Savings accounts 2 375,4 1 824,6Current accounts 4 616,6 4 526,8Money market deposits 930,7 1 421,6Other time deposits 3 002,7 2 644,4Total deposits 13 006,7 12 775,5
Other liabilitiesOther liabilities 0,0 20,6
Total amounts owed to customers 13 006,7 12 796,1
Total amounts owed to credit institutions and customers 16 093,8 13 503,6

46
22 DEBT SECURITIES IN ISSUE
EURm 2008 2007Debt securities in issue
Certificates of deposit 3 771,6 4 425,0Bonds and notes 5 195,1 5 896,8of which in foreign currency 122,3 326,2
Total debt securities in issue8 966,7 10 321,8
Subordinated debt securitiesCapital securities 350,0 341,6Debentures 350,0 400,9Perpetuals
Total subordinated debt securities 700,0 742,5
Total debt securities in issue 9 666,7 11 064,3
Sampo Bank Group had in issue on 31 December 2008 three capital securities included in Tier 1 capital, all of them repayable with the consent of the Finnish Financial Supervision Authority and in one of them a step-up clause at the earliest call. The amount included in the own funds of primary loans in Sampo Bank Group at 31 Dec. 2008 was EUR 350,0 (346,5).
Sampo Housing Loan Bank issued in 2005 a covered bond with a principal of EURm 1 000 and a maturity of 5 years. The loan pays fixed interest rate of 2.5 per cent, which was swapped to floating rate at 0.01 per cent below Euribor.
Sampo Housing Loan Bank issued in September 2006 a covered bond with a principal of EURm 1 000 and a maturity of 5 years. The loan pays f ixed interest rate of 3.75 per cent, which was swapped to floating rate at 0.03 per cent below Euribor.
Sampo Bank issued on 18 March 2004 EUR 125 million preferred capital securities. The loan pays fixed interest rate for the f irst ten years and floating rate interest after that. The interest can be paid only from the distributable capital. The loan is perpetual and is repayable only with the consent of the Finnish Financial Supervision Authority at the earliest on 2014 and on any interest payment after that.
Sampo Bank issued on 13 October 2004 EUR 100 million preferred capital securities. The loan pays fixed interest rate for the f irst year and f loating rate interest after that, however capped to 8,5 per cent p.a. The interest can be paid only from the distributable capital. The loan is perpetual and is repayable only with the consent of the Finnish Financial Supervion Authority at the earliest on 2014 and on every interest payment date after that.
Sampo Bank issued on 16 December 2005 EURm 125 capital securities. The loan was a f loating rate perpetual and pays an interest at 3-month Euribor plus 1.6 per cent. The interest on the loan can be paid only from the distributable capital. Sampo Bank can repay the loan, with the consent of the Finnish Financial Supervision Authority, at the earliest on 16 December 2010 and thereafter on any interest payment date.
23 OTHER LIABILITIES
EURm 2008 2007Other liabilities
Deferred interest 110,4 359,9Items in transit 21,8 420,3Finance lease liabilitiesOther liabilities 432,0 190,1Total 564,2 970,3
Total other liabilities 564,2 970,3
Item Other consists of liabilities arising i.e. from staff expenses and security transactions, and other accruals.

47
24 PROVISIONS 2008 2007From off-balance sheet items 12,6 3,6
25 CONTINGENT LIABILITIES AND COMMITMENTS
EURm 2008 2007Off-balance sheet items
Guarantees and pledges 1 660,5 2 337,7Undrawn loans, overdraft facilities and other commitments to lend 2 708,1 3 819,7- original maturity less than one year 825,1 692,2- original maturity more than one year 1 883,0 3 127,5Other irrevocable commitments 0,0 0,0Total 4 368,6 6 157,4
Sampo Bank Group is continually a party to various lawsuits. The Group does not expect the outcomes of thesepending to have any material effect on its financial position.
Off-balance sheet items consist mainly of guarantees and commitments to extend credit. Guarantees including irrevocable letters of credit comprise commitments written on behalf of customers. Commitments to extend credit are irrevocable commitments and comprise undrawn loans, overdraft facilities and other commitments to lend. The commitments are stated to the amount that can be required to be paid on the basis of the commitment. For guarantees a provision is recognised when the Group considers it more likely than not that an obligation exists under its guarantees.
Assets pledged as collateral for liabilities or contingent liabilities
EURm
Assets pledged as collateral for liabilities Assets
pledged
Liabilities/ commit-
mentsAssets
pledgedLiabilities/
commit- mentsFinancial assets at fair value through p/l- Trading securities 1 072,60 753,0 1 061,1 605,2Loans and receivables- Loans and deposits 2 538,06 2 108,6 2 211,1 1 923,2
Sampo Bank plc has no commitments concerning IT-equipments (EURm 2.0).
EURm 2008 2007Non-cancellable operating leases
Minimum lease payments under non-cancellable operating leases not later than one year 27,9 26,1later than one year and not later than five years 82,6 62,9later than five years 57,9 39,6Total 168,3 128,6
Total of sublease payments expected to be received under non-cancellable operating sub-leases at 31 Dec EUR 7.3 million (7.5).
Sublease payments recognised as an expense in the period EUR 2.8 million (3.4).
Sampo Bank plc has entered into long-term deposit contracts called Guaranteed Investment Contracts. In each contract the maximum amount permitted to be invested and the fixed interest rate to be paid for the investment are specified with the customer. This means that the amount to be invested varies during the term of the contract but the interest rate is fixed. The maximum amount permitted to be invested under these contracts was EURm 87.6 at the balance sheet date (88.7 EURm). Contracts mature in 2025 at the latest.
2008 2007

48
26 EMPLOYEE BENEFITS
Pension benefitsThe basic and supplementary pension insurance of the staff is handled through insurances.
Personnel fund
Other short-term employee benefitsThere are other short-term staff incentive schemes in the Group, the terms of which vary according to country, business area or company. Benefits are recognised in the profit or loss for the year they arise from. An estimated amount of these profit-sharing bonuses for 2008 is EURm 9.7 (EURm 17.4).
Members of the Sampo Group’s personnel fund comprise the staff of Sampo Bank plc and its Finnish subsidiaries located in Finland, except for members of Board of Directors and Board of Management employed by the Group companies, Managing Directors of Group companies and other management personnel or executives and experts involved in the Group long-term incentive schemes. For Sampo Bank and its domestic subsidiaries the estimated amount of the profit-sharing bonuses to the personnel fund for 2008 is EURm 0 (EURm 3.0).
27 RELATED PARTY DISCLOSURES
KEY MANAGEMENT PERSONNEL
The key management personnel in Sampo Bank Group consists of ot the members of theBoard of Directors of Sampo Bank plc.
KEY MANAGEMENT COMPENSATION2008 2007
EUR mShort-term employee benefits 0,9 0,9Post employment benefits 0,4 0,3Other long-term benefits 0,1 4,6Total 1,4 5,8 Short-term employee benefits comprise salaries and fees, including profit-sharing bonusesaccounted for the year, and social security costs.
Post employment benefits include benefits under the Employees' Pensions Act (TyEL) in Finlandand voluntary supplementary pension benefits.
Other long-term benefits consists of the benefits under the long-term incentive schemes for executivesaccounted for the year. The benefits are determined by terms on Group level.Sampo Bank pays the benefits allocated to its key management.
LOANS AND RECEIVABLES2008 2007
EUR mKey management personnel with close family members and entities 0,0 0,0that are controlled or significantly influenced by these
The interest on loans to the key management personnel is at least as high as on the staff loans referred to in the Income and Capital Tax Act, section 67. Also other terms of the loans equal to the terms of the staff loans confirmed in the Group. The loans are secured. The terms of the loans to the entities controlled or significantly influenced by the above mentioned persons equal to those granted to other corporate customers.
ASSOCIATES
2008 2007EUR mLoans and receivables 148,3 121,1Liabilities to credit institutions and customers - 1,9

49
28 EQUITY AND RESERVESNumber of Share
Equity shares capitalAt 1 January 2008 106 106,0At 31 December 2008 106 106,0Total amount of shares at 31 December 2008 106 106,0
Each share has one vote.Danske Bank A/S owns all the share capital of Sampo Bank plc.
Reserves and retained earnings
EURmReserves at 31 December 2007Legal reserve 271,1Fair value reserve 0,6Total 271,7
Reserves at 31 December 2008Legal reserve 271,1Fair value reserve 0,0Total 271,1
Movements in reserves:
Legal reserveThe legal reserve comprises the amounts that shall be transferred from the distributable equity according to the articles of association or on the basis of the decision of the AGM. No change has been in the legal reserve duringthe financial years of 2007or 2008. Fair value reserveAt 1 January 2007 -2,5Cash flow hedge: Recognised in equity Transferred to profit or lossFinancial asset available-for-sale Recognised in equity 9,6 Transferred to profit or loss -6,4At 31 December 2007 0,6Cash flow hedge: Recognised in equity Transferred to profit or lossFinancial asset available-for-sale Recognised in equity Transferred to profit or loss -0,6At 31 December 2008 0,0
Sampo Bank group has no fair value reserve in 2008.The fair value reserve in 2007 consists of changes in the fair values of the financial assets available forsale and derivative financial instruments used for hedging cash flows. The changes in the fair values is presented on page 10 Statement of Changes in Equity.
Retained earningsAt 1 January 2007 808,6Translation differences -0,2Profit for the financial year 687,3Merger difference 14,6Dividend distribution 0,0Share incentives 0,0At 31 December 2007 1 510,2Translation differencesProfit for the financial year 133,4Merger difference 0,0Dividend distribution 0,0Share incentives 0,0At 31 December 2008 1 643,2

50
29 DIVIDENDS
The proposal of the Board of Directors to the annual general meeting will be as follows:No dividends will be distributed for 2008. Retained earnings will be accounted for in equity.

51
SAMPO BANK PLC
FINANCIAL STATEMENTS (FAS)
INCOME STATEMENTEURm 1-12.2008 1-12.2007
Interest income 1 336,8 1 087,4
Net income from leasing 38,4 38,9
Interest expenses -918,4 -688,0
NET INTEREST INCOME 456,9 438,3
Dividend incomefrom Group companies 29,1 35,1from associates 3,3 1,7from other companies 0,6 33,0 8,0 44,8
Fee and commission income 205,5 212,5
Fee and commission expenses -41,8 -37,1
Net income from transactions in securitiesand foreign exchange dealing
from transactions in securities 53,8 7,9from foreign exchange dealing 15,6 69,3 15,0 22,9
Net income from financial assetsavailable-for-sale 0,0 8,0
Gains (losses) from hedge accounting -7,0 -0,2
Net income from investment property 0,0 0,0
Other operating income 4,9 585,5
Administrative expensesStaff costs
Wages and salaries -163,9 -142,9Social security costs
Pension costs -33,3 -22,8Other -15,7 -212,9 -13,7 -179,4
Other administrative expenses -178,9 -391,7 -158,8 -338,2
Depreciation and impairment onproperty, plant and equipmentand intangible assets -15,0 -52,0
Other operating expenses -60,0 -48,2
Impairment on loans and advances -36,8 -60,9
Impairment on otherfinancial assets 0,0 0,0
OPERATING PROFIT 217,3 775,4
Appropriations -34,4 -21,2
Income taxes -30,5 -48,4
PROFIT FOR THE YEAR 152,4 705,8

52
SAMPO BANK PLC
BALANCE SHEET
EURm
ASSETS 12/2008 12/2007
Cash and balances at central banks 127,2 286,5
Treasury bills and othereligible bills
Treasury bills 0,0 543,9Other 1 187,8 1 187,8 757,4 1 301,3
Loans and advances to credit institutionsRepayable on demand 2 524,4 188,5Other 2 644,2 5 168,6 4 542,1 4 730,6
Loans and advances to customersRepayable on demand - -Other 18 319,6 18 319,6 17 835,2 17 835,2
Lease assets 847,3 716,1
Debt securitiesIssued by public bodies 26,4 12,8Other 99,9 126,3 156,2 169,0
Shares and participations 6,1 11,4
Shares and participationsin associates 5,2 5,4
Shares and participationsin Group companies 87,0 126,4
Derivative financial instruments 1 214,1 583,8
Intangible assets 0,0 2,3
Property, plant and equipmentInvestment property and shares and participationsin invesment property companies 0,0 0,0Other property and shares and participationsin property companies 1,4 2,0Equipment 20,4 21,8 23,0 24,9
Other assets 265,8 179,0
Prepayments andaccrued income 154,5 261,2
Deferred tax assets 40,2 31,4
27 571,4 26 264,7

53
LIABILITIES 12/2008 12/2007
LIABILIT IESLiabilities to credit institutions
Central banks 350,8 15,4Credit institutions
Repayable on demand 360,6 118,2Other 2.223,6 2.584,3 2.935,0 632,2 750,3 765,7
Liabilities to customersDeposits
Repayable on demand 9.442,0 9.401,0Other 2.637,6 12.079,6 2.021,1 11.422,1
Other liabilitiesRepayable on demand 353,9 -Other 602,0 955,9 13.035,5 1.454,6 1.454,6 12.876,7
Debt securities in issueBonds and notes 3.170,9 4.005,6Other 3.771,6 6.942,5 4.393,0 8.398,6
Derivative financial liabilities andother liabilities held for trading 1.227,7 675,7
Other liabilitiesOther liabilities 455,2 531,0Provisions for liabilities and charges - 455,2 - 531,0
Accruals and deferred income 234,9 421,3
Subordinated liabilitiesCapital securities 350,0 346,5Other 350,0 700,0 395,0 741,5
Deferred tax liabilities - -
ACCUMULATED APPROPRIATIONSDepreciation in excess or less than plan 87,6 53,2Untaxed reserves 47,3 134,9 47,3 100,5
EQUITYShare capital 106,0 106,0Undistributable reserves
Legal reserve 261,7 261,7Distributable reserves
Fair value reserveCash flow hedging - -Changes in fair value 0,0 0,8Deferred tax recognisedin equity 0,0 0,0 -0,2 0,6
Other reserves 43,8 43,8Retained earnings 1.341,6 635,8Profit for the year 152,4 1.905,5 705,8 1.753,6
27.571,4 26.264,7EURmOFF-BALANCE SHEET ITEMS
Contingent liabilitiesGuarantees and assets pledged 1.660,5 2.342,2Other - 1.660,5 - 2.342,2
CommitmentsSale and option to resell transactions - -Other 2.699,8 2.699,8 3.832,2 3.832,2
4.360,3 6.174,4

54
NOTES TO THE FINANCIAL STATEMENTS
ACCOUNTING POLICIES The separate financial statements of Sampo Bank plc for 2008 have been prepared in accordance with the provisions of Chapter 9 of the Act on Credit Institutions (121/2007), the Decree of the Ministry of Finance (150/2007) concerning annual accounts an Group accounts of financial institutions and investment services companies, and Standard 3.1 Financial statements and Annual report issued by the Finnish Financial Supervision Authority. In addition, the provisions of the Accounting Act and Companies Act are followed, with the exceptions mentioned in the Act on Credit Institutions, 146 §. Accounting policies applied to the separate financial statements of Sampo Bank are practically the same as those applied to the consolidated financial statements of Sampo Bank. Sampo Bank Group has prepared the consolidated financial statements in compliance with the International Financial Reporting Standards (IFRSs) as adopted by the EU. Policies that differ are defined below. LEASE ASSETS Lease assets are recognised in the balance sheet at cost, less depreciation according to plan and possible additional depreciation. The depreciation is recognised at the amount of principal recovered from the lease payments. Prepayments of lease assets are also included in this item. In Income statement, Net income from leasing activities comprise lease payments les depreciation according to plan. The item includes also additional depreciation on lease assets, profits and losses on disposal of the assets, fee and commission income and other income and expenses directly attributable to the leasing activities. Other income and expenses attributable to leasing are included in items according to their nature. IMPAIRMENT OF INTANGIBLE ASSETS AND PROPERTY, PLANT AND EQUIPMENT In the end of the financial year the Group assesses whether there is any indication that an intangible asset or an item of property, plant or equipment may be impaired. If any such indication exists, the Group will estimate the recoverable amount of the asset. APPROPRIATIONS In accordance with the Finnish regulations on accounting and taxation, companies are allowed to include in the accounts certain untaxed reserves and depreciation in excess or less than plan, which impact on the taxation of the companies. Companies use them in planning their accounts and taxation. The amount of those appropriations or changes in them does not reflect the risks of the companies. In the accounts the untaxed reserves and the difference between the depreciation according to plan and the amount deductible in the corporate taxation are shown as a separate item in the Income statement under “Appropriations” and in the Balance sheet under “Accumulated appropriations”. The appropriations shown in Income statement and Balance sheet are presented without deducting the deferred tax liability arising from them.
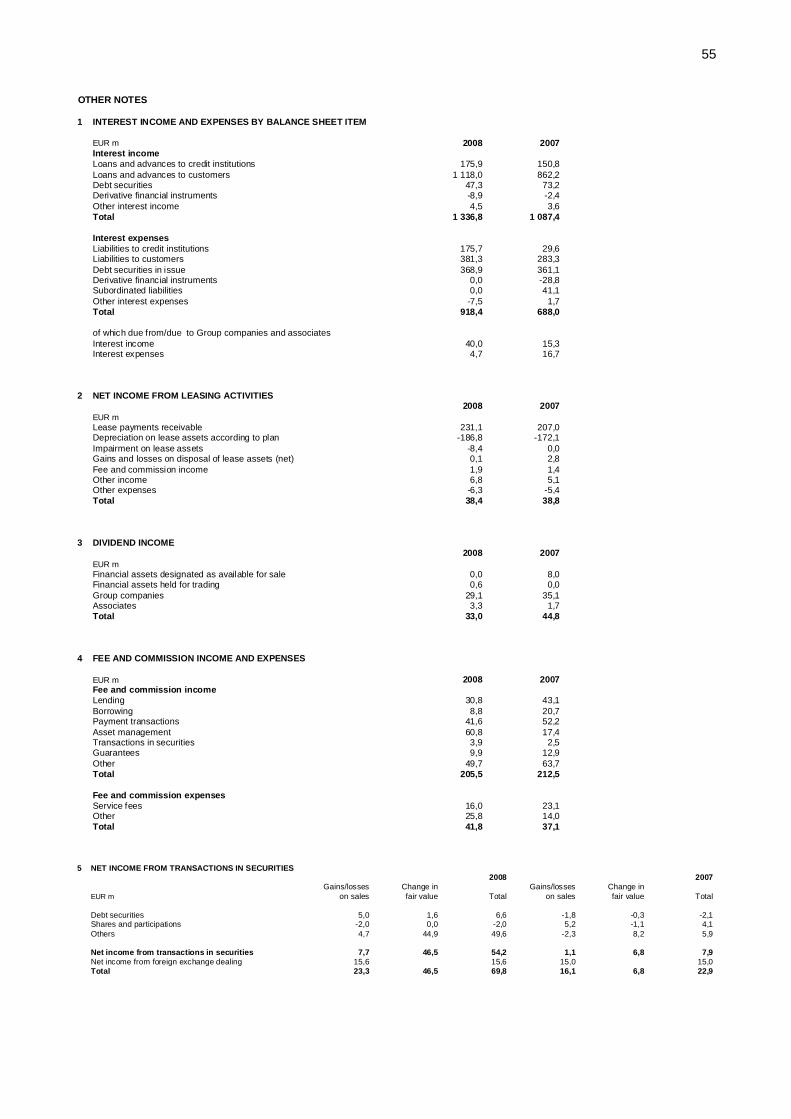
55
OTHER NOTES
1 INTEREST INCOME AND EXPENSES BY BALANCE SHEET ITEM
EUR m 2008 2007Interest incomeLoans and advances to credit institutions 175,9 150,8Loans and advances to customers 1 118,0 862,2Debt securities 47,3 73,2Derivative financial instruments -8,9 -2,4Other interest income 4,5 3,6Total 1 336,8 1 087,4
Interest expensesLiabilities to credit institutions 175,7 29,6Liabilities to customers 381,3 283,3Debt securities in issue 368,9 361,1Derivative financial instruments 0,0 -28,8Subordinated liabilities 0,0 41,1Other interest expenses -7,5 1,7Total 918,4 688,0
of which due from/due to Group companies and associatesInterest income 40,0 15,3Interest expenses 4,7 16,7
2 NET INCOME FROM LEASING ACTIVITIES
2008 2007EUR mLease payments receivable 231,1 207,0Depreciation on lease assets according to plan -186,8 -172,1Impairment on lease assets -8,4 0,0Gains and losses on disposal of lease assets (net) 0,1 2,8Fee and commission income 1,9 1,4Other income 6,8 5,1Other expenses -6,3 -5,4Total 38,4 38,8
3 DIVIDEND INCOME
2008 2007EUR mFinancial assets designated as available for sale 0,0 8,0Financial assets held for trading 0,6 0,0Group companies 29,1 35,1Associates 3,3 1,7Total 33,0 44,8
4 FEE AND COMMISSION INCOME AND EXPENSES
EUR m 2008 2007Fee and commission incomeLending 30,8 43,1Borrowing 8,8 20,7Payment transactions 41,6 52,2Asset management 60,8 17,4Transactions in securities 3,9 2,5Guarantees 9,9 12,9Other 49,7 63,7Total 205,5 212,5
Fee and commission expensesService fees 16,0 23,1Other 25,8 14,0Total 41,8 37,1
5 NET INCOME FROM TRANSACTIONS IN SECURITIES
Gains/losses Change in Gains/losses Change inEUR m on sales fair value Total on sales fair value Total
Debt securities 5,0 1,6 6,6 -1,8 -0,3 -2,1Shares and participations -2,0 0,0 -2,0 5,2 -1,1 4,1Others 4,7 44,9 49,6 -2,3 8,2 5,9
Net income from transactions in securities 7,7 46,5 54,2 1,1 6,8 7,9Net income from foreign exchange dealing 15,6 15,6 15,0 15,0Total 23,3 46,5 69,8 16,1 6,8 22,9
2008 2007

56
6 NET INCOME FROM AVAILABLE FOR SALE FINANCIAL ASSETS
Disposal of Transfer from Disposal of Transfer fromfinancial assets fair value financial assets fair value
EUR m (gains/losses) reserve Total (gains/losses) reserve Total
Debt securities 0,0 0,0 0,0 0,0 0,0Shares and participations 0,0 0,0 0,0 9,0 -1,1 8,0Total 0,0 0,0 0,0 9,0 -1,1 8,0
7 GAINS/LOSSES ON HEDGE ACCOUNTING
EUR m 2008 2007Fair value hedgingChange in fair value of hedging instruments, net, of which 8,7 5,3 Derivatives hedging assets -57,1 8,6 Derivatives hedging liabilities 65,8 -3,4
Change in fair value of hedged items, net, of which -15,7 -5,5 Assets 54,4 -8,2 Liabilities -70,1 2,8
Total -7,0 -0,2
8 OTHER OPERATING INCOME AND EXPENSES
EUR m 2008 2007Other operating incomeOther 4,9 585,5Total 4,9 585,5
Other operating expensesRental expenses 42,1 26,3Expenses on properties and property companies 0,0 0,1Other 17,9 21,9Total 60,0 48,3
9 DEPRECIATION AND IMPAIRMENT ON PROPERTY, PLANT AND EQUIPMENT AND INTANGIBLE ASSETS
EUR m 2008 2007
Depreciation and amortisation according to plan 15,0 52,0
2008 2007
10 IMPAIRMENT ON LOANS, COMMITMENTS AND OTHER FINANCIAL ASSETS
Individually Reversals RecognisedEUR m assessed and in profit or loss
impairment, gross write-offsFromOn loans and advances to customers 55,1 18,3 -36,8Guarantees and other off-balance sheet items 0,0 0,0 0,0Impairment on loans and advances andon off-balance sheet items total 55,1 18,3 -36,8Shares and participations in Group companies 0,0 0,0 0,0Impairment losses on other financial assets totalTotal 0,0 0,0 0,0
55,1 18,3 -36,8
Individually Reversals RecognisedEUR m assessed and in profit or loss
impairment, gross write-offsFromOn loans and advances to customers 73,7 11,9 -61,7Guarantees and other off-balance sheet items -0,8 0,0 0,8Impairment on loans and advances andon off-balance sheet items total 72,9 12,0 -60,9Shares and participations in Group companies 0,0 0,0Impairment losses on other financial assets total 0,0 0,0 0,0Total 72,9 12,0 -60,9
2008
2007

57
11 INFORMATION ON BUSINESS AREAS AND GEOGRAPHICAL MARKET AREAS
EUR m Banking in Finland Asset and Wealth Integration Totaland other functions management
Net interest income 458,2 0,0 -1,3 456,9Impairment losses -36,8 -36,8Other income, net 229,3 34,8 -0,1 264,0Total income 650,7 34,8 -1,4 684,1Total operating expenses 409,5 13,3 78,4 501,2Profit before taxes 241,2 21,5 -79,7 183,0
Total assets 27 540,3 31,1 27 571,4of which loans and advances to creditinstitutions and customers 23 441,5 46,7 23 488,2
Total liabilities 25 809,2 9,1 25 818,3of wich liabilities to credit institutionsand customers 15 970,3 0,3 15 970,6
Average staff number 3 014 66 3 080
EUR m Banking in Finland Asset and Wealth Integration Totaland other functions management
Net interest income 438,3 0,0 0,0 438,3Impairment losses -60,9 -60,9Other income, net 828,1 8,4 -0,1 836,4Total income 1 205,4 8,4 -0,1 1 213,8Total operating expenses 407,9 3,5 48,2 459,6Profit before taxes 797,5 5,0 -48,3 754,1
Total assets 26 264,7 0,0 0,0 26 264,7of which loans and advances to creditinstitutions and customers 22 565,8 0,0 0,0 22 565,8
Total liabilities 25 219,1 0,0 0,0 25 219,1of wich liabilities to credit institutionsand customers 13 642,4 0,0 0,0 13 642,4
Average staff number 2 985 17 0 3 002
2007
2008
12 LOANS AND ADVANCES TO CREDIT INSTITUTIONS
Total Repeyable Other Total Repeyable OtherEUR m on demand on demand
Domestic credit institutions 1 988,8 584,2 1 404,6 30,8 21,0 9,8Foreign credit institutions 3 179,7 1 940,2 1 239,5 4 699,8 167,5 4 532,3Total 5 168,5 2 524,4 2 644,1 4 730,6 188,5 4 542,1
13 LOANS AND ADVANCES TO CUSTOMERS2008 2007
EUR mCorporates and housing companies 7 193,1 6 519,7Financial and insurance institutions 167,7 363,1Public sector entities 132,4 150,1Households 10 077,3 10 058,8Non-profit institutions serving households 156,5 139,5Foreign 592,5 604,0Total 18 319,6 17 835,2
Impairment losses on loans and advances recognised for the year
Impairment losses at beginning of year 110,4 10,0 + Impairment losses recognised on individual loans and advances 48,4 104,3 - Reversals of impairment losses recognised for individual loans and advances -17,7 -3,9Impairment losses at end of year 141,1 110,4
Bank presents loans and receivables as gross basis. Impairment is shown at allowance account.
2008 2007

58
14 DEBT SECURITIES
EUR m Listed Other Total Listed Other TotalIssued by public bodiesHeld for trading 266,6 2,8 269,4 544,2 12,5 556,7Treasury bills 5,7 - 5,7 0,0Local authority paper 12,4 2,8 15,2 7,1 7,1Government bonds 248,5 - 248,5 544,2 5,4 549,6Debt securities issued by other borrowers* 970,3 74,5 1 044,8 41,5 872,1 913,6Debt securities total 1 236,9 77,3 1 314,1 585,7 884,6 1 470,3of which treasury bills and other eligible bills 1 187,8 - 1 187,8 544,1 - 544,1of which subordinated debt securities 0,0 0,0 0,0 1,0 0,0 1,0* broken down in the table below
Listed Other Total Listed Other TotalDebt securities issued by other borrowersHeld for trading 970,3 74,5 1 044,8 41,5 832,0 873,5Certif icates of deposit 942,9 15,4 958,3 - 806,9 806,9Commercial paper - - 0,0 - 6,7 6,7Bonds issued by banks - 12,8 12,8 9,5 18,4 27,9Other bonds 27,3 46,2 73,6 32,0 0,0 32,0Available-for-sale 0,0 0,0 0,0 0,0 40,1 40,1Other bonds - - 0,0 40,1 40,1Debt securities issued by other borrowers total 970,3 74,5 1 044,8 41,5 872,1 913,6
2008 2007
15 ASSETS HELD UNDER FINANCE LEASES
2008 2007EUR mPrepayments 28,3 35,4Equipment 748,8 608,2Properties and building 60,6 64,0Other assets 9,6 8,5Total 847,3 716,1
16 SHARES AND PARTICIPATIONS
EUR m of which in credit of which in creditinstitutions institutions
Shares and participations 6,1 1,3 11,4 0,0Held for trading 6,1 1,3Available-for-sale 0,0 0,0 11,4 0,0Shares and participations in Group companies 87,0 87,0 126,4 0,0Shares and participations in associates 5,2 0,0 5,4Total 98,3 88,3 143,3 0,0
2008 2007
17 DERIVATIVE FINANCIAL INSTRUMENTS
EUR mLess than 1 year 1-5 years Over 5 years Positive Negative
For hedging purposesInterest rate derivatives 631,0 606,0 1 243,0 23,1 71,0Interest rate swaps 631,0 606,0 1 243,0 23,1 71,0
Exchange rate contracts 224,0 7,0 89,0 0,0 35,0Options
Purchased 0,0 0,0 0,0 0,0 0,0Written 0,0 0,0 0,0 0,0 0,0
Interest rate and cross currency swaps 224,0 7,0 89,0 0,0 35,0
Equity contracts 0,0 0,0 0,0 0,0 0,0Options 0,0 0,0 0,0 0,0 0,0
Purchased 0,0 0,0 0,0 0,0 0,0Written 0,0 0,0 0,0 0,0 0,0
Nominal value of the underlying instrumentRemaining maturity
Fair value2008
For other purposesInterest rate contracts 10 900,4 16 598,5 1 674,4 440,3 394,1Futures and forward rate agreements 371,3 0,0 0,0 2,2 13,0Options 0,0 0,0 0,0 67,9 70,1
Purchased 202,9 1 218,8 509,2 0,0 0,0Written 230,4 1 146,0 452,5 0,0 0,0
Interest rate swaps 10 095,8 14 233,6 712,7 370,2 311,0
Exchange rate contracts 11 994,4 881,6 107,5 516,0 499,4Futures and forward exchange 10 135,5 343,3 0,0 338,1 336,0Options 0,0 0,0 0,0 17,7 17,7
Purchased 196,7 9,1 5,8 0,0 0,0Written 198,0 0,0 0,0 0,0 0,0
Interest rate and cross currency swaps 1 464,2 529,2 101,8 160,2 145,7
Equity contracts 2 486,0 0,0 0,0 17,0 19,3Options 0,0 0,0 0,0 17,0 19,3
Purchased 1 243,0 0,0 0,0 0,0 0,0Written 1 243,0 0,0 0,0 0,0 0,0
Other derivatives 278,4 485,0 202,4 217,6 209,0Futures and forwards 278,4 485,0 202,4 217,6 209,0
Contracts with Group companies 1 892,1 2 015,5 114,4 0,0 0,0
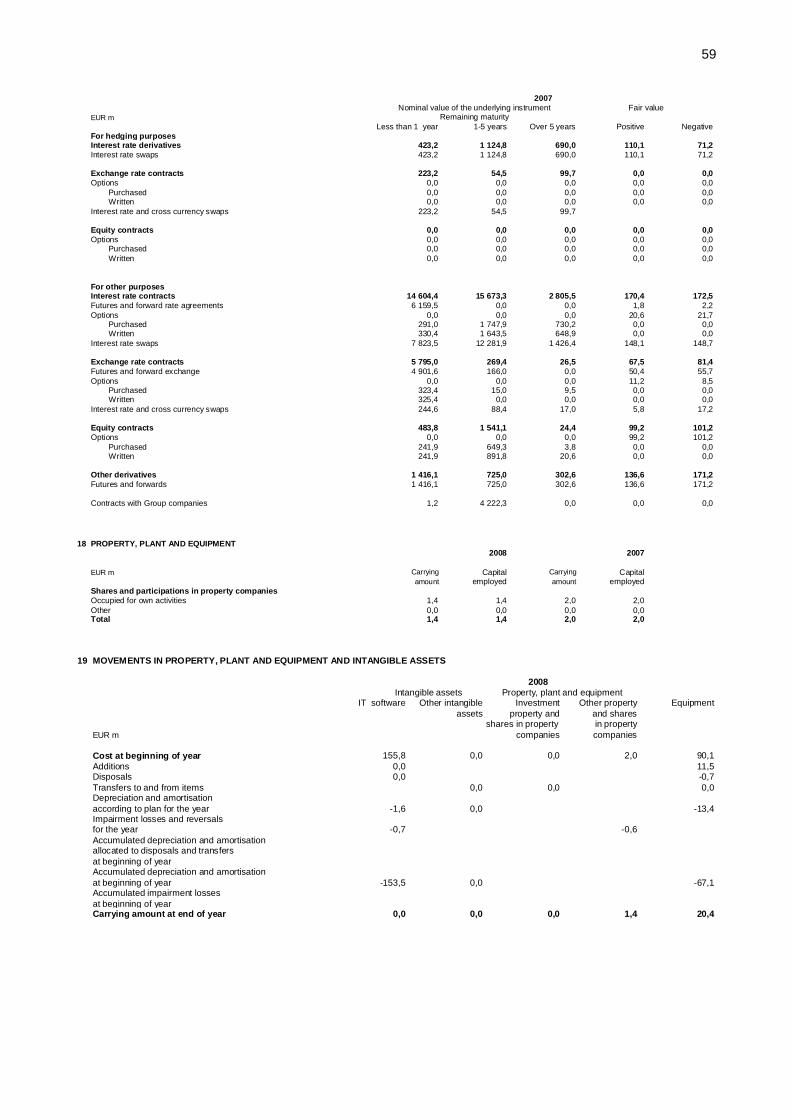
59
EUR mLess than 1 year 1-5 years Over 5 years Positive Negative
For hedging purposesInterest rate derivatives 423,2 1 124,8 690,0 110,1 71,2Interest rate swaps 423,2 1 124,8 690,0 110,1 71,2
Exchange rate contracts 223,2 54,5 99,7 0,0 0,0Options 0,0 0,0 0,0 0,0 0,0
Purchased 0,0 0,0 0,0 0,0 0,0Written 0,0 0,0 0,0 0,0 0,0
Interest rate and cross currency swaps 223,2 54,5 99,7
Equity contracts 0,0 0,0 0,0 0,0 0,0Options 0,0 0,0 0,0 0,0 0,0
Purchased 0,0 0,0 0,0 0,0 0,0Written 0,0 0,0 0,0 0,0 0,0
For other purposesInterest rate contracts 14 604,4 15 673,3 2 805,5 170,4 172,5Futures and forward rate agreements 6 159,5 0,0 0,0 1,8 2,2Options 0,0 0,0 0,0 20,6 21,7
Purchased 291,0 1 747,9 730,2 0,0 0,0Written 330,4 1 643,5 648,9 0,0 0,0
Interest rate swaps 7 823,5 12 281,9 1 426,4 148,1 148,7
Exchange rate contracts 5 795,0 269,4 26,5 67,5 81,4Futures and forward exchange 4 901,6 166,0 0,0 50,4 55,7Options 0,0 0,0 0,0 11,2 8,5
Purchased 323,4 15,0 9,5 0,0 0,0Written 325,4 0,0 0,0 0,0 0,0
Interest rate and cross currency swaps 244,6 88,4 17,0 5,8 17,2
Equity contracts 483,8 1 541,1 24,4 99,2 101,2Options 0,0 0,0 0,0 99,2 101,2
Purchased 241,9 649,3 3,8 0,0 0,0Written 241,9 891,8 20,6 0,0 0,0
Other derivatives 1 416,1 725,0 302,6 136,6 171,2Futures and forwards 1 416,1 725,0 302,6 136,6 171,2
Contracts with Group companies 1,2 4 222,3 0,0 0,0 0,0
Nominal value of the underlying instrument Fair value2007
Remaining maturity
18 PROPERTY, PLANT AND EQUIPMENT
2008 2007
EUR m Carrying Capital Carrying Capitalamount employed amount employed
Shares and participations in property companiesOccupied for own activities 1,4 1,4 2,0 2,0Other 0,0 0,0 0,0 0,0Total 1,4 1,4 2,0 2,0
19 MOVEMENTS IN PROPERTY, PLANT AND EQUIPMENT AND INTANGIBLE ASSETS
IT software Other intangible Investment Other property Equipmentassets property and and shares
shares in property in propertyEUR m companies companies
Cost at beginning of year 155,8 0,0 0,0 2,0 90,1Additions 0,0 11,5Disposals 0,0 -0,7Transfers to and from items 0,0 0,0 0,0Depreciation and amortisationaccording to plan for the year -1,6 0,0 -13,4Impairment losses and reversals for the year -0,7 -0,6Accumulated depreciation and amortisationallocated to disposals and transfersat beginning of yearAccumulated depreciation and amortisationat beginning of year -153,5 0,0 -67,1Accumulated impairment lossesat beginning of yearCarrying amount at end of year 0,0 0,0 0,0 1,4 20,4
2008 Intangible assets Property, plant and equipment

60
IT software Other intangible Investment Other property Equipmentassets property and and shares
shares in property in propertyEUR m companies companies
Cost at beginning of year 153,0 16,4 13,7 2,0 75,1Additions 9,2 9,2Disposals -6,4 -1,2Transfers to and from items -6,9 -13,7 6,9Depreciation and amortisationaccording to plan for the year -38,7 -5,3 -7,8Impairment losses and reversals for the yearAccumulated depreciation and amortisationallocated to disposals and transfersat beginning of yearAccumulated depreciation and amortisationat beginning of year -114,7 -4,2 -59,4Accumulated impairment lossesat beginning of yearCarrying amount at end of year 2,3 0,0 0,0 2,0 23,0
Intangible assets Property, plant and equipment2007
20 OTHER ASSETS
2008 2007EUR mItems in transit 0,1 0,3Margin accounts related to derivatives 14,5 28,2Other 251,2 150,6Total 265,8 179,0
21 PREPAYMENTS AND ACCRUED INCOME2008 2007
EUR mAccrued interest 124,9 247,6Other 29,6 13,6Total 154,5 261,2
22 DEFERRED TAX 2008 2007
EUR mDeferred tax assets 40,2 31,4Timing differences 40,2 31,4Deferred tax liabilities 0,0 0,0Timing differences 0,0 -0,2Fair value reserve 0,0 0,2Deferred tax assets (-)/ liabilities (+), net -40,2 -31,4
23 DEBT SECURITIES IN ISSUE
EUR m Carrying amount Nominal amount Carrying amount Nominal amountCertif icates of Deposits 3 771,6 4 529,2 4 425,0 4 471,3Bonds and notes 3 170,9 3 239,0 3 973,6 4 076,2Total 6 942,5 7 768,2 8 398,6 8 547,5
24 OTHER LIABILITIES2008 2007
EUR mItems in transit 186,7 420,3Other 268,5 110,7Total 455,2 531,0
25 ACCRUALS AND DEFERRED INCOME2008 2007
EUR mDeferred interest 92,5 338,6Other 142,5 82,7Total 234,9 421,3
2008 2007

61
26
EUR m 2008 2007Subordinated liabilities with a carrying amount more than10% of the total amount of such liabilities 700,0 700,0Other subordinated liabilities 0,0 47,4Total 700,0 747,4
of which perpetuals 350,0 346,5
Due to Group companies - -Due to associates - -
Issuer Carrying Nominal Currency Interest Due dateamount amount %
in EURm in EURm
Sampo Bank plc 1) 150,0 150,0 EUR 3,74 17.3.2014Sampo Bank plc 2) 200,0 200,0 EUR 4,13 31.5.2016Sampo Bank plc 3) 125,0 125,0 EUR 5,41 perpetualSampo Bank plc 2) 125,0 125,0 EUR 4,88 perpetualSampo Bank plc 4) 100,0 100,0 EUR 4,57 perpetualTotal 700,0 700,0
1) Repayable on interest payment date in March 2009. In capital adequacy calculation the debenture is included in its entirety in Tier 2 capital.2) Repayable on interest payment date in May 2011. In capital adequacy calculation the debenture is included in its entirety in Tier 2 capital.3) Repayable on interest payment date in March 2014. In capital adequacy calculation EURm 124,6 of capital securities areincluded in their entirety in Tier 1 capital.4) Repayable on interest payment date in December 2010. In capital adequacy calculation EURm 123,3 of capital securities areincluded in their entirety in Tier 1 capital.5) Repayable on interest payment date in October 2014. In capital adequacy calculation EURm 98.6 of capital securities areincluded in their entirety in Tier 1 capital.
Capital securities at 31 December 2008 350,0 (341,6)
Sampo Bank had on 31 December 2008 three capital securities in issue. The main terms of these loans are disclosedin IFRS consolidated financial statements/Note 22 Debt Securities in Issue.
SUBORDINATED LIABILITIES

62
27 MATURITY ANALYSIS OF ASSETS AND LIABILITIES, BY REMAINING MATURITY
EUR m 2008 2007AssetsLess than 3 months 7 519,9 7 497,0Treasury bills and other eligible bills 397,9 750,3Loans and advances to credit institutions 4 361,7 4 471,5Loans and advances to customers 2 727,9 2 206,4Debt securities 32,4 68,73 - 12 months 2 988,1 2 000,6Treasury bills and other eligible bills 545,0 310,7Loans and advances to credit institutions 661,1 158,3Loans and advances to customers 1 763,5 1 529,6Debt securities 18,5 2,01 - 5 years 6 229,0 5 595,4Treasury bills and other eligible bills 242,9 240,2Loans and advances to credit institutions 145,8 100,8Loans and advances to customers 5 770,7 5 167,8Debt securities 69,6 86,75 - 10 years 3 985,5 3 595,8Treasury bills and other eligible bills 2,0 0,1Loans and advances to credit institutions 0,0 0,0Loans and advances to customers 3 978,2 3 584,1Debt securities 5,3 11,6Over 10 years 4 079,7 5 347,3Treasury bills and other eligible bills 0,0 0,0Loans and advances to credit institutions 0,0 0,0Loans and advances to customers 4 079,3 5 347,3Debt securities 0,4 0,0
EUR mLiabilitiesLess than 3 months 19 120,6 16 356,2Liabilities to credit institutions 2 934,9 610,5Liabilities to customers 12 766,4 12 158,7Debt securities in issue 3 269,3 3 587,1Subordinated liabilities 150,0 0,03 - 12 months 1 962,9 2 326,2Liabilities to credit institutions 0,2 45,8Liabilities to customers 38,6 601,9Debt securities in issue 1 924,1 1 677,2Subordinated liabilities 0,0 1,21 - 5 years 1 703,1 2 480,2Liabilities to credit institutions 0,0 35,4Liabilities to customers 190,5 104,3Debt securities in issue 1 512,6 2 190,5Subordinated liabilities 0,0 150,05 - 10 years 584,9 1 394,4Liabilities to credit institutions 0,0 74,0Liabilities to customers 38,9 10,5Debt securities in issue 221,0 935,6Subordinated liabilities 325,0 374,3Over 10 years 241,6 225,5Liabilities to credit institutions 0,0 0,0Liabilities to customers 1,1 1,4Debt securities in issue 15,5 8,1Subordinated liabilities 225,0 216,0
28 ASSETS AND LIABILITIES DENOMINATED IN DOMESTIC CURRENCY (EURO) AND
IN FOREIGN CURRENCIES (OTHER CURRENCIES)
EUR m Other Total To or from Groupcurrencies companies
AssetsLoans and advances to credit institutions 4 964,0 204,6 5 168,6 266,1Loans and advances to customers 17 732,4 587,2 18 319,6Debt securities 1 308,2 5,9 1 314,1 40,0Derivative financial assets 1 214,1 0,0 1 214,1 16,4Other assets 1 532,6 22,3 1 555,0 0,2Total 26 751,3 820,0 27 571,3 322,6
LiabilitiesLiabilities to credit institutions 2 144,4 790,7 2 935,0 16,0Liabilities to customers 12 790,2 245,3 13 035,5Debt securities in issue 6 820,2 122,3 6 942,5Derivative financial liabilities andother liabilities held for trading 1 227,7 0,0 1 227,7 43,9Other liabilities 1 334,1 56,1 1 390,2 0,2Total 24 316,6 1 214,4 25 531,0 60,1
2008

63
EUR m Other Total To or from Groupcurrencies companies
AssetsLoans and advances to credit institutions 4 486,9 243,7 4 730,6Loans and advances to customers 17 256,9 578,2 17 835,2 114,4Debt securities 1 464,8 5,5 1 470,3Derivative financial assets 391,0 192,8 583,8Other assets 1 527,3 117,4 1 644,8 6,6Total 25 127,0 1 137,6 26 264,7 121,1
LiabilitiesLiabilities to credit institutions 307,4 458,3 765,7Liabilities to customers 12 475,6 401,0 12 876,7 1,9Debt securities in issue 8 072,4 326,2 8 398,6Derivative financial liabilities andother liabilities held for trading 515,1 160,7 675,7Other liabilities 1 619,9 174,6 1 794,5Total 22 990,4 1 520,8 24 511,2 1,9
2007
29 CHANGES IN FAIR VALUES RECOGNISED IN INCOME STATEMENT
2008 2007EUR mFinancial assets designated as at fair valueDebt securities 1,6 -0,3Shares and participations 0,0 -1,1Other 44,9 8,2Total 46,5 6,8
30 MOVEMENTS IN EQUITY
Share Legal Fair value Other Retained TotalEUR m capital reserve reserve reserves earnings
Carrying amount at 1 Jan. 2008 106,0 261,7 0,6 43,8 1 341,6 1 753,6Additions 0,0Decreases -0,6 -0,6Dividends 0,0Profit for the year 152,4 152,4Carrying amount at 31 Dec. 2008 106,0 261,7 0,0 43,8 1 494,0 1 905,5
Fair value reserve at 1 Jan. 2008 Available for sale financial assets 0,8 Cash flow hedging 0,0 Deferred tax liability -0,2Total 0,6
Retained earnings at 1 Jan. 2008 1 341,6Dividends 0,0Profit for the year 152,4Retained earnings at 31 Dec. 2008 1 494,0
Distributable equity at 31 December 2008Parent companyOther reserves 43,8Retained earnings 1 341,6Profit for the year 152,4Decreases 0,0Total 1 537,7
2008
Share Legal Fair value Other Retained TotalEUR m capital reserve reserve reserves earnings
Carrying amount at 1 Jan. 2007 106,0 261,7 -2,7 29,1 635,6 1 029,7Additions 3,3 14,6 17,9Decreases 0,0Dividends 0,0Profit for the year 705,8 705,8Carrying amount at 31 Dec. 2007 106,0 261,7 0,6 43,8 1 341,4 1 753,4
Fair value reserve at 1 Jan. 2007 Available for sale financial assets -3,7 Cash flow hedging 0,0 Deferred tax liability 1,0Total -2,7
Retained earnings at 1 Jan. 2007 635,6Dividends 0,0Profit for the year 705,8Retained earnings at 31 Dec. 2007 1 341,4
Distributable equity at 31 December 2007Parent companyOther reserves 43,8Retained earnings 635,6Profit for the year 705,8Decreases 0,0Total 1 385,1
2007

64
31 SHARE CAPITAL
Sampo The share capital of Sampo Bank plc amounts to EUR 106,000,000.00, comprising 106,000 shares.Each share has one vote.
32 SHARE ISSUES, OPTION RIGHTS AND ISSUE OF CONVERTIBLE BONDS
Sampo Bank has not issued new shares, option rights nor convertible bonds during the year.The Bank has no valid authority granted by the annual general meeting to issue new shares, option rights or convertible bonds.
33 SHAREHOLDIGS AND PRINCIPAL SHAREHOLDERS
Danske Bank A/S owns all the share capital of Sampo Bank plc.
34 ASSETS PLEDGED AS COLLATERAL SECURITY2008 2007
EUR mPledged for own liabilities Pledges PledgesBalance sheet itemDerivative financial liabilities andother liabilities held for trading 73,5 140,1Total assets pledged 1 363,0 1 139,7Total pledged for own liabilities 1 436,5 1 279,8 of which on behalf of Group companies 0,0 0,0Pledged on behalf of others 78,9 47,0 of which on behalf of related party executives 0,0 0,0
35 PENSION LIABILITY
The basic and supplemantery pension benefits of the staff in Sampo Bank plc and its Group companies are handled through insurance.
36 FUTURE RENTAL COMMITMENTS
2008 2007EUR mNot more than one year 27,9 26,1Over one year but not more than five years 82,6 62,9Over five years 57,9 39,6Total 168,3 128,6
37 OFF-BALANCE SHEET ITEMS
2008 2007EUR mGuarantees and pledges 1 660,5 2 342,2
of which on behalf of Group companies 4,4 4,4on behalf of associates - -
Sale and option to resell transactionsUndrawn loans, overdraft facilities andcommitments to lend 2 699,8 3 832,2
to Group companies 0,0 12,5to associates 12,7 7,3
Underwriting commitmentsOther commitments
to or on behalf of Group companiesto or on behalf of associates
Total off-balance sheet items 4 360,3 6 174,4to or on behalf of Group companies 4,4 16,9to or on behalf of associates 12,7 7,3
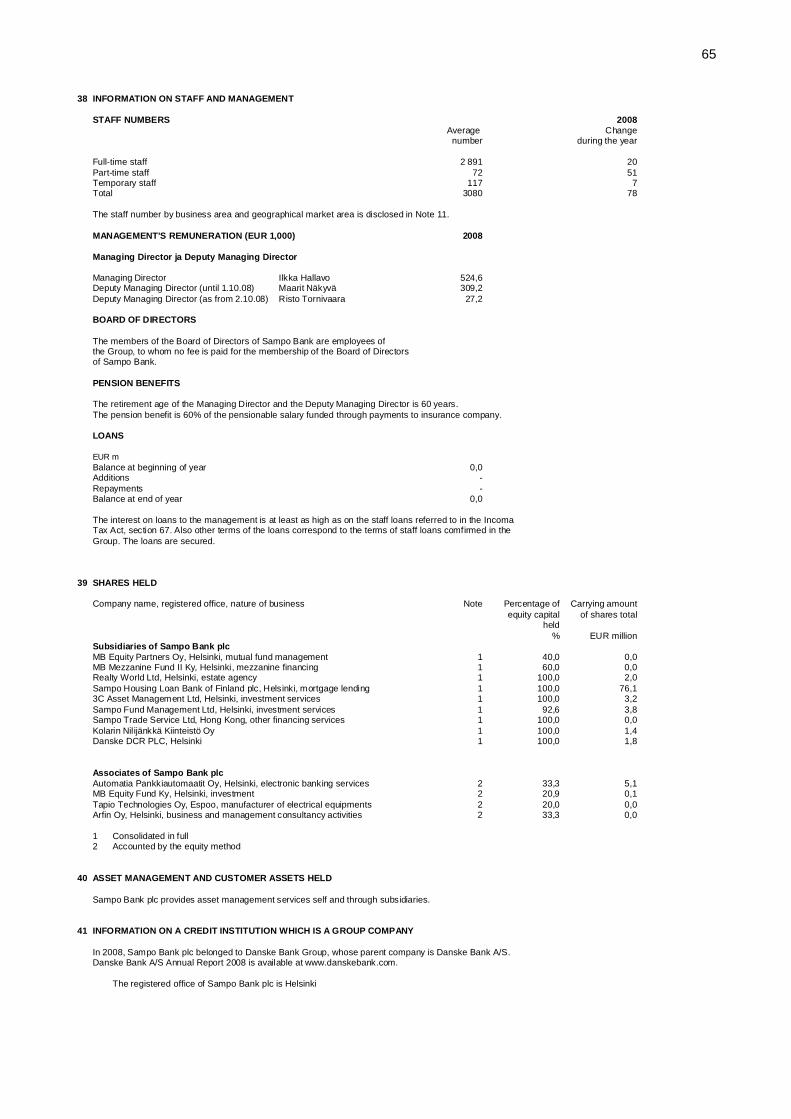
65
38 INFORMATION ON STAFF AND MANAGEMENT
STAFF NUMBERS 2008Average Change
number during the year
Full-time staff 2 891 20Part-time staff 72 51Temporary staff 117 7Total 3080 78
The staff number by business area and geographical market area is disclosed in Note 11.
MANAGEMENT'S REMUNERATION (EUR 1,000) 2008
Managing Director ja Deputy Managing Director
Managing Director Ilkka Hallavo 524,6Deputy Managing Director (until 1.10.08) Maarit Näkyvä 309,2Deputy Managing Director (as from 2.10.08) Risto Tornivaara 27,2
BOARD OF DIRECTORS
The members of the Board of Directors of Sampo Bank are employees ofthe Group, to whom no fee is paid for the membership of the Board of Directorsof Sampo Bank.
PENSION BENEFITS
The retirement age of the Managing Director and the Deputy Managing Director is 60 years.The pension benefit is 60% of the pensionable salary funded through payments to insurance company. LOANS
EUR mBalance at beginning of year 0,0Additions -Repayments -Balance at end of year 0,0
The interest on loans to the management is at least as high as on the staff loans referred to in the IncomaTax Act, section 67. Also other terms of the loans correspond to the terms of staff loans comfirmed in theGroup. The loans are secured.
39 SHARES HELD
Company name, registered office, nature of business Note Percentage of Carrying amountequity capital of shares total
held % EUR million
Subsidiaries of Sampo Bank plcMB Equity Partners Oy, Helsinki, mutual fund management 1 40,0 0,0MB Mezzanine Fund II Ky, Helsinki, mezzanine financing 1 60,0 0,0Realty World Ltd, Helsinki, estate agency 1 100,0 2,0Sampo Housing Loan Bank of Finland plc, Helsinki, mortgage lending 1 100,0 76,13C Asset Management Ltd, Helsinki, investment services 1 100,0 3,2Sampo Fund Management Ltd, Helsinki, investment services 1 92,6 3,8Sampo Trade Service Ltd, Hong Kong, other financing services 1 100,0 0,0Kolarin Nilijänkkä Kiinteistö Oy 1 100,0 1,4Danske DCR PLC, Helsinki 1 100,0 1,8
Associates of Sampo Bank plcAutomatia Pankkiautomaatit Oy, Helsinki, electronic banking services 2 33,3 5,1MB Equity Fund Ky, Helsinki, investment 2 20,9 0,1Tapio Technologies Oy, Espoo, manufacturer of electrical equipments 2 20,0 0,0Arfin Oy, Helsinki, business and management consultancy activities 2 33,3 0,0
1 Consolidated in full2 Accounted by the equity method
40 ASSET MANAGEMENT AND CUSTOMER ASSETS HELD
Sampo Bank plc provides asset management services self and through subsidiaries.
41 INFORMATION ON A CREDIT INSTITUTION WHICH IS A GROUP COMPANY
In 2008, Sampo Bank plc belonged to Danske Bank Group, whose parent company is Danske Bank A/S.Danske Bank A/S Annual Report 2008 is available at www.danskebank.com.
The registered office of Sampo Bank plc is Helsinki

66
Sampo Bank plc Board of Directors’ proposal to the annual general meeting for the distribution of the profits of the parent company
Parent company’s distributable capital and reserves totalled EUR 1,537,736,542.39 of which the profit for the
year is EUR 152,434,552.83.
Sampo Bank’s Board of Directors proposes to the Annual General Meeting the distributable capital and
reserves are used as follows:
No dividend will be issued for the financial year 2008. Retained earnings are left in the equity capital.
Helsinki, 5th February 2009
Peter Straarup
Sven Erik Lystbæk Ilkka Hallavo Lars Stensgaard Mørch
Georg Schubiger Risto Tornivaara Teija Andersen
Esko Mäkeläinen Tonny Thierry Andersen