sampling and analysis of air pollutants
DESCRIPTION
Sampling and Analysis of Air PollutantsTRANSCRIPT

Pollutant Source Human Health Effects
Particles (API) - Air Particle Index
,Internal combustion engines (eg, cars and trucks);
Industry (eg, factories); Burning wood; Cigarette smoke; and Bushfires.
Long term exposure is linked to:
Lung Cancer; Heart Disease; Lung Disease; Asthma Attacks; and Other health problems.
Nitrogen Dioxide (NO2)
Motor Vehicles are the biggest contributors;
Other combustion processes;
Exposure to high levels of NO2 may lead to:
Lung damage; or Respiratory Disease.
It has also been linked to:
Increased hospital admissions for asthma and respiratory problems;
Increased mortality.
Ozone (O3)
Formed by various complex chemical reactions involving the exposure of the oxides of nitrogen and some hydro-carbons.
Ozone is the main ingredient of photochemical smog in summer and early autumn.
Ozone effects the
lining of the lungs; lining of the respiratory tract;
and causes eye irritation.
Ozone also damages plants, buildings and other materials.
Carbon Monoxide (CO)
Motor vehicle exhaust and burning of materials such as coal, oil and wood. It is also released from industrial processes and waste incineration
When inhaled Carbon Monoxide enters the bloodstream and disrupts the supply of oxygen to the body’s tissues.
A range of health effects may result depending on the extent of exposure.

Lead (Pb)
Is largely derived from the combustion of lead additives in motor fuels as well as lead smelting.
Lead pollution from vehicle emissions is declining due to the introduction of unleaded fuels and reductions in lead levels in leaded fuel.
Other atmospheric sources of lead include waste incineration and renovation of old houses (from leaded paint).
Lead retards learning in children and the development of their nervous system;
Lead effects almost every organ in the body, whether it is inhaled or ingested. Young children are particularly susceptible;
Hydro-carbons (HC) - chemical compounds composed of Hydrogen and Carbon atoms
Most fuel combustion processes result in the release of hydro carbons to the environment. The largest fuel sources are natural gas and petrol. Note that hydrocarbons can enter the environment both as evaporative emissions from vehicle fuel systems, or in exhaust emissions. They are also a component of the smoke from wood fires.
Exposure can cause headaches or nausea, while some compounds may cause cancer. Some may also damage plants.
Top of the page
1. AIR POLLUTION
iAir pollution from both stationary (e.g. factories) and mobile (e.g. cars) sources includes many substances, such as carbon monoxide or lead, which are harmful in themselves, primary pollutants, and other substances which react with other chemicals to form new harmful substances , secondary pollutants, (e.g. sulfur dioxide reacting with water and air to produce the sulfuric acid of acid rain).
2. PRIMARY POLLUTANTS
iiPrimary pollutants are those in which the substance emitted is itself hazardous. Some primary pollutants also produce other dangerous substances after undergoing chemical reactions in the atmosphere, and these are known as secondary pollutants. Primary pollutants include the following substances.

1. Particulates
This includes dust, smoke, aerosols and haze - any finely divided airborne solid material. Particulates are commonly generated by fires, motor vehicles, some industries (particularly road building, quarries and fossil fuel power stations) and various natural sources including volcanoes, plant and animal matter and dirt. Particulates are aesthetically displeasing, can irritate the eyes and cause repiratory problems. In recent years concerns have been raised about the possible health effects of 'fine' particulate matter (less than 10µm diameter). These have been shown to be associated with increases in hospitalisation and even deaths from respitorary illnesses and heart disease.
2. Sulphur dioxide, SO2
Sulphur dioxide is often produced by the industrial processes which produce particulates, the primary sources of SO2 being coal, fuel oil and diesel. Being a corrosive acidic gas, sulphur dioxide damages buildings and other materials, and can cause respiratory problems.
3. Carbon monoxide, CO
The commonest source of carbon monoxide is motor vehicle emissions, where it results from the combustion of petrol in the presence of insufficient oxygen. It is also a result of some fuel-consuming industries and domestic fires. Carbon monoxide is a colorless, odorless, highly toxic gas that displaces oxygen in human blood, causing oxygen deprivation.
4. The oxides of nitrogen, NOx:
NOx refers to the mixture of nitric oxide (NO) and nitrogen dioxide (NO2) formed by the oxidation of nitrogen during the combustion of air. NOx is a contributor to several secondary pollutants, and NO2 is a respiratory irritant that can also corrode metals at high concentrations.

3. SECONDARY POLLUTANTS
These are pollutants formed by chemical reactions in the atmosphere, either with other chemicals or with light.
1. Ozone (O3) and photochemical smog
Ozone is the major constituent of photochemical smog, which is a complex mixture also containing oxidised organics, including aldehydes (RCOOH) such as formaldehyde, peroxides (ROOR), acrolein and peroxyacylnitrates
Survey for preliminary information:
During ambient air pollutants sampling, it is also necessary to collect information on qualitative and quantitative data on the local sources of air pollution, topography, population distribution, land use pattern, climatology, etc, depending upon the objectives of the survey or measurement campaign. For example, an area map to locate pollution sources and monitoring locations, sources of pollution situated at far distances, etc. and other relevant data that describe the behaviour of atmosphere for a specific pollutant to be sampled may also be required.
What it includes:
a) Selection of sampling procedures including procedures of analysis of samples
b) Sampling locationsc) Period of sampling, frequency of sampling and durationd) Auxiliary measurements (including meteorological parameters)
e) Processing of data
Selection of sampling procedure:

There are two types of sampling – continuous and time averaged in –situ samplings. Continuous sampling is carried out by automatic sensors, optical or electrochemical, and spectroscopic methods which produce continuous records of concentration values. The specific time-averaged concentration data can then be obtained from continuous records. Time-averaged data can also be obtained by sampling for a short time – i.e. by sampling a known volume of air for the required averaging time. Samples are then analyzed by established physical, chemical, and biological methods for the concentration values which are the effective average over the period of sampling.

Sampling locations:
Sampling locations are in general governed by factors like objectives, method of sampling and resources available. If the objective is to study health hazards and material damages, then locations should be kept close to the objects where the effects are being studied and should be kept at breathing level in the population centres, hospitals, schools, etc. For vegetation, it should be at foliage level. For background concentration, sampling location should be away from the sources of pollution. It can also be done by gridding the entire area to get statistically recommended values.
The number of locations however depends upon the variability of concentration over the area under survey. A spot checking may be done to decide the location besides considering practical factors.
Period of sampling, frequency and duration:
Period, frequency and duration of sampling should be appropriate to the objectives of the study. It should be such that the measurable quantities are trapped in the sample at the end of the sampling. It is preferable to observe sampling period consistent with the averaging times for which air quality standards of the given pollutants are specified.
Network design of monitoring:
Please refer IS 5182 (Part -14): 2000

The pollutants for which sampling and analytical techniques discussed are SO2, NOx, O3, NMHC, CO, BTX, SPM, and RSPM. In addition, methods for meteorological parameters such as wind speed, direction, temperature, solar radiation and relative humidity are also discussed along with wind rose plotting methods. The rationale for selecting these pollutants in this manual is that they are ubiquitous in urban air, widely recognized as posing a po
<="" a="" style="font-family: Arial, Helvetica, Geneva, Swiss, SunSans-Regular; font-size: 12px; font-weight: normal; color: rgb(0, 153, 153); font-style: normal; font-variant: normal; letter-spacing: normal; line-height: normal; orphans: auto; text-align: start; text-indent: 0px; text-transform: none; white-space: normal; widows: auto; word-spacing: 0px; -webkit-text-stroke-width: 0px;">
4. SAMPLING
iiiAir samples are collected to find out the concentration of pollutants in the air. There are four types of air pollutant testing, each having their own positive attributes. The systems vary depending on the need for portability, as well as the type of pollution being searched for.
5. TYPES OF SAMPLING:
1. PASSIVE SAMPLING
Passive sampling is used to get an indication of pollution levels over a period of a few weeks to months.
Sampling of this type is performed near major roads or near power generation sites to detect levels of nitrogen dioxide. This type of sampling method is not accurate enough to

detect direct sources of pollution. It is used to get an idea of average pollution levels.
Passive sampling does not use a physical pump for air collection. Instead a tube housing the sample collector is mounted in the area to be tested, allowing the normal air flow to move through the tube. At the end of the sample period, caps are placed on the ends of the tube and the unit is taken for lab analysis.
2. ACTIVE SAMPLING
Active sampling is the same as passive sampling, except this method uses a pumping mechanism. The air is physically pushed through a filter, or chemical solution, to obtain the sample for later testing in the lab. Air flows over the filter at a specific rate (volume) for a set amount of time. It can be done on a daily basis
3. AUTOMATIC SAMPLING
Use of automatic sampling is designed for a single point sample such as factory smoke stacks. These are sophisticated pieces of equipment producing high-resolution measurements.
Common pollutants that are detected by automatic samplers are benzene, carbon monoxide, ozone, sulphur dioxide as well as oxides of nitrogen.
4. OPTICAL ANALYSERS
A beam of light is sent from the emitter to the detector. Analyzing the wavelength of the light will show what pollution is in the air. All molecules absorb light at different rates and wavelengths. Analyzing the difference in the light can show what molecules are in the path, allowing the tester to determine the amount of pollutant in the air.
S02

Method of measure ment
Volumetric . sampling a volume of air through a collecting medium at a known flow rate for a specified time
PurposeThe purpose of this protocol is to provide guidelines for monitoring and analysis of sulphur dioxide in ambient air.
StandardThe national ambient air quality standards for sulphur dioxide is presented in the table

Principle of the method
Modified West & Gaeke Method (IS 5182 Part 2 Method of Measurement of Air Pollution: Sulphur dioxide).
Sulphur dioxide from air is absorbed in a solution of potassium tetrachloromercurate (TCM). A dichlorosulphitomercurate complex, which resists oxidation by the oxygen in the air, is formed. Once formed, this complex is stable to strong oxidants such as ozone and oxides of nitrogen and therefore, the absorber solution may be stored for some time prior to analysis. The complex is made to react with para-rosaniline and formaldehyde to form the intensely coloured pararosaniline methylsulphonic acid. The absorbance of the solution is measured by means of a suitable spectrophotometer
Instrument/EquipmentThe following items are necessary to perform the monitoring and analysis of nitrogen dioxide in ambient air:
Analytical balance Vacuum pump greater than 0.7 atmosphere at the desired flow rate Calibrated flow-measuring device to control the airflow
from 0.2 to1 l/min.
Absorber Spectrophotometer Glass wares

. Reagents / ChemicalsAll the chemicals should meet specifications of Analytical Reagent grade· Distilled water· Mercuric chloride· Potassium chloride / Sodium chloride· EDTA di sodium salt· Absorbing Reagent, 0.04 M Potassium Tetrachloro mercurate (TCM)
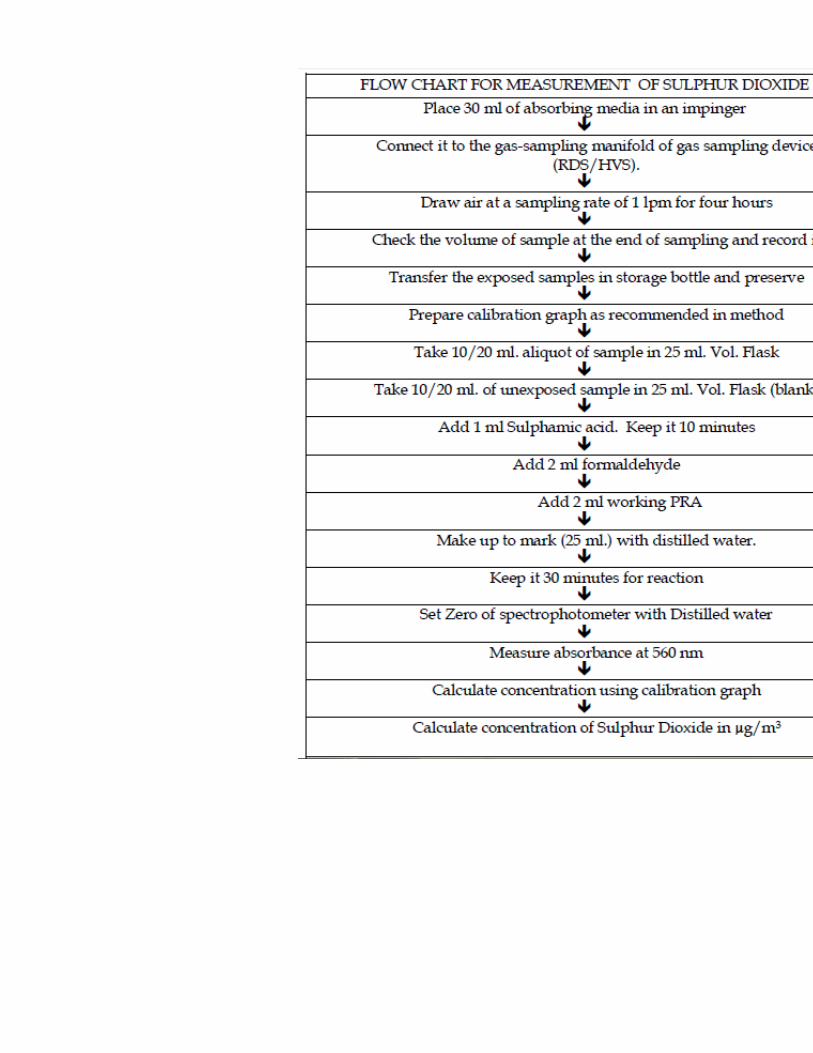
SamplingPlace 30 ml of absorbing solution in an impinger and sample for four hours at the flow rate of 1 L/min. After sampling measure the volume of sample and transfer to a sample storage bottle.Steps for sampling;
Prepare absorbing reagent Prepare a sampling train of at least two gas bubblers. Place bubblers in the sampling system securely
connecting to the manifold. Fill the bubblers with the absorbing reagent Start the sampler and adjust flow rate to 2 liter/minute Note the flow rate and preserve the sample tubes
carefully in the laboratory
AnalysisReplace any water lost by evaporation during sampling by adding distilled water up to the calibration mark on the absorber. Mix thoroughly, pipette out 10 ml of the collected sample into a 25 ml volumetric flask. Add 1 ml 0.6% sulphamic acid and allow reacting for 10 minutes to destroy the nitrite resulting from oxides of nitrogen. Add 2 ml of 0.2% formaldehyde solution and 2 ml pararosaniline solution and make up to 25 ml with distilled water. Prepare a blank in the same manner using 10 ml of unexposed absorbing reagent. After a 30 min colour development interval and before 60 minutes, measure and record the absorbance of samples and reagent blank at 560 nm. Use distilled water; not the reagent blank, as the optical reference
CalibrationThe actual concentration of the sulphite solution is determined by adding excess iodine and back titrating with standard sodium thiosulfate solution. To back-titrate, measure, by pipette, 50 ml of the 0.01 N iodine solution into each of two 500 ml iodine flasks A and B. To flask A (blank) add 25 ml distilled water and

into flask B (sample) measure 25 ml sulphite solution by pipette. Stopper the flasks and allow to react for 5 minutes. Prepare the working sulphite-TCM solution at the same time iodine solution is added to the flasks. By means of a burette containing standardized 0.01 N thiosulfate, titrate each flask in turn to a pale yellow. Then add 5 ml starch solution and continue the titration until the blue colour disappears.
a) Preparation of StandardsMeasure 0.5 ml, 1.0 ml, 1.5 ml, 2.0 ml, 2.5 ml, 3.0 ml, 3.5 ml and 4.0 ml of working sulphite TCM solution in 25 ml volumetric flask. Add sufficient TCM solution to each flask to bring the volume to approximately 10 ml. Then add the remaining reagents as described in the procedure for analysis. A reagent blank with 10 ml absorbing solution is also prepared. Read the absorbance of each standard and reagent blank
b) Standard CurvePlot a curve absorbance (Y axis) versus concentration (X axis). Draw a line of best fit and determine the slope. The reciprocal of slope gives the calibration factor (CF).
CalculationConcentration of sulphite solution:
Where,C = SO2 concentration in mg/mlV1 = Volume of thiosulfate for blank, ml
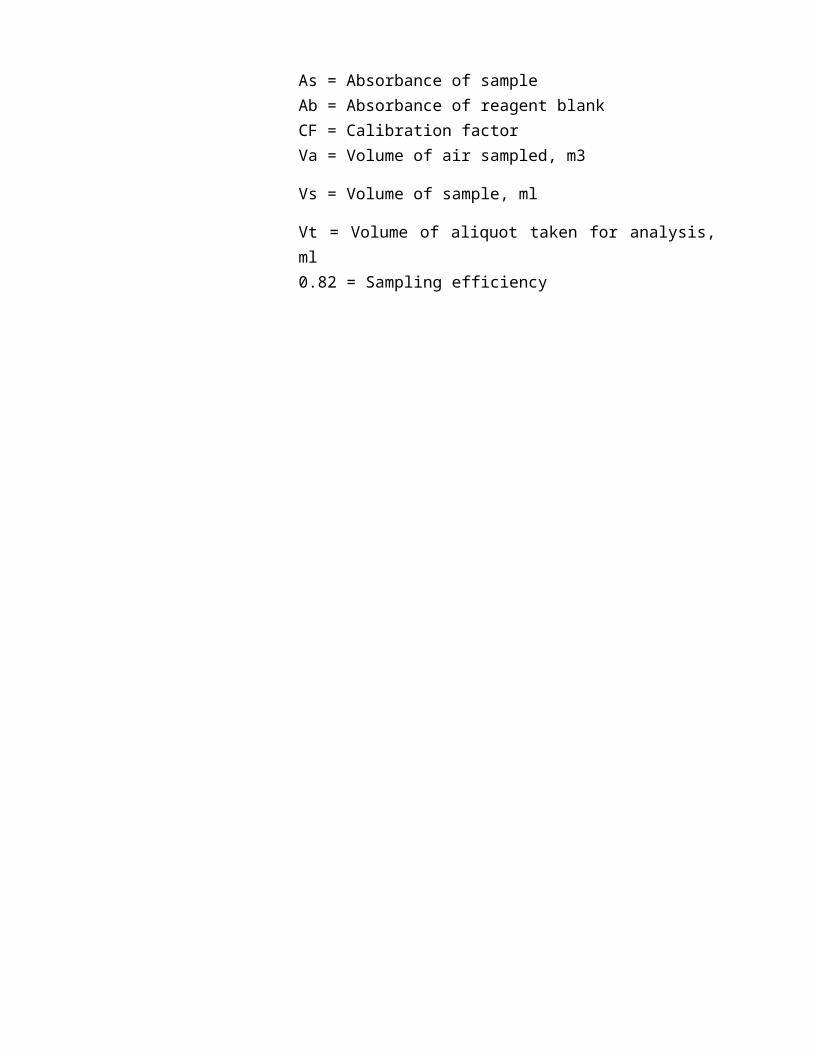
V2 = Volume of thiosulfate for sample, mlN = Normality of thiosulfateK = 32000 (Milliequivalent weight SO2/μg)V = Volume of standard sulphite solution, mlC (SO2 μg/m3 )= (As – Ab) x CF x Vs/ Va x VtWhere,C SO2 = Concentration of Nitrogen dioxide, μg/m3As = Absorbance of sampleAb = Absorbance of reagent blankCF = Calibration factorVa = Volume of air sampled, m3Vs = Volume of sample, ml

Vt = Volume of aliquot taken for analysis, ml

NOx
Guidelines for sampling and analysis of Nitrogen dioxide in ambient air
(Modified Jacob and Hochheiser Method)
1. Purpose
The purpose of this protocol is to provide guidelines for monitoring of nitrogen dioxide in ambient.
2. Standard
The national ambient air quality standard for nitrogen dioxide is presented in the table:
Principle of the method
Ambient nitrogen dioxide (NO2) is collected by bubbling air through a solution of sodium hydroxide and sodium arsenite. The concentration of nitrite ion (NO-2) produced during sampling is determined colorimetrically by reacting the nitrite ion with phosphoric acid, sulfanilamide, and N-(1-naphthyl)- ethylenediamine di-hydrochloride (NEDA) and measuring the absorbance of the highly coloured azo-dye at 540 n m.
Instrument/Equipment
The following items are necessary to perform the monitoring and analysis of nitrogen dioxide in ambient air:

Analytical balance: Vacuum pump Flow control device capable of maintaining a constant
flow of 200-1000 ml per minute through the sampling solution
Calibrated flow measuring device: To control the airflow from 0.2 to 1 l/min.
Absorber: a midget impinger Spectrophotometer Glass wares
Chemicles
Sodium Arsenite Absorbing solution(Dissolve 4.0 g of sodium hydroxide
in distilled water, add 1.0 g of sodium Arsenite, and dilute to 1,000 ml with distilled water)
Sodium hydroxide
Sampling
Place 30 ml of absorbing solution in an impinger and sample for four hour at the flow rate of 0.2 to 1 L/min. After sampling measure the volume of sample and transfer to a sample storage bottle.
Steps for sampling; Prepare absorbing reagent Prepare a sampling train of at least two gas bubblers. Place bubblers in the sampling system securely
connecting to the manifold. To eliminate interference of sulfur dioxide, add a small
amount of hydrogen peroxide Fill the bubblers with the absorbing reagent Start the sampler and adjust flow rate to 2 liter/minute Note the flow rate and preserve the sample tubes
carefully in the laboratory

7. Analysis
Replace any water lost by evaporation during sampling by adding distilled water up to the calibration mark on the absorber, mix thoroughly. Pipette out 10 ml of the collected sample into a 50 ml volumetric flask. Pipette in 1 ml of hydrogen peroxide solution, 10 ml of sulphanilamide solution, and 1.4 ml of NEDA solution, with thorough mixing after the addition of eachreagent and make up to 50 ml with distilled water. Prepare a blank in the same manner using 10 ml of unexposed absorbing reagent. After a 10 min colour development interval, measure and record the absorbance of samples and reagent blank at 540 nm. Use distilled water; not the reagent blank, as the optical reference Samples with an absorbance greater than 1.0 must be re-analyzed after diluting an aliquot of the collected samples with an equal quantity of unexposed absorbing reagent. A randomly selected 5-10% of the samples should be re-analyzed as apart of an internal quality assurance program.
CalibrationPreparation of StandardsPipette 1, 2, 3, 4, 5, 6, 7, 8, 9, 10, 12, 15 and 20 ml of working standard solution in to 50 ml volumetric flask. Fill to 20 ml mark with absorbing solution. A reagent blank with 10 ml absorbing solution is also prepared. Add reagents to each volumetric flask as in the procedure for analysis. Read the absorbance of each standard and reagent blank against distilled water reference.
Standard Curve:Plot a curve absorbance (Y axis) versus concentration (X axis). Draw a line of best fit and determine the slope. The reciprocal of slope gives the calibration factor (CF).
Calculation
C (NO2 μg/m3) = (As – Ab) x CF x Vs/ Va x Vt x 0.82
Where,C NO2 = Concentration of Nitrogen dioxide, μg/m3As = Absorbance of sampleAb = Absorbance of reagent blankCF = Calibration factorVa = Volume of air sampled, m3
Vs = Volume of sample, ml
Vt = Volume of aliquot taken for analysis, ml 0.82 = Sampling efficiency

HYDRO CARBONS

FIG: Flow diagram for measuring of non methan hydrocarbon
Guidelines for sampling and Analysis of Benzo(a)Pyrene & other PAHs inAmbient Air (Solvent Extraction & GC Analysis)
PurposeThe purpose of this protocol is to provide guidelines for monitoring of Benzo Pyrene in ambient air.
Benzo (a) Pyrene (BaP) is one of the most important constituent of PAH compounds and also one of the most potent carcinogens. This can be measured in both particulate phase and vapour phase. In the vapour phase the concentration of B(a)P is significantly less than the particulate phase. Therefore, more care to be taken for the measurement of Benzo (a) Pyrene in the particulate phase. The molecular formula of B(a)P is C20H12 having molecular weight 252 and structural formula is given in following figure:

2. StandardThe national ambient air quality standard for Benzo(a)pyrene is presented inTable
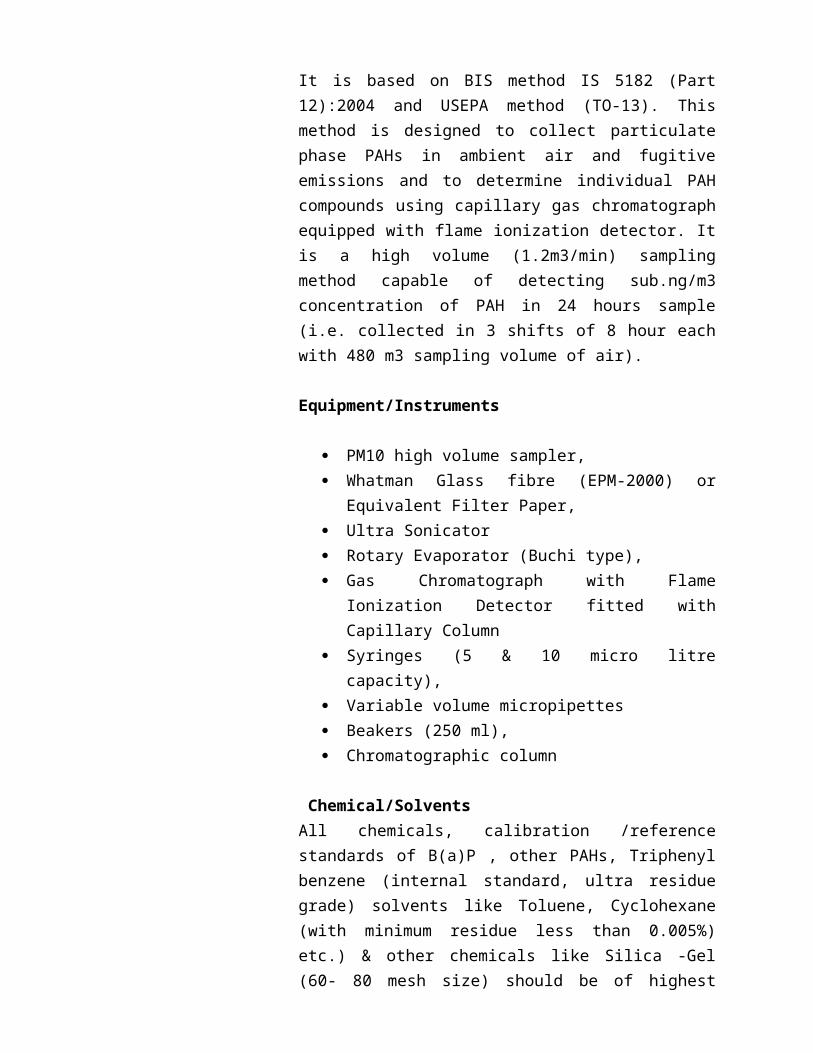
Principle of the MethodIt is based on BIS method IS 5182 (Part 12):2004 and USEPA method (TO-13). This method is designed to collect particulate phase PAHs in ambient air and fugitive emissions and to determine individual PAH compounds using capillary gas chromatograph equipped with flame ionization detector. It is a high volume (1.2m3/min) sampling method capable of detecting sub.ng/m3 concentration of PAH in 24 hours sample (i.e. collected in 3 shifts of 8 hour each with 480 m3 sampling volume of air).
Equipment/Instruments
PM10 high volume sampler,

Whatman Glass fibre (EPM-2000) or Equivalent Filter Paper,
Ultra Sonicator Rotary Evaporator (Buchi type), Gas Chromatograph with Flame Ionization Detector
fitted with Capillary Column Syringes (5 & 10 micro litre capacity), Variable volume micropipettes Beakers (250 ml), Chromatographic column
Chemical/SolventsAll chemicals, calibration /reference standards of B(a)P , other PAHs, Triphenyl benzene (internal standard, ultra residue grade) solvents like Toluene, Cyclohexane (with minimum residue less than 0.005%) etc.) & other chemicals like Silica -Gel (60- 80 mesh size) should be of highest purity & of reputed make with traceability/purity and analysis certificate.
Sampling
1 Instrument/Filter Selection24 hr. sampling using PM10 high volume sampler with 8 hourly samples using EPM- 2000 glass fibre or equivalent filter.
2 Sampling FrequencySampling is done twice a week, total of 104 days monitoring in a year. Particulate laden Benzo(a)Pyrene samples are collected on glass fibre filter (EPM 2000 or equivalent) using PM10 sampler at a flow rate of more than 1m3/min per minute, at selected location(s).
3 Sampling HeightSampling height may be between 3-10 meters from the ground level for ambient air quality monitoring.
4 Sample Filter Storage
After sampling, filters are kept in the controlled laboratory conditions (20-25˚C) in an envelope marked with necessary identification information if processed immediately, otherwise wrap the filters in Aluminium foil & kept it in refrigerator at 4°C in dark to avoid photo oxidation of PAHs.

Sample Processing
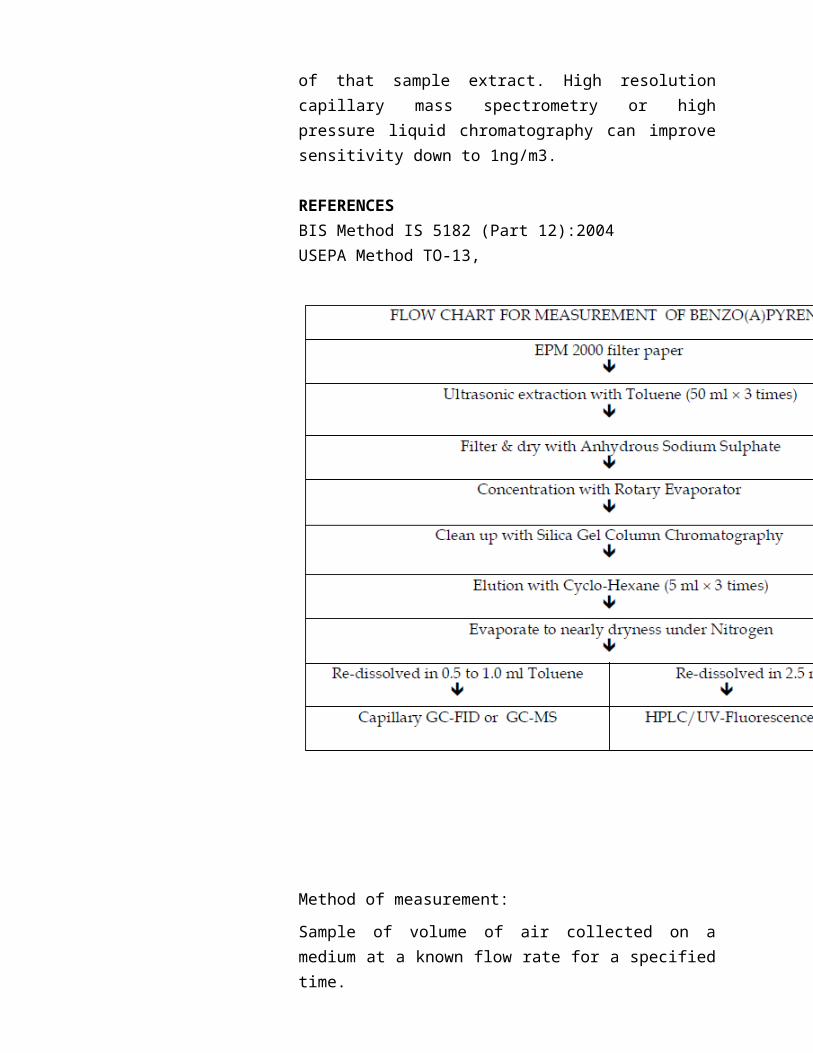
a. Extraction:Filter papers (half of all the filters papers collected in a day) are cut into strips using scissors and transfer to 250 ml beaker. Add ~50 ml. of Toluene (GC/HPLC grade). These samples are extracted with toluene using ultra sonic bath for about 30 minutes. Repeat the procedure twice (50ml x 2 times) for complete extraction. Alternatively, sample can be extracted using soxhlet extraction apparatus for about 8 hr. with Toluene and repeat it twice.
b. Filtration:Filter the extracted samples with Whatman filter paper no.41 containing 2 gm of Anhydrous Sodium Sulphate (to remove moisture).
c. Concentration:After filtration, the filtrate is concentrated using Rotary vacuum evaporator to 2ml final volume.
Fig: Sampling processing
d. Clean-up with silica Gel:To clean up the impurities, pass 2 ml of concentrated sample through silica gel column (pre conditioned, 60-80 mesh, and 200-250mm×10 mm with Teflon stopcock). After cleaning add 5ml cyclohexane and collect the elute in 25 ml beaker. Repeat the process for at least 3 times and collect it in the same beaker. Alternatively Solid Phase Extraction (SPE) may be used for clean up the impurities of sample.
e. Re-concentration with rotary vacuum evaporator:The Cleaned up extract/filtrate (approximately 17 ml) is further concentrated using rotary evaporator and it is evaporated to nearly dryness with Nitrogen.
f. Final Sample volume:The dried sample is re-dissolved in 1ml of toluene and transfer into 4 or 5 ml amber vials final analysis.
g. Extracted Sample Storage:Cover/Cap the sample vials /tubes and mark with necessary identification. Keep it in refrigerator at 4°C
Analysis
GC Conditions: Injector: 300°C FID Temp: 320°C Column: Ultra -2 (25m Length, 320μm diameter, 0.17μ)
or equivalent Oven: 120°C →2 min hold → 7°C/min → 300°C → 10
min hold Run Time: 37.71 minutes Carrier gas flow (N2): 0.50 ml/min Gases for FID Flame: H2 flow: 40 ml/min Zero grade air flow: 400 ml/min
1) Preparation of Standard Calibration Mixture
Stock Standard Solution

PAH mix standard solution of 16 Compounds including B(a)P in Toluene.
Working Standard SolutionWorking Standard Solutions ( 5, 10, 15, 20, 25 ng/μl concentrations) are prepared from stock solution by diluting 200 to 40 times the stock B(a)P or other PAH solution of 1000mg/l (or 1000ng/μl) concentration with Toluene.
Internal Standard1, 2, 3-Tri Phenyl Benzene of concentration ~1000ng/μl is added in the working standard solution so that the final concentration of Internal standard is 10 ng/μl.
2) Calibration of GC
Internal CalibrationInject 1μl of each Working Standard (5, 10, 15, 20, 25 ng/μl) in triplicate and plot the area ratio of analyte PAH Compound [i.e. B(a)P] and the corresponding internal standard against the concentration for each compound and internal standard. The instrument is calibrated as per its manual/software.
External CalibrationInject 1μl of each Working Standard (5, 10, 15, 20, 25 ng/μl) made in Toluene into GC-FID and plot the area of analyte viz. PAH Compound [i.e.B(a)P] against the corresponding concentration of the standard.
Sample injectionTake 2μl of sample from the amber vial using standard gas tight syringe and inject in the Capillary GC-FID instrument for analysis. Record the resulting concentration of each PAH compound including B(a)P. A 10ng/μl concentration B(a)P or other PAH standards are to be injected in GC/FID instrument with every batch of samples. As a control Internal Standard of 10 ng/μl conc. is added to each sample prior to the analysis in case of internal calibration is used.
3) Calculation
Calculate the air volume from the periodic flow reading taken during sampling

using the following equation:V =Q x T
Where,Q =Average flow rate of sampling m3/minT = sampling time, in min.V = total sample volume at ambient conditions in m3Concentration of analyte i.e B(a)P:
The concentration of PAH compound or Benzo(a)pyrene in ng /m3 in the airsampled is given by:
C (ng /m3) = Cs * Ve / Vi *VsWhere,Cs : Concentration of Benzo (a) pyrene in ng / μl in the sample extract recordedby GC.Ve : Final volume of extract in μl (i.e 1000)Vi : Injection Volume (i.e 1μl)Vs : Volume of air sample in m3
4) Detection Limit
The minimum detectable concentration in terms of B(a)P for a sampling period of 8hour (with about 480 m3 of air passed) will be 1ng /m3 assuming 1.0 ml as the final volume of sample extract after clean-up and detectable concentration of 1ng/ μl of that sample extract. High resolution capillary mass spectrometry or high pressure liquid chromatography can improve sensitivity down to 1ng/m3.
REFERENCESBIS Method IS 5182 (Part 12):2004USEPA Method TO-13,

Method of measurement:
Sample of volume of air collected on a medium at a known flow rate for a specified time.
Principle
An electrically powered air sampler draws ambient air at a constant volumetric flow rate (16.7 lpm) into specially designed inertial particle-size separator (i.e. cyclones) where the suspended particulate matter in the PM2.5 size ranges is separated for collection on a 47 mm polytetrafluoroethylene (PTFE) filter over a specified sampling period. Each filter is weighed before and after sample collection to determine the net gain due to the particulate matter. The mass concentration in the ambient air is computed as the total mass of collected particles in the PM2.5 size ranges divided by the actual volume of air sampled, and is expressed in μg/m3.
Sampling
Check the flow rate with the help of accessory given with it.
Set the time constant depending upon the required averaging period.
Instrument can be switch on to the survey mode for spot checking instrument will display concentration value in mg/m3.
Figure 1 P.M Sampler
Analyses
Gravimetric analysis
Analyses can be done by weighing the mass of the particles. Gravimetric analysis of the filters needs to be performed with a microbalance. Gravimetric analysis of filters currently uses the difference method to determine the mass of the collected aerosol. The pre weight of each filter is measured prior to being sent into the field for sampling. Once exposed and returned to the sample handling room, the filter is removed petri-dishes and the post weight of the filter is measured after conditioning. The mass of the aerosol is determined by calculating the difference between the pre and post weights.

Flow chart 1 Measurement of PM2.5
6. METHODS OF ANALYZING P.M 10
GRAVIMETRIC METHOD
Principle of the method
Air is drawn through a size-selective inlet and through a filter at a flow rate, which is typically 1132 L/min. The mass of these particles is determined by the difference in filter weights prior to and after sampling. The concentration of PM10 in the designated size range is calculated by dividing the weight gain of the filter by the volume of air sampled.

Sampling
Field Sampling - Tilt back the inlet and secure it according to manufacturer's instructions. Loosen the faceplate wing nuts and remove the faceplate. Remove the filter from its jacket and centre it on the support screen with the rough side of the filter facing upwards. Replace the faceplate and tighten the wing nuts to secure the rubber gasket against the filter edge. Gently lower the inlet. The specified length of sampling is commonly 8 hours or 24 hours. During this period, several reading (hourly) of flow rate should be taken. After the required time of sampling, record the flow meter reading, take out the filter media from the sampler, and put in a container or envelope.
Figure 2 PM10 Sampler (Cyclonic Inlet)
Analysis
Loose particles should be removed with a soft brush. Apply the filter identification number or a code to the filter if it is not a numbered.
Condition the filter in conditioning room maintained within 20-30° C and 40-50% relative humidity or in an airtight desiccators for 24 hours.
Take initial weight of the filter paper (Wi) before sampling and final weight of the filter paper (Wf).

Figure 3 Calibration set up

Flow chart 2 Measurement of P.M 10

7. METHODS OF ANALYZING CO
ivNON DISPERSIVE INFRARED (NDIR) SPECTROSCOPY
Method of measurement:
Non-dispersive infra red absorption (NDIR) method, the most commonly used automated continuous with a measurement range of about 0.5 to 115 mg/m3.
Instrument:
NDIR consists of two cylindrical cells, a sample and a reference cell. The detector consists of two chambers separated by a thin metal diaphragm and filled with gas of the species being measuredSampling location guidelines:
Sampling station is generally kept at an height of about 3 to 10 m from the ground level and is sufficiently away from the disturbance or direct obstacle from the source under consideration.
Sampling frequency guidelines:
Measurement of CO is done for typically 24 hours at least twice a week.
Steps for sampling:
Flow meter is installed just before the analyzer. A fiber filter is used to capture the particulate matter
prior to the optical cell to prevent its interference. As it often accumulate to the optical cell reducing the efficiency.
Water can be readily removed from the sample by means of an inlet filter containing a desiccant, such as silica gel. In ambient air monitoring the effect of CO2 is usually not significant.
Continuous analysis is carried out at the flow rate of about 100 ml/min to 1000 ml/min.
Working
Infra-red radiation passes through a reference cell, usually containing clean dry air, and a separate cell containing the sample. The detector consists of two chambers separated by a thin metal diaphragm and filled with gas of the species being measured. As the molecules in the detector absorb the IR radiation their kinetic energy increases, causing the pressure in

each chamber will increase. If, however, absorbing molecules are present in the sample cell, the amount of energy reaching that side of the detector will diminish. Thus a pressure differential develops between the two chambers, resulting in displacement of the diaphragm. This serves to create an alternating signal in the detector, which makes it easier to detect and amplify.
8. METHODS OF ANALYZING O3
vUV PHOTOMETRIC
In this method air scrubbed in a wetted wall absorber by a 2% solution of buffered, neutral potassium iodide in water. The yellow color of the solution is measured photo-metrically and recorded continuously on a recorder.
The stoichiometry is approximated by the following reaction:
O3 + 3 KI + H2O --> KI3 + 2 KOH + O2
Instrument:
Continuous gas - Liquid contacting device, recording colorimeter.
Figure 4 UV Visible
Sampling location guidelines:
Sampling station is generally kept at an height of about 3 to 10 m from the ground level and is sufficiently away from the disturbance or direct obstacle from the source under consideration.
Sampling frequency guidelines:
Measurement of O3 is done for typically 24 hours at least twice a week.
Steps for sampling:
Place 10 ml of absorbing solution in a standard impinger and sample for one hour at the flow rate of 1 L/min.
Do not expose the absorbing reagent to direct sunlight. After sampling measure the volume of sample and transfer to a sample storage bottle.
Calibration may be performed by preparing a large mixture of ozone in air.
Analysis is performed by passing a measured volume through impinge containing buffered KI solution and determine the released iodine by spectrometer method.
Adjust the sample or the reagents flow rates to analytically determine the concentration of ozone.
Plot graph between absorbance and concentration.

Steps of analysis:
Place a fresh absorbent solution. Set the flow at convenient rates such as 4 l/min of air. Absorption of UV light (254 nm) by O3 to measure the
reduction of UV energy
NATIONAL AMBIENT AIR QUALITY
STANDARDS (2009)
Pollutants Time
Weighted
Average
Concentration in Ambient Air
Methods of Measurement
Industrial,
Residential,
Rural and
Ecologically
Sensitive Area
(Notified bySulphur Dioxide Annual * 50 20 -Improved West and Gaeke Method
Nitrogen Dioxide
(NO2), µg/m3
Annual *
24 Hours **
40
80
30
80
-Jacob & Hochheiser modified
(NaOH-NaAsO2) Method
Particulate Matter
(Size less than 10µm)
Annual *
24 Hours **
60
100
60
100
-Gravimetric
-TEOM
Particulate Matter
(Size less than 2.5µm)
Annual *
24 Hours **
40
60
40
60
-Gravimetric
-TEOM
Ozone (O3)
µg/m3
8 Hours *
1 Hour **
100
180
100
180
-UV Photometric
-Chemiluminescence

Lead (Pb)
µg/m3
Annual *
24 Hours **
0.50
1.0
0.50
1.0
-AAS/ICP Method after sampling on
EPM 2000 or equivalent filter paper
Carbon Monoxide 8 Hours ** 02 02 -Non dispersive Infrared (NDIR)
Ammonia (NH3), Annual * 100 100 -Chemiluminescence
Benzene (C6H6),
µg/m3
Annual * 05 05 -Gas Chromatography (GC) based
continuous analyzer
-Adsorption and desorption Benzo(a)Pyrene (BaP)
Particulate phase
Annual * 01 01 -Solvent extraction followed by
HPLC/GC analysisArsenic (As), Annual * 06 06 -AAS/ICP Method after sampling on
Nickel (Ni), Annual * 20 20 -AAS/ICP Method after sampling on
* Annual Arithmetic mean of minimum 104 measurements in a year at a particular site taken twice a week 24 hourly at
uniform intervals.
** 24 hourly or 8 hourly or 1 hourly monitored values, as applicable, shall be complied with 98% of the time in a year. 2% of
the time, they may exceed the limits but not on two consecutive days of monitoring.
NOTE: Whenever and wherever monitoring results on two consecutive days of monitoring exceed the limits specified above
for the respective category, it shall be considered adequate reason to institute regular or continuous monitoring and further
investigations.


i http://nzic.org.nz/ChemProcesses/environment/14A.pdfii http://nzic.org.nz/ChemProcesses/environment/14A.pdfiii http://www.ehow.com/list_7389406_air-pollution-sampling-methods.htmliv http://nzic.org.nz/ChemProcesses/environment/14A.pdfvhttp:// CDcelllabmanual.pdf