sample size considerations in factor analysis and latent class analysis
TRANSCRIPT
Sample Size Considerations in Factor Analysis and
Latent Class Analysis
October 18, 2006Statistics for Psychosocial Research
Outline of Today’s Discussion
• Sample Size for reliability analyses– Confidence intervals for reliability– Hypothesis testing in the context of reliability
• Sample Size in factor analysis• Sample size in latent class analysis
Statistical Power• Power describes the ability to detect associations
if they truly exist• Determined by
– Difference desired to be detected • Small difference: small power• Large difference: large power
– Alpha level (type I error)– Standard deviation/measure of variance– SAMPLE SIZE
Sample Size and Power
• An underpowered study: An association may not be “statistically significant” in your sample, even though the association exists in the population
• An overpowered study: – You may have collected more data than you
needed– You may detect “trivial” associations
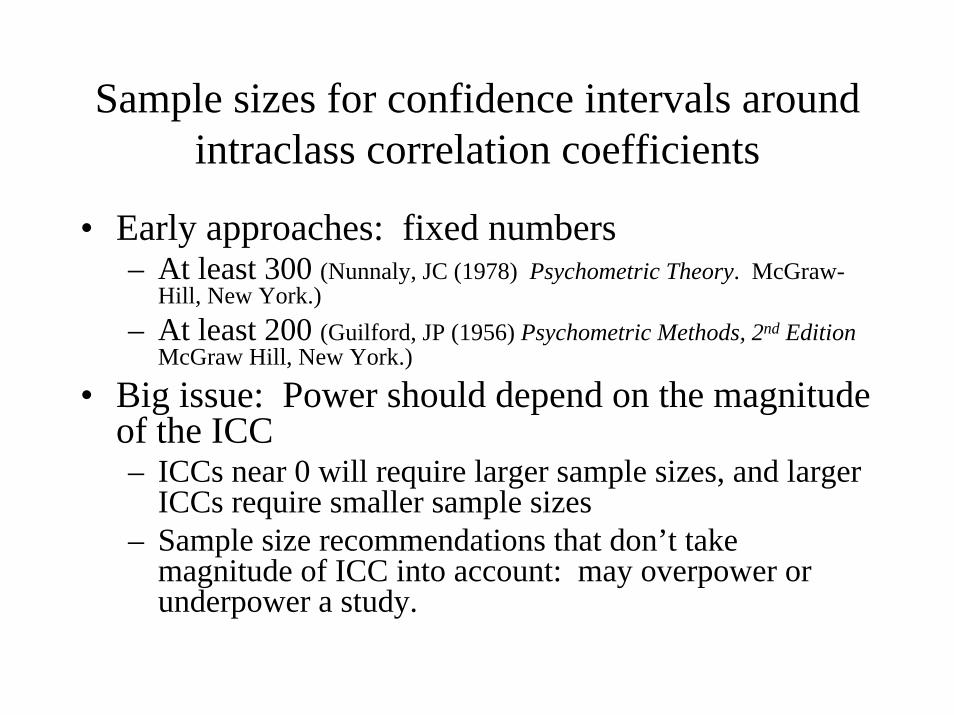
Sample sizes for confidence intervals around intraclass correlation coefficients
• Early approaches: fixed numbers– At least 300 (Nunnaly, JC (1978) Psychometric Theory. McGraw-
Hill, New York.)– At least 200 (Guilford, JP (1956) Psychometric Methods, 2nd Edition
McGraw Hill, New York.)
• Big issue: Power should depend on the magnitude of the ICC– ICCs near 0 will require larger sample sizes, and larger
ICCs require smaller sample sizes– Sample size recommendations that don’t take
magnitude of ICC into account: may overpower or underpower a study.
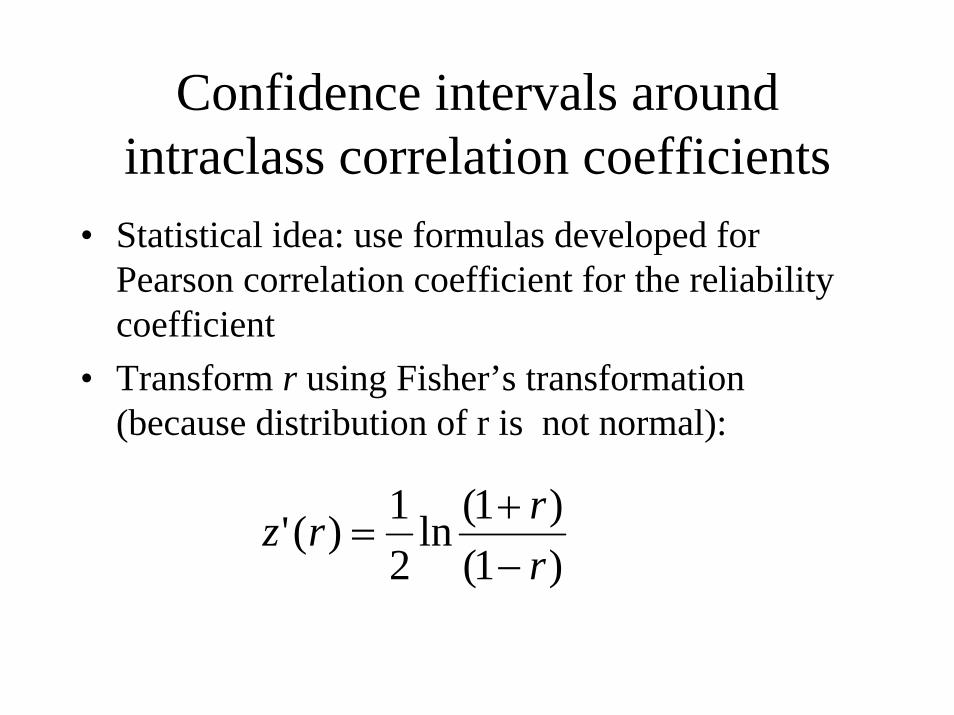
Confidence intervals around intraclass correlation coefficients
• Statistical idea: use formulas developed for Pearson correlation coefficient for the reliability coefficient
• Transform r using Fisher’s transformation (because distribution of r is not normal):
)1()1(ln
21)('
rrrz
−+
=
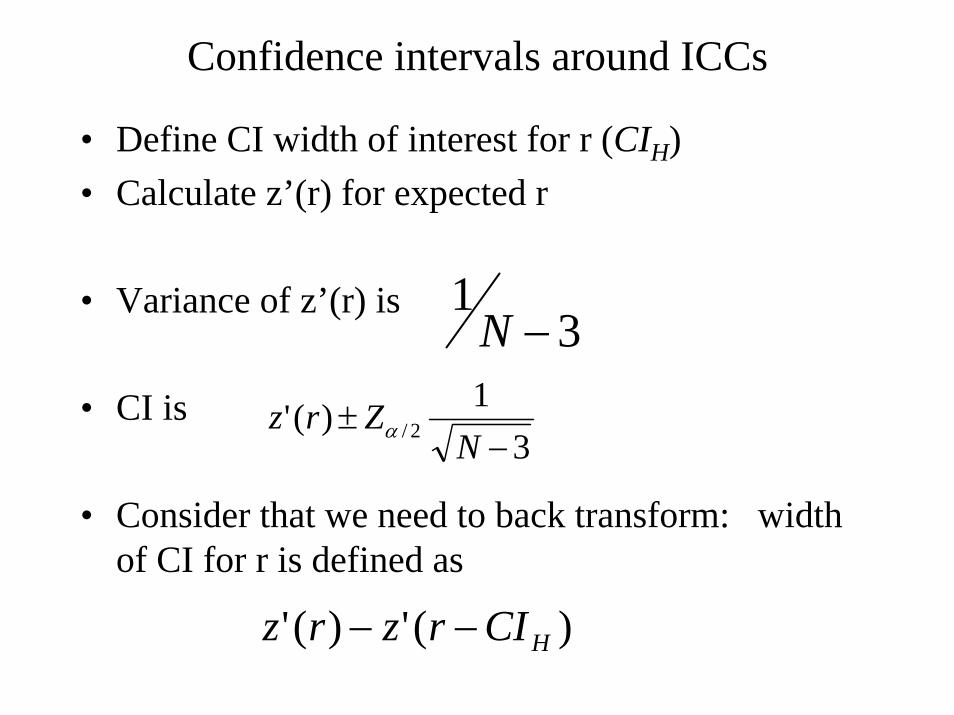
Confidence intervals around ICCs
• Define CI width of interest for r (CIH)• Calculate z’(r) for expected r
• Variance of z’(r) is
• CI is
• Consider that we need to back transform: width of CI for r is defined as
31
−N
31)(' 2/ −
±N
Zrz α
)(')(' HCIrzrz −−
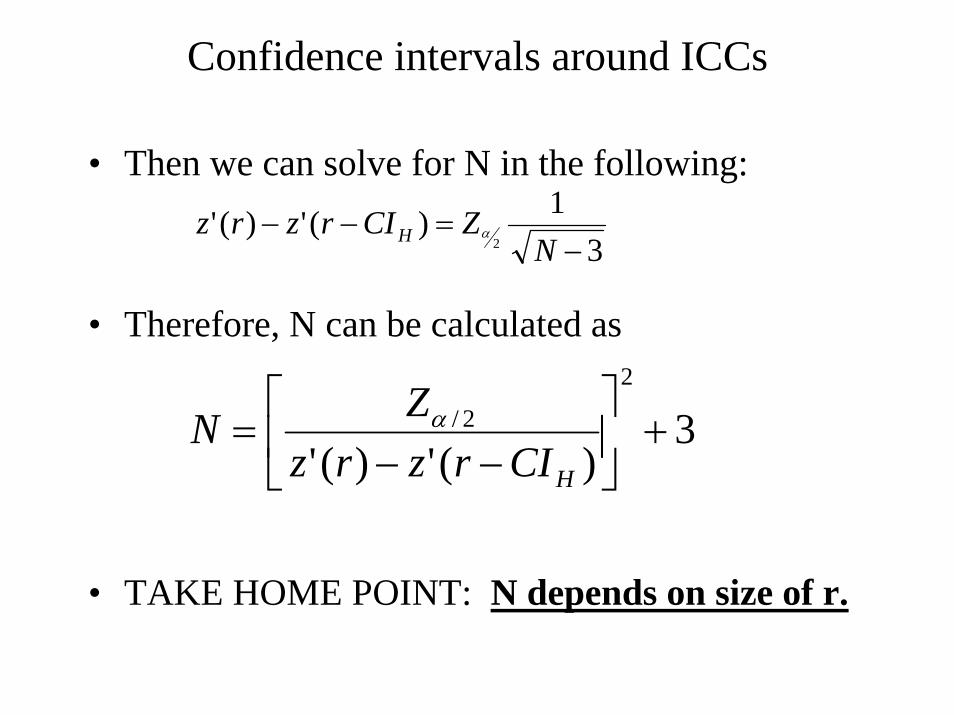
• Then we can solve for N in the following:
• Therefore, N can be calculated as
• TAKE HOME POINT: N depends on size of r.
3)(')('
2
2/ +⎥⎦
⎤⎢⎣
⎡−−
=HCIrzrz
ZN α
Confidence intervals around ICCs
31)(')('
2 −=−−
NZCIrzrz H α
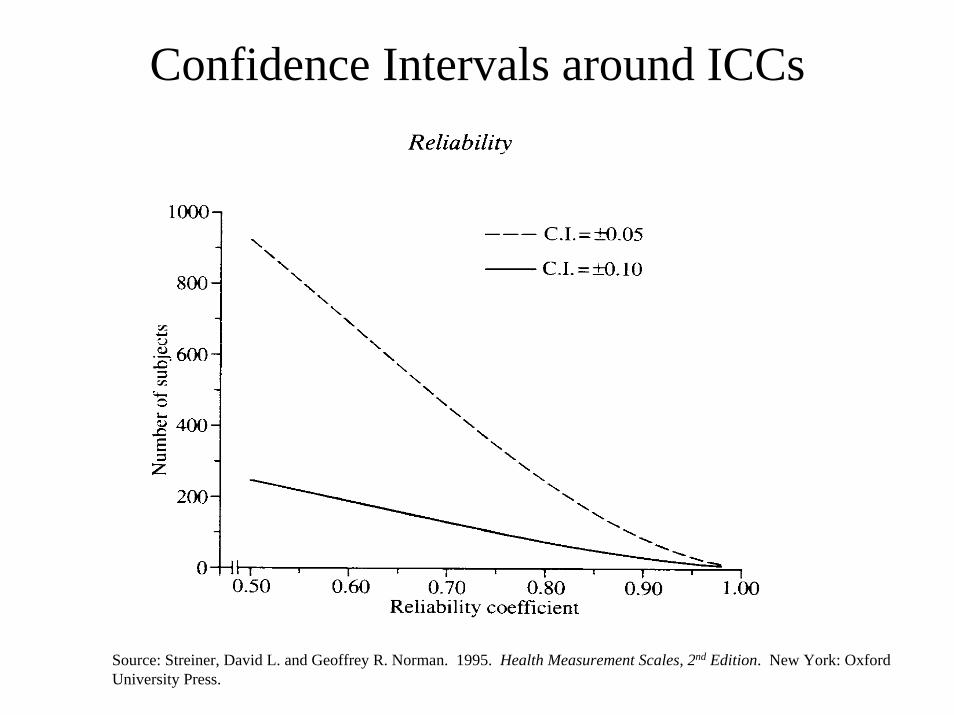
Confidence Intervals around ICCs
Source: Streiner, David L. and Geoffrey R. Norman. 1995. Health Measurement Scales, 2nd Edition. New York: Oxford University Press.

Sample size for hypothesis testing with reliability coefficients
• May need to determine if reliability coefficient is significantly different from 0
• May need to determine if reliability coefficient is significantly different from a pre-specified level– e.g. is it significantly better than reliability of
pre-existing tests?– e.g. is reliability of a measure significantly
improved by training of raters?
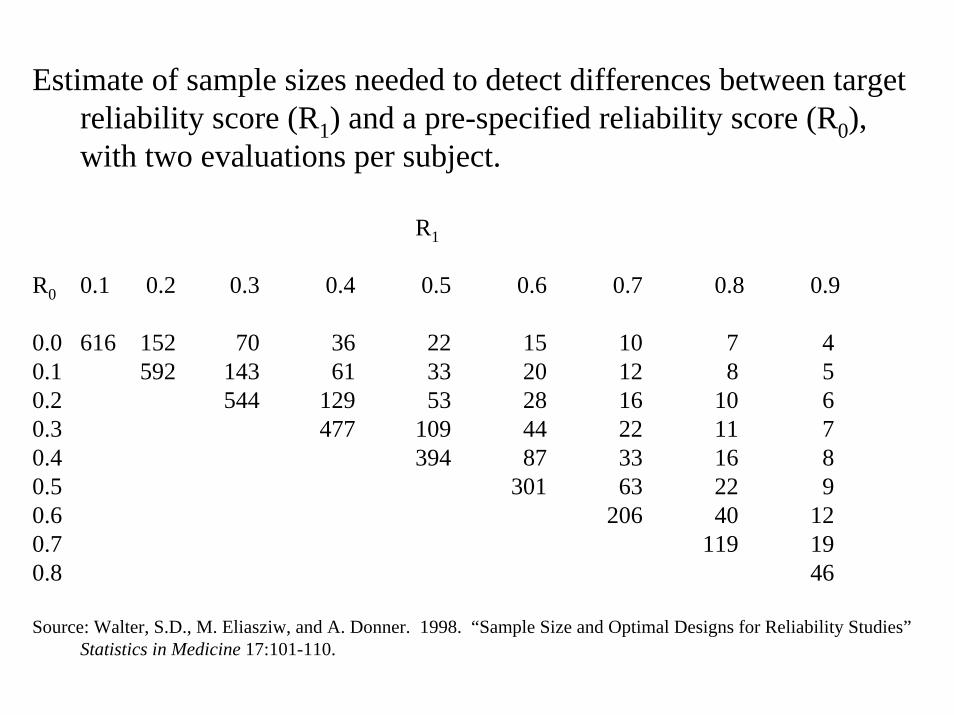
Estimate of sample sizes needed to detect differences between target reliability score (R1) and a pre-specified reliability score (R0), with two evaluations per subject.
R1
R0 0.1 0.2 0.3 0.4 0.5 0.6 0.7 0.8 0.9
0.0 616 152 70 36 22 15 10 7 40.1 592 143 61 33 20 12 8 50.2 544 129 53 28 16 10 60.3 477 109 44 22 11 70.4 394 87 33 16 80.5 301 63 22 90.6 206 40 120.7 119 190.8 46
Source: Walter, S.D., M. Eliasziw, and A. Donner. 1998. “Sample Size and Optimal Designs for Reliability Studies”Statistics in Medicine 17:101-110.
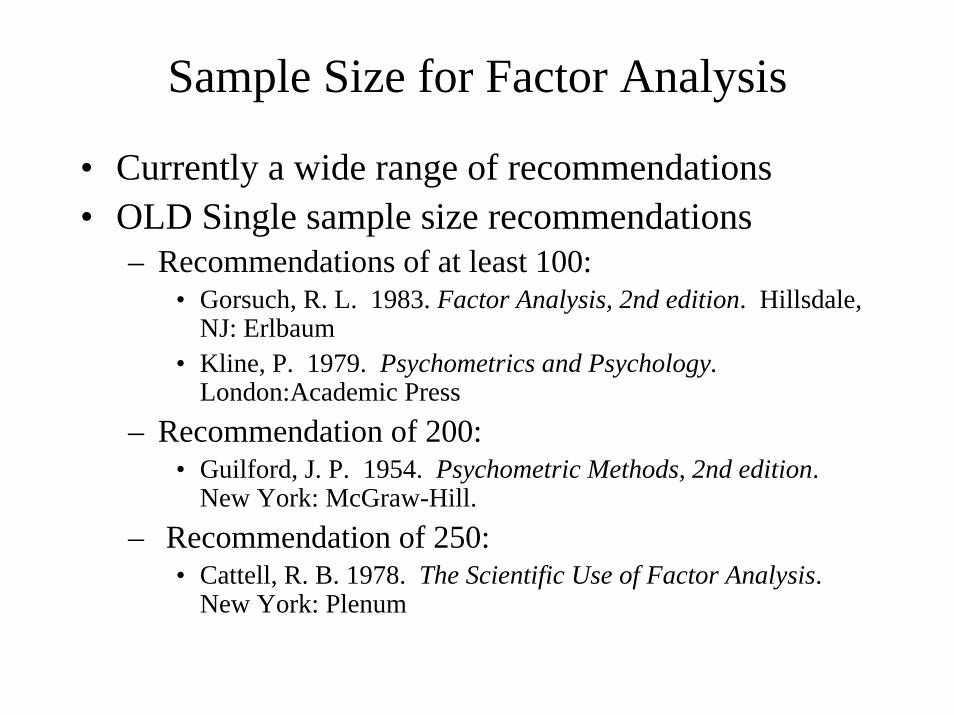
Sample Size for Factor Analysis
• Currently a wide range of recommendations• OLD Single sample size recommendations
– Recommendations of at least 100:• Gorsuch, R. L. 1983. Factor Analysis, 2nd edition. Hillsdale,
NJ: Erlbaum• Kline, P. 1979. Psychometrics and Psychology.
London:Academic Press– Recommendation of 200:
• Guilford, J. P. 1954. Psychometric Methods, 2nd edition. New York: McGraw-Hill.
– Recommendation of 250:• Cattell, R. B. 1978. The Scientific Use of Factor Analysis.
New York: Plenum
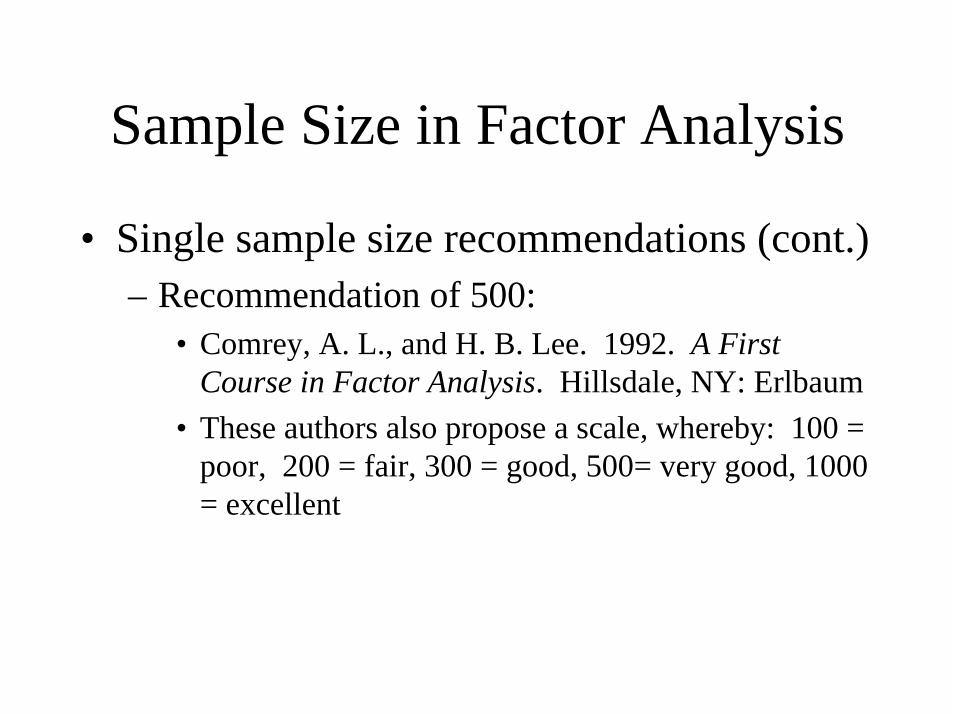
Sample Size in Factor Analysis
• Single sample size recommendations (cont.)– Recommendation of 500:
• Comrey, A. L., and H. B. Lee. 1992. A First Course in Factor Analysis. Hillsdale, NY: Erlbaum
• These authors also propose a scale, whereby: 100 = poor, 200 = fair, 300 = good, 500= very good, 1000 = excellent
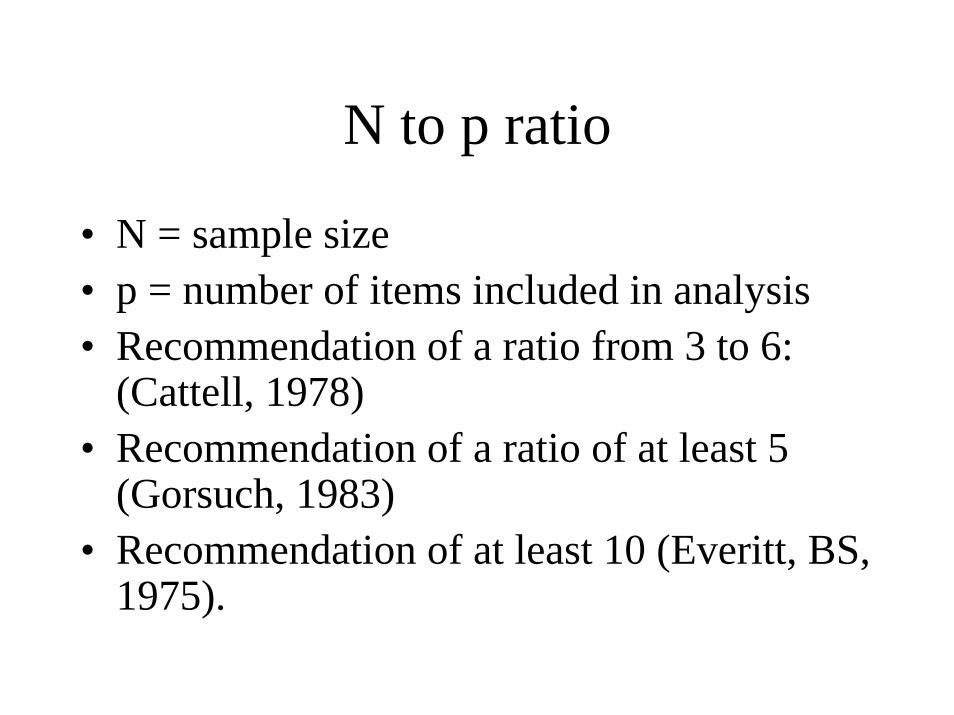
N to p ratio
• N = sample size• p = number of items included in analysis• Recommendation of a ratio from 3 to 6:
(Cattell, 1978) • Recommendation of a ratio of at least 5
(Gorsuch, 1983)• Recommendation of at least 10 (Everitt, BS,
1975).
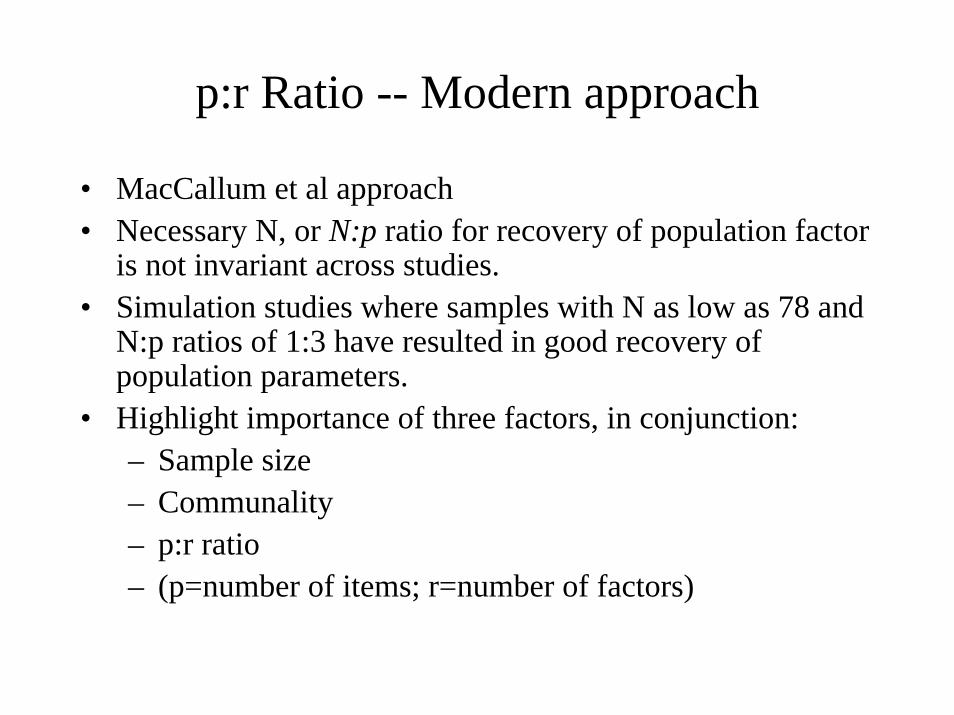
p:r Ratio -- Modern approach
• MacCallum et al approach• Necessary N, or N:p ratio for recovery of population factor
is not invariant across studies.• Simulation studies where samples with N as low as 78 and
N:p ratios of 1:3 have resulted in good recovery of population parameters.
• Highlight importance of three factors, in conjunction:– Sample size– Communality– p:r ratio– (p=number of items; r=number of factors)
Source: MacCallum, Robert C., Keith F. Widaman, Shaobo Zhang, and Sehee Hong. 1999. “Sample Size in Factor Analysis.” Psychological Methods 4:84-99.
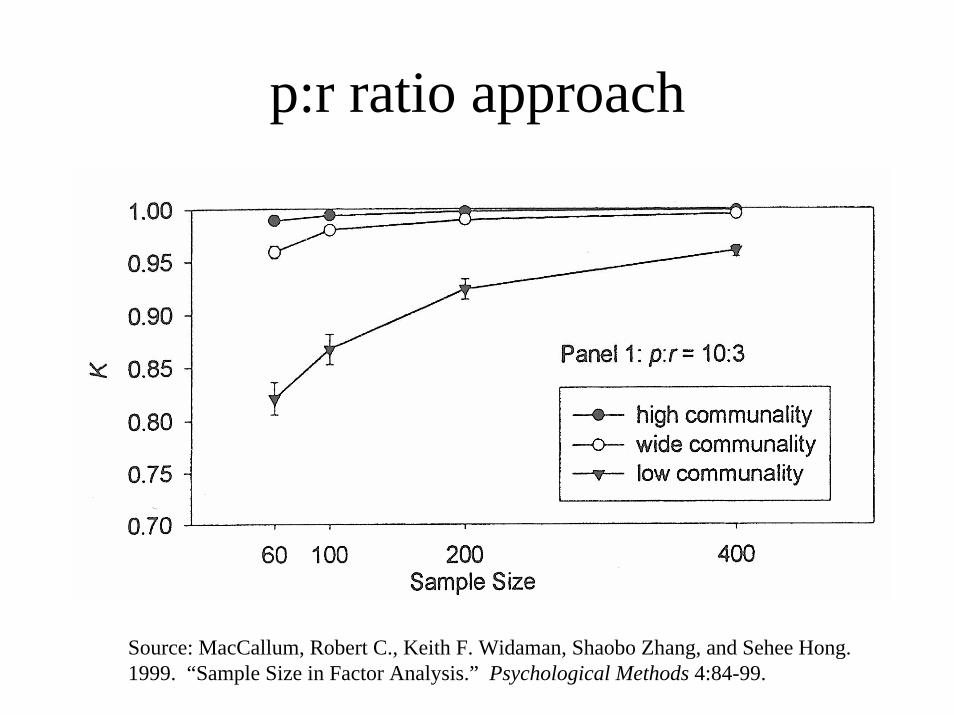
p:r ratio approach
Source: MacCallum, Robert C., Keith F. Widaman, Shaobo Zhang, and Sehee Hong. 1999. “Sample Size in Factor Analysis.” Psychological Methods 4:84-99.
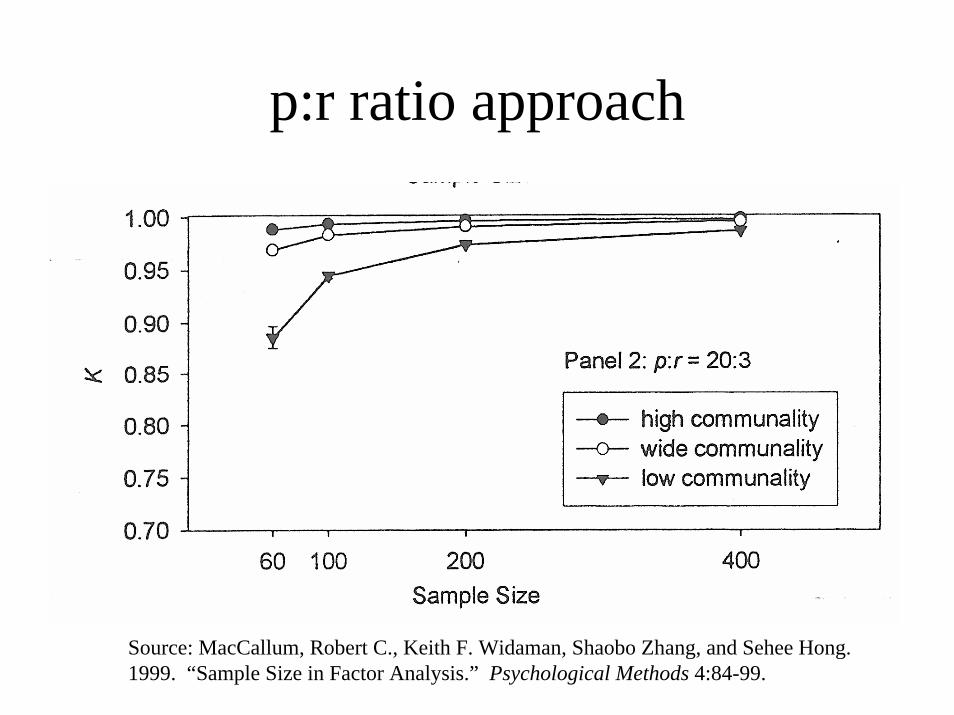
p:r ratio approach
p:r ratio approach
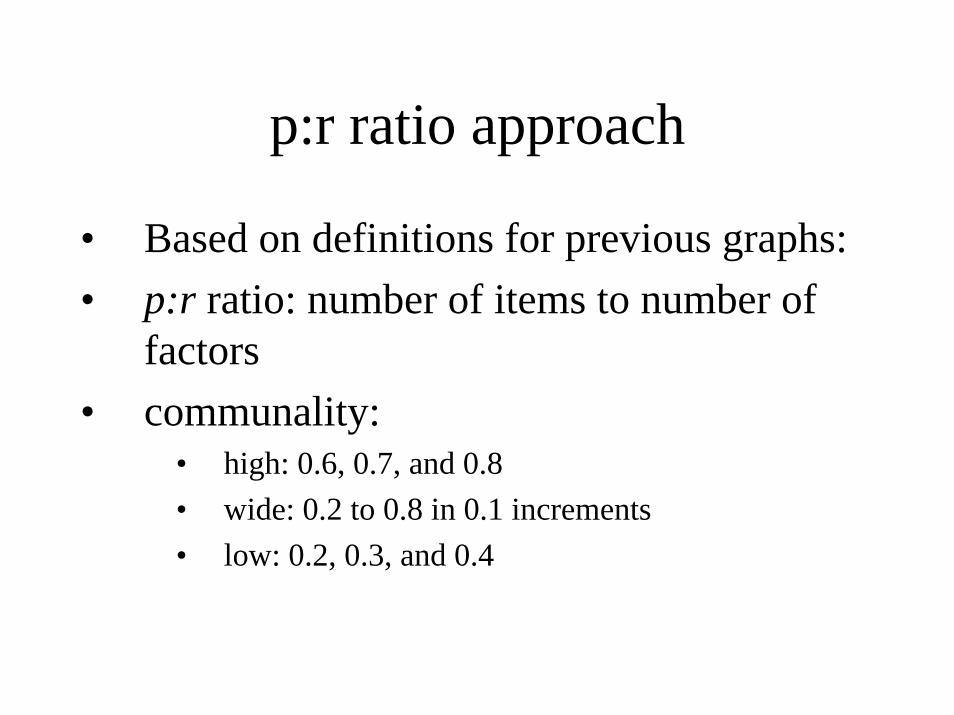
• Based on definitions for previous graphs:• p:r ratio: number of items to number of
factors • communality:
• high: 0.6, 0.7, and 0.8• wide: 0.2 to 0.8 in 0.1 increments• low: 0.2, 0.3, and 0.4
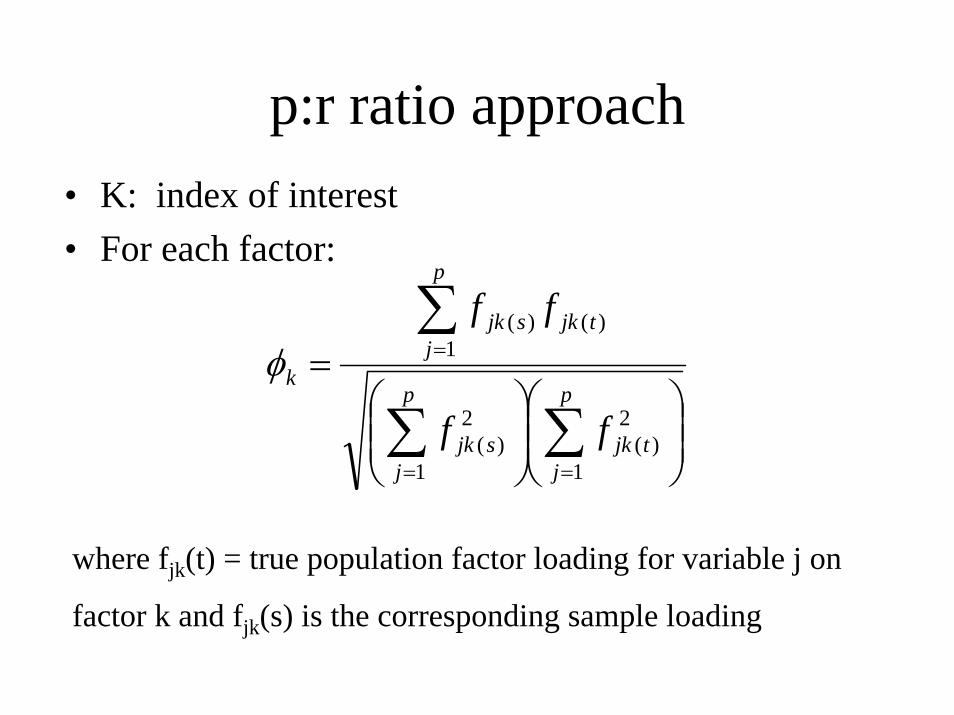
p:r ratio approach• K: index of interest• For each factor:
⎟⎟⎠
⎞⎜⎜⎝
⎛⎟⎟⎠
⎞⎜⎜⎝
⎛=
∑∑
∑
==
=
p
jtjk
p
jsjk
p
jtjksjk
k
ff
ff
1
2)(
1
2)(
1)()(
φ
where fjk(t) = true population factor loading for variable j on
factor k and fjk(s) is the corresponding sample loading
p:r ratio approach
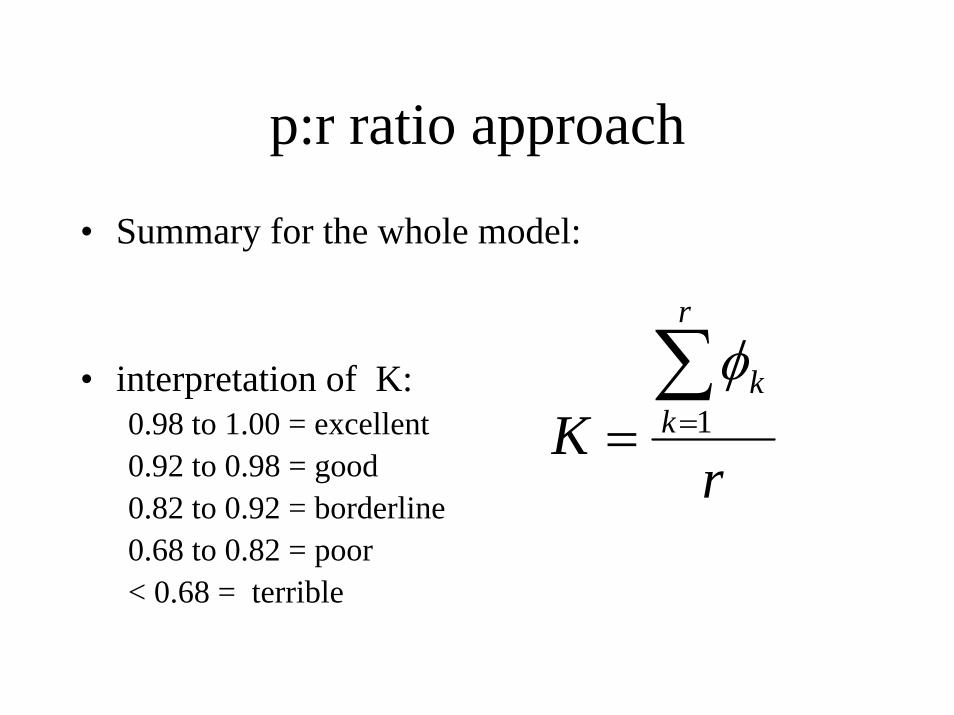
• Summary for the whole model:
• interpretation of K:0.98 to 1.00 = excellent0.92 to 0.98 = good0.82 to 0.92 = borderline0.68 to 0.82 = poor< 0.68 = terrible
rK
r
kk∑
== 1φ
Sample Size Considerations in Latent Class Analysis
• No formal approach has been taken• Critical factors that will affect ‘necessary’
sample size (in order of importance)– Class sizes
• If trying to detect small classes, need large N• Nature of the sample (epidemiologic versus patient
population
– Number of classes to be fit• The larger the number of classes, the larger the N
Sample Size Considerations in Latent Class Analysis
• Critical factors that will affect ‘necessary’ sample size (continued)– Overall prevalence of items
• Generally, want items with large variability (close to 0.5)• Depends on sensitivity of items (i.e., class specific
prevalences)– Number of items
• Some argue need at least 5 per number of possible patterns (doesn’t make sense to me)
• More items allow more complex structure• May tend to increase measurement error• More items may tend to ‘encourage’ violation of conditional
independence and violate model fit• Allows larger number of classes (due to identifiability)