sample plan for training purposes only - school · pdf filesample plan for training purposes...
TRANSCRIPT

Sample Plan for Training Purposes Only
CDE Improvement Planning Template for Schools (Version 1.4 -- Last updated: October 22, 2010) 1
Cover Sheet for Colorado’s Unified Improvement Plan for Schools for 2010-11
Organization Code: 0000 District Name: WXY District School Code: 0001 School Name MNOP Elementary School
Section I: Summary Information about the School
Directions: CDE has pre-populated the school’s 2009-10 data in blue text which was used to determine whether or not the school met the 2010-11 accountability expectations. More detailed reports on the school’s results are available in SchoolView (www.schoolview.org). The tables below have been pre-populated with data from the School Performance Framework and AYP (available through CDE reports shared with the districts). The state and federal expectations are provided as a reference and are the minimum requirements a school must meet for accountability purposes. Student Performance Measures for State and ESEA Accountability
Performance Indicators Measures/ Metrics ‘09-10 Federal and State Expectations ‘09-10 School
Results Meets
Expectations?
Academic Achievement (Status)
CSAP, CSAPA, Lectura, Escritura Description: % P+A in reading, writing, math and science Expectation: %P+A is above the 50th percentile by using 1-year or 3-years of data
Reading
1-year 3-years 1-year 3-years
Meets 71.6% 72.0% 75% 72% Math 70.9% 70.1% 40% 49% Approaching Writing 53.5% 54.8% 56% 55% Meets
Science 47.5% 45.4% n/a 46% Meets
Adequate Yearly Progress (AYP) Description: % PP+P+A on CSAP, CSAPA and Lectura in Reading and Math for each group Expectation: Targets set by state*
Overall number of targets for School: 36 Overall % of targets met by School: 89%
Reading Yes
Math No
Academic Growth
Median Student Growth Percentile Description: Growth in CSAP for reading, writing and math Expectation: If school met adequate growth, then median SGP is at or above 45 If school did not meet adequate growth, then median SGP is at or above 55
Reading
Median Adequate SGP Median SGP
Median SGP: 58 Meets 65 45/55
Math 77 45/55 Median SGP: 44 Approaching
Writing 74 45/55 Median SGP: 56 Meets
* To see annual AYP targets, go to: http://www.cde.state.co.us/FedPrograms/dper/aypprof.asp ** To see your school’s detailed AYP report (includes school results by content area, disaggregated group and school level), access the report in the Automated Data Exchange AYP System.

CDE Improvement Planning Template for Schools (Version 1.4 -- Last updated: October 22, 2010) 2
Student Performance Measures for State and ESEA Accountability (cont.)
Performance Indicators Measures/ Metrics ’09-10 Federal and State
Expectations ’09-10 School Results Meets Expectations?
Academic Growth Gaps
Median Student Growth Percentile Description: Growth for reading, writing and math by disaggregated groups. Expectation: If disaggregated groups met adequate growth, median SGP is at or above 45. If disaggregated groups did not meet adequate growth, median SGP is at or above 55.
Disaggregated groups meeting adequate growth: median SGP is at or above 45 Disaggregated groups not meeting adequate growth: median SGP is at or above 55 (See your school’s performance frameworks for listing of median adequate growth expectations for your school’s disaggregated groups, including free/reduced lunch eligible, minority students, students with disabilities, English Language Learners and students below proficient.)
Median student growth percentiles for all disaggregated groups were met in reading and writing. No disaggregated groups met median adequate growth percentiles in math. (See your school’s performance frameworks for listing of median growth by each subgroup.)
Overall Rating for Growth Gaps: Reading: Meets Writing: Meets Math: Minorities: Approaching ELL: Approaching Poverty: Approaching Disabilities: Approaching
Post Secondary Readiness
Graduation Rate Expectation: 80% or above
80% or above n/a n/a
Dropout Rate Expectation: At or below State average
1-year 3-years 1-year 3-years n/a
3.6% 3.9% n/a n/a
Mean ACT Composite Score Expectation: At or above State average
1-year 3-years 1-year 3-years n/a 20 20.1 n/a n/a

CDE Improvement Planning Template for Schools (Version 1.4 -- Last updated: October 22, 2010) 3
Accountability Status and Requirements for Improvement Plan
Program Identification Process Identification for School Directions for completing improvement plan
State Accountability
Recommended Plan Type Plan assigned based on school’s overall school performance framework score (achievement, growth, growth gaps, postsecondary and workforce readiness)
Improvement
The school has not met state expectations for attainment on the Performance Indicators and is required to adopt and implement an Improvement Plan. The plan must be submitted to CDE by April 15, 2011 to be uploaded on SchoolView.org. More detailed directions on the submittal process will be shared at a later date. Refer to the Checklist for State Requirements for School Improvement Plans available at www.schoolview.org/UnifiedImprovementPlanning.asp to ensure that all required elements are captured in the school's plan.
ESEA Accountability
School Improvement or Corrective Action (Title I)
Title I school missed same AYP target(s) for at least two consecutive years**
School Improvement – Year 2 (Math)
The school must complete a Title I Improvement Plan using the Unified Improvement Plan template within 3 months of identification (mid-January). The district must use a peer review process to review the plan within 45 days of plan submission. For required elements in the improvement plans, go to: www.schoolview.org/UnifiedImprovementPlanning.asp

CDE Improvement Planning Template for Schools (Version 1.4 -- Last updated: October 22, 2010) 4
Section II: Improvement Plan Information
Directions: This section should be completed by the school or district. Additional Information about the School
Improvement Plan Information
The school is submitting this improvement plan to satisfy requirements for (check all that apply): State Accountability Title IA Tiered Intervention Grant School Improvement Grant Other: ________________
Comprehensive Review and Selected Grant History
Related Grant Awards Did the school receive a Tiered Intervention grant? Indicate the intervention approach.
Turnaround Restart Transformation Closure
Has the school received a School Improvement grant? When was the grant awarded? No
School Support Team or Expedited Review Has (or will) the school participated in an SST review or Expedited Review? When? No
External Evaluator Has the school partnered with an external evaluator to provide comprehensive evaluation? Indicate the year and the name of the provider/tool used. No
School Contact Information (Additional contacts may be added, if needed) 1 Name and Title Jane Doe
Email [email protected]
Phone 555-555-5555 Mailing Address 555 Main Street, Anytown, CO 55555
2 Name and Title
Email Phone
Mailing Address

CDE Improvement Planning Template for Schools (Version 1.4 -- Last updated: October 22, 2010) 5
Section III: Narrative on Data Analysis and Root Cause Identification
This section corresponds with the “evaluate” portion of the continuous improvement cycle. Provide a narrative that examines the data for your school – especially in any areas where the school was identified for accountability purposes. To help you construct this narrative, this section has been broken down into three steps: (1) Gather and organize relevant data, (2) Analyze trends in the data and identify priority needs, (3) Determine the root causes of those identified needs, and (4) Create the narrative. Step One: Gather and Organize Relevant Data The planning team must gather data from a variety of sources to inform the planning process. For this process, schools are required to pull specific reports and are highly encouraged to supplement their analysis with local data to help explain the performance data. The team will need to include three years of data to conduct a trend analysis in the next step.
• Required reports. At a minimum, the school is expected to reference key data sources including: (1) School Performance Framework Report, (2) Growth Summary Report, (3) AYP Summaries (including detailed reports in reading and math for each subpopulation of students), and (4) Post Secondary Readiness data. This information is available either on SchoolView (www.schoolview.org/SchoolPerformance/ index.asp) or through CDE reports shared with the district.
• Suggested data sources. Furthermore, it is assumed that more detailed data is available at the school/district level to provide additional context and deepen the analysis. Some recommended sources may include:
Student Learning Local Demographic Data School Processes Data Perception Data
• Local outcome and interim assessments
• Student work samples • Classroom
assessments (type and frequency)
• School locale and size of student population • Student characteristics, including poverty,
language proficiency, IEP, migrant, race/ethnicity
• Student mobility rates • Staff characteristics (e.g., experience,
attendance, turnover) • List of schools and feeder patterns • Student attendance • Discipline referrals and suspension rates
• Comprehensive evaluations of the school (e.g., SST) • Curriculum and instructional materials • Instruction (time and consistency among grade levels) • Academic interventions available to students • Schedules and class sizes • Family/community involvement policies/practices • Professional development structure • Services and/or programs (Title I, special ed, ESL) • Extended day or summer programs
• Teaching and learning conditions surveys (e.g., TELL Colorado)
• Any perception survey data (e.g., parents, students, teachers, community, school leaders)
• Self-assessment tools (district and/or school level)
Step Two: Analyze Trends in the Data and Identify Priority Needs Using at least three years of data, the team should begin by identifying positive and negative trends in each of the key performance indicators (i.e., academic achievement, academic growth, academic growth gaps, post secondary readiness). The summary provided in Part I of this template (pp. 1-2) will provide some

CDE Improvement Planning Template for Schools (Version 1.4 -- Last updated: October 22, 2010) 6
clues on content areas, grade levels and disaggregated groups where the school needs to focus its attention. Local data (suggestions provided above) should also be included – especially in grade levels and subject areas not included in state testing. Next, the team should share observations of its strengths on which it can build, and identify areas of need. Finally, those needs should be prioritized. These efforts should be documented in the Data Analysis Worksheet below. Step Three: Root Cause Analysis This step is focused on examining the underlying cause of the needs identified in step two. A cause is a “root cause” if: (1) the problem would not have occurred if the cause had not been present, (2) the problem will not reoccur if the cause is dissolved and (3) correction of the cause will not lead to the same or similar problems. Finally, the school should have control over the proposed solution – or the means to implement the solution. Remember to verify the root cause with multiple data sources. These efforts should be documented in the Data Analysis Worksheet below. Data Analysis Worksheet Directions: This chart will help you record and organize your observations about your school level data for the required data analysis narrative. You are encouraged to conduct a more comprehensive analysis by examining all of the performance indicators. However, it is not necessary to complete every cell in the chart – just the areas that will be highlighted in the narrative. Keep in mind that you must address the performance indicators for the targets that were not met for accountability purposes. Ultimately, your analysis will then guide the major improvement strategies you choose in section IV. You may add rows, as necessary.
Performance Indicators
Description of Significant Trends (3 years of past data) Priority Needs Root Causes
Academic Achievement (Status)
Reading: 2008 – 68% P and A (less than CO); 2009 – 72% P and A (same as CO); 2010: 75% P and A (higher than CO) Writing: 2008 – 49% P and A (less than CO); 2009 – 52% P and A (less than CO); 2010 – 56% P and A (higher than CO)
None None
CSAP scores declined in Math from 44.6% proficient or above in 07-08 to 40% in 09-10 overall (grades 3 – 6). 45% of 3rd graders in 07-08, 40% of 4th graders on 08-09 and 35% of 5th graders in 09-10 were proficient or above in mathematics. For Hispanic students and ELLs, consistent low performance in mathematics with only 20% proficient or above for 07-08 through 09-10.
Consistent low performance in grades 5 – 6 in Standard 1 (Number Sense) across all disaggregated groups Persistent low performance among English Language Learners in mathematics across all standards and grades 3-6.
Teachers do not emphasize math concepts because there is no consensus on essential math skills within and across grades (each grade assumes Standard 1 is taught in a different grade). English language learners performing at the partially proficient or unsatisfactory level in mathematics in grades 3-6 have not been identified for or received additional support and/or regular monitoring of the progress of their mathematics learning.

CDE Improvement Planning Template for Schools (Version 1.4 -- Last updated: October 22, 2010) 7
Academic Growth
Reading and Writing: Above the 55th percentile and stable
n/a n/a
Math: Median Growth Percentile: Declining (44 in 09-10, 43 in 08-09, and 48 in 07-08.
Only 15% of students scoring U and PP on CSAP in math are making enough growth to catch up to proficient within three years,
Teachers do not emphasize math concepts because there is no consensus on essential math skills within and across grades (each grade assumes Standard 1 is taught in a different grade). Students with low performance and low growth in mathematics have not received any additional support and insufficient time is devoted to universal mathematics instruction (for the most part these are ELLS).
Academic Growth Gaps
Reading and Writing: None n/a n/a
Math: Persistent gap in growth between minority and non-minority students over the last three years, with non-minority median growth percentile at 30, 32, 31 for the last three years and non-minority at 50, 49, 47. For 09-10 the median adequate growth percentile for minority students was 80 and their median growth percentile was 31. Similar consistent low growth for ELLs, with median growth percentiles of 35, 33, 33 for the last three years. Also, similar low growth for non-proficient students with median growth percentile of 31 for the 09-10 school year when the adequate median growth percentile was 85.
The population of students who are English Language Learners performing at the partially proficient or unsatisfactory level have persistently low growth in mathematics.
English language learners performing at the partially proficient or unsatisfactory level in mathematics in grades 3-6 have not been identified for or received additional support and/or regular monitoring of the progress of their mathematics learning.
Post Secondary Readiness
n/a n/a n/a
n/a n/a n/a

CDE Improvement Planning Template for Schools (Version 1.4 -- Last updated: October 22, 2010) 8
Step 4: Create the Data Narrative Directions: Blend the work that you have done in the previous three steps: (1) Gather and organize relevant data, (2) Analyze trends in the data and identify priority needs, and (3) Determine the root causes of those identified needs. The narrative should not take more than five pages. Consider the questions below as you write your narrative. Data Narrative for School Trend Analysis and Priority Needs: On which performance indicators is my school trending positively? On which performance indicators is my school trending negatively? Does this differ for any disaggregated student groups, e.g., by grade level or gender?
Root Cause Analysis: Why do you think this is?
Verification of Root Cause: What evidence do you have for your conclusions?
Narrative: Trend and Priority Needs We considered three years of data related to academic performance trends. That data included not only state CSAP results but also district administered interim assessments (NWEA MAPS) results. Trends in achievement were consistent across these two measures. CSAP : Although we met the state targets in reading and writing, our CSAP math scores (40% proficient and advanced) are below the state average and are declining. We continue to have difficulty moving students from Unsatisfactory to Partially Proficient, especially at the 5th grade. 2008 2009 2010 Grade 3 47 42 40
Grade 4 45 44 39 Grade 5 50 44 41 3-year results for all grades: 44.67% Proficient and Advanced
Growth Summary: Our students exceeded the state median growth percentile in reading and writing, but scored at the 44th percentile in math. While 55% of our students were on track to catch up in reading and 49% were on track to catch up in writing, only 15% were on track to catch up in math. Similar results were found in keep up growth: (55% in reading, 42% in writing, 22% in math), and move up growth (55% in reading, 44% in writing, and 17% in math). Free/reduced lunch, minority, IEP, ELL, and non-proficient students are making less growth math than our general population. Growth was consistent across the three most recent years, with the same populations showing low performance across time. It is important to note, that while these are different disaggregated groups, the students who struggle are the same. 80% of the students scoring below proficient are English Language Learners who qualify for free/reduced lunch. 100% of our English Language Learners are also minority –90% are Hispanic. Our growth analysis points to a specific population within our school with a performance challenge in mathematics -- students scoring below proficient, who are English Language Learners, Hispanic and who qualify for free/reduced price lunch. However, we note that several other similar schools in the district show much higher growth with these populations in math, and we will compare further.
Median Growth Percentile 07-08 08-09 09-10Reading Total 61 55 58Writing Total 56 55 56

CDE Improvement Planning Template for Schools (Version 1.4 -- Last updated: October 22, 2010) 9
Math Total 46 43 44 FRL/Non 32/44 31/42 29/37 Min/Non 30/50 32/49 31/47 IEP/Non 27/37 24/42 38/57 ELL/Non 35/39 33/44 33/45 Non-Prof/Prof 45/58 39/51 31/47
Percent Catching Up
07-08 08-09 09-10Reading Total 44 47 49Writing Total 36 38 37Math Total 20 18 15 FRL/Non 16/28 19/29 12/16 Min/Non 13/20 11/23 11/18 IEP/Non 10/18 9/20 8/16 ELL/Non 17/29 11/19 9/21 Non-Prof/Prof 14/22 11/24 14/28
Percent Keeping Up
07-08 08-09 09-10Reading Total 81 80 82Writing Total 52 52 54Math Total 23 36 27 FRL/Non 24/39 23/40 22/47 Min/Non 23/52 24/37 28/51 IEP/Non 29/50 26/31 38/52 ELL/Non 33/48 22/45 29/46 Non-Prof/Prof 34/41 34/49 24/38
Percent Moving Up
07-08 08-09 09-10Reading Total 31 35 35Writing Total 27 29 28Math Total 14 16 17 FRL/Non 12/25 14/17 8/19 Min/Non 9/13 12/19 10/17 IEP/Non 3/18 2/15 4/14 ELL/Non 4/14 4/18 4/16 Non-Prof/Prof 14/19 13/19 12/16
In addition to considering the performance of disaggregated groups of students, we also considered student performance by standard area. We analyzed CSAP results by standard as well as NWEA MAPS results and then considered classroom assessment results. We found the lowest performance across all groups and across all grades in Standard 1 (Number Sense). The majority of students, regardless of disaggregated group, missed CSAP items related to number sense. This

CDE Improvement Planning Template for Schools (Version 1.4 -- Last updated: October 22, 2010) 10
pattern was evident in our analysis of NWEA MAPS results and as we examined a sample of classroom-level assessments (few of which even assessed number sense at any grade level other than 3rd). AYP: We have failed to make Math AYP targets in previous years based on the low achievement of minority, ELL, and IEP students.
AYP Trends 06-07 07-08 08-09 09-10Reading No Yes Yes YesMath No No No No (82% PP, P or A)
AYP Free/Reduced Lunch Trends
06-07 07-08 08-09 09-10Reading No No No YesMath No No No No (79% PP, P or A)
AYP IEP Trends
06-07 07-08 08-09 09-10Reading No No Yes YesMath No No No No (62% PP, P or A)
AYP ELL Trends
06-07 07-08 08-09 09-10Reading No Yes Yes YesMath No No No No (78% PP, P or A)
Root Cause: Low Math Achievement and Growth We considered additional data as we engaged in root cause analysis. In particular we collected data from teachers about: the amount of time spent in mathematics instruction on a daily basis, interventions or additional support provided to low performing students, ELL strategies used in mathematics, and the degree to which they provided learning experiences related to Standard 1 (Number Sense). We realized the plan we wrote for Year One of School Improvement did not increase student scores or reduce the achievement gap because we had too many targets, focused too much on student demographics and mobility, and did not clearly determine why we did not make AYP. Our analysis led us to identify the following root causes.
1. Because our math scores were below the state average at all grades and were declining, the quality of math instruction in all grades was analyzed. We examined our curriculum and found that our materials appear to be sufficient, covering both concrete and conceptual math skills and all of the new state standards. The teachers acknowledged that they spent more time teaching concrete math skills, but few, especially in grades 4 and 5, allocated much time to math concepts. A corollary of this is that almost no time is spent on writing in math. Rather, the focus is solving problems to the exclusion of thinking in mathematical terms. Teachers were able to provide few examples of specific instruction related to Standard 1 (Number Sense) other than in

CDE Improvement Planning Template for Schools (Version 1.4 -- Last updated: October 22, 2010) 11
the 3rd grade. Our analysis revealed that there is little agreement on the specific skills that all students need to “master” by the end of each grade. Some teachers address almost all the skills covered in the math program at a surface level; others pick and choose what they will teach, but at a deeper level. Teachers did not make a distinction between which mathematics content their students had mastered, and which had just been covered in class.
2. Insufficient instructional time for math was also identified as a root cause. The average time spent on math instruction by grade in 2009-10 was: K: 15 minutes Grade 1: 25 minutes Grade 2: 20 minutes Grade 3: 25 minutes Grade 4: 30 minutes Grade 5: 45 minutes, although teachers acknowledged that only about 20-25 minutes was actually spent on instruction. Because they “departmentalized” (grouped) students in an effort to better meet needs, each teacher had at least two math groups. This was general instruction for all students. No additional time for groups of students needing additional support had been identified.
. 3. Students with performance challenges in mathematics have not been identified for additional support. We have not been monitoring student progress in
math as we have done with DIBELS in reading and writing samples in writing. Teachers administer teacher-made tests and math textbook unit tests, but have not used these data formatively to identify student needs, adjust instruction on an on-going basis, or engage students in identifying their own learning needs. Students who were falling behind didn’t receive any additional support and no progress monitoring was in place for these students.
Verification of Root Cause Our initial discussions with the school leadership team led us to examine more closely what was happening in classrooms with regard to mathematics instruction. We collected additional data from teachers about the time spent on mathematics instruction on a daily basis over a month to verify one of our explanations -- that not enough time was spent on mathematics learning. Then we administered a survey to our teachers to gather more data about the content of the mathematics instruction and use of assessment in mathematics. The results from this survey verified our root cause that mathematics instruction was not focused on the necessary skills and that students who were falling behind did not get additional support. It is evident that changes must be made in math instruction and content, in the time allocated, and in progress-monitoring, which will require professional development schoolwide. Further verification of the root causes will come as we implement changes and obtain the desired results.

CDE Improvement Planning Template for Schools (Version 1.4 -- Last updated: October 22, 2010) 12
Section IV: Action Plan(s)
This section focuses on the “plan” portion of the continuous improvement cycle. First you will identify your annual targets and the interim measures. This will be documented in the School Goals Worksheet. Then you will move into the action plans, where you will use the action planning worksheet. School Goals Worksheet Directions: Complete the worksheet for the priority needs identified in Section III; although, all schools are encouraged to set targets for all performance indicators. Annual targets for AYP have already been determined by the state and may be viewed on the CDE website at: http://www.cde.state.co.us/FedPrograms/danda/aypprof.asp. Safe Harbor and Matched Safe Harbor goals may be used instead of performance targets. For state accountability, schools are expected to set their own annual targets for academic achievement, academic growth, academic growth gaps and post secondary readiness. Once annual targets are established, then the school must identify interim measures that will be used to monitor progress toward the annual targets at least twice during the school year. Make sure to include interim targets for disaggregated groups that were identified as needing additional attention in Section III (data analysis and root cause analysis). Finally, list the major strategies that will enable the school to meet those targets. The major improvement strategies will be detailed in the action planning worksheet. Example of an Annual Target for a Title I Elementary School
Measures/ Metrics 2010-11 Target 2011-12 Target
AYP R 94.23% of all students and of each disaggregated group will be PP and above OR will show a 10% reduction in percent of students scoring non-proficient.
94.23% of all students and by each disaggregated group will be PP and above OR will show a 10% reduction in percent of students scoring non-proficient.

CDE Improvement Planning Template for Schools (Version 1.4 -- Last updated: October 22, 2010) 13
School Goals Worksheet (cont.)
Performance Indicators
Measures/ Metrics
Annual Targets Interim Measures for 2010-11
Major Improvement Strategies 2010-11 2011-12
Academic Achievement
(Status)
CSAP, CSAPA, Lectura, Escritura
R n/a n/a n/a n/a
M
By the end of the 2010-2011 school year, 45% of the students will score proficient or advanced overall on the math CSAP. There will be a ten percentage point increase in the percent of students proficient or above on Standard 1 (Number Sense). 40% of students who are Hispanic, English Language Learners who qualify for free-reduced price lunch will score proficient or advanced on CSAP
By the end of the 2011-2012 school year, 50% of the students will score proficient or advanced overall on the math CSAP. There will be a ten percentage point increase in the percent of students proficient or above on Standard 1 (Number Sense). 50% of students who are Hispanic, English Language Learners who qualify for free-reduced price lunch will score proficient or advanced on CSAP
NWEA MAPS Assessment (administered 3 times during the school year: Sept., Dec., and Mar.) AIMSWeb Math assessments (administered monthly during the school year). % of students meeting targets overall and in Standard 1 (Number Sense). Common items administered as part of several end-of unit assessments across classrooms that focus on Standard 1 (Number Sense).
Identify specific math skills to be taught within and across grade levels, especially those related to Standard 1 and writing and thinking mathematically. Increase amount of time allocated daily to math instruction at each grade and provide additional instruction time to students requiring additional support, especially on Standard 1. Progress monitor student progress in math using NWEA MAPS Mathematics Assessment (3 times yearly), AIMSweb (monthly), and common end-of unit assessments focused on Standard 1.
W n/a n/a n/a n/a
S n/a n/a n/a n/a

CDE Improvement Planning Template for Schools (Version 1.4 -- Last updated: October 22, 2010) 14
AYP (Overall and for each disaggregated groups)
R State target: Elem: 94.23% PP and above on CSAP
State target: Elem: 94.23% PP and above on CSAP n/a n/a
M
State target: Elem: 94.54% PP and above on CSAP and CSAPA Since the school as a whole had 82% of students PP, P or A in 09-10, our 10-11 goal will be to make Safe Harbor in order to make AYP. Specifically, we will reduce the percent of unsatisfactory students by 10%, to 16.2%. Our goal will be for 83.8% of continuously enrolled students to be PP, P or A. Our goal will also be for each disaggregated group to make Safe Harbor and make at least a 10% reduction.
State target: Elem: 94.54% PP and above on CSAP and CSAPA Our school will again work towards making Safe Harbor in order to make AYP. At a maximum, we will have 14.8% of students Unsatisfactory in math, with 85.2% PP, P or A. Again, our goal will also be for each disaggregated group to make Safe Harbor and make at least a 10% reduction. These goals will be revisited with the 10-11 AYP results
NWEA MAPS Mathematics Assessment (administered 3 times during the school year – September, December and March) Common items administered as part of several end-of unit assessments across classrooms that focus on Standard 1 (Number Sense). Note all of these assessment results will be disaggregated across classrooms by ELL, F/R Lunch status, and Race/Ethnicity.
Same as above
Academic Growth
Median Student Growth Percentile
R n/a n/a n/a n/a
M By the end of the 2010-11 school year, the Median Student Growth Percentile in Math will be 50.
By the end of the 2011-12 school year, the Median Student Growth Percentile in Math will be 55.
NWEA Maps Assessments (administered 3 times during the year). Fall-spring RIT growth in math, with goal of meeting or exceeding NWEA growth targets for all grades.
Same as above.
W n/a n/a
n/a n/a

CDE Improvement Planning Template for Schools (Version 1.4 -- Last updated: October 22, 2010) 15
Academic Growth Gaps
Median Student Growth Percentile
R n/a n/a n/a n/a
M
By the end of the 2010-11 school year, the school will meet SPF growth expectations for students designated as ELLs, F/R Lunch eligible and Minority (MGP of 45 if below adequate growth percentile; MGP of 55 if above adequate growth percentile). 35% of the students scoring below proficient will make catch-up growth.
By the end of the 2011-12 school year, the school will exceed SPF growth expectations for students designated as ELLs, F/R Lunch eligible and Minority (MGP of 60 if below adequate growth percentile; MGP of 70 if above adequate growth percentile). 50% of the students scoring below proficient will make catch-up growth.
NWEA Maps Assessments (administered 3 times during the year). Fall-spring RIT growth in math, with goal of meeting or exceeding NWEA growth targets for all grades.
Same as above
W n/a n/a n/a n/a
Post Secondary & Workforce Readiness
Graduation Rate n/a n/a n/a n/a
Dropout Rate n/a n/a n/a n/a
Mean ACT n/a n/a n/a n/a

CDE Improvement Planning Template for Schools (Version 1.4 -- Last updated: October 22, 2010) 16
Action Planning Worksheet Directions: Based on your data analysis in section III, prioritize the root causes that you will address through your action plans and then match it to a major improvement strategy(s). For each major improvement strategy (e.g., adjust reading approach) and the root cause(s) that the action will help to dissolve. Then indicate which accountability provision or grant opportunity it will address. In the chart, provide details on key action steps (e.g., re-evaluating supplemental reading materials, providing new professional development and coaching to school staff) necessary to implement the major improvement strategy. Details should include a description of the action steps, a general timeline, resources that will be used to implement the actions and implementation benchmarks. Implementation benchmarks provide the school with checkpoints to ensure that activities are being implemented as expected. If the school is identified for improvement/corrective action under Title I, action steps should include family/community engagement strategies and professional development (including mentoring) as they are specifically required by ESEA. Add rows in the chart, as needed. While space has been provided for three major improvement strategies, the school may add other major strategies, as needed. Major Improvement Strategy #1: Identify specific math skills to be taught within and across grade levels, especially those related to Standard 1 (Number Sense) and writing and thinking mathematically. Root Cause(s) Addressed by the Major Improvement Strategy: Minimal focus on math concepts, especially in Standard 1 (Number Sense), writing and thinking mathematically, and determining mastery; little agreement on the specific skills that all students need to “master” by the end of each grade. Accountability Provisions or Grant Opportunities Addressed by this Major Improvement Strategy (check all that apply): School Plan under State Accountability. Title IA School Improvement/Corrective Action Plan Application for a Tiered Intervention Grant.
Amendments to a Title I schoolwide or targeted assistance plan. School Improvement Grant.
Description of Action Steps to Implement the Major Improvement Strategy Timeline Key Personnel
Resources
(federal, state, and/or local) Implementation Benchmarks
Teachers meet in grade level teams (facilitated by the school’s math instructional coach) to identify essential math skills and concepts to be taught at each grade level, ensuring Standard 1 (Number Sense) is addressed at the appropriate level in each grade level, and sequence (develop a progression of learning for each) across the school year.
Aug-October 2010
Instructional Coach Stipends for teachers: $25/hr x 12 teachers x 20 hours = $6000 (local funds) Instructional coach (.2 FTE Title I = $15,000)
Essential math skills are identified for each grade level no later than Sept. 30, 2010. The progression of learning within a grade-level, and sequencing of content that scaffolds to the essential skills and concepts are identified for every grade level by October 29th, 2010.
Teachers will meet in cross-grade level groups in the fall to identify and align student expectations across grade levels – defining what students must know and be able to do to be prepared for math instruction at the next grade.
Oct-Nov 2010
Instructional Coach Stipends for wo rk: $25/hr x 4 hrs x 8 teachers for 4 months = $3200 local funds) Instructional coach (.05 FTE Title I = $15,000)
Essential skills will be aligned across grade levels to insure that no gaps exist and that all Colorado math standards are addressed no later than November 28th. 2010.

CDE Improvement Planning Template for Schools (Version 1.4 -- Last updated: October 22, 2010) 17
Major Improvement Strategy #2: Increase amount of time allocated daily to math instruction at each grade and provide additional instructional time to students requiring additional support, especially in Standard 1 (Number Sense). Root Cause(s) Addressed by the Major Improvement Strategy: Insufficient instructional time for math and no additional time for groups of students needing additional support Accountability Provisions or Grant Opportunities Addressed by this Major Improvement Strategy (check all that apply): School Plan under State Accountability. Title IA School Improvement/Corrective Action Plan Application for a Tiered Intervention Grant.
Amendments to a Title I schoolwide or targeted assistance plan. School Improvement Grant.
Description of Action Steps to Implement the Major Improvement Strategy Timeline Key Personnel
(optional) Resources
(federal, state, and/or local) Implementation Benchmarks
Research the amount of time necessary for effective math instruction at elementary level.
August 2010 Principal, Leadership Team
2 days of leadership team member time. (local funds)
School schedule will be developed in August 2010 that insures that the recommended number of minutes of math instruction is provided at each grade. Monthly principal walk-throughs will show an increase in time spent on mathematics instruction.
Insure that the research-based minimum number of minutes of math instruction is provided daily at each grade level.
Sept 2010-May 2011
Teachers None
Insure that each grade level schedules a minimum of 30 minutes each day for an intervention period for students requiring additional instructional support in mathematics. Allocate 50% of the time of a Title I teacher with strong math skills to math intervention.
2010-11 school year
Principal, Grade Level Chairpersons Title I teacher and paraprofessional
Title I Teacher and para-professional salaries
Analysis of formative math data will show that the additional instructional opportunities are increasing the achievement of targeted groups. Instructional support will be increased in January if formative data indicate the need.

CDE Improvement Planning Template for Schools (Version 1.4 -- Last updated: October 22, 2010) 18
Major Improvement Strategy #3: Progress monitor student achievement using NWEA MAPS Mathematics Assessment (3 times yearly), AIMSweb (monthly), and common end-of unit Standard 1 (Number Sense) assessments in order to identify students who need additional instruction in mathematics. Root Cause(s) Addressed by the Major Improvement Strategy: Students with performance challenges in mathematics have not been identified for additional support; no progress monitoring systems in place to formatively to identify student needs, adjust instruction on an on-going basis, or engage students in identifying their own learning needs. Accountability Provisions or Grant Opportunities Addressed by this Major Improvement Strategy (check all that apply):
School Plan under State Accountability. Title IA School Improvement/Corrective Action Plan Application for a Tiered Intervention Grant. Amendments to a Title I schoolwide or targeted assistance plan. School Improvement Grant.
Description of Action Steps to Implement the Major Improvement Strategy Timeline Key Personnel
(optional) Resources
(Amount and Source: federal, state, and/or local)
Implementation Benchmarks
Provide training in: a. Interpretation of NWEA data for instructional
planning and establishing intervention groups; b. Administration and interpretation of AIMSweb for
progress-monitoring, instructional planning, and establishing intervention groups.
Administer teacher survey three times a year to measure teacher confidence and comfort in interpreting NWEA and AIMSweb assessment data and using those data to identify students at-risk in math, to plan instructional, and to establish intervention groups.
August 2010 Sept-Oct 2010 Sept. 2010, Jan. 2011, May 2011
Instructional Coach BOCES professional developer Principal, Instructional Coach
Title I funds: $1800 School funds: $1000 None
100% of teachers in grades 2-5 will participate in trainings. Teacher survey administered in Sept., Jan. and May will show increased teacher confidence and comfort in interpreting NWEA and AIMSweb data and using those data to identify students at-risk in math, to plan instructional, and to establish intervention groups.
Establish and follow a progress-monitoring schedule. Sept, 2010-May 2011
Instructional Coach and Teacher Leadership Team
None Principal and Leadership Team will verify that progress-monitoring schedule is followed.
Discuss results of progress monitoring at monthly data meetings and adjust math instruction and intervention groups based on discussion.
Sept, 2010-May 2011
Principal Leadership Team Teachers
None Meeting minutes will show that meetings were held, which students were discussed, and what adjustments in instruction and groups were made. Principal and Leadership Team will review minutes monthly.

CDE Improvement Planning Template for Schools (Version 1.4 -- Last updated: October 22, 2010) 19
Title I Accountability Provision #1: Parent Involvement/Communication School Plan under State Accountability. Title IA School Improvement/Corrective Action Plan Application for a Tiered Intervention Grant.
Title I schoolwide or targeted assistance requirement. School Improvement Grant.
Description of Action Steps to Address the Accountability Provision Timeline Key Personnel
(optional) Resources
(federal, state, and/or local) Implementation Benchmarks
Hold a beginning of the year orientation meeting for Title I parents to explain our program, answer questions, and invite parent participation.
September, 2010 Title I Teacher and Paraprofessional Principal
None Meeting will be held no later than September 30. Evaluation of meeting by parents will show that it was useful and informative.
Hold Parent/Teacher Conferences each semester with parents to discuss progress of their student (a translator will be available if necessary).
November, 2010 March 2011
Title I Teacher
$500 for translation (Local funds)
Conferences with parents regarding student progress.
Send home Quarterly Progress Reports in both English and Spanish to inform parents of their child's progress and the concepts and skills being covered
Oct. 2010, Dec. 2010, Feb. 2011, Apr. 2011
Teachers Title I Teachers
$150 for printing (Local funds) Quarterly reports will be sent home.
Following a dinner, we will hold a Family Math Night. We will provide Math Make-and Takes for parents, focusing on strengthening student math skills. We will also send home a Monthly Math newsletter in both English and Spanish with math activities and strategies for parents to use with their children.
November 2010 Every month
Principal Teachers Title I Teacher
$400 for dinner (PTO funds) $500 for printing and materials (Local funds)
Parent evaluation of the Family Math night will indicate that parents found it to be enjoyable and informative. A survey on the Monthly Math newsletter will indicate that parents are reading it and are using some of the activities with their children.
Send written notification in English and Spanish to all parents that the school is in the second year of School Improvement and that they have the option to transfer their student to another school in the district that is not on school improvement.
August 1, 2010 Principal $200 for printing and postage (Local funds)
Letters will be sent by August 1.
Send written notification in English and Spanish to the parents of all low-income students notifying them about supplemental education service opportunities. Provide a list of all supplemental service providers.
September 15, 2010
Principal $150 for printing and postage (Local funds)
Letters will be sent by September 15.
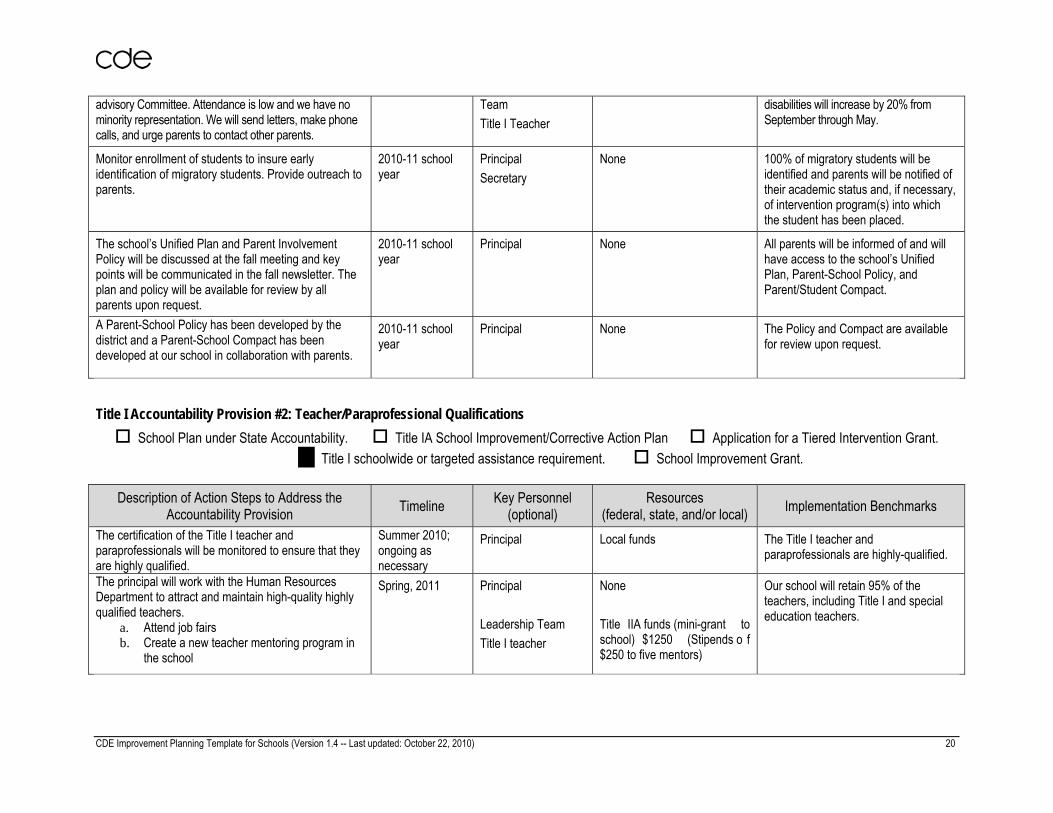
Increase our efforts to get parents of minority students, ELLs and students with disabilities involved in our parent
2010-11 school year
Principal School Leadership
$500 for printing Enrollment of parents of minority students, ELLs and students with
CDE Improvement Planning Template for Schools (Version 1.4 -- Last updated: October 22, 2010) 20
advisory Committee. Attendance is low and we have no minority representation. We will send letters, make phone calls, and urge parents to contact other parents.
Team Title I Teacher
disabilities will increase by 20% from September through May.
Monitor enrollment of students to insure early identification of migratory students. Provide outreach to parents.
2010-11 school year
Principal Secretary
None 100% of migratory students will be identified and parents will be notified of their academic status and, if necessary, of intervention program(s) into which the student has been placed.
The school’s Unified Plan and Parent Involvement Policy will be discussed at the fall meeting and key points will be communicated in the fall newsletter. The plan and policy will be available for review by all parents upon request.
2010-11 school year
Principal None All parents will be informed of and will have access to the school’s Unified Plan, Parent-School Policy, and Parent/Student Compact.
A Parent-School Policy has been developed by the district and a Parent-School Compact has been developed at our school in collaboration with parents.
2010-11 school year
Principal None The Policy and Compact are available for review upon request.
Title I Accountability Provision #2: Teacher/Paraprofessional Qualifications School Plan under State Accountability. Title IA School Improvement/Corrective Action Plan Application for a Tiered Intervention Grant.
Title I schoolwide or targeted assistance requirement. School Improvement Grant.
Description of Action Steps to Address the Accountability Provision Timeline Key Personnel
(optional) Resources
(federal, state, and/or local) Implementation Benchmarks
The certification of the Title I teacher and paraprofessionals will be monitored to ensure that they are highly qualified.
Summer 2010; ongoing as necessary
Principal
Local funds The Title I teacher and paraprofessionals are highly-qualified.
The principal will work with the Human Resources Department to attract and maintain high-quality highly qualified teachers.
a. Attend job fairs b. Create a new teacher mentoring program in
the school
Spring, 2011 Principal Leadership Team Title I teacher
None Title IIA funds (mini-grant to school) $1250 (Stipends o f $250 to five mentors)
Our school will retain 95% of the teachers, including Title I and special education teachers.
CDE Improvement Planning Template for Schools (Version 1.4 -- Last updated: October 22, 2010) 21
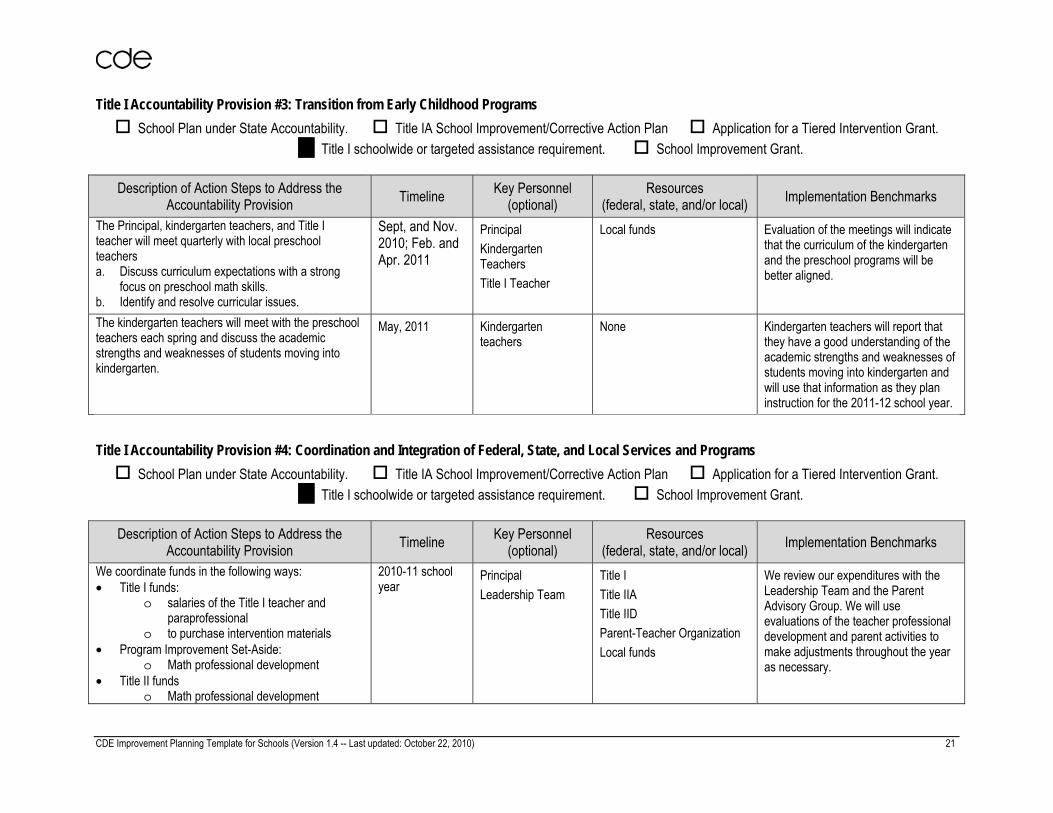
Title I Accountability Provision #3: Transition from Early Childhood Programs School Plan under State Accountability. Title IA School Improvement/Corrective Action Plan Application for a Tiered Intervention Grant.
Title I schoolwide or targeted assistance requirement. School Improvement Grant.
Description of Action Steps to Address the Accountability Provision Timeline Key Personnel
(optional) Resources
(federal, state, and/or local) Implementation Benchmarks
The Principal, kindergarten teachers, and Title I teacher will meet quarterly with local preschool teachers a. Discuss curriculum expectations with a strong
focus on preschool math skills. b. Identify and resolve curricular issues.
Sept, and Nov. 2010; Feb. and Apr. 2011
Principal Kindergarten Teachers Title I Teacher
Local funds Evaluation of the meetings will indicate that the curriculum of the kindergarten and the preschool programs will be better aligned.
The kindergarten teachers will meet with the preschool teachers each spring and discuss the academic strengths and weaknesses of students moving into kindergarten.
May, 2011 Kindergarten teachers
None
Kindergarten teachers will report that they have a good understanding of the academic strengths and weaknesses of students moving into kindergarten and will use that information as they plan instruction for the 2011-12 school year.
Title I Accountability Provision #4: Coordination and Integration of Federal, State, and Local Services and Programs School Plan under State Accountability. Title IA School Improvement/Corrective Action Plan Application for a Tiered Intervention Grant.
Title I schoolwide or targeted assistance requirement. School Improvement Grant.
Description of Action Steps to Address the Accountability Provision Timeline Key Personnel
(optional) Resources
(federal, state, and/or local) Implementation Benchmarks
We coordinate funds in the following ways: • Title I funds:
o salaries of the Title I teacher and paraprofessional
o to purchase intervention materials • Program Improvement Set-Aside:
o Math professional development • Title II funds
o Math professional development
2010-11 school year
Principal Leadership Team
Title I Title IIA Title IID Parent-Teacher Organization Local funds
We review our expenditures with the Leadership Team and the Parent Advisory Group. We will use evaluations of the teacher professional development and parent activities to make adjustments throughout the year as necessary.

CDE Improvement Planning Template for Schools (Version 1.4 -- Last updated: October 22, 2010) 22
• IID funds o Teacher technological literacy and their
ability to integrate technology into their instruction
• PTO Funds o Classroom materials o Parent activities