sample group loti profile report
TRANSCRIPT

20th Anniversary Edition
LoTi Digital Age Profile
©2016 LoTi
Organization:Hollywood Sample School
Participants:52
Data Collected:07/01/2015 — 06/30/2016
2
Levels of Teaching Innovation (LoTi) Today, LoTi as Levels of Teaching Innovation represents the transformation from didactic teaching practices and student compliant learning to Digital Age teaching and learning characterized by the use of digital tools and resources to promote higher order cognitive processing, engaged student learning, and authentic, real-world problem-solving. The acronym, LoTi, is similar to other research-based frameworks to improve student achievement and classroom pedagogy, but differs in its fundamental approach-an approach that uses Digital Age literacy (e.g., learning-centered instruction, real-world problem-solving, collaborative learning environments) to achieve targeted outcomes impacting student success in the classroom. LoTi Digital Age Survey Your organization recently conducted a digital age profile to ascertain each participant’s current level of teaching innovation using the LoTi Digital Age Survey. This instrument measures a broad range of metrics pivotal to digital age literacy and innovative teaching practices (e.g., Moersch’s LoTi Framework, Puentedura’s SAM-R Framework, Webb’s Depth of Knowledge.)
The LoTi Digital Age Survey focused on teacher behaviors, perceptions, and instructional practices using digital tools and resources which collectively have the greatest impact on student achievement and success in the classroom. Such information will enable school systems to target funding sources and provide differentiated professional development opportunities directed at moving participants to a higher level of teaching innovation in the classroom, and in doing so, better prepare students for the challenges facing them in a highly competitive, digital age society.
The LoTi Digital Age Survey generated a customized set of resources/strategies for each participant based on the LoTi, H.E.A.T., and Digital Age Best Practices Frameworks. Each set of resources/strategies, in essence, represents a personalized professional development growth plan for each individual targeting digital age literacy, classroom pedagogy, and student achievement.
LoTi Digital Age Profile On a macro-planning level, the LoTi Digital Age Profile includes a series of comparative analyses involving potential variables impacting the use of digital resources in the classroom. Each of these analyses reports the actual correlation between the teachers’ Level of Teaching Innovation (LoTi) and specific variables involving teacher planning and preparation, teacher perceptions, and school climate. The resulting analysis offers additional insight into areas for potential professional development on a school building/district level that can elevate teaching innovation and the amount of H.E.A.T. applied to student learning in the classroom.
Introduction to LoTi

3
LoTi for Professional PlanningDomains for Professional PlanningThe LoTi Digital Age Survey generated a profile for each participant in five domains: LoTi, H.E.A.T., Digital Age Best Practices, the ISTE Standards, and Other Technology & Instructional Frameworks.
DOMAIN 1: LoTi • Levels of Teaching Innovation
(Appendix A: LoTi Framework)• Current Instructional Practices
(Appendix B: CIP Framework)• Personal Computer Use (PCU)
(Appendix C: PCU Framework)
DOMAIN 2: H.E.A.T. (Appendix D: H.E.A.T. Framework) • Higher order thinking• Engaged learning• Authentic connections• Technology use
DOMAIN 3: Other Technology & Instructional Frameworks • Puentedura’s SAM-R Framework
(http://www.hippasus.com/)• Daggett’s Rigor & Relevance
(http://www.leadered.com/)• Webb’s Depth of Knowledge
(http://www.aps.edu/re/documents/resources/Webbs_DOK_Guide.pdf)
DOMAIN 4: Digital Age Best Practices (Appendix E: Digital Age Best Practices)• Student Questions• Student-Centered Learning• Differentiation (Vertical/Horizontal)• Real World Experiences• Networked Collaboration• Formative Assessments
DOMAIN 5: ISTE Standards (http://www.iste.org/standards/iste-standards)• ISTE Standards for Teachers• ISTE Standards for Administrators
4
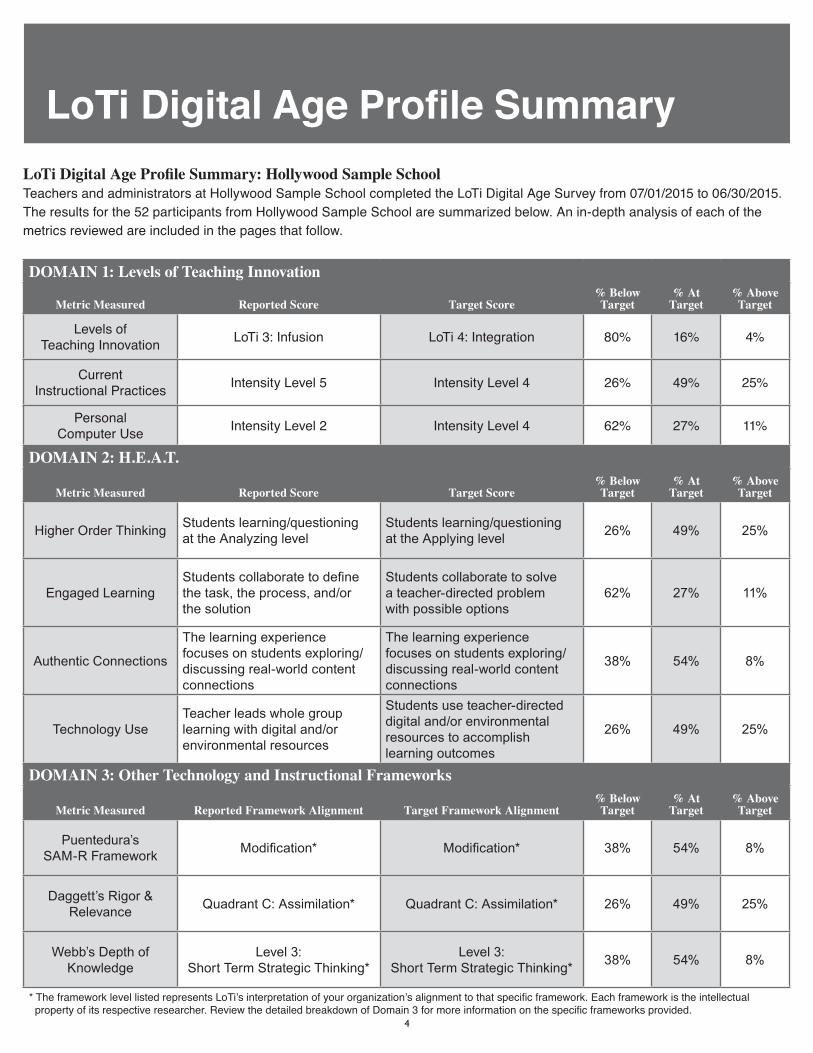
LoTi Digital Age Profile SummaryLoTi Digital Age Profile Summary: Hollywood Sample School Teachers and administrators at Hollywood Sample School completed the LoTi Digital Age Survey from 07/01/2015 to 06/30/2015. The results for the 52 participants from Hollywood Sample School are summarized below. An in-depth analysis of each of the metrics reviewed are included in the pages that follow.
DOMAIN 1: Levels of Teaching Innovation
Metric Measured Reported Score Target Score% Below Target
% At Target
% Above Target
Levels of Teaching Innovation LoTi 3: Infusion LoTi 4: Integration 80% 16% 4%
Current Instructional Practices Intensity Level 5 Intensity Level 4 26% 49% 25%
Personal Computer Use Intensity Level 2 Intensity Level 4 62% 27% 11%
DOMAIN 2: H.E.A.T.
Metric Measured Reported Score Target Score% Below Target
% At Target
% Above Target
Higher Order Thinking Students learning/questioning at the Analyzing level
Students learning/questioning at the Applying level 26% 49% 25%
Engaged LearningStudents collaborate to define the task, the process, and/or the solution
Students collaborate to solve a teacher-directed problem with possible options
62% 27% 11%
Authentic Connections
The learning experience focuses on students exploring/discussing real-world content connections
The learning experience focuses on students exploring/discussing real-world content connections
38% 54% 8%
Technology UseTeacher leads whole group learning with digital and/or environmental resources
Students use teacher-directed digital and/or environmental resources to accomplish learning outcomes
26% 49% 25%
DOMAIN 3: Other Technology and Instructional Frameworks
Metric Measured Reported Framework Alignment Target Framework Alignment% Below Target
% At Target
% Above Target
Puentedura’s SAM-R Framework Modification* Modification* 38% 54% 8%
Daggett’s Rigor & Relevance Quadrant C: Assimilation* Quadrant C: Assimilation* 26% 49% 25%
Webb’s Depth of Knowledge
Level 3: Short Term Strategic Thinking*
Level 3: Short Term Strategic Thinking* 38% 54% 8%
* The framework level listed represents LoTi’s interpretation of your organization’s alignment to that specific framework. Each framework is the intellectual property of its respective researcher. Review the detailed breakdown of Domain 3 for more information on the specific frameworks provided.
5
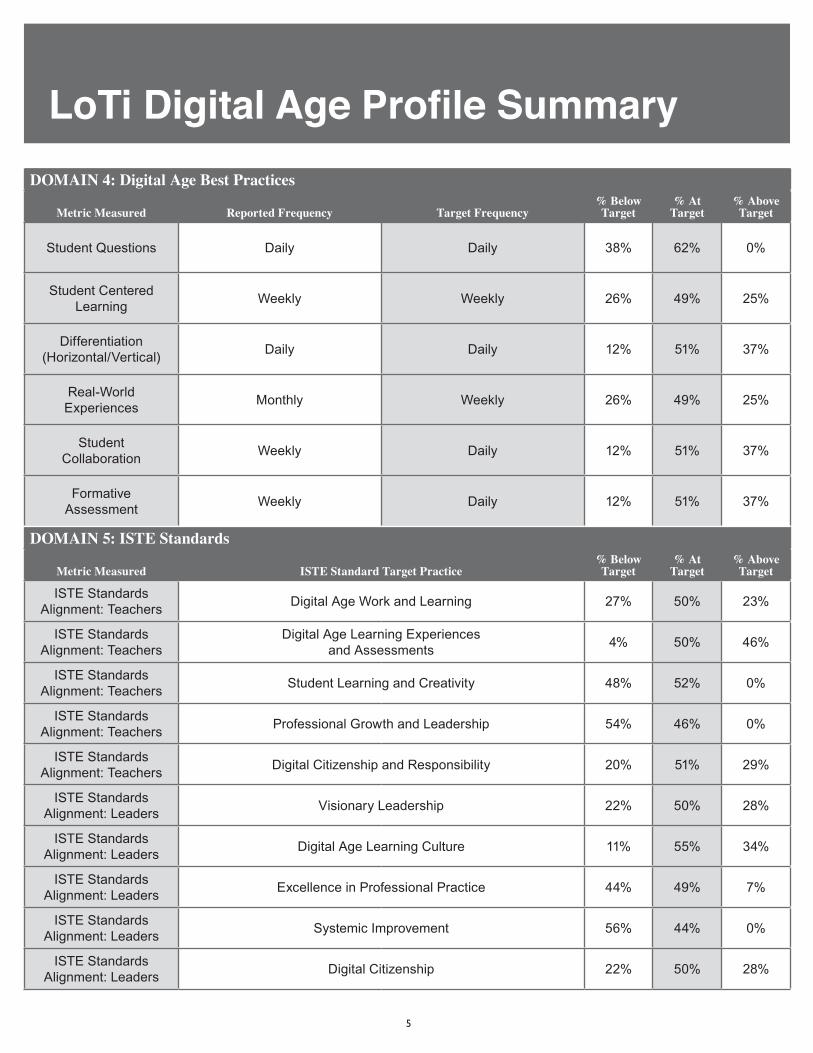
LoTi Digital Age Profile SummaryDOMAIN 4: Digital Age Best Practices
Metric Measured Reported Frequency Target Frequency% Below Target
% At Target
% Above Target
Student Questions Daily Daily 38% 62% 0%
Student Centered Learning Weekly Weekly 26% 49% 25%
Differentiation (Horizontal/Vertical) Daily Daily 12% 51% 37%
Real-World Experiences Monthly Weekly 26% 49% 25%
Student Collaboration Weekly Daily 12% 51% 37%
Formative Assessment Weekly Daily 12% 51% 37%
DOMAIN 5: ISTE Standards
Metric Measured ISTE Standard Target Practice% Below Target
% At Target
% Above Target
ISTE Standards Alignment: Teachers Digital Age Work and Learning 27% 50% 23%
ISTE Standards Alignment: Teachers
Digital Age Learning Experiences and Assessments 4% 50% 46%
ISTE Standards Alignment: Teachers Student Learning and Creativity 48% 52% 0%
ISTE Standards Alignment: Teachers Professional Growth and Leadership 54% 46% 0%
ISTE Standards Alignment: Teachers Digital Citizenship and Responsibility 20% 51% 29%
ISTE Standards Alignment: Leaders Visionary Leadership 22% 50% 28%
ISTE Standards Alignment: Leaders Digital Age Learning Culture 11% 55% 34%
ISTE Standards Alignment: Leaders Excellence in Professional Practice 44% 49% 7%
ISTE Standards Alignment: Leaders Systemic Improvement 56% 44% 0%
ISTE Standards Alignment: Leaders Digital Citizenship 22% 50% 28%

6
LoTi Score % of Staff # of Staff
LoTi 0Non-use 10% 5
LoTi 1Awareness 15% 8
LoTi 2Exploration 31% 16
LoTi 3Infusion 25% 13
LoTi 4aIntegration
(Mechanical)8% 4
LoTi 4bIntegration(Routine)
8% 4
LoTi 5Expansion 4% 2
LoTi 6Refinement 0% 0
Levels of Teaching Innovation (LoTi)
The Levels of Teaching Innovation (LoTi) profile approximates the degree to which each participant is either supporting or implementing the tenets of digital age teaching in a classroom setting.
Target LoTi Score
Mean LoTi Score
Mode LoTi Score
Median LoTi Score
# of Staff at or Above Target
% of Staff at or Above Target
LoTi 4 Integration
LoTi 2.97 Infusion
LoTi 2 Exploration
LoTi 3 Infusion 10 20.0%
At a mean LoTi score of 2.97 (Infusion), the instructional focus emphasizes student higher order thinking (e.g., Bloom Levels – analyzing, evaluating, creating; Webb’s Levels – short-term strategic thinking) and teacher-directed problems. Though specific learning activities may lack authenticity, the instructional emphasis is, nonetheless, placed on higher levels of cognitive processing and in-depth treatment of the content using a variety of thinking skill strategies (e.g., problem-solving, decision-making). The concept attainment, inductive thinking, and scientific inquiry models of teaching are the norm and guide the types of products generated by students. Digital and/or environmental resources are used by students and/or the teacher to execute teacher-directed tasks that emphasize higher levels of student cognitive processing relating to the content standards.
DOMAIN 1: Levels of Teaching Innovation

7
Current Instructional Practices (CIP)
At a mean intensity level CIP 4.05, the use of a teacher-directed approach is the norm, but there is an increased frequency of student-directed decision-making or input into the content, process, or product of instruction. In a student-directed approach, learning activities are diversified and based mostly on student questions, the teacher serves more as a co-learner or facilitator in the classroom, student projects are primarily student-directed, and the use of alternative assessment strategies including performance-based assessments, peer reviews, and student reflections are the norm. The use of limited horizontal and/or vertical differentiated strategies are present based on student interests, modality strengths, learning profile and/or readiness levels.
Although traditional learning activities and evaluation techniques are used, students are also encouraged to contribute to the assessment process when appropriate based on the content standards. The use of research-based best practices expands beyond basic classroom routines (e.g., providing opportunities for non-linguistic representation, offering advanced organizers).
Target CIP Score
Mean CIP Score
Mode CIP Score
Median CIP Score
# of Staff at or Above Target
% of Staff at or Above Target
CIP 4 Intensity Level
CIP 4.05 Intensity Level
CIP 4 Intensity Level
CIP 4 Intensity Level 35 67.3%
CIP Score % of Staff # of Staff
CIP 0 Intensity Level 0% 0
CIP 1 Intensity Level 8% 4
CIP 2 Intensity Level 13% 7
CIP 3 Intensity Level 12% 6
CIP 4 Intensity Level 21% 11
CIP 5 Intensity Level 13% 7
CIP 6 Intensity Level 20% 10
CIP 7 Intensity Level 13% 7
The Current Instructional Practices (CIP) profile assesses the participant’s current instructional practices relating to a subject-matter versus a learner-based based curriculum approach.
DOMAIN 1: Levels of Teaching Innovation

8
PCU Score % of Staff # of Staff
PCU 0 Intensity Level 8% 4
PCU 1 Intensity Level 4% 2
PCU 2 Intensity Level 8% 4
PCU 3 Intensity Level 4% 2
PCU 4 Intensity Level 9% 5
PCU 5 Intensity Level 17% 9
PCU 6 Intensity Level 20% 10
PCU 7 Intensity Level 31% 16
Personal Computer Use (PCU)
The Personal Computer Use (PCU) profile assesses the participant’s comfort and skill level with using computers and related technologies.
Target PCU Score
Mean PCU Score
Mode PCU Score
Median PCU Score
# of Staff at or Above Target
% of Staff at or Above Target
PCU 4 Intensity Level
PCU 5.35 Intensity Level
PCU 7 Intensity Level
PCU 5 Intensity Level 40 76.9%
A mean intensity level of PCU 5.35 indicates that the participant demonstrates a high fluency level with using digital tools and resources for student learning. Participants at Intensity Level 5 are commonly able to use an expanded range of existing and emerging digital age media and formats to modify existing lessons in support of their curriculum and instructional strategies.
Participants at this level advocate the safe, legal, and ethical uses of digital information and technologies and participate in local and global learning that advocate the positive impact of existing digital tools and resources on student success in the classroom.
DOMAIN 1: Levels of Teaching Innovation

9
Higher Order Thinking (H)
The mean Higher Order Thinking score for Hollywood Sample School participants was 3.25. At a mean Higher Order Thinking score of 3.25, students are routinely comprehending the meaning of new concepts, interpreting problems and instructions, and asking questions for clarification purposes.
The Higher Order Thinking rubric includes the following “look-fors”:1 = Students taking notes only; no questions asked2 = Student learning/questioning at Remembering level3 = Student learning/questioning at Understanding level4 = Student learning/questioning at Applying level5 = Student learning/questioning at Analyzing level6 = Student learning/questioning at Evaluating/Creating levels
Target H Score
Mean H Score
Mode H Score
Median H Score
# of Staff at or Above Target
% of Staff at or Above Target
Score 4 Score 3.25 Score 4 Score 4 20 38.5%
H Score % of Staff # of Staff
Score 1 10% 5
Score 2 15% 8
Score 3 37% 19
Score 4 21% 11
Score 5 13% 7
Score 6 4% 2
Higher order thinking references the level of student cognition generated by students from the learning experience based on Bloom’s Taxonomy.
DOMAIN 2: H.E.A.T.
10
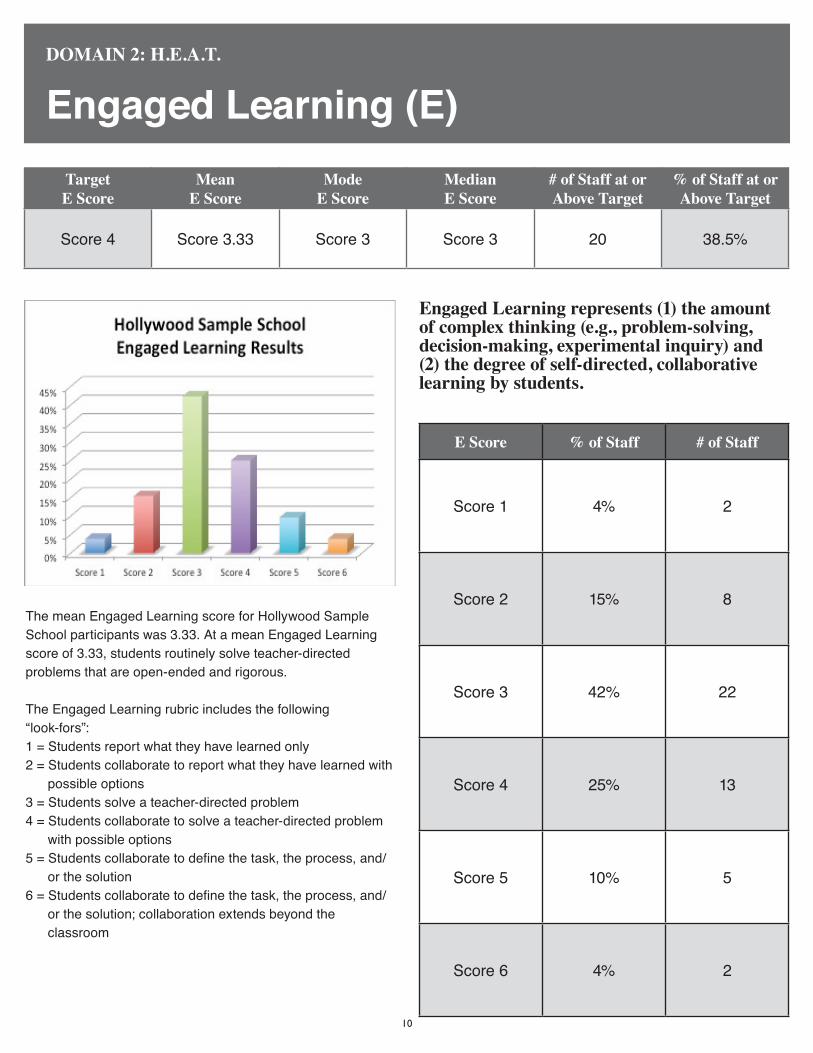
Engaged Learning (E)Target E Score
Mean E Score
Mode E Score
Median E Score
# of Staff at or Above Target
% of Staff at or Above Target
Score 4 Score 3.33 Score 3 Score 3 20 38.5%
The mean Engaged Learning score for Hollywood Sample School participants was 3.33. At a mean Engaged Learning score of 3.33, students routinely solve teacher-directed problems that are open-ended and rigorous.
The Engaged Learning rubric includes the following “look-fors”:1 = Students report what they have learned only2 = Students collaborate to report what they have learned with possible options3 = Students solve a teacher-directed problem4 = Students collaborate to solve a teacher-directed problem with possible options5 = Students collaborate to define the task, the process, and/ or the solution6 = Students collaborate to define the task, the process, and/ or the solution; collaboration extends beyond the classroom
E Score % of Staff # of Staff
Score 1 4% 2
Score 2 15% 8
Score 3 42% 22
Score 4 25% 13
Score 5 10% 5
Score 6 4% 2
Engaged Learning represents (1) the amount of complex thinking (e.g., problem-solving, decision-making, experimental inquiry) and (2) the degree of self-directed, collaborative learning by students.
DOMAIN 2: H.E.A.T.
11
Authentic Connections (A)Target
A ScoreMean
A ScoreMode
A ScoreMedian A Score
# of Staff at or Above Target
% of Staff at or Above Target
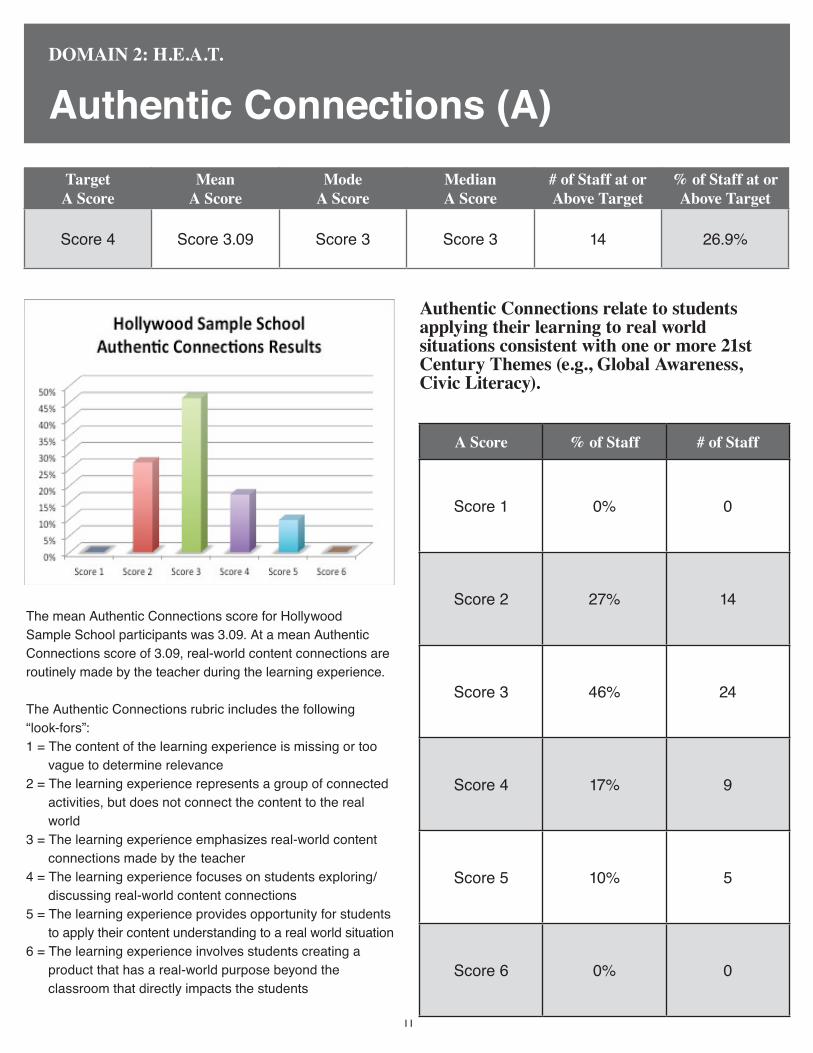
Score 4 Score 3.09 Score 3 Score 3 14 26.9%
DOMAIN 2: H.E.A.T.
The mean Authentic Connections score for Hollywood Sample School participants was 3.09. At a mean Authentic Connections score of 3.09, real-world content connections are routinely made by the teacher during the learning experience.
The Authentic Connections rubric includes the following “look-fors”:1 = The content of the learning experience is missing or too vague to determine relevance2 = The learning experience represents a group of connected activities, but does not connect the content to the real world3 = The learning experience emphasizes real-world content connections made by the teacher4 = The learning experience focuses on students exploring/ discussing real-world content connections5 = The learning experience provides opportunity for students to apply their content understanding to a real world situation6 = The learning experience involves students creating a product that has a real-world purpose beyond the classroom that directly impacts the students
A Score % of Staff # of Staff
Score 1 0% 0
Score 2 27% 14
Score 3 46% 24
Score 4 17% 9
Score 5 10% 5
Score 6 0% 0
Authentic Connections relate to students applying their learning to real world situations consistent with one or more 21st Century Themes (e.g., Global Awareness, Civic Literacy).
12
Technology Use (T)Target T Score
Mean T Score
Mode T Score
Median T Score
# of Staff at or Above Target
% of Staff at or Above Target
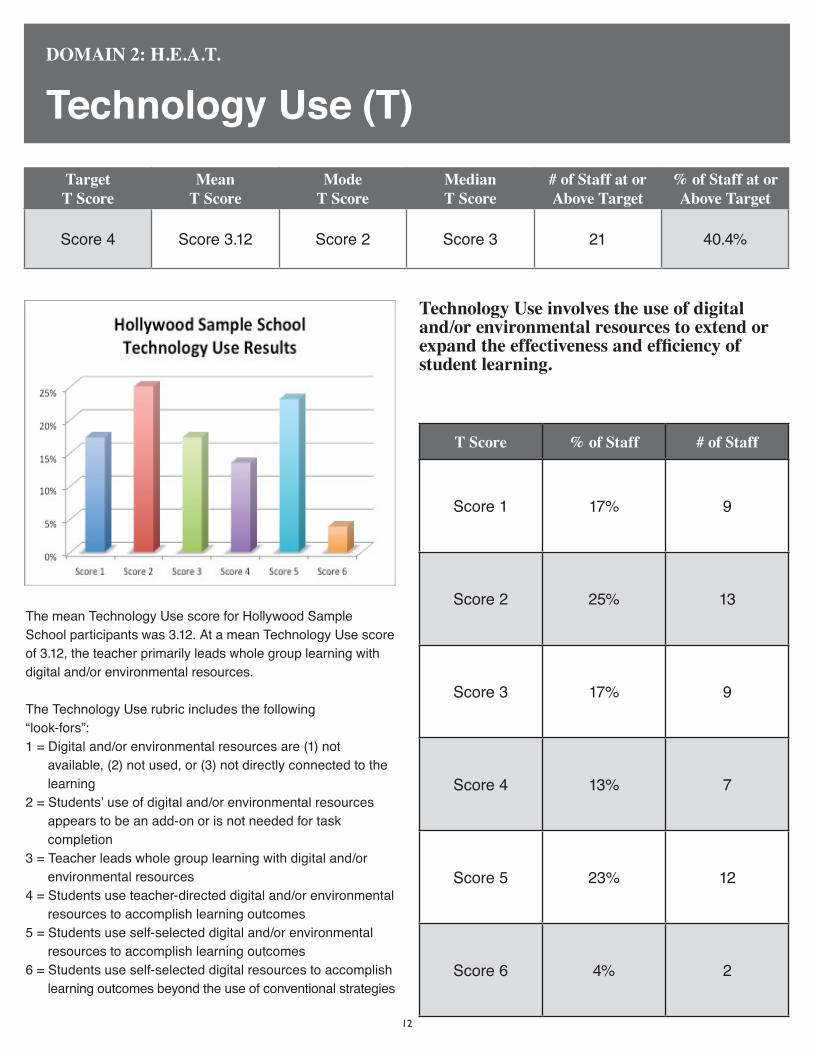
Score 4 Score 3.12 Score 2 Score 3 21 40.4%
The mean Technology Use score for Hollywood Sample School participants was 3.12. At a mean Technology Use score of 3.12, the teacher primarily leads whole group learning with digital and/or environmental resources.
The Technology Use rubric includes the following “look-fors”:1 = Digital and/or environmental resources are (1) not available, (2) not used, or (3) not directly connected to the learning2 = Students’ use of digital and/or environmental resources appears to be an add-on or is not needed for task completion3 = Teacher leads whole group learning with digital and/or environmental resources4 = Students use teacher-directed digital and/or environmental resources to accomplish learning outcomes 5 = Students use self-selected digital and/or environmental resources to accomplish learning outcomes6 = Students use self-selected digital resources to accomplish learning outcomes beyond the use of conventional strategies
T Score % of Staff # of Staff
Score 1 17% 9
Score 2 25% 13
Score 3 17% 9
Score 4 13% 7
Score 5 23% 12
Score 6 4% 2
Technology Use involves the use of digital and/or environmental resources to extend or expand the effectiveness and efficiency of student learning.
DOMAIN 2: H.E.A.T.
13
Alignment with Other FrameworksTarget
Framework AlignmentReported
Framework Alignment# of Staff at or Above Target
% of Staff at or Above Target
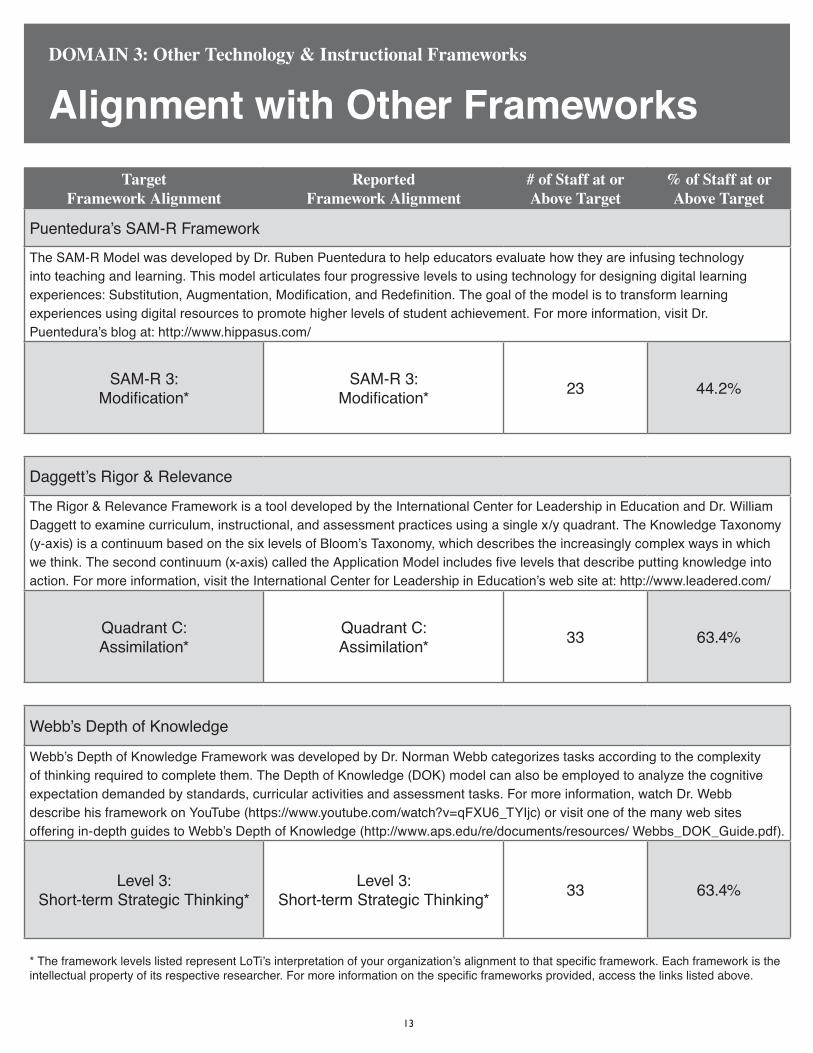
Puentedura’s SAM-R FrameworkThe SAM-R Model was developed by Dr. Ruben Puentedura to help educators evaluate how they are infusing technology into teaching and learning. This model articulates four progressive levels to using technology for designing digital learning experiences: Substitution, Augmentation, Modification, and Redefinition. The goal of the model is to transform learning experiences using digital resources to promote higher levels of student achievement. For more information, visit Dr. Puentedura’s blog at: http://www.hippasus.com/
SAM-R 3: Modification*
SAM-R 3: Modification* 23 44.2%
Daggett’s Rigor & Relevance
The Rigor & Relevance Framework is a tool developed by the International Center for Leadership in Education and Dr. William Daggett to examine curriculum, instructional, and assessment practices using a single x/y quadrant. The Knowledge Taxonomy (y-axis) is a continuum based on the six levels of Bloom’s Taxonomy, which describes the increasingly complex ways in which we think. The second continuum (x-axis) called the Application Model includes five levels that describe putting knowledge into action. For more information, visit the International Center for Leadership in Education’s web site at: http://www.leadered.com/
Quadrant C: Assimilation*
Quadrant C: Assimilation* 33 63.4%
Webb’s Depth of Knowledge
Webb’s Depth of Knowledge Framework was developed by Dr. Norman Webb categorizes tasks according to the complexity of thinking required to complete them. The Depth of Knowledge (DOK) model can also be employed to analyze the cognitive expectation demanded by standards, curricular activities and assessment tasks. For more information, watch Dr. Webb describe his framework on YouTube (https://www.youtube.com/watch?v=qFXU6_TYIjc) or visit one of the many web sites offering in-depth guides to Webb’s Depth of Knowledge (http://www.aps.edu/re/documents/resources/ Webbs_DOK_Guide.pdf).
Level 3: Short-term Strategic Thinking*
Level 3: Short-term Strategic Thinking* 33 63.4%
* The framework levels listed represent LoTi’s interpretation of your organization’s alignment to that specific framework. Each framework is the intellectual property of its respective researcher. For more information on the specific frameworks provided, access the links listed above.
DOMAIN 3: Other Technology & Instructional Frameworks
14
Student Questions (SQ)Target
SQ FrequencyReported
SQ Frequency# of Staff at or Above Target
% of Staff at or Above Target
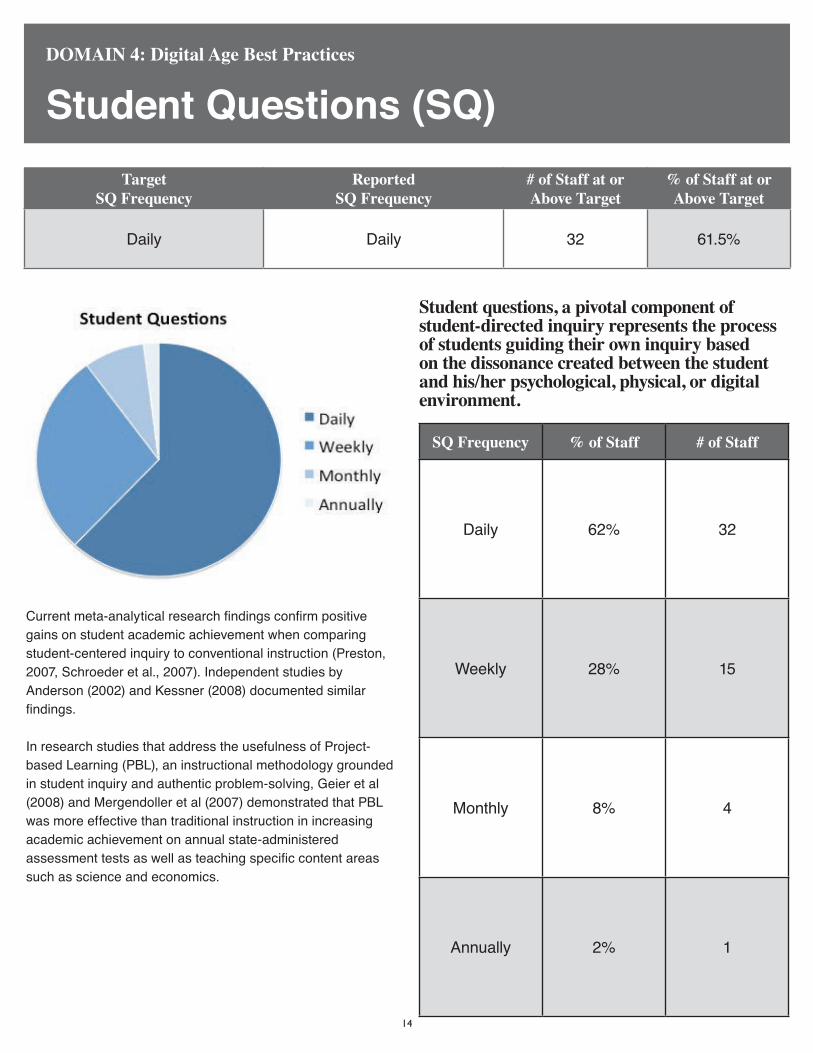
Daily Daily 32 61.5%
Current meta-analytical research findings confirm positive gains on student academic achievement when comparing student-centered inquiry to conventional instruction (Preston, 2007, Schroeder et al., 2007). Independent studies by Anderson (2002) and Kessner (2008) documented similar findings.
In research studies that address the usefulness of Project-based Learning (PBL), an instructional methodology grounded in student inquiry and authentic problem-solving, Geier et al (2008) and Mergendoller et al (2007) demonstrated that PBL was more effective than traditional instruction in increasing academic achievement on annual state-administered assessment tests as well as teaching specific content areas such as science and economics.
SQ Frequency % of Staff # of Staff
Daily 62% 32
Weekly 28% 15
Monthly 8% 4
Annually 2% 1
Student questions, a pivotal component of student-directed inquiry represents the process of students guiding their own inquiry based on the dissonance created between the student and his/her psychological, physical, or digital environment.
DOMAIN 4: Digital Age Best Practices

15
Student-Centered Learning (SCL)DOMAIN 4: Digital Age Best Practices
Target SCL Frequency
ReportedSCL Frequency
# of Staff at or Above Target
% of Staff at or Above Target
Weekly Weekly 47 90.3%
Research shows that providing students with choices in learning activities increased students’ achievement, engagement, perceived competence, and levels of aspiration (Cordova & Lepper, 1996; Westberg & Archambault, 2004). Current meta-analytical study findings confirm positive gains on student academic achievement when comparing student-centered inquiry to conventional instruction (Smith, 1996). In research studies that address the usefulness of Project-based Learning (PBL), Geier et al (2008) and Mergendoller et al (2007) demonstrated that PBL was more effective than traditional instruction in increasing achievement on state-administered standardized; tests as well as teaching specific content areas such as science and economics.
Meta-analyses conducted by Dochy et al (2003) and Walker and Leary (2009) found a positive effect from PBL on the skills of students. In a study on the effects of learner-centered classrooms, Salinas and Garr (2009) found that minorities in schools and classrooms with higher learner-centered orientations not only have test scores statistically equal of those from their white peers, but also that students in learner-centered environments have higher scores in the non-traditional measures, including tolerance and openness to diversity.
SCL Frequency % of Staff # of Staff
Daily 10% 5
Weekly 80% 42
Monthly 7% 4
Annually 2% 1
In a student-directed learning environment, students are vested with more options and input (e.g., subject-matter, learning methods, pacing) into the teaching/learning dynamic than its conventional instructional counterpart, teacher-centered instruction.
16
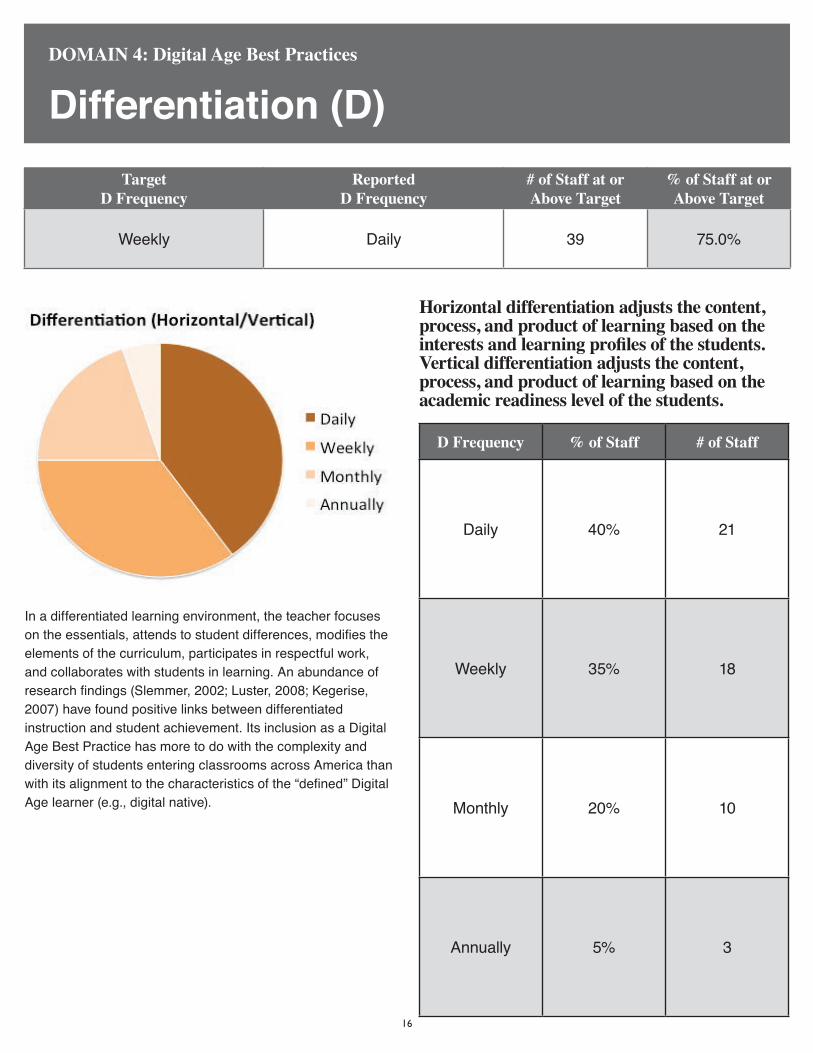
Differentiation (D)DOMAIN 4: Digital Age Best Practices
Target D Frequency
ReportedD Frequency
# of Staff at or Above Target
% of Staff at or Above Target
Weekly Daily 39 75.0%
In a differentiated learning environment, the teacher focuses on the essentials, attends to student differences, modifies the elements of the curriculum, participates in respectful work, and collaborates with students in learning. An abundance of research findings (Slemmer, 2002; Luster, 2008; Kegerise, 2007) have found positive links between differentiated instruction and student achievement. Its inclusion as a Digital Age Best Practice has more to do with the complexity and diversity of students entering classrooms across America than with its alignment to the characteristics of the “defined” Digital Age learner (e.g., digital native).
D Frequency % of Staff # of Staff
Daily 40% 21
Weekly 35% 18
Monthly 20% 10
Annually 5% 3
Horizontal differentiation adjusts the content, process, and product of learning based on the interests and learning profiles of the students. Vertical differentiation adjusts the content, process, and product of learning based on the academic readiness level of the students.
17
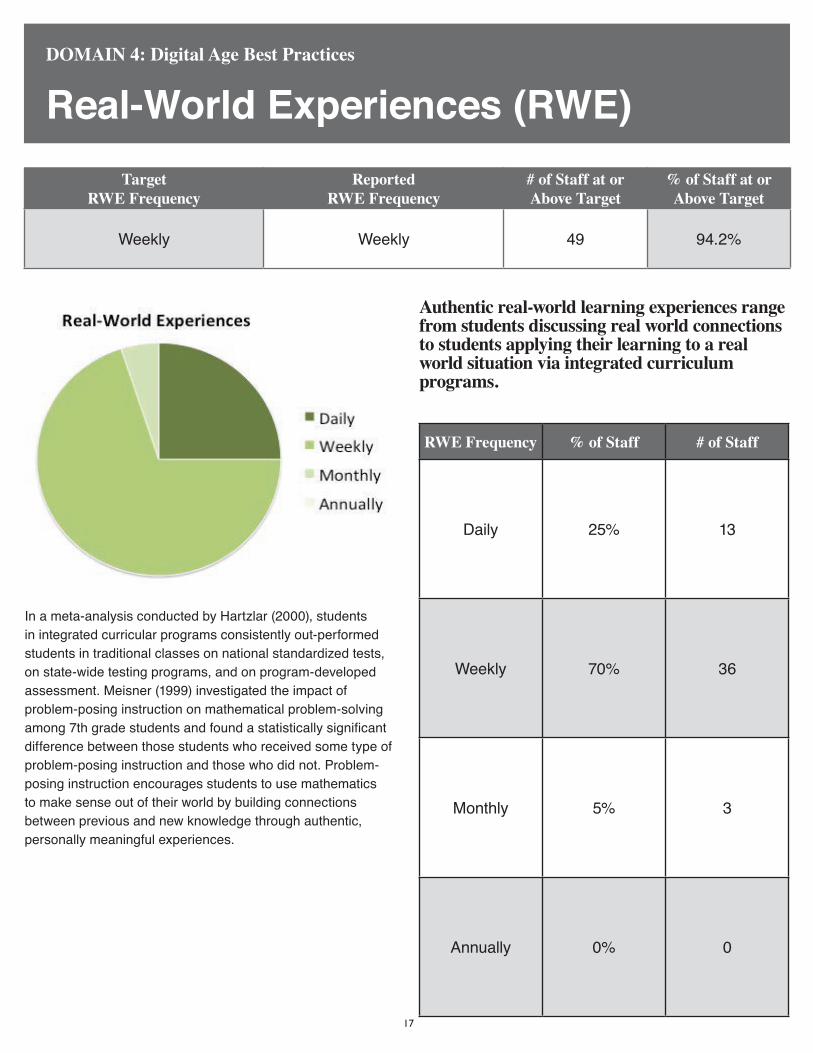
Real-World Experiences (RWE)DOMAIN 4: Digital Age Best Practices
Target RWE Frequency
ReportedRWE Frequency
# of Staff at or Above Target
% of Staff at or Above Target
Weekly Weekly 49 94.2%
In a meta-analysis conducted by Hartzlar (2000), students in integrated curricular programs consistently out-performed students in traditional classes on national standardized tests, on state-wide testing programs, and on program-developed assessment. Meisner (1999) investigated the impact of problem-posing instruction on mathematical problem-solving among 7th grade students and found a statistically significant difference between those students who received some type of problem-posing instruction and those who did not. Problem-posing instruction encourages students to use mathematics to make sense out of their world by building connections between previous and new knowledge through authentic, personally meaningful experiences.
RWE Frequency % of Staff # of Staff
Daily 25% 13
Weekly 70% 36
Monthly 5% 3
Annually 0% 0
Authentic real-world learning experiences range from students discussing real world connections to students applying their learning to a real world situation via integrated curriculum programs.
18
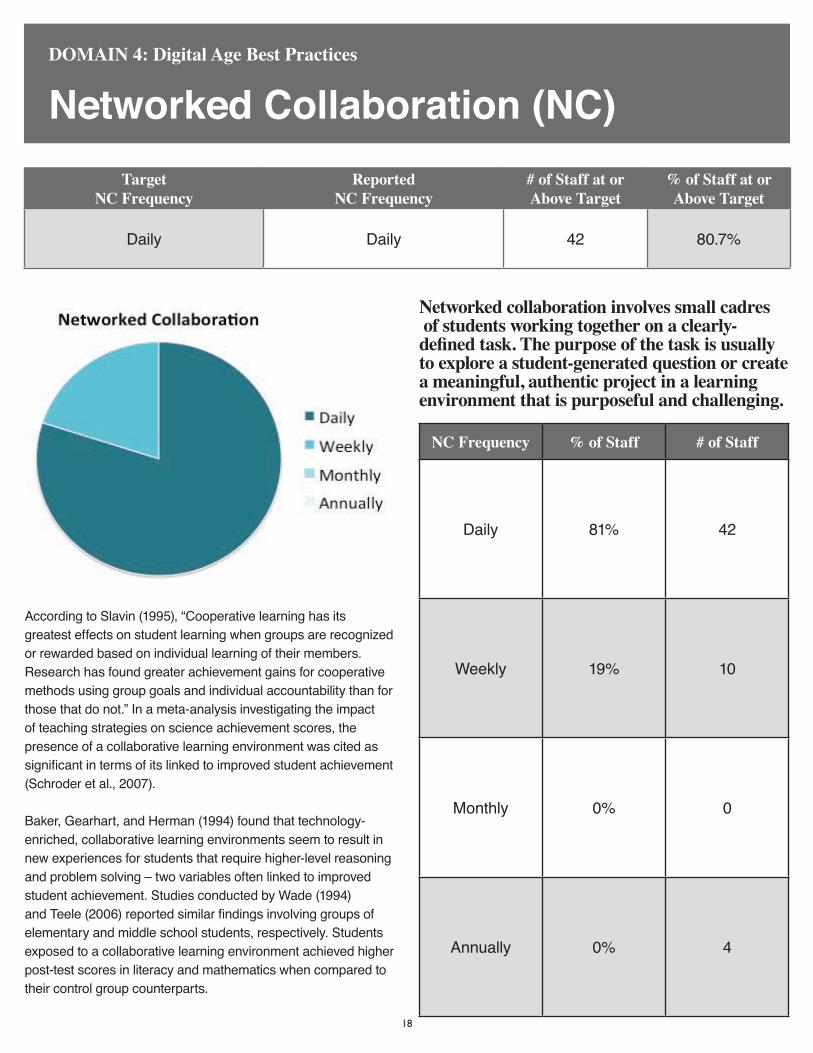
Networked Collaboration (NC)DOMAIN 4: Digital Age Best Practices
Target NC Frequency
ReportedNC Frequency
# of Staff at or Above Target
% of Staff at or Above Target
Daily Daily 42 80.7%
According to Slavin (1995), “Cooperative learning has its greatest effects on student learning when groups are recognized or rewarded based on individual learning of their members. Research has found greater achievement gains for cooperative methods using group goals and individual accountability than for those that do not.” In a meta-analysis investigating the impact of teaching strategies on science achievement scores, the presence of a collaborative learning environment was cited as significant in terms of its linked to improved student achievement (Schroder et al., 2007).
Baker, Gearhart, and Herman (1994) found that technology-enriched, collaborative learning environments seem to result in new experiences for students that require higher-level reasoning and problem solving – two variables often linked to improved student achievement. Studies conducted by Wade (1994) and Teele (2006) reported similar findings involving groups of elementary and middle school students, respectively. Students exposed to a collaborative learning environment achieved higher post-test scores in literacy and mathematics when compared to their control group counterparts.
NC Frequency % of Staff # of Staff
Daily 81% 42
Weekly 19% 10
Monthly 0% 0
Annually 0% 4
Networked collaboration involves small cadres of students working together on a clearly-defined task. The purpose of the task is usually to explore a student-generated question or create a meaningful, authentic project in a learning environment that is purposeful and challenging.

19
Formative Assessment (FA)DOMAIN 4: Digital Age Best Practices
Target FA Frequency
ReportedFA Frequency
# of Staff at or Above Target
% of Staff at or Above Target
Daily Daily 34 65.3%
Research supports the use of formative assessments as a viable strategy to improve student achievement (Black and Wiliam, 1998; Fuch and Fuch, 1986; Wininger, 2005). According to Black and Wiliam (1998), “such assessment becomes formative when the evidence is actually used to adapt the teaching to meet needs.” Formal assessments provide more structure and greater reliability (e.g., common assessments, benchmark tests, performance tasks); informal assessments require less structure, but are more frequent, transparent, and, in many cases, student-centered (e.g., teacher observations, minute papers, peer reviews, questions and answers, self-reflection, student journals, pair-shares).
The inclusion of formative assessments as a Digital Age Best Practice is based on the reflective nature of the formative assessment process to promote personal progress. Shepard (2000) links formative or classroom assessment with the constructivist movement, which suggests that learning is an active process, building on previous knowledge, experience, skills, and interests.
FA Frequency % of Staff # of Staff
Daily 65% 34
Weekly 25% 13
Monthly 6% 3
Annually 4% 2
Formative assessments refer to both informal and formal activities used by teachers and students to provide information about individual and group academic progress for the purpose of adjusting or modifying instruction.

20
ISTE Standards Alignment: TeachersDOMAIN 5: ISTE Standards
ISTE Standards for Teachers Frequency # of Staff Demonstrating Proficiency
% of Staff Demonstrating Proficiency
Digital Age Work and Learning 38 73.0%
Digital Age Learning Experiences and Assessments 50 96.1%
Student Learning and Creativity 27 51.9%
Professional Growth and Leadership 24 46.1%
Digital Citizenship and Responsibility 41 78.8%
For more detailed information about the ISTE Standards for Teachers and Administrators, visit the ISTE Standards website at: http://www.iste.org/standards/iste-standards
ISTE Standards for Teachers:Percentage Breakdown

21
ISTE Standards Alignment: LeadersDOMAIN 5: ISTE Standards
ISTE Standards for Administrators Frequency # of Staff Demonstrating Proficiency
% of Staff Demonstrating Proficiency
Visionary Leadership 7 77.7%
Digital Age Learning Culture 8 88.8%
Excellence in Professional Practice 5 55.5%
Systemic Improvement 4 44.4%
Digital Citizenship 7 77.7%
For more detailed information about the ISTE Standards for Teachers and Administrators, visit the ISTE Standards website at: http://www.iste.org/standards/iste-standards
ISTE Standards for Leaders:Percentage Breakdown
Visionary Leadership
Digital Age Learning Culture
Excellence in Professional Practice
Systemic Improvement
Digital Citizenship
22
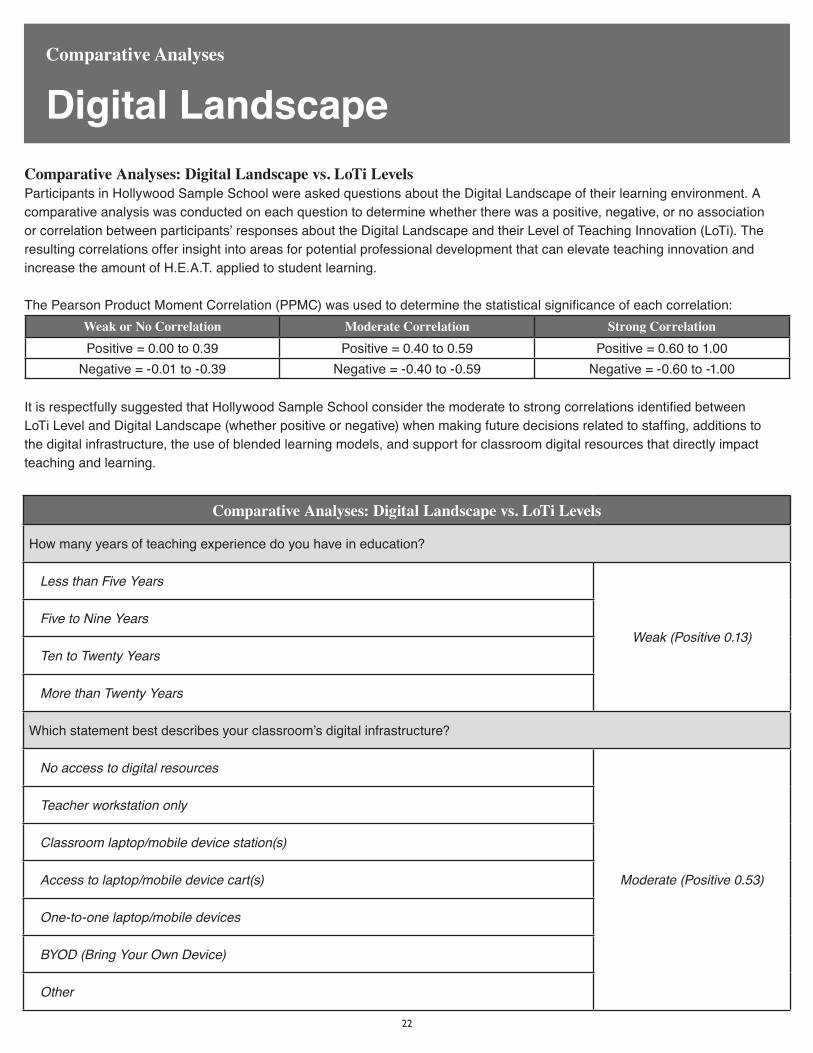
Comparative Analyses: Digital Landscape vs. LoTi Levels
How many years of teaching experience do you have in education?
Less than Five Years
Weak (Positive 0.13) Five to Nine Years
Ten to Twenty Years
More than Twenty Years
Which statement best describes your classroom’s digital infrastructure?
No access to digital resources
Moderate (Positive 0.53)
Teacher workstation only
Classroom laptop/mobile device station(s)
Access to laptop/mobile device cart(s)
One-to-one laptop/mobile devices
BYOD (Bring Your Own Device)
Other
Comparative Analyses: Digital Landscape vs. LoTi LevelsParticipants in Hollywood Sample School were asked questions about the Digital Landscape of their learning environment. A comparative analysis was conducted on each question to determine whether there was a positive, negative, or no association or correlation between participants’ responses about the Digital Landscape and their Level of Teaching Innovation (LoTi). The resulting correlations offer insight into areas for potential professional development that can elevate teaching innovation and increase the amount of H.E.A.T. applied to student learning.
The Pearson Product Moment Correlation (PPMC) was used to determine the statistical significance of each correlation:Weak or No Correlation Moderate Correlation Strong CorrelationPositive = 0.00 to 0.39 Positive = 0.40 to 0.59 Positive = 0.60 to 1.00
Negative = -0.01 to -0.39 Negative = -0.40 to -0.59 Negative = -0.60 to -1.00 It is respectfully suggested that Hollywood Sample School consider the moderate to strong correlations identified between LoTi Level and Digital Landscape (whether positive or negative) when making future decisions related to staffing, additions to the digital infrastructure, the use of blended learning models, and support for classroom digital resources that directly impact teaching and learning.
Digital LandscapeComparative Analyses

23
Digital LandscapeComparative Analyses
Comparative Analyses: Digital Landscape vs. LoTi LevelsWhich model best describes your approach to blended or hybrid learning in the classroom? Blended learning models include Flipped Classroom, Rotation, Online Lab, Flex, Self-Blend, Supplemental, Face-to-Face Driver, and Online Driver.
No Blended Learning Model Moderate (Positive 0.55)
Blended Learning using a Flipped Classroom Model Strong (Positive 0.72)
Blended Learning using a Rotation Model Moderate (Positive 0.44)
Blended Learning using an Online Lab Model Moderate (Positive 0.47)
Blended Learning using a Flex Model Moderate (Positive 0.52)
Blended Learning using a Self-Blend Model Weak (Positive 0.38)
Blended Learning using a Supplemental Model Strong (Positive 0.63)
Blended Learning using a Face-to-Face Driver Model Weak (Positive 0.18)
Blended Learning using an Online Driver Model Strong (Positive 0.83)
From which source do you most frequently seek guidance, information, inspiration, and/or direction relating to your classroom use of digital resources in the classroom?
Students Strong (Positive 0.66)
Building Administrators Weak (Negative -0.23)
School/District Specialists (e.g., Media/Technology Specialist, Instructional Specialist) Moderate (Positive 0.47)
Classroom Teachers (e.g., Other Colleagues, Mentors, Peer Coaches) Weak (Negative -0.38)
Specific websites (e.g., Teaching Channel, YouTube, Kahn Academy, Online Subscriptions) Strong (Positive 0.71)
Other (e.g., College Professor, Conference Presenter, Business/Community Member, Vendor) Weak (Positive 0.31)
What do you perceive as the greatest obstacle to advancing your use of digital resources in your instructional setting?
None Strong (Positive 0.69)
Lack of Access to Digital Resources Moderate (Negative -0.55)
Time to Learn, Practice, and Plan Weak (Negative -0.09)
Required Instructional Priorities (e.g., Statewide Testing, New Textbook Adoptions) Weak (Negative -0.21)
Lack of Staff Development Opportunities Strong (Negative -0.84)
District-controlled Curriculum Weak (Negative -0.27)
Other Weak (Negative -0.33)

24
Comparative Analyses: Teacher Perceptions vs. LoTi Levels
I believe the use of digital resources in my classroom can positively impact student learning and achievement.
Strongly Agree
Moderate (Positive 0.57)
Agree
No opinion
Disagree
Strongly Disagree
I have the necessary capabilities and skills to integrate digital resources successfully into my classroom instruction.
Strongly Agree
Moderate (Positive 0.38)
Agree
No opinion
Disagree
Strongly Disagree
Teacher PerceptionsComparative Analyses: Teacher Perceptions vs. LoTi LevelsParticipants in Hollywood Sample School were asked questions about the prevalent Teacher Perceptions in their learning environment. A comparative analysis was conducted on each question to determine whether there was a positive, negative, or no association or correlation between participants’ responses about Teacher Perceptions and their Level of Teaching Innovation (LoTi). The resulting correlations offer insight into areas for potential professional development that can elevate teaching innovation and increase the amount of H.E.A.T. applied to student learning.
The Pearson Product Moment Correlation (PPMC) was used to determine the statistical significance of each correlation:Weak or No Correlation Moderate Correlation Strong CorrelationPositive = 0.00 to 0.39 Positive = 0.40 to 0.59 Positive = 0.60 to 1.00
Negative = -0.01 to -0.39 Negative = -0.40 to -0.59 Negative = -0.60 to -1.00 It is respectfully suggested that Hollywood Sample School consider the moderate to strong correlations identified between LoTi Level and Teacher Perceptions (whether positive or negative) when making future decisions related to improving student achievement, skill-based technology training, support for classroom digital resources, and the feedback cycle for the integration of digital resources into the learning environment.
Comparative Analyses

25
Teacher PerceptionsComparative Analyses: Teacher Perceptions vs. LoTi Levels
I know where (e.g., Teaching Channel, YouTube, Kahn Academy) or whom (e.g., campus technology specialist, academic coach, grade level teacher, curriculum coordinator) to go to when I need support for using digital resources in my classroom.
Strongly Agree
Strong (Positive 0.87)
Agree
No opinion
Disagree
Strongly Disagree
I receive useful feedback on the integration of digital resources into my instruction from my administrator(s).
Strongly Agree
Moderate (Negative -0.51)
Agree
No opinion
Disagree
Strongly Disagree
I am able to maximize student learning best when I complement my whole group approach with learning stations/centers, cooperative grouping, and/or individualized instruction.
Strongly Agree
Strong (Positive 0.68)
Agree
No opinion
Disagree
Strongly Disagree
Comparative Analyses

26
Comparative Analyses: School Climate vs. LoTi Levels
I am treated as a respected educational professional on my campus.
Strongly Agree
Weak (Positive 0.37)
Agree
No opinion
Disagree
Strongly Disagree
I engage in a two-way cycle of communication and feedback with my school administrators.
Strongly Agree
Moderate (Positive 0.46)
Agree
No opinion
Disagree
Strongly Disagree
School ClimateComparative Analyses: School Climate vs. LoTi LevelsParticipants in Hollywood Sample School were asked questions about the prevalent School Climate in their learning environment. A comparative analysis was conducted on each question to determine whether there was a positive, negative, or no association or correlation between participants’ responses about School Climate and their Level of Teaching Innovation (LoTi). The resulting correlations offer insight into areas for potential professional development that can elevate teaching innovation and increase the amount of H.E.A.T. applied to student learning.
The Pearson Product Moment Correlation (PPMC) was used to determine the statistical significance of each correlation:Weak or No Correlation Moderate Correlation Strong CorrelationPositive = 0.00 to 0.39 Positive = 0.40 to 0.59 Positive = 0.60 to 1.00
Negative = -0.01 to -0.39 Negative = -0.40 to -0.59 Negative = -0.60 to -1.00 It is respectfully suggested that Hollywood Sample School consider the moderate to strong correlations identified between LoTi Level and School Climate (whether positive or negative) when making future decisions related to professional practices, the teacher/administrator feedback cycle, teacher voice, and support for the shared vision of digital resource use in the learning environment.
Comparative Analyses

27
School ClimateComparative Analyses: School Climate vs. LoTi Levels
I feel that I am listened to, represented, and feel I have a voice on campus.
Strongly Agree
Weak (Positive 0.16)
Agree
No opinion
Disagree
Strongly Disagree
I understand and support the shared vision for our school’s use of digital resources along with other key stakeholders.
Strongly Agree
Strong (Positive 0.76)
Agree
No opinion
Disagree
Strongly Disagree
I am able to maximize student learning best when I complement my whole group approach with learning stations/centers, cooperative grouping, and/or individualized instruction.
Strongly Agree
Strong (Positive 0.68)
Agree
No opinion
Disagree
Strongly Disagree
Comparative Analyses
28
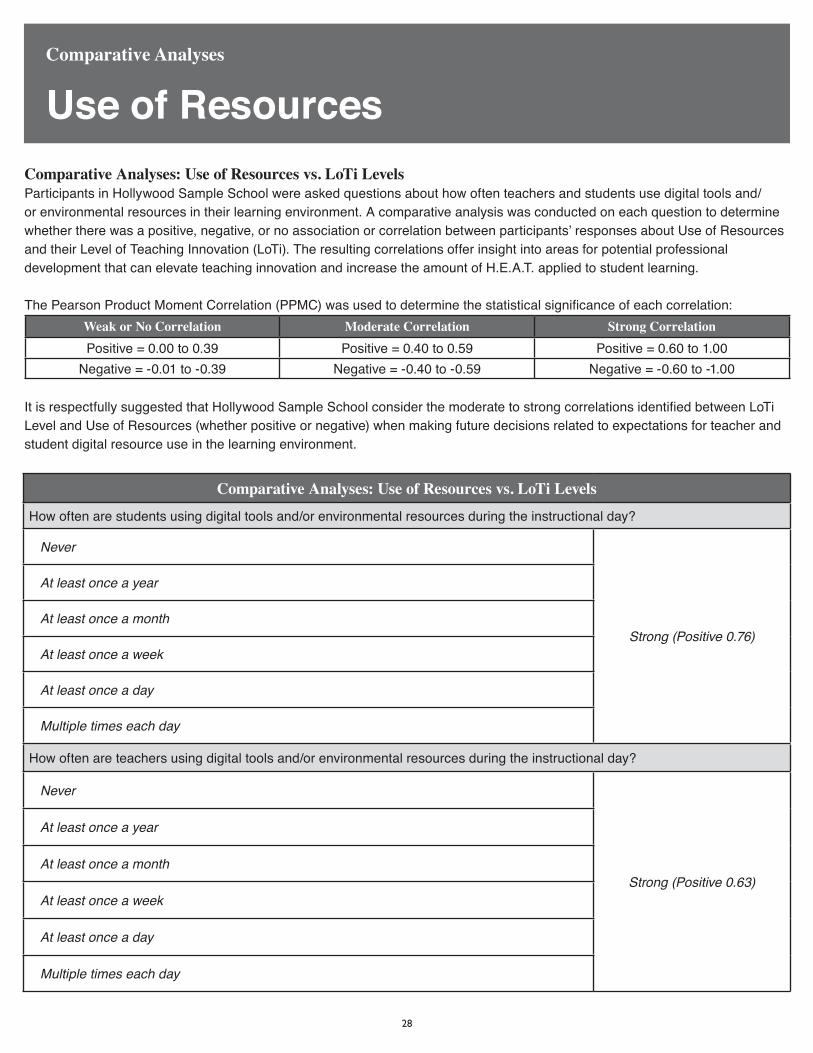
Comparative Analyses: Use of Resources vs. LoTi LevelsHow often are students using digital tools and/or environmental resources during the instructional day?
Never
Strong (Positive 0.76)
At least once a year
At least once a month
At least once a week
At least once a day
Multiple times each day
How often are teachers using digital tools and/or environmental resources during the instructional day?
Never
Strong (Positive 0.63)
At least once a year
At least once a month
At least once a week
At least once a day
Multiple times each day
Use of ResourcesComparative Analyses: Use of Resources vs. LoTi LevelsParticipants in Hollywood Sample School were asked questions about how often teachers and students use digital tools and/or environmental resources in their learning environment. A comparative analysis was conducted on each question to determine whether there was a positive, negative, or no association or correlation between participants’ responses about Use of Resources and their Level of Teaching Innovation (LoTi). The resulting correlations offer insight into areas for potential professional development that can elevate teaching innovation and increase the amount of H.E.A.T. applied to student learning.
The Pearson Product Moment Correlation (PPMC) was used to determine the statistical significance of each correlation:Weak or No Correlation Moderate Correlation Strong CorrelationPositive = 0.00 to 0.39 Positive = 0.40 to 0.59 Positive = 0.60 to 1.00
Negative = -0.01 to -0.39 Negative = -0.40 to -0.59 Negative = -0.60 to -1.00 It is respectfully suggested that Hollywood Sample School consider the moderate to strong correlations identified between LoTi Level and Use of Resources (whether positive or negative) when making future decisions related to expectations for teacher and student digital resource use in the learning environment.
Comparative Analyses
29
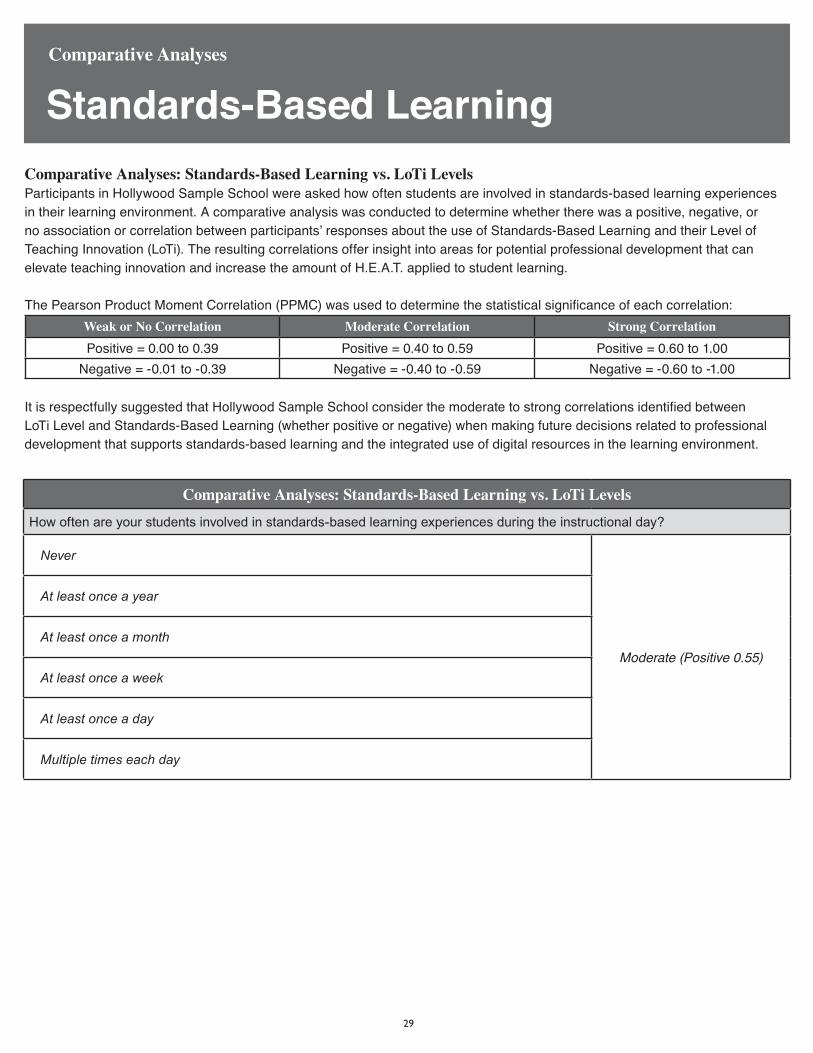
Comparative Analyses: Standards-Based Learning vs. LoTi LevelsHow often are your students involved in standards-based learning experiences during the instructional day?
Never
Moderate (Positive 0.55)
At least once a year
At least once a month
At least once a week
At least once a day
Multiple times each day
Standards-Based LearningComparative Analyses: Standards-Based Learning vs. LoTi LevelsParticipants in Hollywood Sample School were asked how often students are involved in standards-based learning experiences in their learning environment. A comparative analysis was conducted to determine whether there was a positive, negative, or no association or correlation between participants’ responses about the use of Standards-Based Learning and their Level of Teaching Innovation (LoTi). The resulting correlations offer insight into areas for potential professional development that can elevate teaching innovation and increase the amount of H.E.A.T. applied to student learning.
The Pearson Product Moment Correlation (PPMC) was used to determine the statistical significance of each correlation:Weak or No Correlation Moderate Correlation Strong CorrelationPositive = 0.00 to 0.39 Positive = 0.40 to 0.59 Positive = 0.60 to 1.00
Negative = -0.01 to -0.39 Negative = -0.40 to -0.59 Negative = -0.60 to -1.00 It is respectfully suggested that Hollywood Sample School consider the moderate to strong correlations identified between LoTi Level and Standards-Based Learning (whether positive or negative) when making future decisions related to professional development that supports standards-based learning and the integrated use of digital resources in the learning environment.
Comparative Analyses
30
Hollywood Sample School Recommended Goals Based on the findings from the LoTi Digital Age Survey, it is recommended that the Hollywood Sample School’s technology leadership team consider the goal statements below. These recommendations consider the reported Level of TeachingInnovation (LoTi), Current Instructional Practices (CIP), and Personal Computer Use(PCU) on campus.
S.M.A.R.T. Goals:• Move 25% of the Hollywood Sample School staff member(s) positioned at a LoTi
(Level of Teaching Innovation) Level 3: Infusion to a LoTi Level 4a: Integration - Mechanical during the current school year. This recommendation is consistent with these staff members’ current scores for Current Instructional Practices (CIP) and Personal Computer Use (PCU).
• Move 32% of the Hollywood Sample School staff member(s) positioned at a LoTi (Level of Teaching Innovation) Level 2: Exploration to a LoTi Level 3: Infusion during the current school year. This recommendation is consistent with these staff members’ current scores for Current Instructional Practices (CIP) and Personal Computer Use (PCU).
• Move 15% of the Hollywood Sample School staff member(s) positioned at a LoTi (Level of Teaching Innovation) Level 1: Awareness to a LoTi Level 2: Exploration during the current school year. This recommendation is consistent with these staff members’ current scores for Current Instructional Practices (CIP) and Personal Computer Use (PCU).
Recommended Goals
31
Recommended InterventionsDigital Age PlanningHollywood Sample School Recommended Interventions
Based on the findings from the LoTi Digital Age Survey, it is recommended that the Hollywood Sample School’s technology leadership team consider implementing one or more of the targeted interventions below. These recommendations consider the reported frequency of staff members implementing H.E.A.T. strategies, Digital Age Best Practices, other Technology Frameworks, and the ISTE Standards on campus. Recommended interventions have also been included for factors related to the Digital Landscape, Teacher Perceptions, School Climate, Use of Resources, and Standards-Based Learning that yielded strong correlations with the Level of Teaching Innovation (LoTi) on campus.
H.E.A.T.:• Higher Order Thinking
Organize targeted professional development opportunities that address Higher Order Thinking based on the H.E.A.T. Framework. According to the survey results, 65.4% of the respondents were below the Target Level 4 (Students learning/questioning at the Applying level). Sample interventions include content that addresses questioning strategies, Bloom’s Taxonomy reviews, Webb’s Depth of Knowledge reviews, and problem-solving/critical thinking. Visit the website article, HOTS for Teachers: 25 Top Resources For Higher Order Thinking Skills, for information on strategies to promote high level thinking processes in the classroom.
• Authentic Connections Organize targeted professional development opportunities that address Authentic Connections based on the H.E.A.T. Framework. According to the survey results, 73.1% of the respondents were below the Target Level 4 (The learning experience focuses on students exploring/discussing real-world content connections). Sample interventions include content that addresses 21st Century Themes, Project-based Learning (PBL), Challenge-based Learning (CBL), and Renzulli’s Enrichment Triad. Visit the website, Framework for 21st Century Learning, for information on the attributes of 21st Century learning.
Digital Age Best Practices:• Student Questions
Organize targeted professional development opportunities that address Student Questions based on the Digital Age Best Practices. According to the survey results, 38.5% of the respondents were below the Target Level (Promoting Student Questions Daily). Sample interventions include content that addresses questioning strategies such as Quescussions, Socratic Seminars, Bloom’s Taxonomy, and Question Formation Technique (QFT). Visit the web article, Five Ways to Help Your Students Become Better Questioners, for information on ways of promoting student questioning in the classroom.
Other Frameworks:• Puentedura’sSAM-RFramework
Organize targeted professional development opportunities that address the SAM-R Levels where the Reported Target Level was below 50%. According to the survey results, 55.8% of the respondents were below the Target Level (SAM-R 3: Modification). Visit Dr. Puentedura’s blog, Hippasus, for information on strategies to increase the SAM-R Level relating to digital age teaching and learning.
ISTE Standards:• ISTE Standards for Teachers
Organize targeted professional development opportunities that address any ISTE Standards for Teachers where the Reported Target Levels were below 50%. According to the survey results, respondents were below the Target Levels in the following area(s): Professional Growth and Leadership. Visit the website, ISTE Standards for Teachers, for information on strategies to elevate digital age teaching and learning.
32
Recommended Interventions• ISTEStandardsforAdministrators
Organize targeted professional development opportunities that address any of the ISTE Standards for Administrators where the Reported Target Levels were below 50%. According to the survey results, respondents were below the Target Levels in the following area(s): Systemic Improvement. Visit the website, ISTE Standards for Administrators, for information on strategies to elevate digital age leadership.
Digital Landscape:• ApproachtoBlendedLearning:FlippedClassroomModel
Consider professional development opportunities that address the reported strong positive correlation (0.72) between approaching blended learning with the Flipped Classroom Model and LoTi Level. If implementing blended learning using a Flipped Classroom Model is associated with higher levels of teaching innovation, then follow-up interventions should address ways of promoting the flipped classroom model in non-flipped classrooms. Potential topics for PLC sessions, faculty meetings, and/or teacher inservices might involve peer mentoring, accessing flipped classroom videos and articles from the ISTE and Edutopia websites, student-centered approaches to teaching, Project and Problem-based Learning, and/or classroom management strategies.
• PrimarySourceforGuidanceonDigitalResources:Students Consider professional development opportunities that address the reported strong positive correlation (0.66) between Using Students as the Primary Source for Guidance/Resources and LoTi Level. If using students as the primary source for guidance, information, inspiration, and/or direction relating to instructional computing is associated with higher levels of teaching innovation, then follow-up interventions should address ways of promoting greater student/teacher interactions. Potential topics for PLC sessions, faculty meetings, and/or teacher inservices might involve inviting select students to attend PLC meetings or help to facilitate “Lunch and Learn” sessions devoted to instructional computing; encouraging students to build simple online classes for the teaching staff devoted to a specific skill, teaching strategy, or web site; and/or allowing students to serve as “peer” mentors in the classroom.
Teacher Perceptions:• SupportforUsingDigitalResources
Consider professional development opportunities that address the reported strong positive correlation (0.87) between Teacher Perceptions about Support for Using Digital Resources and LoTi Level. If teachers’ positive perception about their ability to find assistance relating to their use of digital tools and resources in the classroom is associated with higher levels of teaching innovation, then strategies should be considered that focus on promoting a campus technology help desk, creating a school version of a “Geek Squad” to assist staff members in their classrooms with technical issues, and/or creating a blog that contains updated websites for effective technology use (e.g., YouTube, Teaching Channel) for all staff members.
School Climate:• SharedVisionforDigitalLearning
Consider professional development opportunities that address the reported strong positive correlation (0.76) between Shared Vision for Digital Age Learning and LoTi Level. If teachers’ positive perception about their campus’ vision for using digital resources is associated with higher levels of teaching innovation, then strategies should be considered that focus on ensuring that all stakeholders share this collective vision. Visit Jesse Lyn Stoner’s blog post, How to Create A Shared Vision That Works (http://seapointcenter.com/how-to-create-a-shared-vision/) for information on strategies to create a shared vision.
33
Recommended Interventions• StudentGroupingStrategies
Consider professional development opportunities that address the reported strong positive correlation (0.68) between Student Grouping and LoTi Level. If the trend toward smaller learning environments (learning centers/stations, individualized instruction) is associated with higher levels of teaching innovation, then strategies should be considered that promote small group instruction throughout the school. Topics for PLC sessions, faculty meetings, and/or teacher inservices might involve strategies for designing learning centers/stations, creating learning contracts, implementing collaborative learning opportunities, and/or promoting peer mentoring.
Use of Resources:• StudentDigitalTool/ResourceUse
Consider professional development opportunities that address the reported strong positive correlation (0.76) between Student Use of Digital Tools and LoTi Level. If the frequency of student use of digital tools is associated with higher levels of teaching innovation, then strategies should be considered that focus on ways getting students using technology more effectively and frequently based on the content standards. Topics for PLC sessions, faculty meetings, and/or teacher inservices might involve strategies for using mobile carts as a station/center, collaborative learning methodologies that emphasize social media, course management systems (e.g., Edmodo, Moodle, Blackboard) that offer discussion threads, and/or online interactive word walls.
• TeacherDigitalTool/ResourceUse Consider professional development opportunities that address the reported strong positive correlation (0.63) between Teacher Use of Digital Tools and LoTi Level. If the frequency of teacher use of digital tools is associated with higher levels of teaching innovation, then strategies should be considered that focus on ways getting all teachers using technology more effectively and frequently based on the content standards. Topics for PLC sessions, faculty meetings, and/or teacher inservices might involve strategies for implementing the “one-computer” classroom, developing and maintaining a daily personal/professional blog//wiki, and/or subscribing to different online grade level/content area forums for ideas to integrate technology.
34
LoTi FrameworkAppendix A
Level of Teaching Innovation (LoTi) Framework
LoTi 0: Non-useAt a Level 0 (Non-Use), the instructional setting—including the use of digital and/or environmental resources—does not support or promote purposeful learning aligned to academic standards/expectations.
LoTi 1: AwarenessAt a Level 1 (Awareness), the instructional focus is exclusively direct instruction. Student learning focuses on lower levels of cognitive processing (e.g., Bloom Levels - remembering, understanding, applying; Webb’s Levels – recall & reproduction, working with skills & concepts). Digital and/or environmental resources are either (1) non-existent or (2) used by the classroom teacher to enhance teacher presentations.
LoTi 2: ExplorationAt a Level 2 (Exploration) the instructional focus emphasizes content understanding and supports mastery learning and direct instruction. Student learning focuses on lower levels of cognitive processing (e.g., Bloom Levels - remembering, understanding, applying; Webb’s Levels – recall & reproduction, working with skills & concepts). Digital and/or environmental resources are used by students for extension activities, enrichment exercises, information gathering assignments, or presentations that reinforce lower cognitive skill development relating to the content under investigation.
LoTi 3: InfusionAt a Level 3 (Infusion), the instructional focus emphasizes student higher order thinking (e.g., Bloom Levels – analyzing, evaluating, creating; Webb’s Levels – short-term strategic thinking) and teacher-directed problems. Though specific learning activities may lack authenticity, the instructional emphasis is, nonetheless, placed on higher levels of cognitive processing and in-depth treatment of the content using a variety of thinking skill strategies (e.g., problem-solving, decision-making). The concept attainment, inductive thinking, and scientific inquiry models of teaching are the norm and guide the types of products generated by students.
Digital and/or environmental resources are used by students and/or the teacher to execute teacher-directed tasks that emphasize higher levels of student cognitive processing relating to the content standards.
LoTi 4a: Integration (Mechanical)At a Level 4a (Integration: Mechanical) students are engaged in exploring real-world issues and solving authentic problems using the available digital and/or environmental resources; however, the teacher may experience classroom management (e.g., disciplinary problems) or school climate issues (lack of support from colleagues) that restrict full-scale integration. Heavy reliance is placed on prepackaged materials and/or outside resources (e.g., assistance from a peer coach) that aid the teacher in sustaining student-directed learning. Emphasis is placed on the constructivist, problem-based models of teaching that require higher levels of student cognitive processing (e.g., Bloom Levels – analyzing, evaluating, creating; Webb’s Levels – short-term strategic thinking, extended strategic thinking) and in-depth examination of the content standards.
Student use of digital and/or environmental resources is inherent and motivated by the drive to answer student-generated questions that dictate the content, process, and/or products embedded in the learning experience.
LoTi 4b: Integration (Routine)At a Level 4b (Integration: Routine) students are fully engaged in exploring real-world issues and solving authentic problems using the available digital and/or environmental resources. The teacher is within his/her comfort level with promoting an inquiry-based model of teaching that involves students applying their learning to the real world (e.g., Webb’s Levels – extended strategic thinking). Emphasis is placed on learner-centered strategies and the constructivist, problem-based models of teaching that promote personal goal setting and self-monitoring, student action, and issues resolution.
Students use of digital and/or environmental resources is inherent and motivated by the drive to answer student- generated questions that dictate the content, process, and products embedded in the learning experience.

35
LoTi FrameworkAppendix A
Level of Teaching Innovation (LoTi) Framework (continued)
LoTi 5: ExpansionAt a Level 5 (Expansion), student collaborations extending beyond the classroom are employed for authentic problem-solving and issues resolution. Emphasis is placed on learner-centered strategies that promote personal goal setting and self-monitoring, student action, and collaborations with other groups (e.g., another school, different cultures, business establishments, governmental agencies).
Student use of digital and/or environmental resources is inherent and motivated by the drive to answer student- generated questions that dictate the content, process, and products embedded in the learning experience.
The complexity and sophistication of the digital and environmental resources and collaboration tools used are commensurate with (1) the inventiveness and spontaneity of the teacher’s experiential-based approach to teaching and learning and (2) the students’ level of complex thinking (e.g., problem-solving, decision-making, experimental inquiry) and in- depth understanding of the content standards.
LoTi 6: RefinementAt a Level 6 (Refinement), student collaborations extending beyond the classroom that promote authentic student problem-solving and issues resolution are the norm. The instructional curriculum is entirely learner- based involving the content, process, and product of instruction. The content emerges based on the needs of the learner according to his/her interests and/or aspirations and is supported by ubiquitous access to the most current digital tools and resources.
The pervasive use of and access to advanced digital tools and resources provides a seamless medium for information queries, creative problem-solving, student reflection, and/or product development. Students have ready access to and a complete understanding of a vast array of online collaboration tools and related digital resources to accomplish learning outcomes beyond conventional strategies.
36
CIP FrameworkAppendix B
Current Instructional Practices (CIP) Framework
CIP Intensity Level 0At a CIP Intensity Level 0, the student is not involved in a formal classroom setting (e.g., independent study).
CIP Intensity Level 1At a CIP Intensity Level 1, the participant’s current instructional practices align exclusively with a teacher-directed approach relating to the content, process, and product of instruction. Teaching strategies tend to lean toward lectures and/or teacher-led presentations. The use of curriculum materials aligned to specific content standards serves as the focus for student learning. Learning activities tend to be sequential and uniform for all students. The use of differentiated strategies is non-existent. Evaluation techniques focus on traditional measures such as essays, quizzes, short-answers, or true-false questions. Student projects are teacher-directed in terms of identifying project outcomes as well as requirements for project completion.
The use of research-based best practices focuses on basic classroom routines (e.g., providing homework and practice, setting objectives and providing feedback, students summarizing and note taking, providing adequate wait time).
CIP Intensity Level 2Similar to a CIP Intensity Level 1, the participant at a CIP Intensity Level 2 supports instructional practices consistent with a teacher-directed approach relating to the content, process, and product, but not at the same level of intensity or commitment. Teaching strategies tend to lean toward lectures and/or teacher-led presentations. The use of curriculum materials aligned to specific content standards serves as the focus for student learning. Learning activities tend to be sequential and uniform for most students. The use of horizontal differentiated strategies are sometimes employed based on the teacher’s interests, modality strengths, and/or learning profile. Evaluation techniques focus on traditional measures such as essays, quizzes, short-answers, or true-false questions. Student projects tend to be teacher-directed in terms of identifying project outcomes as well as requirements for project completion.
The use of research-based best practices focuses on basic classroom routines (e.g., providing homework and practice, setting objectives and providing feedback, students summarizing and note taking, providing adequate wait time).
CIP Intensity Level 3At a CIP Intensity Level 3, the participant supports instructional practices aligned somewhat with a teacher-directed approach—an approach characterized by sequential and uniform learning activities for all students, teacher-directed presentations, and/or the use of traditional evaluation techniques. However, the participant may also support the use of horizontal differentiated strategies that provide opportunities for students to determine the “look and feel” of a final product based on student’s interests.
Evaluation techniques continue to focus on traditional measures with the resulting data serving as the basis for curriculum decision-making. The use of research-based best practices expands beyond basic classroom routines (e.g., providing opportunities for non-linguistic representation, offering advanced organizers).
CIP Intensity Level 4At a CIP Intensity Level 4, the use of a teacher-directed approach is the norm, but there is an increased frequency of student-directed decision-making or input into the content, process, or product of instruction. In a student-directed approach, learning activities are diversified and based mostly on student questions, the teacher serves more as a co-learner or facilitator in the classroom, student projects are primarily student-directed, and the use of alternative assessment strategies including performance-based assessments, peer reviews, and student reflections are the norm. The use of limited horizontal and/or vertical differentiated strategies are present based on student interests, modality strengths, learning profile and/or readiness levels.
Although traditional learning activities and evaluation techniques are used, students are also encouraged to contribute to the assessment process when appropriate based on the content standards. The use of research-based best practices expands beyond basic classroom routines (e.g., providing opportunities for non-linguistic representation, offering advanced organizers).
37
CIP FrameworkAppendix B
Current Instructional Practices (CIP) Framework (continued)
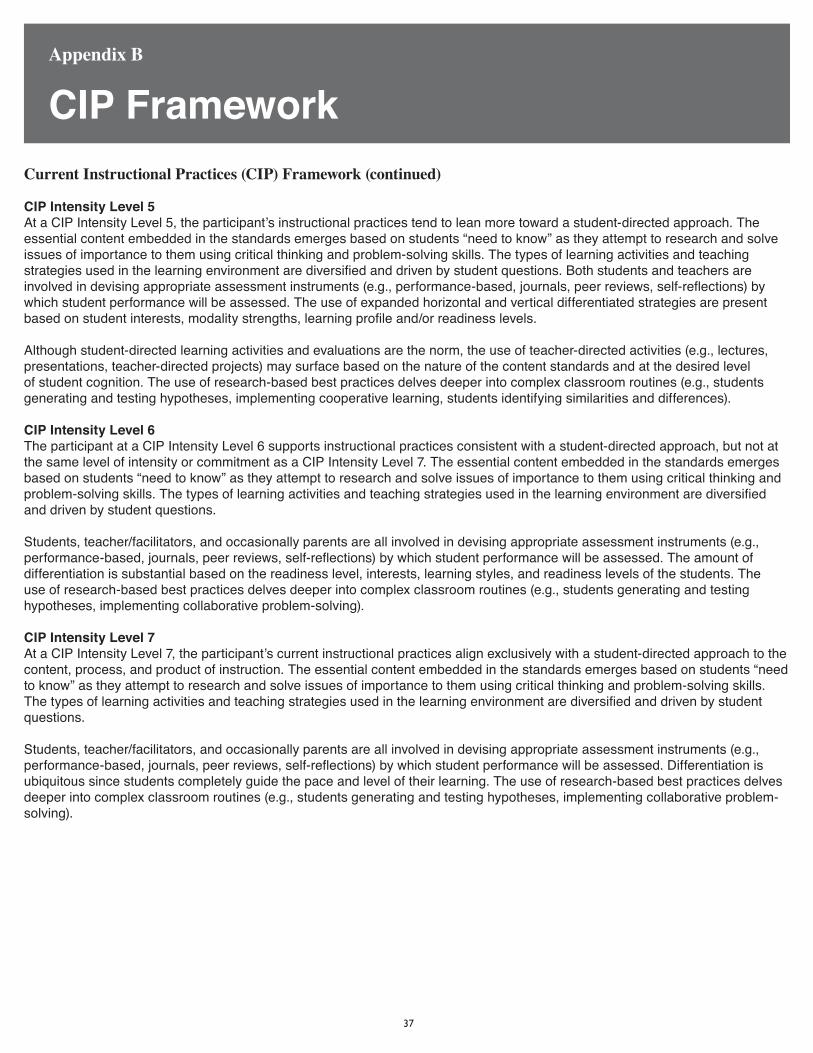
CIP Intensity Level 5At a CIP Intensity Level 5, the participant’s instructional practices tend to lean more toward a student-directed approach. The essential content embedded in the standards emerges based on students “need to know” as they attempt to research and solve issues of importance to them using critical thinking and problem-solving skills. The types of learning activities and teaching strategies used in the learning environment are diversified and driven by student questions. Both students and teachers are involved in devising appropriate assessment instruments (e.g., performance-based, journals, peer reviews, self-reflections) by which student performance will be assessed. The use of expanded horizontal and vertical differentiated strategies are present based on student interests, modality strengths, learning profile and/or readiness levels.
Although student-directed learning activities and evaluations are the norm, the use of teacher-directed activities (e.g., lectures, presentations, teacher-directed projects) may surface based on the nature of the content standards and at the desired level of student cognition. The use of research-based best practices delves deeper into complex classroom routines (e.g., students generating and testing hypotheses, implementing cooperative learning, students identifying similarities and differences).
CIP Intensity Level 6The participant at a CIP Intensity Level 6 supports instructional practices consistent with a student-directed approach, but not at the same level of intensity or commitment as a CIP Intensity Level 7. The essential content embedded in the standards emerges based on students “need to know” as they attempt to research and solve issues of importance to them using critical thinking and problem-solving skills. The types of learning activities and teaching strategies used in the learning environment are diversified and driven by student questions.
Students, teacher/facilitators, and occasionally parents are all involved in devising appropriate assessment instruments (e.g., performance-based, journals, peer reviews, self-reflections) by which student performance will be assessed. The amount of differentiation is substantial based on the readiness level, interests, learning styles, and readiness levels of the students. The use of research-based best practices delves deeper into complex classroom routines (e.g., students generating and testing hypotheses, implementing collaborative problem-solving).
CIP Intensity Level 7At a CIP Intensity Level 7, the participant’s current instructional practices align exclusively with a student-directed approach to the content, process, and product of instruction. The essential content embedded in the standards emerges based on students “need to know” as they attempt to research and solve issues of importance to them using critical thinking and problem-solving skills. The types of learning activities and teaching strategies used in the learning environment are diversified and driven by student questions.
Students, teacher/facilitators, and occasionally parents are all involved in devising appropriate assessment instruments (e.g., performance-based, journals, peer reviews, self-reflections) by which student performance will be assessed. Differentiation is ubiquitous since students completely guide the pace and level of their learning. The use of research-based best practices delves deeper into complex classroom routines (e.g., students generating and testing hypotheses, implementing collaborative problem-solving).
38
PCU FrameworkAppendix C
Personal Computer Use (PCU) Framework
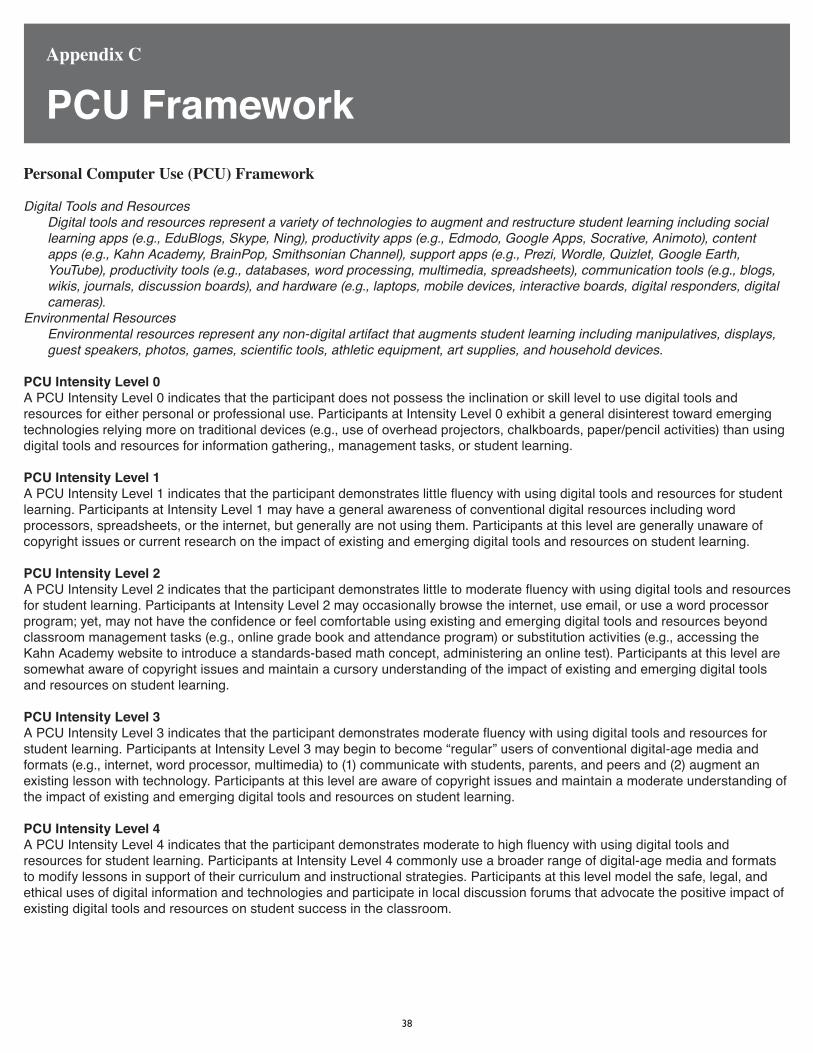
Digital Tools and ResourcesDigital tools and resources represent a variety of technologies to augment and restructure student learning including social learning apps (e.g., EduBlogs, Skype, Ning), productivity apps (e.g., Edmodo, Google Apps, Socrative, Animoto), content apps (e.g., Kahn Academy, BrainPop, Smithsonian Channel), support apps (e.g., Prezi, Wordle, Quizlet, Google Earth, YouTube), productivity tools (e.g., databases, word processing, multimedia, spreadsheets), communication tools (e.g., blogs, wikis, journals, discussion boards), and hardware (e.g., laptops, mobile devices, interactive boards, digital responders, digital cameras).
Environmental ResourcesEnvironmental resources represent any non-digital artifact that augments student learning including manipulatives, displays, guest speakers, photos, games, scientific tools, athletic equipment, art supplies, and household devices.
PCU Intensity Level 0A PCU Intensity Level 0 indicates that the participant does not possess the inclination or skill level to use digital tools and resources for either personal or professional use. Participants at Intensity Level 0 exhibit a general disinterest toward emerging technologies relying more on traditional devices (e.g., use of overhead projectors, chalkboards, paper/pencil activities) than using digital tools and resources for information gathering,, management tasks, or student learning.
PCU Intensity Level 1A PCU Intensity Level 1 indicates that the participant demonstrates little fluency with using digital tools and resources for student learning. Participants at Intensity Level 1 may have a general awareness of conventional digital resources including word processors, spreadsheets, or the internet, but generally are not using them. Participants at this level are generally unaware of copyright issues or current research on the impact of existing and emerging digital tools and resources on student learning.
PCU Intensity Level 2A PCU Intensity Level 2 indicates that the participant demonstrates little to moderate fluency with using digital tools and resources for student learning. Participants at Intensity Level 2 may occasionally browse the internet, use email, or use a word processor program; yet, may not have the confidence or feel comfortable using existing and emerging digital tools and resources beyond classroom management tasks (e.g., online grade book and attendance program) or substitution activities (e.g., accessing the Kahn Academy website to introduce a standards-based math concept, administering an online test). Participants at this level are somewhat aware of copyright issues and maintain a cursory understanding of the impact of existing and emerging digital tools and resources on student learning.
PCU Intensity Level 3A PCU Intensity Level 3 indicates that the participant demonstrates moderate fluency with using digital tools and resources for student learning. Participants at Intensity Level 3 may begin to become “regular” users of conventional digital-age media and formats (e.g., internet, word processor, multimedia) to (1) communicate with students, parents, and peers and (2) augment an existing lesson with technology. Participants at this level are aware of copyright issues and maintain a moderate understanding of the impact of existing and emerging digital tools and resources on student learning.
PCU Intensity Level 4A PCU Intensity Level 4 indicates that the participant demonstrates moderate to high fluency with using digital tools and resources for student learning. Participants at Intensity Level 4 commonly use a broader range of digital-age media and formats to modify lessons in support of their curriculum and instructional strategies. Participants at this level model the safe, legal, and ethical uses of digital information and technologies and participate in local discussion forums that advocate the positive impact of existing digital tools and resources on student success in the classroom.
39
PCU FrameworkAppendix C
Personal Computer Use (PCU) Framework (continued)
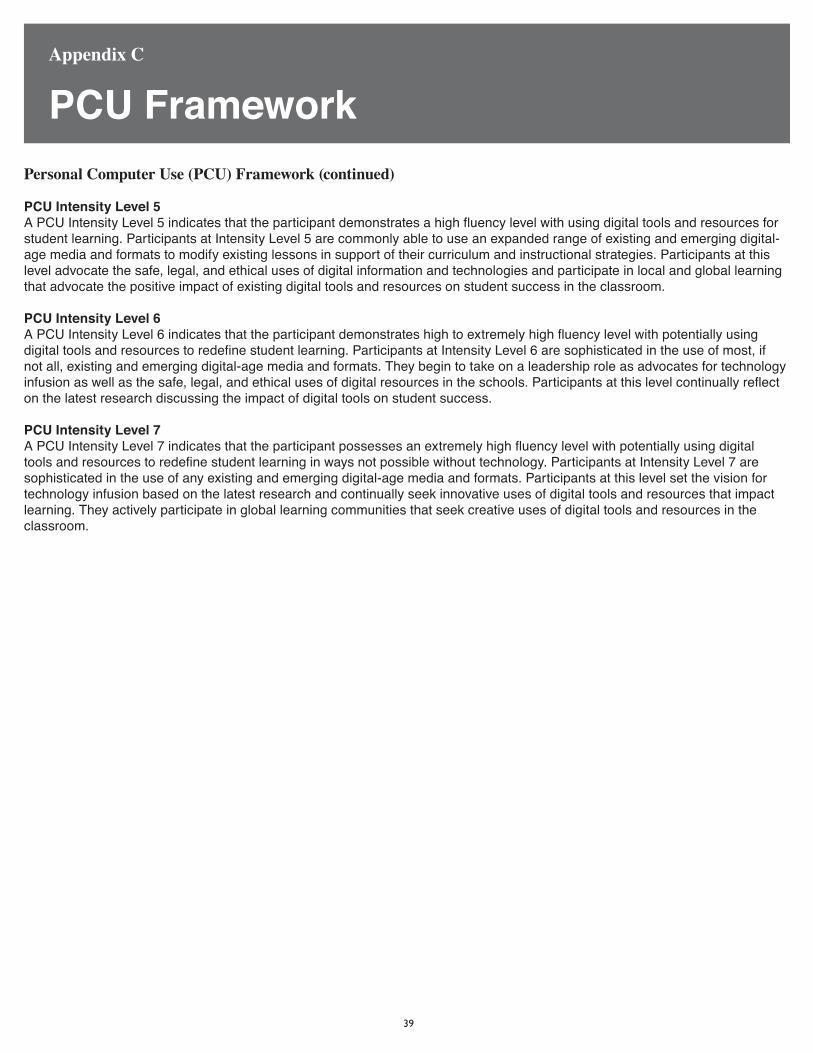
PCU Intensity Level 5A PCU Intensity Level 5 indicates that the participant demonstrates a high fluency level with using digital tools and resources for student learning. Participants at Intensity Level 5 are commonly able to use an expanded range of existing and emerging digital-age media and formats to modify existing lessons in support of their curriculum and instructional strategies. Participants at this level advocate the safe, legal, and ethical uses of digital information and technologies and participate in local and global learning that advocate the positive impact of existing digital tools and resources on student success in the classroom.
PCU Intensity Level 6A PCU Intensity Level 6 indicates that the participant demonstrates high to extremely high fluency level with potentially using digital tools and resources to redefine student learning. Participants at Intensity Level 6 are sophisticated in the use of most, if not all, existing and emerging digital-age media and formats. They begin to take on a leadership role as advocates for technology infusion as well as the safe, legal, and ethical uses of digital resources in the schools. Participants at this level continually reflect on the latest research discussing the impact of digital tools on student success.
PCU Intensity Level 7A PCU Intensity Level 7 indicates that the participant possesses an extremely high fluency level with potentially using digital tools and resources to redefine student learning in ways not possible without technology. Participants at Intensity Level 7 are sophisticated in the use of any existing and emerging digital-age media and formats. Participants at this level set the vision for technology infusion based on the latest research and continually seek innovative uses of digital tools and resources that impact learning. They actively participate in global learning communities that seek creative uses of digital tools and resources in the classroom.

40
H.E.A.T. FrameworkAppendix D
Higher-Order ThinkingThe task requires students operating at the higher levels of Bloom’s Taxonomy (e.g., Analyzing, Evaluating, Creating).1 = Students taking notes only; no questions asked2 = Student learning/questioning at Remembering level 3 = Student learning/questioning at Understanding level4 = Student learning/questioning at Applying level5 = Student learning/questioning at Analyzing level6 = Student learning/questioning at Evaluating/Creating levels
Engaged LearningThe task asks students to show their “know how” on something important and challenging, not just their knowledge.1 = Students report what they have learned only2 = Students collaborate to report what they have learned with possible options3 = Students solve a teacher-directed problem4 = Students collaborate to solve a teacher-directed problem with possible options5 = Students collaborate to define the task, the process, and/or the solution6 = Students collaborate to define the task, the process, and/or the solution; collaboration extends beyond the classroom
Authentic ConnectionsThe task reflects what people might actually do in the real world—real life issues, themes, and/or problems.1 = The content of the learning experience is missing or too vague to determine relevance2 = The learning experience represents a group of connected activities, but does not connect the content to the real world3 = The learning experience emphasizes real-world content connections made by the teacher4 = The learning experience focuses on students exploring/discussing real-world content connections5 = The learning experience provides opportunity for students to apply their content understanding to a real world situation6 = The learning experience involves students creating a product that has a real-world purpose beyond the classroom that
directly impacts the students
Technology UseDigital and/or environmental resources are used in a seamless fashion to promote student learning.1 = Digital and/or environmental resources are (1) not available, (2) not used, or (3) not directly connected to the learning2 = Students’ use of digital and/or environmental resources appears to be an add-on or is not needed for task completion3 = Teacher leads whole group learning with digital and/or environmental resources4 = Students use teacher-directed digital and/or environmental resources to accomplish learning outcomes5 = Students use self-selected digital and/or environmental resources to accomplish learning outcomes6 = Students use self-selected digital resources to accomplish learning outcomes beyond conventional strategies
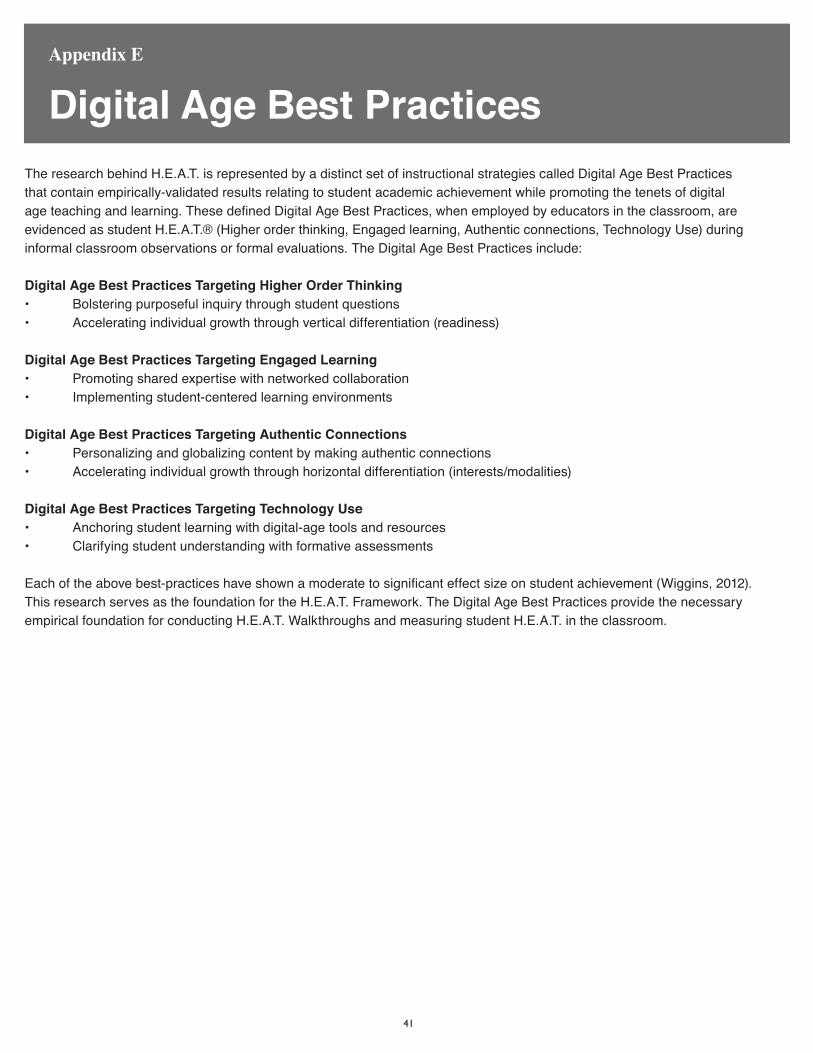
41
Digital Age Best PracticesAppendix E
The research behind H.E.A.T. is represented by a distinct set of instructional strategies called Digital Age Best Practices that contain empirically-validated results relating to student academic achievement while promoting the tenets of digital age teaching and learning. These defined Digital Age Best Practices, when employed by educators in the classroom, are evidenced as student H.E.A.T.® (Higher order thinking, Engaged learning, Authentic connections, Technology Use) during informal classroom observations or formal evaluations. The Digital Age Best Practices include: Digital Age Best Practices Targeting Higher Order Thinking• Bolstering purposeful inquiry through student questions• Accelerating individual growth through vertical differentiation (readiness)
Digital Age Best Practices Targeting Engaged Learning• Promoting shared expertise with networked collaboration• Implementing student-centered learning environments
Digital Age Best Practices Targeting Authentic Connections• Personalizing and globalizing content by making authentic connections• Accelerating individual growth through horizontal differentiation (interests/modalities)
Digital Age Best Practices Targeting Technology Use• Anchoring student learning with digital-age tools and resources• Clarifying student understanding with formative assessments Each of the above best-practices have shown a moderate to significant effect size on student achievement (Wiggins, 2012). This research serves as the foundation for the H.E.A.T. Framework. The Digital Age Best Practices provide the necessary empirical foundation for conducting H.E.A.T. Walkthroughs and measuring student H.E.A.T. in the classroom.

42
• Anderson,RonaldD.(2002)Reformingscienceteaching:Whatresearchsaysaboutinquiry.Journal of Science Teacher Education,13(1),1-12.
• Baker,E.L.,Gearhart,M.,andHerman,J.L.(1994).Evaluating the apple classrooms of tomorrow(SM). InE.L.BakerandH.F.O’Neil,Jr.(Eds),TechnologyAssessmentinEducationandTraining.Hillsdale,NJ:Erlbaum,173-198.
• Berger,W.(2014,August18)Five ways to help your students become better questioners [Web log post].RetrievedfromEdutopiawebsitehttp://www.edutopia.org/blog/help-students-become-better-questioners-warren-berger
• Black,P.J.andWiliam,D.(1998).Insidetheblackbox:Raisingthestandardsthroughclassroomassessment.Phi Delta Kappan,RetrievedFebruary15th,2011fromhttp://blog.discoveryeducation.com/assessment/files/2009/02/blackbox_article.pdf
• Black,P.andWiliam,D.(1998).Assessmentandclassroomlearning.Assessment in Education, 5(1),7-74.• Clifford,M.(2011)20 collaborative learning tips and strategies for teachers.RetrievedfromtheTeachThoughtwebsitehttp://
www.teachthought.com/uncategorized/20-collaborative-learning-tips-and-strategies/• Cohen,J.,Cardillo,R,andPickeral,T.(September,2011) Creating a climate of respect.EducationalLeadership.Retrievedfrom
http://www.ascd.org/publications/educational-leadership/sept11/vol69/num01/Creating-a-Climate-of-Respect.aspx• Cordova,DianaI.andLepper,MarkR.(1996)Intrinsicmotivationandtheprocessoflearning:Beneficialeffectsof
contextualization,personalization,andchoice.Journal of Educational Psychology, 88(4),715-30.• Daggett,W.(2014).Rigor relevance framework: A guide to focusing resources to increase student performance. Retrievedfrom
http://www.leadered.com/pdf/rigor_relevance_framework_2014.pdf• DeFrondeville,T(2009,March11).Ten steps to better student engagement. RetrievedfromtheEdutopiawebsitehttp://www.
edutopia.org/project-learning-teaching-strategies• Dochy,Filip,Segers,Mien,Bossche,PietVanden,Gijbels.(2003).Effectsofproblem-basedlearning:Ameta-analysis.Learning
and Instruction, 13,533-568.• Dotson,J.M.(2001)Cooperativelearning.structurescanincreasestudentachievement.Kagan Online Magazine.San
Clemente,CA:KaganPublishing.RetrievedFebruary15,2011fromhttp://www.kaganonline.com/free_articles/research_and_rationale/increase_achievement.php
• DreamboxLearningBlog(2013,October23).6 models of blended learning [Web log post].Retrievedfromhttp://www.dreambox.com/blog/6-models-blended-learning
• Edutopia(2007,November5)How to integrate technology.Retrievedfromhttp://www.edutopia.org/technology-integration-guide-implementation
• Enrichment triad model: Developing the gifts and talents of students (n.d.)Retrievedfromhttp://enrichmenttriadmodel.weebly.com/what-is-triad.html
• FacingHistoryandOurselves.(n.d.)Teaching strategies. Retrievedfromhttps://www.facinghistory.org/for-educators/educator-resources/teaching-strategies
• Fuch,L.S.andFuch,D.(1986).Effectsofsystematicformativeevaluation:Ameta-analysis.Exceptional Children, 53,199-208.• Geier,R.,Blumenfeld,P.C.,Marx,R.W.,Krajcik,J.S.,Fishman,B.,Soloway,E.,andClay-Chambers,J.(2008).Standardizedtest
outcomesforstudentsengagedininquiry-basedsciencecurriculainthecontextofurbanreform.Journal of Research in Science Teaching, 45(8),922-939.
• Gibbs,G.(1992).Assessing more students.Oxford:OxfordBrookesUniversity.• Hartzler,D.S.(2000).A meta-analysis of studies conducted on integrated curriculum programs and their effects on student
achievement.(Unpublisheddissertation).IndianaUniversity.• Haynes,K.(n.d.)12 ways to bring the real world into your classroom. RetrievedfromtheTeachingHubwebsitehttp://www.
teachhub.com/top-12-ways-bring-real-world-your-classroom• Heick,T.(2013,September24)6 proposals for improving teacher morale [Web log post].RetrievedfromtheEdutopiawebsite
http://www.edutopia.org/blog/proposals-for-improving-teacher-morale-terry-heick• ISTE(n.d.)ISTE standards for administrators. Retrievedfromhttp://www.iste.org/standards/iste-standards/standards-for-
administrators• ISTE(n.d.)ISTE standards for teachers. Retrievedfromhttp://www.iste.org/standards/iste-standards/standards-for-teachers• ISTEExcerpt(n.d.)Using model strategies for integrating technology into teaching.Retrievedfromhttp://www.iste.org/docs/
excerpts/nettb2-excerpt.pdf.• Johnson,D.W.andJohnsonR.T.(1999).Learning together and alone: Cooperative, competitive, and individualistic learning (5th
ed.).Boston,MA:AllynandBacon.• Johnson,D.W.,Johnson,R.T.,andStanne,M.B.(2000).Cooperative learning methods: A meta-analysis.RetrievedFebruary
15th,2011fromhttp://www.tablelearning.com/uploads/File/EXHIBIT-B.pdf.• Kessner.MichaelJ.(2008).How does implementation of inquiry-based science instruction in a high-stakes testing environment
affectfifth-gradestudentscienceachievement?.(Doctoraldissertation).RetrievedfromProQuestDissertationsandTheses.(AccessionOrderNo.AAT3304567)
• Kegerise,SusanM.(2007)Impactofdifferentiatedinstructionalgroupingstrategyonfifthgradestudents’mathematicsachievement.(Unpublisheddissertation).WidenerUniversity.
• Luster,RamonaJanet(2008)A quantitative study investigating the effects of whole-class and differentiated instruction on student achievement.(Doctoraldissertation).RetrievedfromProQuestDissertationsandTheses.(AccessionOrderNo.AAT3320691
• Lynch,P.(2010).Employee voice: A critical element of organizational success.Retrievedfrom(http://www.businessalignmentstrategies.com/research/employee-voice.php
• Meissner,H.(1999)Creativity and Mathematics Education. SummaryofInternationalConference,July15-19.
Bibliography

43
Bibliography• Mergendoller,J.R.,Maxwell,N.,andBellisimo,Y.(2007).Theeffectivenessofproblembasedinstruction:Acomparativestudyof
instructionalmethodsandstudentcharacteristics.Interdisciplinary Journal of Problem-based Learning, 1(2),49-69.• Moersch,C.(1994,Fall)Labs for learning: An experiential-based action model.Retrievedfromhttp://loticonnection.cachefly.net/
global_documents/1994_10OCT_LabsforLearning.pdf• Moersch,C.(n.d.)A-Z list of informal assessment strategies.RetreivedfromtheWestVirginiaDepartmentofEducationwebsite
http://loticonnection.cachefly.net/global_documents/A-Z_Informal_Assessment_Strategies.pdf• Moersch,C.(2009).LoTi math project summary: Year 3 report for Atlantic City Board of Education.Carlsbad,CA:LoTi
Connection.• Moersch,C.(2011).Digital age best practices.Retrievedfromhttp://digitalis.nwp.org/sites/default/files/files/94/Digital%20
Age%20Best%20Practices.pdf• Moersch,C.(1995) LevelsofTechnologyImplementation(LoTi):AFrameworkforMeasuringClassroomTechnologyUse. Learning
and Leading with Technology. November.• Moersch,C.(2011,May/june)Turning up the H.E.A.T. on student learning.EducationalTechnology.51.43-46..Retrievedfrom
http://loticonnection.cachefly.net/global_documents/2011_5MAYJUN_HEATStudentLearning.pdf• P21Partnershipfor21stCenturyLearning(n.d).Framework for 21st Century Learning. Retrievedfromhttp://www.p21.org/our-
work/p21-framework• Perez-Prado,A.andThirunarayanan,M.(2002).Aqualitativecomparisonofonlineandclassroom-basedsectionsofacourse:
Exploringstudentperspectives.Education Media International, 39(2),195-202.• Preston,J.(2008)Student-centered versus teacher-centered mathematics instruction: A meta-analysis. (Doctoraldissertation).
RetrievedfromDissertations&Theses:FullText.(PublicationNo.AAT3289778)• Puentedura,R.R.(2015,October15).SAMR: A brief introduction [Web log post].Retrievedfromhttp://hippasus.com/blog/
archives/227• Raffaelli,L.(2014,December5)18 teacher-tested strategies for differentiated instruction.RetrievedfromtheEdutopiawebsite
http://www.edutopia.org/discussion/18-teacher-tested-strategies-differentiated-instruction• Roschelle,J.M.Pea,R.D.,Hoadley,C.M.,Gordin,D.N.andMeans,B.M.(2000).Changinghowandwhatchildrenlearninschool
withcomputer-basedtechnologies.The Future of Children, 10(2),76-101• Schacter,J.(June,1999).The impact of education technology on student achievement: What the most current research has to
say.SantaMonica,CA:MilkenExchangeonEducationTechnology.• Shepard,L.A.(2000).The role of classroom assessment in teaching and learning. Center for the Study of Evaluation (CSE
Technical Report # 517). Los Angeles, CA: University of California.• Slavin,R.E.(1991).Synthesisofresearchoncooperativelearning.Educational Leadership, 48,71-82.• Slavin,R.E.(1995).Cooperative learning: Theory, research, and practice (2nd ed.).Boston:Allyn&Bacon.• Salinas,MoisesF.andGarr,Johanna.(2009)Effectoflearner-centerededucationontheacademicoutcomesofminoritygroups.
Journal of Instructional Psychology, 36(2),1-13.Sandy-Hanson,A.E.(2006)A meta-analysis of the impact of computer technology versus traditional instruction on students in kindergarten through twelfth grade in the United States. A comparison of academic achievement, higher-order thinking skills, motivation, physical outcomes and social skills.(Unpublisheddissertation).HowardUniversity,Washington,D.C.
• Schroeder,CarolynM.,Scott,TimothyP.,Tolson,Homer,Huang,Tse-Yang,Lee,Yi-Hsuan.(October30,2007)Ameta-analysisofnationalresearch:EffectsofteachingstrategiesonstudentachievementinscienceintheUnitedStates.Journal of Research in Science Teaching, 44(10),1436-1460.
• Slemmer,D.L.(2002).The effect of learning styles on student achievement in various hypertext, hypermedia and technology enhanced learning environments: A meta-analysis.(Unpublisheddissertation).BoiseStateUniversity,Boise,Idaho.
• Stoner,J.(2014,January21)Howtocreateasharedvisionthatworks?[Weblogpost].Retrievedfromhttp://seapointcenter.com/how-to-create-a-shared-vision/
• Teele,LeCounte.(2006).The impact of integrated study skills and critical thinking on student achievement. (Unpublisheddissertation).CapellaUniversity.
• Turner,L(2014,December4) HOTS for teachers: 25 top resources for higher order thinking skills. RetrievedfromtheTech & Learningwebsitehttp://www.techlearning.com/default.aspx?tabid=100&entryid=8519
• Wade,EileenGray(1994).A study of the effects of a constructivist-based mathematics problem-solving instructional program on theattitudes,self-confidence,andachievementofpost-fifth-gradestudents.RetrievedfromDissertations&Theses:FullText.(PublicationNo.AAT9510417)
• Walker,A.andLeary,H.(2009).Aproblembasedlearningmeta-analysis:Differencesacrossproblemtypes,implementationtypes,disciplines,andassessmentlevels.Interdisciplinary Journal of Problem-based Learning, 3(1).
• Webb,N.(2009)Webb’sdepthofknowledgeguide:Careerandtechnicaleducationdefinitions.Retrievedfromhttp://www.aps.edu/re/documents/resources/Webbs_DOK_Guide.pdf
• Westberg,KarenL.andArchambault,FrancisX.(2004).A multi-site case study of successful classroom practices for high ability students in Differentiation for gifted and talented students.ThousandOaks,CA,CorwinPressandNationalAssociationforGiftedChildren.
• Wiggins,G.(September2012).Seven keys to effective feedback.RetrievedfromtheEducational Leadershipwebsite:http://www.ascd.org/publications/educational-leadership/sept12/vol70/num01/Seven-Keys-to-Effective-Feedback.aspx
• Wininger,R.S.(2005).Usingyourteststoteach:Formativesummativeassessment.Teaching Psychology, 32(2),164-166.• WorkplaceInsights(2011,August25)Areyoucommunicatingeffectively?[Weblogpost].Retrievedfromhttp://blog.capital.org/
tag/two-way-communication/

44
InquiriesWe welcome the opportunity to speak with you about your specific situation. You can contact a LoTi team member or stay in contact with us through Facebook, Linked In, or Twitter.
Fred Saunders • Phone: 760.522.8567 • Email: [email protected] • Google: lotiguyfred
Chris Moersch • Phone: 858.245.3746 • Email: [email protected] • Google: lotiguychris • Blog: lotiguyspeaks.blogspot.com
Stay Connected with LoTi Connection • Facebook: www.facebook.com/pages/LoTi-Connection/176027867726 • Linked In: www.linkedin.com/company/loti-connection/ • Twitter: twitter.com/loticonnection