sample - compass international · copyright © 2018 compass international, inc. about the firm....
TRANSCRIPT

2018Pipelines, Mining & Offshore Cost Data
Yearbook7TH EDITION
SAMPLE

Copyright © 2018 Compass International, Inc.
1
CONTENTS
ABOUT THE FIRMACKNOWLEDGEMENTS
1SECTION 1: Introduction, General Comments and Calibration Factors: includes the following:Location (Calibration) Factors - International values compared to USA Gulf Coast. (Base of 1.00). Calibrations in this application are used to adjust the benchmark prices depicted in the following SECTIONS (1 thru 700).25 # Country Calibration Factors.General Conversion Values - Imperial to Metric Units. Import Duties General Sales Tax / Value. Added Tax / Consumption Tax.Detailed Design / Engineering / Architectural and CM Fees 51 # Facility Types.Union Labor Costs / Inflation Cost Indexes.USA and Canada State & Province Sales Tax / GST.
10SECTION 10: Major Equipment / Production Equipment
20SECTION 20: Site, Civil, Piling, Concrete, Masonry and Buildings
30SECTION 30: Structural Steel
40SECTION 40: Piping / (ISBL and OSBL)
I N T E R N A T I O N A L I N C .
VII
17
41
47
49
SAMPLE

Copyright © 2018 Compass International, Inc.
50SECTION 50: Electrical and Instrumentation
60SECTION 60: Insulation
70SECTION 70: Painting and Coatings
80SECTION 80: Refractory
90SECTION 90: Scaffolding
100SECTION 100: Construction Equipment / Plant Hire
110SECTION 110: Domestic and International Freight
120SECTION 120: Offshore Data
130SECTION 130: Pipelines (Onshore and Offshore)
II. | CONTENTS
65
75
79
83
83
85
95
99
115
SAMPLE
Copyright © 2018 Compass International, Inc. Copyright © 2018 Compass International, Inc.
140SECTION 140: Module Cost and Man hour Benchmarks
150SECTION 150: Wind Turbines (Onshore and Offshore) Benchmarks
160SECTION 160: Mining Benchmarks
200SECTION 200: Home Office Engineering and Support Costs
300SECTION 300: Construction Management Cost Data
400SECTION 400: Temporary Site Facilities
500SECTION 500: All-in hourly labor rates
600SECTION 600: Insurance Data
700SECTION 700: Miscellaneous items, Bonds, Spare Parts, Camp Costs, Construction Consum-ables, Start up issues, Transmission Line Benchmarks and Camp Costs.
131
139
145
153
155
157
159
163
165
CONTENTS | III.
SAMPLE
Copyright © 2018 Compass International, Inc.
ABOUT THE FIRM
ompass International Consultants Inc. was founded in 1992 (C.I.C.I) and is a provider of construc-tion estimating services, international construction cost data, location factors, training seminars, value engineering, estimating support and conceptual construction economic cost data. Compass International is backed by an excellent staff of experienced Cost Engineers, Cost Estimators, Civil
/ Mechanical / Chemical Engineers and Economists.
WEB SITE: www.compassinternational.net
MAILING ADDRESS:Compass International Inc.P.O. Box 1295Morrisville, PA. 19067 - USATelephone / Fax (215) 504 9777
E-MAIL [email protected] [email protected]
ACKNOWLEDGEMENTSThis data source is the result of more than twenty years research and data collection. The information con-tained in this data source was collected from more than 60 + completed CAPEX projects (Refinery, Chemical and Manufacturing facilities) located in North America, the UK, Mainland Europe, Asia, Africa and South America valued between $0.30 million to over $3 billion. The data is based on Compass International’s cost library, augmented with latest cost and labor data from International Development Banks and Agencies, Eu-ropean Union Commission Reports, various Country National Libraries and Bibliotheques from around the world, various Government Information Agencies, Global Quasi-Governance Organizations, an assortment of Government Trade Promotion Departments / Labor Departments, numerous trade magazines, hourly and an-nual salary rates from US / Overseas labor trade unions, professional society articles, an assortment of news-paper / magazine articles, various international almanacs / directories / tables / reference books, internet data and various cost – construction related publications. The cost models and tables have also been augmented by a number of personal estimating libraries, this information has been audited, expanded upon, modified and calibrated and refined to today’s construction methods and installation applications. We would like to express our sincere thanks to the many engineers, contractors, vendors and other individuals (friends and colleagues) too many to mention who have given freely of their advice, input, time and knowledge so that this data source could be produced for the benefit of individuals that have an interest in this subject matter. We welcome any comments or data that could be used in future updates to make this database more complete and accurate.
CSAMPLE
14. | SECTION 1
Copyright © 2018 Compass International, Inc.
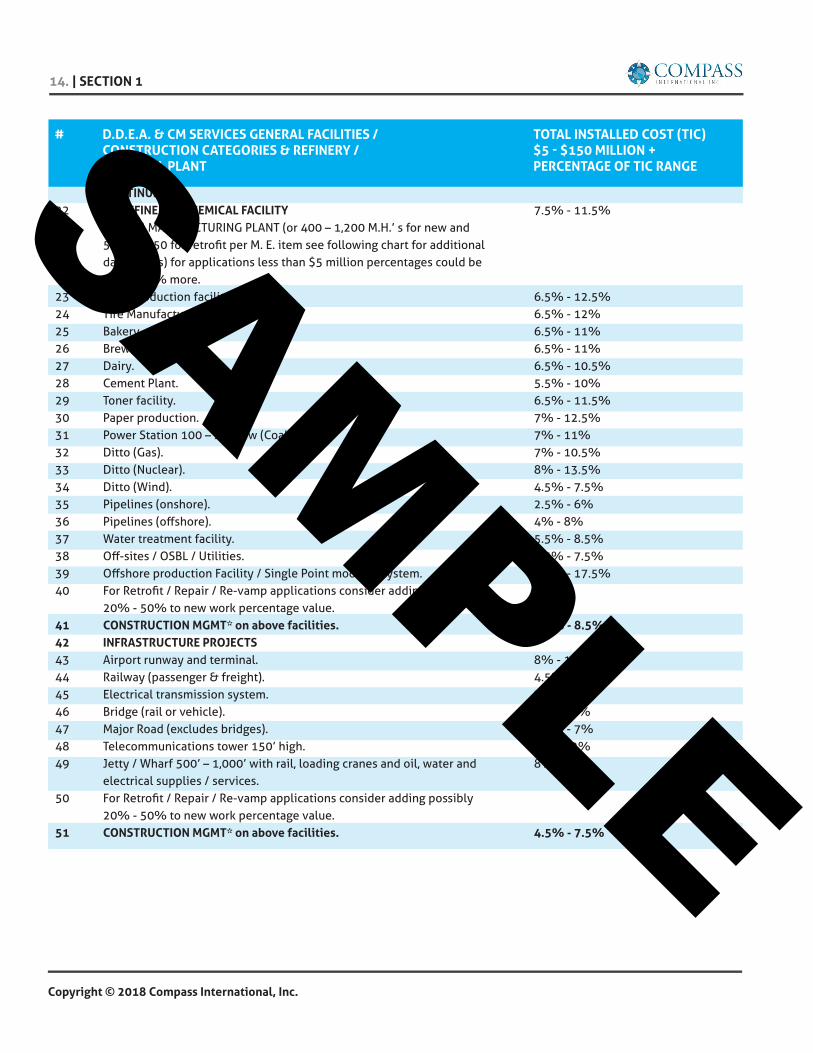
# D.D.E.A. & CM SERVICES GENERAL FACILITIES / TOTAL INSTALLED COST (TIC) CONSTRUCTION CATEGORIES & REFINERY / $5 - $150 MILLION + CHEMICAL PLANT PERCENTAGE OF TIC RANGE CONTINUED22 (E) REFINERY / CHEMICAL FACILITY 7.5% - 11.5% (I.S.B.L.) MANUFACTURING PLANT (or 400 – 1,200 M.H.’ s for new and 500 – 1,750 for retrofit per M. E. item see following chart for additional data points) for applications less than $5 million percentages could be 10% - 30% more. 23 Auto production facility. 6.5% - 12.5%24 Tire Manufacturing facility. 6.5% - 12%25 Bakery. 6.5% - 11%26 Brewery. 6.5% - 11%27 Dairy. 6.5% - 10.5%28 Cement Plant. 5.5% - 10%29 Toner facility. 6.5% - 11.5%30 Paper production. 7% - 12.5%31 Power Station 100 – 250 Mw (Coal). 7% - 11%32 Ditto (Gas). 7% - 10.5%33 Ditto (Nuclear). 8% - 13.5%34 Ditto (Wind). 4.5% - 7.5%35 Pipelines (onshore). 2.5% - 6%36 Pipelines (offshore). 4% - 8%37 Water treatment facility. 5.5% - 8.5%38 Off-sites / OSBL / Utilities. 3.5% - 7.5%39 Offshore production Facility / Single Point mooring System. 9.5% - 17.5%40 For Retrofit / Repair / Re-vamp applications consider adding possibly 20% - 50% to new work percentage value. 41 CONSTRUCTION MGMT* on above facilities. 4.5% - 8.5%42 INFRASTRUCTURE PROJECTS 43 Airport runway and terminal. 8% - 14%44 Railway (passenger & freight). 4.5% - 8%45 Electrical transmission system. 7% - 13%46 Bridge (rail or vehicle). 5% - 12%47 Major Road (excludes bridges). 3.5% - 7%48 Telecommunications tower 150’ high. 6% - 12%49 Jetty / Wharf 500’ – 1,000’ with rail, loading cranes and oil, water and 8% - 13% electrical supplies / services. 50 For Retrofit / Repair / Re-vamp applications consider adding possibly 20% - 50% to new work percentage value. 51 CONSTRUCTION MGMT* on above facilities. 4.5% - 7.5%
SAMPLE

SECTION 60 | 77.
Copyright © 2018 Compass International, Inc.
# DESCRIPTION U OF M MATERIAL LABOR C.E. TOTAL
CONTINUED 71 Insulation to valves 1 1/2” - 3” thick calcium EACH 24.18 56.98 7.05 88.20 silicate or fiberglass with contact cement and cloth jacket 1” dia valve (Maximum) 72 Ditto (Minimum) EACH 12.09 35.61 4.41 52.1173 2” dia (Maximum) EACH 36.27 71.22 8.81 116.3074 2” dia (Minimum) EACH 24.18 47.48 5.87 77.5375 4” dia (Maximum) EACH 48.36 106.83 13.22 168.4176 4” dia (Minimum) EACH 36.27 83.09 10.28 129.6477 6” dia (Maximum) EACH 72.54 154.31 19.09 245.9478 6” dia (Minimum) EACH 60.43 118.71 14.68 193.8379 8” dia (Maximum) EACH 96.70 237.42 29.37 363.4980 8” dia (Minimum) EACH 72.54 189.93 23.49 285.9681 10” dia (Maximum) EACH 145.06 296.76 36.71 478.5382 10” dia (Minimum) EACH 96.70 237.42 29.37 363.4983 12” dia (Maximum) EACH 241.77 356.13 44.05 641.9584 12” dia (Minimum) EACH 169.25 296.76 36.71 502.7285 2” thick Cal-Sil insulation to 1” dia steel pipe, LF 5.48 0.060 - 0.080 excludes jacket 86 Ditto 1.50” dia LF 6.18 0.060 - 0.080 87 Ditto 2” dia LF 6.62 0.060 - 0.080 88 Ditto 3” dia LF 7.63 0.060 - 0.080 89 Ditto 4” dia LF 8.94 0.070 - 0.090 90 Ditto 6” dia LF 11.34 0.070 - 0.090 91 Ditto 8” dia LF 13.63 0.070 - 0.090 92 Ditto 10” dia LF 15.82 0.10 - 0.15 93 Ditto 12” dia LF 18.11 0.10 - 0.16 94 Ditto 14” dia LF 20.55 0.10 - 0.17 95 Ditto 16” dia LF 22.73 0.10 - 0.18 96 Ditto 18” dia LF 24.90 0.10 - 0.19 97 Ditto 20” dia LF 29.83 0.10 - 0.20 98 Ditto 24” dia LF 43.98 0.10 - 0.21 99 3” thick Cal-Sil insulation to 1” dia steel pipe, LF 8.24 0.060 - 0.080 excludes jacket 100 Ditto 1.50” dia LF 9.28 0.060 - 0.080 101 Ditto 2” dia LF 9.95 0.060 - 0.080 102 Ditto 3” dia LF 11.45 0.060 - 0.080 103 Ditto 4” dia LF 13.42 0.070 - 0.090 104 Ditto 6” dia LF 17.01 0.070 - 0.090 105 Ditto 8” dia LF 20.43 0.070 - 0.090 106 Ditto 10” dia LF 23.75 0.10 - 0.15 107 Ditto 12” dia LF 27.19 0.10 - 0.16 108 Ditto 14” dia LF 30.82 0.10 - 0.17 109 Ditto 16” dia LF 34.10 0.10 - 0.18 110 Ditto 18” dia LF 37.35 0.10 - 0.19 111 Ditto 20” dia LF 44.74 0.10 - 0.20 112 Ditto 24” dia LF 66.04 0.10 - 0.21 113 3” thick Cal-Sil insulation to 1” dia steel pipe, LF 8.24 0.060 - 0.080 excludes jacket 114 Ditto 1.50” dia LF 9.28 0.060 - 0.080
SAMPLE

SECTION 120 | 107.
Copyright © 2018 Compass International, Inc.
REF # DESCRIPTION / CATEGORY UNIT ASIA / PERSIAN GULF ASIA / PERSIAN GULF ONSHORE IN US $ OFFSHORE IN US $ CONTINUED17 REMOVAL OF SAFETY VALVES 17.1 Valves up to 2” size inlet Ea 18.29 67.8617.2 Valves - more than 2” to 6” Inlet Ea 26.14 88.5617.3 Valves - more than 6” to 10” Inlet Ea 97.75 126.5917.4 Valves - more than 10” Inlet Ea 103.43 154.63 18 REMOVAL OF SHUTDOWN VALVES 18.1 Valves up to 2” size inlet Ea 29.65 60.9618.2 Valves - more than 2” to 6” Inlet Ea 42.05 102.3718.3 Valves - more than 6” to 10” Inlet Ea 80.70 119.6718.4 Valves - more than 10” Inlet Ea 97.95 154.13 19 REMOVAL OF ORIFICES 19.1 Orifices in Flanges up to 2” size inlet Ea 19.32 60.9619.2 Orifices in Flanges valves - more than 2” to 8” inlet Ea 45.46 85.1119.3 Orifices in Flanges valves - more than 8” to 14” inlet Ea 64.79 102.3719.4 Orifices in Flanges valves - more than 14” inlet Ea 113.76 170.23 20 TERMINATION & GLANDING Ea 19.32 34.5821 JB INSTALLATION Ea 45.46 102.5322 PANEL INSTALLATION Ea 80.80 102.3723 HYDROTEST Ea 113.86 172.43
Steel Cost # DESCRIPTION UNIT $ COST MAX. $ COST MIN. REMARKS
1 Module Steel Material (FOB) Ton $2,895 $3,315 Assume greater than 1,000 Tons2 Jacket Steel Material (FOB) Ton $2,960 $3,410 Assume greater than 1,000 Tons3 Corrosion Resistant Alloy Ton $4,100 $7,370 Assume greater than 1,000 Tons (Super Duplex)
MAIN ELEMENTS / CHECK LIST OF OFFSHORE PLATFORM SCOPE ITEMS THAT NEED TO BE EVALUATED AND ESTIMATED:
Transport Issues: Distance from fabrication yard to mating location and tow out to final offshore loca-tion:
Weather window issues:Availability of Offshore Vessels:Structural Primary / Secondary Structural
Steel: this includes• All structural columns, beams, channels and
supports / girders:• Lifting pads, connection plates, steel decking
and tubular shapes:
• Stabbing pins, bumper guards, umbilical casing, J conductor guides and grating supports:
• Equipment supports, helipad main support steel framing:
• Handrails, ladders and crane boom foundations:Cathodic Protection Issues:Production Equipment / Modules: this includes• Pre-assemblies:• Modules:• Loose pumps and heat exchangers• Compressor items not in modules: Piping & Fittings / Valves: this includes• Pipe spools and loose fittings less than 2” diam-
eter:
SAMPLE
126. | SECTION 130
Copyright © 2018 Compass International, Inc.
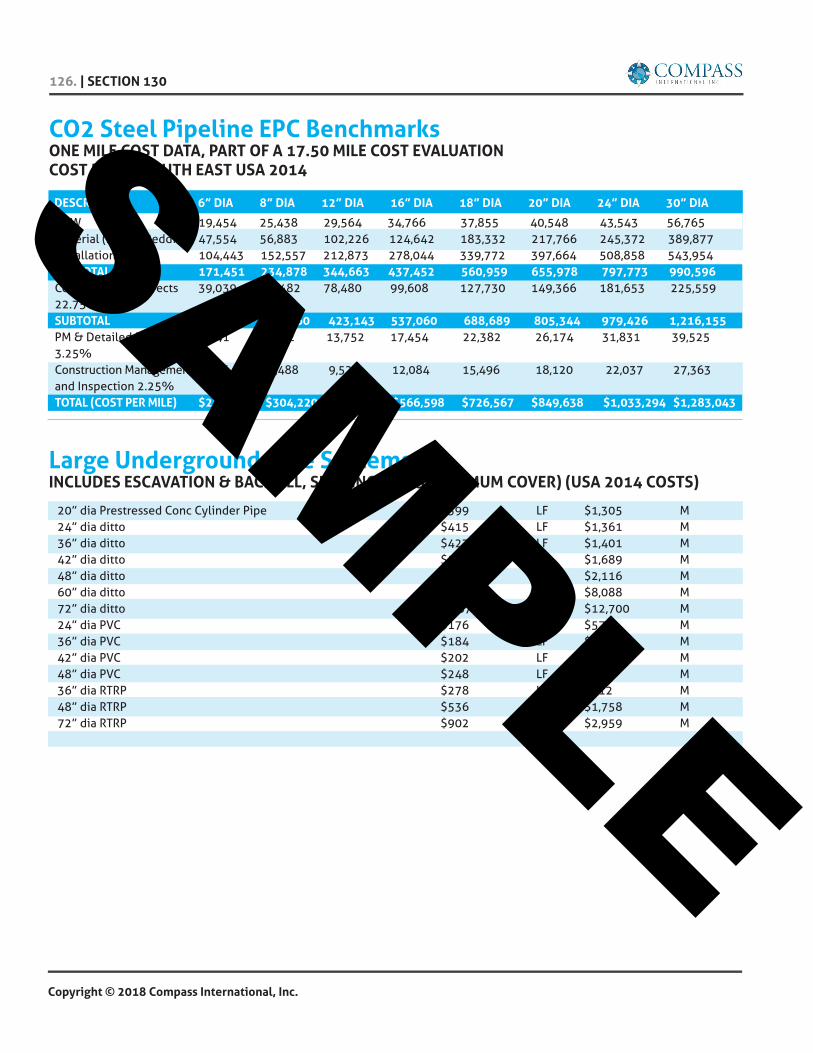
CO2 Steel Pipeline EPC Benchmarks ONE MILE COST DATA, PART OF A 17.50 MILE COST EVALUATIONCOST BASIS: SOUTH EAST USA 2014
DESCRIPTION 6” DIA 8” DIA 12” DIA 16” DIA 18” DIA 20” DIA 24” DIA 30” DIA ROW 19,454 25,438 29,564 34,766 37,855 40,548 43,543 56,765Material (Pipe & Bedding) 47,554 56,883 102,226 124,642 183,332 217,766 245,372 389,877Installation Labor 104,443 152,557 212,873 278,044 339,772 397,664 508,858 543,954SUBTOTAL 171,451 234,878 344,663 437,452 560,959 655,978 797,773 990,596Construction In-directs 39,039 53,482 78,480 99,608 127,730 149,366 181,653 225,55922.75%SUBTOTAL 210,490 288,360 423,143 537,060 688,689 805,344 979,426 1,216,155PM & Detailed Design 6,841 9,372 13,752 17,454 22,382 26,174 31,831 39,525 3.25%Construction Management 4,736 6,488 9,521 12,084 15,496 18,120 22,037 27,363and Inspection 2.25%TOTAL (COST PER MILE) $222,067 $304,220 $446,416 $566,598 $726,567 $849,638 $1,033,294 $1,283,043
Large Underground Pipe Systems INCLUDES ESCAVATION & BACKFILL, SHORING AND 3’ MINIMUM COVER) (USA 2014 COSTS)
20” dia Prestressed Conc Cylinder Pipe $399 LF $1,305 M24” dia ditto $415 LF $1,361 M36” dia ditto $427 LF $1,401 M42” dia ditto $515 LF $1,689 M48” dia ditto $645 LF $2,116 M60” dia ditto $2,466 LF $8,088 M72” dia ditto $3,872 LF $12,700 M24” dia PVC $176 LF $577 M36” dia PVC $184 LF $604 M42” dia PVC $202 LF $663 M48” dia PVC $248 LF $813 M36” dia RTRP $278 LF $912 M48” dia RTRP $536 LF $1,758 M72” dia RTRP $902 LF $2,959 M
SAMPLE

170. | SECTION 700
Copyright © 2018 Compass International, Inc.
REF # DESCRIPTION $ COST COMMENTS DESCRIPTION UNIT UNIT UNIT UNIT $ MATERIAL $ MATERIAL $ MATERIAL HOURS HOURS HOURS UNIT RATE UNIT RATE UNIT RATE -30% BASELINE +30% -30% BASELINE + 30%
CONTINUED 50 Supply & place Cu. Yd. 9.44 13.48 17.52 130.46 186.37 242.28 4,000 PSI water resistant concrete for walls, with sulfate- resisting cement. 51 Supply and place 4,000 Cu. Yd. 9.44 13.49 17.53 130.52 186.45 242.39 PSI concrete for walls, with sulfate-resisting cement. 52 Supply and place 4,000 Cu. Yd. 9.44 13.48 17.53 130.48 186.40 242.32 PSI water resistant concrete in walls, with sulfate-resisting cement 53 Supply and place 4,000 Cu. Yd. 16.03 22.90 29.77 150.54 215.05 279.57 PSI concrete for columns. 54 Supply and place 4,000 Cu. Yd. 11.32 16.18 21.03 136.22 194.60 252.98 PSI concrete for elevated beams. 55 Supply and place 4,000 Cu. Yd. 11.33 16.18 21.03 136.26 194.65 253.05 PSI concrete for elevated slabs, upper concrete surface horizontal or sloped areas. 56 Supply and place Cu. Yd. 18.83 26.90 34.97 158.94 227.06 295.17 4000 PSI concrete for stairs / small landings. 57 Supply and place Cu. Yd. 20.28 28.97 37.66 159.35 227.64 295.93 4000 PSI concrete for housekeeping pads, pedestals and curbs on ground and elevated slabs 58 Supply & place Cu. Yd. 47.22 67.46 87.70 237.63 339.47 441.31 4,000 PSI concrete for housekeeping pads pedestals and curbs on ground floor (SOG) and elevated slabs already cast and hardened including all supplementary work such as chipping the concrete slab, drilling of anchor holes for rebar connections, supply and epoxy coating / grout. 59 Fabricate and place Sq. Yd. 0.63 0.90 1.17 65.92 94.17 122.42 sawed timber FI formwork for single and continuous footings, foundation beams and slabs, pile caps, grade beams, lighting posts, etc.
SAMPLE

SECTION 700 | 185.
Copyright © 2018 Compass International, Inc.
69 kV electrical overhead single circuit electrical / transmission line in the USA would cost between costs approximately $300,000 to $350,000 per mile as opposed to $1.600,000 to $1,850,000 per mile for a new 69 kV underground electrical line, represent-ing a factor of more than 5. Following up on this comparison, a new 138 kV electrical overhead line costs approximately $400,000 to $450,000 per mile compared to $2,150,000 to $2,500,000 per mile for an underground electrical line, representing a factor of more than 5
The above costs are influenced by the loca-tion, i.e. rural or suburban situation, wooded areas, changes in direction, road crossings, level or hilly ground conditions, the cable run lengths, tie-ins / ter-mination locations and the number of supplementary services and support structures required.
Additional items that can add to the cost of bur-ied / underground power / transmission lines versus overhead electrical transmission / power lines are as follows:
• Demo of paving / roads and possible structures.• Repairs and making good to paving and road
area.• Road, rail and river crossing.• Loss of construction productivity due restric-
tions in built-up urban areas.• Planking & strutting / sheet piling to open
trenches.• Clashes and interfacing with other underground
services, such as gas, water, gas and sewers.Underground electrical transmission construc-
tion costs can be extremely location specific; this is usually the case for high voltage Overhead Electrical Transmission / Power Line applications, these plus a host of other issues will possibly influence the cost.
Various Types of Underground Electric Trans-mission Cable Lines:
CAMP COSTS (PER DAY) 2017 COST BASIS BASED ON 24 MONTH UTILIZATION:
Temporary worker campsites are many times required on large remote or inaccessible CAPEX projects. The logistics of lodging and feeding the construction workforce can be very challenging. The closest city and any hotels or lodging facilities might be more than 100 miles away from the actual construction site. Harsh conditions, such as jungle, deserts and arctic tundra may be in play, these is-sues, together with the intense weather conditions are issues to that need to be considered in the cost estimating cycle. Inadequate or a total lack of trans-portation systems or highways may be present, many times electricity and other utilities (water, gas and sewers) are absent, these issues together with a pos-sible scarcity of skilled workers typically lead to the decision that a temporary worker camp is required.
The following table (next page) depicts the day rate costs for different sizes of temporary worker camps, the data is based on new modular construc-tion, a combination of 2, 3 and 4 beds / persons per room, a shower, sink and toilet to each shared room, beds and bedding / towels provided and changed once a week, heat and air-conditioning, 2, 3 or 4 desks / chairs, chest of drawers, together with mid-sized refrigerator and one TV per room, one com-mon laundry, kitchen and lunch room per 40 work-ers. Day rate includes erection and dismantling of the modular buildings, maintenance, cleaning, guard services, cooks, restaurant workers and administra-tion staff.
The day rate also includes, (3) three meals per day (Breakfast and Evening meal, plus a brown bag lunch). Site preparation and construction of utili-ties are excluded. Note: USA / Canada and Western Europe should be considered as equal to a 1 or 2 star hotel, other locations typically are of a lesser stan-dard and quality, this of course drives the day rate down.
SAMPLE