sample call center peer group benchmark - amazon...
TRANSCRIPT

Company XYZCall Center Peer Group Benchmark
Company XYZ

Sample Report Only. Data is not accurate.Company XYZ Call Center Peer Group Benchmark
1
Report Contents
Project Overview and Objectives Page 2
Industry Background Page 34
Performance Benchmarking Summary Page 42
Interview Themes and Quotes Page 65
Conclusions and Recommendations Page 75
Detailed Benchmarking Comparisons Page 95
Cost and Price Metrics Page 96
Productivity Metrics Page 107
Service Level Metrics Page 116
Quality Metrics Page 123
Agent Metrics Page 130
Contact Handling Metrics Page 145
About MetricNet Page 150
© MetricNet, LLC, www.metricnet.com

Project Overview and Objectives
2
Company
XYZ

Company XYZ Call Center Peer Group BenchmarkSample Report Only. Data is not accurate.
Project Objectives
Review and assess the performance of the Company XYZ Call
Center
Benchmark the performance of Company XYZ against a peer group
of comparable Call Centers
Recommend strategies for improved performance
Achieve world-class levels of service
Maximize customer satisfaction
3© MetricNet, LLC, www.metricnet.com

Sample Report Only. Data is not accurate.Company XYZ Call Center Peer Group Benchmark
4© MetricNet, LLC, www.metricnet.com
Project Approach
Module 1: Company XYZ Baselining / Data Collection
Module 2: Benchmarking and Gap Analysis
Module 3: Balanced Scorecard
Module 4: Strategies for Improved Performance
Module 5: Report Development and Presentation of Results

Sample Report Only. Data is not accurate.Company XYZ Call Center Peer Group Benchmark
5
Module 1: Company XYZ Baselining/Data Collection
Core Topics
Project Kickoff
Data Collection
Interviews
© MetricNet, LLC, www.metricnet.com

Sample Report Only. Data is not accurate.Company XYZ Call Center Peer Group Benchmark
Project Kickoff Meeting
Company XYZ
6© MetricNet, LLC, www.metricnet.com
Key Objectives: Project Kickoff Meeting
• Introduce the MetricNet and Company
XYZ project teams
• Discuss the project schedule
• Distribute the data collection document
• Answer questions about the project

Sample Report Only. Data is not accurate.Company XYZ Call Center Peer Group Benchmark
7
Data Collection
© MetricNet, LLC, www.metricnet.com

Sample Report Only. Data is not accurate.Company XYZ Call Center Peer Group Benchmark
Interviews
8© MetricNet, LLC, www.metricnet.com
Interviews
• Agents, team leads, supervisors
• QA/QC, Workforce schedulers, trainers
Company XYZ

Sample Report Only. Data is not accurate.Company XYZ Call Center Peer Group Benchmark
Module 2: Benchmarking and Gap Analysis
Core Topics
Peer Group Selection
Benchmarking
Comparison
Gap Analysis
© MetricNet, LLC, www.metricnet.com 9

Sample Report Only. Data is not accurate.Company XYZ Call Center Peer Group Benchmark
Benchmarking Peer Group Selection
Read MetricNet’s whitepaper on Benchmarking Peer Group Selection. Go to www.metricnet.com to get your copy!
Scope
Complexity
Scale
Geography
IDEAL PEER
GROUP
10© MetricNet, LLC, www.metricnet.com

Sample Report Only. Data is not accurate.Company XYZ Call Center Peer Group Benchmark
Dynamic Peer Group Selection
Scope
Complexity
Scale
Geography
Scope refers to the services offered by the Call Center. The broader the scope of
services offered, the broader the skill set required by the agents. As scope
increases, so too does the cost of providing support. The Call Centers selected for
benchmarking comparison must be comparable in the scope of services offered.
Volume refers to the number of contacts handled by the Call Center. Virtually
everything in the Call Center is subject to scale economies. This is particularly true
when it comes to the volume of contacts handled. The approximate scale effect for
volume is 5%. What this means is that every time the number of transactions
doubles, you should expect to see the cost per contact decline by 5%. For this
reason, it is important to select benchmarking peer groups that are similar in scale.
The complexity of transactions handled will influence the handle time, and hence the
cost per transaction. For example, a password reset is a simple transaction that
takes very little time, and costs very little to resolve. By contrast, an inquiry for a
complex application like SAP takes much longer and costs much more to resolve.
MetricNet uses a proprietary algorithm to determine a weighted complexity index
based upon the mix of transactions handled by a Call Center. The companies
chosen for a benchmarking peer group will have similar complexity factors.
The main factor that is affected by geography is cost; specifically labor cost. Since
labor accounts for 65% of call center operating expense, it is important to
benchmark call centers that have a common geography. Even within a particular
geography, wage rates can differ significantly, so MetricNet makes adjustments to
ensure that each Call Center in a benchmarking peer group is normalized to the
same wage rate.
© MetricNet, LLC, www.metricnet.com 11

Sample Report Only. Data is not accurate.Company XYZ Call Center Peer Group Benchmark
12
Key Questions
How is your Call Center
performing?
How does your Call Center
compare to other comparable
Call Centers?
What are the strengths and
weaknesses of your Call Center?
What are the areas of
improvement for your
Call Center?
How can you enhance Call
Center performance and achieve
world-class status?
Call Center
Benchmark
Gap Analysis
Improvement
Recommendations
Realized
Performance Gains
Company XYZ Call
Center Data
MetricNet’s
Benchmarking
Database
Call Center Benchmark: Key Questions Answered
© MetricNet, LLC, www.metricnet.com

Sample Report Only. Data is not accurate.Company XYZ Call Center Peer Group Benchmark
13
Company XYZ Call
Center Performance
Performance of
Benchmarking Peer
Group
Determine How Best in Class Achieve
Superiority
Adopt Selected Practices of
Best in Class
Build a Sustainable Competitive Advantage
The ultimate
objective of
benchmarking
COMPARE
The Benchmarking Methodology
© MetricNet, LLC, www.metricnet.com
Read MetricNet’s whitepaper on Call Center Benchmarking. Go to www.metricnet.com to receive your copy!

Sample Report Only. Data is not accurate.Company XYZ Call Center Peer Group Benchmark
Summary of Included Benchmarking Metrics
Cost per Inbound Contact
Cost per Minute of Inbound
Handle Time
Price per Inbound Contact
Price per Minute of Handle Time
First Level Resolution Rate
Cost Productivity
Service Level
Quality
Call HandlingAgent
Average Speed of Answer
(ASA)
% of Calls Answered in 30
seconds
Call Abandonment Rate
Inbound Contacts per
Agent per Month
Agent Utilization
Agents as a % of Total
Headcount
Customer Satisfaction
First Contact Resolution Rate
Call Quality
Annual Agent Turnover
Daily Agent Absenteeism
Schedule Adherence
New Agent Training Hours
Annual Agent Training Hours
Agent Tenure
Agent Job Satisfaction
Inbound Contact Handle
Time
User Self-Service
Completion Rate
© MetricNet, LLC, www.metricnet.com 14

Sample Report Only. Data is not accurate.Company XYZ Call Center Peer Group Benchmark
15© MetricNet, LLC, www.metricnet.com
Benchmarking KPI Performance Summary
Average Min Median Max
Cost per Inbound Contact $8.42 $11.93 $7.09 $11.40 $20.50
Cost per Minute of Inbound Handle Time $1.46 $1.64 $1.03 $1.54 $2.43
Price per Inbound Contact (PC Helps) $14.59 $15.84 $7.54 $14.62 $24.28
Price per Minute of Handle Time (PC Helps) $1.87 $2.07 $1.25 $2.02 $3.51
First Level Resolution Rate N/A 82.3% 73.7% 82.9% 97.5%
Inbound Contacts per Agent per Month 910 591 329 574 910
Agent Utilization 54.9% 48.1% 30.8% 50.3% 62.7%
Agents as a % of Total Headcount 79.0% 84.5% 75.2% 83.5% 93.7%
Average Speed of Answer (ASA) (seconds) 124 71 20 71 129
% of Calls Answered in 30 Seconds 2.6% 43.9% 2.6% 44.4% 85.8%
Call Abandonment Rate 15.3% 6.4% 1.1% 5.9% 15.3%
Call Quality N/A 83.7% 65.1% 83.9% 94.5%
First Contact Resolution Rate 57.6% 71.6% 57.6% 70.4% 91.4%
Customer Satisfaction 87.6% 78.2% 63.1% 76.1% 96.7%
Annual Agent Turnover 31.3% 40.7% 13.6% 40.3% 65.6%
Daily Agent Absenteeism 10.3% 10.8% 4.7% 10.1% 24.2%
Schedule Adherence 89.7% 83.4% 72.7% 83.8% 90.8%
New Agent Training Hours 100 128 67 125 238
Annual Agent Training Hours 24 16 0 12 74
Agent Tenure (months) 25.0 33.2 17.6 28.2 86.9
Agent Job Satisfaction 99.0% 70.3% 53.3% 66.8% 99.0%
Inbound Contact Handle Time (minutes) 5.75 7.18 5.29 7.35 9.08
User Self-Serve Completion Rate 0.0% 9.2% 0.0% 7.9% 25.2%
Service Level
Quality
Agent
Contact Handling
Peer Group Statistics
Productivity
Company
XYZKey Performance Indicator (KPI)Metric Type
Cost

Sample Report Only. Data is not accurate.Company XYZ Call Center Peer Group Benchmark
16
Cost vs. Quality for Company XYZ Call Center
© MetricNet, LLC, www.metricnet.com
Lower CostCost (Efficiency)
Qu
alit
y (
Effe
ctiveness)
Top Quartile
Efficient and Effective
Lower Quartile
Middle Quartiles
Effective but not Efficient
Middle Quartiles
Efficient but not Effective
Higher Cost
Lower
Quality
Higher
Quality
Company
XYZ
Call Center
Global
Database

Sample Report Only. Data is not accurate.Company XYZ Call Center Peer Group Benchmark
17
Module 3: Balanced Scorecard
© MetricNet, LLC, www.metricnet.com
Core Topics
Metrics Selection
Metric Weightings
Scorecard Construction

Sample Report Only. Data is not accurate.Company XYZ Call Center Peer Group Benchmark
18© MetricNet, LLC, www.metricnet.com
The Call Center Scorecard: An Overview
The Call Center scorecard employs a methodology that provides
you with a single, all-inclusive measure of your Call Center
performance
It combines cost, service level, productivity, and quality metrics into
an overall performance indicator for your Call Center
Your Call Center score will range between 0 and 100%, and can be
compared directly to the scores of other Call Centers in the
benchmark
By computing your overall score on a monthly or quarterly basis, you
can track and trend your performance over time
Charting and tracking your Call Center score is an ideal way to
ensure continuous improvement in your Call Center!

Sample Report Only. Data is not accurate.Company XYZ Call Center Peer Group Benchmark
Worst Case Best Case
Cost per Inbound Contact 25.0% $20.50 $7.09 $8.42 90.1% 22.5%
Customer Satisfaction 25.0% 63.1% 96.7% 87.6% 72.9% 18.2%
Agent Utilization 15.0% 30.8% 62.7% 54.9% 75.5% 11.3%
First Contact Resolution Rate 15.0% 57.6% 91.4% 57.6% 0.0% 0.0%
Agent Job Satisfaction 10.0% 53.3% 99.0% 99.0% 100.0% 10.0%
% of Calls Answered in 30 Seconds 10.0% 2.6% 85.8% 2.6% 0.0% 0.0%
Total 100.0% N/A N/A N/A N/A 62.1%
Performance Metric
Metric
Weighting
Performance Range Your
Performance Metric Score
Balanced
Score
Step 2
Each metric has been
weighted according to its
relative importance
The Call Center Scorecard
Step 1
Six critical
performance
metrics have been
selected for the
scorecard
Step 3
For each performance
metric, the highest and
lowest performance levels
in the benchmark are
recorded
Step 4
Your actual
performance for
each metric is
recorded in this
column
Step 5
Your score for
each metric is then
calculated: (worst
case – actual
performance) /
(worst case – best
case) X 100
Step 6
Your balanced score for each
metric is calculated: metric
score X weighting
19

Sample Report Only. Data is not accurate.Company XYZ Call Center Peer Group Benchmark
20© MetricNet, LLC, www.metricnet.com
Balanced Scorecard Summary*
*The scores shown in the chart are based upon the performance metrics, weightings, and data ranges shown on the previous page.
20.0%
25.0%
30.0%
35.0%
40.0%
45.0%
50.0%
55.0%
60.0%
65.0%
70.0%
6 9 21 13 XYZ 22 3 5 18 14 11 1 7 8 19 20 10 12 2 17 16 15 4
Bala
nced
Sco
res
Call Center
High 63.8%
Average ----- 50.2%
Median 47.2%
Low 31.6%
Company XYZ 62.1%
Key Statistics
Call Center Scores

Sample Report Only. Data is not accurate.Company XYZ Call Center Peer Group Benchmark
21© MetricNet, LLC, www.metricnet.com
Scorecard Performance Rankings
Overall Ranking
Call Center
Number
Cost per Inbound
Contact
Customer
Satisfaction Agent Utilization
First Contact
Resolution Rate
Agent Job
Satisfaction
% of Calls
Answered in 30
Seconds
Total Balanced
Score
1 6 $17.55 90.2% 50.8% 91.4% 88.3% 53.1% 63.8%
2 9 $8.18 84.7% 52.4% 68.5% 74.7% 40.3% 63.2%
3 21 $17.93 96.7% 35.2% 90.0% 89.8% 73.0% 62.7%
4 13 $12.00 85.2% 48.5% 78.8% 78.5% 60.2% 62.5%
5 Company XYZ $8.42 87.6% 54.9% 57.6% 99.0% 2.6% 62.1%
6 22 $8.32 79.4% 55.5% 73.1% 71.8% 27.4% 60.4%
7 3 $8.44 81.8% 56.9% 71.1% 66.8% 17.1% 59.4%
8 5 $8.34 74.2% 47.9% 70.4% 65.6% 62.1% 54.5%
9 18 $9.24 74.6% 53.3% 71.1% 65.3% 44.4% 53.8%
10 14 $13.09 75.2% 52.6% 72.3% 72.3% 49.1% 49.3%
11 11 $7.09 72.2% 57.8% 64.8% 53.3% 16.4% 49.3%
12 1 $10.26 76.0% 47.8% 67.5% 66.2% 29.8% 47.2%
13 7 $10.53 66.2% 52.9% 72.9% 66.0% 53.0% 46.9%
14 8 $13.69 81.4% 36.3% 75.1% 66.8% 60.4% 46.6%
15 19 $13.99 86.7% 45.3% 68.7% 55.3% 37.8% 46.1%
16 20 $8.25 63.1% 47.5% 69.1% 61.7% 65.8% 45.2%
17 10 $12.59 76.1% 50.3% 68.1% 72.2% 23.7% 44.9%
18 12 $10.22 67.3% 62.7% 63.5% 57.0% 23.6% 43.2%
19 2 $12.45 78.2% 39.8% 69.1% 63.2% 42.4% 42.5%
20 17 $15.65 82.0% 42.3% 66.7% 68.0% 50.0% 41.5%
21 16 $11.40 68.9% 50.8% 67.8% 57.6% 35.4% 40.1%
22 15 $16.27 75.2% 33.7% 74.9% 79.2% 56.6% 38.1%
23 4 $20.50 75.5% 30.8% 73.2% 78.3% 85.8% 31.6%
Average $11.93 78.2% 48.1% 71.6% 70.3% 43.9% 50.2%
Max $20.50 96.7% 62.7% 91.4% 99.0% 85.8% 63.8%
Min $7.09 63.1% 30.8% 57.6% 53.3% 2.6% 31.6%
Median $11.40 76.1% 50.3% 70.4% 66.8% 44.4% 47.2%
Scorecard Metrics
Key Statistics

Sample Report Only. Data is not accurate.Company XYZ Call Center Peer Group Benchmark
22© MetricNet, LLC, www.metricnet.com
KPI Data in Rank Order
Cost per Inbound
Contact
Customer
Satisfaction Agent Utilization
First Contact
Resolution Rate
Agent Job
Satisfaction
% of Calls
Answered in 30
Seconds
Total Balanced
Score
Company XYZ $8.42 87.6% 54.9% 57.6% 99.0% 2.6% 62.1%
Ranking 6 3 5 23 1 23 5
Quartile 1 1 1 4 1 4 1
1 $7.09 96.7% 62.7% 91.4% 99.0% 85.8% 63.8%
2 $8.18 90.2% 57.8% 90.0% 89.8% 73.0% 63.2%
3 $8.25 87.6% 56.9% 78.8% 88.3% 65.8% 62.7%
4 $8.32 86.7% 55.5% 75.1% 79.2% 62.1% 62.5%
5 $8.34 85.2% 54.9% 74.9% 78.5% 60.4% 62.1%
6 $8.42 84.7% 53.3% 73.2% 78.3% 60.2% 60.4%
7 $8.44 82.0% 52.9% 73.1% 74.7% 56.6% 59.4%
8 $9.24 81.8% 52.6% 72.9% 72.3% 53.1% 54.5%
9 $10.22 81.4% 52.4% 72.3% 72.2% 53.0% 53.8%
10 $10.26 79.4% 50.8% 71.1% 71.8% 50.0% 49.3%
11 $10.53 78.2% 50.8% 71.1% 68.0% 49.1% 49.3%
12 $11.40 76.1% 50.3% 70.4% 66.8% 44.4% 47.2%
13 $12.00 76.0% 48.5% 69.1% 66.8% 42.4% 46.9%
14 $12.45 75.5% 47.9% 69.1% 66.2% 40.3% 46.6%
15 $12.59 75.2% 47.8% 68.7% 66.0% 37.8% 46.1%
16 $13.09 75.2% 47.5% 68.5% 65.6% 35.4% 45.2%
17 $13.69 74.6% 45.3% 68.1% 65.3% 29.8% 44.9%
18 $13.99 74.2% 42.3% 67.8% 63.2% 27.4% 43.2%
19 $15.65 72.2% 39.8% 67.5% 61.7% 23.7% 42.5%
20 $16.27 68.9% 36.3% 66.7% 57.6% 23.6% 41.5%
21 $17.55 67.3% 35.2% 64.8% 57.0% 17.1% 40.1%
22 $17.93 66.2% 33.7% 63.5% 55.3% 16.4% 38.1%
23 $20.50 63.1% 30.8% 57.6% 53.3% 2.6% 31.6%
Average $11.93 78.2% 48.1% 71.6% 70.3% 43.9% 50.2%
Max $20.50 96.7% 62.7% 91.4% 99.0% 85.8% 63.8%
Min $7.09 63.1% 30.8% 57.6% 53.3% 2.6% 31.6%
Median $11.40 76.1% 50.3% 70.4% 66.8% 44.4% 47.2%
Scorecard Metrics

Sample Report Only. Data is not accurate.Company XYZ Call Center Peer Group Benchmark
*Sample Only
40%
45%
50%
55%
60%
65%
70%
75%
80%
85%
Jan Feb Mar Apr May Jun Jul Aug Sep Oct Nov Dec
Call
Cen
ter
Ba
lan
ce
d S
co
re
12 Month Average Monthly Score
23© MetricNet, LLC, www.metricnet.com
The Scorecard Can be Updated Monthly*
*Sample Only

Sample Report Only. Data is not accurate.Company XYZ Call Center Peer Group Benchmark
Module 4: Strategies for Improved Performance
Core Components
Conclusions and
Recommendations
Roadmap for World-
Class Performance
24© MetricNet, LLC, www.metricnet.com

Sample Report Only. Data is not accurate.Company XYZ Call Center Peer Group Benchmark
Conclusions and Recommendations
Conclusions and Recommendations fall into six
categories
1. Strategy
2. Human Resource Management
3. Call Handling Processes and Procedures
4. Technology
5. Performance Measurement and Management
6. Stakeholder Communication
25© MetricNet, LLC, www.metricnet.com

Sample Report Only. Data is not accurate.Company XYZ Call Center Peer Group Benchmark
A Summary of the Major KPI Correlations
Cost per Contact Customer Satisfaction
Agent
Utilization
First
Contact
Resolution
Agent
Satisfaction
Coaching Career Path Training Hours
Call
Quality
Handle
Time
Agents/
Total FTE’s
Absenteeism/
Turnover
First Level
ResolutionScheduling
Efficiency
Service Levels:
ASA and AR
26© MetricNet, LLC, www.metricnet.com

Sample Report Only. Data is not accurate.Company XYZ Call Center Peer Group Benchmark
27
Cost vs. Quality for Global Call Centers
Lower CostCost (Efficiency)
Qualit
y (
Effectiveness)
Top Quartile
Efficient and Effective
Lower Quartile
Middle Quartiles
Effective but not Efficient
Middle Quartiles
Efficient but not Effective
World-Class
Call Centers
Peer Group
Higher Cost
Lower
Quality
Higher
Quality
© MetricNet, LLC, www.metricnet.com

Sample Report Only. Data is not accurate.Company XYZ Call Center Peer Group Benchmark
Performance Targets will be Established
Achieving the performance targets recommended above will increase the Company XYZ Balanced
Score from 62.1% to 74.3%, and put Company XYZ in the top position on the Balanced Scorecard.
Performance MetricCurrent
Performance
Target
Performance
First Contact Resolution Rate 57.6% 75.0%
First Level Resolution Rate N/A 85.0%
Average Speed of Answer (ASA) (seconds) 124 90
% of Calls Answered in 30 Seconds 2.6% 40.0%
Call Abandonment Rate 15.3% 7.0%
New Agent Training Hours 100 140
Call Center Balanced Score 62.1% 74.3%
28© MetricNet, LLC, www.metricnet.com

Sample Report Only. Data is not accurate.Company XYZ Call Center Peer Group Benchmark
29
Module 5: Report Development and Presentation of Results
Core Topics
Conclusions and
Recommendations
Report Development
Presentation of
Benchmarking Results
© MetricNet, LLC, www.metricnet.com

Sample Report Only. Data is not accurate.Company XYZ Call Center Peer Group Benchmark
30
Write Benchmarking Report
© MetricNet, LLC, www.metricnet.com

Sample Report Only. Data is not accurate.Company XYZ Call Center Peer Group Benchmark
Presentation of Results
Company XYZ
31© MetricNet, LLC, www.metricnet.com
The results of the benchmark will be presented in a live webcast

Sample Report Only. Data is not accurate.Company XYZ Call Center Peer Group Benchmark
Summary of Deliverables
Deliverables include…
Project Participation Kit:
Project Schedule
Data collection questionnaires
Project Kickoff Meeting
Telephone Interviews
Comprehensive Assessment and Benchmarking Report
Project Overview and Objectives
Industry Background
Benchmarking Performance Summary
Balanced Scorecard
Interview Themes and Quotes
Conclusions and Recommendations
Detailed Benchmarking Data
Live Webcast Presentation of Results via GoTo Meeting
32© MetricNet, LLC, www.metricnet.com

Sample Report Only. Data is not accurate.Company XYZ Call Center Peer Group Benchmark
33
Benchmarking Schedule
© MetricNet, LLC, www.metricnet.com

Industry Background
34
Company
XYZ

Sample Report Only. Data is not accurate.Company XYZ Call Center Peer Group Benchmark
35
Growing importance of
customer contact!
Every
Company
Faces
Increasing
Pressure
from
Numerous
Sources
Industry
Consolidation
Increased Regulatory
Scrutiny (e.g. SOX)
The emergence of virtual business
One-Stop Shopping
Shareholder pressure
Budgetary
constraints
Increasingly demanding customers
Greater customer choice and leverage
An Industry in Transition
•
•
•
•
•
•
© MetricNet, LLC, www.metricnet.com

Sample Report Only. Data is not accurate.Company XYZ Call Center Peer Group Benchmark
36
Customer expectation is that you
are available 24 X 7, and provide
flawless service, on demand!
Yet most companies have minimal
direct contact with their customers
JAN FEB MAR APR MAY JUN JUL AUG SEP OCT NOV DEC
8760 Hours
Customer Contact
7 - 22 minutes/yr.Moment of Truth Opportunity!
Customer Contact: A Critical Interface!
© MetricNet, LLC, www.metricnet.com

Sample Report Only. Data is not accurate.Company XYZ Call Center Peer Group Benchmark
37
Call center is a source of value creation
Customer contact is a company and product differentiator
Replacement for traditional bricks & mortar facilities
Stay ahead of customer needs and expectations –proactive!
Goal is customer enthusiasm, product differentiation, and customer aggregation
NEW PARADIGM
A Fundamental Shift
Call center is a support
function
Customer contact is a
necessary evil
Supplement to traditional
bricks & mortar facilities
Play catch up with
customer needs and
expectations – reactive!
Goal is customer
satisfaction
OLD PARADIGM
Building a Service-Based Competitive Advantage!
© MetricNet, LLC, www.metricnet.com

Sample Report Only. Data is not accurate.Company XYZ Call Center Peer Group Benchmark
38
Contact Centers Must Evolve to Survive
Progression along this dimension is critical to success
Call centers that stay in one place too long risk obsolescence
The most effective call centers continually strive to add more value by moving to the right along this axis
World-class call centers also have specific plans for how they will continuously improve the quality of contact with their customers
Customer needs
and
requirements are
evolving too
quickly
Continuously
differentiate the
underlying
products
supported
Staying ahead of
customer needs
and expectations
Competitors can
exploit any
complacency
marked by a call
center’s failure to
evolve
Support Stage Transitional Stage Strategic Stage
© MetricNet, LLC, www.metricnet.com

Sample Report Only. Data is not accurate.Company XYZ Call Center Peer Group Benchmark
39
67%
29%
4%
Support Stage Transitional Stage Strategic Stage
Traditional customer
contact paradigm
The call center makes a shift
from following the customer to
leading the customer
The call center operates in a
non-traditional customer
contact paradigm – every
transaction adds value!
How Far Has Your Contact Center Evolved?
© MetricNet, LLC, www.metricnet.com

Sample Report Only. Data is not accurate.Company XYZ Call Center Peer Group Benchmark
Characteristics of a World-Class Contact Center
Contact center consistently exceeds customer expectations – regardless of the
transaction type
Result is high levels of customer satisfaction
Call quality is consistently high
Business value is managed at or above industry average levels
Cost per contact is below industry average levels
Revenue generated is above industry average levels
Telemarketing and Telesales
Debt collections
Contact Center follows industry best practices
Industry best practices are defined and documented
Contact Center follows industry best practices
Every transaction adds value
A positive customer experience
Improves customer loyalty
Creates positive brand awareness and switching costs
40© MetricNet, LLC, www.metricnet.com

Sample Report Only. Data is not accurate.Company XYZ Call Center Peer Group Benchmark
41
The World-Class Contact Center Defined
Cost per Contact HigherLower
HigherA World-Class Contact Center
An “Average” Contact
Center
BEST-IN-CLASS
PERFORMANCE CURVE
AVERAGE PERFORMANCE CURVE
© MetricNet, LLC, www.metricnet.com
Performance Benchmarking Summary
42
Company
XYZ

Sample Report Only. Data is not accurate.Company XYZ Call Center Peer Group Benchmark
19
Company XYZ Call Center Overview
© MetricNet, LLC, www.metricnet.com
Primary Agents 687.51 Customer Information System (CIS) Siebel (Version 7)
Supervisor/Team Lead 48.71 Customer Relationship Management (CRM) Allstate (Internal)
Manager 10.87 Automatic Call Distributor (ACD) Avaya
QA/QC, Call Quality, and
Performance Measurement8.01 Workforce Management System/Software Aspect (Version 6.4)
Training 13.84 Interactive Voice Response (IVR) Syntellect, Nuance, Avaya
Workforce Scheduling 6.54 Knowledge Management System Allstate (Internal)
Core Administrators 7.00 Private Branch Exchange (PBX) Avaya
Administrative Secretaries 2.97 Computer Telephony Integration Siebel
Total FTE Headcount 785.45 Predictive Dialer Noble
Call Quality (e.g. Witness, Dictaphone, etc.) eLoyalty
Other Technologies usedAIM Call (Version 6.5)
Centerbridge, Knowlagent
Technology Profile
313,255
FTE Headcount
Monthly Contact Volume
Contact Center Location(s) Anytown, USA
$49,188,715
Hours of Operation Mon - Sat 7:00 AM - 1:00 AM EST and Sun 9:00 AM - 9:00 PM EST
Annual Operating Budget

Sample Report Only. Data is not accurate.Company XYZ Call Center Peer Group Benchmark
Summary of Included Benchmarking Metrics
Cost per Inbound Contact
Cost per Minute of Inbound
Handle Time
Price per Inbound Contact
Price per Minute of Handle Time
First Level Resolution Rate
Cost Productivity
Service Level
Quality
Call HandlingAgent
Average Speed of Answer
(ASA)
% of Calls Answered in 30
seconds
Call Abandonment Rate
Inbound Contacts per
Agent per Month
Agent Utilization
Agents as a % of Total
Headcount
Customer Satisfaction
First Contact Resolution Rate
Call Quality
Annual Agent Turnover
Daily Agent Absenteeism
Schedule Adherence
New Agent Training Hours
Annual Agent Training Hours
Agent Tenure
Agent Job Satisfaction
Inbound Contact Handle
Time
User Self-Service
Completion Rate
© MetricNet, LLC, www.metricnet.com 44

Company XYZ Call Center Peer Group BenchmarkSample Report Only. Data is not accurate.
Benchmarking KPI Performance Summary
45© MetricNet, LLC, www.metricnet.com
Average Min Median Max
Cost per Inbound Contact $8.42 $11.93 $7.09 $11.40 $20.50
Cost per Minute of Inbound Handle Time $1.46 $1.64 $1.03 $1.54 $2.43
Price per Inbound Contact (PC Helps) $14.59 $15.84 $7.54 $14.62 $24.28
Price per Minute of Handle Time (PC Helps) $1.87 $2.07 $1.25 $2.02 $3.51
First Level Resolution Rate N/A 82.3% 73.7% 82.9% 97.5%
Inbound Contacts per Agent per Month 910 591 329 574 910
Agent Utilization 54.9% 48.1% 30.8% 50.3% 62.7%
Agents as a % of Total Headcount 79.0% 84.5% 75.2% 83.5% 93.7%
Average Speed of Answer (ASA) (seconds) 124 71 20 71 129
% of Calls Answered in 30 Seconds 2.6% 43.9% 2.6% 44.4% 85.8%
Call Abandonment Rate 15.3% 6.4% 1.1% 5.9% 15.3%
Call Quality N/A 83.7% 65.1% 83.9% 94.5%
First Contact Resolution Rate 57.6% 71.6% 57.6% 70.4% 91.4%
Customer Satisfaction 87.6% 78.2% 63.1% 76.1% 96.7%
Annual Agent Turnover 31.3% 40.7% 13.6% 40.3% 65.6%
Daily Agent Absenteeism 10.3% 10.8% 4.7% 10.1% 24.2%
Schedule Adherence 89.7% 83.4% 72.7% 83.8% 90.8%
New Agent Training Hours 100 128 67 125 238
Annual Agent Training Hours 24 16 0 12 74
Agent Tenure (months) 25.0 33.2 17.6 28.2 86.9
Agent Job Satisfaction 99.0% 70.3% 53.3% 66.8% 99.0%
Inbound Contact Handle Time (minutes) 5.75 7.18 5.29 7.35 9.08
User Self-Serve Completion Rate 0.0% 9.2% 0.0% 7.9% 25.2%
Service Level
Quality
Agent
Contact Handling
Peer Group Statistics
Productivity
Company
XYZKey Performance Indicator (KPI)Metric Type
Cost

Company XYZ Call Center Peer Group BenchmarkSample Report Only. Data is not accurate.
KPI Gap Summary
46© MetricNet, LLC, www.metricnet.com
Peer
Average
Cost per Inbound Contact $8.42 $11.93 29.4%
Cost per Minute of Inbound Handle Time $1.46 $1.64 10.7%
Price per Inbound Contact (PC Helps) $14.59 $15.84 7.9%
Price per Minute of Handle Time (PC Helps) $1.87 $2.07 9.7%
First Level Resolution Rate N/A 82.3% N/A
Inbound Contacts per Agent per Month 910 591 54.0%
Agent Utilization 54.9% 48.1% 14.2%
Agents as a % of Total Headcount 79.0% 84.5% -6.5%
Average Speed of Answer (ASA) (seconds) 124 71 -75.1%
% of Calls Answered in 30 Seconds 2.6% 43.9% -94.1%
Call Abandonment Rate 15.3% 6.4% -140.2%
Call Quality N/A 83.7% N/A
First Contact Resolution Rate 57.6% 71.6% -19.5%
Customer Satisfaction 87.6% 78.2% 12.0%
Annual Agent Turnover 31.3% 40.7% 23.3%
Daily Agent Absenteeism 10.3% 10.8% 5.0%
Schedule Adherence 89.7% 83.4% 7.5%
New Agent Training Hours 100 128 -21.9%
Annual Agent Training Hours 24 16 46.4%
Agent Tenure (months) 25.0 33.2 -24.7%
Agent Job Satisfaction 99.0% 70.3% 40.8%
Inbound Contact Handle Time (minutes) 5.75 7.18 19.9%
User Self-Serve Completion Rate 0.0% 9.2% -100.0%
Agent
Contact Handling
Cost
Productivity
Performance
GapMetric Type Key Performance Indicator (KPI) Company XYZ
Service Level
Quality

Company XYZ Call Center Peer Group BenchmarkSample Report Only. Data is not accurate.
47© MetricNet, LLC, www.metricnet.com
KPI Gap Ranking
Peer
Average
Inbound Contacts per Agent per Month 910 591 54.0%
Annual Agent Training Hours 24 16 46.4%
Agent Job Satisfaction 99.0% 70.3% 40.8%
Cost per Inbound Contact $8.42 $11.93 29.4%
Annual Agent Turnover 31.3% 40.7% 23.3%
Inbound Contact Handle Time (minutes) 5.75 7.18 19.9%
Agent Utilization 54.9% 48.1% 14.2%
Customer Satisfaction 87.6% 78.2% 12.0%
Cost per Minute of Inbound Handle Time $1.46 $1.64 10.7%
Price per Minute of Handle Time (PC Helps) $1.87 $2.07 9.7%
Price per Inbound Contact (PC Helps) $14.59 $15.84 7.9%
Schedule Adherence 89.7% 83.4% 7.5%
Daily Agent Absenteeism 10.3% 10.8% 5.0%
First Level Resolution Rate N/A 82.3% N/A
Call Quality N/A 83.7% N/A
Agents as a % of Total Headcount 79.0% 84.5% -6.5%
First Contact Resolution Rate 57.6% 71.6% -19.5%
New Agent Training Hours 100 128 -21.9%
Agent Tenure (months) 25.0 33.2 -24.7%
Average Speed of Answer (ASA) (seconds) 124 71 -75.1%
% of Calls Answered in 30 Seconds 2.6% 43.9% -94.1%
User Self-Serve Completion Rate 0.0% 9.2% -100.0%
Call Abandonment Rate 15.3% 6.4% -140.2%
Key Performance Indicator (KPI) Company XYZ Performance Gap

Sample Report Only. Data is not accurate.Company XYZ Call Center Peer Group Benchmark
48© MetricNet, LLC, www.metricnet.com
Quartile Rankings: Cost and Productivity Metrics
Cost Metric
Quartile Your Call
Center
Performance
1
2 3 (Bottom)
4
(Top)
Cost per Inbound Contact$7.09 $8.43 $11.40 $13.84
$8.42$8.43 $11.40 $13.84 $20.50
$1.39 $1.54 $1.87 $2.43
$1.87
$1.46
Price per Inbound Contact (PC Helps)$7.54 $13.23 $14.62
Cost per Minute of Inbound Handle Time$1.03 $1.39 $1.54
$13.23 $14.62 $19.16 $24.28
$19.16
$14.59
$1.69 $2.02 $2.20 $3.51
$2.20
$1.87
First Level Resolution Rate97.5% 86.1% 82.9%
Price per Minute of Handle Time (PC
Helps)
$1.25 $1.69 $2.02
86.1% 82.9% 77.2% 73.7%
77.2%
N/A
Productivity Metric
Quartile Your Call
Center
Performance
1
2 3
4
(Bottom)(Top)
Inbound Contacts per Agent per Month910 665 574 483
910665 574 483 329
53.1% 50.3% 43.8% 30.8%
43.8%
54.9%
Agents as a % of Total Headcount93.7% 89.7% 83.5%
Agent Utilization62.7% 53.1% 50.3%
89.7% 83.5% 80.1% 75.2%
80.1%
79.0%

Company XYZ Call Center Peer Group BenchmarkSample Report Only. Data is not accurate.
49© MetricNet, LLC, www.metricnet.com
Quartile Rankings: Service Level and Quality Metrics
Service Level Metric
Quartile Your Call
Center
Performance
1
2 3
4
(Bottom)(Top)
Average Speed of Answer (ASA)
(seconds)
20 49 71 90
12449 71 90 129
58.4% 44.4% 28.6% 2.6%
28.6%
2.6%
Call Abandonment Rate1.1% 3.9% 5.9%
% of Calls Answered in 30 Seconds85.8% 58.4% 44.4%
3.9% 5.9% 9.0% 15.3%
9.0%
15.3%
Quality Metric
Quartile Your Call
Center
Performance
1
2 3
4
(Bottom)(Top)
Call Quality94.5% 90.1% 83.9% 78.5%
N/A90.1% 83.9% 78.5% 65.1%
73.2% 70.4% 68.0% 57.6%
68.0%
57.6%
Customer Satisfaction96.7% 83.4% 76.1%
First Contact Resolution Rate91.4% 73.2% 70.4%
83.4% 76.1% 74.4% 63.1%
74.4%
87.6%

Company XYZ Call Center Peer Group BenchmarkSample Report Only. Data is not accurate.
50© MetricNet, LLC, www.metricnet.com
Quartile Rankings: Agent Metrics
Agent Performance Metric
Quartile Your Call
Center
Performance
1
2 3
4
(Bottom)(Top)
Annual Agent Turnover13.6% 34.8% 40.3% 48.8%
31.3%34.8% 40.3% 48.8% 65.6%
6.8% 10.1% 12.7% 24.2%
12.7%
10.3%
Schedule Adherence90.8% 85.7% 83.8%
Daily Agent Absenteeism4.7% 6.8% 10.1%
85.7% 83.8% 80.2% 72.7%
80.2%
89.7%
153 125 100 67
100
100
Annual Agent Training Hours74 24 12
New Agent Training Hours238 153 125
24 12 0 0
0
24
36.7 28.2 23.6 17.6
23.6
25.0
Agent Job Satisfaction99.0% 76.5% 66.8%
Agent Tenure (months)86.9 36.7 28.2
76.5% 66.8% 64.3% 53.3%
64.3%
99.0%

Company XYZ Call Center Peer Group BenchmarkSample Report Only. Data is not accurate.
51© MetricNet, LLC, www.metricnet.com
Quartile Rankings: Contact Handling Metrics
Contact Handling Metric
Quartile Your Call
Center
Performance
1
2 3
4
(Bottom)(Top)
Inbound Contact Handle Time (minutes)5.29 6.60 7.35 7.77
5.756.60 7.35 7.77 9.08
User Self-Serve Completion Rate25.2% 14.1% 7.9%
14.1% 7.9% 1.8% 0.0%
1.8%
0.0%

Sample Report Only. Data is not accurate.Company XYZ Call Center Peer Group Benchmark
52© MetricNet, LLC, www.metricnet.com
The Call Center Scorecard: An Overview
The Call Center scorecard employs a methodology that provides you with a
single, all-inclusive measure of your Call Center performance
It combines cost, service level, productivity, and quality metrics into an
overall performance indicator for your Call Center
Your Call Center score will range between 0 and 100%, and can be
compared directly to the scores of other Call Centers in the benchmark
By computing your overall score on a monthly or quarterly basis, you can
track and trend your performance over time
Charting and tracking your Call Center score is an ideal way to ensure
continuous improvement in your Call Center!

Sample Report Only. Data is not accurate.Company XYZ Call Center Peer Group Benchmark
Worst Case Best Case
Cost per Inbound Contact 25.0% $20.50 $7.09 $8.42 90.1% 22.5%
Customer Satisfaction 25.0% 63.1% 96.7% 87.6% 72.9% 18.2%
Agent Utilization 15.0% 30.8% 62.7% 54.9% 75.5% 11.3%
First Contact Resolution Rate 15.0% 57.6% 91.4% 57.6% 0.0% 0.0%
Agent Job Satisfaction 10.0% 53.3% 99.0% 99.0% 100.0% 10.0%
% of Calls Answered in 30 Seconds 10.0% 2.6% 85.8% 2.6% 0.0% 0.0%
Total 100.0% N/A N/A N/A N/A 62.1%
Performance Metric
Metric
Weighting
Performance Range Your
Performance Metric Score
Balanced
Score
Step 2
Each metric has been
weighted according to its
relative importance
The Company XYZ Call Center Scorecard
Step 1
Six critical
performance
metrics have been
selected for the
scorecard
Step 4
Your actual
performance for
each metric is
recorded in this
column
Step 5
Your score for
each metric is then
calculated: (worst
case – actual
performance) /
(worst case – best
case) X 100
Step 6
Your balanced score for each
metric is calculated: metric
score X weighting
53
Step 3
For each performance
metric, the highest and
lowest performance levels
in the benchmark are
recorded

Sample Report Only. Data is not accurate.Company XYZ Call Center Peer Group Benchmark
54© MetricNet, LLC, www.metricnet.com
Balanced Scorecard Summary*
*The scores shown in the chart are based upon the performance metrics, weightings, and data ranges shown on the previous page.
20.0%
25.0%
30.0%
35.0%
40.0%
45.0%
50.0%
55.0%
60.0%
65.0%
70.0%
6 9 21 13 XYZ 22 3 5 18 14 11 1 7 8 19 20 10 12 2 17 16 15 4
Bala
nced
Sco
res
Call Center
High 63.8%
Average ----- 50.2%
Median 47.2%
Low 31.6%
Company XYZ 62.1%
Key Statistics
Call Center Scores

Sample Report Only. Data is not accurate.Company XYZ Call Center Peer Group Benchmark
55© MetricNet, LLC, www.metricnet.com
Peer Group Scorecard Summary Data
The next two pages illustrate the benchmarking peer
group performance for each KPI in the scorecard
Page 56 ranks each Call Center from best performer
(Call Center #6) to worst performer (Call Center #4)
based upon their balanced scores
Page 57 ranks each KPI in the scorecard from best (top
row) to worst (bottom row)

Sample Report Only. Data is not accurate.Company XYZ Call Center Peer Group Benchmark
56© MetricNet, LLC, www.metricnet.com
Scorecard Performance Rankings
Overall Ranking
Call Center
Number
Cost per Inbound
Contact
Customer
Satisfaction Agent Utilization
First Contact
Resolution Rate
Agent Job
Satisfaction
% of Calls
Answered in 30
Seconds
Total Balanced
Score
1 6 $17.55 90.2% 50.8% 91.4% 88.3% 53.1% 63.8%
2 9 $8.18 84.7% 52.4% 68.5% 74.7% 40.3% 63.2%
3 21 $17.93 96.7% 35.2% 90.0% 89.8% 73.0% 62.7%
4 13 $12.00 85.2% 48.5% 78.8% 78.5% 60.2% 62.5%
5 Company XYZ $8.42 87.6% 54.9% 57.6% 99.0% 2.6% 62.1%
6 22 $8.32 79.4% 55.5% 73.1% 71.8% 27.4% 60.4%
7 3 $8.44 81.8% 56.9% 71.1% 66.8% 17.1% 59.4%
8 5 $8.34 74.2% 47.9% 70.4% 65.6% 62.1% 54.5%
9 18 $9.24 74.6% 53.3% 71.1% 65.3% 44.4% 53.8%
10 14 $13.09 75.2% 52.6% 72.3% 72.3% 49.1% 49.3%
11 11 $7.09 72.2% 57.8% 64.8% 53.3% 16.4% 49.3%
12 1 $10.26 76.0% 47.8% 67.5% 66.2% 29.8% 47.2%
13 7 $10.53 66.2% 52.9% 72.9% 66.0% 53.0% 46.9%
14 8 $13.69 81.4% 36.3% 75.1% 66.8% 60.4% 46.6%
15 19 $13.99 86.7% 45.3% 68.7% 55.3% 37.8% 46.1%
16 20 $8.25 63.1% 47.5% 69.1% 61.7% 65.8% 45.2%
17 10 $12.59 76.1% 50.3% 68.1% 72.2% 23.7% 44.9%
18 12 $10.22 67.3% 62.7% 63.5% 57.0% 23.6% 43.2%
19 2 $12.45 78.2% 39.8% 69.1% 63.2% 42.4% 42.5%
20 17 $15.65 82.0% 42.3% 66.7% 68.0% 50.0% 41.5%
21 16 $11.40 68.9% 50.8% 67.8% 57.6% 35.4% 40.1%
22 15 $16.27 75.2% 33.7% 74.9% 79.2% 56.6% 38.1%
23 4 $20.50 75.5% 30.8% 73.2% 78.3% 85.8% 31.6%
Average $11.93 78.2% 48.1% 71.6% 70.3% 43.9% 50.2%
Max $20.50 96.7% 62.7% 91.4% 99.0% 85.8% 63.8%
Min $7.09 63.1% 30.8% 57.6% 53.3% 2.6% 31.6%
Median $11.40 76.1% 50.3% 70.4% 66.8% 44.4% 47.2%
Scorecard Metrics
Key Statistics

Sample Report Only. Data is not accurate.Company XYZ Call Center Peer Group Benchmark
57© MetricNet, LLC, www.metricnet.com
KPI Data in Rank Order
Cost per Inbound
Contact
Customer
Satisfaction Agent Utilization
First Contact
Resolution Rate
Agent Job
Satisfaction
% of Calls
Answered in 30
Seconds
Total Balanced
Score
Company XYZ $8.42 87.6% 54.9% 57.6% 99.0% 2.6% 62.1%
Ranking 6 3 5 23 1 23 5
Quartile 1 1 1 4 1 4 1
1 $7.09 96.7% 62.7% 91.4% 99.0% 85.8% 63.8%
2 $8.18 90.2% 57.8% 90.0% 89.8% 73.0% 63.2%
3 $8.25 87.6% 56.9% 78.8% 88.3% 65.8% 62.7%
4 $8.32 86.7% 55.5% 75.1% 79.2% 62.1% 62.5%
5 $8.34 85.2% 54.9% 74.9% 78.5% 60.4% 62.1%
6 $8.42 84.7% 53.3% 73.2% 78.3% 60.2% 60.4%
7 $8.44 82.0% 52.9% 73.1% 74.7% 56.6% 59.4%
8 $9.24 81.8% 52.6% 72.9% 72.3% 53.1% 54.5%
9 $10.22 81.4% 52.4% 72.3% 72.2% 53.0% 53.8%
10 $10.26 79.4% 50.8% 71.1% 71.8% 50.0% 49.3%
11 $10.53 78.2% 50.8% 71.1% 68.0% 49.1% 49.3%
12 $11.40 76.1% 50.3% 70.4% 66.8% 44.4% 47.2%
13 $12.00 76.0% 48.5% 69.1% 66.8% 42.4% 46.9%
14 $12.45 75.5% 47.9% 69.1% 66.2% 40.3% 46.6%
15 $12.59 75.2% 47.8% 68.7% 66.0% 37.8% 46.1%
16 $13.09 75.2% 47.5% 68.5% 65.6% 35.4% 45.2%
17 $13.69 74.6% 45.3% 68.1% 65.3% 29.8% 44.9%
18 $13.99 74.2% 42.3% 67.8% 63.2% 27.4% 43.2%
19 $15.65 72.2% 39.8% 67.5% 61.7% 23.7% 42.5%
20 $16.27 68.9% 36.3% 66.7% 57.6% 23.6% 41.5%
21 $17.55 67.3% 35.2% 64.8% 57.0% 17.1% 40.1%
22 $17.93 66.2% 33.7% 63.5% 55.3% 16.4% 38.1%
23 $20.50 63.1% 30.8% 57.6% 53.3% 2.6% 31.6%
Average $11.93 78.2% 48.1% 71.6% 70.3% 43.9% 50.2%
Max $20.50 96.7% 62.7% 91.4% 99.0% 85.8% 63.8%
Min $7.09 63.1% 30.8% 57.6% 53.3% 2.6% 31.6%
Median $11.40 76.1% 50.3% 70.4% 66.8% 44.4% 47.2%
Scorecard Metrics

Sample Report Only. Data is not accurate.Company XYZ Call Center Peer Group Benchmark
58© MetricNet, LLC, www.metricnet.com
Scorecard Metrics: Cost per Inbound Contact
$0.00
$2.00
$4.00
$6.00
$8.00
$10.00
$12.00
$14.00
$16.00
$18.00
$20.00
$22.00
11 9 20 22 5 XYZ 3 18 12 1 7 16 13 2 10 14 8 19 17 15 6 21 4
Co
st
per
Inb
ou
nd
Co
nta
ct
Call Center
High $20.50
Average ----- $11.93
Median $11.40
Low $7.09
Company XYZ $8.42
Key Statistics
Cost per Inbound Contact

Sample Report Only. Data is not accurate.Company XYZ Call Center Peer Group Benchmark
50.0%
55.0%
60.0%
65.0%
70.0%
75.0%
80.0%
85.0%
90.0%
95.0%
100.0%
21 6 XYZ 19 13 9 17 3 8 22 2 10 1 4 14 15 18 5 11 16 12 7 20
Cu
sto
mer
Sati
sfa
cti
on
Call Center
59© MetricNet, LLC, www.metricnet.com
Scorecard Metrics: Customer Satisfaction
High 96.7%
Average ----- 78.2%
Median 76.1%
Low 63.1%
Company XYZ 87.6%
Key Statistics
Customer Satisfaction

Sample Report Only. Data is not accurate.Company XYZ Call Center Peer Group Benchmark
© MetricNet, LLC, www.metricnet.com
Scorecard Metrics: Agent Utilization
20.0%
25.0%
30.0%
35.0%
40.0%
45.0%
50.0%
55.0%
60.0%
65.0%
12 11 3 22 XYZ 18 7 14 9 6 16 10 13 5 1 20 19 17 2 8 21 15 4
Ag
en
t U
tilizati
on
Call Center
High 62.7%
Average ----- 48.1%
Median 50.3%
Low 30.8%
Company XYZ 54.9%
Key Statistics
Agent Utilization
60

Sample Report Only. Data is not accurate.Company XYZ Call Center Peer Group Benchmark
61© MetricNet, LLC, www.metricnet.com
Scorecard Metrics: First Contact Resolution Rate
45.0%
50.0%
55.0%
60.0%
65.0%
70.0%
75.0%
80.0%
85.0%
90.0%
95.0%
6 21 13 8 15 4 22 7 14 3 18 5 2 20 19 9 10 16 1 17 11 12 XYZ
Fir
st
Co
nta
ct
Reso
luti
on
Rate
Call Center
High 91.4%
Average ----- 71.6%
Median 70.4%
Low 57.6%
Company XYZ 57.6%
Key Statistics
First Contact Resolution Rate

Sample Report Only. Data is not accurate.Company XYZ Call Center Peer Group Benchmark
62© MetricNet, LLC, www.metricnet.com
Scorecard Metrics: Agent Job Satisfaction
50.0%
55.0%
60.0%
65.0%
70.0%
75.0%
80.0%
85.0%
90.0%
95.0%
100.0%
XYZ 21 6 15 13 4 9 14 10 22 17 3 8 1 7 5 18 2 20 16 12 19 11
Ag
en
t Jo
b S
ati
sfa
cti
on
Call Center
High 99.0%
Average ----- 70.3%
Median 66.8%
Low 53.3%
Company XYZ 99.0%
Key Statistics
Agent Job Satisfaction

Sample Report Only. Data is not accurate.Company XYZ Call Center Peer Group Benchmark
63© MetricNet, LLC, www.metricnet.com
Scorecard Metrics: % of Calls Answered in 30 Seconds
0.0%
10.0%
20.0%
30.0%
40.0%
50.0%
60.0%
70.0%
80.0%
90.0%
4 21 20 5 8 13 15 6 7 17 14 18 2 9 19 16 1 22 10 12 3 11 XYZ
% o
f C
alls A
nsw
ere
d in
30 S
eco
nd
s
Call Center
High 85.8%
Average ----- 43.9%
Median 44.4%
Low 2.6%
Company XYZ 2.6%
Key Statistics
% of Calls Answered in 30
Seconds

Sample Report Only. Data is not accurate.Company XYZ Call Center Peer Group Benchmark
64
Cost vs. Quality for Company XYZ Call Center
© MetricNet, LLC, www.metricnet.com
Lower CostCost (Efficiency)
Qu
alit
y (
Effe
ctiveness)
Top Quartile
Efficient and Effective
Lower Quartile
Middle Quartiles
Effective but not Efficient
Middle Quartiles
Efficient but not Effective
Higher Cost
Lower
Quality
Higher
Quality
Company
XYZ
Call Center
Global
Database

Interview Themes and Quotes
65
Company
XYZ

Sample Report Only. Data is not accurate.Company XYZ Call Center Peer Group Benchmark
66© MetricNet, LLC, www.metricnet.com
MetricNet Conducted Fifteen Company XYZ Interviews
Company XYZ Interviewee List Title
Employee A Title 01
Employee B Title 02
Employee C Title 03
Employee D Title 04
Employee E Title 05
Employee F Title 06
Employee G Title 07
Employee H Title 08
Employee I Title 09
Employee J Title 10
Employee K Title 11
Employee L Title 12
Employee M Title 13
Employee N Title 14
Employee O Title 15

Sample Report Only. Data is not accurate.Company XYZ Call Center Peer Group Benchmark
67© MetricNet, LLC, www.metricnet.com
A majority of the interviewees agree that the agents are stressed and
overwhelmed due to the high call volume
There is a general consensus that the Call Center needs more agents to handle
the increasing call volume
The lack of space in the Call Center department is viewed as a concern
A majority of the interviewees would like to see improved communication
between the Call Center and the other IT groups
Everyone agrees that finding information within the knowledge base is difficult
and this increases the time spent on calls
Most interviewees have expressed their concern over the long call waiting time
Everyone would like to see the Call Center develop a more efficient way to
handle the call volume
There is a general feeling that management does not listen to the concerns of
the Call Center
Some interviewees expressed the need to have more in-depth training on the
applications and programs that are supported
Key Themes from Company XYZ Interviews

Sample Report Only. Data is not accurate.Company XYZ Call Center Peer Group Benchmark
68© MetricNet, LLC, www.metricnet.com
“The agents work hard to resolve the issues of the customers.”
“The Call Center needs to build a better partnership with the other IT teams, so that
increases in call volume can be anticipated.”
“It is frustrating that the Call Center is getting additional call volume from the Telecom
group without the capability to troubleshoot the issues.”
“It is a running joke that management won’t spend money on the Call Center. Some agents
joke about it while others are angered by it.”
“The Call Center is not taken seriously as a department. It is hard to prove the worth of the
Call Center in the organization.”
“Whenever there is an I.S. outing or get-together, the Call Center can only send 2-3 people
because there won’t be enough agents left to handle the calls.”
“The Call Center is constantly complimented on how well the agents resolve customer
issues. This is why upper management does not think that anything needs to be fixed.”
“It would be nice to have a bigger and more ventilated workspace.”
“The customers would not be waiting in queue for 10-20 minutes if there were enough
agents.”
“The request for more staff has been turned down several times. The morale is low
because management is sending more work without providing sufficient resources or
tools.”
Representative Comments from Company XYZ Interviews

Sample Report Only. Data is not accurate.Company XYZ Call Center Peer Group Benchmark
69© MetricNet, LLC, www.metricnet.com
“The agents have good teamwork and get along well with each other.”
“The password reset tool needs to be improved, so that the call can be resolved quickly
and agents can accept additional calls.”
“It would be more effective to have an actual training space where the agents can focus on
the training materials and not be bothered by distractions.”
“More in-depth training in applications and programs will help the agents troubleshoot the
issues and will result in higher First Call Resolution.”
“The performance goals on knowledge base contributions and project assignments are
unfair because there isn’t enough time to work on these due to the high call volume.”
“The result of the Associate Satisfaction survey does not reflect the true satisfaction level of
the agents. The agents only give a high rating in this survey because based on previous
experience, scoring low will only produce more work for the agents.”
“The agents on the day shift are completely overwhelmed with the volume of calls. The
agents are constantly stressed, tired and exhausted at the end of the day.”
“Being busy is good, but being busy and overwhelmed are two different things.”
“The agents come in sick to avoid causing additional stress on the other agents. Having
more agents will allow the sick agents to take a day off instead of coming to work sick and
spreading the virus.”
“The resolution rate is low because the agents are not trained on the new programs.”
Representative Comments from Company XYZ Interviews

Sample Report Only. Data is not accurate.Company XYZ Call Center Peer Group Benchmark
70© MetricNet, LLC, www.metricnet.com
“The customer survey results are sometimes low not because the customer dealt with a
bad agent, but because the customer waited in queue for so long.”
“The agents get a lot of calls to resolve issues on Macs, iPads and iPhones. Having
access to these devices would help the agents understand and resolve issues better.”
“There needs to be more levels of support within the Call Center.”
“There are a lot of access restrictions preventing agents from resolving simple issues.”
“When new technologies are introduced, the IT group responsible should train the Call
Center, so that the agents will know what to do when the customers call in with issues.”
“The agents are rushing through the tickets to get to the calls and some mistakes occur
because of this.”
“Not having a true knowledge base can be a struggle. It affects the agents’ ability to have
First Call Resolution and it affects the amount of time it takes to resolve issues. This is
frustrating for both the agent and the caller.”
“The customers need to be more aware of Company XYZ’s online tools.”
“The agents are well prepared to handle difficult customers.”
“The Call Center would like upper management to have a better perspective of how hard
the agents work.”
“The agents maintain good humored despite the stressful work environment.”
Representative Comments from Company XYZ Interviews

Sample Report Only. Data is not accurate.Company XYZ Call Center Peer Group Benchmark
71© MetricNet, LLC, www.metricnet.com
“Having more space, more resources and a true knowledge base will help reduce the
agents’ stress level.”
“There needs to be a clear career path for advancement and for moving to a different
position and department.”
“The Call Center needs to find an efficient way to handle the call volume.”
“It is difficult to find information in the knowledge base because people call the same thing
different names. Using Excel’s “Find” option does not give an accurate result.”
“The leadership needs to come up with a consistent model for support.”
“The Call Center feels discouraged because the leadership does not listen to the concerns
of the Call Center.”
“There are ongoing training sessions for the veteran agents, but these are not formalized.”
“It would be nice for the agents to understand the environment in which the customers
work.”
“The agents are so customer-oriented that the agents sometimes sacrifice break time just
to answer the calls.”
“If the call volume was manageable, agents would want to stay with Company XYZ longer.
Some agents have left the Call Center due to the overwhelming amount of work.”
Representative Comments from Company XYZ Interviews

Sample Report Only. Data is not accurate.Company XYZ Call Center Peer Group Benchmark
72© MetricNet, LLC, www.metricnet.com
“The Call Center is constantly finding ways to streamline the current processes.”
“When the call volume is high, the morale goes down and the stress level goes up.”
“The Call Center does not feel treated as part of the IT team.”
“The agents are held accountable for their performance and are advised of any corrective
actions needed.”
“It is frustrating for a doctor to be on queue for so long especially when a patient is waiting.
It could be a life or death situation.”
“The Application team does not cooperate with the Call Center. Management needs to
make the Application team work more seamlessly with the Call Center.”
“The abandonment rate is high because the Call Center does not have enough agents to
take the calls.”
“The Call Center needs to come up with an easier process for documenting critical incident
reports so that the same information is not documented 2-3 times in different places. It
takes 10 minutes in between calls to be able to document this properly.”
“There are monthly meetings between the agents and supervisors where the agents are
given feedback by the supervisors.”
“The agents are trained to focus on the customer’s issues, but sometimes this is difficult
when the customer is constantly berating the agent for being on hold for a long time.”
“The other IT departments don’t respect the Call Center.”
Representative Comments from Company XYZ Interviews

Sample Report Only. Data is not accurate.Company XYZ Call Center Peer Group Benchmark
73© MetricNet, LLC, www.metricnet.com
“The Call Center needs to identify what the key indicators should be and what the actual
measurements should look like.”
“There needs to be more structure within the Call Center. The Call Center needs to identify
what it can and cannot do.”
“A lot of the Call Center processes are 9-10 years old. These need to be reviewed and
improved upon.”
“More customers will be frustrated if the Call Center does not address the long queue
times.”
“The agents would like to have more responsibilities. The agents are not allowed to tackle
certain tasks because the other IT teams do not think that the Call Center is capable.”
“The performance goals may be too demanding based on the Call Center environment and
the fact that the staffing ratio is inadequate.”
“Some agents come in without knowing where to sit for the day. This is a stressful way to
start the day.”
“The Call Center can’t afford to have ongoing training for the agents because there are not
enough agents on the phones.”
“The Call Center needs a strong leadership that knows how to run a Call Center and can
help guide the staff to go in that direction.”
Representative Comments from Company XYZ Interviews

Sample Report Only. Data is not accurate.Company XYZ Call Center Peer Group Benchmark
74© MetricNet, LLC, www.metricnet.com
“The First Call Resolution goal is not reasonable because there are a lot of things that the
Call Center can do but are not allowed to do. It is unfair to hold this against the agents
when the agents are not allowed to resolve certain issues.”
“Telecommuting will help address the Call Center’s lack of space.”
“Management needs to promote what the Call Center does to the rest of the company. The
customers need to know what to expect from the Call Center.”
“The ticketing system needs to be integrated with the knowledge base, so that when the
agents type in the subject of the ticket, it can immediately start listing information.”
“There needs to be a better focus on the services being provided by the Call Center.”
“The agents would feel better if upper management verbally acknowledges the challenges
faced by the Call Center.”
“The Call Center does not have a specific mission, vision, purpose or definition of what we
are supposed to be doing. How can we hit a target that is not yet defined?
“When new technologies are introduced, there isn’t a good way of maintaining that
knowledge in the Call Center.”
“The agents try to address the calls as quickly as possible without trying to rush the caller.”
“The agents’ performance goals are reasonable. The performance goals are adjusted
based on the call volume and the environment.”
Representative Comments from Company XYZ Interviews

Conclusions and Recommendations
Company
XYZ
75
Sample Report Only. Data is not accurate.Company XYZ Call Center Peer Group Benchmark
76© MetricNet, LLC, www.metricnet.com
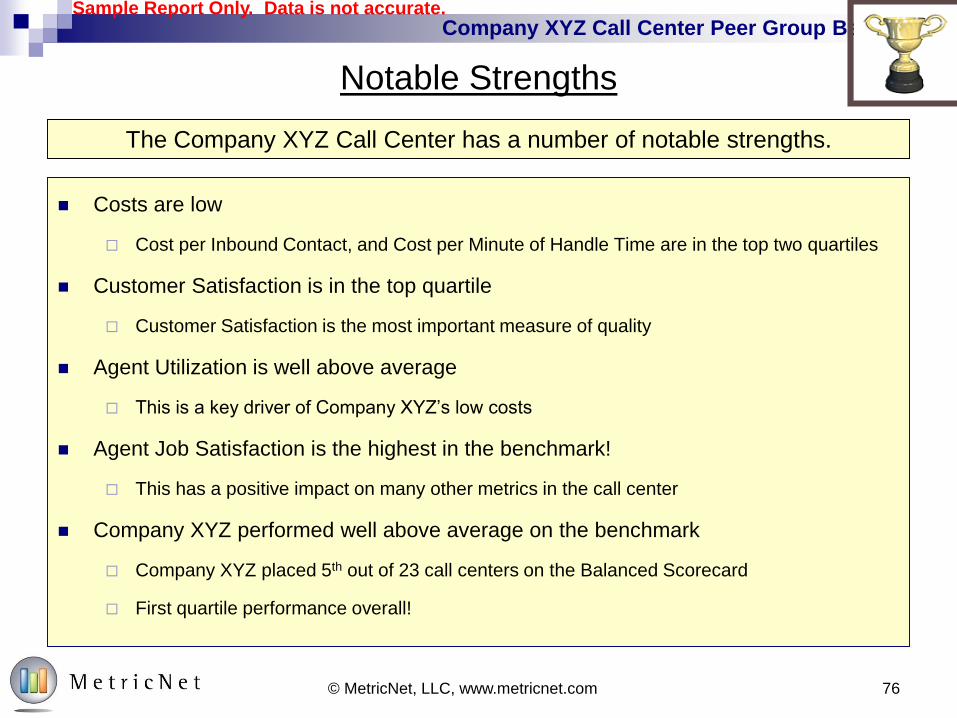
Notable Strengths
Costs are low
Cost per Inbound Contact, and Cost per Minute of Handle Time are in the top two quartiles
Customer Satisfaction is in the top quartile
Customer Satisfaction is the most important measure of quality
Agent Utilization is well above average
This is a key driver of Company XYZ’s low costs
Agent Job Satisfaction is the highest in the benchmark!
This has a positive impact on many other metrics in the call center
Company XYZ performed well above average on the benchmark
Company XYZ placed 5th out of 23 call centers on the Balanced Scorecard
First quartile performance overall!
The Company XYZ Call Center has a number of notable strengths.

Sample Report Only. Data is not accurate.Company XYZ Call Center Peer Group Benchmark
77© MetricNet, LLC, www.metricnet.com
But Opportunities for Improvement Remain
Service Levels are universally weak
All Company XYZ service levels are in the 4th quartile
First Contact Resolution is the lowest in the benchmark
FCR is an important driver of Customer Satisfaction
Some Agent metrics are weak
New Agent Training Hours are in the 4th quartile
Agent Absenteeism and Tenure are in the 3rd quartile
Many interviewees opined that a lack of recognition and investment in the
Call Center has created a number of problems, including:
Poor integration into the IT department, understaffing, inadequate training,
ineffective knowledgebase, access restrictions, and limited career options

Sample Report Only. Data is not accurate.Company XYZ Call Center Peer Group Benchmark
Summary of Benchmarking Recommendations
1. Consider transitioning to a Call Center model that emphasizes Level 1 incident resolution
2. Offer additional agent training that is oriented specifically towards improving First Contact and
First Level Resolution Rates
3. Develop and document a formal career path for call center agents
4. Consider adding additional agent headcount to improve service levels and First Contact/First
Level Resolution Rates
Four additional agents would be needed to bring Company XYZ into alignment with industry average
headcount figures
This would also enable agents to spend more time adding solutions to the knowledgebase
5. Consider adopting the MetricNet Call Center Balanced Scorecard, and update the scorecard
monthly
6. Develop an internal communication program to improve the visibility and reputation of the
Company XYZ Call Center
7. Work on improving process maturity and compliance with industry best practices
78© MetricNet, LLC, www.metricnet.com

Company XYZ Call Center Peer Group BenchmarkSample Report Only. Data is not accurate.
Level 1 Resolution is the Biggest Driver of Call Center TCO
Support Level Cost per Ticket
Vendor
Level 2: Desktop Support
Field Support
Level 3 IT
(apps, networking, NOC, etc.)
Level 1: Call Center
$471
$196
$85
$62
$22
© MetricNet, LLC, www.metricnet.com 79

Company XYZ Call Center Peer Group BenchmarkSample Report Only. Data is not accurate.
0%
10%
20%
30%
40%
50%
60%
70%
80%
90%
100%
0 50 100 150 200 250 300 350
New Agent Training Hours
Fir
st C
on
tact R
eso
lutio
n R
ate
Training Can Improve First Contact Resolution Rates
© MetricNet, LLC, www.metricnet.com 80

Company XYZ Call Center Peer Group BenchmarkSample Report Only. Data is not accurate.
0%
10%
20%
30%
40%
50%
60%
70%
80%
90%
100%
0 20 40 60 80 100 120 140
Veteran Agent Training Hours
Fir
st C
on
tact R
eso
lutio
n R
ate
Training Can Improve First Contact Resolution Rates (contd.)
© MetricNet, LLC, www.metricnet.com 81

Sample Report Only. Data is not accurate.Company XYZ Call Center Peer Group Benchmark
Training and Career Pathing are Key to Improving Agent Effectiveness
Cost per Contact Customer Satisfaction
Agent
UtilizationFirst
Contact
Resolution
Agent
Satisfaction
Coaching Career Path Training Hours
Call
Quality
Handle
Time
Agents/
Total FTE’sAbsenteeism/
Turnover
First Level
ResolutionScheduling
Efficiency
Service Levels:
ASA and AR
82© MetricNet, LLC, www.metricnet.com

Sample Report Only. Data is not accurate.Company XYZ Call Center Peer Group Benchmark
Some Suggested Performance Targets
Achieving the performance targets recommended above will increase the Company XYZ Balanced
Score from 62.1% to 74.3%, and put Company XYZ in the top position on the Balanced Scorecard.
Performance MetricCurrent
Performance
Target
Performance
First Contact Resolution Rate 57.6% 75.0%
First Level Resolution Rate N/A 85.0%
Average Speed of Answer (ASA) (seconds) 124 90
% of Calls Answered in 30 Seconds 2.6% 40.0%
Call Abandonment Rate 15.3% 7.0%
New Agent Training Hours 100 140
Call Center Balanced Score 62.1% 74.3%
83© MetricNet, LLC, www.metricnet.com

Sample Report Only. Data is not accurate.Company XYZ Call Center Peer Group Benchmark
Worst Case Best Case
Cost per Inbound Contact 25.0% $20.50 $7.09 $8.42 90.1% 22.5%
Customer Satisfaction 25.0% 63.1% 96.7% 87.6% 72.9% 18.2%
Technician Utilization 15.0% 30.8% 62.7% 54.9% 75.5% 11.3%
First Contact Resolution Rate 15.0% 57.6% 91.4% 57.6% 0.0% 0.0%
Technician Job Satisfaction 10.0% 53.3% 99.0% 99.0% 100.0% 10.0%
% of Calls Answered in 30 Seconds 10.0% 2.6% 85.8% 2.6% 0.0% 0.0%
Total 100.0% N/A N/A N/A N/A 62.1%
Performance Metric
Metric
Weighting
Performance Range Your
Performance Metric Score
Balanced
Score
84© MetricNet, LLC, www.metricnet.com
Consider Adopting the Call Center Balanced Scorecard
Step 1
Six critical
performance
metrics have been
selected for the
scorecard
Step 2
Each metric has been
weighted according to its
relative importance
Step 3
For each performance
metric, the highest and
lowest performance levels
in the benchmark are
recorded
Step 4
Your actual
performance for
each metric is
recorded in this
column
Step 5
Your score for
each metric is then
calculated: (worst
case – actual
performance) /
(worst case –best
case) X 100
Step 6
Your balanced score for each
metric is calculated: metric
score X weighting
84

Company XYZ Call Center Peer Group BenchmarkSample Report Only. Data is not accurate.
And Update the Scorecard Monthly
40%
45%
50%
55%
60%
65%
70%
75%
80%
85%
Jan Feb Mar Apr May Jun Jul Aug Sep Oct Nov Dec
Call
Cen
ter
Ba
lan
ce
d S
co
re
12 Month Average Monthly Score
© MetricNet, LLC, www.metricnet.com 85

Sample Report Only. Data is not accurate.Company XYZ Call Center Peer Group Benchmark
86© MetricNet, LLC, www.metricnet.com
Internal Communication: Positioning Company XYZ for Future Success
LOWER COST HIGHERACTUAL VALUE
PE
RC
EIV
ED
VA
LU
E
HIGHER
LOWER
Perceived Value > Actual Value
Perceived Value < Actual Value

Company XYZ Call Center Peer Group BenchmarkSample Report Only. Data is not accurate.
Where Does the Company XYZ Call Center Operate?
LOWER COST HIGHERACTUAL VALUE
PE
RC
EIV
ED
VA
LU
E
HIGHER
LOWER
Perceived Value > Actual Value
Perceived Value < Actual Value
A Common (but
Dangerous) Operating
Position
87© MetricNet, LLC, www.metricnet.com

Company XYZ Call Center Peer Group BenchmarkSample Report Only. Data is not accurate.
Operational Effectiveness First!
LOWER COST HIGHERACTUAL VALUE
PE
RC
EIV
ED
VA
LU
E
HIGHER
LOWER
Perceived Value > Actual Value
Perceived Value < Actual Value
#1 Operational
Effectiveness
#2 B
rand
Managem
ent
88© MetricNet, LLC, www.metricnet.com

Company XYZ Call Center Peer Group BenchmarkSample Report Only. Data is not accurate.
Closing the Perception vs. Reality Gap
LOWER COST HIGHERACTUAL VALUE
PE
RC
EIV
ED
VA
LU
E
HIGHER
LOWER
Perceived Value > Actual Value
Perceived Value < Actual Value
Closing
the
Perception
Gap
Where you Should Be
Where you Are
89© MetricNet, LLC, www.metricnet.com

Sample Report Only. Data is not accurate.Company XYZ Call Center Peer Group Benchmark
90© MetricNet, LLC, www.metricnet.com
Image Management: The Five W’s
1. Who – Who are the Key Stakeholder Groups?
2. What – What are the Key Messages?
3. When – When are You Going to Communicate Them?
4. Where/How – Where/How do You Reach the Stakeholders?
5. Why – Why are We Doing This?

Sample Report Only. Data is not accurate.Company XYZ Call Center Peer Group Benchmark
91© MetricNet, LLC, www.metricnet.com
Key Success Factors in Call Center Image Management
MessagesTim
ing
Timing
Frequent Contact• New employee orientation
• At session log-in
• During training
• During the incident
• At scheduled sessions
Messages
Multiple Messages• Services
• Major initiatives
• Performance Levels
• FAQ’s
• Success Stories
Channels
Use All Available
• Log-in messages
• Newsletters
• Reference Guides
• Asset tags
• Surveys
• User liaisons
Tim
ing

Sample Report Only. Data is not accurate.Company XYZ Call Center Peer Group Benchmark
92© MetricNet, LLC, www.metricnet.com
Why are We Doing This?
We’ve all heard the expression…
“Expectations Not Set…
are Expectations Not Met!
So, let’s get serious about proactively
managing expectations!

Sample Report Only. Data is not accurate.Company XYZ Call Center Peer Group Benchmark
© MetricNet, LLC, www.metricnet.com 93

Sample Report Only. Data is not accurate.Company XYZ Call Center Peer Group Benchmark
94© MetricNet, LLC, www.metricnet.com
Company XYZ Internal Communication Summary
Managing the gap between perception and reality is fairly
straightforward
It doesn’t take a lot of time, or cost a lot of money
But it is critically important
The success of your Call Center depends as much on your image, as it
does on your actual performance!
The Benefits of effective Image Management Include:
Customer loyalty and positive word-of-mouth referrals
Credibility, which leverages your ability to Get Things Done!
A Positive Image for IT overall
High levels of Customer Satisfaction

95
Detailed Benchmarking Comparisons
Company
XYZ

Cost and Price Metrics
96
Company
XYZ

Sample Report Only. Data is not accurate.Company XYZ Call Center Peer Group Benchmark
97© MetricNet, LLC, www.metricnet.com
Cost Metrics: Cost per Inbound Contact
Cost per Contact is strongly correlated with the following metrics:
Agent Utilization
First Contact Resolution Rate
Contact Handle Time
Self-Serve Completion Rate
Average Speed of Answer
Definition
Why it’s Important
Key Correlations
Cost per Contact is one of the most important Call Center metrics. It is a measure of how efficiently your Call Center conducts its business. A higher than average Cost per Contact is not necessarily a bad thing, particularly if accompanied by higher than average quality levels. Conversely, a low Cost per Contact is not necessarily good, particularly if the low cost is achieved by sacrificing Call Quality or service levels. Every Call Center should track and trend Cost per Contact on a monthly basis.
Cost per Inbound Contact is the total annual operating expense of the Call Center divided by the annual inbound contact volume of the Call Center. Operating expense includes all employee salaries, overtime pay, benefits, and incentive compensation, contractor costs, facilities expense, telecom costs, desktop computing, software licensing, training, travel, office supplies, and miscellaneous expenses. Contact volume includes contacts from all sources: live voice, voice mail, Email, web, fax, etc.

Sample Report Only. Data is not accurate.Company XYZ Call Center Peer Group Benchmark
98© MetricNet, LLC, www.metricnet.com
Cost Metrics: Cost per Inbound Contact
$0.00
$2.00
$4.00
$6.00
$8.00
$10.00
$12.00
$14.00
$16.00
$18.00
$20.00
$22.00
11 9 20 22 5 XYZ 3 18 12 1 7 16 13 2 10 14 8 19 17 15 6 21 4
Co
st
per
Inb
ou
nd
Co
nta
ct
Call Center
High $20.50
Average ----- $11.93
Median $11.40
Low $7.09
Company XYZ $8.42
Key Statistics
Cost per Inbound Contact

Sample Report Only. Data is not accurate.Company XYZ Call Center Peer Group Benchmark
Cost Metrics: Cost per Minute of Inbound Handle Time
Cost per Minute of Inbound Handle Time is strongly correlated with the following metrics:
Agent Utilization
First Contact Resolution Rate
User Self-Serve Completion Rate
Average Speed of Answer
Inbound Contacts as a % of Total Contacts
Definition
Why it’s Important
Key Correlations
Unlike Cost per Inbound Contact, which does not take into account the Contact Handle Time or call complexity, Cost per Minute of Inbound Handle Time is a measure of the per minute cost of providing customer support. It enables a more direct comparison of costs between Call Centers because it is independent of the types of contacts that come into the Call Center and the complexity of those contacts.
Cost per Minute of Inbound Handle Time is simply the Cost per Contact divided by the Average Inbound Contact Handle Time. The Average Inbound Contact Handle Time includes all inbound contacts: voice calls, voice mail, email, web chat, walk-in, etc.
99© MetricNet, LLC, www.metricnet.com

Sample Report Only. Data is not accurate.Company XYZ Call Center Peer Group Benchmark
100© MetricNet, LLC, www.metricnet.com
Cost Metrics: Cost per Minute of Inbound Handle Time
$0.00
$0.20
$0.40
$0.60
$0.80
$1.00
$1.20
$1.40
$1.60
$1.80
$2.00
$2.20
$2.40
$2.60
18 3 22 5 11 20 1 9 XYZ 12 16 7 10 13 14 19 8 17 21 2 6 15 4
Co
st
per
Min
ute
of
Inb
ou
nd
Han
dle
Tim
e
Call Center
High $2.43
Average ----- $1.64
Median $1.54
Low $1.03
Company XYZ $1.46
Key Statistics
Cost per Minute of Inbound
Handle Time

Sample Report Only. Data is not accurate.Company XYZ Call Center Peer Group Benchmark
101© MetricNet, LLC, www.metricnet.com
Price Metrics: Price per Inbound Contact
Price per Inbound Contact is strongly correlated with the following metrics:
Agent Utilization
First Contact resolution rate
Inbound Contact Handle Time
User Self-Service Completion Rate
Average Speed of Answer
Definition
Why it’s Important
Key Correlations
Price per Inbound Contact is one of the most important Call Center metrics. It is a measure of contract efficiency and effectiveness with your outsourcer. A higher than average Price per Inbound Contact is not necessarily a bad thing, particularly if accompanied by higher than average quality levels. Conversely, a low Price per Inbound Contact is not necessarily good, particularly if the low price is achieved by sacrificing Customer Satisfaction or service levels. Every outsourced Call Center should track and trend Price per Inbound Contact on an ongoing basis.
Price per Inbound Contact is the amount paid to the outsourcer for each inbound contact handled. It is typically calculated by dividing the annual fee paid to the outsourcer by the annual inbound contact volume. Contact volume includes contacts from all sources: live voice, voice mail, Email, web, fax, etc.

Sample Report Only. Data is not accurate.Company XYZ Call Center Peer Group Benchmark
102© MetricNet, LLC, www.metricnet.com
Price Metrics: Price per Inbound Contact
$0.00
$2.00
$4.00
$6.00
$8.00
$10.00
$12.00
$14.00
$16.00
$18.00
$20.00
$22.00
$24.00
$26.00
115 103 104 114 106 113 102 XYZ 101 105 108 109 116 110 112 107 111
Pri
ce p
er
Inb
ou
nd
Co
nta
ct
Call Center
High $24.28
Average ----- $15.84
Median $14.62
Low $7.54
Company XYZ $14.59
Key Statistics
Price per Inbound Contact

Sample Report Only. Data is not accurate.Company XYZ Call Center Peer Group Benchmark
Price Metrics: Price per Minute of Handle Time
Price per Minute of Handle Time is strongly correlated with the following metrics:
Agent Utilization
First Contact Resolution Rate
User Self-Service Completion Rate
Average Speed of Answer
Definition
Why it’s Important
Key Correlations
Unlike Price per Contact, which does not take into account the Contact Handle Time or call complexity, Price per Minute of Handle Time is a measure of the per minute price paid to your outsourcer for providing technical support. It enables a more direct comparison of price between Call Centers and outsourcers because it is independent of the types of calls that come into the Call Center and the complexity of those calls.
Price per Minute of Handle Time is simply the Price per Contact divided by the average Inbound Contact Handle Time.
103© MetricNet, LLC, www.metricnet.com

Sample Report Only. Data is not accurate.Company XYZ Call Center Peer Group Benchmark
Price Metrics: Price per Minute of Handle Time
104© MetricNet, LLC, www.metricnet.com
$0.00
$0.50
$1.00
$1.50
$2.00
$2.50
$3.00
$3.50
$4.00
115 103 113 102 114 104 XYZ 106 108 110 101 109 116 105 112 107 111
Pri
ce p
er
Min
ute
of
Han
dle
Tim
e
Call Center
High $3.51
Average ----- $2.07
Median $2.02
Low $1.25
Company XYZ $1.87
Key Statistics
Price per Minute of Handle

Sample Report Only. Data is not accurate.Company XYZ Call Center Peer Group Benchmark
105© MetricNet, LLC, www.metricnet.com
Cost Metrics: First Level Resolution Rate
First Level Resolution is strongly correlated with the following metrics: First Contact Resolution Rate New Agent Training Hours Annual Agent Training Hours Cost per Inbound Contact Total Cost of Ownership
Definition
Why it’s Important
Key Correlations
First Level Resolution is a measure of the overall competency of the Call Center, and is a proxy for Total Cost of Ownership (TCO). A high First Level Resolution Rate helps to minimize TCO because each contact that is resolved at Level 1 avoids a higher cost of resolution at Level n (IT, Desktop Support, Vendor Support, etc.). Call Centers can improve their First Level Resolution Rates through training, and investments in certain technologies such as remote diagnostic tools, and knowledge management systems.
First Level Resolution Rate is the number of incidents resolved in the Call Center, divided by all incidents that can potentially be resolved at the Call Center. Any incident that is pushed out to another support level (Desktop Support, Level 2 IT support, Vendor Support, etc.) is, by definition, not resolved at Level 1. Incidents than cannot be resolved at Level 1, such as a hardware failure, do not count in the First Level Resolution Rate. MetricNet considers this a cost metric since it has a strong impact on Total Cost of Ownership for end-user support

Sample Report Only. Data is not accurate.Company XYZ Call Center Peer Group Benchmark
45.0%
50.0%
55.0%
60.0%
65.0%
70.0%
75.0%
80.0%
85.0%
90.0%
95.0%
6 21 13 8 15 4 22 7 14 3 18 5 2 20 19 9 10 16 1 17 11 12 XYZ
Fir
st
Co
nta
ct
Reso
luti
on
Rate
Call Center
106© MetricNet, LLC, www.metricnet.com
Cost Metrics: First Level Resolution Rate
High 97.5%
Average ----- 82.3%
Median 82.9%
Low 73.7%
Company XYZ N/A
Key Statistics
First Level Resolution Rate

Productivity Metrics
107
Company
XYZ

Sample Report Only. Data is not accurate.Company XYZ Call Center Peer Group Benchmark
108© MetricNet, LLC, www.metricnet.com
Productivity Metrics: Inbound Contacts per Agent per Month
Inbound Contacts per Agent per Month is strongly correlated with the following metrics:
Agent Utilization
Inbound Contact Handle Time
Cost per Inbound Contact
Cost per Minute of Inbound Handle Time
Agent Occupancy
Average Speed of Answer
Definition
Why it’s Important
Key Correlations
Inbound Contacts per Agent per Month is an important indicator of Agent productivity. A low number could indicate low Agent Utilization, poor scheduling efficiency or schedule adherence, or a higher than average Contact Handle Time. Conversely, a high number of Agent handled contacts may indicate high Agent Utilization, good scheduling efficiency and schedule adherence, or a lower than average Contact Handle Time. Every Call Center should track and trend this metric on a monthly basis.
Inbound Contacts per Agent per Month is the average monthly inbound contact volume divided by the average Full Time Equivalent (FTE) Agent headcount. Contact volume includes contacts from all sources: live voice, voice mail, Email, web, fax, etc. Agent headcount is the average FTE number of employees and contractors handling customer contacts.

Sample Report Only. Data is not accurate.Company XYZ Call Center Peer Group Benchmark
109© MetricNet, LLC, www.metricnet.com
Productivity Metrics: Inbound Contacts per Agent per Month
0
100
200
300
400
500
600
700
800
900
1,000
XYZ 11 9 20 3 5 7 22 12 13 1 10 14 16 6 18 2 19 8 17 15 21 4
Inb
ou
nd
Co
nta
cts
per
Ag
en
t p
er
Mo
nth
Call Center
High 910
Average ----- 591
Median 574
Low 329
Company XYZ 910
Key Statistics
Inbound Contacts per Agent per
Month

Sample Report Only. Data is not accurate.Company XYZ Call Center Peer Group Benchmark
110© MetricNet, LLC, www.metricnet.com
Productivity Metrics: Agent Utilization
Agent Utilization is strongly correlated with the following metrics:
Inbound Contacts per Agent per Month
Cost per Inbound Contact
Cost per Minute of Inbound Handle Time
Agent Occupancy
Average Speed of Answer
Definition
Why it’s Important
Key Correlations
Agent Utilization is the single most important indicator of Agent productivity. It measures the percentage of time that the average Agent is in “work mode”, and is independent of Contact Handle Time or call complexity.
Agent Utilization is the average time that a Agent spends handling both inbound and outbound contacts per month, divided by the number of work hours in a given month. The calculation for Agent Utilization is shown on the next page.

Sample Report Only. Data is not accurate.Company XYZ Call Center Peer Group Benchmark
Agent Utilization Defined
Agent
Utilization
((Average number of inbound calls handled by an Agent in a month) X (Average inbound handle time in minutes) +
(Average number of outbound calls handled by an Agent in a month) X (Average outbound handle time in minutes))
(Average number of days worked in a month) X (Number of work hours in a day) X (60 minutes/hr)
Agent Utilization is a measure of actual time worked by Agents in a month,
divided by total time at work during the month
It takes into account both inbound and outbound contacts handled by the Agents
But it does not make adjustments for sick days, holidays, training time, project
time, or idle time
=
© MetricNet, LLC, www.metricnet.com 111

Sample Report Only. Data is not accurate.Company XYZ Call Center Peer Group Benchmark
Example: Call Center Agent Utilization
Inbound Contacts per Agent per Month = 375
Outbound Contacts per Agent per Month = 225
Average Inbound Contact Handle Time = 10 minutes
Average Outbound Contact Handle Time = 5 minutes
Agent
Utilization
((375 Inbound Contacts per Month) X (10 minutes) + (225 Outbound Contacts per Month) X (5 minutes)
(21.5 working days per month) X (7.5 work hours per day) X (60 minutes/hr)= =
50.4%
Agent
Utilization
Agent
Utilization
((Average number of inbound Contacts handled by a Agent in a month) X (Average inbound handle time in minutes) +
(Average number of outbound Contacts handled by a Agent in a month) X (Average outbound handle time in minutes))
(Average number of days worked in a month) X (Number of work hours in a day) X (60 minutes/hr)=
112© MetricNet, LLC, www.metricnet.com

Sample Report Only. Data is not accurate.Company XYZ Call Center Peer Group Benchmark
© MetricNet, LLC, www.metricnet.com
Productivity Metrics: Agent Utilization
20.0%
25.0%
30.0%
35.0%
40.0%
45.0%
50.0%
55.0%
60.0%
65.0%
12 11 3 22 XYZ 18 7 14 9 6 16 10 13 5 1 20 19 17 2 8 21 15 4
Ag
en
t U
tilizati
on
Call Center
High 62.7%
Average ----- 48.1%
Median 50.3%
Low 30.8%
Company XYZ 54.9%
Key Statistics
Agent Utilization
113

Sample Report Only. Data is not accurate.Company XYZ Call Center Peer Group Benchmark
114© MetricNet, LLC, www.metricnet.com
Productivity Metrics: Agents as a % of Total Headcount
Agents as a % of Total Headcount is strongly correlated with the following metrics:
Cost per Inbound Contact
Cost per Minute of Inbound Handle Time
Definition
Why it’s Important
Key Correlations
The Agent headcount as a percent of total Call Center headcount is an important measure of management and overhead efficiency. Since non-Agents include both management and non-management personnel (e.g., supervisors and team leads, QA/QC, trainers, etc.), this metric is not a pure measure of management span of control. It is, however, a more useful metric than management span of control because the denominator of this ratio takes into account all personnel that are not directly engaged in customer service activities.
This metric is the Full Time Equivalent Agent headcount divided by the total Call Center headcount. It is expressed as a percentage, and represents the percentage of total Call Center personnel who are engaged in direct customer service activities.

Sample Report Only. Data is not accurate.Company XYZ Call Center Peer Group Benchmark
© MetricNet, LLC, www.metricnet.com
Productivity Metrics: Agents as a % of Total Headcount
70.0%
72.0%
74.0%
76.0%
78.0%
80.0%
82.0%
84.0%
86.0%
88.0%
90.0%
92.0%
94.0%
96.0%
12 2 3 22 18 8 5 20 15 11 9 7 17 4 19 16 10 13 14 XYZ 1 21 6
Ag
en
ts a
s a
% o
f T
ota
l H
ead
co
un
t
Call Center
High 93.7%
Average ----- 84.5%
Median 83.5%
Low 75.2%
Company XYZ 79.0%
Key Statistics
Agents as a % of Total
Headcount
115

Service Level Metrics
116
Company
XYZ
Sample Report Only. Data is not accurate.Company XYZ Call Center Peer Group Benchmark
117© MetricNet, LLC, www.metricnet.com
Service Level Metrics: Average Speed of Answer (ASA)
Average Speed of Answer is strongly correlated with the following metrics:
Call Abandonment Rate
Percentage of Calls Answered in 30 Seconds
Agent Utilization
Definition
Why it’s Important
Key Correlations
ASA is a common service level metric in the Call Center industry. It is an indication of how responsive a Call Center is to incoming calls. Since most Call Centers have an ASA service level target, the ASA is tracked to ensure service level compliance.
Average Speed of Answer is the total wait time that callers are in queue, divided by the number of calls handled. This includes both IVR-handled calls as well as calls handled by a live Agent. Most ACD systems provide this number.

Sample Report Only. Data is not accurate.Company XYZ Call Center Peer Group Benchmark
118© MetricNet, LLC, www.metricnet.com
Service Level Metrics: Average Speed of Answer
0
10
20
30
40
50
60
70
80
90
100
110
120
130
8 15 4 21 17 19 5 2 20 1 9 13 6 7 18 14 22 10 16 12 XYZ 11 3
Avera
ge S
peed
of
An
sw
er
(AS
A) (s
eco
nd
s)
Call Center
High 129
Average ----- 71
Median 71
Low 20
Company XYZ 124
Key Statistics
Average Speed of Answer
(ASA) (seconds)

Sample Report Only. Data is not accurate.Company XYZ Call Center Peer Group Benchmark
119© MetricNet, LLC, www.metricnet.com
Service Level Metrics: % of Calls Answered in 30 Seconds
The Percentage of Calls Answered Within 30 Seconds is strongly correlated with the following metrics:
Average Speed of Answer
Call Abandonment Rate
Agent Utilization
Definition
Why it’s Important
Key Correlations
The percentage of calls answered within 30 seconds is a common service level metric in the industry. It is an indication of how responsive a Call Center is to incoming calls. Many Call Centers have a service level target for the percentage of calls answered within 30 seconds, so the metric is tracked to ensure service level compliance.
This metric is fairly self explanatory. It is the percentage of all incoming calls that are answered by a live Agent within 30 seconds. For those who don’t track this exact metric, but track a similar metric such as % answered within 60 seconds, MetricNet uses a conversion formula to calculate the equivalent percentage of calls answered within 30 seconds.

Sample Report Only. Data is not accurate.Company XYZ Call Center Peer Group Benchmark
120© MetricNet, LLC, www.metricnet.com
Service Level Metrics: % of Calls Answered in 30 Seconds
0.0%
10.0%
20.0%
30.0%
40.0%
50.0%
60.0%
70.0%
80.0%
90.0%
4 21 20 5 8 13 15 6 7 17 14 18 2 9 19 16 1 22 10 12 3 11 XYZ
% o
f C
alls A
nsw
ere
d in
30 S
eco
nd
s
Call Center
High 85.8%
Average ----- 43.9%
Median 44.4%
Low 2.6%
Company XYZ 2.6%
Key Statistics
% of Calls Answered in 30
Seconds

Sample Report Only. Data is not accurate.Company XYZ Call Center Peer Group Benchmark
121© MetricNet, LLC, www.metricnet.com
Service Level Metrics: Call Abandonment Rate
Call Abandonment Rate is strongly correlated with the following metrics:
Average Speed of Answer
Percentage of Calls Answered in 30 Seconds
Agent Utilization
Definition
Why it’s Important
Key Correlations
Call abandonment rate is a common service level metric in the Call Center industry. An abandoned call is an indication that a caller has given up, and hung up the phone before receiving service from a live Agent or from an IVR. Since most Call Centers have an abandonment rate service level target, the call abandonment rate is tracked to ensure service level compliance.
Call Abandonment Rate is the percentage of calls that were connected to the ACD, but were disconnected by the caller before reaching a Agent, or before completing a process within the IVR.

Sample Report Only. Data is not accurate.Company XYZ Call Center Peer Group Benchmark
122© MetricNet, LLC, www.metricnet.com
Service Level Metrics: Call Abandonment Rate
0.0%
2.0%
4.0%
6.0%
8.0%
10.0%
12.0%
14.0%
16.0%
4 15 17 8 5 21 20 2 19 9 1 6 7 10 18 22 13 16 11 14 12 3 XYZ
Call A
ban
do
nm
en
t R
ate
Call Center
High 15.3%
Average ----- 6.4%
Median 5.9%
Low 1.1%
Company XYZ 15.3%
Key Statistics
Call Abandonment Rate

Quality Metrics
123
Company
XYZ

Sample Report Only. Data is not accurate.Company XYZ Call Center Peer Group Benchmark
124© MetricNet, LLC, www.metricnet.com
Quality Metrics: Call Quality
Call Quality is strongly correlated with the following metrics:
Customer Satisfaction
First Contact Resolution Rate
New Agent Training Hours
Annual Agent Training Hours
Definition
Why it’s Important
Key Correlations
Call Quality is the cornerstone of Customer Satisfaction. Good Call Quality takes into account Agent knowledge and expertise, call efficiency (i.e. Call Handle Time), and Agent courtesy and professionalism. Unless Call Quality is consistently high, it is difficult to achieve consistently high levels of Customer Satisfaction. When measured properly, Call Quality and Customer Satisfaction should track fairly closely.
Although there is no consistent methodology for measuring Call Quality in the Call Center industry, most Call Centers have developed their own scoring system for grading the quality of a call. Most will measure call quality on a scale of 0 to 100%, and include such things as Agent courtesy, professionalism, empathy, timeliness of resolution, quality of resolution, following the script, etc. in their Call Quality evaluations

Sample Report Only. Data is not accurate.Company XYZ Call Center Peer Group Benchmark
125© MetricNet, LLC, www.metricnet.com
Quality Metrics: Call Quality
60.0%
62.0%
64.0%
66.0%
68.0%
70.0%
72.0%
74.0%
76.0%
78.0%
80.0%
82.0%
84.0%
86.0%
88.0%
90.0%
92.0%
94.0%
96.0%
1 21 6 13 9 22 19 16 12 18 17 10 2 11 4 5 3 8 7 1 15 20
Call Q
uality
Call Center
High 94.5%
Average ----- 83.7%
Median 83.9%
Low 65.1%
Company XYZ N/A
Key Statistics
Call Quality

Sample Report Only. Data is not accurate.Company XYZ Call Center Peer Group Benchmark
126© MetricNet, LLC, www.metricnet.com
Quality Metrics: First Contact Resolution Rate
First Contact Resolution is strongly correlated with the following metrics:
Customer Satisfaction
Net Level 1 Resolution Rate
New Agent Training Hours
Annual Agent Training Hours
Inbound Contact Handle Time
Definition
Why it’s Important
Key Correlations
First Contact Resolution is the single biggest driver of Customer Satisfaction. A high First Contact Resolution Rate is almost always associated with high levels of Customer Satisfaction. Call Centers that emphasize training (i.e., high training hours for new and veteran Agents), and have good technology tools, such as remote diagnostic capability and knowledge management, generally enjoy a higher than average First Contact Resolution Rate.
First Contact Resolution applies only to live (telephone) contacts. It is the percentage of inbound calls that are resolved on the first interaction with the customer, divided by all calls that are potentially resolvable on first contact. Calls that cannot be resolved on first contact, such as a hardware break/fix, are not included in the denominator of First Contact Resolution Rate. Calls that require a customer callback, or are otherwise unresolved on the first contact for any reason, do not qualify for First Contact Resolution. For email contacts, some Call Centers consider an email resolved on first contact if the customer receives a resolution within one hour of submitting the email.

Sample Report Only. Data is not accurate.Company XYZ Call Center Peer Group Benchmark
127© MetricNet, LLC, www.metricnet.com
Quality Metrics: First Contact Resolution Rate
45.0%
50.0%
55.0%
60.0%
65.0%
70.0%
75.0%
80.0%
85.0%
90.0%
95.0%
6 21 13 8 15 4 22 7 14 3 18 5 2 20 19 9 10 16 1 17 11 12 XYZ
Fir
st
Co
nta
ct
Reso
luti
on
Rate
Call Center
High 91.4%
Average ----- 71.6%
Median 70.4%
Low 57.6%
Company XYZ 57.6%
Key Statistics
First Contact Resolution Rate

Sample Report Only. Data is not accurate.Company XYZ Call Center Peer Group Benchmark
128© MetricNet, LLC, www.metricnet.com
Quality Metrics: Customer Satisfaction
Customer Satisfaction is strongly correlated with the following metrics:
First Contact Resolution Rate
Call Quality
Definition
Why it’s Important
Key Correlations
Customer Satisfaction is the single most important measure of Call Center quality. Any successful Call Center will have consistently high Customer Satisfaction ratings. Some Call Center managers are under the impression that a low Cost per Inbound Contact may justify a lower level of Customer Satisfaction. But this is not true. MetricNet’s research shows that even Call Center’s with a very low Cost per Inbound Contact can achieve consistently high Customer Satisfaction ratings.
Customer Satisfaction is the percentage of customers who are either satisfied or very satisfied with their Call Center experience. This metric can be captured in a numbers of ways including automatic after-call IVR surveys, follow-up outbound (live Agent) calls, Email surveys, postal surveys, etc.

Sample Report Only. Data is not accurate.Company XYZ Call Center Peer Group Benchmark
129© MetricNet, LLC, www.metricnet.com
Quality Metrics: Customer Satisfaction
50.0%
55.0%
60.0%
65.0%
70.0%
75.0%
80.0%
85.0%
90.0%
95.0%
100.0%
21 6 XYZ 19 13 9 17 3 8 22 2 10 1 4 14 15 18 5 11 16 12 7 20
Cu
sto
mer
Sati
sfa
cti
on
Call Center
High 96.7%
Average ----- 78.2%
Median 76.1%
Low 63.1%
Company XYZ 87.6%
Key Statistics
Customer Satisfaction

Agent Metrics
130
Company
XYZ

Sample Report Only. Data is not accurate.Company XYZ Call Center Peer Group Benchmark
131© MetricNet, LLC, www.metricnet.com
Agent Metrics: Annual Agent Turnover
Annual Agent Turnover is strongly correlated with the following metrics:
Daily Agent Absenteeism
Annual Agent Training Hours
Customer Satisfaction
Net First Contact Resolution Rate
Cost per Inbound Contact
Agent Job Satisfaction
Definition
Why it’s Important
Key Correlations
Agent turnover is costly. Each time a Agent leaves the Call Center, a new Agent needs to be hired to replace the outgoing Agent. This results in costly recruiting, hiring, and training expenses. Additionally, it is typically several weeks or even months before a Agent is fully productive, so there is lost productivity associated with Agent turnover as well. High Agent turnover is generally associated with low Agent morale in a Call Center.
Annual Agent Turnover is the percentage of Agents that leave the Call Center, for any reason (voluntarily or involuntarily), on an annual basis.

Sample Report Only. Data is not accurate.Company XYZ Call Center Peer Group Benchmark
132© MetricNet, LLC, www.metricnet.com
Agent Metrics: Annual Agent Turnover
0.0%
5.0%
10.0%
15.0%
20.0%
25.0%
30.0%
35.0%
40.0%
45.0%
50.0%
55.0%
60.0%
65.0%
70.0%
21 6 15 22 XYZ 3 13 8 4 14 1 2 10 20 7 5 16 11 19 9 17 18 12
An
nu
al A
gen
t T
urn
over
Call Center
High 65.6%
Average ----- 40.7%
Median 40.3%
Low 13.6%
Company XYZ 31.3%
Key Statistics
Annual Agent Turnover

Sample Report Only. Data is not accurate.Company XYZ Call Center Peer Group Benchmark
133© MetricNet, LLC, www.metricnet.com
Agent Metrics: Daily Agent Absenteeism
Daily Agent Absenteeism is strongly correlated with the following metrics:
Annual Agent Turnover
Agent Job Satisfaction
Agent Utilization
Cost per Inbound Contact
Contacts per Agent per Month
Definition
Why it’s Important
Key Correlations
High Agent Absenteeism is problematic because it makes it difficult for a Call Center to schedule resources efficiently. High absenteeism can severely impact a Call Center’s operating performance, and increase the likelihood that service level targets will be missed. A Call Center’s ASA and Call Abandonment Rate typically suffer when absenteeism is high. Also, chronically high absenteeism is often a sign of low Agent morale.
Daily Agent Absenteeism is the average percentage of Agents with an unexcused absence on any given day. It is calculated by dividing the number of absent Agents by the total number of Agents that are scheduled to be at work.

Sample Report Only. Data is not accurate.Company XYZ Call Center Peer Group Benchmark
134© MetricNet, LLC, www.metricnet.com
Agent Metrics: Daily Agent Absenteeism
0.0%
2.0%
4.0%
6.0%
8.0%
10.0%
12.0%
14.0%
16.0%
18.0%
20.0%
22.0%
24.0%
26.0%
13 21 6 19 5 10 16 7 17 8 22 2 XYZ 4 14 18 15 9 12 1 3 11 20
Daily A
gen
t A
bsen
teeis
m
Call Center
High 24.2%
Average ----- 10.8%
Median 10.1%
Low 4.7%
Company XYZ 10.3%
Key Statistics
Daily Agent Absenteeism

Sample Report Only. Data is not accurate.Company XYZ Call Center Peer Group Benchmark
135
Agent Metrics: Agent Schedule Adherence
Agent schedule adherence is strongly correlated with the following metrics:
Agent Utilization
Inbound Contacts per Agent per Month
Agent Occupancy
Average Speed of Answer
Definition
Why it’s Important
Key Correlations
Effective Agent scheduling is critical to achieving a Call Center’s service level goals and maximizing Agent Utilization. However, a work schedule, no matter how well constructed, is only as good as the adherence to the schedule. It is therefore important for Agents to adhere to the schedule as closely as possible to ensure that these productivity and service level goals are met.
Agent Schedule Adherence is a measure of whether Agents are in their seats ready to accept calls as scheduled. It measures how well a Call Center’s Agents are “adhering” to the schedule. Agent Schedule Adherence is equal to the actual time that a Agent is logged in to the system ready to accept calls, divided by the total time the Agent is scheduled to be available to accept calls.
© MetricNet, LLC, www.metricnet.com

Sample Report Only. Data is not accurate.Company XYZ Call Center Peer Group Benchmark
70.0%
72.0%
74.0%
76.0%
78.0%
80.0%
82.0%
84.0%
86.0%
88.0%
90.0%
92.0%
13 10 22 XYZ 6 16 17 14 8 7 12 21 19 9 11 2 1 3 15 4 20 18 5
Sch
ed
ule
Ad
here
nce
Call Center
Agent Metrics: Agent Schedule Adherence
136© MetricNet, LLC, www.metricnet.com
High 90.8%
Average ----- 83.4%
Median 83.8%
Low 72.7%
Company XYZ 89.7%
Key Statistics
Schedule Adherence
Sample Report Only. Data is not accurate.Company XYZ Call Center Peer Group Benchmark
137© MetricNet, LLC, www.metricnet.com
Agent Metrics: New Agent Training Hours
New Agent Training Hours are strongly correlated with the following metrics:
Call Quality
Net First Contact Resolution Rate
Customer Satisfaction
Inbound Contact Handle Time
Agent Job Satisfaction
Definition
Why it’s Important
Key Correlations
New Agent Training Hours are strongly correlated with Call Quality and Net First Contact Resolution Rate. particularly during a Agent’s first few months on the job. The more training a new Agent receives, the higher the Call Quality and Net FCR will typically be. This, in turn, has a positive effect on many other performance metrics including Customer Satisfaction. Perhaps most importantly, training levels have a strong impact on Agent morale: Agents who receive more training typically have higher levels of job satisfaction.
The name of this metric is somewhat self explanatory. New Agent Training Hours is the number of training hours (including classroom, CBT, self-study, shadowing, being coached, and OJT) that a new Agents receives before he/she is allowed to handle customer contacts independently.

Sample Report Only. Data is not accurate.Company XYZ Call Center Peer Group Benchmark
138© MetricNet, LLC, www.metricnet.com
Agent Metrics: New Agent Training Hours
0
20
40
60
80
100
120
140
160
180
200
220
240
21 15 13 6 4 9 7 3 18 20 10 19 2 8 22 5 XYZ 17 11 16 14 12 1
New
Ag
en
t T
rain
ing
Ho
urs
Call Center
High 238
Average ----- 128
Median 125
Low 67
Company XYZ 100
Key Statistics
New Agent Training Hours

Sample Report Only. Data is not accurate.Company XYZ Call Center Peer Group Benchmark
139© MetricNet, LLC, www.metricnet.com
Agent Metrics: Annual Agent Training Hours
Annual Agent Training Hours are strongly correlated with the following metrics:
Call Quality
Net First Contact Resolution Rate
Customer Satisfaction
Inbound Contact Handle Time
Agent Job Satisfaction
Definition
Why it’s Important
Key Correlations
Annual Agent Training Hours are strongly correlated with Call Quality, Customer Satisfaction, and Net First Contact Resolution Rate. Perhaps most importantly, training levels have a strong impact on Agent morale: Agents who train more typically have higher levels of job satisfaction.
Annual Agent Training Hours is the average number of training hours (including classroom, CBT, self-study, shadowing, etc.) that a Agent receives on an annual basis. This number includes any training hours that a Agent receives that are not part of the Agent’s initial (new Agent) training, but it does not include routine team meetings, shift handoffs, or other activities that do not involve formal training.

Sample Report Only. Data is not accurate.Company XYZ Call Center Peer Group Benchmark
140© MetricNet, LLC, www.metricnet.com
Agent Metrics: Annual Agent Training Hours
0
5
10
15
20
25
30
35
40
45
50
55
60
65
70
75
6 21 5 13 8 XYZ 7 9 14 18 22 3 4 10 1 2 11 12 15 16 17 19 20
An
nu
al A
gen
t T
rain
ing
Ho
urs
Call Center
High 74
Average ----- 16
Median 12
Low 0
Company XYZ 24
Key Statistics
Annual Agent Training Hours

Sample Report Only. Data is not accurate.Company XYZ Call Center Peer Group Benchmark
141© MetricNet, LLC, www.metricnet.com
Agent Metrics: Agent Tenure
Definition
Why it’s Important
Key Correlations
Agent tenure is a measure of Agent experience. Virtually every metric related to Call Center cost and quality is impacted by the level of experience the Agents have.
Agent tenure is the average number of months that Agents have worked on a particular Call Center.
Agent tenure is strongly correlated with the following metrics:
Cost per Inbound Contact
Call Quality
Customer Satisfaction
Annual Agent Turnover
Training Hours
Coaching Hours
Inbound Contact Handle Time
Net First Contact Resolution Rate
Agent Job Satisfaction

Sample Report Only. Data is not accurate.Company XYZ Call Center Peer Group Benchmark
142© MetricNet, LLC, www.metricnet.com
Agent Metrics: Agent Tenure
0.0
10.0
20.0
30.0
40.0
50.0
60.0
70.0
80.0
90.0
21 6 15 22 4 3 14 2 8 13 5 10 20 1 11 16 XYZ 17 7 18 19 9 12
Ag
en
t T
en
ure
(m
on
ths)
Call Center
High 86.9
Average ----- 33.2
Median 28.2
Low 17.6
Company XYZ 25.0
Key Statistics
Agent Tenure (months)

Sample Report Only. Data is not accurate.Company XYZ Call Center Peer Group Benchmark
143© MetricNet, LLC, www.metricnet.com
Agent Metrics: Agent Job Satisfaction
Agent Job Satisfaction is strongly correlated with the following metrics:
Annual Agent Turnover
Daily Agent Absenteeism
Agent Training Hours
Agent Coaching Hours
Definition
Why it’s Important
Key Correlations
Agent Job Satisfaction is a proxy for Agent morale. And morale, while difficult to measure, is a bellwether metric that affects almost every other metric in the Call Center. High performance Call Centers almost always have high levels of Agent Job Satisfaction. Perhaps more importantly, this metric can be controlled and improved through training, coaching, and career pathing.
Agent Job Satisfaction is the percent of Agents in a Call Center that are either satisfied or very satisfied with their jobs.
Customer Satisfaction
Net First Contact Resolution Rate
Inbound Contact Handle Time
Cost per Inbound Contact

Sample Report Only. Data is not accurate.Company XYZ Call Center Peer Group Benchmark
144© MetricNet, LLC, www.metricnet.com
Agent Metrics: Agent Job Satisfaction
50.0%
55.0%
60.0%
65.0%
70.0%
75.0%
80.0%
85.0%
90.0%
95.0%
100.0%
XYZ 21 6 15 13 4 9 14 10 22 17 3 8 1 7 5 18 2 20 16 12 19 11
Ag
en
t Jo
b S
ati
sfa
cti
on
Call Center
High 99.0%
Average ----- 70.3%
Median 66.8%
Low 53.3%
Company XYZ 99.0%
Key Statistics
Agent Job Satisfaction

Contact Handling Metrics
145
Company
XYZ

Sample Report Only. Data is not accurate.Company XYZ Call Center Peer Group Benchmark
146© MetricNet, LLC, www.metricnet.com
Contact Handling Metrics: Inbound Contact Handle Time
Inbound Contact Handle Time is strongly correlated with the following metrics:
Cost per Inbound Contact
Inbound Contacts per Agent per Month
Net First Contact Resolution Rate
Definition
Why it’s Important
Key Correlations
A contact is the basic unit of work in a Call Center. Contact Handle Time, therefore, represents the amount of labor required to complete one unit of work.
Inbound Contact Handle Time for a live (telephone) contact is the average time that a Agent spends on the contact, including Talk Time, wrap time, and After Call Work Time. For non-live contacts, such as Email, voice mail, and faxes, the Inbound Contact Handle Time is the average time that a Agent spends resolving the contact.

Sample Report Only. Data is not accurate.Company XYZ Call Center Peer Group Benchmark
147© MetricNet, LLC, www.metricnet.com
Contact Handling Metrics: Inbound Contact Handle Time
4.00
4.50
5.00
5.50
6.00
6.50
7.00
7.50
8.00
8.50
9.00
9.50
10.00
11 9 XYZ 2 20 5 7 12 13 22 1 3 14 10 15 16 8 19 17 6 4 18 21
Inb
ou
nd
Co
nta
ct
Han
dle
Tim
e (m
inu
tes)
Call Center
High 9.08
Average ----- 7.18
Median 7.35
Low 5.29
Company XYZ 5.75
Key Statistics
Inbound Contact Handle Time
(minutes)

Sample Report Only. Data is not accurate.Company XYZ Call Center Peer Group Benchmark
148© MetricNet, LLC, www.metricnet.com
Contact Handling Metrics: User Self-Serve Completion Rate
User Self-Serve Completion Rate is strongly correlated with the following metrics:
Cost per Inbound Contact
Definition
Why it’s Important
Key Correlations
The Cost per Contact for self-serve contacts is significantly lower than it is for Agent assisted calls. By increasing the number of contacts resolved through Self-Serve, the average Cost per Inbound Contact can be reduced significantly. Many Call Centers, recognizing the potential to reduce their costs, constantly strive to increase their Self-Serve Completion Rates.
The User Self-Serve Completion Rate is the percentage of incidents that are resolved by the user without the assistance of a live Agent. These could include contacts that are resolved within the IVR (e.g., automated password resets), and incidents that are resolved by the user through a self-help portal. A user who opts out of the IVR or self-help session to speak with a live Agent does not count as User Self-Serve because the user did not obtain a resolution for their issue before speaking with a live Agent.

Sample Report Only. Data is not accurate.Company XYZ Call Center Peer Group Benchmark
149© MetricNet, LLC, www.metricnet.com
Contact Handling Metrics: User Self-Serve Completion Rate
0.0%
2.0%
4.0%
6.0%
8.0%
10.0%
12.0%
14.0%
16.0%
18.0%
20.0%
22.0%
24.0%
26.0%
28.0%
14 16 17 19 13 22 18 2 6 21 20 7 9 8 4 15 1 XYZ 3 5 10 11 12
User
Self
-Serv
e C
om
ple
tio
n R
ate
Call Center
High 25.2%
Average ----- 9.2%
Median 7.9%
Low 0.0%
Company XYZ 0.0%
Key Statistics
User Self-Serve Completion
Rate

About MetricNet:
Your Benchmarking Partner
150
Company
XYZ

Sample Report Only. Data is not accurate.Company XYZ Call Center Peer Group Benchmark
Your Project Manager: Jeff Rumburg
151© MetricNet, LLC, www.metricnet.com
Jeff Rumburg is a co-founder and Managing Partner at MetricNet,
LLC. Jeff is responsible for global strategy, product development,
and financial operations for the company. As a leading expert in
benchmarking and re-engineering, Mr. Rumburg authored a best
selling book on benchmarking, and has been retained as a
benchmarking expert by such well-known companies as American
Express, Hewlett-Packard, and GM. Prior to co-founding
MetricNet, Mr. Rumburg was president and founder of The Verity
Group, an international management consulting firm specializing in
IT benchmarking. While at Verity, Mr. Rumburg launched a number
of syndicated benchmarking services that provided low cost
benchmarks to more than 1,000 corporations worldwide.
Mr. Rumburg has also held a number of executive positions at META Group, and Gartner, Inc. As
a vice president at Gartner, Mr. Rumburg led a project team that reengineered Gartner's global
benchmarking product suite. And as vice president at META Group, Mr. Rumburg's career was
focused on business and product development for IT benchmarking. Mr. Rumburg's education
includes an M.B.A. from the Harvard Business School, an M.S. magna cum laude in Operations
Research from Stanford University, and a B.S. magna cum laude in Mechanical Engineering. He
is author of A Hands-On Guide to Competitive Benchmarking: The Path to Continuous Quality
and Productivity Improvement, and has taught graduate-level engineering and business courses.
Mr. Rumburg serves on the Strategic Advisory Board for HDI, formerly the Help Desk Institute.

Sample Report Only. Data is not accurate.Company XYZ Call Center Peer Group Benchmark
152
Benchmarking is MetricNet’s Core Business
Call
Centers
Information
Technology
Satisfaction
Surveys
Customer Service
Technical Support
Telemarketing/Telesales
Collections
Complaint Handling
Service Desk
Desktop Support
Customer Satisfaction
Customer Satisfaction
Employee Satisfaction
© MetricNet, LLC, www.metricnet.com

Sample Report Only. Data is not accurate.Company XYZ Call Center Peer Group Benchmark
153
MetricNet’s Global Benchmarking Database
More than 2,400 Benchmarks
Global Database
30 Key Performance Indicators
Nearly 80 Industry Best Practices
© MetricNet, LLC, www.metricnet.com

Sample Report Only. Data is not accurate.Company XYZ Call Center Peer Group Benchmark
Meet a Sampling of Our Clients
MetricNet Conducts benchmarking for Contact Centers worldwide,
and across virtually every industry sector.
154© MetricNet, LLC, www.metricnet.com

Sample Report Only. Data is not accurate.Company XYZ Call Center Peer Group Benchmark
Thank You!
We look forward
to serving you!
155© MetricNet, LLC, www.metricnet.com