sample arc flash risk study using ieee 1584-2018 · to determine arc hazard level the ieee standard...
TRANSCRIPT
Sample
Arc Flash Risk Study
Using IEEE 1584-2018

Table of Contents 1 Introduction 3 1.1 Purpose 3
1.2 Method 3
2 Study Results 5 2.1 Fault currents 5
2.2 Coordination 5
2.3 Arc Flash Hazard 6
2.4 Arc Flash Risk 6
3 Power System Model 7 3.1 Sources 7
3.2 Scenarios 7
3.3 Assumptions & Approximations 7
A Calculation Results 8 A.1 Single Line Diagram 8
A.2 Input Data 9
A.3 Fault currents 10
A.4 Coordination 11
A.5 Time-current Diagrams 13
A.6 IEEE 1584-2018 Calculation Results 15
A.7 Arc Flash Risk 17
This report has been prepared by:
Vrielink Electrical Services
De Spinde 170
8102 LG Raalte
The Netherlands
www.vrielink-es.com
Author:
Joost Vrielink
3 Sample Arc Flash Hazard Calculation Study www.vrielink-es.com
1 Introduction 1.1 Purpose
This is a sample arc flash risk study based on a fictional industrial power system. For more
information about this sample report or arc flash hazard calculation studies please contact:
Vrielink Electrical Services
Email: [email protected]
Phone: +316 4641 4084
Or visit www.vrielink-es.com
1.2 Method
To determine arc hazard level the IEEE Standard 1584 can be used to calculate the incident
energy and arc flash boundary. The standard provides the following method for calculation:
1. Gather data for a short-circuit and protective device coordination study
2. Calculate short-circuit current
3. Calculate the arcing current
4. Determine the trip time for the arcing current
5. Calculate the incident energy in cal/cm²
The equations for calculating arcing current and incident energy are empirically derived from
measurements performed on electrical arcs. These equations have a limited range of validity for
current and voltage although for most industrial systems these limits are not reached.
1.2.1 Data Collection
Details about the electrical distribution system are required to accurately calculate the hazard
level. The following lists the information typically required:
• Utility data; fault contribution and protection settings
• One Line Diagrams showing the main electrical equipment
• When one-line diagrams do not show complete distribution, an additional list
should be obtained of all three-phase electrical distribution panels. These are the
locations that are going to be labeled (and calculated). Loads and single-phase
distribution are not applicable.
• Cable List with Sizes & Lengths. If estimated, the lengths that are at least accurate
to within about 5m.
• Relay and circuit breaker setting schedule.
Typically, an onsite data collection effort is required to verify drawings are accurate. This is
especially a concern for older installations.
1.2.2 Scenarios
When the electrical distribution system is operated in different modes, scenarios can be
created that simulate the entire range of operating parameters. This ensures that the worst-
case hazard is found. As an example, the following scenarios may be created:

4 Sample Arc Flash Hazard Calculation Study www.vrielink-es.com
• Maximum Utility – full contribution of all sources, including motors
• Minimum Utility – minimum contribution of utility and all rotating equipment out
of service
• Emergency – with emergency generators supplying part of the system
A calculation needs to be performed for all applicable scenarios, evaluation should be based on
the worst-case result. Which scenario yields the worst-case result is determined for each location
separately.
1.2.3 Short-circuit Evaluation
The results of the short-circuit evaluation can be used for checking if switchgear and
protective devices are adequately rated against short-circuit currents.
During data collection the short-circuit withstand of all switchgear and protective devices is
gathered and compared to the maximum calculated short-circuit current. When current-limiting
devices are present (such as fuses or molded-case circuit breakers) their limiting effect will be
included as far as documentation is available.
The following parameters are evaluated:
• The symmetrical (RMS) withstand current for thermal withstand
• The peak current for mechanical withstand
Any issues with inadequate rating of equipment are immediately reported, as they can create
unsafe working conditions.
1.2.4 Protective Device Evaluation
Overcurrent devices that are modelled should be checked for miscoordination for overload and
short-circuit currents. When during an overcurrent more than one device trips, these devices are
said to not provide full coordination, and this may present operational issues (although not
necessarily safety related). In this case alternative protection settings can be explored that do
provide improved or full coordination.
A report should include a list of locations where full coordination is not available. Alternative
protection settings can be presented with their limits, as this is usually a compromise between
operational stability, safety and cost. A setting evaluation will consider the following information:
• Connected loads and system stability
• System coordination
• Arc flash hazard levels
1.2.5 Arc Flash Hazard Calculation
Using the result of the short-circuit evaluation and the protection device coordination studies,
the arc flash incident energy and the associated boundary can be calculated according to the
equations in IEEE Standard 1584. A report should provide the calculation results, source data
and any approximations or analytical variables used.
5 Sample Arc Flash Hazard Calculation Study www.vrielink-es.com
2 Study Results 2.1 Fault currents
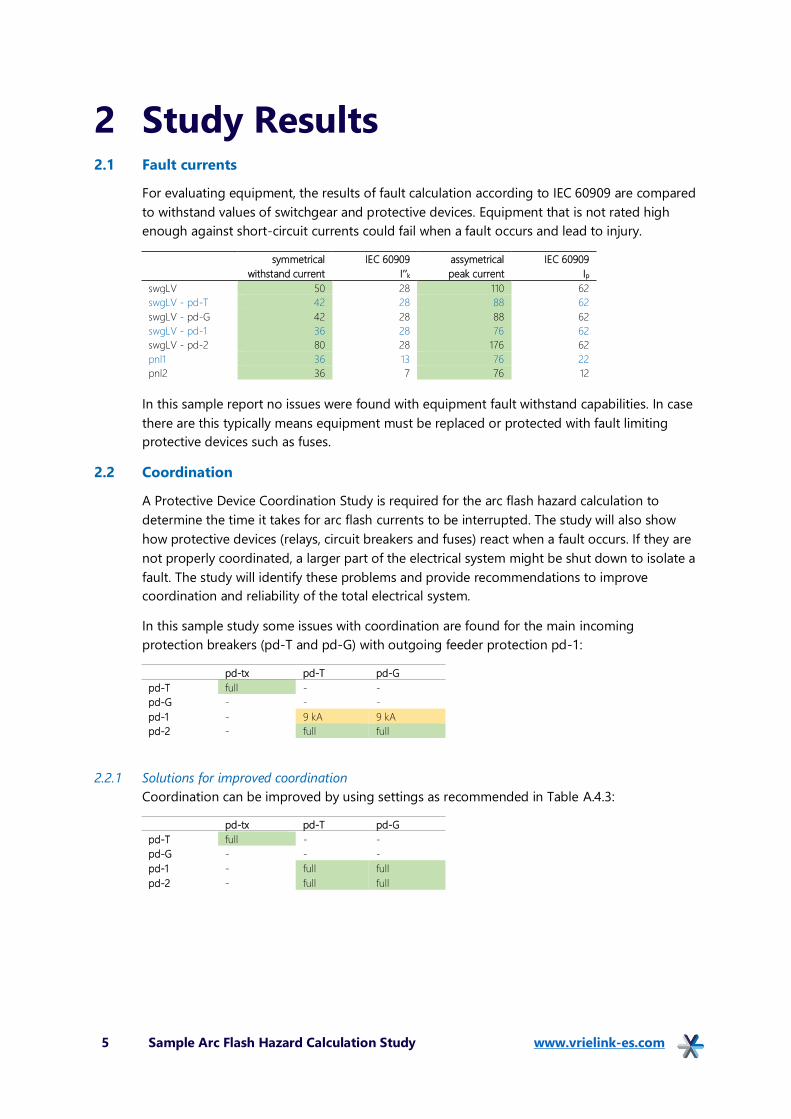
For evaluating equipment, the results of fault calculation according to IEC 60909 are compared
to withstand values of switchgear and protective devices. Equipment that is not rated high
enough against short-circuit currents could fail when a fault occurs and lead to injury.
symmetrical
withstand current
IEC 60909
I’’k
assymetrical
peak current
IEC 60909
Ip
swgLV 50 28 110 62
swgLV - pd-T 42 28 88 62
swgLV - pd-G 42 28 88 62
swgLV - pd-1 36 28 76 62
swgLV - pd-2 80 28 176 62
pnl1 36 13 76 22
pnl2 36 7 76 12
In this sample report no issues were found with equipment fault withstand capabilities. In case
there are this typically means equipment must be replaced or protected with fault limiting
protective devices such as fuses.
2.2 Coordination
A Protective Device Coordination Study is required for the arc flash hazard calculation to
determine the time it takes for arc flash currents to be interrupted. The study will also show
how protective devices (relays, circuit breakers and fuses) react when a fault occurs. If they are
not properly coordinated, a larger part of the electrical system might be shut down to isolate a
fault. The study will identify these problems and provide recommendations to improve
coordination and reliability of the total electrical system.
In this sample study some issues with coordination are found for the main incoming
protection breakers (pd-T and pd-G) with outgoing feeder protection pd-1:
pd-tx pd-T pd-G
pd-T full - -
pd-G - - -
pd-1 - 9 kA 9 kA
pd-2 - full full
2.2.1 Solutions for improved coordination
Coordination can be improved by using settings as recommended in Table A.4.3:
pd-tx pd-T pd-G
pd-T full - -
pd-G - - -
pd-1 - full full
pd-2 - full full
6 Sample Arc Flash Hazard Calculation Study www.vrielink-es.com
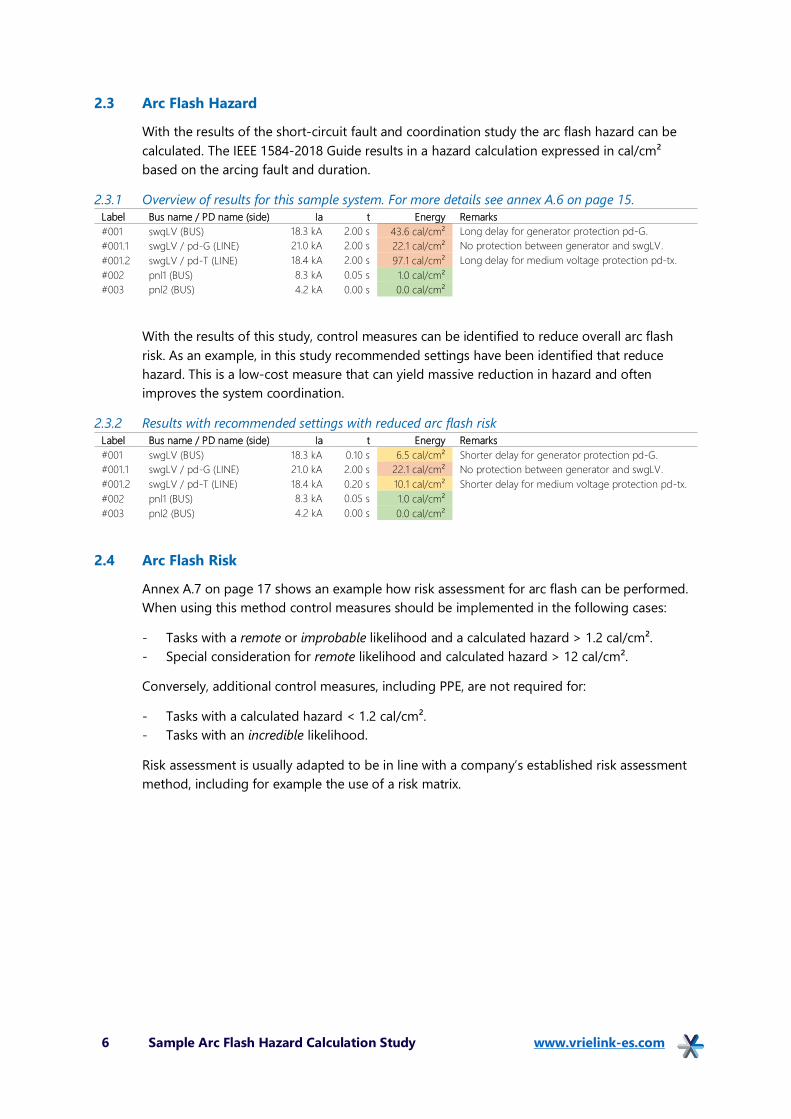
2.3 Arc Flash Hazard
With the results of the short-circuit fault and coordination study the arc flash hazard can be
calculated. The IEEE 1584-2018 Guide results in a hazard calculation expressed in cal/cm²
based on the arcing fault and duration.
2.3.1 Overview of results for this sample system. For more details see annex A.6 on page 15.
Label
#
Bus name / PD name (side) Ia t Energy Remarks
#001 swgLV (BUS) 18.3 kA 2.00 s 43.6 cal/cm² Long delay for generator protection pd-G.
#001.1 swgLV / pd-G (LINE) 21.0 kA 2.00 s 22.1 cal/cm² No protection between generator and swgLV.
#001.2 swgLV / pd-T (LINE) 18.4 kA 2.00 s 97.1 cal/cm² Long delay for medium voltage protection pd-tx.
#002 pnl1 (BUS) 8.3 kA 0.05 s 1.0 cal/cm²
#003 pnl2 (BUS) 4.2 kA 0.00 s 0.0 cal/cm²
With the results of this study, control measures can be identified to reduce overall arc flash
risk. As an example, in this study recommended settings have been identified that reduce
hazard. This is a low-cost measure that can yield massive reduction in hazard and often
improves the system coordination.
2.3.2 Results with recommended settings with reduced arc flash risk
Label
#
Bus name / PD name (side) Ia t Energy Remarks
#001 swgLV (BUS) 18.3 kA 0.10 s 6.5 cal/cm² Shorter delay for generator protection pd-G.
#001.1 swgLV / pd-G (LINE) 21.0 kA 2.00 s 22.1 cal/cm² No protection between generator and swgLV.
#001.2 swgLV / pd-T (LINE) 18.4 kA 0.20 s 10.1 cal/cm² Shorter delay for medium voltage protection pd-tx.
#002 pnl1 (BUS) 8.3 kA 0.05 s 1.0 cal/cm²
#003 pnl2 (BUS) 4.2 kA 0.00 s 0.0 cal/cm²
2.4 Arc Flash Risk
Annex A.7 on page 17 shows an example how risk assessment for arc flash can be performed.
When using this method control measures should be implemented in the following cases:
- Tasks with a remote or improbable likelihood and a calculated hazard > 1.2 cal/cm².
- Special consideration for remote likelihood and calculated hazard > 12 cal/cm².
Conversely, additional control measures, including PPE, are not required for:
- Tasks with a calculated hazard < 1.2 cal/cm².
- Tasks with an incredible likelihood.
Risk assessment is usually adapted to be in line with a company’s established risk assessment
method, including for example the use of a risk matrix.
7 Sample Arc Flash Hazard Calculation Study www.vrielink-es.com
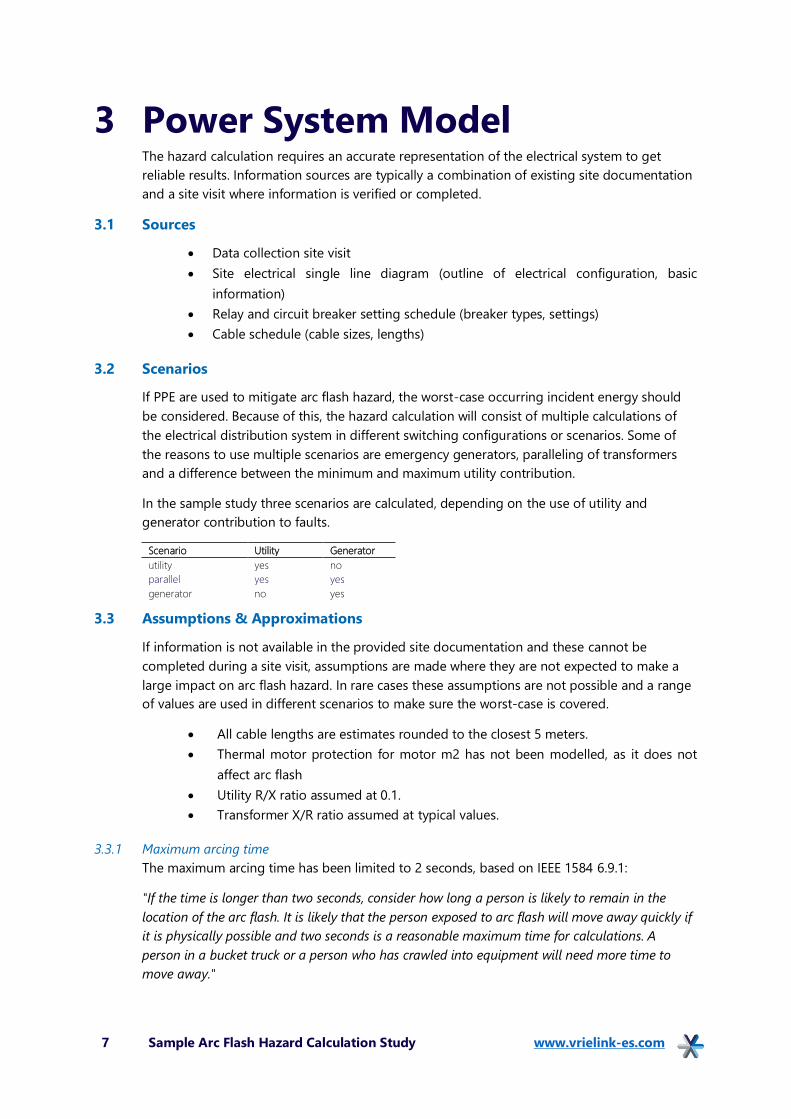
3 Power System Model The hazard calculation requires an accurate representation of the electrical system to get
reliable results. Information sources are typically a combination of existing site documentation
and a site visit where information is verified or completed.
3.1 Sources
• Data collection site visit
• Site electrical single line diagram (outline of electrical configuration, basic
information)
• Relay and circuit breaker setting schedule (breaker types, settings)
• Cable schedule (cable sizes, lengths)
3.2 Scenarios
If PPE are used to mitigate arc flash hazard, the worst-case occurring incident energy should
be considered. Because of this, the hazard calculation will consist of multiple calculations of
the electrical distribution system in different switching configurations or scenarios. Some of
the reasons to use multiple scenarios are emergency generators, paralleling of transformers
and a difference between the minimum and maximum utility contribution.
In the sample study three scenarios are calculated, depending on the use of utility and
generator contribution to faults.
Scenario Utility Generator
utility yes no
parallel yes yes
generator no yes
3.3 Assumptions & Approximations
If information is not available in the provided site documentation and these cannot be
completed during a site visit, assumptions are made where they are not expected to make a
large impact on arc flash hazard. In rare cases these assumptions are not possible and a range
of values are used in different scenarios to make sure the worst-case is covered.
• All cable lengths are estimates rounded to the closest 5 meters.
• Thermal motor protection for motor m2 has not been modelled, as it does not
affect arc flash
• Utility R/X ratio assumed at 0.1.
• Transformer X/R ratio assumed at typical values.
3.3.1 Maximum arcing time
The maximum arcing time has been limited to 2 seconds, based on IEEE 1584 6.9.1:
"If the time is longer than two seconds, consider how long a person is likely to remain in the
location of the arc flash. It is likely that the person exposed to arc flash will move away quickly if
it is physically possible and two seconds is a reasonable maximum time for calculations. A
person in a bucket truck or a person who has crawled into equipment will need more time to
move away."
8 Sample Arc Flash Hazard Calculation Study www.vrielink-es.com
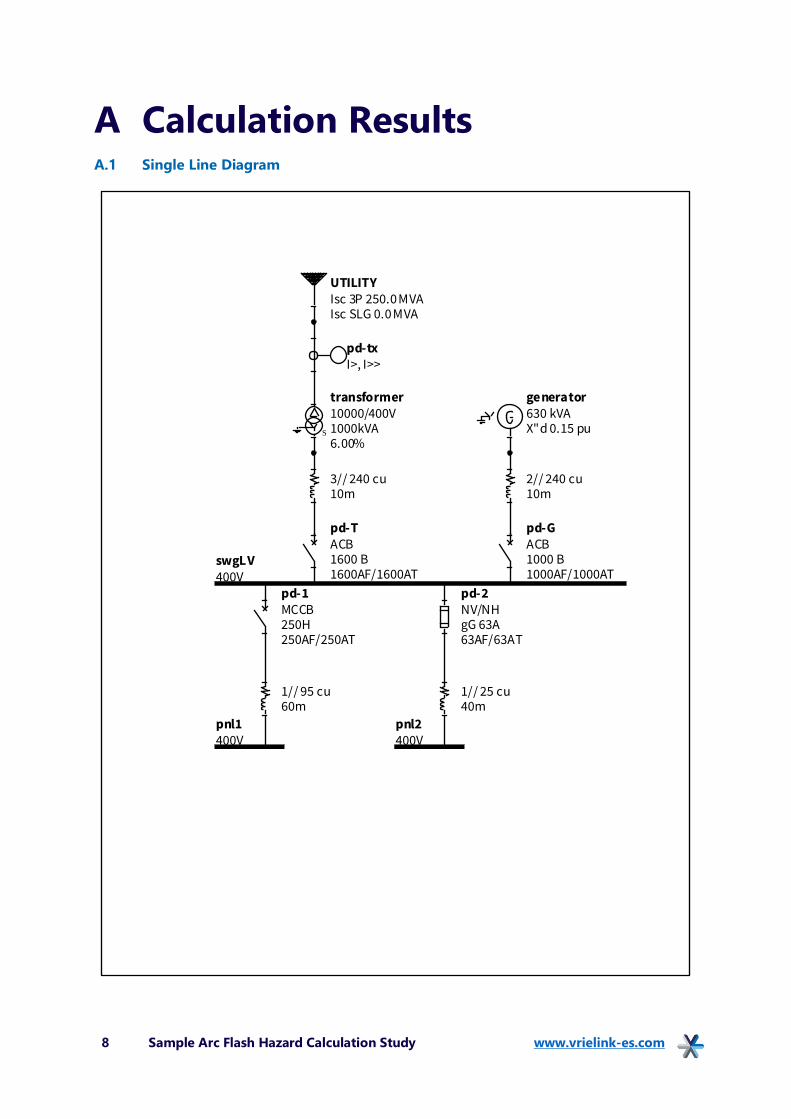
A Calculation Results A.1 Single Line Diagram
UTILITYIsc 3P 250.0 MVAIsc SLG 0.0 MVA
pd-txI>, I>>
S
transformer10000/400V1000kVA6.00%
swgLV400V
3// 240 cu10m
pd-TACB1600 B1600AF/1600AT
generator630 kVAX"d 0.15 pu
2// 240 cu10m
pd-GACB1000 B1000AF/1000AT
pd-1MCCB250H250AF/250AT
pd-2NV/NHgG 63A63AF/63AT
1// 95 cu60m
1// 25 cu40m
pnl1400V
pnl2400V
9 Sample Arc Flash Hazard Calculation Study www.vrielink-es.com
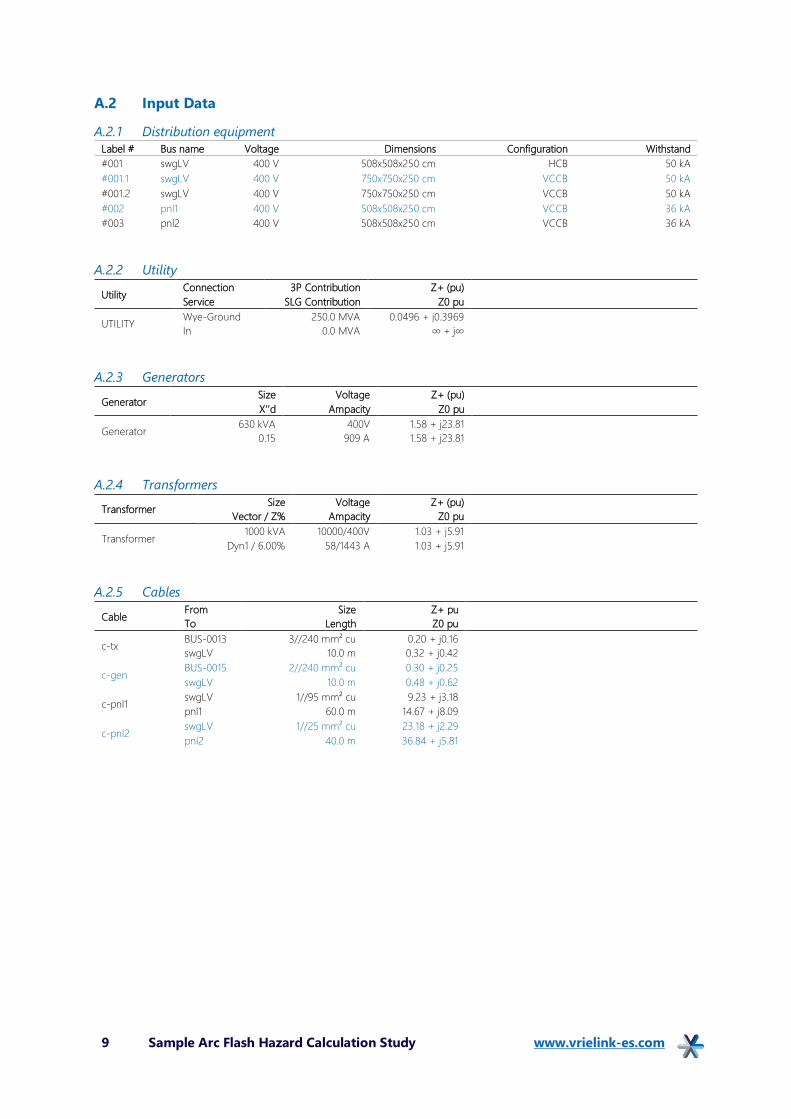
A.2 Input Data
A.2.1 Distribution equipment
Label # Bus name Voltage Dimensions Configuration Withstand
#001 swgLV 400 V 508x508x250 cm HCB 50 kA
#001.1 swgLV 400 V 750x750x250 cm VCCB 50 kA
#001.2 swgLV 400 V 750x750x250 cm VCCB 50 kA
#002 pnl1 400 V 508x508x250 cm VCCB 36 kA
#003 pnl2 400 V 508x508x250 cm VCCB 36 kA
A.2.2 Utility
Utility Connection 3P Contribution Z+ (pu)
Service SLG Contribution Z0 pu
UTILITY Wye-Ground 250.0 MVA 0.0496 + j0.3969
In 0.0 MVA ∞ + j∞
A.2.3 Generators
Generator Size Voltage Z+ (pu)
X’’d Ampacity Z0 pu
Generator 630 kVA 400V 1.58 + j23.81
0.15 909 A 1.58 + j23.81
A.2.4 Transformers
Transformer Size Voltage Z+ (pu)
Vector / Z% Ampacity Z0 pu
Transformer 1000 kVA 10000/400V 1.03 + j5.91
Dyn1 / 6.00% 58/1443 A 1.03 + j5.91
A.2.5 Cables
Cable From Size Z+ pu
To Length Z0 pu
c-tx BUS-0013 3//240 mm² cu 0.20 + j0.16
swgLV 10.0 m 0.32 + j0.42
c-gen BUS-0015 2//240 mm² cu 0.30 + j0.25
swgLV 10.0 m 0.48 + j0.62
c-pnl1 swgLV 1//95 mm² cu 9.23 + j3.18
pnl1 60.0 m 14.67 + j8.09
c-pnl2 swgLV 1//25 mm² cu 23.18 + j2.29
pnl2 40.0 m 36.84 + j5.81
10 Sample Arc Flash Hazard Calculation Study www.vrielink-es.com
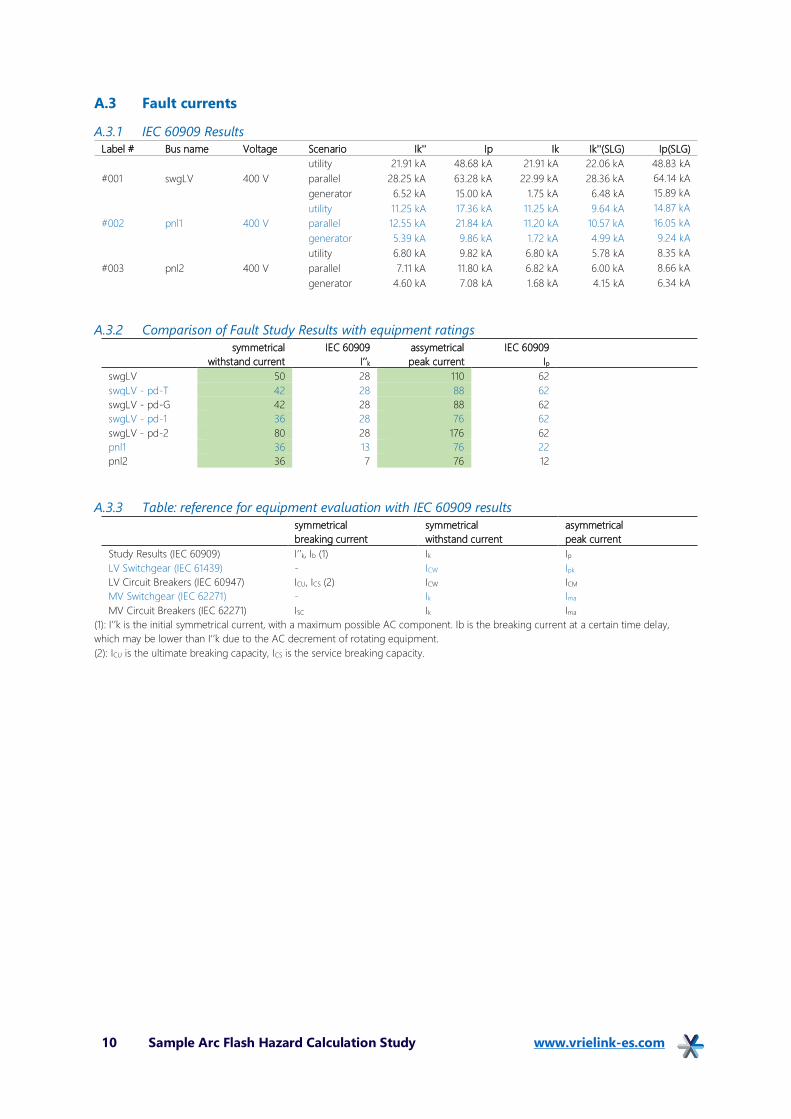
A.3 Fault currents
A.3.1 IEC 60909 Results
Label # Bus name Voltage Scenario Ik'' Ip Ik Ik''(SLG) Ip(SLG)
#001 swgLV 400 V
utility 21.91 kA 48.68 kA 21.91 kA 22.06 kA 48.83 kA parallel 28.25 kA 63.28 kA 22.99 kA 28.36 kA 64.14 kA generator 6.52 kA 15.00 kA 1.75 kA 6.48 kA 15.89 kA
#002 pnl1 400 V
utility 11.25 kA 17.36 kA 11.25 kA 9.64 kA 14.87 kA parallel 12.55 kA 21.84 kA 11.20 kA 10.57 kA 16.05 kA generator 5.39 kA 9.86 kA 1.72 kA 4.99 kA 9.24 kA
#003 pnl2 400 V
utility 6.80 kA 9.82 kA 6.80 kA 5.78 kA 8.35 kA parallel 7.11 kA 11.80 kA 6.82 kA 6.00 kA 8.66 kA generator 4.60 kA 7.08 kA 1.68 kA 4.15 kA 6.34 kA
A.3.2 Comparison of Fault Study Results with equipment ratings
symmetrical
withstand current
IEC 60909
I’’k
assymetrical
peak current
IEC 60909
Ip
swgLV 50 28 110 62
swgLV - pd-T 42 28 88 62
swgLV - pd-G 42 28 88 62
swgLV - pd-1 36 28 76 62
swgLV - pd-2 80 28 176 62
pnl1 36 13 76 22
pnl2 36 7 76 12
A.3.3 Table: reference for equipment evaluation with IEC 60909 results
symmetrical
breaking current
symmetrical
withstand current
asymmetrical
peak current
Study Results (IEC 60909) I’’k, Ib (1) Ik Ip
LV Switchgear (IEC 61439) - ICW Ipk
LV Circuit Breakers (IEC 60947) ICU, ICS (2) ICW ICM
MV Switchgear (IEC 62271) - Ik Ima
MV Circuit Breakers (IEC 62271) ISC Ik Ima
(1): I’’k is the initial symmetrical current, with a maximum possible AC component. Ib is the breaking current at a certain time delay,
which may be lower than I’’k due to the AC decrement of rotating equipment.
(2): ICU is the ultimate breaking capacity, ICS is the service breaking capacity.
11 Sample Arc Flash Hazard Calculation Study www.vrielink-es.com
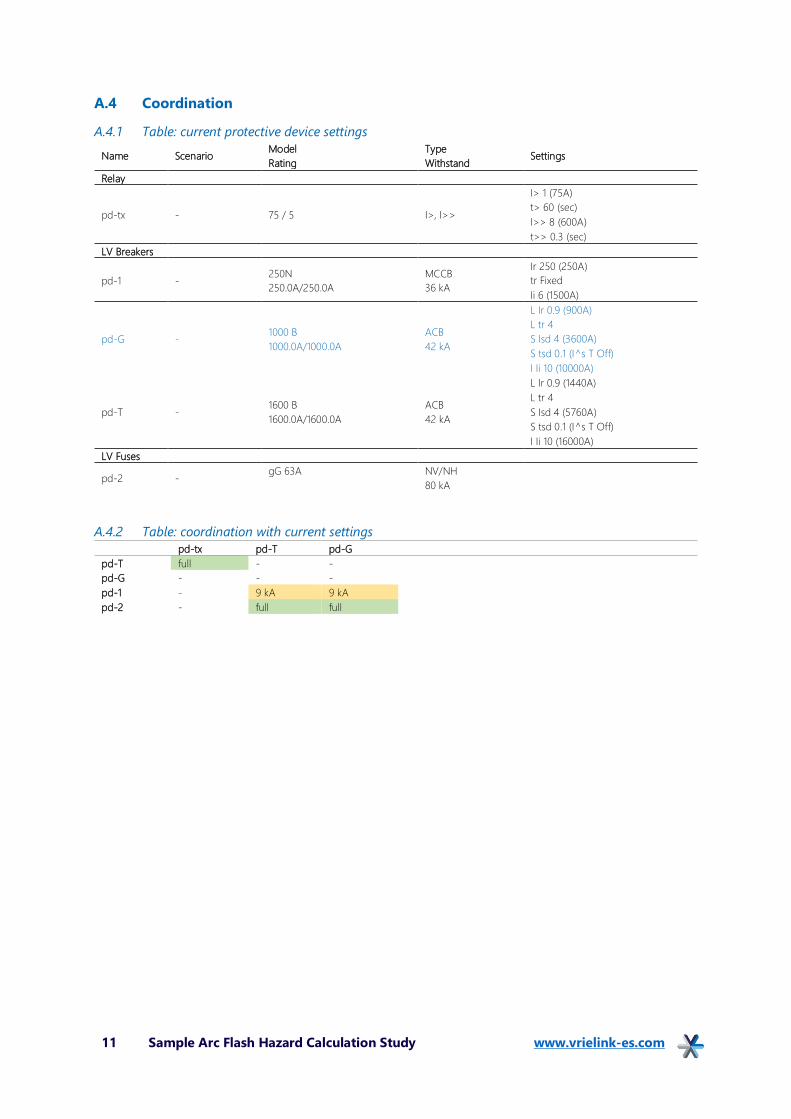
A.4 Coordination
A.4.1 Table: current protective device settings
Name Scenario Model Type
Settings Rating Withstand
Relay
pd-tx - 75 / 5 I>, I>>
I> 1 (75A)
t> 60 (sec)
I>> 8 (600A)
t>> 0.3 (sec)
LV Breakers
pd-1 - 250N
250.0A/250.0A
MCCB
36 kA
Ir 250 (250A)
tr Fixed
Ii 6 (1500A)
pd-G - 1000 B
1000.0A/1000.0A
ACB
42 kA
L Ir 0.9 (900A)
L tr 4
S Isd 4 (3600A)
S tsd 0.1 (I^s T Off)
I Ii 10 (10000A)
pd-T - 1600 B
1600.0A/1600.0A
ACB
42 kA
L Ir 0.9 (1440A)
L tr 4
S Isd 4 (5760A)
S tsd 0.1 (I^s T Off)
I Ii 10 (16000A)
LV Fuses
pd-2 - gG 63A NV/NH
80 kA
A.4.2 Table: coordination with current settings
pd-tx pd-T pd-G
pd-T full - -
pd-G - - -
pd-1 - 9 kA 9 kA
pd-2 - full full
12 Sample Arc Flash Hazard Calculation Study www.vrielink-es.com
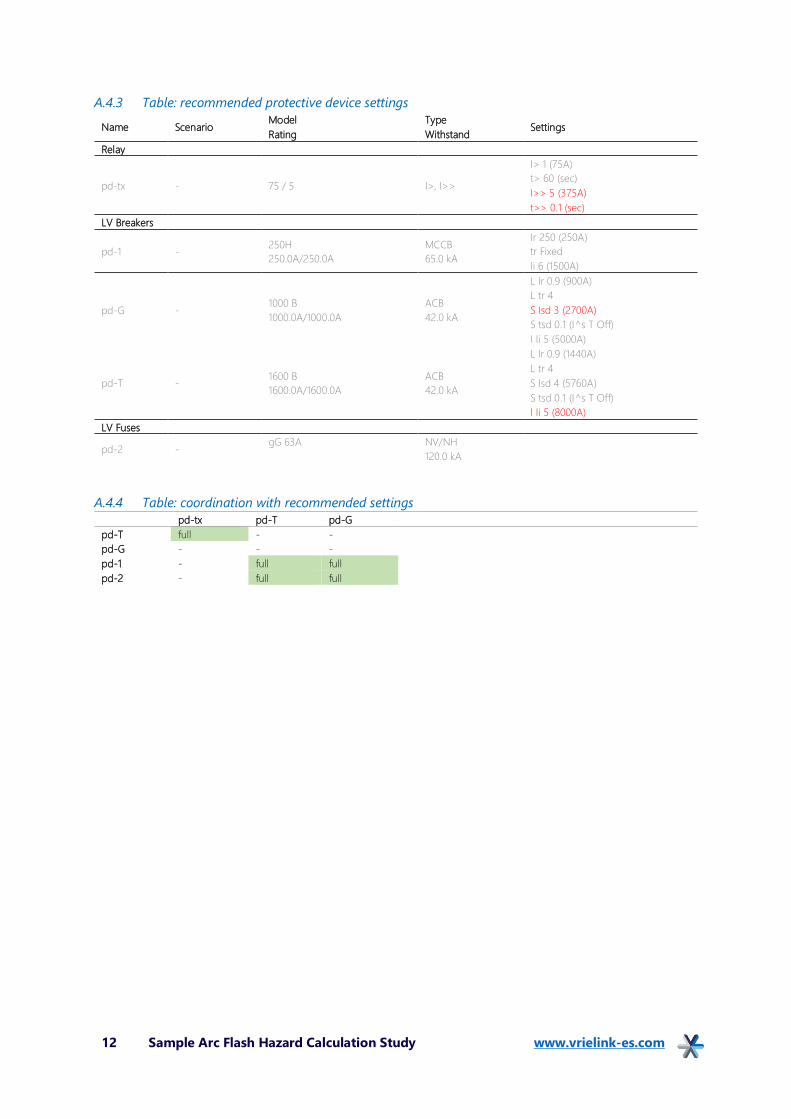
A.4.3 Table: recommended protective device settings
Name Scenario Model Type
Settings Rating Withstand
Relay
pd-tx - 75 / 5 I>, I>>
I> 1 (75A)
t> 60 (sec)
I>> 5 (375A)
t>> 0.1 (sec)
LV Breakers
pd-1 - 250H
250.0A/250.0A
MCCB
65.0 kA
Ir 250 (250A)
tr Fixed
Ii 6 (1500A)
pd-G - 1000 B
1000.0A/1000.0A
ACB
42.0 kA
L Ir 0.9 (900A)
L tr 4
S Isd 3 (2700A)
S tsd 0.1 (I^s T Off)
I Ii 5 (5000A)
pd-T - 1600 B
1600.0A/1600.0A
ACB
42.0 kA
L Ir 0.9 (1440A)
L tr 4
S Isd 4 (5760A)
S tsd 0.1 (I^s T Off)
I Ii 5 (8000A)
LV Fuses
pd-2 - gG 63A NV/NH
120.0 kA
A.4.4 Table: coordination with recommended settings
pd-tx pd-T pd-G
pd-T full - -
pd-G - - -
pd-1 - full full
pd-2 - full full
13 Sample Arc Flash Hazard Calculation Study www.vrielink-es.com
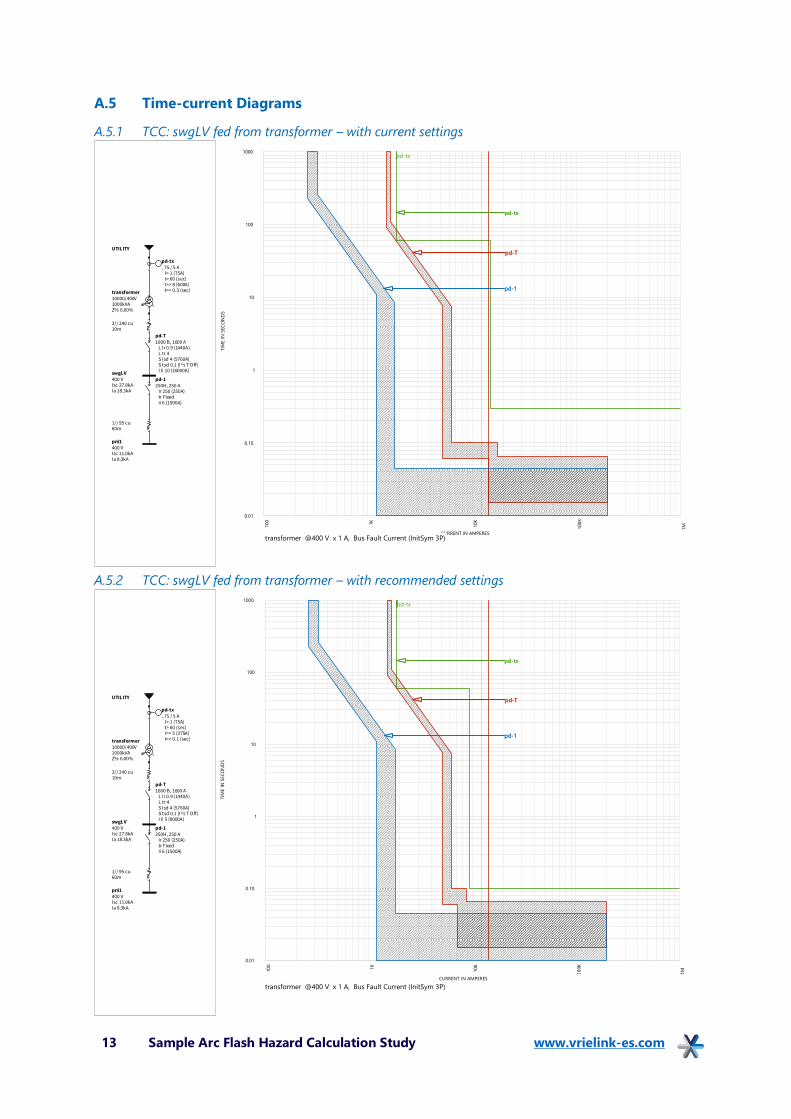
A.5 Time-current Diagrams
A.5.1 TCC: swgLV fed from transformer – with current settings
A.5.2 TCC: swgLV fed from transformer – with recommended settings
pd-tx
100
1K
10K
100
K
1M
0.01
0.10
1
10
100
1000
CURRENT IN AMPERES
TIM
E I
N S
EC
ON
DS
pd-tx
pd-T
pd-1
pd-tx
pd-T
pd-1
UTILITY
pd-tx, 75 / 5 A I> 1 (75A) t> 60 (sec) I>> 8 (600A) t>> 0.3 (sec)
S
transformer10000/400V1000kVAZ% 6.00%
3// 240 cu10m
pd-T1600 B, 1600 A L Ir 0.9 (1440A) L tr 4 S Isd 4 (5760A) S tsd 0.1 (I^s T Off) I Ii 10 (16000A)
pd-1250H, 250 A Ir 250 (250A) tr Fixed Ii 6 (1500A)
1// 95 cu60m
pnl1400 VIsc 11.0kAIa 8.3kA
swgLV400 VIsc 27.8kAIa 18.3kA
transformer @400 V x 1 A, Bus Fault Current (InitSym 3P)
pd-tx
10
0
1K
10
K
10
0K
1M
0.01
0.10
1
10
100
1000
CURRENT IN AMPERES
TIM
E I
N S
EC
ON
DS
pd-tx
pd-T
pd-1
pd-tx
pd-T
pd-1
UTILITY
pd-tx, 75 / 5 A I> 1 (75A) t> 60 (sec) I>> 5 (375A) t>> 0.1 (sec)
S
transformer10000/400V1000kVAZ% 6.00%
3// 240 cu10m
pd-T1600 B, 1600 A L Ir 0.9 (1440A) L tr 4 S Isd 4 (5760A) S tsd 0.1 (I^s T Off) I Ii 5 (8000A)
pd-1250H, 250 A Ir 250 (250A) tr Fixed Ii 6 (1500A)
1// 95 cu60m
pnl1400 VIsc 11.0kAIa 8.3kA
swgLV400 VIsc 27.8kAIa 18.3kA
transformer @400 V x 1 A, Bus Fault Current (InitSym 3P)

14 Sample Arc Flash Hazard Calculation Study www.vrielink-es.com
A.5.3 TCC: swgLV fed from generator – with current settings
A.5.4 TCC: swgLV fed from generator – with recommended settings
100
1K
10K
100K
1M
0.01
0.10
1
10
100
1000
CURRENT IN AMPERES
TIM
E I
N S
EC
ON
DS
pd-G
pd-1
pd-G
pd-1
generator
2// 240 cu10m
pd-G1000 B, 1000 A L Ir 0.9 (900A) L tr 4 S Isd 4 (3600A) S tsd 0.1 (I^s T Off) I Ii 10 (10000A)
pd-1250H, 250 A Ir 250 (250A) tr Fixed Ii 6 (1500A)1// 95 cu
60m
pnl1400 VIsc 11.0kAIa 8.3kA
swgLV400 VIsc 27.8kAIa 18.3kA
generator @400 V x 1 A, Bus Fault Current (InitSym 3P)
100
1K
10K
100K
1M
0.01
0.10
1
10
100
1000
CURRENT IN AMPERES
TIM
E I
N S
EC
ON
DS
pd-G
pd-1
pd-G
pd-1
generator
2// 240 cu10m
pd-G1000 B, 1000 A L Ir 0.9 (900A) L tr 4 S Isd 3 (2700A) S tsd 0.1 (I^s T Off) I Ii 10 (10000A)
pd-1250H, 250 A Ir 250 (250A) tr Fixed Ii 6 (1500A)1// 95 cu
60m
pnl1400 VIsc 11.0kAIa 8.3kA
swgLV400 VIsc 27.8kAIa 18.3kA
generator @400 V x 1 A, Bus Fault Current (InitSym 3P)
15 Sample Arc Flash Hazard Calculation Study www.vrielink-es.com
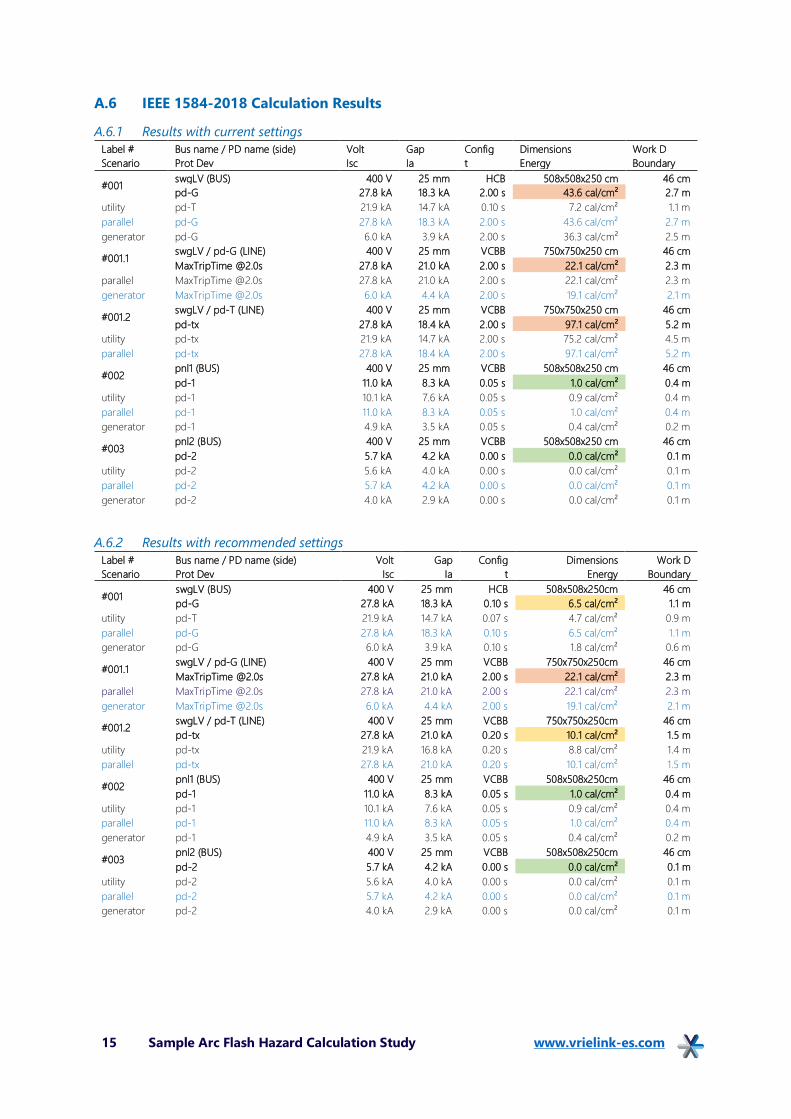
A.6 IEEE 1584-2018 Calculation Results
A.6.1 Results with current settings
Label # Bus name / PD name (side) Volt Gap Config Dimensions Work D
Scenario Prot Dev Isc Ia t Energy Boundary
#001 swgLV (BUS) 400 V 25 mm HCB 508x508x250 cm 46 cm
pd-G 27.8 kA 18.3 kA 2.00 s 43.6 cal/cm² 2.7 m
utility pd-T 21.9 kA 14.7 kA 0.10 s 7.2 cal/cm² 1.1 m
parallel pd-G 27.8 kA 18.3 kA 2.00 s 43.6 cal/cm² 2.7 m
generator pd-G 6.0 kA 3.9 kA 2.00 s 36.3 cal/cm² 2.5 m
#001.1 swgLV / pd-G (LINE) 400 V 25 mm VCBB 750x750x250 cm 46 cm
MaxTripTime @2.0s 27.8 kA 21.0 kA 2.00 s 22.1 cal/cm² 2.3 m
parallel MaxTripTime @2.0s 27.8 kA 21.0 kA 2.00 s 22.1 cal/cm² 2.3 m
generator MaxTripTime @2.0s 6.0 kA 4.4 kA 2.00 s 19.1 cal/cm² 2.1 m
#001.2 swgLV / pd-T (LINE) 400 V 25 mm VCBB 750x750x250 cm 46 cm
pd-tx 27.8 kA 18.4 kA 2.00 s 97.1 cal/cm² 5.2 m
utility pd-tx 21.9 kA 14.7 kA 2.00 s 75.2 cal/cm² 4.5 m
parallel pd-tx 27.8 kA 18.4 kA 2.00 s 97.1 cal/cm² 5.2 m
#002 pnl1 (BUS) 400 V 25 mm VCBB 508x508x250 cm 46 cm
pd-1 11.0 kA 8.3 kA 0.05 s 1.0 cal/cm² 0.4 m
utility pd-1 10.1 kA 7.6 kA 0.05 s 0.9 cal/cm² 0.4 m
parallel pd-1 11.0 kA 8.3 kA 0.05 s 1.0 cal/cm² 0.4 m
generator pd-1 4.9 kA 3.5 kA 0.05 s 0.4 cal/cm² 0.2 m
#003 pnl2 (BUS) 400 V 25 mm VCBB 508x508x250 cm 46 cm
pd-2 5.7 kA 4.2 kA 0.00 s 0.0 cal/cm² 0.1 m
utility pd-2 5.6 kA 4.0 kA 0.00 s 0.0 cal/cm² 0.1 m
parallel pd-2 5.7 kA 4.2 kA 0.00 s 0.0 cal/cm² 0.1 m
generator pd-2 4.0 kA 2.9 kA 0.00 s 0.0 cal/cm² 0.1 m
A.6.2 Results with recommended settings
Label # Bus name / PD name (side) Volt Gap Config Dimensions Work D
Scenario Prot Dev Isc Ia t Energy Boundary
#001 swgLV (BUS) 400 V 25 mm HCB 508x508x250cm 46 cm
pd-G 27.8 kA 18.3 kA 0.10 s 6.5 cal/cm² 1.1 m
utility pd-T 21.9 kA 14.7 kA 0.07 s 4.7 cal/cm² 0.9 m
parallel pd-G 27.8 kA 18.3 kA 0.10 s 6.5 cal/cm² 1.1 m
generator pd-G 6.0 kA 3.9 kA 0.10 s 1.8 cal/cm² 0.6 m
#001.1 swgLV / pd-G (LINE) 400 V 25 mm VCBB 750x750x250cm 46 cm
MaxTripTime @2.0s 27.8 kA 21.0 kA 2.00 s 22.1 cal/cm² 2.3 m
parallel MaxTripTime @2.0s 27.8 kA 21.0 kA 2.00 s 22.1 cal/cm² 2.3 m
generator MaxTripTime @2.0s 6.0 kA 4.4 kA 2.00 s 19.1 cal/cm² 2.1 m
#001.2 swgLV / pd-T (LINE) 400 V 25 mm VCBB 750x750x250cm 46 cm
pd-tx 27.8 kA 21.0 kA 0.20 s 10.1 cal/cm² 1.5 m
utility pd-tx 21.9 kA 16.8 kA 0.20 s 8.8 cal/cm² 1.4 m
parallel pd-tx 27.8 kA 21.0 kA 0.20 s 10.1 cal/cm² 1.5 m
#002 pnl1 (BUS) 400 V 25 mm VCBB 508x508x250cm 46 cm
pd-1 11.0 kA 8.3 kA 0.05 s 1.0 cal/cm² 0.4 m
utility pd-1 10.1 kA 7.6 kA 0.05 s 0.9 cal/cm² 0.4 m
parallel pd-1 11.0 kA 8.3 kA 0.05 s 1.0 cal/cm² 0.4 m
generator pd-1 4.9 kA 3.5 kA 0.05 s 0.4 cal/cm² 0.2 m
#003 pnl2 (BUS) 400 V 25 mm VCBB 508x508x250cm 46 cm
pd-2 5.7 kA 4.2 kA 0.00 s 0.0 cal/cm² 0.1 m
utility pd-2 5.6 kA 4.0 kA 0.00 s 0.0 cal/cm² 0.1 m
parallel pd-2 5.7 kA 4.2 kA 0.00 s 0.0 cal/cm² 0.1 m
generator pd-2 4.0 kA 2.9 kA 0.00 s 0.0 cal/cm² 0.1 m
16 Sample Arc Flash Hazard Calculation Study www.vrielink-es.com
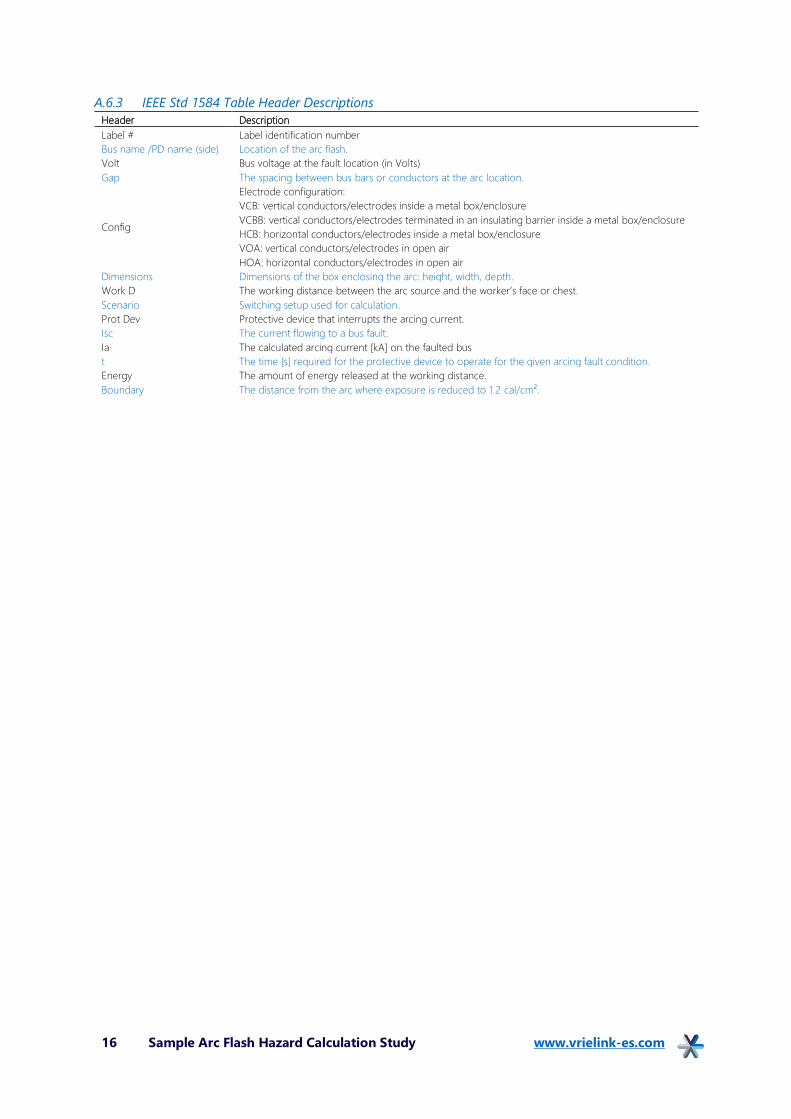
A.6.3 IEEE Std 1584 Table Header Descriptions
Header Description
Label # Label identification number
Bus name /PD name (side) Location of the arc flash.
Volt Bus voltage at the fault location (in Volts)
Gap The spacing between bus bars or conductors at the arc location.
Config
Electrode configuration:
VCB: vertical conductors/electrodes inside a metal box/enclosure
VCBB: vertical conductors/electrodes terminated in an insulating barrier inside a metal box/enclosure
HCB: horizontal conductors/electrodes inside a metal box/enclosure
VOA: vertical conductors/electrodes in open air
HOA: horizontal conductors/electrodes in open air
Dimensions Dimensions of the box enclosing the arc: height, width, depth.
Work D The working distance between the arc source and the worker’s face or chest.
Scenario Switching setup used for calculation.
Prot Dev Protective device that interrupts the arcing current.
Isc The current flowing to a bus fault.
Ia The calculated arcing current [kA] on the faulted bus
t The time [s] required for the protective device to operate for the given arcing fault condition.
Energy The amount of energy released at the working distance.
Boundary The distance from the arc where exposure is reduced to 1.2 cal/cm².
17 Sample Arc Flash Hazard Calculation Study www.vrielink-es.com
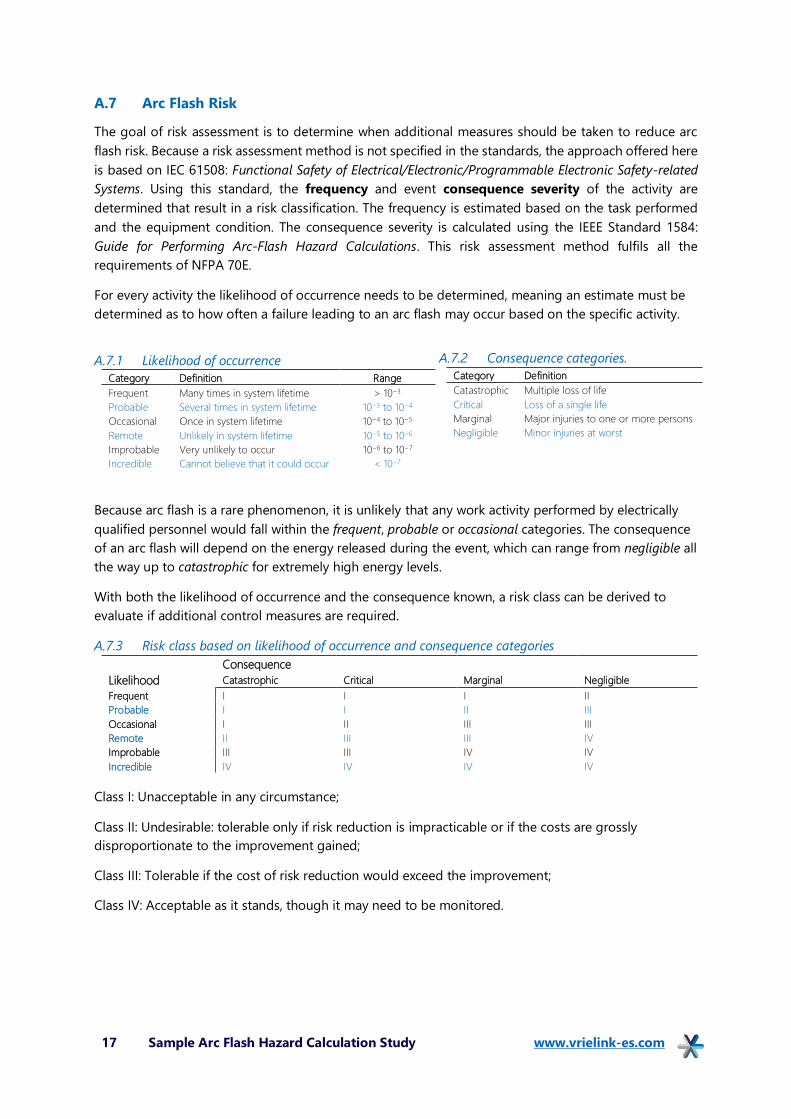
A.7 Arc Flash Risk
The goal of risk assessment is to determine when additional measures should be taken to reduce arc
flash risk. Because a risk assessment method is not specified in the standards, the approach offered here
is based on IEC 61508: Functional Safety of Electrical/Electronic/Programmable Electronic Safety-related
Systems. Using this standard, the frequency and event consequence severity of the activity are
determined that result in a risk classification. The frequency is estimated based on the task performed
and the equipment condition. The consequence severity is calculated using the IEEE Standard 1584:
Guide for Performing Arc-Flash Hazard Calculations. This risk assessment method fulfils all the
requirements of NFPA 70E.
For every activity the likelihood of occurrence needs to be determined, meaning an estimate must be
determined as to how often a failure leading to an arc flash may occur based on the specific activity.
A.7.1 Likelihood of occurrence
Category Definition Range
Frequent Many times in system lifetime > 10−3
Probable Several times in system lifetime 10−3 to 10−4
Occasional Once in system lifetime 10−4 to 10−5
Remote Unlikely in system lifetime 10−5 to 10−6
Improbable Very unlikely to occur 10−6 to 10−7
Incredible Cannot believe that it could occur < 10−7
A.7.2 Consequence categories.
Category Definition
Catastrophic Multiple loss of life
Critical Loss of a single life
Marginal Major injuries to one or more persons
Negligible Minor injuries at worst
Because arc flash is a rare phenomenon, it is unlikely that any work activity performed by electrically
qualified personnel would fall within the frequent, probable or occasional categories. The consequence
of an arc flash will depend on the energy released during the event, which can range from negligible all
the way up to catastrophic for extremely high energy levels.
With both the likelihood of occurrence and the consequence known, a risk class can be derived to
evaluate if additional control measures are required.
A.7.3 Risk class based on likelihood of occurrence and consequence categories
Consequence
Likelihood Catastrophic Critical Marginal Negligible
Frequent I I I II
Probable I I II III
Occasional I II III III
Remote II III III IV
Improbable III III IV IV
Incredible IV IV IV IV
Class I: Unacceptable in any circumstance;
Class II: Undesirable: tolerable only if risk reduction is impracticable or if the costs are grossly
disproportionate to the improvement gained;
Class III: Tolerable if the cost of risk reduction would exceed the improvement;
Class IV: Acceptable as it stands, though it may need to be monitored.

18 of 19 Sample Arc Flash Hazard Calculation Study – www.vrielink-es.com
For arc flash incident energy, the consequence category will be divided as follows:
A.7.4 Arc flash incident energy and consequence categories
Table Error! Reference source not found..1: Arc flash incident energy and consequence categories
Incident Energy Category Consequence
Below 1.2 cal/cm² Negligible Minor injuries at worst
1.2 – 12 cal/cm² Critical Loss of a single life
Over 12 cal/cm² Catastrophic Multiple loss of life
The likelihood of occurrence for electrical arcs depends on the task performed and the
condition of the equipment. The table below is based on NFPA 70E table 130.5(C), but
adjusted to only show the likelihood, not risk assessment results.
A.7.5 Likelihood of occurrence for tasks with possible exposure to electrical arcs.
Task Likelihood
Reading a panel meter while operating a meter switch. Incredible
Examination of insulated cable with no manipulation of cable. Incredible
Operation of a CB, switch, contactor, or starter. Normal equipment condition. Incredible
Removal or installation of covers for equipment such as wireways, junction boxes, and cable trays that does not
expose bare, energized electrical conductors and circuit parts. Normal equipment condition. Incredible
Opening a panelboard hinged door or cover to access dead front overcurrent devices. Normal equipment
condition. Incredible
Performing infrared thermography and other non-contact inspections outside the restricted approach boundary.
This activity does not include opening of doors or covers. Improbable
Working on control circuits with exposed energized electrical conductors and circuit parts, nominal 125 volts ac or
dc, or below without any other exposed energized equipment over nominal 125 volts ac or dc, including opening of
hinged covers to gain access.
Improbable
For dc systems, insertion or removal of individual cells or multi-cell units of a battery system in an open rack. Improbable
For dc systems, maintenance on a single cell of a battery system or multi-cell units in an open rack. Improbable
Removal of battery nonconductive intercell connector covers. Normal equipment condition. Improbable
Voltage testing on individual battery cells or individual multi-cell units. Normal equipment condition. Improbable
For ac systems, work on energized electrical conductors and circuit parts, including voltage testing. Remote
For dc systems, working on energized electrical conductors and circuit parts of series-connected battery cells,
including voltage testing. Remote
Removal or installation of CBs or switches. Remote
Opening hinged door(s) or cover(s) or removal of bolted covers (to expose bare, energized electrical conductors
and circuit parts). For dc systems, this includes bolted covers, such as battery terminal covers. Remote
Application of temporary protective grounding equipment, after voltage test. Remote
Working on control circuits with exposed energized electrical conductors and circuit parts, greater than 120 volts. Remote
Insertion or removal of individual starter buckets from motor control center (MCC). Remote
Insertion or removal (racking) of circuit breakers (CBs) or starters from cubicles, doors open or closed. Remote
Examination of insulated cable with manipulation of cable. Remote
Working on exposed energized electrical conductors and circuit parts of equipment directly supplied by a
panelboard or motor control center. Remote
Insertion or removal of revenue meters (kW-hour, at primary voltage and current). Remote
Removal of battery conductive intercell connector covers. Remote
Opening voltage transformer or control power transformer compartments. Remote
Operation of outdoor disconnect switch (hookstick operated) at 1 kV through 15 kV. Remote
Operation of outdoor disconnect switch (gang-operated, from grade) at 1 kV through 15 kV. Remote
Maintenance and testing on individual battery cells or individual multi-cell units in an open rack. Abnormal
equipment condition. Remote
Insertion or removal of individual cells or multi-cell units of a battery system in an open rack. Abnormal equipment
condition. Remote
Arc-resistant switchgear Type 1 or 2 (for clearing times of less than 0.5 sec with a prospective fault current not to
exceed the arc-resistant rating of the equipment) and metal enclosed interrupter switchgear, fused or unfused of
arc resistant type construction, 1 kV through 15 kV. Abnormal equipment condition.
Remote
Insertion or removal (racking) of CBs from cubicles; Insertion or removal (racking) of ground and test device; or
Insertion or removal (racking) of voltage transformers on or off the bus. Abnormal equipment condition. Remote

19 of 19 Sample Arc Flash Hazard Calculation Study – www.vrielink-es.com
Normal equipment condition is defined as:
• The equipment is properly installed in accordance with the manufacturer’s recommendations and applicable industry codes
and standards.
• The equipment is properly maintained in accordance with the manufacturer’s recommendations and applicable industry
codes and standards.
• The equipment is used in accordance with instructions included in the listing and labeling and in accordance with
manufacturer’s instructions.
• Equipment doors are closed and secured.
• Equipment covers are in place and secured.
• There is no evidence of impending failure such as arcing, overheating, loose or bound equipment parts, visible damage, or
deterioration.
Using the tables above we obtain the following risk classes for electrical arcs:
A.7.6 Risk class for electrical arcs
Hazard Likelihood Consequence Risk Class
Over 12 cal/cm²
Remote Catastrophic Class II
Improbable Catastrophic Class III
Incredible Catastrophic Class IV
1,2-12 cal/cm²
Remote Critical Class III
Improbable Critical Class III
Incredible Critical Class IV
Under 1,2 cal/cm²
Remote Negligible Class IV
Improbable Negligible Class IV
Incredible Negligible Class IV
These results show that control measures should be implemented in the following cases:
• Tasks with a remote or improbable likelihood and a calculated hazard > 1.2
cal/cm².
• Special consideration for remote likelihood and calculated hazard > 12 cal/cm².
Conversely, additional control measures, including PPE, are not required for:
• Tasks with a calculated hazard < 1.2 cal/cm².
• Tasks with an incredible likelihood.