sample answers to hw set 3a - lehigh.edu
TRANSCRIPT
SAMPLE ANSWERS TO HW SET 3A Copied below are some examples of (more or less) successful answers to the HW problems that were originally due on Sept. 26th. I selected these examples to give everyone an idea on how to solve each problem- don’t read anything into why I chose what examples I did. Mostly, I’ve selected answers that seem straight-forward. 1. Calculate the rate of rise of spherical bubbles of different sizes (from 10 microns to 1 cm) in a
molten glass tank, glass density 2.5 g/cm3 and a viscosity of 102 P. How long will it take bubbles of different sizes to rise 100 cm under these conditions?
Example 1:
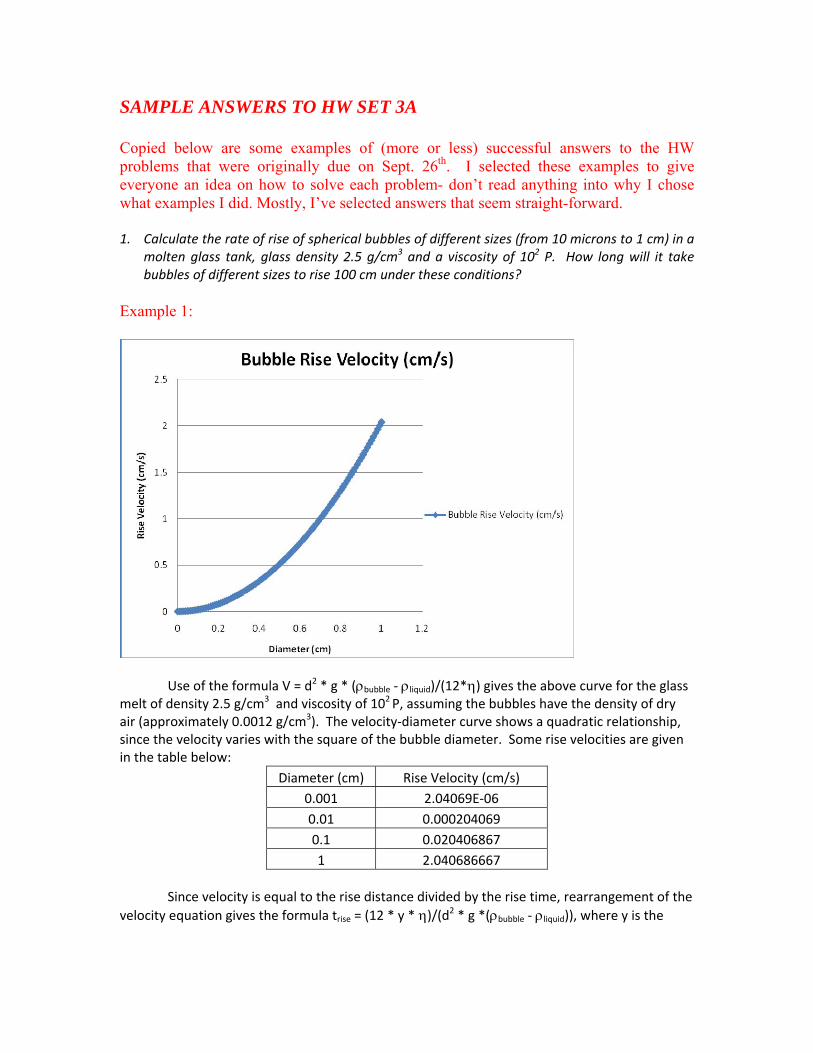
Use of the formula V = d2 * g * (ρbubble ‐ ρliquid)/(12*η) gives the above curve for the glass melt of density 2.5 g/cm3 and viscosity of 102 P, assuming the bubbles have the density of dry air (approximately 0.0012 g/cm3). The velocity‐diameter curve shows a quadratic relationship, since the velocity varies with the square of the bubble diameter. Some rise velocities are given in the table below:
Diameter (cm) Rise Velocity (cm/s) 0.001 2.04069E‐06 0.01 0.000204069 0.1 0.020406867 1 2.040686667
Since velocity is equal to the rise distance divided by the rise time, rearrangement of the velocity equation gives the formula trise = (12 * y * η)/(d2 * g *(ρbubble ‐ ρliquid)), where y is the
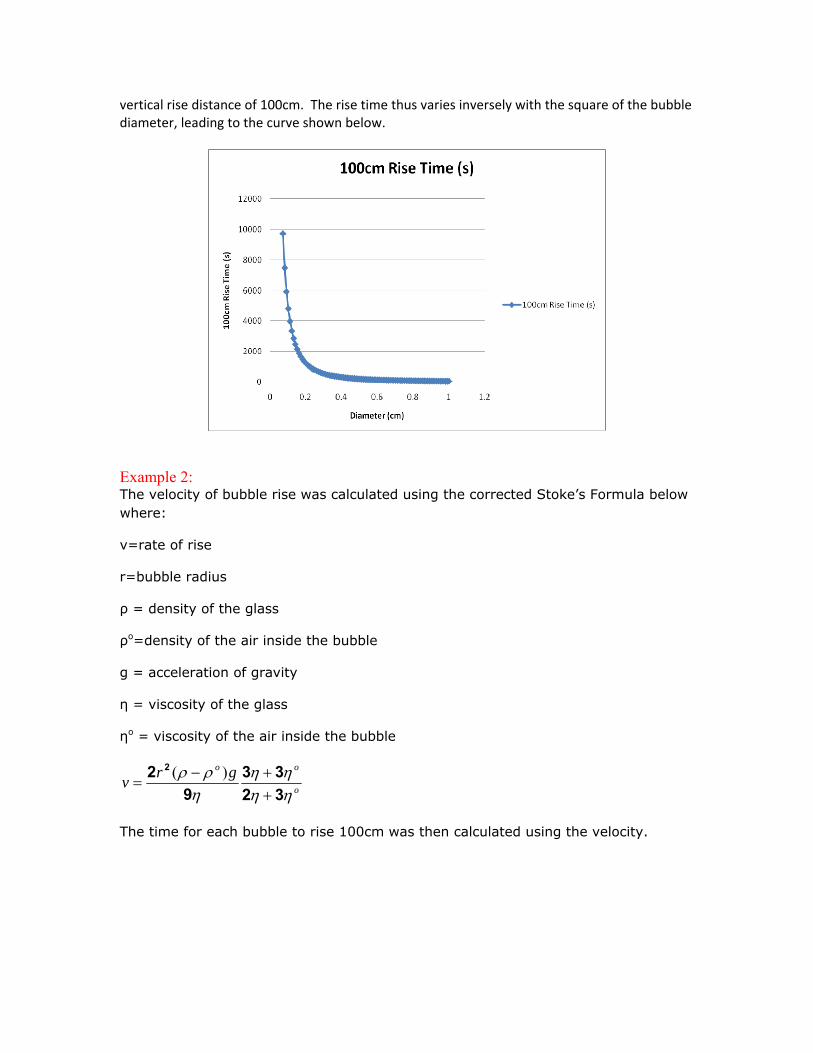
vertical rise distance of 100cm. The rise time thus varies inversely with the square of the bubble diameter, leading to the curve shown below.
Example 2: The velocity of bubble rise was calculated using the corrected Stoke’s Formula below where:
v=rate of rise
r=bubble radius
ρ = density of the glass
ρo=density of the air inside the bubble
g = acceleration of gravity
η = viscosity of the glass
ηo = viscosity of the air inside the bubble
o
oo grvηηηη
ηρρ
3233
92 2
++−
=)(
The time for each bubble to rise 100cm was then calculated using the velocity.
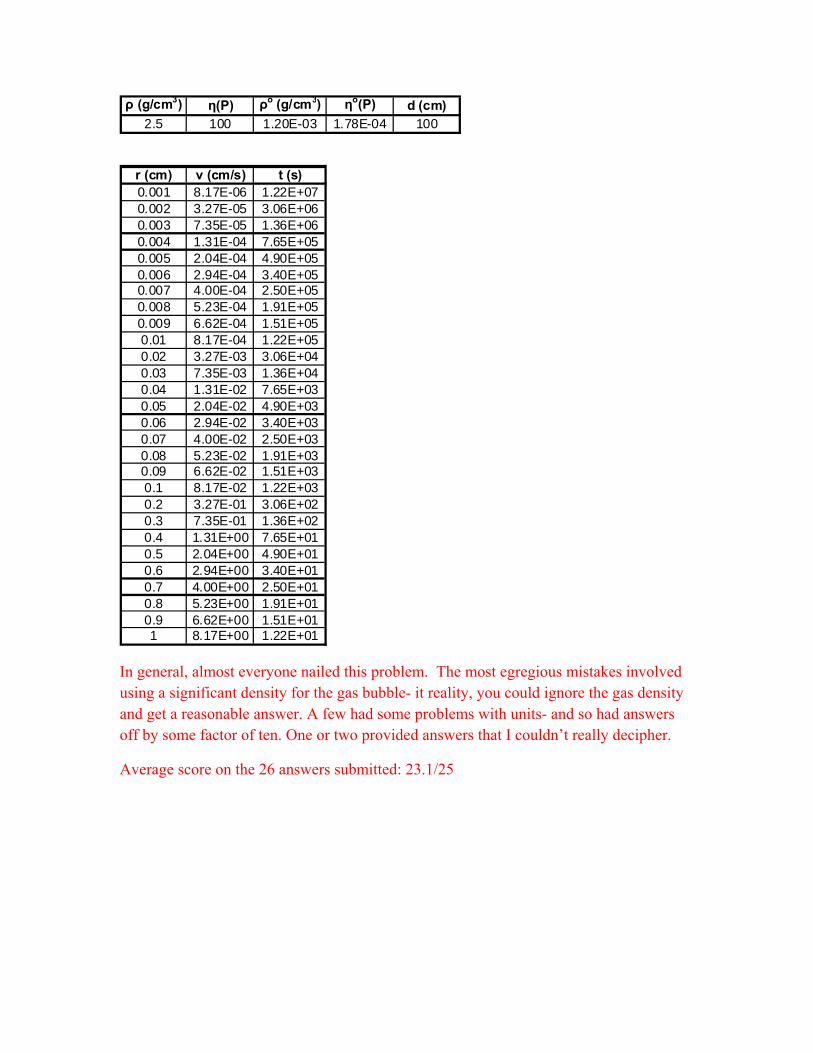
ρ (g/cm3) η(P) ρo (g/cm3) ηo(P) d (cm)2.5 100 1.20E-03 1.78E-04 100
r (cm) v (cm/s) t (s)0.001 8.17E-06 1.22E+070.002 3.27E-05 3.06E+060.003 7.35E-05 1.36E+060.004 1.31E-04 7.65E+050.005 2.04E-04 4.90E+050.006 2.94E-04 3.40E+050.007 4.00E-04 2.50E+050.008 5.23E-04 1.91E+050.009 6.62E-04 1.51E+050.01 8.17E-04 1.22E+050.02 3.27E-03 3.06E+040.03 7.35E-03 1.36E+040.04 1.31E-02 7.65E+030.05 2.04E-02 4.90E+030.06 2.94E-02 3.40E+030.07 4.00E-02 2.50E+030.08 5.23E-02 1.91E+030.09 6.62E-02 1.51E+030.1 8.17E-02 1.22E+030.2 3.27E-01 3.06E+020.3 7.35E-01 1.36E+020.4 1.31E+00 7.65E+010.5 2.04E+00 4.90E+010.6 2.94E+00 3.40E+010.7 4.00E+00 2.50E+010.8 5.23E+00 1.91E+010.9 6.62E+00 1.51E+011 8.17E+00 1.22E+01
In general, almost everyone nailed this problem. The most egregious mistakes involved using a significant density for the gas bubble- it reality, you could ignore the gas density and get a reasonable answer. A few had some problems with units- and so had answers off by some factor of ten. One or two provided answers that I couldn’t really decipher.
Average score on the 26 answers submitted: 23.1/25

2. Consider a soda‐lime silicate glass fiber in a Littleton softening point experiment. The surface tension of the glass in a dry atmosphere is 300 mN/m and the measured Littleton softening point is 750 ºC. When the fiber is equilibrated in a wet atmosphere, the surface tension is reduced to 200 mN/m. By how much does the apparent Littleton softening temperature change?
Example 1:

Example 2:
The equation to describe the viscosity of a fiber in a fiber elongation experiment is:
ηρ γ
=
+⎛⎝⎜
⎞⎠⎟ −
Lp p g pr
dpdt
2
2
3
where η is the viscosity, L is the length of fiber outside of the furnace, p is the length of fiber inside the furnace, ρ is the glass density, g is the acceleration of gravity, γ is the surface tension, r is the average radius of the fiber, and dp/dt is the fiber elongation rate. The Littleton softening point experiment has set values for many of these variables, such that η = 106.65 Pa∙s when L = 0.135 m, p = 0.100 m, r = 0.275‐0.375 mm, and dp/dt = 1 mm/min.
If a glass with a surface tension of γ = 300 mN/m is subjected to these conditions (and if we assume the average acceptable radius of 0.325 mm), we can back calculate the density of the glass from the above equation to be 2.738 g/cm3.
( ) ( )( )
( ) ( )ρ
η γ
=+
+⎛⎝⎜
⎞⎠⎟
=⋅ ⎛
⎝⎜⎞⎠⎟
+
⋅× +⎛
⎝⎜⎜
⎞
⎠⎟⎟
= ⋅
−
−
−3
2
3 10 0 00160
0 3 010
0 000325
9 810135 0100 0100
2
2738 42
6 651
22
3
dpdt
pr
g Lp p
Pa s m Nm m
m
m sm m m
kg m
. .sec
. .
.
.. . .
.
If this same glass was then equilibrated in a wet atmosphere such that the surface tension was lowered to 200 mN/m, the apparent viscosity would decrease to 106.706 Pa∙s.
( ) ( )( ) ( )( )
ηρ γ
=
+⎛⎝⎜
⎞⎠⎟ −
=
× +⎛
⎝⎜⎜
⎞
⎠⎟⎟ ⋅ ⋅ −
⋅
⎛⎝⎜
⎞⎠⎟
= ⋅ = ⋅
− −−
Lp p g pr
dpdt
m m mkg m m s
N m m
m
m
Pa s Pa s
2
23 2
1
6 706
2
3
0135 0100 01002
2738 9 810 200 0100
0 000325
3 0 00160
5082201 10
. . ..
. .
.
.sec
.
Examining the viscosity‐temperature relationship of a typical soda lime silicate glass will give us the apparent Littleton softening temperature in the wet conditions. We can assume that the viscosity follows a VFT relationship, described by the following equation:
( )η η=
−
⎡
⎣⎢
⎤
⎦⎥o
o
HR T T
exp Δ,
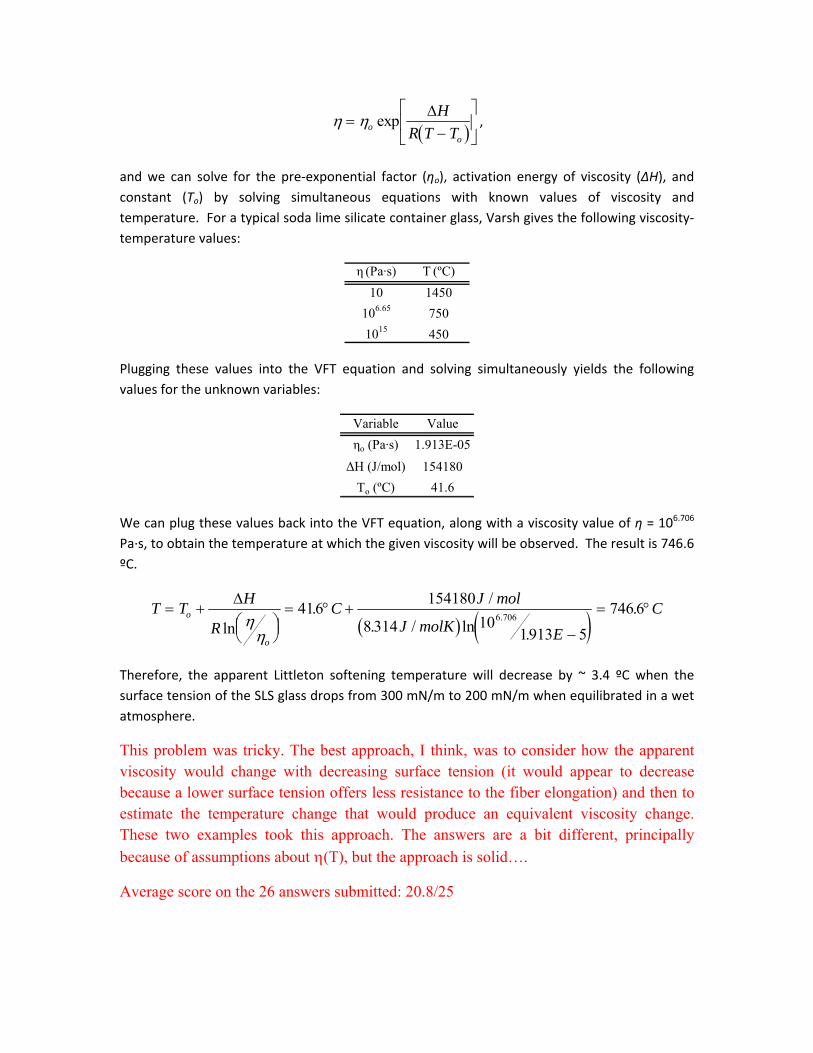
and we can solve for the pre‐exponential factor (ηo), activation energy of viscosity (ΔH), and constant (To) by solving simultaneous equations with known values of viscosity and temperature. For a typical soda lime silicate container glass, Varsh gives the following viscosity‐temperature values:
η (Pa·s) T (ºC)10 1450
106.65 7501015 450
Plugging these values into the VFT equation and solving simultaneously yields the following values for the unknown variables:
Variable Valueηo (Pa·s) 1.913E-05
ΔH (J/mol) 154180To (ºC) 41.6
We can plug these values back into the VFT equation, along with a viscosity value of η = 106.706 Pa∙s, to obtain the temperature at which the given viscosity will be observed. The result is 746.6 ºC.
( ) ( )T T H
RC J mol
J molK ECo
o
= +⎛⎝⎜
⎞⎠⎟
= ° +
−
= °Δ
ln. /
. / ln ..
.ηη
416 154180
8 314 101913 5
746 66 706
Therefore, the apparent Littleton softening temperature will decrease by ~ 3.4 ºC when the surface tension of the SLS glass drops from 300 mN/m to 200 mN/m when equilibrated in a wet atmosphere.
This problem was tricky. The best approach, I think, was to consider how the apparent viscosity would change with decreasing surface tension (it would appear to decrease because a lower surface tension offers less resistance to the fiber elongation) and then to estimate the temperature change that would produce an equivalent viscosity change. These two examples took this approach. The answers are a bit different, principally because of assumptions about η(T), but the approach is solid….
Average score on the 26 answers submitted: 20.8/25
3. Review the 1995 Science article by Angell, then describe and explain in detail the relationship between the change in heat capacity at Tg and the fragility characteristics of the corresponding melt viscosities. On the Angell ‘fragility plot’ why do all normalized viscosity curves converge at an apparent viscosity of ~10‐4 P as Tg/T → 0?
Example 1
The first part of the answer discusses the effects of structural changes in supercooled melts near Tg on changes in heat capacity and viscosity. Most answers I received were similar, but most people had problems with the second part of the question. I like the last part of the answer shown above. Turns out that the viscosity (at room temperature and pressure of common gases also fall within the range 10-3.5-10-5 Pa·s range, the same range for which the VFT extrapolations for silicate melts converge when T→∞. (See Russell et al., Amer. Mineral. 88 1390 (2003).
Example 2
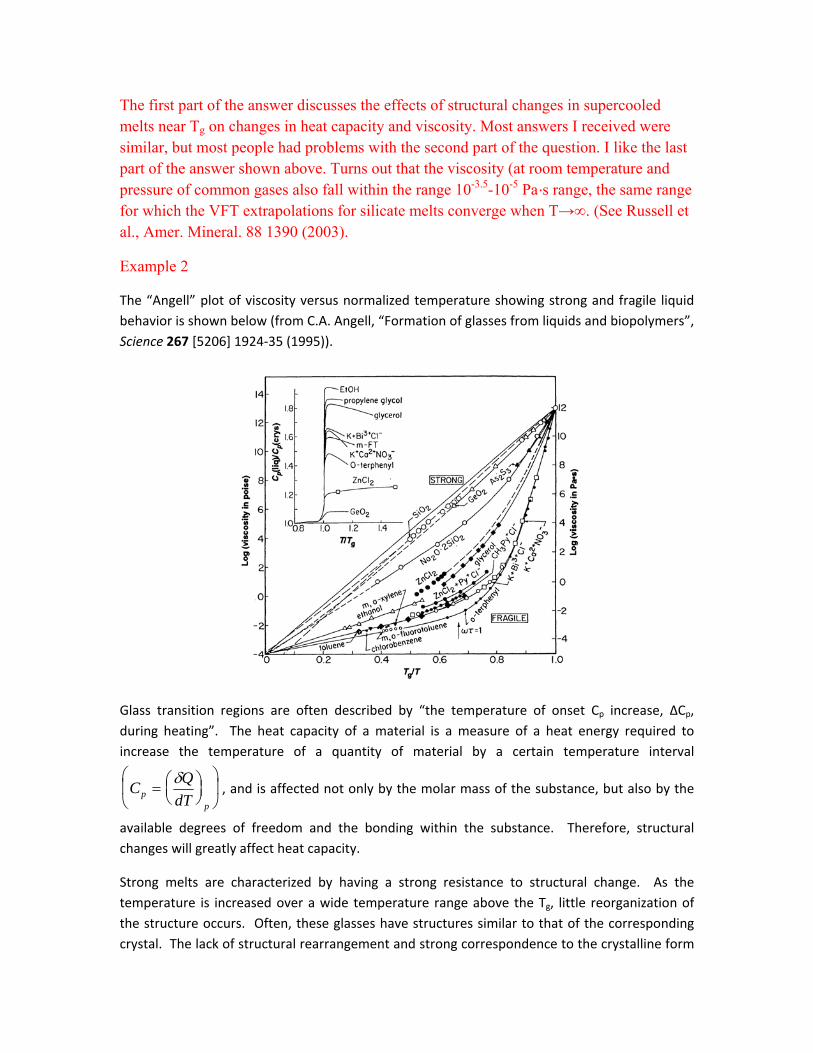
The “Angell” plot of viscosity versus normalized temperature showing strong and fragile liquid behavior is shown below (from C.A. Angell, “Formation of glasses from liquids and biopolymers”, Science 267 [5206] 1924‐35 (1995)).
Glass transition regions are often described by “the temperature of onset Cp increase, ΔCp, during heating”. The heat capacity of a material is a measure of a heat energy required to increase the temperature of a quantity of material by a certain temperature interval
C QdTp
p
= ⎛⎝⎜
⎞⎠⎟
⎛
⎝⎜
⎞
⎠⎟
δ, and is affected not only by the molar mass of the substance, but also by the
available degrees of freedom and the bonding within the substance. Therefore, structural changes will greatly affect heat capacity.
Strong melts are characterized by having a strong resistance to structural change. As the temperature is increased over a wide temperature range above the Tg, little reorganization of the structure occurs. Often, these glasses have structures similar to that of the corresponding crystal. The lack of structural rearrangement and strong correspondence to the crystalline form

result in Arrhenius behavior of the viscosity with respect to temperature and small changes in heat capacity as the melt passes through the Tg range.
The structures of fragile liquids, however, are very sensitive to temperature changes and undergo more substantial rearrangements upon heating by way of changes in coordination and orientation of the structural units. Fragile liquids often have structures that differ greatly from the corresponding crystalline form. This considerable structural reorganization upon heating through the glass transition region results in non‐Arrhenius behavior of the viscosity of the melt and a large change in the heat capacity.
In summary, “strong” liquids experience little structural reorganization upon heating through the Tg region and thus exhibit smaller, more gradual changes in viscosity over a wide temperature range above Tg. The viscosity‐temperature relationship demonstrates an Arrhenius dependence and the glass transition region is associated with only a small change in heat capacity. “Fragile” liquids undergo larger structural rearrangements upon heating through the Tg region and thus exhibit more abrupt changes in viscosity with respect to changes in temperature. The viscosity‐temperature relationship is non‐Arrhenius and the glass transition region is associated with a substantial change in heat capacity.
On Angell’s fragility plot, all normalized viscosities converge as Tg/T → 0 (T → ∞). As the temperature increases to infinity, the liquids will all vaporize and will exist in gaseous form. This convergence implies that all gases, regardless of the atomic or molecular make up, will have the same viscosity (~ 10‐4 P) at infinitely high temperatures. This phenomena is also demonstrated by the VFT equation for viscosity,
η η=−
⎛⎝⎜
⎞⎠⎟o
o
BT T
exp .
According to the above equation, the viscosities of all substances will approach η → ηo as T → ∞, regardless of the constants B and To, which are dependent on the material composition. This implies that ηo is the same for all materials and is equal to 10‐4 P (or 10‐5 Pa∙s).
The answer to the Tg/T0 part of this last answer is similar to what I received from most people. However, if you did some digging, you could find a couple of explanations for why the limiting viscosity is on the order of 10-4 P (or Pa·s). For example, in the Eyring paper I referenced in my viscosity lecture (J. Chem Phys., 4 283 (1936)), , the following equation is derived for viscosity (η):
η=(Nh/V)exp(E0/kT) (19)
where N is Avogadro’s number, h is Planck’s constant, V is molar volume, and E0 is the activation energy for viscous flow. Eyring uses a ballpark value for molar volume of 40 cc/mole and so ends up with the approximate expression for viscosity:
η≈10-4·exp(E0/kT) (Pa·s) (20)
From (20), η→10-4 Pa·s as T→∞.
A second way to consider the limiting viscosity is to use Maxwell’s relationship (η=G∞·τ, where G∞ is the bulk shear modulus, ~1010 Pa, and τ is the relaxation time, now defined as the period for lattice vibrations, about 10-14 sec). If we assume that relaxation rates are limited by vibrational rates, then the ‘minimum’ viscosity will be 10-4 Pa·s.
See CA Angell, J. Non-Cryst. Solids, 131-133, 13-31 (1991); CA Angell et al., J. Appl. Phys., 88 3113-49 (2000) for some more details.
Average score on the 26 answers submitted: 20.0/25
4. From your review of the literature, identify a family of glasses (or representative compositions) that possess glass thermal expansion coefficients in the range 125‐175 x 10‐7/ºC and glass transition temperatures below 450ºC. Such glasses could be used for seals to a variety of metals. What are the advantages or disadvantages for using your compositions for such applications?
Example 1
Glasses in the systems 0.2MoO3–0.3P2O5–(0.5−x)PbO–xPbCl2 (x > 0.2) [1] and xPbF2– (1–
x)[PbO:TeO2] [2] posses the properties specified above. The introduction of halide ions into the
glass is accompanied by important changes in the glass properties. It can increase the
conductivity by increasing both carrier concentration and mobility which is an advantage in the
use of these glasses as metal seals.
In these systems, the strong covalent P–O and Mo–O and Te–O bonds in the glassy network are
probably replaced by apparently weaker ionic bonds of the Pb2+–O2− type. Increasing PbCl2 and
PbF2 content strongly affects the transformation temperature Tg of these glasses. Tg decreases
gradually with the replacement of PbO by PbCl2 or PbF2, which is should be correlated with
breaking of the network, contributing to its loosening and consequently decreasing the bond
strength. This observation is consistent with the decrease in hardness number. The continuous
decrease of the hardness number for these glasses reveals that the fragility nature of the
network may be increased (i.e. a weaker structure obtained). This behavior can be
disadvantageous for the applicability of these glasses as metal seals since the hardness of the
glass is often equated with its resistance to abrasion and may determine the durability of the
glass during use.
An open, less rigid or loose structure also favors an increase in the thermal expansion.
Therefore, the increase of thermal expansion with increasing PbCl2 or PbF2 content can be
ascribed to the elongation or rupture of some bonds such as P–O–P, Mo–O–Mo and/or P–O–Mo
in addition to Pb–O–P linkages due to accommodation of halide ions. The increasing thermal
expansion may also limit the applicability of these glasses as metal seals in certain temperature
ranges.
[1] Hassan A. K., J. Phys.: Condens. Matter 11, 7995 (1999).
[2] El‐Damrawi G., Phys. Status Solidi A 177, 385 (2000).
I included this question as a bit of a throw-away- there are hundreds of examples in the literature of glasses with the requisite properties- including a few papers of my own. (*No* bonus points were given to anyone who cited them!) I was surprised that a number of you did not find an appropriate reference, or if you did find one, you didn’t provide a useable citation. I was also trying to find out what you know about glass properties in general.
Average score on the 26 answers submitted: 20.2/25
Overall Homework Scores:
Average: 84.2 (standard deviation = 11.5)
Range: 61-99
I have submitted my scores for this HW set to Lehigh/Clemson to be posted on Blackboard (I think). I intend to scan the ‘marked up’ pages and send them to each of you- but that will take a bit.
Questions? Be sure to contact me at your convenience!
rkb