salts by multifrequency esr
TRANSCRIPT

PHYSICAL REVIEW B 85, 144428 (2012)
Broken magnetic symmetry due to charge-order ferroelectricity discovered in (TMTTF)2 X salts bymultifrequency ESR
S. Yasin,1,2 B. Salameh,1,3 E. Rose,1 M. Dumm,1 H.-A. Krug von Nidda,4 A. Loidl,4 M. Ozerov,2
G. Untereiner,1 L. Montgomery,5 and M. Dressel111. Physikalisches Institut, Universitat Stuttgart, Pfaffenwaldring 57, 70550 Stuttgart, Germany
2Hochfeld-Magnetlabor Dresden, Helmholtz-Zentrum Dresden-Rossendorf, 01314 Dresden, Germany3Department of Applied Physics, Tafila Technical University, Tafila, Jordan
4Experimentalphysik V, Center for Electronic Correlations and Magnetism, Universitat Augsburg, 86135 Augsburg, Germany5Department of Chemistry, Indiana University, Bloomington, 47405 Indiana, USA
(Received 17 October 2011; revised manuscript received 6 February 2012; published 26 April 2012)
We have investigated the charge-ordered state of the quasi-one-dimensional organic charge-transfer salts(TMTTF)2X (where TMTTF stands for tetramethyltetrathiafulvalene and X = PF6 AsF6, SbF6, and SCN) byperforming comprehensive electron-spin-resonance (ESR) experiments at several frequencies for 4 K < T <
300 K. At elevated temperatures all compounds show a linear increase of �H (T ). Below the charge-orderingtransition TCO important anomalies are observed in both the temperature dependence and the anisotropy of the ESRlinewidth. In the case of the centrosymmetric anions PF6, AsF6, and SbF6, the linewidth doubles its periodicitywhen rotated in a plane normal to the molecule axis; and it exhibits a significant frequency dependence. Thisenhanced linewidth is caused by anisotropic Zeeman interaction that we identify as a relaxation process in thecharge-ordered state where magnetically inequivalent sites are present in adjacent stacks. Thus, charge order notonly produces ferroelectricity but also breaks the symmetry of the magnetic degree of freedom in these organicquantum spin chains. For (TMTTF)2SCN charge order coincides with the ordering of the non-centrosymmetricanions; the large contribution of dipolar interaction dominates the relaxation process.
DOI: 10.1103/PhysRevB.85.144428 PACS number(s): 75.10.Pq, 71.70.Ej, 75.25.−j, 76.30.−v
I. INTRODUCTION
The organic linear-chain compounds of the (TMTSF)2X
and (TMTTF)2X family, where TMTSF and TMTTF denotetetramethyltetraselenafulvalene and tetramethyltetrathiafulva-lene, respectively, and X stands for a monovalent anionsuch as SbF6, AsF6, PF6, Br, and SCN, are considered tobe benchmark systems for low-dimensional matter, whichallow for exploration of interesting physics ranging fromMott insulator to Luttinger liquid.1–4 Of particular importanceare the transitions to various ordered ground states thatdevelop in one-dimensional electron systems depending on theinterplay of lattice, charge, and spin degrees of freedom.5 Thequasi-one-dimensional electronic behavior of (TMTTF)2X
salts originates in their crystallographic structure. The planarTMTTF molecules stack in a slight zigzag configuration alongthe a axis that constitutes the highest conducting direction.With some minor interaction between the stacks they formlayers in the ab plane which alternate with the anions X
along the c axis (Fig. 1). Recently, it was pointed out thatthe contacts between the anions and the organic moleculesvia the methyl groups and the sulfur atoms are importantand shall not be neglected when considering the charge-order transition.6–9 Furthermore, the molecular stacks are nothomogeneous, but the TMTTF molecules form dimers withimportant consequences on the electronic properties of thesesalts.8 The 3
4 -filled conduction band ( 14 -filled hole band) is
split and becomes effectively half filled; dimerization alsoenhances the phenomenon of charge localization. Due to theirsmall transfer integrals and strong on-site Coulomb repulsionTMTTF salts are Mott-Hubbard insulators.10–12
The quasi-one-dimensional systems with 14 -filled bands,
where electronic correlations tend to localize the charge
carriers along the chains, commonly exhibit a charge-orderingtransition in the temperature range from 100 K to 200 K.Charge order (CO) in (TMTTF)2X salts has been intensivelystudied in the last decade.6,9,13–27 The metal-insulator transitionat TCO = 155 K was first identified by a clear anomaly inthe thermopower data of (TMTTF)2SbF6. The same transportanomaly was also recorded in (TMTTF)2AsF6 at about 100 K;and doping studies ensured that these are actually the sametype of transition.28 Resistivity measurements reveal a steepincrease in the conductivity gap at TCO for the three crystaldirections of (TMTTF)2AsF6 (Refs. 25 and 6); this effect iseven stronger for the two axes perpendicular to the stacks.Deuteration of the organic molecules of (TMTTF)2SbF6 and(TMTTF)2AsF6 enhances the CO transition temperature24;hydrostatic pressure reduces TCO.9
Using one- and two-dimensional 13C nuclear magneticresonance (NMR) spectroscopy the phase transition was finallyproven to be due to CO.9,18,20,29 Subsequently, CO transitionswere found in (TMTTF)2X (X = PF6, AsF6, SbF6, ReO4, andSCN) at 63 K, 102 K, 155 K, 227 K, and 160 K, respectively.Dielectric permittivity measurements15–17 recognized the fer-roelectric and antiferroelectric [in (TMTTF)2SCN] order ofthe low-temperature ground states; CO is associated with aloss of the symmetry center for the molecules on the chain.The charge disproportionation can be locally probed by Ramanand infrared vibrational spectroscopy.30,31 Optical reflectivitymeasurements on (TMTTF)2AsF6 and (TMTTF)2PF6 withlight polarized parallel to the molecular stacks (a axis)allowed us to detect a splitting of the electron-molecular-vibrational (emv) coupled intramolecular modes below the COtransition.22,23 More sensitive are the asymmetric molecularvibrations along the molecule axis,26 which are best measuredperpendicular to the ab planes.32,33
144428-11098-0121/2012/85(14)/144428(14) ©2012 American Physical Society
S. YASIN et al. PHYSICAL REVIEW B 85, 144428 (2012)
b
(a)
I
II
c
c b
II
I
a
a
c c
a
c
(b)
I II a
b
(c) φφ
aa
b
b
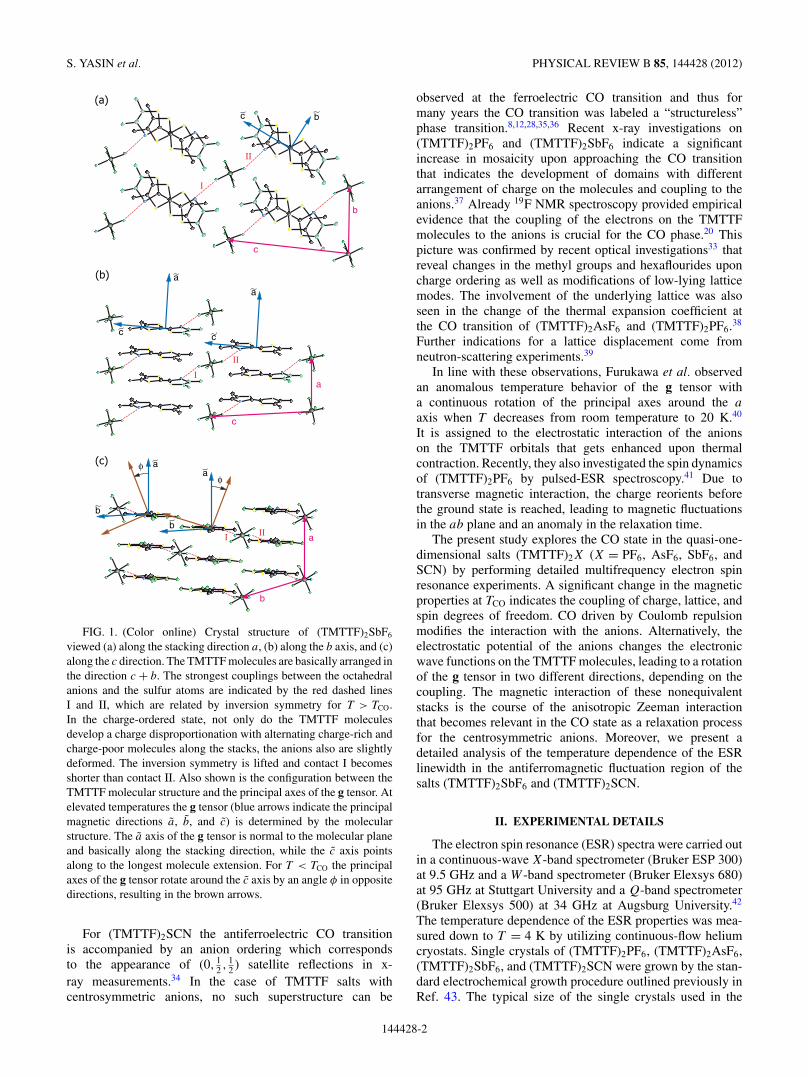
FIG. 1. (Color online) Crystal structure of (TMTTF)2SbF6
viewed (a) along the stacking direction a, (b) along the b axis, and (c)along the c direction. The TMTTF molecules are basically arranged inthe direction c + b. The strongest couplings between the octahedralanions and the sulfur atoms are indicated by the red dashed linesI and II, which are related by inversion symmetry for T > TCO.In the charge-ordered state, not only do the TMTTF moleculesdevelop a charge disproportionation with alternating charge-rich andcharge-poor molecules along the stacks, the anions also are slightlydeformed. The inversion symmetry is lifted and contact I becomesshorter than contact II. Also shown is the configuration between theTMTTF molecular structure and the principal axes of the g tensor. Atelevated temperatures the g tensor (blue arrows indicate the principalmagnetic directions a, b, and c) is determined by the molecularstructure. The a axis of the g tensor is normal to the molecular planeand basically along the stacking direction, while the c axis pointsalong to the longest molecule extension. For T < TCO the principalaxes of the g tensor rotate around the c axis by an angle φ in oppositedirections, resulting in the brown arrows.
For (TMTTF)2SCN the antiferroelectric CO transitionis accompanied by an anion ordering which correspondsto the appearance of (0, 1
2 , 12 ) satellite reflections in x-
ray measurements.34 In the case of TMTTF salts withcentrosymmetric anions, no such superstructure can be
observed at the ferroelectric CO transition and thus formany years the CO transition was labeled a “structureless”phase transition.8,12,28,35,36 Recent x-ray investigations on(TMTTF)2PF6 and (TMTTF)2SbF6 indicate a significantincrease in mosaicity upon approaching the CO transitionthat indicates the development of domains with differentarrangement of charge on the molecules and coupling to theanions.37 Already 19F NMR spectroscopy provided empiricalevidence that the coupling of the electrons on the TMTTFmolecules to the anions is crucial for the CO phase.20 Thispicture was confirmed by recent optical investigations33 thatreveal changes in the methyl groups and hexaflourides uponcharge ordering as well as modifications of low-lying latticemodes. The involvement of the underlying lattice was alsoseen in the change of the thermal expansion coefficient atthe CO transition of (TMTTF)2AsF6 and (TMTTF)2PF6.38
Further indications for a lattice displacement come fromneutron-scattering experiments.39
In line with these observations, Furukawa et al. observedan anomalous temperature behavior of the g tensor witha continuous rotation of the principal axes around the a
axis when T decreases from room temperature to 20 K.40
It is assigned to the electrostatic interaction of the anionson the TMTTF orbitals that gets enhanced upon thermalcontraction. Recently, they also investigated the spin dynamicsof (TMTTF)2PF6 by pulsed-ESR spectroscopy.41 Due totransverse magnetic interaction, the charge reorients beforethe ground state is reached, leading to magnetic fluctuationsin the ab plane and an anomaly in the relaxation time.
The present study explores the CO state in the quasi-one-dimensional salts (TMTTF)2X (X = PF6, AsF6, SbF6, andSCN) by performing detailed multifrequency electron spinresonance experiments. A significant change in the magneticproperties at TCO indicates the coupling of charge, lattice, andspin degrees of freedom. CO driven by Coulomb repulsionmodifies the interaction with the anions. Alternatively, theelectrostatic potential of the anions changes the electronicwave functions on the TMTTF molecules, leading to a rotationof the g tensor in two different directions, depending on thecoupling. The magnetic interaction of these nonequivalentstacks is the course of the anisotropic Zeeman interactionthat becomes relevant in the CO state as a relaxation processfor the centrosymmetric anions. Moreover, we present adetailed analysis of the temperature dependence of the ESRlinewidth in the antiferromagnetic fluctuation region of thesalts (TMTTF)2SbF6 and (TMTTF)2SCN.
II. EXPERIMENTAL DETAILS
The electron spin resonance (ESR) spectra were carried outin a continuous-wave X-band spectrometer (Bruker ESP 300)at 9.5 GHz and a W -band spectrometer (Bruker Elexsys 680)at 95 GHz at Stuttgart University and a Q-band spectrometer(Bruker Elexsys 500) at 34 GHz at Augsburg University.42
The temperature dependence of the ESR properties was mea-sured down to T = 4 K by utilizing continuous-flow heliumcryostats. Single crystals of (TMTTF)2PF6, (TMTTF)2AsF6,(TMTTF)2SbF6, and (TMTTF)2SCN were grown by the stan-dard electrochemical growth procedure outlined previously inRef. 43. The typical size of the single crystals used in the
144428-2
BROKEN MAGNETIC SYMMETRY DUE TO CHARGE-ORDER . . . PHYSICAL REVIEW B 85, 144428 (2012)
TABLE I. Temperature of charge localization Tρ , charge orderTCO, spin-Peierls transition TSP, antiferromagnetic order TN , andexchange constants J of the (TMTTF)2X salts under consideration(X = PF6, SbF6, AsF6, and SCN) (Refs. 5,6,27,48–50).
Tρ TCO TSP TN J
Compound (K) (K) (K) (K) (K)
(TMTTF)2PF6 250 67 19 420(TMTTF)2AsF6 250 102 13 410(TMTTF)2SbF6 240 157 8 400(TMTTF)2SCN 250 160 7 460
X-band ESR measurements was 2 × 0.5 × 0.1 mm3, whilevery small samples of less than 0.4 × 0.4 × 0.05 mm3 weresufficient for the Q- and W -band ESR measurements in orderto avoid any sample-size effect that can lead to a broadeningof the linewidth.44
In the triclinic crystals, the TMTTF molecules are stackedapproximately normal to the molecular plane in the a direction.The crystallographic b axis points toward adjacent stacks ascan be seen in Fig. 1; the projection normal to a is commonlycalled b′. The TMTTF stacks are separated in the c directionby the anions X; c∗ is the projection of the crystallographic c
axis normal to the ab′ plane. As pointed out previously,40,45,46
the g factor measured by ESR experiments is determinedby the π electronic wave function on the TMTTF moleculeand the arrangement of the g tensor can be solely deducedfrom the molecular symmetry. Hence, we introduce a Cartesiancoordinate system linked to the TMTTF molecule, whichdescribes the principal axes of the g tensor.47 Here a is normalto the molecular bc plane and c denotes the long axis of themolecule, as is depicted in Fig. 1.
In our ESR experiments the crystals can be rotated aroundan axis perpendicular to the static magnetic field using agoniometer; the accuracy of the sample positioning waswithin 2◦. The g value was determined by comparing theresonance field of the measured ESR signal with that of DPPH(2,2-diphenyl-1-picrylhydrazyl).
The characteristic temperatures of the (TMTTF)2X saltsunder investigation are summarized in Table I.
III. RESULTS
A. X-band investigations
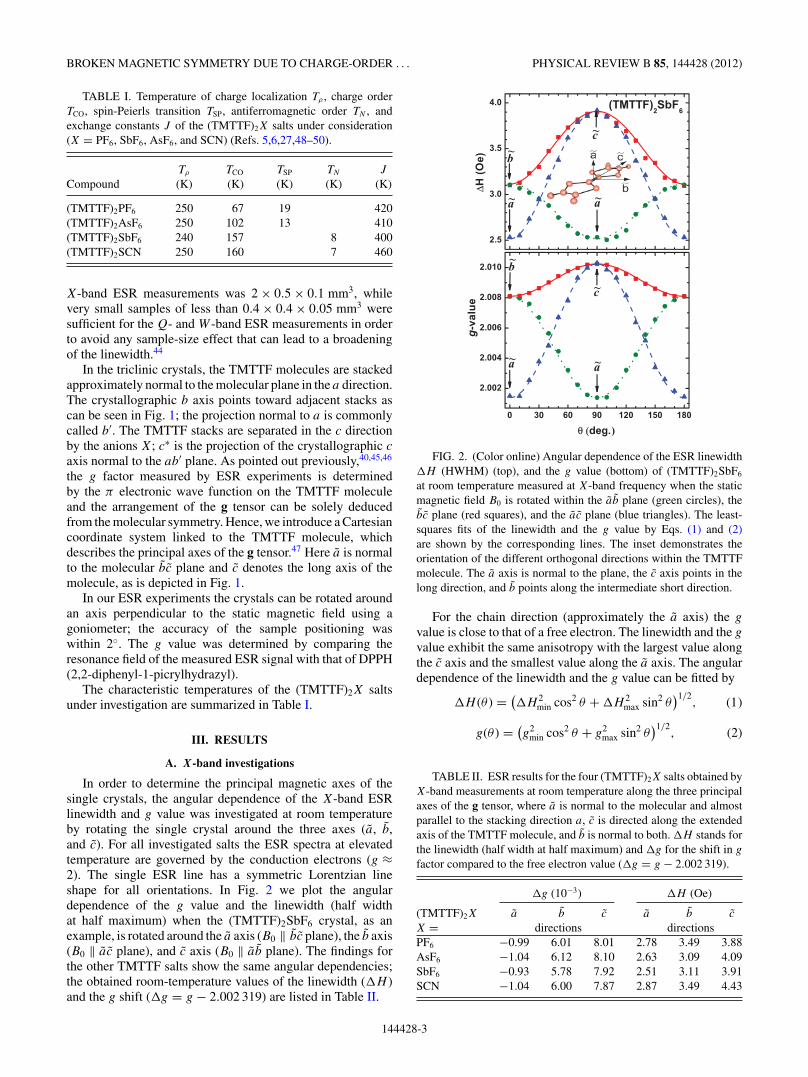
In order to determine the principal magnetic axes of thesingle crystals, the angular dependence of the X-band ESRlinewidth and g value was investigated at room temperatureby rotating the single crystal around the three axes (a, b,and c). For all investigated salts the ESR spectra at elevatedtemperature are governed by the conduction electrons (g ≈2). The single ESR line has a symmetric Lorentzian lineshape for all orientations. In Fig. 2 we plot the angulardependence of the g value and the linewidth (half widthat half maximum) when the (TMTTF)2SbF6 crystal, as anexample, is rotated around the a axis (B0 ‖ bc plane), the b axis(B0 ‖ ac plane), and c axis (B0 ‖ ab plane). The findings forthe other TMTTF salts show the same angular dependencies;the obtained room-temperature values of the linewidth (�H )and the g shift (�g = g − 2.002 319) are listed in Table II.
FIG. 2. (Color online) Angular dependence of the ESR linewidth�H (HWHM) (top), and the g value (bottom) of (TMTTF)2SbF6
at room temperature measured at X-band frequency when the staticmagnetic field B0 is rotated within the ab plane (green circles), thebc plane (red squares), and the ac plane (blue triangles). The least-squares fits of the linewidth and the g value by Eqs. (1) and (2)are shown by the corresponding lines. The inset demonstrates theorientation of the different orthogonal directions within the TMTTFmolecule. The a axis is normal to the plane, the c axis points in thelong direction, and b points along the intermediate short direction.
For the chain direction (approximately the a axis) the g
value is close to that of a free electron. The linewidth and the g
value exhibit the same anisotropy with the largest value alongthe c axis and the smallest value along the a axis. The angulardependence of the linewidth and the g value can be fitted by
�H (θ ) = (�H 2
min cos2 θ + �H 2max sin2 θ
)1/2, (1)
g(θ ) = (g2
min cos2 θ + g2max sin2 θ
)1/2, (2)
TABLE II. ESR results for the four (TMTTF)2X salts obtained byX-band measurements at room temperature along the three principalaxes of the g tensor, where a is normal to the molecular and almostparallel to the stacking direction a, c is directed along the extendedaxis of the TMTTF molecule, and b is normal to both. �H stands forthe linewidth (half width at half maximum) and �g for the shift in g
factor compared to the free electron value (�g = g − 2.002 319).
�g (10−3) �H (Oe)
(TMTTF)2X a b c a b c
X = directions directionsPF6 −0.99 6.01 8.01 2.78 3.49 3.88AsF6 −1.04 6.12 8.10 2.63 3.09 4.09SbF6 −0.93 5.78 7.92 2.51 3.11 3.91SCN −1.04 6.00 7.87 2.87 3.49 4.43
144428-3
S. YASIN et al. PHYSICAL REVIEW B 85, 144428 (2012)
(a)
(b)
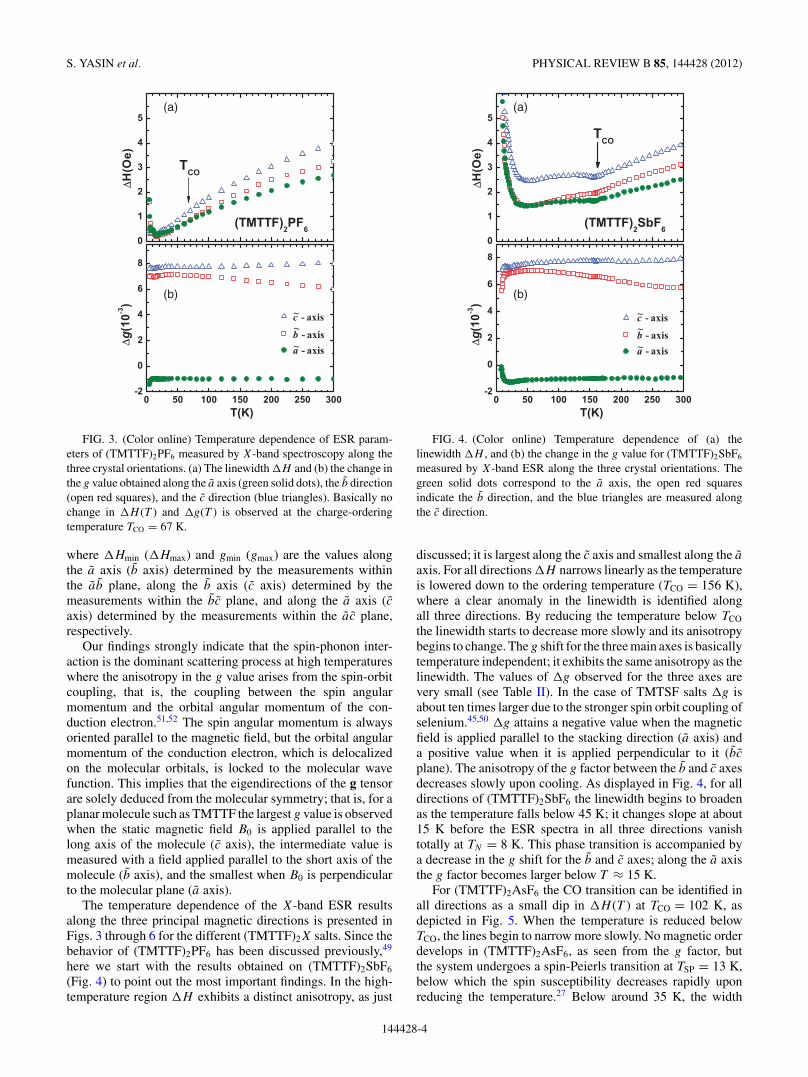
FIG. 3. (Color online) Temperature dependence of ESR param-eters of (TMTTF)2PF6 measured by X-band spectroscopy along thethree crystal orientations. (a) The linewidth �H and (b) the change inthe g value obtained along the a axis (green solid dots), the b direction(open red squares), and the c direction (blue triangles). Basically nochange in �H (T ) and �g(T ) is observed at the charge-orderingtemperature TCO = 67 K.
where �Hmin (�Hmax) and gmin (gmax) are the values alongthe a axis (b axis) determined by the measurements withinthe ab plane, along the b axis (c axis) determined by themeasurements within the bc plane, and along the a axis (caxis) determined by the measurements within the ac plane,respectively.
Our findings strongly indicate that the spin-phonon inter-action is the dominant scattering process at high temperatureswhere the anisotropy in the g value arises from the spin-orbitcoupling, that is, the coupling between the spin angularmomentum and the orbital angular momentum of the con-duction electron.51,52 The spin angular momentum is alwaysoriented parallel to the magnetic field, but the orbital angularmomentum of the conduction electron, which is delocalizedon the molecular orbitals, is locked to the molecular wavefunction. This implies that the eigendirections of the g tensorare solely deduced from the molecular symmetry; that is, for aplanar molecule such as TMTTF the largest g value is observedwhen the static magnetic field B0 is applied parallel to thelong axis of the molecule (c axis), the intermediate value ismeasured with a field applied parallel to the short axis of themolecule (b axis), and the smallest when B0 is perpendicularto the molecular plane (a axis).
The temperature dependence of the X-band ESR resultsalong the three principal magnetic directions is presented inFigs. 3 through 6 for the different (TMTTF)2X salts. Since thebehavior of (TMTTF)2PF6 has been discussed previously,49
here we start with the results obtained on (TMTTF)2SbF6
(Fig. 4) to point out the most important findings. In the high-temperature region �H exhibits a distinct anisotropy, as just
(a)
(b)
FIG. 4. (Color online) Temperature dependence of (a) thelinewidth �H , and (b) the change in the g value for (TMTTF)2SbF6
measured by X-band ESR along the three crystal orientations. Thegreen solid dots correspond to the a axis, the open red squaresindicate the b direction, and the blue triangles are measured alongthe c direction.
discussed; it is largest along the c axis and smallest along the a
axis. For all directions �H narrows linearly as the temperatureis lowered down to the ordering temperature (TCO = 156 K),where a clear anomaly in the linewidth is identified alongall three directions. By reducing the temperature below TCO
the linewidth starts to decrease more slowly and its anisotropybegins to change. The g shift for the three main axes is basicallytemperature independent; it exhibits the same anisotropy as thelinewidth. The values of �g observed for the three axes arevery small (see Table II). In the case of TMTSF salts �g isabout ten times larger due to the stronger spin orbit coupling ofselenium.45,50 �g attains a negative value when the magneticfield is applied parallel to the stacking direction (a axis) anda positive value when it is applied perpendicular to it (bc
plane). The anisotropy of the g factor between the b and c axesdecreases slowly upon cooling. As displayed in Fig. 4, for alldirections of (TMTTF)2SbF6 the linewidth begins to broadenas the temperature falls below 45 K; it changes slope at about15 K before the ESR spectra in all three directions vanishtotally at TN = 8 K. This phase transition is accompanied bya decrease in the g shift for the b and c axes; along the a axisthe g factor becomes larger below T ≈ 15 K.
For (TMTTF)2AsF6 the CO transition can be identified inall directions as a small dip in �H (T ) at TCO = 102 K, asdepicted in Fig. 5. When the temperature is reduced belowTCO, the lines begin to narrow more slowly. No magnetic orderdevelops in (TMTTF)2AsF6, as seen from the g factor, butthe system undergoes a spin-Peierls transition at TSP = 13 K,below which the spin susceptibility decreases rapidly uponreducing the temperature.27 Below around 35 K, the width
144428-4

BROKEN MAGNETIC SYMMETRY DUE TO CHARGE-ORDER . . . PHYSICAL REVIEW B 85, 144428 (2012)
(a)
(b)
FIG. 5. (Color online) Temperature dependence of (a) the ESRlinewidth �H and (b) the g shift �g(T ) = g(T ) − 2.002 319 for(TMTTF)2AsF6 measured by X-band spectroscopy along the threedirections a (green dots), b (open red squares), and c (blue triangles).
starts to broaden strongly as T is reduced and for even lowertemperatures (T < 16 K) strong fluctuations are observed.
In the case of (TMTTF)2SCN, charge ordering at TCO =160 K also shows up in the linewidth as a minor hump.The g factors are not affected significantly by the CO, albeitminor anomalies can be identified at TCO. With reducing thetemperature further �H (T ) goes through a broad minimumaround 120 K and then increases down to T ≈ 20 K; thisbehavior is similar along all three directions. At even lowertemperatures a minimum of �H is detected around 13 K butthen the linewidth increases strongly down to TN = 7 K. Themagnetic order is seen in all three directions and resembles thebehavior observed in (TMTTF)2SbF6. This phase transition isaccompanied by a strong negative shift of the g value for the b
and c axes and a pronounced increase along the a axis leadingto a change in sign of �g for (TMTTF)2SCN.
Finally, we want to return to (TMTTF)2PF6; at elevatedtemperatures the ESR properties are similar to the othermembers of the TMTTF family. The data shown in Fig. 3are taken from Ref. 49 and discussed there in more detail.The compound is particular in the sense that the CO phasetransition at TCO = 67 K basically does not show up in the ESRlinewidth; hence, it can serve a reference system to model thebackground for T > 80 K. At low temperatures the linewidthincreases due to the spin-Peierls transition at TSP = 19 K.These data are listed in Table I.
B. Q- and W -band results
In order to gain a deeper insight into the anisotropicinteraction, we have performed Q-band (34 GHz) and W -band (95 GHz) ESR measurements as a function of orien-tation and temperature. First, the principal magnetic axes
(a)
(b)
FIG. 6. (Color online) (a) ESR linewidth �H and (b) �g of(TMTTF)2SCN measured in the X band as a function of temperaturealong the three principal directions as indicated.
of (TMTTF)2SbF6 and (TMTTF)2AsF6 were determined byangular-dependent room-temperature investigations. For allorientations the resulting Q- and W -band spectra reveal asymmetric Lorentzian line shape. Also, the angular depen-dence of �H and �g were similar to our X-band results,as far as the absolute values and the anisotropy along theac and bc planes are concerned. Only within the ab planedoes a pronounced frequency dependence show up in theCO state, which is considered in the following section. InFigs. 7 and 8 the W -band ESR linewidth and the g shift of(TMTTF)2SbF6 and (TMTTF)2AsF6 are plotted as a functionof temperature for the three principal magnetic axes: a, b, andc. The corresponding plots of the Q-band data, restricted to thea axis, are presented as insets. In the whole temperature range(4.2 K–300 K) the linewidth and the g shift exhibit a behaviorvery similar to the X-band results. Also, the absolute values forboth compounds show no significant frequency dependence.
IV. ANALYSIS AND DISCUSSION
A. Charge-ordered state
1. Temperature- and angular-dependent linewidth
At TCO we observe interesting modifications in thelinewidth (top panels of Figs. 4 to 8) that are analyzed inmore detail in the following. For the (TMTTF)2SbF6 and(TMTTF)2AsF6 crystals, �H (T ) decreases more slowly uponentering the CO state; for (TMTTF)2SCN it even increasesat lower temperatures. Also the anisotropy of the linewidthchanges in the ordered region with important differences be-tween the salts with centrosymmetrical anions and those withlinear anions. These observations indicate that the broadeningmechanism below TCO is different from the mechanism above.To give a clearer picture of the effect induced by CO, we define
144428-5
S. YASIN et al. PHYSICAL REVIEW B 85, 144428 (2012)
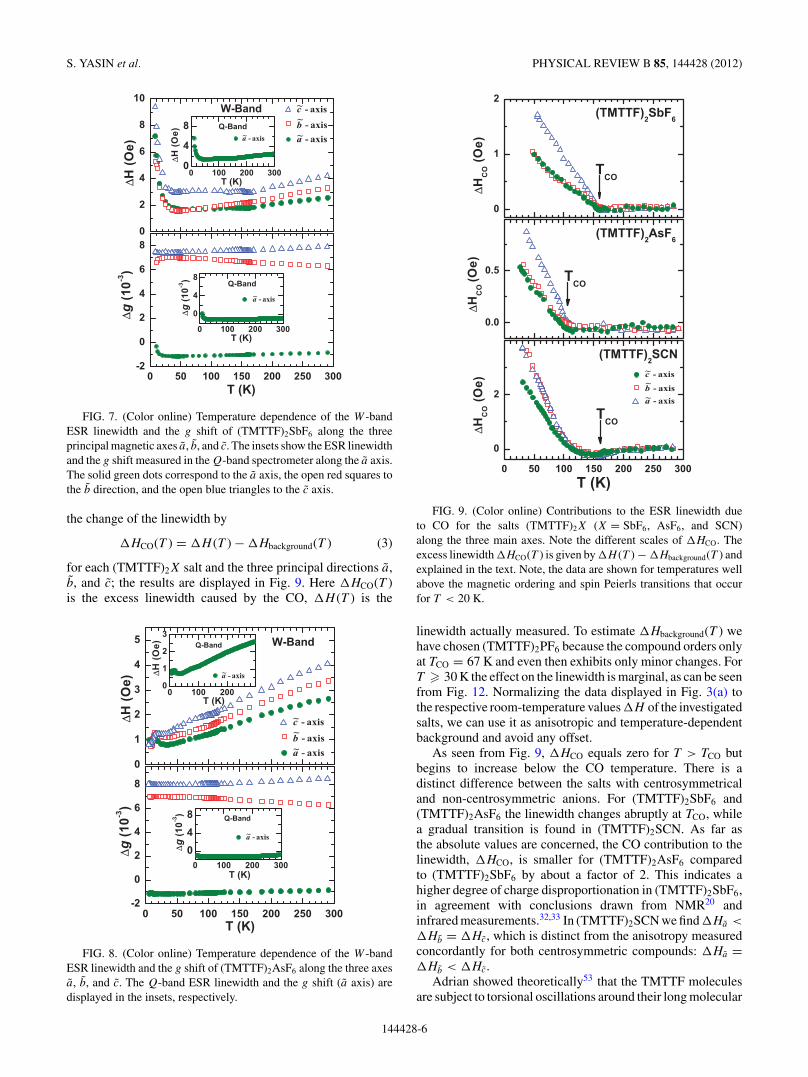
FIG. 7. (Color online) Temperature dependence of the W -bandESR linewidth and the g shift of (TMTTF)2SbF6 along the threeprincipal magnetic axes a, b, and c. The insets show the ESR linewidthand the g shift measured in the Q-band spectrometer along the a axis.The solid green dots correspond to the a axis, the open red squares tothe b direction, and the open blue triangles to the c axis.
the change of the linewidth by
�HCO(T ) = �H (T ) − �Hbackground(T ) (3)
for each (TMTTF)2X salt and the three principal directions a,b, and c; the results are displayed in Fig. 9. Here �HCO(T )is the excess linewidth caused by the CO, �H (T ) is the
FIG. 8. (Color online) Temperature dependence of the W -bandESR linewidth and the g shift of (TMTTF)2AsF6 along the three axesa, b, and c. The Q-band ESR linewidth and the g shift (a axis) aredisplayed in the insets, respectively.
FIG. 9. (Color online) Contributions to the ESR linewidth dueto CO for the salts (TMTTF)2X (X = SbF6, AsF6, and SCN)along the three main axes. Note the different scales of �HCO. Theexcess linewidth �HCO(T ) is given by �H (T ) − �Hbackground(T ) andexplained in the text. Note, the data are shown for temperatures wellabove the magnetic ordering and spin Peierls transitions that occurfor T < 20 K.
linewidth actually measured. To estimate �Hbackground(T ) wehave chosen (TMTTF)2PF6 because the compound orders onlyat TCO = 67 K and even then exhibits only minor changes. ForT � 30 K the effect on the linewidth is marginal, as can be seenfrom Fig. 12. Normalizing the data displayed in Fig. 3(a) tothe respective room-temperature values �H of the investigatedsalts, we can use it as anisotropic and temperature-dependentbackground and avoid any offset.
As seen from Fig. 9, �HCO equals zero for T > TCO butbegins to increase below the CO temperature. There is adistinct difference between the salts with centrosymmetricaland non-centrosymmetric anions. For (TMTTF)2SbF6 and(TMTTF)2AsF6 the linewidth changes abruptly at TCO, whilea gradual transition is found in (TMTTF)2SCN. As far asthe absolute values are concerned, the CO contribution to thelinewidth, �HCO, is smaller for (TMTTF)2AsF6 comparedto (TMTTF)2SbF6 by about a factor of 2. This indicates ahigher degree of charge disproportionation in (TMTTF)2SbF6,in agreement with conclusions drawn from NMR20 andinfrared measurements.32,33 In (TMTTF)2SCN we find �Ha <
�Hb = �Hc, which is distinct from the anisotropy measuredconcordantly for both centrosymmetric compounds: �Ha =�Hb < �Hc.
Adrian showed theoretically53 that the TMTTF moleculesare subject to torsional oscillations around their long molecular
144428-6
BROKEN MAGNETIC SYMMETRY DUE TO CHARGE-ORDER . . . PHYSICAL REVIEW B 85, 144428 (2012)
c axis that can cause spin-orbit scattering. However, sym-metry arguments exclude intrastack spin-orbit scattering of amagnitude comparable to the interstack scattering. Electronictransitions within the stacks are not possible between identi-cally oriented, centrosymmetric donor molecules. Hence, theinversion symmetry present in the crystals above TCO precludesintrastack spin-orbit scattering in the TMTTF chains. For thatreason, the anisotropy of the ESR linewidth (�Ha < �Hb <
�Hc) does not change with temperature at T > TCO.The significant modifications in �H (T ) noted for T <
TCO indicate dramatic changes in symmetry. Also dielectricpermittivity15–17 and NMR measurements9,18,20 as well assecond-harmonic generation54 led to the conclusion that theTMTTF molecules in the stacks are not connected any moreby inversion centers due to CO. The loss of symmetry belowTCO allows spin-orbit scattering in the TMTTF chains toincrease and to contribute appreciably to the linewidth. Withdecreasing temperature the excess �HCO(T ) increases andits anisotropy becomes more significant. The difference in�HCO(T ) observed for the salts with centrosymmetric anionscompared to non-centrosymmetric anions indicates that notonly charge disproportionation is important in this regard.Hence, we conclude that the CO pattern55 also depends onthe symmetry of the counterions, in accord with previous ESRinvestigations by Nakamura.21,34 In the case of (TMTTF)2SCNthe CO occurs simultaneously with the ordering of theanions. While x-ray investigations reveal a superstructurealong the b and c directions, no corresponding indica-tions have been observed in crystals with centrosymmetricanions.37
Nakamura argues that the angular-dependent linewidthresults from intersite magnetic dipole-dipole coupling, andconsequently angular studies of the linewidth will revealdetails of the CO arrangement.21 Hence, we performed detailedangular-dependent measurements of �H and �g for theinvestigated salts along the three planes ab, ac, and bc atdifferent temperatures above and below TCO. In all cases theangular dependence of the g value remains unchanged withtemperature and corresponds to the orientational dependenceas displayed in the lower frame of Fig. 2 for T = 300 K.Also, the linewidth does not change its angular dependencewithin the ac and bc planes at low temperatures. Importantdeviations, however, are observed for the linewidth below TCO
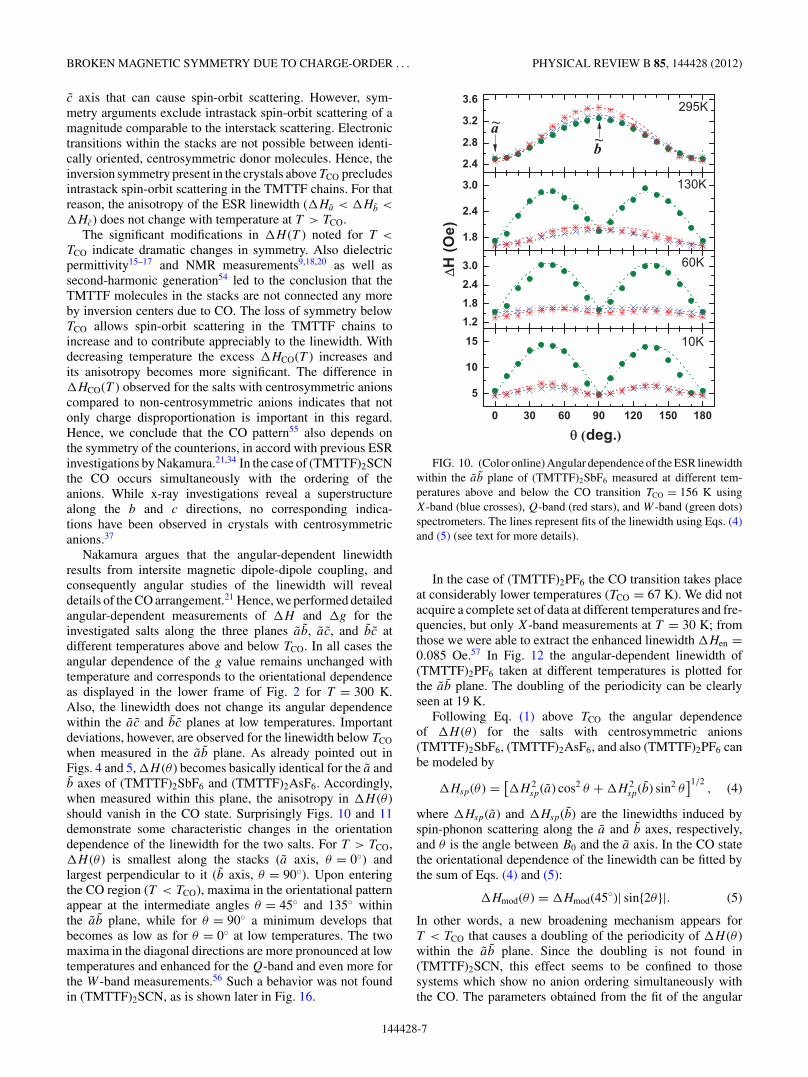
when measured in the ab plane. As already pointed out inFigs. 4 and 5, �H (θ ) becomes basically identical for the a andb axes of (TMTTF)2SbF6 and (TMTTF)2AsF6. Accordingly,when measured within this plane, the anisotropy in �H (θ )should vanish in the CO state. Surprisingly Figs. 10 and 11demonstrate some characteristic changes in the orientationdependence of the linewidth for the two salts. For T > TCO,�H (θ ) is smallest along the stacks (a axis, θ = 0◦) andlargest perpendicular to it (b axis, θ = 90◦). Upon enteringthe CO region (T < TCO), maxima in the orientational patternappear at the intermediate angles θ = 45◦ and 135◦ withinthe ab plane, while for θ = 90◦ a minimum develops thatbecomes as low as for θ = 0◦ at low temperatures. The twomaxima in the diagonal directions are more pronounced at lowtemperatures and enhanced for the Q-band and even more forthe W -band measurements.56 Such a behavior was not foundin (TMTTF)2SCN, as is shown later in Fig. 16.
FIG. 10. (Color online) Angular dependence of the ESR linewidthwithin the ab plane of (TMTTF)2SbF6 measured at different tem-peratures above and below the CO transition TCO = 156 K usingX-band (blue crosses), Q-band (red stars), and W -band (green dots)spectrometers. The lines represent fits of the linewidth using Eqs. (4)and (5) (see text for more details).
In the case of (TMTTF)2PF6 the CO transition takes placeat considerably lower temperatures (TCO = 67 K). We did notacquire a complete set of data at different temperatures and fre-quencies, but only X-band measurements at T = 30 K; fromthose we were able to extract the enhanced linewidth �Hen =0.085 Oe.57 In Fig. 12 the angular-dependent linewidth of(TMTTF)2PF6 taken at different temperatures is plotted forthe ab plane. The doubling of the periodicity can be clearlyseen at 19 K.
Following Eq. (1) above TCO the angular dependenceof �H (θ ) for the salts with centrosymmetric anions(TMTTF)2SbF6, (TMTTF)2AsF6, and also (TMTTF)2PF6 canbe modeled by
�Hsp(θ ) = [�H 2
sp(a) cos2 θ + �H 2sp(b) sin2 θ
]1/2, (4)
where �Hsp(a) and �Hsp(b) are the linewidths induced byspin-phonon scattering along the a and b axes, respectively,and θ is the angle between B0 and the a axis. In the CO statethe orientational dependence of the linewidth can be fitted bythe sum of Eqs. (4) and (5):
�Hmod(θ ) = �Hmod(45◦)| sin{2θ}|. (5)
In other words, a new broadening mechanism appears forT < TCO that causes a doubling of the periodicity of �H (θ )within the ab plane. Since the doubling is not found in(TMTTF)2SCN, this effect seems to be confined to thosesystems which show no anion ordering simultaneously withthe CO. The parameters obtained from the fit of the angular
144428-7
S. YASIN et al. PHYSICAL REVIEW B 85, 144428 (2012)
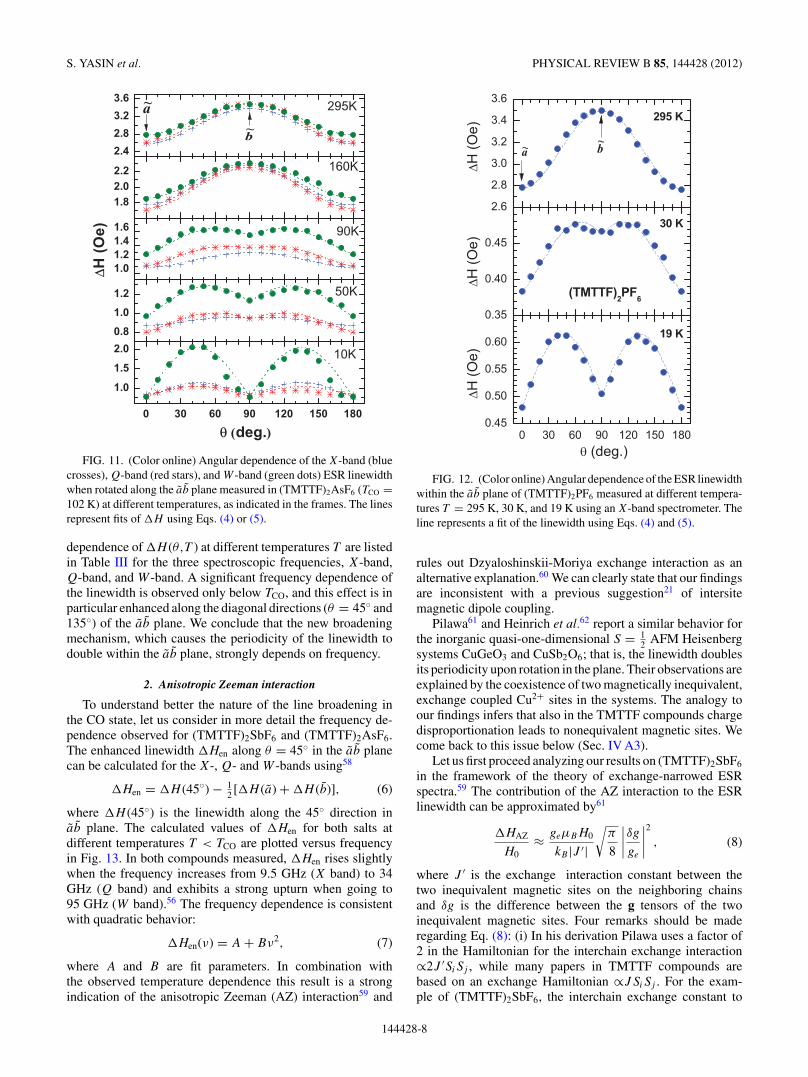
FIG. 11. (Color online) Angular dependence of the X-band (bluecrosses), Q-band (red stars), and W -band (green dots) ESR linewidthwhen rotated along the ab plane measured in (TMTTF)2AsF6 (TCO =102 K) at different temperatures, as indicated in the frames. The linesrepresent fits of �H using Eqs. (4) or (5).
dependence of �H (θ,T ) at different temperatures T are listedin Table III for the three spectroscopic frequencies, X-band,Q-band, and W -band. A significant frequency dependence ofthe linewidth is observed only below TCO, and this effect is inparticular enhanced along the diagonal directions (θ = 45◦ and135◦) of the ab plane. We conclude that the new broadeningmechanism, which causes the periodicity of the linewidth todouble within the ab plane, strongly depends on frequency.
2. Anisotropic Zeeman interaction
To understand better the nature of the line broadening inthe CO state, let us consider in more detail the frequency de-pendence observed for (TMTTF)2SbF6 and (TMTTF)2AsF6.The enhanced linewidth �Hen along θ = 45◦ in the ab planecan be calculated for the X-, Q- and W -bands using58
�Hen = �H (45◦) − 12 [�H (a) + �H (b)], (6)
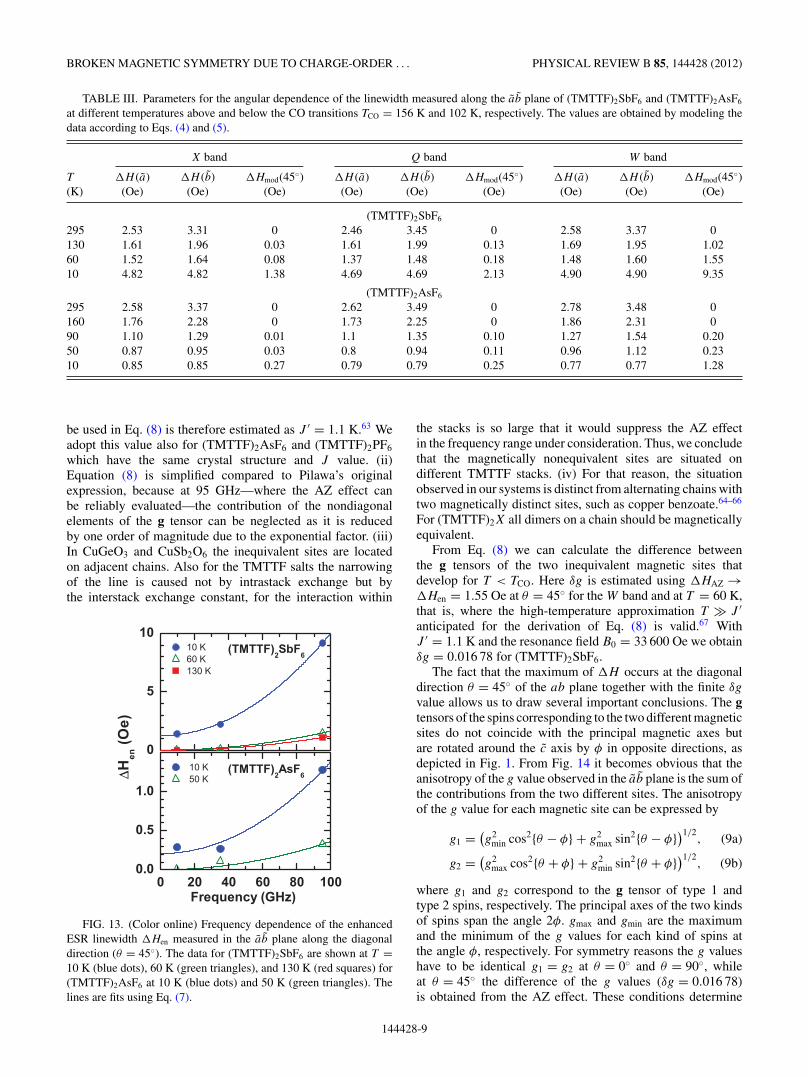
where �H (45◦) is the linewidth along the 45◦ direction inab plane. The calculated values of �Hen for both salts atdifferent temperatures T < TCO are plotted versus frequencyin Fig. 13. In both compounds measured, �Hen rises slightlywhen the frequency increases from 9.5 GHz (X band) to 34GHz (Q band) and exhibits a strong upturn when going to95 GHz (W band).56 The frequency dependence is consistentwith quadratic behavior:
�Hen(ν) = A + Bν2, (7)
where A and B are fit parameters. In combination withthe observed temperature dependence this result is a strongindication of the anisotropic Zeeman (AZ) interaction59 and
FIG. 12. (Color online) Angular dependence of the ESR linewidthwithin the ab plane of (TMTTF)2PF6 measured at different tempera-tures T = 295 K, 30 K, and 19 K using an X-band spectrometer. Theline represents a fit of the linewidth using Eqs. (4) and (5).
rules out Dzyaloshinskii-Moriya exchange interaction as analternative explanation.60 We can clearly state that our findingsare inconsistent with a previous suggestion21 of intersitemagnetic dipole coupling.
Pilawa61 and Heinrich et al.62 report a similar behavior forthe inorganic quasi-one-dimensional S = 1
2 AFM Heisenbergsystems CuGeO3 and CuSb2O6; that is, the linewidth doublesits periodicity upon rotation in the plane. Their observations areexplained by the coexistence of two magnetically inequivalent,exchange coupled Cu2+ sites in the systems. The analogy toour findings infers that also in the TMTTF compounds chargedisproportionation leads to nonequivalent magnetic sites. Wecome back to this issue below (Sec. IV A3).
Let us first proceed analyzing our results on (TMTTF)2SbF6
in the framework of the theory of exchange-narrowed ESRspectra.59 The contribution of the AZ interaction to the ESRlinewidth can be approximated by61
�HAZ
H0≈ geμBH0
kB |J ′|√
π
8
∣∣∣∣δgge
∣∣∣∣2
, (8)
where J ′ is the exchange interaction constant between thetwo inequivalent magnetic sites on the neighboring chainsand δg is the difference between the g tensors of the twoinequivalent magnetic sites. Four remarks should be maderegarding Eq. (8): (i) In his derivation Pilawa uses a factor of2 in the Hamiltonian for the interchain exchange interaction∝2J ′SiSj , while many papers in TMTTF compounds arebased on an exchange Hamiltonian ∝JSiSj . For the exam-ple of (TMTTF)2SbF6, the interchain exchange constant to
144428-8
BROKEN MAGNETIC SYMMETRY DUE TO CHARGE-ORDER . . . PHYSICAL REVIEW B 85, 144428 (2012)
TABLE III. Parameters for the angular dependence of the linewidth measured along the ab plane of (TMTTF)2SbF6 and (TMTTF)2AsF6
at different temperatures above and below the CO transitions TCO = 156 K and 102 K, respectively. The values are obtained by modeling thedata according to Eqs. (4) and (5).
X band Q band W band
T �H (a) �H (b) �Hmod(45◦) �H (a) �H (b) �Hmod(45◦) �H (a) �H (b) �Hmod(45◦)(K) (Oe) (Oe) (Oe) (Oe) (Oe) (Oe) (Oe) (Oe) (Oe)
(TMTTF)2SbF6
295 2.53 3.31 0 2.46 3.45 0 2.58 3.37 0130 1.61 1.96 0.03 1.61 1.99 0.13 1.69 1.95 1.0260 1.52 1.64 0.08 1.37 1.48 0.18 1.48 1.60 1.5510 4.82 4.82 1.38 4.69 4.69 2.13 4.90 4.90 9.35
(TMTTF)2AsF6
295 2.58 3.37 0 2.62 3.49 0 2.78 3.48 0160 1.76 2.28 0 1.73 2.25 0 1.86 2.31 090 1.10 1.29 0.01 1.1 1.35 0.10 1.27 1.54 0.2050 0.87 0.95 0.03 0.8 0.94 0.11 0.96 1.12 0.2310 0.85 0.85 0.27 0.79 0.79 0.25 0.77 0.77 1.28
be used in Eq. (8) is therefore estimated as J ′ = 1.1 K.63 Weadopt this value also for (TMTTF)2AsF6 and (TMTTF)2PF6
which have the same crystal structure and J value. (ii)Equation (8) is simplified compared to Pilawa’s originalexpression, because at 95 GHz—where the AZ effect canbe reliably evaluated—the contribution of the nondiagonalelements of the g tensor can be neglected as it is reducedby one order of magnitude due to the exponential factor. (iii)In CuGeO3 and CuSb2O6 the inequivalent sites are locatedon adjacent chains. Also for the TMTTF salts the narrowingof the line is caused not by intrastack exchange but bythe interstack exchange constant, for the interaction within
FIG. 13. (Color online) Frequency dependence of the enhancedESR linewidth �Hen measured in the ab plane along the diagonaldirection (θ = 45◦). The data for (TMTTF)2SbF6 are shown at T =10 K (blue dots), 60 K (green triangles), and 130 K (red squares) for(TMTTF)2AsF6 at 10 K (blue dots) and 50 K (green triangles). Thelines are fits using Eq. (7).
the stacks is so large that it would suppress the AZ effectin the frequency range under consideration. Thus, we concludethat the magnetically nonequivalent sites are situated ondifferent TMTTF stacks. (iv) For that reason, the situationobserved in our systems is distinct from alternating chains withtwo magnetically distinct sites, such as copper benzoate.64–66
For (TMTTF)2X all dimers on a chain should be magneticallyequivalent.
From Eq. (8) we can calculate the difference betweenthe g tensors of the two inequivalent magnetic sites thatdevelop for T < TCO. Here δg is estimated using �HAZ →�Hen = 1.55 Oe at θ = 45◦ for the W band and at T = 60 K,that is, where the high-temperature approximation T J ′anticipated for the derivation of Eq. (8) is valid.67 WithJ ′ = 1.1 K and the resonance field B0 = 33 600 Oe we obtainδg = 0.016 78 for (TMTTF)2SbF6.
The fact that the maximum of �H occurs at the diagonaldirection θ = 45◦ of the ab plane together with the finite δg
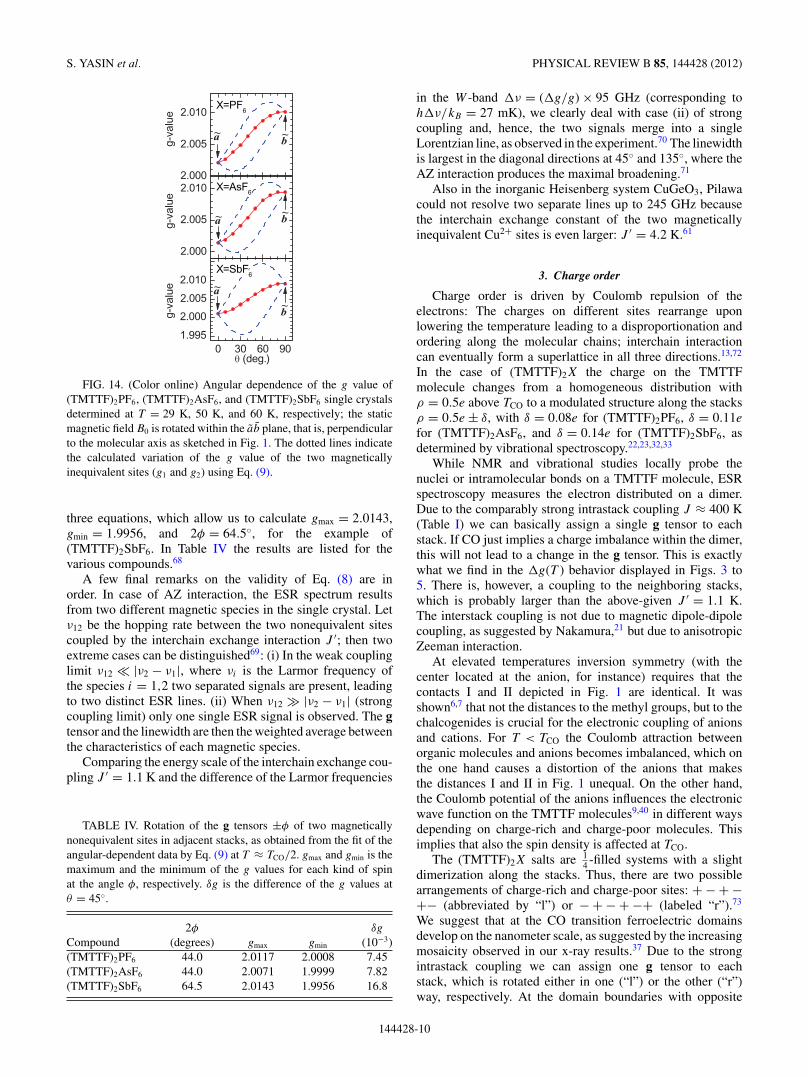
value allows us to draw several important conclusions. The gtensors of the spins corresponding to the two different magneticsites do not coincide with the principal magnetic axes butare rotated around the c axis by φ in opposite directions, asdepicted in Fig. 1. From Fig. 14 it becomes obvious that theanisotropy of the g value observed in the ab plane is the sum ofthe contributions from the two different sites. The anisotropyof the g value for each magnetic site can be expressed by
g1 = (g2
min cos2{θ − φ} + g2max sin2{θ − φ})1/2
, (9a)
g2 = (g2
max cos2{θ + φ} + g2min sin2{θ + φ})1/2
, (9b)
where g1 and g2 correspond to the g tensor of type 1 andtype 2 spins, respectively. The principal axes of the two kindsof spins span the angle 2φ. gmax and gmin are the maximumand the minimum of the g values for each kind of spins atthe angle φ, respectively. For symmetry reasons the g valueshave to be identical g1 = g2 at θ = 0◦ and θ = 90◦, whileat θ = 45◦ the difference of the g values (δg = 0.016 78)is obtained from the AZ effect. These conditions determine
144428-9
S. YASIN et al. PHYSICAL REVIEW B 85, 144428 (2012)
FIG. 14. (Color online) Angular dependence of the g value of(TMTTF)2PF6, (TMTTF)2AsF6, and (TMTTF)2SbF6 single crystalsdetermined at T = 29 K, 50 K, and 60 K, respectively; the staticmagnetic field B0 is rotated within the ab plane, that is, perpendicularto the molecular axis as sketched in Fig. 1. The dotted lines indicatethe calculated variation of the g value of the two magneticallyinequivalent sites (g1 and g2) using Eq. (9).
three equations, which allow us to calculate gmax = 2.0143,gmin = 1.9956, and 2φ = 64.5◦, for the example of(TMTTF)2SbF6. In Table IV the results are listed for thevarious compounds.68
A few final remarks on the validity of Eq. (8) are inorder. In case of AZ interaction, the ESR spectrum resultsfrom two different magnetic species in the single crystal. Letν12 be the hopping rate between the two nonequivalent sitescoupled by the interchain exchange interaction J ′; then twoextreme cases can be distinguished69: (i) In the weak couplinglimit ν12 |ν2 − ν1|, where νi is the Larmor frequency ofthe species i = 1,2 two separated signals are present, leadingto two distinct ESR lines. (ii) When ν12 |ν2 − ν1| (strongcoupling limit) only one single ESR signal is observed. The gtensor and the linewidth are then the weighted average betweenthe characteristics of each magnetic species.
Comparing the energy scale of the interchain exchange cou-pling J ′ = 1.1 K and the difference of the Larmor frequencies
TABLE IV. Rotation of the g tensors ±φ of two magneticallynonequivalent sites in adjacent stacks, as obtained from the fit of theangular-dependent data by Eq. (9) at T ≈ TCO/2. gmax and gmin is themaximum and the minimum of the g values for each kind of spinat the angle φ, respectively. δg is the difference of the g values atθ = 45◦.
2φ δg
Compound (degrees) gmax gmin (10−3)(TMTTF)2PF6 44.0 2.0117 2.0008 7.45(TMTTF)2AsF6 44.0 2.0071 1.9999 7.82(TMTTF)2SbF6 64.5 2.0143 1.9956 16.8
in the W -band �ν = (�g/g) × 95 GHz (corresponding toh�ν/kB = 27 mK), we clearly deal with case (ii) of strongcoupling and, hence, the two signals merge into a singleLorentzian line, as observed in the experiment.70 The linewidthis largest in the diagonal directions at 45◦ and 135◦, where theAZ interaction produces the maximal broadening.71
Also in the inorganic Heisenberg system CuGeO3, Pilawacould not resolve two separate lines up to 245 GHz becausethe interchain exchange constant of the two magneticallyinequivalent Cu2+ sites is even larger: J ′ = 4.2 K.61
3. Charge order
Charge order is driven by Coulomb repulsion of theelectrons: The charges on different sites rearrange uponlowering the temperature leading to a disproportionation andordering along the molecular chains; interchain interactioncan eventually form a superlattice in all three directions.13,72
In the case of (TMTTF)2X the charge on the TMTTFmolecule changes from a homogeneous distribution withρ = 0.5e above TCO to a modulated structure along the stacksρ = 0.5e ± δ, with δ = 0.08e for (TMTTF)2PF6, δ = 0.11e
for (TMTTF)2AsF6, and δ = 0.14e for (TMTTF)2SbF6, asdetermined by vibrational spectroscopy.22,23,32,33
While NMR and vibrational studies locally probe thenuclei or intramolecular bonds on a TMTTF molecule, ESRspectroscopy measures the electron distributed on a dimer.Due to the comparably strong intrastack coupling J ≈ 400 K(Table I) we can basically assign a single g tensor to eachstack. If CO just implies a charge imbalance within the dimer,this will not lead to a change in the g tensor. This is exactlywhat we find in the �g(T ) behavior displayed in Figs. 3 to5. There is, however, a coupling to the neighboring stacks,which is probably larger than the above-given J ′ = 1.1 K.The interstack coupling is not due to magnetic dipole-dipolecoupling, as suggested by Nakamura,21 but due to anisotropicZeeman interaction.
At elevated temperatures inversion symmetry (with thecenter located at the anion, for instance) requires that thecontacts I and II depicted in Fig. 1 are identical. It wasshown6,7 that not the distances to the methyl groups, but to thechalcogenides is crucial for the electronic coupling of anionsand cations. For T < TCO the Coulomb attraction betweenorganic molecules and anions becomes imbalanced, which onthe one hand causes a distortion of the anions that makesthe distances I and II in Fig. 1 unequal. On the other hand,the Coulomb potential of the anions influences the electronicwave function on the TMTTF molecules9,40 in different waysdepending on charge-rich and charge-poor molecules. Thisimplies that also the spin density is affected at TCO.
The (TMTTF)2X salts are 14 -filled systems with a slight
dimerization along the stacks. Thus, there are two possiblearrangements of charge-rich and charge-poor sites: + − + −+− (abbreviated by “l”) or − + − + −+ (labeled “r”).73
We suggest that at the CO transition ferroelectric domainsdevelop on the nanometer scale, as suggested by the increasingmosaicity observed in our x-ray results.37 Due to the strongintrastack coupling we can assign one g tensor to eachstack, which is rotated either in one (“l”) or the other (“r”)way, respectively. At the domain boundaries with opposite
144428-10

BROKEN MAGNETIC SYMMETRY DUE TO CHARGE-ORDER . . . PHYSICAL REVIEW B 85, 144428 (2012)
polarization the interaction leads to a coupling of adjacentstacks with two inequivalent magnetic sites.
Without any coupling two distinct ESR signals wouldbe expected below the ordering temperature TCO, butthe strong coupling leads to a significant broadening. Asthe averaged g tensor does not abruptly change at the phasetransition, the effect of CO can be pictured as follows: AboveTCO random charge disproportionation exists on the TMTTFchains, giving rise to an averaged g tensor as observed,but without any AZ effect, which is suppressed due to thenarrowing by large intrachain exchange. Below TCO, the chargedisproportionation becomes cooperative within each domainand at the boundaries adjacent chains weakly interact. Thisgives rise to two inequivalent sites that yield the same averagedg tensor as above TCO, but the AZ effect becomes visiblebecause the signal is narrowed by the much weaker interchainexchange.
Note that the splitting into two g tensors rotated by ±32.25◦around the c axis (see Fig. 1) that sets in at TCO is distinct fromthe gradual uniform rotation of the g tensor around the a axisas temperature decreases, which has recently been reported byFurukawa et al.40 In (TMTTF)2SbF6, for example, the rotationangle around the a axis at T = 60 K is equal to 13◦, but as allsites exhibit the same rotation, it does not give rise to additionalline broadening from AZ effect. Nevertheless, an indication ofthe rotation of the g tensor is given by Figs. 4 and 5, where thechange in the anisotropy of the g value in the bc plane withreduced temperature is seen.
Already, Riera and Poilblanc74 suggested that CO inTMTTF salts is a cooperative effect between the Coulombinteraction and the electronic coupling of the TMTTF stacksto the anions; small displacements of the anions along somearbitrary directions lead to local changes of the on-siteelectronic energies which produce nonequivalent magneticsites. We conclude from our ESR measurements that in theCO regime two inequivalent magnetic TMTTF sites coexiston neighboring stacks, which produce a doubling in theangular periodicity of the linewidth as well as the characteristicquadratic frequency dependence.
We should note that for the lowest temperature presentedin Fig. 10, (TMTTF)2SbF6 approaches the antiferromagneticorder at TN = 8 K. In the subsequent Sec. IV B we discussthe fluctuation regime in more detail. We note that for(TMTTF)2SbF6 the linewidth increases by a factor of 6 in thefluctuation regime. Looking at Eq. (8) this implies a decreaseof |J ′| or—more likely—an increase of δg by a factor of 2.5.In Figs. 11 and 12 we present data of (TMTTF)2AsF6 and(TMTTF)2PF6 in the spin-Peierls state. It seems that the COstate is not affected by the spin-Peierls transition.
B. Antiferromagnetic fluctuations
Let us come back to the temperature dependence of thelinewidth as displayed in Figs. 4 and 6. As the temperature isreduced and approaches the AFM ordering TN = 8 K and 7 Kof (TMTTF)2SbF6 and (TMTTF)2SCN, respectively, �H (T )strongly increases. This singularity of the ESR linewidth is asignature of magnetic fluctuations. Bourbonnais presented adetailed theoretical analysis of �H (T ) in the AFM fluctuationregion.75 In the case of a small static magnetic field B0,
FIG. 15. (Color online) Double-logarithmic plot of the linewidthversus T − TN of (TMTTF)2SCN (top) and (TMTTF)2SbF6 (bottom)in the antiferromagnetic fluctuation region; the X-band data are takenat different directions, as indicated. The lines represent the fit to apower law �H (T ) ∝ (T − TN )−μ given in Eq. (10) with the exponentμ = 1.5 for (TMTTF)2SCN and μ = 0.5 for (TMTTF)2SbF6, whereTN = 7 K in the case of (TMTTF)2SCN and 8 K for (TMTTF)2SbF6.
the linewidth in the fluctuation region follows a power-lawbehavior:
�H (T → TN ) ∝(
T − TN
TN
)−μ
, (10)
where μ depends on the dimension d of the AFM fluctuations.If dipole-dipole interactions are the dominant relaxationprocess in this critical region, the exponent is given by μ =3 − d/2; that is, μ = 3/2 is predicted for three-dimensionalAFM fluctuations.75
In Fig. 15 we present the analysis of the temperaturedependence of �H for the two materials investigated nearthe AFM phase transition. The data of (TMTTF)2SCN followthe power-law given by Eq. (10) with μ = 1.5 expected forfluctuations associated with three-dimensional AFM orderingbelow TN . Both directions (B0 ‖ b and B0 ‖ c) exhibit thesame behavior. Our findings are in agreement with previousNMR investigations where a critical behavior in the relaxationrate was reported.76 The same slope of �H (T ) with μ = 1.5was found in the AFM fluctuation region of (TMTSF)2PF6,(TMTSF)2AsF6, and (TMTTF)2Br.49,50,77,78
Surprisingly, a different power law of μ = 0.5 is obtainedin the data of (TMTTF)2SbF6 where AZ interaction is present.This observation was made in all three directions and for allthree frequencies used in our study. The reason might be thedifferent anisotropy in the spin degree of freedom, but alsothe relative magnitude of the dipole-dipole interaction andspin-orbit interaction is different compared to (TMTTF)2SCN.It seems that dipole-dipole interaction is missing at all in
144428-11
S. YASIN et al. PHYSICAL REVIEW B 85, 144428 (2012)
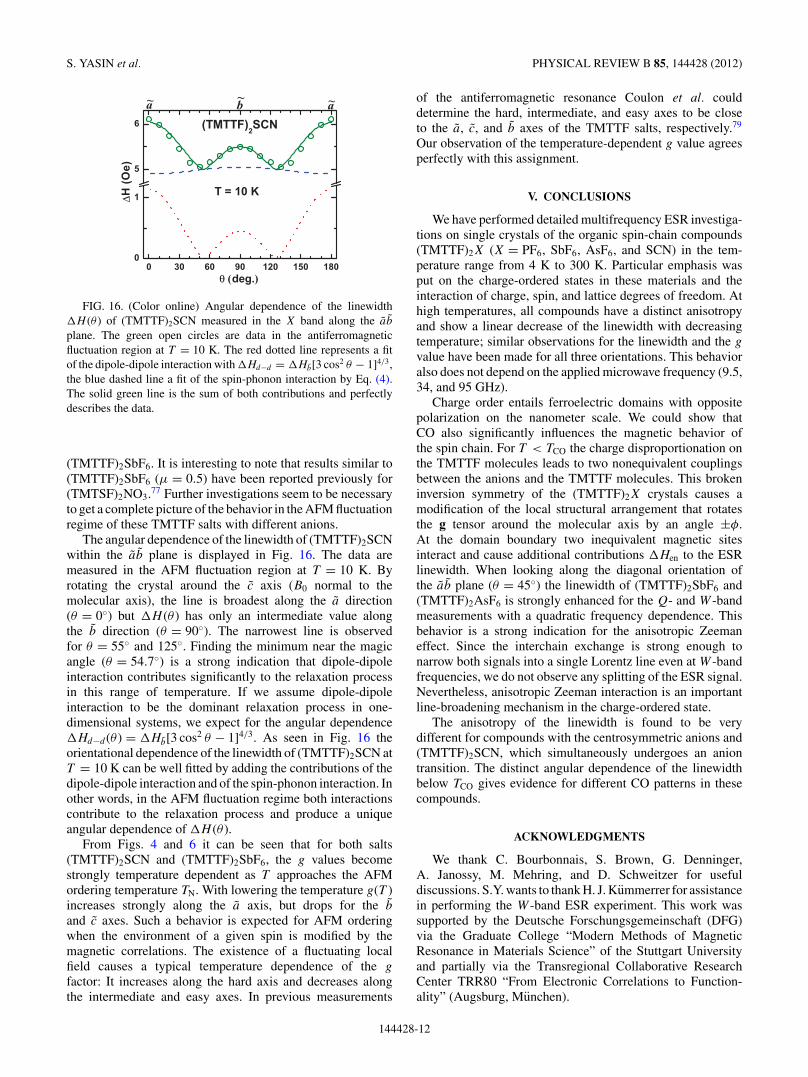
FIG. 16. (Color online) Angular dependence of the linewidth�H (θ ) of (TMTTF)2SCN measured in the X band along the ab
plane. The green open circles are data in the antiferromagneticfluctuation region at T = 10 K. The red dotted line represents a fitof the dipole-dipole interaction with �Hd−d = �Hb[3 cos2 θ − 1]4/3,the blue dashed line a fit of the spin-phonon interaction by Eq. (4).The solid green line is the sum of both contributions and perfectlydescribes the data.
(TMTTF)2SbF6. It is interesting to note that results similar to(TMTTF)2SbF6 (μ = 0.5) have been reported previously for(TMTSF)2NO3.77 Further investigations seem to be necessaryto get a complete picture of the behavior in the AFM fluctuationregime of these TMTTF salts with different anions.
The angular dependence of the linewidth of (TMTTF)2SCNwithin the ab plane is displayed in Fig. 16. The data aremeasured in the AFM fluctuation region at T = 10 K. Byrotating the crystal around the c axis (B0 normal to themolecular axis), the line is broadest along the a direction(θ = 0◦) but �H (θ ) has only an intermediate value alongthe b direction (θ = 90◦). The narrowest line is observedfor θ = 55◦ and 125◦. Finding the minimum near the magicangle (θ = 54.7◦) is a strong indication that dipole-dipoleinteraction contributes significantly to the relaxation processin this range of temperature. If we assume dipole-dipoleinteraction to be the dominant relaxation process in one-dimensional systems, we expect for the angular dependence�Hd−d (θ ) = �Hb[3 cos2 θ − 1]4/3. As seen in Fig. 16 theorientational dependence of the linewidth of (TMTTF)2SCN atT = 10 K can be well fitted by adding the contributions of thedipole-dipole interaction and of the spin-phonon interaction. Inother words, in the AFM fluctuation regime both interactionscontribute to the relaxation process and produce a uniqueangular dependence of �H (θ ).
From Figs. 4 and 6 it can be seen that for both salts(TMTTF)2SCN and (TMTTF)2SbF6, the g values becomestrongly temperature dependent as T approaches the AFMordering temperature TN. With lowering the temperature g(T )increases strongly along the a axis, but drops for the b
and c axes. Such a behavior is expected for AFM orderingwhen the environment of a given spin is modified by themagnetic correlations. The existence of a fluctuating localfield causes a typical temperature dependence of the g
factor: It increases along the hard axis and decreases alongthe intermediate and easy axes. In previous measurements
of the antiferromagnetic resonance Coulon et al. coulddetermine the hard, intermediate, and easy axes to be closeto the a, c, and b axes of the TMTTF salts, respectively.79
Our observation of the temperature-dependent g value agreesperfectly with this assignment.
V. CONCLUSIONS
We have performed detailed multifrequency ESR investiga-tions on single crystals of the organic spin-chain compounds(TMTTF)2X (X = PF6, SbF6, AsF6, and SCN) in the tem-perature range from 4 K to 300 K. Particular emphasis wasput on the charge-ordered states in these materials and theinteraction of charge, spin, and lattice degrees of freedom. Athigh temperatures, all compounds have a distinct anisotropyand show a linear decrease of the linewidth with decreasingtemperature; similar observations for the linewidth and the g
value have been made for all three orientations. This behavioralso does not depend on the applied microwave frequency (9.5,34, and 95 GHz).
Charge order entails ferroelectric domains with oppositepolarization on the nanometer scale. We could show thatCO also significantly influences the magnetic behavior ofthe spin chain. For T < TCO the charge disproportionation onthe TMTTF molecules leads to two nonequivalent couplingsbetween the anions and the TMTTF molecules. This brokeninversion symmetry of the (TMTTF)2X crystals causes amodification of the local structural arrangement that rotatesthe g tensor around the molecular axis by an angle ±φ.At the domain boundary two inequivalent magnetic sitesinteract and cause additional contributions �Hen to the ESRlinewidth. When looking along the diagonal orientation ofthe ab plane (θ = 45◦) the linewidth of (TMTTF)2SbF6 and(TMTTF)2AsF6 is strongly enhanced for the Q- and W -bandmeasurements with a quadratic frequency dependence. Thisbehavior is a strong indication for the anisotropic Zeemaneffect. Since the interchain exchange is strong enough tonarrow both signals into a single Lorentz line even at W -bandfrequencies, we do not observe any splitting of the ESR signal.Nevertheless, anisotropic Zeeman interaction is an importantline-broadening mechanism in the charge-ordered state.
The anisotropy of the linewidth is found to be verydifferent for compounds with the centrosymmetric anions and(TMTTF)2SCN, which simultaneously undergoes an aniontransition. The distinct angular dependence of the linewidthbelow TCO gives evidence for different CO patterns in thesecompounds.
ACKNOWLEDGMENTS
We thank C. Bourbonnais, S. Brown, G. Denninger,A. Janossy, M. Mehring, and D. Schweitzer for usefuldiscussions. S.Y. wants to thank H. J. Kummerrer for assistancein performing the W -band ESR experiment. This work wassupported by the Deutsche Forschungsgemeinschaft (DFG)via the Graduate College “Modern Methods of MagneticResonance in Materials Science” of the Stuttgart Universityand partially via the Transregional Collaborative ResearchCenter TRR80 “From Electronic Correlations to Function-ality” (Augsburg, Munchen).
144428-12
BROKEN MAGNETIC SYMMETRY DUE TO CHARGE-ORDER . . . PHYSICAL REVIEW B 85, 144428 (2012)
1D. Jerome and H. J. Schulz, Adv. Phys. 31, 299 (1982).2J. Moser, M. Gabay, P. Auban-Senzier, D. Jerome, K. Bechgaard,and J. M. Fabre, Eur. Phys. J. B 1, 39 (1998).
3C. Bourbonnais and D. Jerome, in Advances in Synthetic Metals,edited by P. Bernier, S. Lefrant, and G. Bidan (Elsevier, Amsterdam,1999), p. 206.
4M. Dressel, Naturwissenschaften 90, 337 (2003); J. Phys.: Condens.Matter 23, 293201 (2011).
5M. Dressel, Naturwissenschaften 94, 527 (2007).6B. Kohler, E. Rose, M. Dumm, G. Untereiner, and M. Dressel,Phys. Rev. B 84, 035124 (2011).
7E. Rose and M. Dressel, Physica B 407, 1787 (2012).8J. P. Pouget and S. Ravy, J. Phys. I (France) 6, 1501 (1996).9W. Yu, F. Zhang, F. Zamborszky, B. Alavi, A. Baur, C. A. Merlic,and S. E. Brown, Phys. Rev. B 70, 121101 (2004).
10D. Chasseau, J. Gaultier, J. L. Miane, C. Coulon, P. Delhaes,S. Flandrois, J. M. Fabre, and L. Giral, J. Phys. Colloq. (France)44, C3-1223 (1983).
11L. Ducasse, M. Abderrabba, B. Gallois, and D. Chasseau, Synth.Met. 19, 327 (1987).
12T. Granier, B. Gallois, A. Fritsch, L. Ducasse, and C. Coulon, inLower Dimensional Systems and Molecular Electronics, edited byR. M. Metzger, P. Day, and G. C. Papavassiliou (Plenum Press, NewYork, 1990), Vol. 248 of NATO ASI, Series B: Physics, p. 163.
13H. Seo and H. Fukuyama, J. Phys. Soc. Jpn. 66, 1249 (1997).14F. Nad, P. Monceau, and J. M. Fabre, Eur. Phys. J. B 3, 301 (1998).15F. Nad, P. Monceau, C. Carcel, and J. M. Fabre, J. Phys.: Condens.
Matter 13, L717 (2001).16P. Monceau, F. Y. Nad, and S. Brazovskii, Phys. Rev. Lett. 86, 4080
(2001).17F. Nad and P. Monceau, J. Phys. IV (France) 12, Pr9-133 (2002).18D. S. Chow, F. Zamborszky, B. Alavi, D. J. Tantillo, A. Baur, C. A.
Merlic, and S. E. Brown, Phys. Rev. Lett. 85, 1698 (2000).19F. Zamborszky, W. Yu, W. Raas, S. E. Brown, B. Alavi, C. A.
Merlic, and A. Baur, Phys. Rev. B 66, 081103(R) (2002).20W. Yu, F. Zamborszky, B. Alavi, A. Baur, C. A. Merlic, and S. E.
Brown, J. Phys. IV (France) 114, 35 (2004).21T. Nakamura, J. Phys. Soc. Jpn. 72, 213 (2003).22M. Dumm, B. Salameh, M. Abaker, L. K. Montgomery, and
M. Dressel, J. Phys. IV (France) 114, 57 (2004).23M. Dumm, M. Abaker, and M. Dressel, J. Phys. IV (France) 131,
55 (2005).24K. Furukawa, T. Hara, and T. Nakamura, J. Phys. Soc. Jpn. 74, 3288
(2005).25B. Korin-Hamzic, E. Tafra, M. Basletic, A. Hamzic, and M. Dressel,
Phys. Rev. B 73, 115102 (2006).26S. Hirose, A. Kawamoto, N. Matsunaga, K. Nomura, K. Yamamoto,
and K. Yakushi, Phys. Rev. B 81, 205107 (2010).27B. Salameh, S. Yasin, M. Dumm, G. Untereiner, L. Montgomery,
and M. Dressel, Phys. Rev. B 83, 205126 (2011).28C. Coulon, S. S. P. Parkin, and R. Laversanne, Phys. Rev. B 31,
3583 (1985).29Sh. Fujiyama and T. Nakamura, Phys. Rev. B 70, 045102 (2004).30M. Dressel and N. Drichko, Chem. Rev. 104, 5689 (2004).31N. Drichko, S. Kaiser, Y. Sun, C. Clauss, M. Dressel, H. Mori,
J. Schlueter, E. I. Zhyliaeva, S. A. Torunova, and R. N.Lyubovskaya, Physica B 404, 490 (2009).
32T. Knoblauch and M. Dressel, Phys. Status Solidi C (2012)(in press).
33M. Dressel, M. Dumm, T. Knoblauch, and M. Masino, Crystals(2012) (in press).
34Y. Nogami and T. Nakamura, J. Phys. IV (France) 12, Pr9-145(2002).
35R. Laversanne, C. Coulon, B. Gallois, J. P. Pouget, and R. Moret,J. Phys. Lett. 45, L393 (1984).
36S. Ravy, P. Foury-Leylekian, D. Le Bolloch, J. P. Pouget,J. M. Fabre, R. J. Prado, and P. Lagarde, J. Phys. IV 114, 81 (2004).
37E. Rose, F. Lissner, T. Schleid, and M. Dressel (to be published).38M. de Souza, P. Foury-Leylekian, A. Moradpour, J.-P. Pouget, and
M. Lang, Phys. Rev. Lett. 101, 216403 (2008).39P. Foury-Leylekian, S. Petit, G. Andre, A. Moradpour, and J.-P.
Pouget, Physica B 405, 595 (2010).40K. Furukawa, T. Hara, and T. Nakamura, J. Phys. Soc. Jpn. 78,
104713 (2009).41K. Furukawa, T. Hara, and T. Nakamura, J. Phys. Soc. Jpn. 79,
043702 (2010).42Complementary X-band measurements were performed at the
Hochfeld-Magnetlabor Dresden and at the University Augsburgusing a Bruker Elexsys 500 CW system.
43L. K. Montgomery, in Organic Conductors, edited by J. P. Farges(Dekker, New York, 1994), p. 138.
44A. Janossy (private communications).45N. Kinoshita, T. Ukachi, M. Tokumoto, H. Anzai, T. Ishiguro,
G. Saito, T. Yamabe, and H. Teramae, J. Phys. Colloq. C3 (France)44, C3-1029 (1983); N. Kinoshita, M. Tokumoto, H. Anzai,T. Ishiguro, G. Saito, T. Yamabe, and H. Teramae, J. Phys. Soc.Jpn. 53, 1504 (1984).
46C. Coulon and R. Clerac, Chem. Rev. 104, 5655 (2004).47Previously, the long, intermediate, and short molecular axes have
been heterogeneously labeled as x, y, and z (Ref. 45) or as c∗, b′,and a axis (Ref. 50). Furukawa et al. and Kinoshita et al. indicatedthe principal axes of the g tensor as g1, g2, and g3 (Refs. 40 and 45).
48M. Dressel, P. Hesse, S. Kirchner, G. Untereiner, M. Dumm,J. Hemberger, A. Loidl, and L. Montgomery, Synth. Met. 120,719 (2001).
49M. Dumm, A. Loidl, B. W. Fravel, K. P. Starkey, L. K. Montgomery,and M. Dressel, Phys. Rev. B 61, 511 (2000).
50M. Dumm, A. Loidl, B. Alavi, K. P. Starkey, L. K. Montgomery,and M. Dressel, Phys. Rev. B 62, 6512 (2000).
51C. P. Slichter, Principle of Magnetic Resonance (Springer-Verlag,Berlin, 1996).
52R. S. Drago, Physical Methods in Chemistry (Saunders, Philadel-phia, 1977).
53F. J. Adrian, Phys. Rev. B 26, 2682 (1982); 33, 1537 (1986).54K. Yamamoto, S. Iwai, N. Nishi, and K. Yakushi (unpublished).55The CO pattern defines the arrangement of the charge-rich and
charge-poor sites along the stacking axis a; these sites can bearranged in different ways, such as 1010 or 1001, for instance.See R. T. Clay, S. Mazumdar, and D. K. Campbell, Phys. Rev. B67, 115121 (2003).
56For (TMTTF)2AsF6 the X-band linewidth exceeds the Q-band dataat T = 10 K. From Fig. 5 we can see that X-band data exhibita strong temperature dependence in this range; for experimentalreasons uncertainties in the absolute temperature value cannot beruled out.
57We have calculated the enhanced linewidth at this temperature T ≈30 K in order to eliminate any spin-Peierls fluctuation effects in ourcalculations.
144428-13
S. YASIN et al. PHYSICAL REVIEW B 85, 144428 (2012)
58The enhanced linewidth (�Hen) for the Q- and W -band measure-ments is calculated by relating their linewidths along a and b axesto the ones of the X-band measurements in order to eliminate anysample-size effect in our calculations.
59A. Bencini and D. Gatteschi, in Electron Paramagnetic Resonanceof Exchange Coupled Systems (Springer, Berlin, 1990).
60In the case of staggered fields, antisymmetric Dzyaloshinskii-Moriya interaction also causes a ω2 frequency dependence ofthe linewidth; however, leading to a T −2 temperature dependence[H. Oshikawa and I. Affleck, Phys. Rev. Lett. 82, 5136 (1999);H. Herak, A. Zorko, D. Arcon, A. Potocnik, M. Klanjsek, J. vanTol, A. Ozarowski, and H. Berger, Phys. Rev. B 84, 184436 (2011)]in contrast to our findings. Note also that in those referencesHeisenberg spin chains with significant intra-chain Dzyaloshinskii-Moriya interaction were considered. In the present case, thealternating contributions result from interaction between the chains,for which the iostropic exchange J ′ is already small. Thus theantisymmetric Dzyaloshinskii-Moriya exchange can be neglected.
61B. Pilawa, J. Phys.: Condens. Matter 9, 3779 (1997).62M. Heinrich, H. A. Krug von Nidda, A. Krimmel, A. Loidl,
R. M. Eremina, A. D. Ineev, B. I. Kochelaev, A. V. Prokofiev, andW. Assmus, Phys. Rev. B 67, 224418 (2003).
63C. Yasuda, S. Todo, K. Hukushima, F. Alet, M. Keller, M. Troyer,and H. Takayama, Phys. Rev. Lett. 94, 217201 (2005).
64M. Date, H. Yamazaki, M. Motokawa, and S. Tazawa, Prog. Theor.Phys. Suppl. 46, 194 (1970).
65K. Okuda, H. Hata, and M. Date, J. Phys. Soc. Jpn. 33, 1574(1972).
66D. C. Dender, D. Davidovic, D. H. Reich, C. Broholm, K. Lefmann,and G. Aeppli, Phys. Rev. B 53, 2583 (1996).
67We have chosen this temperature T ≈ 60 K in order to excludeantiferromagnetic fluctuation effects in our calculations.
68For (TMTTF)2AsF6 and (TMTTF)2SbF6 we see basically noincrease in the enhanced linewidth when going from X band toQ band. A similar assumption can be made for (TMTTF)2PF6.For the analysis of the g tensor rotation; we have therefore usedB0 = 1250 Oe for the Q-band frequency.
69A. Carrington and A. D. McLachlan, Introduction to MagneticResonance (McLachlan, New York, 1967).
70We observe a slight distortion in the ESR spectra along the 45◦
and 135◦ below TCO. It is known from previous studies that thedistortion of the signal is a precursor of the splitting.
71E. I. Yudanova, S. K. Hoffmann, A. Graja, S. V. Konovalikhin,O. A. Dyachenko, R. B. Lubovskii, and R. N. Lyubovskaya, Synth.Met. 73, 227 (1995).
72H. Seo, C. Hotta, and H. Fukuyama, Chem. Rev. 104, 5005 (2004).73There are no indications of a tetramerization along the stack, that
is, an arrangement + − − + + − −+.74J. Riera and D. Poilblanc, Phys. Rev. B 63, 241102 (2001).75C. Bourbonnais, in Interacting Electrons in Reduced Dimensions,
edited by D. Baeriswyl and D. K. Campdell (Plenum, New York,1989), Vol. 213 of NATO ASI, Series B: Physics, p. 227.
76B. Liautard, S. Peytavin, G. Brun, and M. Maurin, J. Phys. Coll. C344, 951 (1983).
77S. Tomic, J. R. Cooper, W. Kang, D. Jerome, and K. Maki, J. Phys.I 1, 1603 (1991).
78P. Baillargeon, C. Bourbonnais, S. Tomic, P. Vaca, and C. Coulon,Synth. Met. 27, 83 (1988).
79C. Coulon, J. C. Scott, and R. Laversanne, Phys. Rev. B 33, 6235(1986).
144428-14