salmon stocks and fisheries in england and wales...report on salmon fisheries in 2017 1. description...
TRANSCRIPT

Salmon Stocks and Fisheries
in England and Wales
in 2017


SALMON STOCKS AND FISHERIES IN ENGLAND AND WALES, 2017
Preliminary assessment prepared for ICES, April 2018

Acknowledgement:
This report has been compiled jointly by staff from the Cefas Salmon and Freshwater Fisheries Team at Lowestoft and fisheries personnel from the Environment Agency and Natural Resources Wales. The monitoring and assessment of salmon stocks is funded by Defra and Welsh Government. All the participating organisations would like to extend their thanks and recognition to the various operational fisheries staff who have collected and compiled the data for this report. Thanks are also due to: the National River Flow Archive at the Centre for Ecology and Hydrology for providing river flow data; to the Game and Wildlife Conservation Trust for data relating to the River Frome; to the General Secretary of ICES for permission to cite the reports of the ICES Working Group on North Atlantic Salmon; to NASCO for permission to include their summary of regulatory measures for the high seas fisheries; and to Graphic Solutions (E.A.) Limited for preparation of the final report.
© Crown Copyright 2018

CONTENTS
FOREWORD 4
HIGHLIGHTS FOR 2017 5
REPORT ON SALMON FISHERIES IN 2017 6
1. Description of Stocks and Fisheries 6
2. Fishery regulation measures 9
3. Fishing effort 13
4. Declared catches 20
5. Catch per unit effort (CPUE) 44
6. Exploitation rates 48
REPORT ON STATUS OF STOCKS IN 2017 52
7. Stock monitoring 52
8. Assessment of stock status 61
9. Factors affecting stocks, fisheries and catches 729.1 Management measures 729.2 Other factors 73
10. Existing and emerging threats to salmon populations 77
11. References 79
ANNEX 1. NASCO’s request for scientific advice from ICES in 2018 80
ANNEX 2. Net Limitation Orders applying to salmon net fisheries in England & Wales. 82
ANNEX 3. Byelaws applying to salmon rod fisheries in England and Wales. 83

FOREWORD
Annual reports on the status of salmon stocks and fisheries in England and Wales have been produced since 1997. These reports present a preliminary assessment for the latest year to assist ICES in providing scientific advice to NASCO and to provide early feedback to fishery managers and anglers. The list of questions posed by NASCO to ICES for consideration in 2018 is provided at Annex 1 of this report.
For much of the period, the annual reports were prepared by the Centre for Environment, Fisheries and Aquaculture Science (Cefas) and the Environment Agency. However, from 1 April 2013, the functions of the Environment Agency in Wales transferred to a new body, Natural Resources Wales (Cyfoeth Naturiol Cymru) (NRW). This body is now responsible for salmon management and regulation in Wales. All three organisations have therefore contributed to production of the annual assessment report since 2013.
Until 2013, each annual assessment report was designed to stand alone, to avoid the need to refer to previous reports for background information. However, this resulted in much of the descriptive text being very similar year-on-year. From 2014, therefore, and in the interest of streamlining procedures, the report has been split into two separate documents. A background report provides the regulatory framework and describes the various methods and approaches used in the assessment process; this report is expected to change relatively little year on year. The most recent annual assessment (this report) then provides a relatively short description of developments in the latest year together with updated tables and figures. Both reports are available on line at the same location on the Gov.UK website.
It should be noted that the data for the most recent year are provisional and will be updated and confirmed as complete catch data are obtained and records validated. The final confirmed data for the current year will be included in next year’s report. The Environment Agency and Natural Resources Wales also publish separate Salmonid and Freshwater Fisheries Statistics reports. These are also available at Gov.UK: https://www.gov.uk/government/collections/salmonid-and-freshwater-fisheries-statistics.
Salmon Stocks and Fisheries in England and Wales, 2017
4
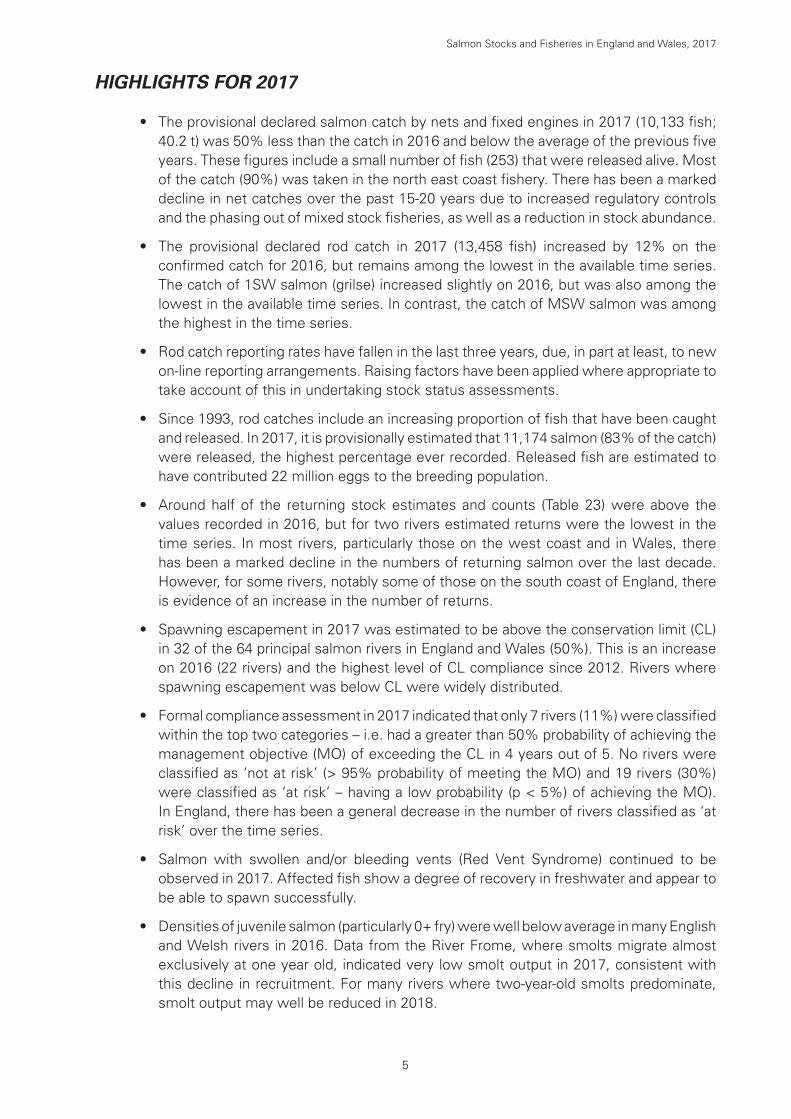
HIGHLIGHTS FOR 2017
• The provisional declared salmon catch by nets and fixed engines in 2017 (10,133 fish; 40.2 t) was 50% less than the catch in 2016 and below the average of the previous five years. These figures include a small number of fish (253) that were released alive. Most of the catch (90%) was taken in the north east coast fishery. There has been a marked decline in net catches over the past 15-20 years due to increased regulatory controls and the phasing out of mixed stock fisheries, as well as a reduction in stock abundance.
• The provisional declared rod catch in 2017 (13,458 fish) increased by 12% on the confirmed catch for 2016, but remains among the lowest in the available time series. The catch of 1SW salmon (grilse) increased slightly on 2016, but was also among the lowest in the available time series. In contrast, the catch of MSW salmon was among the highest in the time series.
• Rod catch reporting rates have fallen in the last three years, due, in part at least, to new on-line reporting arrangements. Raising factors have been applied where appropriate to take account of this in undertaking stock status assessments.
• Since 1993, rod catches include an increasing proportion of fish that have been caught and released. In 2017, it is provisionally estimated that 11,174 salmon (83% of the catch) were released, the highest percentage ever recorded. Released fish are estimated to have contributed 22 million eggs to the breeding population.
• Around half of the returning stock estimates and counts (Table 23) were above the values recorded in 2016, but for two rivers estimated returns were the lowest in the time series. In most rivers, particularly those on the west coast and in Wales, there has been a marked decline in the numbers of returning salmon over the last decade. However, for some rivers, notably some of those on the south coast of England, there is evidence of an increase in the number of returns.
• Spawning escapement in 2017 was estimated to be above the conservation limit (CL) in 32 of the 64 principal salmon rivers in England and Wales (50%). This is an increase on 2016 (22 rivers) and the highest level of CL compliance since 2012. Rivers where spawning escapement was below CL were widely distributed.
• Formal compliance assessment in 2017 indicated that only 7 rivers (11%) were classified within the top two categories – i.e. had a greater than 50% probability of achieving the management objective (MO) of exceeding the CL in 4 years out of 5. No rivers were classified as ‘not at risk’ (> 95% probability of meeting the MO) and 19 rivers (30%) were classified as ‘at risk’ – having a low probability (p < 5%) of achieving the MO). In England, there has been a general decrease in the number of rivers classified as ‘at risk’ over the time series.
• Salmon with swollen and/or bleeding vents (Red Vent Syndrome) continued to be observed in 2017. Affected fish show a degree of recovery in freshwater and appear to be able to spawn successfully.
• Densities of juvenile salmon (particularly 0+ fry) were well below average in many English and Welsh rivers in 2016. Data from the River Frome, where smolts migrate almost exclusively at one year old, indicated very low smolt output in 2017, consistent with this decline in recruitment. For many rivers where two-year-old smolts predominate, smolt output may well be reduced in 2018.
5
Salmon Stocks and Fisheries in England and Wales, 2017

REPORT ON SALMON FISHERIES IN 2017
1. DESCRIPTION OF STOCKS AND FISHERIES
There are 49 rivers in England and 31 rivers in Wales that regularly support salmon (Figure 1), although some of the stocks are very small and support minimal catches; of these, 64 rivers have been designated ‘principal salmon rivers’. Conservation limits (CLs) and Management Targets (MTs) have been set for the 42 principal salmon rivers in England and 22 in Wales and are used to give annual advice on stock status and to assess the need for management and conservation measures.
Rod fishing for salmon is permitted on all rivers supporting salmon stocks, and net or fixed engine fisheries operate on a proportion of these, usually in the river estuaries. Descriptions of the different salmon fishing methods employed in England and Wales can be found in the background report.
Many of the tables and figures presented in this report summarise statistics for England and Wales at a regional level. Following a reorganisation in 2014, the Environment Agency ceased to operate on a regional basis. However, in the interests of maintaining existing time series, data are still aggregated and reported by region in this report. The full statistics, reported on a river by river basis, are provided in the catch statistics reports which are published annually by the Environment Agency and Natural Resources Wales. A list of the individual rivers falling within each region is provided in Table 1.
Table 1. The main salmon rivers in England and Wales aggregated by their earlier regional jurisdictions. The table also provides details of those rivers with Salmon Action Plans and those designated as Special Areas of Conservation (SAC) for which salmon are a qualifying species.
Country Region (pre 2014) Region (pre 2011 where different)
River SAP for river SAC designation
Comments
England North East AlnCoquet YesTyne YesWear YesTees YesYorkshire Esk Yes
Anglian No salmon producing rivers, but has coastal fishery
South East Thames Thames YesSouthern Itchen Yes Yes
Test YesSouth West Hampshire Avon Yes Yes
Stour YesPiddle YesFrome YesAxe YesExe YesTeign Yes YesDart Yes YesAvon (Devon) YesErme Yes YesYealm Yes YesPlym YesTavy Yes YesTamar YesLynher Yes
Salmon Stocks and Fisheries in England and Wales, 2017
6

Table 1. continued
LooeFowey YesCamel Yes YesTaw Yes YesTorridge YesLyn Yes
Midlands OuseTrent YesSevern Yes
North West MerseyRibble YesWyre YesLune YesKent YesLeven YesCrake YesDuddon YesEsk (Cumbria) YesIrt YesEhen Yes YesCalder YesDerwent Yes YesEllenEden Yes YesEsk (Border) Yes
Wales Welsh Wye Yes YesUsk Yes YesTaff YesOgmore YesAfan YesNeathTawe YesLoughor YesGwendraeth Fawr & FachTywi YesTaf YesE & W Cleddau YesNevern YesTeifi Yes YesAeronYstwythRheidol YesDyfi YesDysynni YesMawddach Yes YesWnionArtroDwyryd YesGlaslyn YesDwyfach & Dwyfawr YesLlyfniGwyrfai YesSeiont YesOgwen YesConwy YesClwyd YesDee Yes Yes
Note: Those rivers designated as SACs have salmon identified as a qualifying species in all or part of the catchment. This confers additional protection measures specifically for salmon in these rivers and any associated on-line lakes. In some of these rivers, salmon are a primary reason for SAC designation.
7
Salmon Stocks and Fisheries in England and Wales, 2017

59 865
9
10
80
5
11
3334
2
3
7
4
35
13
64
12
79
43
6
41
30
47
51
19
37
62
45
66
39
72
69
76
44
1
40
17
63
50
18
31
68
46
75
29
42
70
55
20
60
36
77
71
16
49
61
53
52
78
28
48
67
2426
5657
38
58
25
7374
15
32
54
23
14
2122
27
1 Aln2 Coquet*3 Tyne*4 Wear*5 Tees*6 Esk (Yorkshire)*7 Ouse8 Trent9 Thames*10 Itchen*$11 Test*12 Avon (Hants)*$13 Stour (Dorset)*14 Piddle*15 Frome*16 Axe*17 Exe*
34 Wye*$35 Usk*$36 Taff*37 Ogmore*38 Afan*39 Neath40 Tawe*41 Loughor*42 Gwendraeth Fawr43 Tywi*44 Taf*45 E & W Cleddau*46 Nevern*47 Teifi*$48 Aeron49 Ystwyth50 Rheidol*
18 Teign*$19 Dart*$20 Avon (Devon)*21 Erme*$22 Yealm*$23 Plym*24 Tavy*$25 Tamar*26 Lynher*27 Looe28 Fowey*29 Camel*$30 Torridge*31 Taw*$32 Lyn*33 Severn*
51 Dyfi*52 Dysynni*53 Mawddach*$
& Wnion*54 Artro55 Dwyryd*56 Glaslyn*57 Dwyfach &
Dwyfawr*58 Llyfni59 Gwyrfai$60 Seiont*61 Ogwen*62 Conwy*63 Clwyd*64 Dee*$
65 Mersey66 Ribble*67 Wyre*68 Lune*69 Kent*70 Leven*71 Crake*72 Duddon*73 Esk (Cumbria)*74 Irt*75 Calder*76 Ehen*$77 Derwent*$78 Ellen79 Eden*$80 Esk (Border)*
© Crown copyright and database rights [2018]. Ordnance Survey licence number 100024198.
English river systems Welsh river systems
WALES
ENGLAND
Figure 1. Map of England and Wales showing the main salmon rivers and denoting those with Salmon Action Plans (*) and those designated as Special Areas of Conservation ($) in which salmon must be maintained or restored to favourable conservation status.
Salmon Stocks and Fisheries in England and Wales, 2017
8

2. FISHERY REGULATION MEASURES
Salmon fisheries in England and Wales are primarily regulated by effort controls, which specify the nature of the gear that may be operated, along with where, when and how it may be used. A full description of these controls is provided in the background report; summary details of the current Net Limitation Orders (NLOs) and byelaws related to rod fisheries are provided in this report at Annex 2 and Annex 3, respectively. The following tables summarise some of the other current controls:
• Table 2 provides details of the rod bag limits and catch limits on net and fixed engine fisheries that are currently in force.
• Table 3 summarises the progress in phasing out those net fisheries that exploit predominantly mixed-stocks where our capacity to manage individual stocks is compromised. A policy to phase out such fisheries has been in place since 1996.
• Table 4 provides details of other arrangements to reduce netting effort operating in 2017, principally by agreement to release fish alive or by compensating netsmen not to fish for the periods shown.
• Table 5 provides a summary of the effort restrictions recorded in Table 4 over the available time series, 1993 – present.
In response to the widespread decline in stocks of early-running multi-sea-winter (MSW) salmon, national measures were introduced in 1999 to reduce the levels of exploitation of this stock component. Most netsmen were banned from fishing for salmon before 1 June, with a small number allowed to continue where netting is predominantly for sea trout, on the basis that any salmon caught are returned alive. The national measures also introduced mandatory catch-and-release of salmon by anglers prior to 16 June and imposed other method restrictions. Following review and consultation, the total package of national spring salmon measures was renewed for a further 10 years in December 2008. A brief evaluation of the effect of these measures is included in Section 4.
In response to declining stock status, proposals for further controls on exploitation have been developed in both England and Wales in 2017. These include proposals for closure of many net fisheries (or for requirements to release salmon where a fishery is authorised to continue to operate for sea trout) and for requirements to achieve very high levels of catch-and-release in rod fisheries (including mandatory catch-and-release on rivers with the lowest stock status in England and for all rivers in Wales). These proposals have been subject to public consultation and new measures will be implemented through appropriate legislative provisions. Final proposals (post-consultation) will be subject to approval by the regulatory bodies and government; the aim is to introduce the measures in 2019.
9
Salmon Stocks and Fisheries in England and Wales, 2017

Table 2. Statutory rod bag limits in force for salmon in 2017.
EA Region / NRW
Rod fishery bag limits Net/FE catch limitsRiver Salmon Bag Limits - per Other constraints Fishery Measure
day week seasonNorth East No bag limits applyAnglian No bag limits applySouth East Thames 2South West Taw 2 3 10 No fish > 70 cm to be retained
after 1 AugustTorridge 2 2 7Tavy Tavy seine nets Seasonal catch
limits applyTamar Tamar seine netsMidlands No bag limits apply Severn fixed
enginesSeasonal catch limits apply
Severn lave netsSevern seine nets
North West Ribble 2 Additional voluntary carcass tagging scheme of 1 fish per angler per season
Lune 4Leven 3 Limit applies to catch on whole
river by all anglers; mandatory carcass tagging scheme
Crake 3 Limit applies to catch on whole river by all anglers; mandatory carcass tagging scheme
Derwent 2 No female fish to be retained after 30 Sept. Voluntary 1 fish per day and 5 fish per season limit encouraged by Derwent Owners Association
Eden 2 No female fish to be retained after 9 Sept. Voluntary 1 fish per day and 6 fish per season limits encouraged by River Eden and District Fisheries Association and supported by carcass tagging scheme.
Solway haaf nets and Eden coops
Seasonal catch limits apply. For 2014-2017, salmon catch restricted to 10 salmon per season for haaf nets and 3 salmon per season for coops. No limits on sea trout.
Border Esk 2 No female fish to be retained after 9 Sept.
Wales Taf 2 5 No fish to be retained after 8 Oct.Tywi 2 5 No fish to be retained after 8 Oct.E&W Cleddau 2 5 No fish to be retained after 8 Oct.Nevern 2 5Teifi 2 5Aeron 2 5Ystwyth 2 5Rheidol 2 5
Salmon Stocks and Fisheries in England and Wales, 2017
10

Tab
le 3
. N
um
ber
of
licen
ces
issu
ed e
ach
yea
r in
net
fish
erie
s su
bje
ct t
o p
has
e o
uts
(ze
ro N
LOs)
an
d c
losu
res,
199
2-20
17.
Fish
ery
Pha
se O
uts
Clo
sure
s [a
]
NE Coast drift
NE Coast T/J
Anglian coastal
SW Wales coast wade & seine
R. Ogwen seine
R. Seiont seine
R. Clwyd sling
R. Llyfni seine
R. Dwyfawr seine
R. Usk drift
SW Cumbria drift
R. Lune seine
Taw/Torridge seine
R. Leven lave
R. Tamar seine
R. Lynher seine
R. Tavy seine
R. Dee trammel
R. Dee seine
R. Severn seine
R. Dart seine
R. Duddon seine
S. Caern seine
N. Anglesey seine
Pha
se o
ut c
omm
ence
d19
9320
1219
9619
9719
9719
9719
9719
9719
9719
9719
9820
0020
0220
0320
0420
0420
0420
0520
0520
1420
15Ye
ar19
9214
212
917
22
20
28
41
14 [b
]6
145
44
132
00
1993
124
9311
11
30
28
41
14 [b
]6
145
44
211
00
1994
114
7216
22
20
28
41
14 [b
]6
145
54
180
00
1995
9965
92
12
02
84
114
[b]
614
55
414
00
019
9689
590
21
21
28
41
126
145
44
140
00
1997
8156
12
12
02
84
114
614
55
415
00
019
9875
540
20
0 *
01
84
114
615
55
414
00
019
9972
542
18
11
146
145
44
120
00
2000
7146
10
0 *
11
146
145
44
100
00
2001
7046
01
114
614
54
48
00
020
0269
461
13
*6
145
44
120
00
2003
16 *
451
13
414
54
412
#0
020
0416
40#
##
##
##
01
34
3 *
[b]
1 *
[b]
2 *
[b]
411
##
2005
1639
#1
34
3 [b
]1
[b]
2 [b
]4
1320
0616
361
33
3 [b
]1
[b]
2 [b
]3
*9
*20
0716
351
33
3 [b
]1
[b]
2 [b
]2
*4
*20
0816
331
33
3 [b
]1
[b]
2 [b
]0
*3
*20
0915
300
32
3 [b
]1
[b]
2 [b
]0
*20
1014
303
23
[b]
1 [b
]2
[b]
2011
1426
32
3 [b
]1
[b]
2 [b
]
2012
1463
253
[c]
23
[b]
1 [b
]2
[b]
2013
1356
243
1 [d
]3
[b]
1 [b
]2
[b]
2014
1352
223
23
[e]
01
[e]
120
1512
4920
32
3 [e
]1
[e]
11
2016
1148
183
23
[e]
1 [e
]1
0 *
2017
1147
173
23
[e]
1 [e
]1
Not
e:B
old
text
den
otes
tar
get
reac
hed.
Key
:*
Pha
se o
ut a
ccel
erat
ed b
y fu
ll or
par
tial b
uy-o
ff.
# D
enot
es fi
sher
y cl
osed
by
byel
aw.
[a] F
ishe
ries
have
not
ope
rate
d fo
r a
num
ber
of y
ears
, now
for
mal
ly c
lose
d th
roug
h by
elaw
.[b
] Lic
ence
s is
sued
but
fish
erm
en c
ompe
nsat
ed n
ot t
o fis
h in
the
se y
ears
.[c
] Pha
se o
ut r
epla
ced
by n
ew N
LO in
201
2 pe
rmitt
ing
the
use
of 1
net
.[d
] Pha
se o
ut r
epla
ced
by n
ew N
LO in
201
3 pe
rmitt
ing
the
use
of 2
net
s.[e
] Pha
se o
ut r
emai
ns in
pla
ce, b
ut u
nder
new
NLO
exi
stin
g lic
ense
es a
ble
to r
esum
e fis
hing
fol
low
ing
10-y
ear
buy-
off,
sub
ject
to
catc
h lim
its.
11
Salmon Stocks and Fisheries in England and Wales, 2017

Table 4. Buy off arrangements operating on net fisheries in 2017.
River/ Fishery Method Period without netting (full season in parentheses)
Brokers / Funding agency
Fowey seine nets (all)
complete season (2007 to present) (2 March–31 August)
Brokered by: Environment Agency / South West Water plc
Piddle and Frome (Poole Harbour)
seine nets (all)
All salmon & sea trout caught to be released (2008 to present) (1 June–31 July)
Brokered by:Environment Agency and funded by the Frome and Piddle Association [a]
Notes: Fowey buy-off - fishing from 2 March to 31 May applies to sea trout only. [a] Local arrangements apply in respect of provision of compensation.
Table 5. Summary of buy off arrangements and local agreements operating on net fisheries, 1993-2017. (X denotes compensation measure applied; O denotes fishery closed or no licences issued/available).
Year Fishery
Itch
en s
eine
net
#
Avo
n &
Sto
ur s
eine
net
s $
Pid
dle
& F
rom
e se
ine
net
$
Exe
sei
ne n
ets
Teig
n se
ine
nets
Dar
t se
ine
nets
Tavy
sei
ne n
ets
Tam
ar s
eine
net
s
Lynh
er s
eine
net
s
Fow
ey s
eine
net
s
Cam
el d
rift
nets
Taw
& T
orrid
ge s
eine
net
s
Lyn
fixed
eng
ine
Sev
ern
fixed
eng
ine
Wye
fixe
d en
gine
s
Usk
Drif
t ne
ts
Usk
fixe
d en
gine
s
Tyw
i sei
ne n
ets
Dee
sei
ne n
ets
Dee
tra
mm
el n
ets
Rib
ble
drift
net
s
Leve
n la
ve n
ets
Cum
bria
n co
asta
l drif
t ne
ts
1993 X X1994 X X1995 O X1996 O1997 O X X X X X1998 O X X X X X X X1999 O X X X X X X X2000 O X X X X X X X X X2001 O X X X X X X O X X2002 O X X X X X X X X O X X X2003 O X X X X X X X X O X X2004 O X X X X X X O X X O X X2005 O X X X X X X O O O O X O2006 O X X X X X X X X O O O O X X O2007 O X X X X X X X O O O O X X O2008 O X X X X X X X X O O O O X X X O2009 O X X X X X X X X O O O O X X O O2010 O X X X X X X X X O X O O O X O O O2011 O X X X X X X X X X O X O O O X O O O2012 O O X X X X X X O X O O O X O O O2013 O O X X X X X X O O O O O O O2014 O O X O X O O O O O O X O2015 O O X O X O O O O O O O2016 O O X O X O O O O O O O2017 O O X O X O O O O O O O
Key: # Fishery operated for scientific purposes - all fish released alive in tracking investigation (no compensation agreement).$ Agreement for all salmon caught to be released alive.
Salmon Stocks and Fisheries in England and Wales, 2017
12

3. FISHING EFFORT
The regulatory measures outlined above provide overall limits on the ‘allowable’ fishing effort in England and Wales; this has fallen in recent years as measures have been introduced to regulate exploitation. The amount that both netsmen and anglers actually fish (the ‘utilised’ effort) also varies due to weather conditions, perceptions about the numbers of fish returning, and other factors. The following tables and figures summarise changes in allowable and utilised effort:
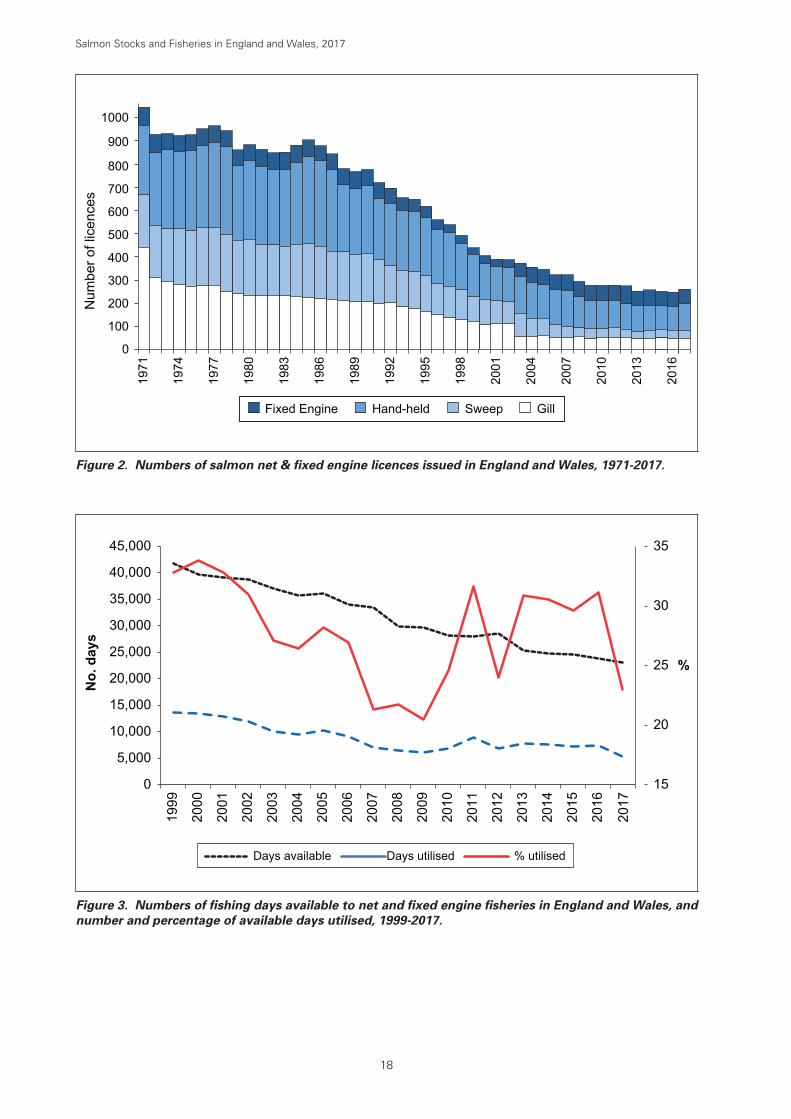
Net fisheries – Table 6 and Figure 2 illustrate the long-term decline in the numbers of licences issued for all types of nets and traps over the period since 1971. The rate of decline in the number of fishing days available, covering a more recent, shorter time period, has been greater over this time as a result of additional effort restrictions on remaining licensees (Figure 3). Table 7 provides details of the allowable and utilised effort in salmon net fisheries for the latest season. The percentage of available days that are utilised varies markedly. Figure 3 also illustrates the overall changes in allowable and utilised effort, and the percentage of available days utilised by netsmen, over the available time series.
Rod fisheries – Numbers of rod licences (annual and short-term) from 1994 are shown in Table 6 and Figure 4. No comparable data are available for earlier years because of changes in licensing arrangements. Regional summaries of the total rod days fished, over available time series, are provided in Table 8 and Figure 5. It should be noted that effort data (days fished) submitted via rod licence returns do not distinguish between times spent fishing separately for salmon and sea trout.
Overview of fishing effort in 2017
There has been a progressive decline in the number of net and fixed engine licences issued, and hence in fishing effort, over the time series. There was a small decrease in the number of licences issued in 2017 compared with 2016 (3 fewer licences issued), with total licence numbers in 2017 the lowest in the time series. The percentage of the available days utilised by netsmen in 2017 was typically below the levels seen in recent years. Utilised effort in 2017 was below that in 2016 in all regions except the Midlands Region (River Severn), where effort remined particularly low. This may be related to the recent introduction of catch limits for the Severn net and fixed engine fishery. As in previous years, there was marked variation between the levels of utilised effort in individual fisheries, ranging from 82-84% (North East coast drift nets) to zero, where licences were available but no fishing for salmon took place. The overall percentage of available days utilised by netsmen declined steadily between 2000 and 2009, from a little over 34% to about 20% (Figure 3). However, percentage utilisation has been higher and more variable since this time, with values increasing to around 25-30% in many years, associated with relatively good catches. This suggests that the take-up of available fishing opportunities is strongly influenced by catch rates. There was a marked downturn in utilised effort in 2017, with the value among the lowest in the time series.
The numbers of salmon rod licences issued over the shorter available time series (1994 on) show variable patterns. The number of short term (one-day and eight-day) rod licences issued has shown a slow decline over the period, from a 5-year mean of about 11,000 licences at the start of the period to a 5-year mean of around 7,800 recently. There has been greater variation in the number of annual licences issued; these account for the majority of the salmon caught by anglers. Annual licence numbers decreased sharply from over 26,000 in 1994 to about 15,000 in 2001. This was thought to reflect the decline in salmon stocks and the introduction of restrictions on angling, especially those to protect early-run MSW fish, although licence sales were particularly low in 2001 due to
13
Salmon Stocks and Fisheries in England and Wales, 2017

the restrictions on access to many rivers as a result of an outbreak of the ‘foot and mouth’ livestock disease. Sales of annual licences increased again after this date, reflecting Environment Agency efforts to promote angling and to reduce levels of licence evasion through targeted enforcement efforts. Licence sales in the period 2009 to 2012 were in excess of 26,000, similar to levels at the start of the time period. Season licence numbers declined again after this, but there was a marked increase in numbers in 2017 due to the introduction of a new free licence for juveniles (under 18s). Over 7,000 of these licences were issued; the data for 2017 remain provisional.
The number of days fished by anglers closely followed the reduction in rod licence numbers over the period 1994 to 2001. However, while annual licence sales then recovered to the levels at the start of the time series, the number of days fished by anglers has not. Provisionally, the overall number of days fished by anglers in 2017 has been estimated at about 140,300, which is 8% below the average of the previous five years. There is some variation in the pattern of fishing effort between regions (Figure 5). For Wales and a number of regions in England (North West, South West and Midlands), the number of days fished has fallen by about a half between the start and end of the time series. In contrast, fishing effort in the North East and Southern Regions has remained relatively consistent.
Salmon Stocks and Fisheries in England and Wales, 2017
14

Table 6. Numbers of rod licences (1994-2017) and net & fixed engine licences (1971-2017).
Year Rod licences Gear Type Total net licencesShort-term Annual Gill Sweep Hand-held FE Combined
drift/T net #1971 437 230 294 79 75 10401972 308 224 315 76 75 9231973 291 230 335 70 75 9261974 280 240 329 69 75 9181975 269 243 341 69 75 9221976 275 247 355 70 75 9471977 273 251 365 71 75 9601978 249 244 376 70 75 9391979 241 225 322 68 75 8561980 233 238 339 69 75 8791981 232 219 336 72 75 8591982 232 221 319 72 75 8441983 232 209 333 73 75 8471984 226 223 354 74 75 8771985 223 232 375 69 75 8991986 220 221 369 64 75 8741987 213 206 352 68 75 8391988 210 212 284 70 75 7761989 208 199 282 75 75 7641990 207 204 292 70 75 7731991 199 187 264 66 75 7161992 203 158 267 65 75 6931993 187 151 259 55 36 6521994 10,637 26,641 177 158 257 53 30 6451995 9,992 24,949 163 156 249 47 29 6151996 12,508 22,773 151 132 232 42 29 5571997 11,640 21,146 139 131 231 35 27 5361998 11,364 21,161 130 129 196 35 26 4901999 10,709 18,423 120 109 178 30 26 4372000 10,916 19,223 110 103 158 32 25 4032001 9,434 14,916 113 99 143 33 24 3882002 10,039 19,368 113 94 147 32 24 3862003 8,683 21,253 58 96 160 57 5 3712004 10,628 22,138 57 75 157 65 5 3542005 10,170 23,870 59 73 148 65 5 3452006 9,460 22,146 52 57 147 65 5 3212007 9,065 23,116 53 45 157 66 5 3212008 9,761 24,139 55 42 130 66 5 2932009 9,353 27,108 50 42 118 66 4 2762010 10,024 26,135 51 41 118 66 4 2762011 10,121 26,870 53 41 117 66 3 2772012 9,045 26,090 51 34 115 73 3 2732013 8,264 25,037 49 29 111 62 3 2512014 7,691 23,914 48 34 109 65 3 2562015 8,017 22,830 52 33 102 63 3 2502016 8,055 22,159 49 34 105 62 2 2502017 7,098 28,064 46 32 112 57 2 247
Notes: Rod short-term licences are for 1 or 8 days; annual licences are valid from the date of issue to 31 March following. Gill nets include: drift, trammel, sling and coracle nets. Sweep nets include: seine (draft and draw) and wade nets. Hand-held nets include: haaf/heave and lave/dip nets. Fixed engines include: T-nets, J-nets, stop (compass) nets, putcher ranks, traps, weirs and cribs (coops). East Anglian coastal nets & Southern seine net are not included, as they are targeted primarily at sea trout and catch few
salmon. Table only includes data for gear licences that are fished (i.e. excluding licences that remain available, but which cannot be
fished due to compensation arrangements or other similar provisions). Data for 2017 are provisional. Free annual licences were introduced for junior anglers in 2017; this accounts for the observed increase in licence numbers.Key: # Combined drift/T net licences (issued in Northumbria (Northern area)) have been included in the gill net totals.
15
Salmon Stocks and Fisheries in England and Wales, 2017

Table 7. Allowable and utilised effort for the principal salmon net fisheries in 2017
EA Region / NRW
River/ Fishery [a] Method No. of licences
NLO [c] Daysavailable
[a,f]
Allowable effort net
days [h]
Utilised effort % days utilised
Av. day/lic.net days net tides
NE N Coastal (N) Drift & T 2 0 113 226N Coastal (N) Drift 8 0 66 528 616 863 82 62N Coastal (N) [b] T 20 0 113 2,260 637 892 28 32N Coastal (S) Drift 0 0 0 0 0 0 0 0N Coastal (S) [b] T 0 0 0 0 0 0 0 0Y Coastal Drift 1 0 66 66 56 78 84 56Y Coastal [b] T or J 27 0 113 3,051 890 1,246 29 33Region total 58 6,131 2,199 3,079 36
SW Avon & Stour Seine 0 0 0 0 0 0 0 0Poole Harbour [g] Seine 1 1 44 44 14 20 32 14Exe Seine 3 3 54 162 86 121 53 29Teign [b] Seine 3 3 99 297 77 108 26 26Dart [b] Seine 0 0 0 0 0 0 0 0Camel Drift 3 6 21 126 14 20 11 5Tavy Seine [i] 1 0 65 65 10 14 15 10Tamar Seine [i] 3 0 65 195 86 120 44 29Lynher Seine 0 0 0 0 0 0 0 0Fowey [b,g] Seine 0 1 131 131 0 0 0 0Taw/Torridge Seine 3 1 53 159 34 47 21 11Region total 17 1,179 321 450 27
Midlands Severn Putchers [d,i] 1 76 76 0 0 0 0Severn Seine [i] 1 0 66 66 19 27 29 19Severn Lave [i] 21 15 66 1,386 84 118 6 4Region total 23 1,528 104 145 7
NW Ribble Drift 4 2 66 264 49 68 18 12Lune Haaf 12 12 66 792 257 360 32 21Lune Drift 7 7 66 462 127 178 28 18Lune Seine 0 0 0 0 0 0 0 0Kent Lave 3 6 66 396 39 54 10 13Leven Lave 2 2 44 88 29 40 32 14Eden & Esk Haaf [i] 66 105 72 7,560 954 1336 13 14Eden & Esk Coops [d,i] 3 66 198 0 0 0 0Region total 97 9,760 1,454 2,036 15
Wales Wye Lave 8 [e] 66 528 260 308 49 33Tywi [b] Seine 3 3 109 327 205 246 63 68Tywi [b] Coracles 8 8 109 872 198 187 23 25Taf Coracles 1 1 44 44 0 0 0 0Taf Wade 1 1 44 44 10 10 23 10E/W Cleddau Compass 6 6 66 396 34 34 9 6Nevern [b] Seine 1 1 109 109 9 11 8 9Teifi [b] Seine 3 3 109 327 37 48 11 12Teifi [b] Coracles 12 12 109 1,308 375 373 29 31Dyfi [b] Seine 3 3 109 327 39 39 12 13Dysynni Seine 1 1 66 66 31 48 47 31Mawddach Seine 2 3 66 198 19 31 10 10Conwy Seine 3 3 66 198 39 46 20 13Conwy Basket [d] 0 0 0 0 0 0 0Dee Trammel 0 0 0 0 0 0 0 0Dee Seine 0 0 0 0 0 0 0 0Wales total 52 4,744 1,256 1,381 26
Key: [a] National spring salmon byelaws apply - all net fisheries closed until June 1. [b] Sea trout fisheries - exempted from national spring salmon byelaws (all salmon caught before 1 June to be released). [c] NLO refers to number of nets allowed under the terms of the net limitation order for that fishery. Where the number of
licences exceeds the NLO, numbers are being reduced as licensees leave the fishery. For coastal mixed stock fisheries a zero NLO means the fishery is being phased out permanently, but for other fisheries the zero limit may only apply for the duration of the NLO.
[d] Denotes fishery operates under an historical certificate of privilege. [e] No NLO, but number of licences capped. [f] In calculating the days available, any day, or part day, on which fishing has been allowed is included. Days available have
been adjusted to take account of partial buy-off arrangements and the national measures. [g] Buy-off applies for all or part season (see Table 4 for details). [h] Allowable effort is calculated by multiplying the days available by the number of nets permitted under the NLO, except
where the number of licences exceeds the NLO, in which case the higher figure is used. [i] Fishery subject to seasonal catch limit.Notes: Effort data incomplete for some licence returns; minor corrections were applied based on catch and effort data for other
licensees fishing in same area and time period. For all regions in England, days fished were calculated from data provided on tides fished, using an average of 1.4 tides per day. For Wales, days fished were as reported.
Salmon Stocks and Fisheries in England and Wales, 2017
16

Table 8. Total number of rod days fished, as reported in catch returns, 1994-2017.
Total days Former Environment Agency Region NRWWales
E&W TotalNE Thames Southern SW Midlands NW
1994 37,937 343 2,446 41,087 13,596 78,176 118,862 292,4471995 38,724 414 2,696 35,853 14,893 65,601 85,107 243,2881996 34,726 154 1,928 32,504 13,056 64,454 84,922 231,7441997 40,345 181 2,332 38,809 14,886 70,222 102,930 269,7051998 38,229 145 2,095 31,285 11,493 64,248 85,906 233,4011999 31,676 311 2,018 25,642 7,024 50,667 70,660 187,9982000 32,319 143 1,771 22,401 5,373 49,255 66,270 177,5322001 27,485 111 2,117 18,573 4,084 23,320 59,163 134,8532002 34,423 91 2,462 25,526 4,720 43,278 72,328 182,8282003 31,030 126 2,663 23,322 5,302 37,567 72,719 172,7292004 37,677 110 2,344 24,730 4,633 48,174 72,846 190,5142005 37,355 86 2,096 22,427 5,221 49,698 69,786 186,6692006 30,441 21 1,602 17,704 4,124 40,782 53,441 148,1152007 33,292 64 1,816 19,979 3,800 40,828 64,694 164,4732008 35,633 53 2,132 20,708 4,211 44,499 63,776 171,0122009 37,366 46 2,046 22,828 4,819 47,509 69,144 183,7582010 42,061 37 2,652 23,279 5,052 51,774 70,201 195,0562011 42,982 22 2,873 24,122 5,105 53,340 68,453 196,8972012 38,349 13 2,284 20,763 3,521 47,352 63,131 175,4132013 38,785 17 2,709 18,497 4,211 46,163 56,634 167,0162014 35,366 55 2,812 16,476 4,198 36,592 49,456 144,9552015 32,892 68 3,022 18,359 4,584 30,573 52,232 141,7302016 33,018 73 2,974 15,573 3,611 30,521 49,586 135,3562017 35,857 160 2,983 17,766 3,851 32,565 47,092 140,274
Mean (2012-16) 35,682 45 2,760 17,934 4,025 38,240 54,208 152,894% change:
2017 on 2016 +9 +135 -1 -3 -16 +7 -10 -12017 on 5-yr mean +0.5 +254 +8 -1 -4 -15 -13 -8
Notes: Includes effort targeted at both salmon and sea trout. Table does not include rod days fished in the Anglian Region, where there are not thought to be any directed rod fisheries. Not all catch returns report effort data. Data for 2017 are provisional.
17
Salmon Stocks and Fisheries in England and Wales, 2017
GillSweepHand-heldFixed Engine
0
100
200
300
400
500
600
700
800
900
1000
1971
1974
1977
1980
1983
1986
1989
1992
1995
1998
2001
2004
2007
2010
2013
2016
Num
ber o
f lic
ence
s
Figure 2. Numbers of salmon net & fixed engine licences issued in England and Wales, 1971-2017.
0
5,000
10,000
15,000
20,000
25,000
40,000
35,000
30,000
45,000
No.
day
s
1999
2000
2001
2002
2003
2004
2005
2006
2007
2008
2009
2010
2016
2017
2015
2014
2013
2012
2011
Days available Days utilised % utilised
15
25
20
30
35
%
Figure 3. Numbers of fishing days available to net and fixed engine fisheries in England and Wales, and number and percentage of available days utilised, 1999-2017.
Salmon Stocks and Fisheries in England and Wales, 2017
18

Short term licences Annual licences Rod days fished
1994
1996
1998
2000
2002
2004
2006
2008
2010
2014
2016
2012
0
50,000
100,000
150,000
200,000
250,000
300,000
350,000
Num
ber o
f rod
day
s fis
hed
0
5,000
10,000
15,000
20,000
25,000
30,000N
umbe
r of l
icen
ces
Figure 4. Numbers of annual and short-term rod licences issued, and the number of rod days fished in England and Wales, 1994-2017.
1994 1996 1998 2000 2002 2004 2006 2008 2010 2012 20162014
120
100
80
60
40
20
0
Num
ber r
od d
ays
fishe
d (th
ousa
nds)
NE Southern SW Midlands Wales NW
Figure 5. Numbers of rod days fished (as reported in catch returns), 1994-2017.
19
Salmon Stocks and Fisheries in England and Wales, 2017

4. DECLARED CATCHES
The chief indicators of the state of salmon stocks are the catches taken by rod and net fisheries. It should be remembered that the data presented here for 2017 are provisional. Final confirmed data for 2017 will be reported in the Environment Agency and Natural Resources Wales annual compilation of catch statistics, which will be available later in the year (see, for example, Environment Agency, 2017).
Assessment of rod catch data in 2015 identified a decrease in the level of catch reporting, which is believed to have been associated with changes to the rod catch reporting system and the introduction of on-line data entry. Similar concerns have also applied to the rod catch data for 2016 and 2017. The majority of tables presented in this report present the catches for these years as they were declared; this is consistent with the annual catch statistics report which also presents declared catches. However, in order to ensure that assessments of stock status use the most complete catch information, additional correction factors to allow for the increased level of under-reporting have been applied to catches for the last three years. The methodology used in this adjustment process, as well as the catch reporting procedures for both net and rod fisheries, are described in the background report. Footnotes to the tables in this report indicate where adjusted data have been used.
Net and rod fisheries – The following tables and figures provide provisional declared catches for 2017 together with confirmed catches for earlier years:
• Table 9 provides the total declared number and weight of salmon caught by nets & fixed engines and by rods in England and Wales since 1988, and provides overall catch totals for England and Wales for both total catch and retained catch (excluding fish that have been caught and released).
• Table 10 gives a regional breakdown of the provisional 2017 rod and net catches (based on the former Environment Agency regions). These data are total catches only and include fish that have been caught and released by both nets and rods.
• Table 11 and Figure 6 provide time series of regional net and fixed engine catches from 1971 on.
• Table 12 and Figure 7 provide time series of regional rod catches from 1993 on, distinguishing fish caught and released from those caught and retained (data on catch-and-release were not recorded prior to 1993).
Catches in coastal, estuary and river fisheries – ICES requests that catch data (fish caught and retained only) are grouped by coastal, estuary and river fisheries. Data for the available time series, since 1988, are presented in Table 13 and Figure 8. Details of the fisheries included in the various categories are provided in the footnotes to the table. The catch for the coastal zone mainly reflects the catch in the north east drift and fixed net fishery. Only two coastal fisheries remained in operation in 2017 and one of these, Anglian, takes very few salmon and none in 2017 (Table 11). The catches in each of the categories have been subjected to downward pressures over recent years, in the case of the coastal and estuarine categories due to the substantial reductions in fishing effort, and, in the case of rod fisheries, due to the increasing use of catch and release.
Salmon Stocks and Fisheries in England and Wales, 2017
20

Catch and release (C&R) – C&R data were first collected in England and Wales in 1993, and the practice has been used increasingly by salmon anglers in recent years. This is largely a result of voluntary measures, but also reflects the national measures to protect spring salmon and the introduction of mandatory C&R on some rivers (details available in Annex 3). As noted above, new proposals have been developed which, if approved, will introduce requirements for enhanced levels of C&R in the future. Regional C&R rates are provided in Table 12 and Figure 7 and a summary for England and Wales as a whole is given in Table 14 and Figure 9. C&R rates for each major salmon river in England and Wales are published in the annual catch statistics.
Long-term catch trends – The annual declared net and fixed engine catch for England and Wales since 1956 is shown in Figure 10; this distinguishes the catch taken in the north east coast fishery from net catches elsewhere. Figure 11 presents the declared rod catch of salmon from 1956, including (since 1993) fish that have been caught and released. It is unclear to what extent fish may be caught and recorded more than once as a result of C&R.
Undeclared and illegal catches – The non-reported and illegal catch for England and Wales in 2017 (only fish retained) is estimated at about 6 tonnes. This represents approximately 11% of the total weight (including the unreported and illegal catch) of salmon caught and killed.
Of the total unreported and illegal catch in 2017 (about 1,600 salmon), 41% by number is estimated to have derived from under-reporting in rod fisheries, 47% from illegal catches and 13% from under-reporting in net fisheries. These estimates exclude the additional under-reporting of rod caught fish that are assumed to have been subject to catch and release. The methodology used to derive these crude estimates is provided in the background report. No other substantial sources of non-catch fishing mortality, such as reports of significant mortalities of fish in rivers / estuaries due to elevated temperatures or water quality issues, were noted in 2017.
Effect of the national spring salmon measures – The restrictions imposed as a result of the national measures, since 1999, have affected both net and rod fisheries. Table 15 and Figures 12a (nets) and 12b (rods) show the reduction in the number of fish caught before June. Table 16 and Figure 13 show the numbers of salmon released by weight category (<3.6 kg (8 lbs), 3.6–6.4 kg, and >6.4 kg (14 lbs)) and season, since 1998. This illustrates that anglers have been voluntarily releasing an increased proportion of all fish caught after June, and large salmon in particular.
Age composition of catches – The annual salmon stock assessments carried out by ICES are conducted on two separate stock components: those fish that mature after one winter at sea (i.e. one-sea-winter fish / 1SW or grilse) and those that mature after two or more years at sea (i.e. multi-sea-winter / MSW fish). The relative proportions of the different sea-age groups have shown marked variability over time (Figure 14), and the different sea-age classes tend to have different patterns of run-timing. It is therefore necessary to be able to estimate the relative proportions of 1SW and MSW fish in catches; details of the approaches used are provided in the background report.
• Nets – The relative proportions of 1SW and MSW fish in regional net catches in 2017 are provided in Table 17 and available time series are presented in Figures 15 and 16. The longer time series for the North East Region reflects the consistent reporting arrangements that have applied in this fishery since the mid-1960s.
21
Salmon Stocks and Fisheries in England and Wales, 2017

• Rods – The estimated age composition of catches for many of the principal salmon rivers in 2017 is provided in Table 18. Of these, 18 rivers (44%) were estimated to contain 50% or more MSW salmon (including fish subsequently released), 20 rivers (49%) had between 25% and 49% MSW salmon and just 3 rivers (7%) less than 25% MSW salmon in the rod catch. Changes in the relative proportions of fish in these different categories (for the same rivers) are presented in Figure 17. There has been a notable increase in the proportion of MSW fish in rod catches in the last 6 years.
The estimated numbers of 1SW and MSW salmon (including fish released), and the percentage of MSW fish, in regional rod catches over the period since 1992 are provided in Table 19; these data have been corrected for under-reporting – a scaling factor of 1.1 has typically applied. However, larger adjustments have been made for the catches since 2015 as noted above (see background report for details). The number and percentage of MSW salmon in regional rod catches are illustrated in Figure 18. A summary of the estimated rod catch of 1SW and MSW salmon for England and Wales as a whole, for the same period, is provided at Figure 19.
Overview of catches in 2017
The total salmon catch for 2017 (including those fish released alive by netsmen and anglers) is provisionally estimated at 101.1 t, representing 23,591 fish, and comprising 40.2 t (10,133 fish) by nets and fixed engines and 59.9 t (13,458 fish) by rods. A total of 253 fish (0.8 t) were released from nets and fixed engines. Of the rod caught fish, 11,174 were released (50.4 t), representing 83% of the catch by number. Thus, 9,880 fish (39.4 t) were retained by netsmen and 2,284 fish (9.5 t) were retained by anglers. These figures do not take account of catches of salmon which go unreported (including those taken illegally), and it is estimated that there may have been a total of 6 t of additional fish caught in 2017.
The total declared catch by nets and fixed engines in 2017 decreased by 50% on the catch recorded in 2016, and was 33% below the average of the previous five years. There has been a marked decline in net catches over the past 15-20 years as a consequence of increased regulatory controls and the phasing out of some fisheries.
The policy to phase out salmon fisheries predominantly exploiting mixed stocks, where the capacity to manage individual river stocks is compromised, has had a major effect on catches. The largest phase out has occurred in the north east coast fishery. This was enhanced by a partial buy out in 2003, which reduced the number of drift net licences from 69 in 2002 to 16 (an immediate reduction of 77%). The ongoing phase out has resulted in the number of drift net licences continuing to fall; this currently stands at 11. The T/J nets have also been subject to a reducing NLO since 2012 with licence numbers falling from 63 in 2012 to 47 currently. Despite this, the north east coast fishery still accounts for the majority of the England and Wales net catch. In the past seven years, the fishery has accounted for between 86% and 93% of the total net catch (90% in 2017).
The provisional estimated rod catch in 2017 (including released fish) increased by 12% on 2016, and was 2% above the average of the previous 5 years. Long-term trends in rod catch (Figure 11) indicate a progressive decline from the peak in the mid-1960’s to the early 2000’s. This was followed by a general improvement in the rod catch between 2004 and 2011, suggesting some degree of reversal in the declining trend, when catches, including fish caught and released, were typically above the long-term average. However, there has been a decline in catches since 2012 and the provisional rod catch for 2017 remains among the lowest in the entire time series. As
Salmon Stocks and Fisheries in England and Wales, 2017
22

noted above, rod catch reporting rates appear to have reduced since 2015 due, in part at least, to changes in the reporting procedures and this will have contributed to the low catches declared over the last three years. Nonetheless, catches corrected for under-reporting (Table 19, Figure 19) remain among the lowest recorded. It should also be noted that rod catch trends on individual rivers have varied from much more severe declines to substantial recoveries. The percentage of rod caught fish released by anglers has increased progressively since such data were first recorded in 1993; it is provisionally estimated that 83% of rod caught fish were released in 2017. It should be noted that rod catches have not been adjusted to account for repeat capture of salmon arising from C&R practices.
Rod catches of 1SW salmon show substantially greater year to year variability than those of MSW fish in numerical terms (Figure 19). Since the early 1990s, catches of 1SW salmon have ranged from a high of over 24,200 to just 5,600. Catches in the period 2004 to 2011 were generally higher than those in the early part of the time series. However, there was a sharp downturn in the 1SW rod catch from 2012 to 2014 that subsequently stabilised at low levels. The provisional corrected catch in 2017 was the fourth lowest in the time series, the lowest being in 2014. In contrast, rod catches of MSW salmon have demonstrated comparatively small numerical changes (range 3,100 to 10,900), and have been trending positively over the period as a whole. Catches of MSW salmon in 2017 were the second highest in the time series, and MSW salmon have comprised over 40% of the estimated total rod catch, on average, over the past seven years, compared with an average of 25% in the preceding period back to 1992. In total, the declared number of salmon retained in catches by rods, nets and fixed engines in 2017 (12,164) was the lowest in the time series, representing 52% of the 23,591 salmon caught.
Assessment of national catch trend
The annual assessment of the status of salmon stocks in the northeast Atlantic carried out by the ICES North Atlantic Salmon Working Group, requires the best available time series of nominal catch data (i.e. fish retained) for each country. Figure 20 provides the current best estimate of the total catches of 1SW and MSW salmon in England and Wales, for the period since 1971. These data have been adjusted to take account of non-reported and illegal catches, and exclude Scottish origin fish taken in the north east coast fishery. Further details on the procedures used in deriving these estimates are provided in the background report.
The data indicate that catches of salmon in England and Wales (fish caught and killed only) have declined by nearly 90% from the early 1970s to the present time. There was a particularly marked decline in catch around 1990, which is consistent with the general perception of a decrease in the marine survival for many stocks around the North Atlantic, and consequently in the abundance of returning fish, at about this time. For much of the period, the decline has been greater in the non-maturing (i.e. potential MSW) fish than for the maturing (i.e. potential 1SW) component. However, there has been a marked increase in the proportion of MSW salmon in the catch in the last seven years (Figure 20) and the overall reduction in catches between the start and end of the time series is now very similar (85%-88%) for both age groups of fish.
23
Salmon Stocks and Fisheries in England and Wales, 2017

Table 9. Declared number and weight of salmon caught by nets & fixed engines and by rods in England and Wales, 1988-2017.
Year Nets & Fixed Engines Rods (inc. released fish) Total caught Total retainedNo. Wt (t) No. Wt (t) No. Wt (t) No. Wt (t)
1988 77,317 271.1 32,846 123.6 110,163 394.8 110,163 394.81989 68,940 239.3 14,728 56.6 83,668 295.9 83,668 295.91990 71,827 277.8 14,849 60.3 86,676 338.1 86,676 338.11991 37,675 144.6 13,974 55.5 51,649 200.1 51,649 200.11992 33,849 130.4 10,737 40.2 44,586 170.5 44,586 170.51993 56,566 202.3 14,059 51.1 70,625 253.4 69,177 248.11994 66,457 241.9 24,891 94.0 91,348 335.9 88,121 323.71995 67,659 245.7 16,008 61.0 83,667 306.7 80,478 294.61996 32,680 125.7 17,444 71.5 50,124 197.2 46,696 183.21997 31,459 107.2 13,047 48.4 44,506 155.6 41,374 141.81998 25,179 84.7 17,109 59.1 42,288 143.9 36,917 122.91999 34,167 124.4 12,505 49.8 46,672 174.2 41,107 150.02000 50,998 182.7 17,596 67.5 68,594 250.2 60,953 218.82001 43,243 153.3 14,383 56.8 57,626 210.1 51,307 184.22002 38,279 133.2 15,282 60.4 53,561 193.6 45,669 161.02003 17,219 69.2 11,519 48.5 28,738 117.7 22,206 89.02004 16,581 59.1 27,332 104.5 43,913 163.6 30,559 111.42005 16,811 60.9 21,418 85.8 38,229 146.7 26,162 96.52006 13,578 50.5 19,509 72.1 33,087 122.6 22,056 79.82007 10,922 37.9 19,984 71.6 30,906 109.5 19,914 67.12008 8,647 30.2 23,512 83.7 32,159 113.9 19,036 63.72009 7,505 29.3 15,563 62.0 23,068 91.3 13,910 54.02010 22,615 72.9 25,153 89.4 47,768 162.3 32,695 108.72011 26,193 101.2 23,199 98.5 49,392 199.7 34,575 135.82012 8,484 31.0 18,450 81.1 26,934 112.1 14,926 58.02013 18,176 67.2 14,920 62.2 33,096 129.4 22,608 84.12014 11,976 45.2 10,307 43.4 22,283 88.6 14,218 54.32015 17,320 60.4 10,263 42.8 27,583 103.1 19,261 67.62016 20,312 76.9 12,068 52.9 32,380 129.8 22,494 85.92017 10,133 40.2 13,458 59.9 23,591 100.1 12,164 49.0
Mean (2012-2016) 15,254 56.1 13,202 56.5 28,455 112.6 18,701 70.0
Note: Data for 2017 are provisional.
Table 10. Provisional regional declared number and weight of salmon caught by nets and rods (including released fish), 2017.
Former EA Region / NRW
Net catch Rod catch Total catchNo. Weight (kg) No. Weight (kg) No. Weight (kg)
North East 9,157 36,359 4,943 24,264 14,100 60,623Anglian 0 0 0 0 0 0Southern 0 0 285 945 285 945South West 246 737 1,603 5,571 1,849 6,307Midlands 42 164 328 1,630 370 1,794North West 424 1,918 3,107 13,281 3,531 15,199Wales 264 1,019 3,192 14,226 3,456 15,245Unknown 0 0 0 0 0 0E&W Total 10,133 40,197 13,458 59,917 23,591 100,113
Note: Rod catch data for 2017 were, in part, derived from a new on-line catch reporting system. Concerns have been raised about the completeness of the resulting data. Declared catches are reported in this table, however, adjusted values have been used for assessment purposes (see Table 19).
Salmon Stocks and Fisheries in England and Wales, 2017
24

Table 11. Declared number of salmon caught by nets and fixed engines, 1971-2017. (N.B. Since 1999, catches include fish that were subsequently released).
Year Environment Agency Region NRWWales
E&WTotalNE Anglian [a] Southern SW Midlands NW
1971 60,353 186 11,827 3,629 4,989 9,008 89,9921972 51,681 317 13,146 4,467 3,941 9,633 83,1851973 62,842 455 12,637 3,887 4,939 9,006 93,7661974 52,756 346 8,709 3,152 6,282 8,883 80,1281975 53,451 384 14,736 3,833 5,251 11,107 88,7621976 15,701 195 11,365 3,194 5,348 7,712 43,5151977 52,888 212 7,566 2,593 5,312 6,492 75,0631978 51,630 163 6,653 2,327 7,321 7,426 75,5201979 43,464 282 7,853 1,404 3,723 4,552 61,2781980 45,780 137 9,303 3,204 3,769 6,880 69,0731981 69,113 233 11,391 4,014 5,048 9,050 98,8491982 50,167 94 6,341 1,738 3,944 4,481 66,7651983 77,277 163 8,718 2,699 8,489 4,834 102,1801984 59,295 157 8,489 3,376 7,957 3,947 83,2211985 57,356 251 9,876 2,423 2,559 3,465 75,9301986 63,425 461 11,548 3,300 6,682 5,031 90,4471987 36,143 505 14,530 2,963 5,052 4,535 63,7281988 50,849 477 11,799 3,511 5,671 5,010 77,3171989 41,453 4 83 10,684 4,364 7,294 5,058 68,9401990 51,530 9 43 5,892 4,397 5,579 4,377 71,8271991 25,429 34 25 2,897 1,747 4,499 3,044 37,6751992 20,144 11 5,521 2,117 3,123 2,927 33,8431993 41,800 4 5,017 950 5,460 3,324 56,5551994 46,554 3 6,437 2,321 6,143 4,995 66,4531995 53,210 5 3,251 2,588 5,566 3,039 67,6591996 18,581 3 5,093 1,608 4,464 2,931 32,6801997 21,922 0 2,466 1,282 3,161 2,628 31,4591998 18,265 3 1,759 1,074 1,778 2,300 25,1791999 26,833 6 1,605 989 2,387 2,347 34,1672000 43,354 0 2,171 973 3,496 1,004 50,9982001 36,115 0 1,794 1,027 3,310 997 43,2432002 30,980 112 1,404 1,190 3,318 1,275 38,2792003 10,435 24 1,444 1,540 2,801 975 17,2192004 11,017 53 1,295 769 2,477 970 16,5812005 8,987 15 572 938 5,178 1,121 16,8112006 7,566 15 477 864 3,977 679 13,5782007 7,091 7 211 676 2,324 613 10,9222008 6,241 9 587 871 981 160 8,8492009 5,395 3 285 883 846 93 7,5052010 19,982 1 506 238 1,665 223 22,6152011 24,214 5 363 171 915 228 25,8962012 7,276 2 258 210 577 106 8,4292013 16,643 2 286 131 877 204 18,1432014 10,800 7 291 177 479 222 11,9762015 15,863 1 402 135 543 188 17,1322016 18,824 0 338 162 742 241 20,3072017 9,157 0 246 42 424 264 10,133
Mean (2012-2016) 13,881 2 315 163 644 192 15,197% change:
2017 on 2016 -51 -27 -74 -43 +10 -502017 on 5-yr mean -34 -22 -74 -34 +37 -33
Note: Data for 2017 are provisional.Key: [a] Returns not required before 1989. It is unusual for salmonids positively identified as salmon to be caught in this sea
trout fishery in any numbers; some reported fish may have been misidentified in some years. Hence, no period means are reported.
25
Salmon Stocks and Fisheries in England and Wales, 2017

Table 12. Declared number of salmon caught by rods and the number and percentage of salmon released, 1993-2017.
Year Environment Agency Region NRWWales
E&W Total #NE Thames Southern SW Midlands NW
Number caught1993 1,696 2 84 2,806 336 5,055 4,080 14,0591994 1,939 11 432 5,213 555 8,840 7,901 24,8911995 2,201 13 302 2,554 442 6,348 4,146 16,0061996 2,514 34 384 2,681 643 5,720 5,468 17,4441997 2,445 2 149 2,372 312 4,144 3,622 13,0471998 2,941 0 366 2,919 186 6,359 4,325 17,1091999 2,670 1 253 1,881 185 4,133 3,369 12,4932000 3,600 0 316 2,487 327 6,814 4,049 17,5962001 3,733 0 405 1,396 273 4,209 4,351 14,3832002 3,967 0 531 1,737 195 5,532 3,312 15,2822003 3,507 0 225 1,266 333 3,547 2,632 11,5192004 6,788 0 609 2,799 319 10,022 6,648 27,3322005 5,933 0 438 1,725 430 8,446 4,408 21,4182006 5,774 0 331 1,802 356 6,771 4,355 19,5092007 4,872 0 466 2,071 280 7,151 5,136 19,9842008 5,634 0 711 2,686 294 8,065 6,122 23,5122009 4,421 0 391 1,648 213 5,532 3,356 15,5632010 7,947 2 590 2,628 235 8,074 5,676 25,1532011 8,373 0 606 2,402 362 6,672 4,784 23,1992012 6,465 0 364 2,022 249 4,609 4,740 18,4502013 6,469 0 271 1,085 332 3,539 3,224 14,9202014 4,269 0 336 799 211 2,530 2,162 10,3072015 2,936 0 451 1,592 469 2,179 2,636 10,2632016 4,460 0 368 1,178 334 2,590 3,137 12,0672017 4,943 0 285 1,603 328 3,107 3,192 13,458
Number released1993 191 1 36 262 17 668 273 1,4481994 322 0 69 745 36 1,253 802 3,2271995 555 7 83 526 32 1,393 593 3,1891996 732 25 88 510 57 1,332 684 3,4281997 797 1 107 586 30 1,131 480 3,1321998 1,037 0 222 1,077 31 2,019 979 5,3711999 1,348 1 137 898 65 1,795 1,203 5,4472000 1,888 0 247 1,152 103 2,816 1,264 7,4702001 1,855 0 397 635 128 1,779 1,347 6,1432002 2,257 0 528 920 73 2,534 1,346 7,6582003 2,265 0 225 746 153 1,859 1,172 6,4252004 3,612 0 609 1,572 174 4,672 2,487 13,2112005 3,426 0 438 1,130 271 4,376 2,310 11,9832006 3,283 0 331 1,342 210 3,450 2,285 10,9592007 2,545 0 466 1,406 145 3,838 2,517 10,9222008 2,831 0 711 1,825 155 4,360 3,153 13,0352009 2,533 0 391 1,080 119 3,236 1,736 9,0962010 4,714 2 587 1,795 133 4,807 2,974 15,0122011 5,232 0 604 1,678 222 3,904 2,766 14,4062012 3,995 0 358 1,454 185 2,774 3,186 11,9522013 4,444 0 266 870 227 2,320 2,331 10,4582014 3,193 0 332 657 166 1,953 1,691 7,9922015 2,114 0 449 1,338 340 1,708 2,164 8,1132016 3,448 0 366 989 260 2,027 2,610 9,7002017 3,952 0 284 1,377 252 2,552 2,757 11,174
Number retained1993 1,505 1 48 2,544 319 4,387 3,807 12,6111994 1,617 11 363 4,468 519 7,587 7,099 21,6641995 1,646 6 219 2,028 410 4,955 3,553 12,817
Salmon Stocks and Fisheries in England and Wales, 2017
26

Table 12. continued
1996 1,782 9 296 2,171 586 4,388 4,784 14,0161997 1,648 1 42 1,786 282 3,013 3,142 9,9151998 1,904 0 144 1,842 155 4,340 3,346 11,7381999 1,322 0 116 983 120 2,338 2,166 7,0462000 1,712 0 69 1,335 224 3,998 2,785 10,1262001 1,878 0 8 761 145 2,430 3,004 8,2402002 1,710 0 3 817 122 2,998 1,966 7,6242003 1,242 0 0 520 180 1,688 1,460 5,0942004 3,176 0 0 1,227 145 5,350 4,161 14,1212005 2,507 0 0 595 159 4,070 2,098 9,4352006 2,491 0 0 460 146 3,321 2,070 8,5502007 2,327 0 0 665 135 3,313 2,619 9,0622008 2,803 0 0 861 139 3,705 2,969 10,4772009 1,888 0 0 568 94 2,296 1,620 6,4672010 3,233 0 3 833 102 3,267 2,702 10,1412011 3,141 0 2 724 140 2,768 2,018 8,7932012 2,470 0 6 568 64 1,835 1,554 6,4982013 2,025 0 5 215 105 1,219 893 4,4622014 1,076 0 4 142 45 577 471 2,3152015 822 0 2 254 129 471 472 2,1502016 1,012 0 2 189 74 563 527 2,3672017 991 0 1 226 76 555 435 2,284
% of fish released1993 11 50 43 9 5 13 7 101994 17 0 16 14 6 14 10 131995 25 54 27 21 7 22 14 201996 29 74 23 19 9 23 13 201997 33 50 72 25 10 27 13 241998 35 61 37 17 32 23 311999 50 100 54 48 35 43 36 442000 52 78 46 31 41 31 422001 50 98 45 47 42 31 432002 57 99 53 37 46 41 502003 65 100 59 46 52 45 562004 53 100 56 55 47 37 482005 58 100 66 63 52 52 562006 57 100 74 59 51 52 562007 52 100 68 52 54 49 552008 50 100 68 53 54 52 552009 57 100 66 56 58 52 582010 59 100 99 68 57 60 52 602011 62 99.7 70 61 59 58 622012 62 98 72 74 60 67 652013 69 98 80 68 66 72 702014 75 99 82 79 77 78 782015 72 100 84 72 78 82 792016 77 99 84 78 78 83 802017 80 100 86 77 82 86 83
Mean total catch - including fish caught & released (2012-2016)
4,920 358 1,335 319 3,089 3,180 13,201
% change:2017 on 2016 +11 -23 +36 -2 +20 +2 +12
2017 on 5-yr mean +0.5 -20 +20 +3 +1 +0.4 +2
Key: # Totals include some fish of unknown region of capture.Notes: Rod catch data since 2015 have, in part, been derived from a new on-line catch reporting system. Concerns have been
raised about the completeness of the resulting data. Declared catches are reported in this table, however, adjusted values have been used for assessment purposes (see Table 19).
Data for 2017 are provisional.
27
Salmon Stocks and Fisheries in England and Wales, 2017

Table 13. Declared weight of salmon caught (retained fish only) and percentage of catch by weight taken in coastal, estuarine and riverine fisheries in England & Wales, 1988-2017.
Year Coastal Estuarine Riverine TotalWt (t) % Wt (t) % Wt (t) % Wt (t)
1988 218.1 55 53.0 13 123.6 31 394.81989 159.3 54 80.0 27 56.6 19 295.91990 212.4 63 65.5 19 60.3 18 338.11991 105.9 53 38.7 19 55.6 28 200.11992 90.7 53 39.6 23 40.2 24 170.51993 158.8 64 43.4 18 45.9 18 248.11994 183.5 57 58.4 18 81.9 25 323.81995 200.3 68 45.4 15 48.9 17 294.61996 83.3 45 42.3 23 57.5 31 183.21997 80.5 57 26.7 19 34.6 24 141.81998 65.2 53 19.4 16 38.2 31 122.91999 101.0 67 23.1 15 26.0 17 150.02000 156.6 72 25.4 12 36.9 17 218.82001 128.6 70 24.2 13 31.3 17 184.22002 107.9 67 24.4 15 28.7 18 161.02003 42.0 47 26.6 30 20.4 23 89.02004 39.2 35 19.4 17 52.8 47 111.42005 32.2 33 28.3 29 36.0 37 96.52006 29.5 37 20.7 26 29.6 37 79.82007 23.9 36 13.4 20 29.8 44 67.12008 21.7 34 8.1 13 34.0 53 63.72009 20.2 37 8.6 16 25.2 47 54.02010 63.8 59 8.8 8 36.2 33 108.72011 93.1 69 6.4 5 36.3 27 135.82012 26.1 45 4.6 8 27.2 47 58.02013 61.5 73 5.6 7 17.0 20 84.12014 40.6 75 4.3 8 9.3 17 54.32015 55.2 82 4.4 6 8.0 12 67.62016 70.7 82 5.6 6 9.7 11 85.92017 36.0 73 3.5 7 9.5 19 49.0
Mean (2012-16) 50.8 73 4.9 7 14.2 20 70.0
Notes: Coastal catches in 2017 from North East coast nets and Anglian coastal nets, but previously included River Parrett putcher rank (last fished 1999), River Usk drift nets (1997) & putcher rank (1999), SW Wales coastal wade (1995) & seine nets (1997), River Ogwen seine nets (2000), River Seiont/Gwyrfai seine nets (1997), River Dwyfawr seine nets (1999), N. Caernarvonshire seine nets (1996), River Clwyd sling (drift) nets (1997) and the SW Cumbria drift nets (2003).
Riverine catches in 2017 from rod catches and River Eden coops; River Conwy basket trap (also operated in freshwater) was last fished in 2002.
Estuarine fisheries include all other nets and fixed engines not mentioned above. Data for 2017 are provisional.
Salmon Stocks and Fisheries in England and Wales, 2017
28

Table 14. Declared number, weight and percentage of salmon released by rods, and declared number and weight of salmon released by nets in England & Wales, 1993-2017.
Year Salmon released by rods Salmon released by netsNumber released Weight (t) % of declared catch Number Weight (t)
1993 1,448 5.26 101994 3,227 12.19 131995 3,189 12.11 201996 3,428 13.99 201997 3,132 13.77 241998 5,371 20.98 311999 5,447 23.87 44 118 0.42000 7,470 30.70 42 171 0.72001 6,143 25.50 43 176 0.42002 7,658 31.80 50 234 0.92003 6,425 28.20 56 107 0.52004 13,211 51.70 48 143 0.52005 11,983 49.80 56 84 0.42006 10,959 42.50 56 72 0.32007 10,922 42.00 55 70 0.32008 13,035 49.80 55 88 0.32009 9,096 37.00 58 62 0.32010 15,012 53.38 60 61 0.22011 14,406 62.40 62 411 1.52012 11,952 53.89 65 56 0.22013 10,458 45.26 70 30 0.12014 7,992 34.19 78 73 0.22015 8,113 34.74 79 209 0.82016 9,700 43.25 80 185 0.62017 11,174 50.38 83 253 0.8
Notes: A proportion of the salmon released by nets are fish caught pre June, which, since 1999, are required to be released. Catch limits now apply on a number of net and fixed engine fisheries necessitating salmon to be released once limits are
reached. A small proportion of the salmon released by nets have previously resulted from an agreement between the Environment
Agency and netsmen fishing the estuary of the River Avon (Hants); this fishery ceased to operate in 2012. There was no requirement for net caught salmon to be released prior to 1999. Rod catch data since 2015 have, in part, been derived from a new on-line catch reporting system. Concerns have
been raised about the completeness of the resulting data. Declared catches are reported in this table, but somewhat underestimate the total catch. Adjusted values have been used for assessment purposes (see Table 19).
Data for 2017 are provisional.
29
Salmon Stocks and Fisheries in England and Wales, 2017

Table 15. Declared number and percentage of salmon caught by nets and rods taken before (<) and from (≥) 1 June, 1989-2017.
Year Net catch (including released fish) Rod catch (including released fish)Number % Number # %
< 1 June ≥ 1 June Total < 1 June < 1 June ≥ 1 June Total < 1 June1989 4,742 64,198 68,940 6.9 3,199 11,529 14,728 21.71990 7,339 64,488 71,827 10.2 2,397 12,290 14,687 16.31991 3,637 34,038 37,675 9.7 2,240 11,496 13,736 16.31992 2,497 31,352 33,849 7.4 1,012 9,725 10,737 9.41993 1,630 54,936 56,566 2.9 865 13,194 14,059 6.21994 4,824 61,633 66,457 7.3 2,609 22,282 24,891 10.51995 4,888 62,771 67,659 7.2 2,141 13,865 16,006 13.41996 2,913 29,767 32,680 8.9 2,691 14,753 17,444 15.41997 1,528 29,931 31,459 4.9 1,335 11,278 12,613 10.61998 832 24,335 25,167 3.3 712 15,275 15,987 4.51999 116 34,043 34,159 0.3 920 11,211 12,131 7.62000 19 50,979 50,998 0.04 760 16,496 17,256 4.42001 47 43,196 43,243 0.11 708 13,675 14,383 4.92002 32 38,247 38,279 0.08 815 14,250 15,065 5.42003 42 17,177 17,219 0.24 1,037 10,373 11,410 9.12004 35 16,546 16,581 0.21 1,168 25,777 26,945 4.32005 29 16,782 16,811 0.17 1,652 19,239 20,891 7.92006 17 13,561 13,578 0.13 1,618 17,891 19,509 8.32007 14 10,908 10,922 0.13 908 18,733 19,641 4.62008 17 8,630 8,647 0.20 1,068 22,444 23,512 4.5
2009 [a] 1 7,504 7,505 0.01 925 14,638 15,563 5.92010 [a] 1 22,614 22,615 0.00 682 23,811 24,493 2.82011 [b] 367 25,826 26,193 1.40 1,255 21,383 22,638 5.52012 59 8,425 8,484 0.70 1,175 17,025 18,200 6.52013 30 18,146 18,176 0.17 1,236 13,541 14,777 8.42014 47 11,417 11,464 0.41 957 9,350 10,307 9.32015 133 17,188 17,321 0.77 1,348 8,843 10,191 13.22016 104 20,203 20,307 0.51 1,173 10,801 11,974 9.82017 172 9,961 10,133 1.70 1,090 12,368 13,458 8.1
Mean (1994-98) 2,997 41,687 44,684 6.7 1,898 15,491 17,388 10.9Mean (1999-17) 67 20,598 20,665 0.3 1,079 15,887 16,965 6.4
Notes: National measures to protect ‘spring’ salmon introduced on April 15 1999 - required compulsory catch and release of all rod caught salmon prior to June 16, and closed most net fisheries prior to June 1. Those net fisheries still allowed to operate before June (mainly targeted at sea trout) are required to release all salmon alive.
Rod catch data since 2015 have, in part, been derived from a new on-line catch reporting system. Concerns have been raised about the completeness of the resulting data. Declared catches are reported in this table, however, adjusted values have been used for assessment purposes (see Table 19).
Data for 2017 are provisional.Key: # Excludes fish for which no capture date recorded. [a] No requirement to record net-released fish on new logbooks, so pre-June catch under-estimated. [b] The increase in the pre-June catch from 2011 reflects the fact that salmon caught and released by T&J nets operating in
the NE Region were not recorded over the period 1999-2010.
Table 16. Declared number of salmon caught by rods, and number and percentage of fish released, by weight category and season, 1998-2017.
Season April to June July to August September to October April to OctoberWt. category (kg) <3.6 3.6–6.4 >6.4 <3.6 3.6–6.4 >6.4 <3.6 3.6–6.4 >6.4 <3.6 3.6–6.4 >6.4
Number caught1998 523 753 111 3782 857 222 5767 2045 562 10,072 3,655 8961999 354 864 262 1283 627 203 3667 2209 879 5,303 3,699 1,3452000 388 771 206 2495 818 240 5813 3111 896 8,695 4,700 1,3422001 205 971 203 1758 1041 200 4290 2536 724 6,253 4,548 1,1272002 377 1014 300 2033 767 173 4434 2728 775 6,844 4,508 1,2472003 282 817 241 885 839 188 2879 2400 862 4,046 4,056 1,2922004 516 832 241 3374 1587 283 11124 6120 1212 15,014 8,539 1,7362005 546 1454 327 2007 1198 169 8048 4941 974 10,601 7,593 1,4702006 567 1505 269 1422 779 110 9176 3593 766 11,165 5,877 1,145
Salmon Stocks and Fisheries in England and Wales, 2017
30

Table 16. continued
2007 565 931 161 2936 1897 233 7876 3445 707 11,377 6,273 1,1012008 719 1,381 215 3,367 2,213 288 8,908 4,028 1,018 12,994 7,622 1,5212009 500 849 172 2,163 1,933 221 4,955 3,096 802 7,618 5,878 1,1952010 441 469 117 3740 1418 215 11284 4986 1099 15,465 6,873 1,4312011 643 1,426 364 2,606 2,777 574 6,831 5,255 1,567 10,080 9,458 2,5052012 597 1,395 512 2,504 2,750 558 4,476 3,762 1,185 7,577 7,907 2,2552013 437 1,200 486 1,644 1,146 228 5,202 3,130 1,006 7,283 5,476 1,7202014 388 879 214 1,296 1,096 184 2,993 2,270 647 4,677 4,245 1,0452015 547 1,236 461 1,826 1,182 292 2,465 1,403 575 4,838 3,821 1,3282016 614 1,184 574 1,996 1,527 580 2,534 1,715 1,101 5,144 4,426 2,2552017 572 1,223 464 2,091 1,662 596 2,697 2,501 1,312 5,360 5,386 2,372
Number released1998 136 113 20 643 197 40 2,076 900 253 2,855 1,210 3131999 209 570 194 295 163 61 1,430 994 466 1,934 1,727 7212000 221 532 148 499 229 72 2,325 1,431 502 3,045 2,192 7222001 119 602 138 422 302 52 1,673 1,141 420 2,214 2,045 6102002 241 659 213 488 207 57 2,084 1,473 488 2,813 2,339 7582003 214 629 193 239 235 64 1,382 1,392 595 1,835 2,256 8522004 283 576 143 1074 501 116 5,154 2,962 707 6,511 4,039 9662005 464 1105 265 715 439 67 4,240 2,661 598 5,419 4,205 9302006 499 1234 239 583 304 54 4,496 2,048 498 5,578 3,586 7912007 436 666 142 1181 726 109 4,253 1,981 448 5,870 3,373 6992008 507 948 170 1547 874 116 4,827 2,307 622 6,881 4,129 9082009 378 630 148 957 743 104 2,925 1,963 549 4,260 3,336 8012010 339 367 104 1743 604 107 6751 3141 802 8,833 4,112 1,0132011 481 1,038 298 1,380 1,289 301 4,242 3,351 1,092 6,102 5,678 1,6912012 449 1,046 443 1,391 1,371 334 2,960 2,502 871 4,800 4,919 1,6482013 367 996 456 874 619 137 3,553 2,292 794 4,794 3,907 1,3872014 345 768 204 830 649 112 2,406 1,823 553 3,581 3,240 8692015 486 1,140 440 1,280 745 215 1,876 1,170 512 3,642 3,055 1,1672016 522 1,040 528 1,424 1,009 409 2,081 1,468 983 4,027 3,517 1,9202017 504 1,096 434 1,546 1,134 433 2,336 2,179 1,189 4,386 4,409 2,056
Percentage (%) released1998 26 15 18 17 23 18 36 44 45 28 33 351999 59 66 74 23 26 30 39 45 53 36 47 542000 57 69 72 20 28 30 40 46 56 35 47 542001 58 62 68 24 29 26 39 45 58 35 45 542002 64 65 71 24 27 33 47 54 63 41 52 612003 76 77 80 27 28 34 48 58 69 45 56 662004 55 69 59 32 32 41 46 48 58 43 47 562005 85 76 81 36 37 40 53 54 61 51 55 632006 88 82 89 41 39 49 49 57 65 50 61 692007 77 72 88 40 38 47 54 58 63 52 54 632008 71 69 79 46 39 40 54 57 61 53 54 602009 76 74 86 44 38 47 59 63 68 56 57 672010 77 78 89 47 43 50 60 63 73 57 60 712011 75 73 82 53 46 52 62 64 70 61 60 682012 75 75 87 56 50 60 66 67 74 63 62 732013 84 83 94 53 54 60 68 73 79 66 71 812014 89 87 95 64 59 61 80 80 85 77 76 832015 89 92 95 70 63 74 76 83 89 75 80 882016 85 88 92 71 66 71 82 86 89 78 79 852017 88 90 94 74 68 73 87 87 91 82 82 87
Notes: 1998 Pre national byelaw. 1999 National byelaw requiring compulsory catch and release before 16 June introduced on 15 April. 2000 First full year of national catch and release byelaw. Analysis based on representative sample of catch return data; totals differ from the declared catches (Table 10). Rod catch data since 2015 have, in part, been derived from a new on-line catch reporting system. Concerns have been
raised about the completeness of the resulting data. Declared catches are reported in this table, however, adjusted values have been used for assessment purposes (see Table 19).
Data for 2017 are provisional.
31
Salmon Stocks and Fisheries in England and Wales, 2017

Table 17. Provisional declared number and percentage of small (<3.6kg) and large (>3.6kg) salmon caught by net fisheries in England & Wales, 2017.
EA Region/NRW Small salmon (1SW) Large salmon (MSW) Total(<3.6 kg) % (>3.6 kg) %
North East 3,383 37 5,687 63 9,070South West 159 67 78 33 237Midlands 1 5 21 95 22North West 87 21 323 79 410Wales 107 41 157 59 264Total 3,737 37 6,266 63 10,003
Note: Weight split based primarily on retained fish, so total differs from that provided in Table 10.
Table 18. Provisional declared number and percentage of 1SW (grilse) and MSW salmon caught by selected rod fisheries (including fish caught and released), 2017.
EA Region / NRW River No. 1SW % No. MSW %NE Coquet 207 61 135 39
Tyne 922 28 2407 72Wear 409 46 471 54
Southern Itchen 109 69 50 31Test 77 62 47 38
SW Hants Avon 53 38 86 62Frome 43 54 36 46Exe 127 79 33 21Teign 35 78 10 22Dart 14 56 11 44Tavy 27 56 21 44Tamar 211 61 136 39Lynher 92 75 31 25Fowey 121 72 47 28Camel 45 52 41 48Taw 100 42 137 58Torridge 30 43 39 57Lyn 27 66 14 34
Midlands Severn 73 22 254 78NW Ribble 333 47 372 53
Lune 209 46 248 54Kent 90 62 55 38Leven 20 57 15 43Irt 34 76 11 24Ehen 124 62 76 38Derwent 133 40 202 60Eden 182 29 437 71Border Esk 135 36 235 64
Wales Wye 202 25 597 75Usk 241 32 512 68Ogmore 12 67 6 33Tywi 133 40 201 60Tawe 22 46 26 54Taf 28 70 12 30E & W Cleddau 28 62 17 38Teifi 102 44 128 56Dyfi 36 54 31 46Mawddach 21 36 38 64Ogwen 45 61 29 39Conwy 87 59 60 41Dee 122 30 287 70
E&W Total 5,061 40 7,601 60
Note: Data only included for fish for which weight data provided on catch return and do not include all rivers; these data therefore differ from the total reported catch (Table 10).
Salmon Stocks and Fisheries in England and Wales, 2017
32

Table 19. Estimated number of 1SW and MSW salmon (corrected for under-reporting) and the percentage composition of MSW salmon caught by rods (including fish caught and released), 1992-2017.
Year Environment Agency Region NRWWales
E&WTotalNE Southern SW Midlands NW
1SW MSW 1SW MSW 1SW MSW 1SW MSW 1SW MSW 1SW MSW 1SW MSW1992 1,085 723 235 29 3,186 476 112 175 4,029 945 2,282 1,074 10,927 3,4221993 966 729 465 82 3,216 706 145 192 5,245 999 4,788 1,197 14,825 3,9051994 1,173 660 277 156 4,172 1,043 217 339 7,162 1,680 5,609 2,291 18,611 6,1691995 1,270 1,082 218 65 1,914 860 71 402 5,380 1,102 2,769 1,491 11,622 5,0021996 1,246 1,405 262 97 1,674 1,116 90 603 4,620 1,228 3,431 2,287 11,322 6,7361997 1,325 1,084 120 30 1,932 483 54 266 3,780 667 2,382 1,021 9,593 3,5511998 2,226 909 378 24 2,543 501 66 131 5,975 699 3,548 843 14,736 3,1071999 1,586 1,351 206 72 1,386 683 70 132 3,589 955 2,278 1,175 9,115 4,3682000 2,188 1,618 292 56 2,270 441 200 139 6,507 807 3,196 816 14,653 3,8772001 2,628 1,478 344 61 1,275 261 90 210 3,936 694 3,638 1,149 11,911 3,8532002 2,924 1,440 520 64 1,452 459 92 123 5,233 852 2,550 1,093 12,771 4,0312003 2,353 1,505 151 74 947 446 117 249 3,121 780 1,766 1,129 8,455 4,1832004 5,222 2,245 528 81 2,633 446 123 228 9,790 1,234 5,927 1,386 24,223 5,6202005 5,481 2,088 306 132 1,404 494 151 322 7,804 1,487 3,588 1,261 18,734 5,7842006 4,637 1,715 256 76 1,388 595 145 247 5,810 1,639 3,593 1,198 15,829 5,4702007 3,798 1,431 382 84 1,615 656 171 136 6,725 1,029 4,110 1,267 16,801 4,6032008 4,651 1,547 633 78 2,245 710 106 217 7,724 1,147 5,387 1,347 20,746 5,0462009 3,686 1,346 157 95 1,326 477 74 157 4,686 1,346 2,323 1,163 12,252 4,5842010 6,119 2,623 498 88 2,486 335 106 153 7,194 1,687 5,027 1,103 21,430 5,9892011 4,422 4,788 420 183 1,882 760 105 293 4,564 2,775 3,066 2,126 14,460 10,9252012 3,528 3,584 273 128 1,219 1,005 68 206 2,877 2,193 2,198 3,016 10,162 10,1322013 3,978 3,138 140 158 778 416 76 289 2,790 1,103 1,828 1,719 9,590 6,8222014 2,153 2,200 256 100 463 339 48 161 1,738 901 953 1,197 5,610 4,8972015 2,074 1,919 326 287 1,232 933 136 502 1,323 1,641 1,414 2,171 6,505 7,4532016 2,285 3,602 263 223 881 674 78 363 1,614 1,805 1,439 2,702 6,560 9,3692017 2,118 4,209 239 126 1,219 833 95 325 1,764 2,213 1,505 2,581 6,940 10,287
Mean (2012-2016) 2,804 2,888 251 179 915 673 81 304 2,068 1,528 1,566 2,161 7,686 7,734% change:
2017 on 2016 -7 +17 -9 -44 +38 +24 +22 -10 +9 +23 +5 -4 +6 +102017 on 5-year mean -24 +46 -5 -30 +33 +24 +17 +7 -15 +45 -4 +19 -10 +33Percentage MSW
Year Environment Agency Region NRWWales
E&WTotalNE Southern SW Midlands NW
1992 40 11 13 61 19 32 241993 43 15 18 57 16 20 211994 36 36 20 61 19 29 251995 46 23 31 85 17 35 301996 53 27 40 87 21 40 371997 45 20 20 83 15 30 271998 29 6 16 66 10 19 171999 46 26 33 65 21 34 322000 43 16 16 41 11 20 212001 36 15 17 70 15 24 242002 33 11 24 57 14 30 242003 39 33 32 68 20 39 332004 30 13 14 65 11 19 192005 28 30 26 68 16 26 242006 27 23 30 63 22 25 262007 27 18 29 44 13 24 222008 25 11 24 67 13 20 202009 27 38 26 68 22 33 272010 30 15 12 59 19 18 222011 52 30 29 74 38 41 432012 50 32 45 75 43 58 502013 44 53 35 79 28 48 422014 51 28 42 77 34 56 472015 48 47 43 79 55 61 532016 61 46 43 82 53 65 592017 67 35 41 77 56 63 60
Mean (2012-2016) 51 42 42 79 42 58 50
Note: Data for 2017 are provisional. Rod catch data since 2015 have, in part, been derived from a new on-line catch reporting system. Concerns have been
raised about the completeness of the resulting data. Correction factors have therefore been applied to the catches reported in this table to provide the best estimate of the total catch in each former region. The methodology applied to correct for under-reporting is outlined in the background report.
33
Salmon Stocks and Fisheries in England and Wales, 2017

North East
0
20,000
40,000
60,000
80,000
1971
2017
South West
0
3,000
6,000
9,000
12,000
15,000
1971
2017
Wales
0
3,000
6,000
9,000
12,000
1971
2017
Midlands
0
1,000
2,000
3,000
4,000
5,000
1971
2017
Southern
0
100
200
300
400
600
500
1971
2017
North West
0
3,000
6,000
9,000
1971
2017
Figure 6. Declared number of salmon caught by nets and fixed engines, 1971-2017. (Note: y-axes not to same scale.)
Salmon Stocks and Fisheries in England and Wales, 2017
34

Midlands
0
100
200
300
400
500
600
700
1993
2017
Wales
0
1,000
2,000
3,000
4,000
5,000
6,000
7,000
8,000
1993
2017
North West
0
2,000
4,000
6,000
8,000
10,000
1993
2017
North East
0
1,000
2,000
3,000
4,000
5,000
6,000
8,000
9,000
7,000
1993
2017
Southern
0
100
200
300
400
500
600
700
800
1993
2017
South West
0
1,000
2,000
3,000
4,000
5,000
6,000
1993
2017
Figure 7. Declared number of salmon caught by rods and the number of salmon released, 1993-2017. The histograms display the total declared catch, with the blue shaded area denoting fish caught and released. (Note: y-axes not to same scale.)
35
Salmon Stocks and Fisheries in England and Wales, 2017

1988
1990
1992
1994
1996
1998
2000
2002
2004
2006
2008
2010
2014
2016
2012
0%
20%
40%
60%
80%
100%%
of t
otal
cat
ch
Coast Estuary River
Figure 8. Percentage (by weight) of the declared total catch of salmon (caught and retained only) taken in coastal, estuarine and riverine fisheries, 1988-2017.
1993
1995
1997
1999
2001
2003
2005
2007
2009
2016
2014
2011
16,000
14,000
60
100
8090
70
Number released % released
50403020100
12,000
10,000
8,000
6,000
4,000
2,000
0
Num
ber r
elea
sed
% re
leas
ed
Figure 9. The number and percentage of the declared salmon catch released by anglers, 1993-2017.
Salmon Stocks and Fisheries in England and Wales, 2017
36

0
20,000
40,000
60,000
80,000
No.
sal
mon
100,000
120,000
140,000
%
100
90
80
70
60
50
40
30
20
10
0
NE Coast (drift & T/J) E & W excluding NEC long-term average % catch in NE fishery
1956
1958
1960
1962
1964
1966
1968
1970
1972
1974
1976
1978
1980
1982
1984
1986
1988
1990
1992
1994
1996
1998
2000
2002
2004
2006
2008
2010
2012
2014
2016
Figure 10. Declared number of salmon caught by nets and fixed engines in England & Wales and the percentage of the catch taken in the north east coast fishery, 1956-2017.
0
5,000
10,000
15,000
20,000
25,000
30,000
35,000
40,000
No.
sal
mon
1956
19
58
1960
19
62
1964
19
66
1968
19
70
1972
19
74
1976
19
78
1980
19
82
1984
19
86
1988
19
90
1992
19
94
1996
19
98
2000
20
02
2004
20
06
2008
20
10
2012
2016
20
14
Released Caught and retained long-term average
Figure 11. Declared number of salmon caught by rods in England & Wales, 1956-2017.
37
Salmon Stocks and Fisheries in England and Wales, 2017

0
5
10
15
20
25
% o
f tot
al c
atch
0
500
1,000
1,500
2,000
2,500
3,000
3,500
Num
ber s
alm
on c
augh
t < 1
Jun
e
0
2
4
6
8
10
12
0
1,000
2,000
3,000
4,000
5,000
6,000
7,000
8,000
1989
1991
1993
1995
1997
1999
2001
2003
2005
2007
2009
2011
2013
2015
2017
1989
1991
1993
1995
1997
1999
2001
2003
2005
2007
2009
2011
2013
2015
2017
% o
f tot
al c
atch
Num
ber s
alm
on c
augh
t < 1
Jun
e (a) Nets (b) Rods
Number % Number %
Figure 12. Declared number and percentage of salmon caught by (a) nets and (b) rods before 1 June, 1989-2017.
20
40
60
80
100
1998 2000 2002 2004 2006 2008 2010 2012 2014 2016
<3.6 kg
3.6 – 6.4kg
>6.4kg
% fi
sh re
leas
ed
Figure 13. Percentage of rod caught fish released by anglers by weight category, 1998-2017.
Salmon Stocks and Fisheries in England and Wales, 2017
38

2SW fish 1SW fish 3SW fish 4SW fish Previous spawners 1SW fish 2SW fish 3SW fish Previous spawners
1SW fish 2SW fish 3SW fish Previous spawners 1SW fish 2SW fish 3SW fish Previous spawners
0%
20%
40%
60%
80%
100% Se
a ag
e co
mpo
sitio
n
Adult return year
0%
20%
40%
60%
80%
100%
Sea
age
com
posi
tion
Adult return year
Tamar
0%
20%
40%
60%
80%
100%
1960
1970
1980
1990
2000
2010
1965
1975
1985
1995
2005
2016
1960
1970
1980
1990
2000
2010
1965
1975
1985
1995
2005
2016
1960
1970
1980
1990
2000
2010
1965
1975
1985
1995
2005
2016
1960
1965
1970
1975
1980
1985
1990
1995
2000
2010
2005
2016
Sea
age
com
posi
tion
Adult return year
Lune
0%
20%
40%
60%
80%
100%
Sea
age
com
posi
tion
Adult return year
Tyne
Dee
Figure 14. Variation in the proportions of 1SW and older salmon returning to the Rivers Dee, Tamar, Lune and Tyne over available time series.
39
Salmon Stocks and Fisheries in England and Wales, 2017

1999
2000
2001
2002
2003
2004
2005
2006
2007
2008
2009
2016
2015
2017
2014
2013
2012
2011
2010
0
10
20
30
40
50
60
70
80
100
90
% o
f sal
mon
>8l
b (3
.6kg
) in
catc
h
SW Midlands Wales NW Total excluding NE
Figure 15. Estimated percentage (%) of salmon >8lb (3.6 kg) caught in net and fixed engine fisheries (excluding NE Region), 1999-2017.
0
10
20
30
40
50
60
70
1965
1968
1971
1974
1977
1980
1983
1986
1989
1992
1995
1998
2001
2004
2007
2010
2013
2016
% o
f sal
mon
>8l
b (3
.6kg
) in
catc
h
Figure 16. Estimated percentage (%) of salmon >8lb (3.6 kg) caught in the north east coast net fishery (as declared by netsmen), 1965-2017.
Salmon Stocks and Fisheries in England and Wales, 2017
40

1997
1998
1999
2000
2001
2002
2003
2004
2005
2006
2007
2008
2009
2014
2016
2015
2017
2013
2012
2011
2010
100%
80%
60%
40%
20%
0%
<=24% 25-49% >=50%
Figure 17. Estimated percentage of selected principal salmon rivers with ≥ 50%, 25-49% and ≤ 24% of MSW salmon in the declared rod catch, 1997-2017.
41
Salmon Stocks and Fisheries in England and Wales, 2017

0
20
40
60
80
100%
0
500
1,000
1,500
2,500
3,000
2,000
North West 19
92
2017
0
20
40
60
80
100%
0
500
1,000
1,500
2,000
5,000
4,000
3,000
2,500
4,500
3,500
1992
2017
North East
0
20
40
60
80
100%
0
500
1,000
1,500
2,000
3,500
3,000
2,500
1992
2017
Wales
0
250
500
750
1992
2017
Midlands
0
20
40
60
80
100%
0
500
1,000
1,500South West
1992
2017
0
20
40
60
80
100%
0
50
100
150
300
200
250
1992
2017
0
20
40
60
80
100%Southern
Figure 18. Estimated number (histogram) and percentage (solid line) of MSW salmon caught by rods, 1992 to 2017.
Salmon Stocks and Fisheries in England and Wales, 2017
42
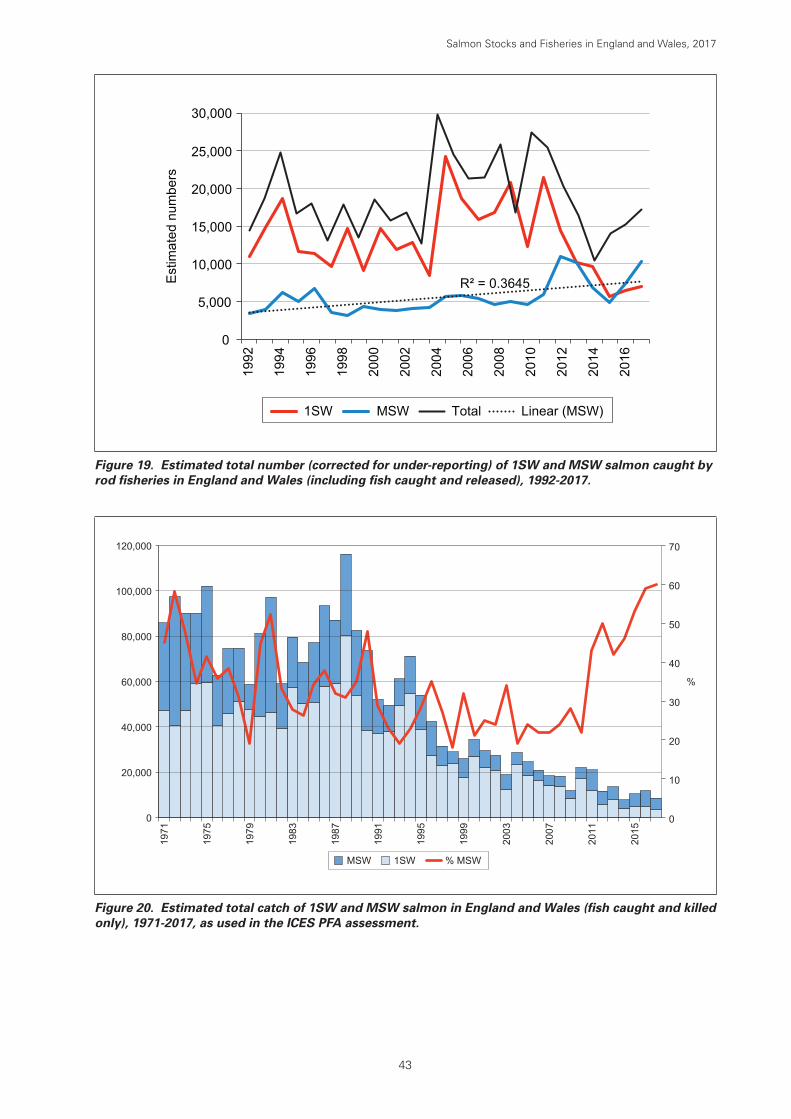
0
5,000
10,000
15,000
20,000
25,000
30,000
1992
1994
1996
1998
2000
2002
2004
2006
2008
2010
2016
2014
2012
Est
imat
ed n
umbe
rs
1SW MSW Total Linear (MSW)
R² = 0.3645
Figure 19. Estimated total number (corrected for under-reporting) of 1SW and MSW salmon caught by rod fisheries in England and Wales (including fish caught and released), 1992-2017.
0
20,000
40,000
60,000
80,000
100,000
120,000
1971
1975
1979
1983
1987
1991
1995
1999
2003
2007
2011
2015
MSW 1SW % MSW
0
10
20
30
40
50
60
70
%
Figure 20. Estimated total catch of 1SW and MSW salmon in England and Wales (fish caught and killed only), 1971-2017, as used in the ICES PFA assessment.
43
Salmon Stocks and Fisheries in England and Wales, 2017

5. CATCH PER UNIT EFFORT (CPUE)
Since catch levels are influenced strongly by the level of fishing effort, catch per unit effort (CPUE) data are commonly used as well as the declared catch in order to help evaluate the status of stocks. However, the relationship between CPUE and abundance can be influenced by confounding factors in both rod and net fisheries. It should also be remembered that net and rod fisheries operate sequentially (the net fisheries exploit the returning fish first), and over different time periods (fishing seasons). Rod fisheries are active over a longer period and typically extend into the early autumn after net fisheries have ceased to fish. Thus, changes in patterns of run-timing may also impact on CPUE values in the different fisheries.
• Nets – Regional CPUE data for net fisheries for the period since 1997 are presented in Table 20. These data are based on the number of tides fished by netsmen, except in the North East Region where the number of days fished is used. In order to provide comparable time series, the data only include fishing gears that have operated in a consistent manner over the full period. Plots of the standardised CPUE Z-scores for the various regions and for net fisheries overall (expressed as a 2-year moving average) are provided in Figure 21.
• Rods – Regional CPUE data for rod fisheries for the period since 1997 (expressed as the number of salmon caught per 100 days fished) are presented in Table 21. Plots of the standardised CPUE Z-scores for the various regional rod fisheries and the overall rod CPUE for England and Wales are provided in Figure 22 for the same period. Individual CPUE data for all the major salmon rivers in England and Wales are reported in the annual catch statistics reports (e.g. Environment Agency, 2017). The trends in rod CPUE for the different regions show a reasonable degree of coherence and available evidence from selected rivers where we have estimates of returning stock size, as well as CPUE, suggests rod CPUE values provide a reasonable indicator of stock abundance (Figure 23).
Overview of CPUE in 2017
The overall catch per unit effort (CPUE) for nets and fixed engines in 2017 decreased on that in 2016, and was 19% below the previous 5-year mean (2012-2016). CPUE in 2017 was above the 5-year average in Wales, but below the 5-year mean elsewhere (Table 20). Normalised CPUE values (Z-scores) for the various former regions and an overall average (Figure 21) indicate that CPUE, and by inference abundance, peaked during the period 2000-02, then declined steadily until 2009 (which had the lowest CPUE of the time series), before increasing again between 2010 and 2011. Since that time overall CPUE has oscillated; in 2017 it was below the long-term average of the time series. An earlier analysis of net CPUE and river flow suggests above average flows in July (when a high proportion of the net catch typically occurs) tend to result in reduced CPUE values.
Rod CPUE in 2017 increased on 2016 in the South West, North West and Wales. For all regions, except Southern, rod CPUE was equal to or above the 5-year average (Table 21). In the North East Region, rod CPUE in 2017 was slightly above (2%) the 5-year average. Normalised CPUE values (Z-scores) for rod fisheries (Figure 22) indicate a largely positive trend between 1997 and 2012, and by inference increasing abundance (Figure 23). However, overall CPUE decreased from 2013 to 2015 followed by an increase thereafter. Overall CPUE in 2017 was slightly above the long-term average of the time series.
Salmon Stocks and Fisheries in England and Wales, 2017
44
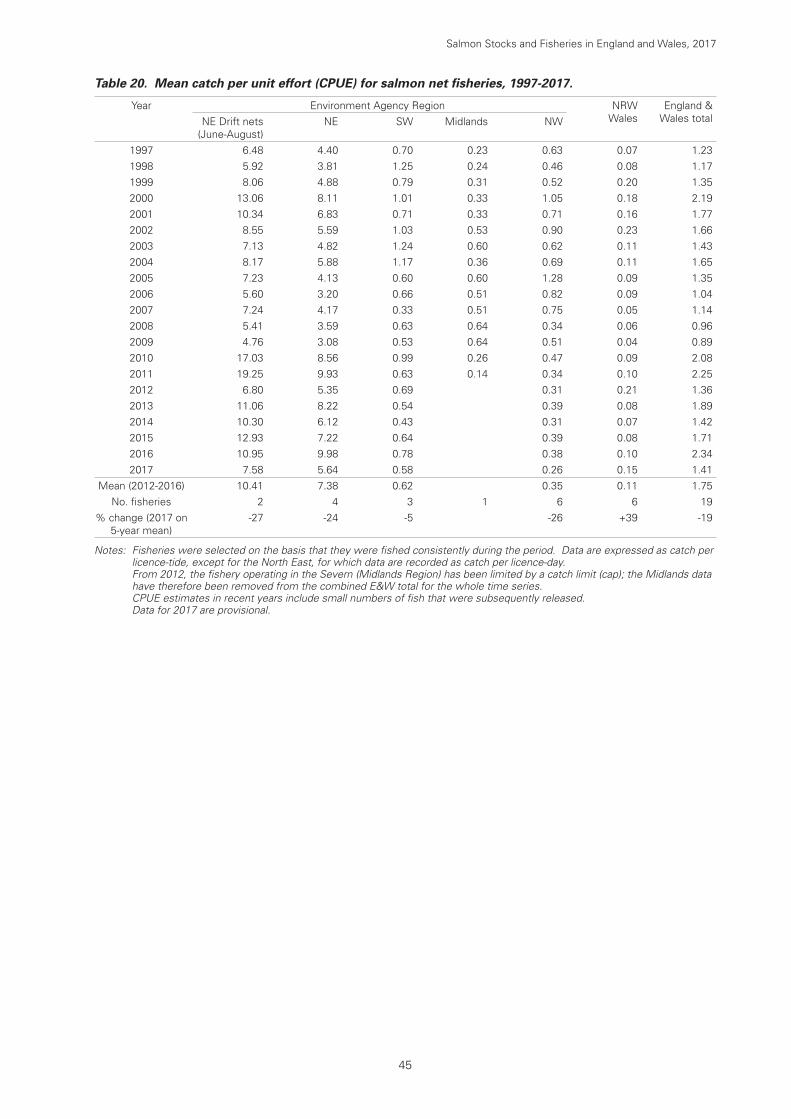
Table 20. Mean catch per unit effort (CPUE) for salmon net fisheries, 1997-2017.
Year Environment Agency Region NRWWales
England & Wales totalNE Drift nets
(June-August)NE SW Midlands NW
1997 6.48 4.40 0.70 0.23 0.63 0.07 1.231998 5.92 3.81 1.25 0.24 0.46 0.08 1.171999 8.06 4.88 0.79 0.31 0.52 0.20 1.352000 13.06 8.11 1.01 0.33 1.05 0.18 2.192001 10.34 6.83 0.71 0.33 0.71 0.16 1.772002 8.55 5.59 1.03 0.53 0.90 0.23 1.662003 7.13 4.82 1.24 0.60 0.62 0.11 1.432004 8.17 5.88 1.17 0.36 0.69 0.11 1.652005 7.23 4.13 0.60 0.60 1.28 0.09 1.352006 5.60 3.20 0.66 0.51 0.82 0.09 1.042007 7.24 4.17 0.33 0.51 0.75 0.05 1.142008 5.41 3.59 0.63 0.64 0.34 0.06 0.962009 4.76 3.08 0.53 0.64 0.51 0.04 0.892010 17.03 8.56 0.99 0.26 0.47 0.09 2.082011 19.25 9.93 0.63 0.14 0.34 0.10 2.252012 6.80 5.35 0.69 0.31 0.21 1.362013 11.06 8.22 0.54 0.39 0.08 1.892014 10.30 6.12 0.43 0.31 0.07 1.422015 12.93 7.22 0.64 0.39 0.08 1.712016 10.95 9.98 0.78 0.38 0.10 2.342017 7.58 5.64 0.58 0.26 0.15 1.41
Mean (2012-2016) 10.41 7.38 0.62 0.35 0.11 1.75No. fisheries 2 4 3 1 6 6 19
% change (2017 on 5-year mean)
-27 -24 -5 -26 +39 -19
Notes: Fisheries were selected on the basis that they were fished consistently during the period. Data are expressed as catch per licence-tide, except for the North East, for which data are recorded as catch per licence-day.
From 2012, the fishery operating in the Severn (Midlands Region) has been limited by a catch limit (cap); the Midlands data have therefore been removed from the combined E&W total for the whole time series.
CPUE estimates in recent years include small numbers of fish that were subsequently released. Data for 2017 are provisional.
45
Salmon Stocks and Fisheries in England and Wales, 2017
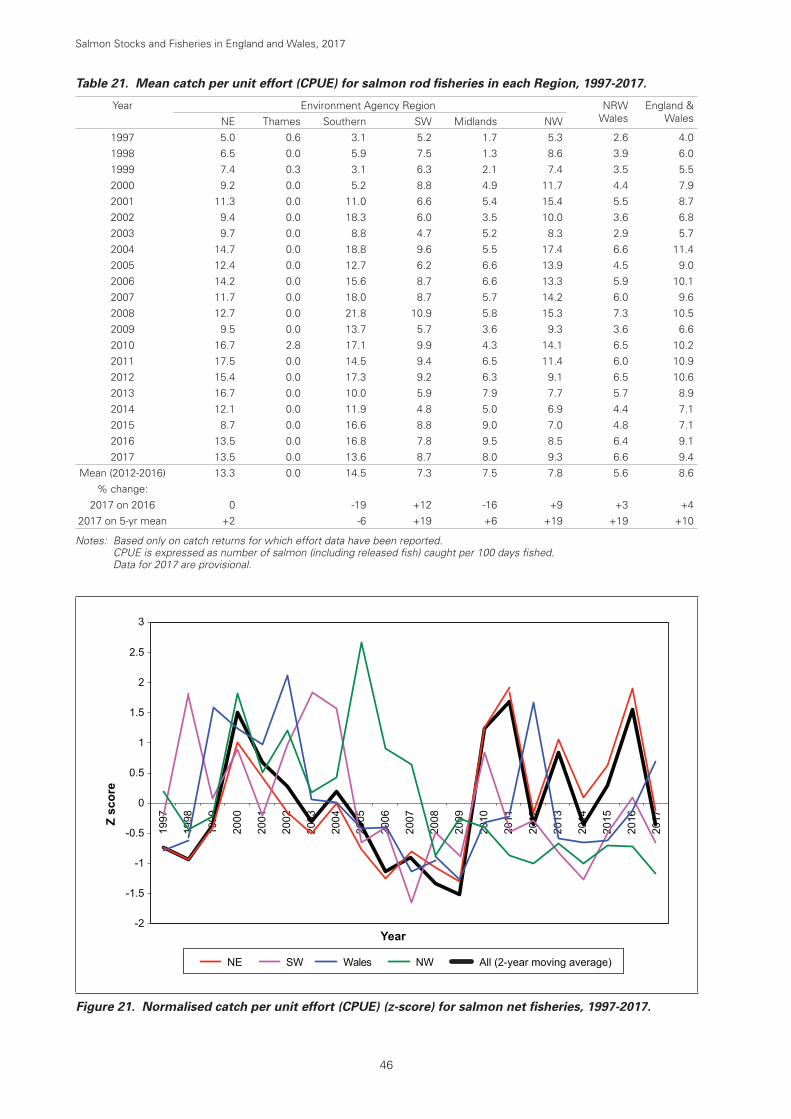
Table 21. Mean catch per unit effort (CPUE) for salmon rod fisheries in each Region, 1997-2017.
Year Environment Agency Region NRWWales
England & WalesNE Thames Southern SW Midlands NW
1997 5.0 0.6 3.1 5.2 1.7 5.3 2.6 4.01998 6.5 0.0 5.9 7.5 1.3 8.6 3.9 6.01999 7.4 0.3 3.1 6.3 2.1 7.4 3.5 5.52000 9.2 0.0 5.2 8.8 4.9 11.7 4.4 7.92001 11.3 0.0 11.0 6.6 5.4 15.4 5.5 8.72002 9.4 0.0 18.3 6.0 3.5 10.0 3.6 6.82003 9.7 0.0 8.8 4.7 5.2 8.3 2.9 5.72004 14.7 0.0 18.8 9.6 5.5 17.4 6.6 11.42005 12.4 0.0 12.7 6.2 6.6 13.9 4.5 9.02006 14.2 0.0 15.6 8.7 6.6 13.3 5.9 10.12007 11.7 0.0 18.0 8.7 5.7 14.2 6.0 9.62008 12.7 0.0 21.8 10.9 5.8 15.3 7.3 10.52009 9.5 0.0 13.7 5.7 3.6 9.3 3.6 6.62010 16.7 2.8 17.1 9.9 4.3 14.1 6.5 10.22011 17.5 0.0 14.5 9.4 6.5 11.4 6.0 10.92012 15.4 0.0 17.3 9.2 6.3 9.1 6.5 10.62013 16.7 0.0 10.0 5.9 7.9 7.7 5.7 8.92014 12.1 0.0 11.9 4.8 5.0 6.9 4.4 7.12015 8.7 0.0 16.6 8.8 9.0 7.0 4.8 7.12016 13.5 0.0 16.8 7.8 9.5 8.5 6.4 9.12017 13.5 0.0 13.6 8.7 8.0 9.3 6.6 9.4
Mean (2012-2016) 13.3 0.0 14.5 7.3 7.5 7.8 5.6 8.6% change:
2017 on 2016 0 -19 +12 -16 +9 +3 +42017 on 5-yr mean +2 -6 +19 +6 +19 +19 +10
Notes: Based only on catch returns for which effort data have been reported. CPUE is expressed as number of salmon (including released fish) caught per 100 days fished. Data for 2017 are provisional.
1997
1998
1999
2000
2001
2002
2003
2004
2005
2006
2007
2008
2009
2016
2017
2015
2014
2013
2012
2011
2010
-2
-1.5
-1
-0.5
0
0.5
1
1.5
2
2.5
3
Z sc
ore
Year
NE SW Wales NW All (2-year moving average)
Figure 21. Normalised catch per unit effort (CPUE) (z-score) for salmon net fisheries, 1997-2017.
Salmon Stocks and Fisheries in England and Wales, 2017
46

1997
1998
1999
2000
2001
2002
2003
2004
2005
2006
2007
2008
2009
2016
2017
2015
2014
2013
2012
2011
2010
-1.5
-2
-1
-0.5
0
0.5
1
1.5
2
2.5
Z sc
ore
Year
NE SW Midlands Wales NW Southern All (2-year moving average)
Figure 22. Normalised catch per unit effort (CPUE) (z-score) for salmon rod fisheries, 1997-2017. Note: the bold black line for all fisheries has been smoothed using a 2-year moving average.
0
0.05
0.1
0.15
0.2
0.25
Rod
CP
UE
(Num
ber p
er d
ay)
Stock size2000 2500 3000 3500 4000 4500 5000 5500
r2 = 50.7, P < 0.001
Figure 23. The relationship between mean rod CPUE and mean stock size for the Rivers Frome, Tamar, Fowey, Dee and Lune, 1997-2016. Note: the red lines are 95% confidence intervals and the blue lines 95% prediction intervals.
47
Salmon Stocks and Fisheries in England and Wales, 2017
6. EXPLOITATION RATES
Care is required in trying to draw general conclusions about current stock status from catches alone. The actual relationship between catch and stock abundance depends upon exploitation rates (i.e. the proportion of the salmon population taken in the catch – both retained fish and those released), although it is important to remember that fishing effort and catchability (the proportion of the stock taken per unit of fishing effort) can be influenced by factors such as river flow, angler activity and changes in run timing. Exploitation rates can be estimated where there is a fishery-independent measure of the salmon run, such as that obtained from fish counters and traps (Table 23 and Figure 28), and these data can then be compared against the catch (both total catch and retained fish) to estimate exploitation rates (Table 22 and Figure 24). These show varying trends, but the ‘true’ exploitation rates (i.e. fish retained) show a marked decline over the available time series, due largely to the increasing use of catch-and-release.
Overview of exploitation rates in 2017
There was considerable variability in the exploitation rates in rod fisheries in 2017. In some rivers, exploitation rates were higher than those in 2016 and above the average of the previous five years, while in other rivers the opposite applied. While total exploitation rates remain quite high on some rivers, the ‘true’ exploitation rates (i.e. fish retained) show a marked decline over the available time series in almost all rivers. This is largely attributable to catch and release, which has increased from 10% to over 80% over the past 2 to 3 decades, with mandatory catch and release now applying on some rivers. The exploitation rates for the net fisheries, where estimates have been possible, have either been reduced to zero or been greatly reduced, largely reflecting a major reduction in effort.
Assessment of national trend in exploitation
Estimates of aggregated national exploitation rates, split by sea-age class, are required for use in the ICES annual assessment of stock status to estimate numbers of returning fish. The procedures used in deriving these estimates are described in the background report. The overall trends in national exploitation rate derived from this process are provided in Figure 25. These indicate that exploitation rates have fallen from about 50% for 1SW fish and 35-40% for MSW fish at the start of the period to 12% and 6%, respectively, currently, due to the measures taken to control both legal and illegal fisheries. The decline in exploitation rates occurred particularly in the 1990s, but has levelled out more recently.
Salmon Stocks and Fisheries in England and Wales, 2017
48

Tab
le 2
2. E
stim
ated
exp
loit
atio
n r
ates
(%
) fo
r se
lect
ed r
od
an
d n
et fi
sher
ies,
198
8-20
17.
Rod
Fis
herie
sN
et F
ishe
ries
Reg
ion/
NR
WN
ES
outh
ern
SW
NW
Wal
esN
WW
ales
Riv
erTy
ne [c
]Te
st
Itch
enH
amps
hire
/Avo
nFr
ome
[a]
Tam
arFo
wey
Ken
tLe
ven
Lune
Dee
[b]
Dee
[b]
Teifi
Ken
tLe
ven
Lune
Dee
Wild
/Hat
cher
yW
W/H
WW
WW
WW
WW
W (1
SW
)W
(MS
W)
WW
WW
W
Year
All
Ret
.A
llR
et.
All
Ret
.A
llR
et.
All
Ret
.A
llR
et.
All
Ret
.A
llR
et.
All
Ret
.A
llR
et.
All
Ret
.A
llR
et.
All
Ret
.R
et.
Ret
.R
et.
Ret
.
1988
4040
3434
1212
1989
2929
4545
88
3737
2929
2644
1990
3737
5353
1212
2828
4545
936
1991
2626
6868
99
5252
5151
1131
1992
5353
8585
1313
4343
5454
1414
1818
429
15
1993
3734
3030
127
5347
4741
1110
1513
730
11
1994
4031
5954
1514
1312
3631
3429
1513
2119
435
22
1995
3226
1710
109
87
1612
2218
2317
87
1312
427
18
1996
2418
6852
1613
87
2114
1512
2217
97
108
124
17
1997
151
4115
86
64
3016
2218
2418
87
96
728
17
1998
2715
397
96
106
2511
3727
2112
107
105
112
15
1999
2011
4414
167
73
136
2415
2312
1310
105
515
22
2000
279
829
148
74
2210
2616
61
198
85
2013
310
1713
2001
531
891
169
32
168
106
104
1511
125
617
14
2002
330
790
146
21
2310
126
31
166
74
50
12
1812
2003
460
340
113
21
155
95
40.
113
610
78
22
112
13
2004
2310
410
370
94
73
136
2112
166
1711
1710
06
9
2005
2912
310
210
124
21
238
2011
177
158
207
319
13
2006
2510
200
290
120
80.
34
127
1020
1231
017
811
614
53
1015
8
2007
3316
390
700
100.
310
05
214
519
128
011
412
717
60.
20.
97
8
2008
3920
280
580
90
50.
25
123
752
3112
1.0
167
135
2615
00.
33
0.8
2009
3816
200
740
110.
36
17
215
641
2126
011
410
412
72
25
0
2010
2711
260
480
90.
25
06
228
731
1618
1.3
156
158
174
1710
10.
35
0
2011
3413
320
420
170.
37
0.2
62
216
n/a
n/a
421.
719
816
620
1016
9n/
a0
40
2012
4116
310
600
90
130
175
218
n/a
n/a
260
167
186
204
1910
n/a
0.5
30
2013
278
320
320
100
230
61
124
n/a
n/a
190
115
93
132
187
n/a
0.7
50
2014
226
230
350
90
141
41
184
n/a
n/a
80
112
102
101
185
n/a
0.3
60
2015
195
250
380
290
181
81
257
n/a
n/a
30
134
113
112
239
n/a
0.3
70
2016
287
240
870
180.
113
06
135
9n/
an/
a10
0n/
an/
a9
114
220
7n/
a0.
4n/
a0
2017
180
510
180.
610
110
144
10n/
an/
a11
0n/
an/
a13
115
1n/
a0
n/a
0
Mea
n (2
012-
2016
)27
927
050
015
016
0.3
82
226
130
134
113
132
197
0.4
50
% c
hang
e
201
7 on
201
6-2
5-4
1+
4-1
9+
56+
29+
29+
8+
8+
40-1
0+
7-2
1
201
7 on
5-y
r m
ean
-33
+2
+23
-37
+19
-30
+10
1+
52-1
8+
18-5
9+
13-2
7
Not
es:
It is
unc
lear
to
wha
t ex
tent
tot
al r
od e
xplo
itatio
n ra
te (‘
All’
) has
bee
n af
fect
ed b
y ca
tch
and
rele
ase
and
the
repe
at c
aptu
re o
f fis
h; n
o co
rrec
tion
fact
or h
as b
een
appl
ied.
Th
e en
tire
catc
h fr
om n
et fi
sher
ies
is a
ssum
ed k
illed
.
Dat
a fo
r 20
17 a
re p
rovi
sion
al.
Key
: [a
] D
ata
base
d on
Gam
e &
Wild
life
Con
serv
atio
n Tr
ust
coun
ter
at E
ast
Sto
ke, a
nd s
uppl
ied
cour
tesy
of
GW
CT.
[b
] D
ata
deriv
ed f
rom
mar
k re
capt
ure
inve
stig
atio
n.
[c]
Tyne
val
ues
are
prov
isio
nal;
wor
k is
ong
oing
with
New
cast
le U
nive
rsity
to
furt
her
refin
e R
SE
s.
49
Salmon Stocks and Fisheries in England and Wales, 2017

19800
1020304050
1990 2000 2010 2020
Tyne – rods
0102030
5040
60Test – rods
1980 1990 2000 2010 2020
0
5
10
15
20Tamar – rods
1980 1990 2000 2010 2020
0102030
5040
60Lune – rods
1980 1990 2000 2010 20200
1020304050
Lune – nets
1980 1990 2000 2010 2020
0
15
30
45Leven – rods
1980 1990 2000 2010 2020
0246
108
12Leven – nets
1980 1990 2000 2010 2020
0102030
5040
60Kent – rods
1980 1990 2000 2010 2020
05
1015
2520
30Kent – nets
1980 1990 2000 2010 2020
020406080
100Itchen – rods
1980 1990 2000 2010 2020
0
15105
35302520
Hants Avon – rods
1980 1990 2000 2010 202005
10152025
1980 1990 2000 2010 2020
Frome – rods
010
3020
4050
Fowey – rods
1980 1990 2000 2010 2020
0
5
10
15
20Dee – rods (1SW)
1980 1990 2000 2010 2020
05
1015
2520
30Dee – rods (MSW)
1980 1990 2000 2010 2020
05
10152025
Dee – nets
1980 1990 2000 2010 2020
05
10152025
Teifi – rods
1980 1990 2000 2010 2020
Figure 24. Estimated exploitation rates (%) for selected rod and net fisheries in England & Wales, 1988-2017. For rod fisheries, the figures display exploitation rates for all fish caught – i.e. including fish released (blue dots) and fish killed (red triangles). Note that estimates for the Dee rods have been split by sea-age class (1SW and MSW), all other estimates are combined for all ages. Data for net fisheries are for retained fish only.
Salmon Stocks and Fisheries in England and Wales, 2017
50

0.0
0.1
0.2
0.3
0.4
0.5
0.6
1971
1975
1979
1983
1987
1991
1995
1999
2003
2007
2011
2015
Exp
loita
tion
rate
(pro
porti
on)
1SW MSW
Figure 25. Estimated national exploitation rates for 1SW and MSW salmon caught in England and Wales (fish caught and killed only), including estimated non-reported catch, 1971-2017, as used in the ICES PFA assessment.
51
Salmon Stocks and Fisheries in England and Wales, 2017

REPORT ON STATUS OF STOCKS IN 2017
7. STOCK MONITORING
The Environment Agency and Natural Resources Wales monitor both stocks and fishery performance in most rivers supporting salmon stocks in England and Wales. This includes operating counters, undertaking surveys of juvenile fish and collecting fishery statistics. These data provide the basis for assessing stock status and informing management decisions. In addition to protecting the abundance of stocks, managers need to maintain the diversity of stocks in terms of their biological characteristics. Measures of stock diversity potentially encompass a wide range of biological characteristics, but those of greatest significance for the management of stocks are the population structure within the river, the river-age of the emigrating smolts and the run-timing and sea-age composition of the returning adult stock. Such data tend to be derived from a small number of ‘indicator’ rivers. Further details on the various monitoring programmes are provided in the background report.
Juvenile surveys (salmon fry and parr)
A programme of juvenile salmonid monitoring is carried out to identify spatial variation in juvenile populations and temporal trends in their abundance. The habitat at all sites is assessed such that the abundance of the juvenile salmon population at any site can be compared with standard reference conditions. A classification scheme is also applied such that the proportion of sites falling into different salmon abundance classes (Classes A to F) provides a measure of the health of the juvenile salmon populations for each river. Figure 26 presents the proportion of sites in each catchment that fall into the top three categories (Classes A to C) over the period 2012 to 2017. Thus, for catchments shaded red, less than 25% of sites fall within this category, while for those shaded green more than 75% of sites are at or above average. Overall, the majority (68%) of sites surveyed over the period were in the lowest two classes (Classes E or F). The proportion of sites surveyed that fell within Classes A to C varied between regions from 4% to 30%. Work is continuing to revise and update the procedures for collecting and interpreting juvenile data.
Figure 27 presents annual estimates of the overall percentage of sites within principal salmon rivers falling within classes A to C viewed over the available time series (2005 – 2017). It should be noted that the same sites are not sampled every year and so are strictly not directly comparable. Nonetheless, these data provide the best general indication of overall changes in juvenile recruitment throughout England and Wales over the period. The data show considerable variability in the percentage of sites falling within classes A-C with a notable decline from over 50% in 2009 to below 30% in 2010. The value for 2016 was the lowest in the time series (23%), highlighting the poor juvenile recruitment that was observed throughout England and Wales in that year (Section 10). There was an improvement in the percentage of sites falling within classes A to C in 2017 (32%), although this remained among the lowest in the time series.
Upstream counts of adult salmon
Electronic fish counters or traps are operated on several catchments to provide estimates of the upstream run of adult salmon and sea trout. Where it is possible to separate the species, the counts are adjusted to provide estimates of the numbers of returning salmon. For some rivers (e.g. River Tyne and River Teifi) the time-consuming validation procedures mean data may not be available for the latest year. A number of such monitoring facilities have also ceased to
Salmon Stocks and Fisheries in England and Wales, 2017
52

operate in recent years as a result of changes in operating procedures, counter / trap damage or due to budgetary restrictions. Available time series, including those that have been recently discontinued, are presented in Table 23 and Figure 28.
Around half the available returning stock estimates and counts for 2017 were above the levels recorded in 2016 and the recent 5-year averages. However, on two rivers (Dee and Taff) the 2017 values were the lowest in the time series. In the majority of rivers, particularly those on the west coast of England and in Wales (Figure 28), there is evidence of a marked decline in the numbers of returning salmon over the last decade. However, on some other rivers, notably some of those on the south coast of England, the numbers of returns indicate an increasing trend.
Tagging investigations
Tagging studies have often been employed to monitor stocks and to evaluate the outcome of different management initiatives, although tagging effort has fallen in recent years. In 2017, around 2,400 wild salmon smolts were microtagged and released in England and Wales to assess levels of marine survival; all these fish were also adipose fin-clipped. A further 9,900 hatchery parr and smolts and 11,000 wild parr were marked with adipose fin clips; all the wild parr were also fitted with PIT tags. In addition, about 700 adult salmon were tagged for the assessment of returning stocks. Details of the tagged and marked salmon released each year around the whole North Atlantic are compiled annually by ICES. Details of the fish tagged in England and Wales in 2017 are provided in Table 24.
Marine survival
Evidence from monitored rivers around the North Atlantic indicates that the survival of salmon during the marine phase of their life-cycle has declined in recent decades. Time series of marine survival estimates, measured as percentage return rates, are shown in Table 25 for the River Corrib (Ireland), River Bush (Northern Ireland) and River North Esk (Scotland) (data from ICES, 2018). Shorter time series for the Rivers Dee (Wales), Tamar and Frome (Table 25 and Figure 29) indicate similar low levels of marine survival in recent years. It was not possible to monitor adult returns on the Tamar in 2014, or to undertake any smolt tagging, so there are therefore gaps in this time series. However, this programme resumed in 2015.
For the Rivers Tamar and Frome, the return rate of 1SW fish (from the 2016 smolt cohort) was lower than the previous year, but remained within the range of observed values (back to 2002). For the River Dee, however, the return rate of 1SW was the lowest in the time series. The survival estimate for 2SW salmon on the Frome in 2017 (from the 2015 smolt cohort) was the highest recorded and that for the Dee was the highest for over 10 years, while that for Tamar was below average.
Analysis of data for the River Dee has previously indicated a clear correlation between survival rates of particular smolt cohorts and the condition of the adult salmon returning to the river derived from these cohorts. This suggests a direct link between the ability of salmon to feed and grow at sea and their subsequent survival.
53
Salmon Stocks and Fisheries in England and Wales, 2017
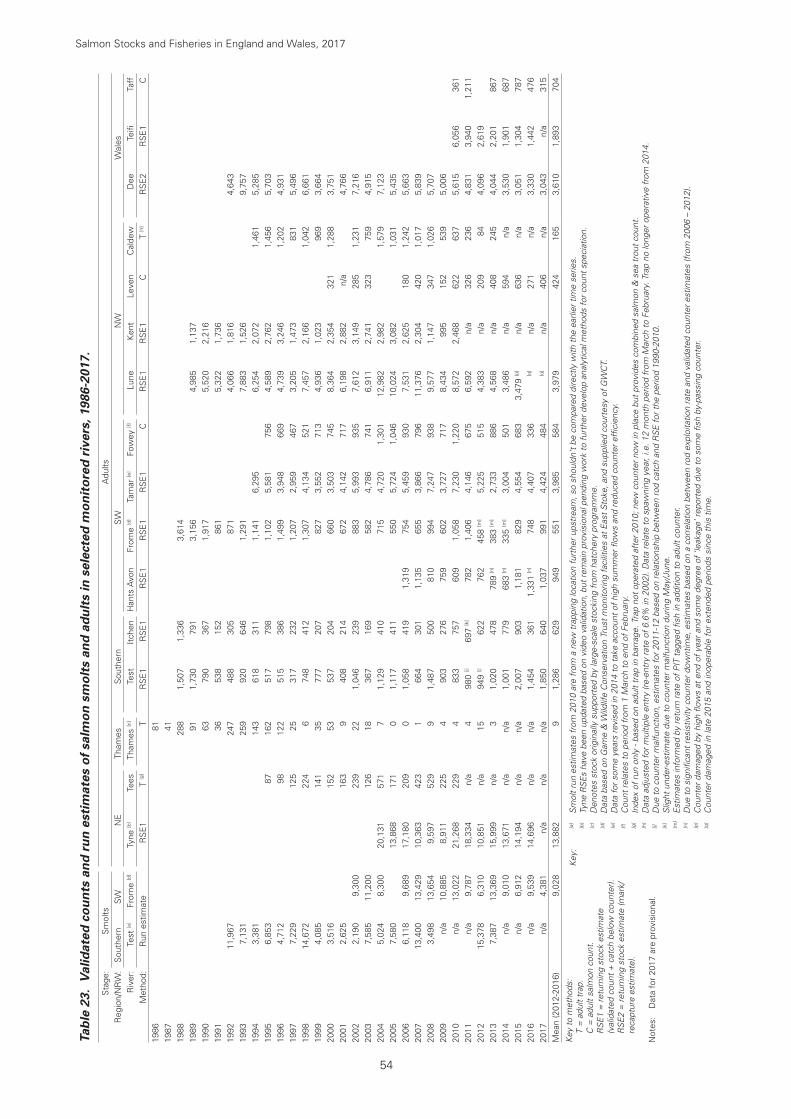
Tab
le 2
3. V
alid
ated
co
un
ts a
nd
ru
n e
stim
ates
of
salm
on
sm
olt
s an
d a
du
lts
in s
elec
ted
mo
nit
ore
d r
iver
s, 1
986-
2017
.
Sta
ge:
Sm
olts
Adu
ltsR
egio
n/N
RW
:S
outh
ern
SW
NE
Tham
esS
outh
ern
SW
NW
Wal
esR
iver
:Te
st [a
]Fr
ome
[d]
Tyne
[b]
Tees
Tham
es [c
]Te
stIt
chen
Han
ts A
von
From
e [d
]Ta
mar
[e]
Fow
ey [f
]Lu
neK
ent
Leve
nC
alde
wD
eeTe
ifiTa
ffM
etho
d:R
un e
stim
ate
RS
E1
T [g
]T
RS
E1
RS
E1
RS
E1
RS
E1
RS
E1
CR
SE
1R
SE
1C
T [h
]R
SE
2R
SE
1C
1986
8119
8741
1988
288
1,50
71,
336
3,61
419
8991
1,73
079
13,
156
4,98
51,
137
1990
6379
036
71,
917
5,52
02,
216
1991
3653
815
286
15,
322
1,73
619
9211
,967
247
488
305
871
4,06
61,
816
4,64
319
937,
131
259
920
646
1,29
17,
883
1,52
69,
757
1994
3,38
114
361
831
11,
141
6,29
56,
254
2,07
21,
461
5,28
519
956,
853
8716
251
779
81,
102
5,58
175
64,
589
2,76
21,
456
5,70
319
964,
712
9812
251
538
61,
499
3,94
866
94,
739
3,24
61,
202
4,93
119
977,
229
125
2531
723
21,
207
2,95
946
73,
205
1,47
383
15,
496
1998
14,6
7222
46
748
412
1,30
74,
134
521
7,45
72,
166
1,04
26,
661
1999
4,08
514
135
777
207
827
3,55
271
34,
936
1,02
396
93,
664
2000
3,51
615
253
537
204
660
3,50
374
58,
364
2,35
432
11,
288
3,75
120
012,
625
163
940
821
467
24,
142
717
6,19
82,
882
n/a
4,76
620
022,
190
9,30
023
922
1,04
623
988
35,
993
935
7,61
23,
149
285
1,23
17,
216
2003
7,58
511
,200
126
1836
716
958
24,
786
741
6,91
12,
741
323
759
4,91
520
045,
024
8,30
020
,131
571
71,
129
410
715
4,72
01,
301
12,9
822,
982
1,57
97,
123
2005
7,58
013
,868
171
01,
117
411
550
5,72
41,
046
10,0
243,
082
1,03
15,
435
2006
6,11
89,
689
17,1
8020
90
1,05
841
91,
319
754
5,45
993
07,
531
2,62
518
01,
242
5,66
320
0713
,400
13,4
2910
,363
423
166
430
11,
135
655
3,86
679
611
,376
2,30
442
01,
017
5,83
920
083,
498
13,6
549,
597
529
91,
487
500
810
994
7,24
793
89,
577
1,14
734
71,
026
5,70
720
09n/
a10
,885
8,91
122
54
903
276
759
602
3,72
771
78,
434
995
152
539
5,00
620
10n/
a13
,022
21,2
6822
94
833
757
609
1,05
87,
230
1,22
08,
572
2,46
862
263
75,
615
6,05
636
120
11n/
a9,
787
18,3
34n/
a4
980
[j]69
7 [k
]78
21,
406
4,14
667
56,
592
n/a
326
236
4,83
13,
940
1,21
120
1215
,378
6,31
010
,851
n/a
1594
9 [j]
622
762
458
[m]
5,22
551
54,
383
n/a
209
844,
096
2,61
920
137,
387
13,3
6915
,999
n/a
31,
020
478
789
[n]
383
[m]
2,73
388
64,
568
n/a
408
245
4,04
42,
201
867
2014
n/a
9,01
013
,671
n/a
n/a
1,00
177
968
3 [n
]33
5 [m
]3,
004
501
3,48
6n/
a59
4n/
a3,
530
1,90
168
720
15n/
a6,
912
14,1
94n/
an/
a2,
007
903
1,18
182
94,
554
683
3,47
9 [p
]n/
a63
6n/
a3,
051
1,30
478
720
16n/
a9,
539
14,6
96n/
an/
a1,
454
361
1,33
1 [n
]74
84,
407
336
[q]
n/a
271
n/a
3,33
01,
442
476
2017
n/a
4,38
1n/
an/
an/
a1,
850
640
1,03
799
14,
424
484
[q]
n/a
406
n/a
3,04
3n/
a31
5M
ean
(201
2-20
16)
9,02
813
,882
91,
286
629
949
551
3,98
558
43,
979
424
165
3,61
01,
893
704
Key
to
met
hods
:
T =
adu
lt tr
ap.
C
= a
dult
salm
on c
ount
.
RS
E1
= r
etur
ning
sto
ck e
stim
ate
(val
idat
ed c
ount
+ c
atch
bel
ow c
ount
er).
R
SE
2 =
ret
urni
ng s
tock
est
imat
e (m
ark/
reca
ptur
e es
timat
e).
Not
es:
Dat
a fo
r 20
17 a
re p
rovi
sion
al.
Key
: [a
] S
mol
t ru
n es
timat
es f
rom
201
0 ar
e fr
om a
new
tra
ppin
g lo
catio
n fu
rthe
r up
stre
am, s
o sh
ould
n’t
be c
ompa
red
dire
ctly
with
the
ear
lier
time
serie
s.
[b]
Tyne
RS
Es
have
bee
n up
date
d ba
sed
on v
ideo
val
idat
ion,
but
rem
ain
prov
isio
nal p
endi
ng w
ork
to f
urth
er d
evel
op a
naly
tical
met
hods
for
cou
nt s
peci
atio
n.
[c]
Den
otes
sto
ck o
rigin
ally
sup
port
ed b
y la
rge-
scal
e st
ocki
ng f
rom
hat
cher
y pr
ogra
mm
e.
[d]
Dat
a ba
sed
on G
ame
& W
ildlif
e C
onse
rvat
ion
Trus
t m
onito
ring
faci
litie
s at
Eas
t S
toke
, and
sup
plie
d co
urte
sy o
f G
WC
T.
[e]
Dat
a fo
r so
me
year
s re
vise
d in
201
4 to
tak
e ac
coun
t of
hig
h su
mm
er fl
ows
and
redu
ced
coun
ter
effic
ienc
y.
[f]
Cou
nt r
elat
es t
o pe
riod
from
1 M
arch
to
end
of F
ebru
ary.
[g
] In
dex
of r
un o
nly
- bas
ed o
n ad
ult
trap
in b
arra
ge. T
rap
not
oper
ated
aft
er 2
010;
new
cou
nter
now
in p
lace
but
pro
vide
s co
mbi
ned
salm
on &
sea
tro
ut c
ount
.
[h]
Dat
a ad
just
ed f
or m
ultip
le e
ntry
(re-
entr
y ra
te o
f 6.
6% in
200
2). D
ata
rela
te t
o sp
awni
ng y
ear,
i.e. 1
2 m
onth
per
iod
from
Mar
ch t
o Fe
brua
ry. T
rap
no lo
nger
ope
rativ
e fr
om 2
014.
[j]
Due
to
coun
ter
mal
func
tion,
est
imat
es f
or 2
011-
12 b
ased
on
rela
tions
hip
betw
een
rod
catc
h an
d R
SE
for
the
per
iod
1990
-201
0.
[k]
Slig
ht u
nder
-est
imat
e du
e to
cou
nter
mal
func
tion
durin
g M
ay/J
une.
[m
] E
stim
ates
info
rmed
by
retu
rn r
ate
of P
IT t
agge
d fis
h in
add
ition
to
adul
t co
unte
r.
[n]
Due
to
sign
ifica
nt r
esis
tivity
cou
nter
dow
ntim
e, e
stim
ates
bas
ed o
n a
corr
elat
ion
betw
een
rod
expl
oita
tion
rate
and
val
idat
ed c
ount
er e
stim
ates
(fro
m 2
006
– 20
12).
[p
] C
ount
er d
amag
ed b
y hi
gh fl
ows
at e
nd o
f ye
ar a
nd s
ome
degr
ee o
f ‘le
akag
e’ r
epor
ted
due
to s
ome
fish
by-p
assi
ng c
ount
er.
[q
] C
ount
er d
amag
ed in
late
201
5 an
d in
oper
able
for
ext
ende
d pe
riods
sin
ce t
his
time.
Salmon Stocks and Fisheries in England and Wales, 2017
54

Tab
le 2
4. I
CE
S C
om
pila
tio
n o
f m
icro
tag
, fin
clip
an
d e
xter
nal
tag
rel
ease
s
Mar
king
sea
son:
201
7C
ount
ry: U
K (E
ngla
nd a
nd W
ales
)To
tals
Orig
inP
rimar
y Ta
g or
Mar
kO
ther
inte
rnal
[a]
Tota
lM
icro
tag
Ext
erna
l Mar
kA
dipo
se C
lipH
atch
ery
juve
nile
9,85
29,
852
Wild
juve
nile
2,38
310
,965
13,3
48A
dult
692
692
Tota
l fish
mar
ked
2,38
369
220
,817
023
,892
Mar
king
Age
ncy
Age
Life
Sta
geH
/WS
tock
Orig
inP
rimar
y Ta
g or
Mar
kN
umbe
r m
arke
dC
ode
or S
eria
lS
econ
dary
Tag
or
Mar
kR
elea
se d
ate
Rel
ease
Loc
atio
n
EA
Nor
th E
ast
Vario
usA
dult
WTy
neFl
oy t
ag14
9G
reen
200
1 - 2
525
Non
eN
ov -
Dec
201
7Ty
ne &
trib
utar
ies
Nat
ural
Res
ourc
es W
ales
Vario
usS
mol
tW
Dee
(Wor
then
bury
)C
WT
4601
/42/
34A
dipo
seM
ay 2
017
Dee
- W
orth
enbu
ryN
atur
al R
esou
rces
Wal
esVa
rious
Sm
olt
WD
ee (C
eirio
g)C
WT
221
01/4
2/38
Adi
pose
May
201
7D
ee -
Cei
riog
Nat
ural
Res
ourc
es W
ales
Vario
usA
dult
WD
eeFl
oy t
ag54
3Va
rious
(blu
e an
d bl
ue/g
reen
)N
one
Mar
ch-O
ct 2
017
Dee
- C
hest
erN
atur
al R
esou
rces
Wal
es0+
Par
rH
Dee
Adi
pose
clip
3,12
4N
one
Oct
201
7D
ee -
Tryw
eryn
Nat
ural
Res
ourc
es W
ales
1+ &
2+
Sm
olt
HTa
ffA
dipo
se c
lip6,
728
Non
eM
ay-J
une
2017
Taff
- R
adyr
EA
Sou
th W
est
Vario
usS
mol
tW
Tam
arC
WT
2,11
601
/42/
95A
dipo
seA
pril-
May
201
7Ta
mar
Cef
asVa
rious
Par
rW
Itch
enA
dipo
se c
lip17
8C
odes
sta
rt: D
C00
xxxx
xxP
IT t
agJu
ly 2
017
Itch
enC
efas
/NR
WVa
rious
Par
rW
Dee
(Cei
riog)
Adi
pose
clip
279
Cod
es s
tart
: DC
00xx
xxxx
PIT
tag
Sep
t 20
17D
ee -
Cei
riog
GW
CT/
Cef
as0+
& 1
+P
arr
WFr
ome
Adi
pose
clip
10,5
08C
odes
sta
rt: 3
DD
.003
* (h
exad
ecim
al)
or 9
89.0
010*
(dec
imal
)P
IT t
agA
ug-S
ept
2017
From
e
Not
es:
[a]
Incl
udes
PIT
and
rad
io/a
cous
tic t
ags.
55
Salmon Stocks and Fisheries in England and Wales, 2017

Tab
le 2
5. E
stim
ated
su
rviv
al o
f w
ild s
mo
lts
(%)
to r
etu
rn t
o h
om
ewat
ers
(pri
or
to c
oas
tal fi
sher
ies)
fo
r in
dex
riv
ers
in t
he
UK
an
d Ir
elan
d (
fro
m IC
ES
, 201
8 an
d
En
viro
nm
ent
Ag
ency
/Nat
ura
l Res
ou
rces
Wal
es/C
efas
/GW
CT
dat
a) f
or
1984
to
201
6 sm
olt
yea
rs.
Sm
olt
mig
ratio
n ye
arIr
elan
dU
K (N
. Ire
land
)U
K (S
cotla
nd)
UK
(Eng
land
and
Wal
es)
Riv
er C
orrib
Bur
isho
ole
Riv
er B
ush
[a]
Riv
er N
orth
Esk
[b]
Dee
[c]
Tam
arFr
ome
[d]
1SW
2SW
1SW
1SW
1SW
MS
W1S
W95
% C
LM
SW
95%
CL
1SW
95%
CL
MS
W95
% C
L1S
WM
SW
1984
26.2
2.0
19.8
6.0
4.0
1985
18.9
1.8
19.3
13.6
5.4
1986
20.0
31.3
1987
16.6
0.7
26.9
35.1
10.4
3.9
1988
14.6
0.7
22.9
36.2
1989
6.7
0.7
7.1
25.0
6.6
4.2
1990
5.0
0.6
16.0
34.7
6.0
3.1
1991
7.3
1.3
21.7
27.8
7.6
3.1
1992
7.3
15.9
29.0
10.9
6.5
1993
10.8
0.1
23.9
14.5
6.1
6.3
3.6
2.5
2.2
1994
9.8
1.4
26.9
27.1
10.9
3.6
1.3
1.2
1.2
1.3
1995
8.4
0.1
14.6
8.4
3.8
2.7
1.8
0.4
0.7
1996
6.3
1.2
18.3
31.0
5.9
2.7
4.8
1.7
2.1
1.3
1997
12.7
0.8
15.6
19.8
7.2
4.2
6.2
2.9
3.4
1.9
1998
5.5
1.1
12.4
13.4
2.6
1.4
2.3
2.4
3.7
3.6
1999
6.4
0.9
14.9
16.5
6.8
3.8
5.0
8.3
12.4
11.8
2000
9.4
22.5
10.1
6.0
2.8
2.0
1.1
0.9
0.8
2001
7.2
1.1
16.6
12.4
4.7
2.9
4.3
5.1
2002
6.0
0.5
12.3
11.3
2.2
2.0
2.9
1.4
0.7
0.9
3.6
2.1
1.4
0.9
5.6
1.7
2003
8.3
2.1
19.4
6.8
2.6
1.7
0.4
0.4
6.1
2.0
1.8
1.1
4.8
0.9
2004
6.3
0.8
12.8
6.8
4.5
1.1
1.0
0.5
6.0
2.3
1.5
1.0
5.3
2.9
2005
8.1
5.9
6.7
2.8
5.1
1.6
0.5
0.4
6.4
1.6
1.2
0.8
2006
3.6
0.7
12.9
14.0
3.3
3.4
4.3
1.2
1.5
0.9
3.8
1.3
5.3
2.5
5.1
2.2
2007
1.3
1.6
8.4
8.3
5.0
4.0
1.3
1.1
0.9
0.7
7.6
3.8
3.3
2.0
5.7
1.3
2008
1.7
1.0
8.2
4.0
6.4
5.3
2.5
2.0
1.3
1.5
1.6
0.9
0.9
0.7
3.1
1.6
2009
6.0
1.0
8.9
5.9
9.0
8.7
4.8
2.1
1.1
1.0
8.2
2.1
1.9
0.9
7.7
2.6
2010
2.9
1.2
7.5
4.0
1.9
1.9
0.7
1.3
3.4
1.5
5.0
3.1
8.6
2.8
2011
2.4
010
.82.
70.
30.
51.
11.
61.
91.
21.
21.
720
121.
50
9.4
11.7
4.8
4.9
2.5
1.4
3.1
2.0
2013
2.2
0.3
4.5
4.6
1.9
1.7
1.4
1.3
4.7
2.6
1.5
2.1
2014
2.9
0.5
8.0
2.9
0.5
1.1
2.0
2.7
2015
5.5
0.6
7.8
6.7
0.5
1.0
1.8
1.6
4.2
2.1
2.3
1.9
5.9
3.0
2016
6.9
7.5
3.8
0.3
0.6
3.5
2.6
4.4
Mea
n (2
011-
15)
2.9
0.3
8.1
5.7
2.4
1.0
2.6
3.0
2.8
2.3
Mea
n (2
006-
15)
3.0
0.2
8.6
6.5
5.9
5.4
2.8
1.0
4.0
3.2
4.4
2.2
Key
: [a
] B
ased
on
mic
rota
ggin
g, c
orre
cted
for
tag
ging
mor
talit
y.
[b]
Bas
ed o
n ta
ggin
g w
ith C
arlin
tag
s, n
ot c
orre
cted
for
tag
ging
mor
talit
y
[c]
Bas
ed o
n m
icro
tagg
ing
with
a 9
0% t
ag r
eten
tion
rate
, not
cor
rect
ed f
or t
aggi
ng m
orta
lity.
[d
] D
ata
base
d on
Gam
e &
Wild
life
Con
serv
atio
n Tr
ust
mon
itorin
g fa
cilit
ies
at E
ast
Sto
ke, a
nd s
uppl
ied
cour
tesy
of
GW
CT.
Not
es:
Dat
a fo
r 20
16 s
mol
t m
igra
tion
year
are
pro
visi
onal
.
Salmon Stocks and Fisheries in England and Wales, 2017
56

© Crown copyright and database rights [2018]. Ordnance Survey licence number 100024198.
Percentage of juvenile surveys in classesA-C in 2012-2017
Juvenile salmon abundance
Figure 26. Juvenile salmon abundance indices for each catchment, presented as percentage of surveys in classes A-C only, 2012-2017.
57
Salmon Stocks and Fisheries in England and Wales, 2017

0
10
20
30
40
50
60
2005 2006 2007 2008 2009 2010 2011 2012 2013 20162015 20172014
% o
f site
s in
cla
sses
A to
C
Figure 27. Overall percentage of juvenile survey sites in England and Wales in classes A to C, 2005–2017. Data include all surveys conducted in a single year from principal salmon rivers only. (Note: data updated from previous reports.)
Salmon Stocks and Fisheries in England and Wales, 2017
58

0
2000
4000
6000
8000
10000
1987
2017
Wye (C)
0
5000
10000
15000
20000
25000
1987
2017
Tyne (RSE)
0
500
1000
1500
2000
2500
1987
2017
Test (RSE)
0100200300400500600
1987
2017
Tees (T)
0
2000
4000
6000
8000
1987
2017
Tamar (RSE)
02000400060008000
100001200014000
1987
2017
Lune (RSE)
0100200300400500600700
1987
2017
Leven (C)
0500
100015002000250030003500
1987
2017
Kent (RSE)
0
500
1000
1500
1987
2017
Itchen (RSE)
0200400600800
100012001400
1987
2017
Hants Avon (RSE)
0
1000
2000
3000
4000
1987
2017
Frome (RSE)
0200400600800
100012001400
1987
2017
Fowey (C)
0
2000
4000
6000
8000
10000
1987
2017
Dee (RSE)
0
500
1000
1500
2000
1987
2017
Caldew (T)
Figure 28. Counts from electronic counters (C) and monitoring traps (T), and returning stock estimates (RSE) (based on trapping and tagging, or validated counts plus catch below counter) for selected salmon stocks in England and Wales, 1988-2017. Regression lines are indicative only and based on data from 1995 on (red squares); earlier data for some rivers indicated as blue diamonds. Note that y-axes scales differ.
59
Salmon Stocks and Fisheries in England and Wales, 2017

0.0
2.0
4.0
6.0
8.0
10.0
12.0
14.0
1990
% s
urvi
val
1995 2000 2005 2010 20202015
Smolt Year
(a) 1SW Dee
Tamar
Frome
0.0
2.0
4.0
6.0
8.0
10.0
12.0
14.0
1990
% s
urvi
val
1995 2000 2005 2010 20202015
Smolt Year
Dee
Tamar
Frome
(b) MSW
Figure 29. Estimated survival (± 95 CLs where available) of wild smolts (%) to return to homewaters (prior to coastal fisheries) for (a) 1SW and (b) MSW salmon for the Rivers Dee, Tamar and Frome.
Salmon Stocks and Fisheries in England and Wales, 2017
60

8. ASSESSMENT OF STOCK STATUS
The status of individual river stocks in England and Wales is evaluated annually against stock conservation limits (CLs) and management targets (MTs) in line with the requirements of ICES and NASCO. A national assessment of the status of the salmon resource in England and Wales is also undertaken annually, using the Pre-fishery Abundance (PFA) and National Conservation Limit Models (Potter et al., 2004), and reported to ICES to assist with the development of management advice for the distant water fisheries. Full details of these assessment approaches are provided in the background report.
Status of river stocks in 2017
Egg deposition estimates for 2017 have been calculated for each of the 64 main salmon rivers in England and Wales and values, expressed as the proportion of the CL attained, are provided in Table 26 and illustrated in Figure 30.
Thirty two rivers (50%) were provisionally assessed as meeting their CL in 2017 (Table 27), an increase on 2016 (22 rivers). This represents the highest level of CL attainment since 2012 (Figure 31). Seventeen rivers (27%) were below 50% of their CL in 2017, compared with 22 rivers in 2016. River-to-river variation in the proportion of the CL attained in 2017 (Figure 30) indicates that rivers where spawning escapement was below the CL were widely distributed throughout England and Wales.
In 2017, additional egg deposition resulting from fish that were caught and released is estimated at about 22 million eggs (assuming 80% survival to spawning, 50% females and an average of 5,000 eggs per female). This represents about 7% of the total estimated egg deposition in England and Wales in 2017.
Compliance with the management objective
The ‘management objective’ for salmon stocks in England and Wales is that they should meet or exceed their CLs in at least four years out of five. Compliance with this objective takes trends in egg deposition into account, and has been calculated for all 64 principal river stocks in England and Wales for 2017 and forecast for 2022 (Table 26 and Figure 32).
The latest compliance assessment indicates that none of the principal rivers across England and Wales were classified as ‘not at risk’ in 2017 – having a high probability (p > 95%) of achieving the management objective. The same has applied in each year since 2014 and is forecast to continue to apply in 2022. In 2017, 19 rivers (30%) were classified as ‘at risk’ - having a low probability (p < 5%) of achieving the management objective; this represent an improvement on 2016 (25 rivers). Twelve rivers (19%) are forecast to be ‘at risk’ in 2022, consistent with the progressive reduction in the number of rivers classified as ‘at risk’ over the time series. Thirty eight rivers in England and Wales in 2017 (59%) are classified as ‘probably at risk’ (5% < p < 50% of achieving the management objective); this rises to 64% in 2022. Only 7 rivers (11%) are classified as ‘probably not at risk’ (50% ≤ p < 95%) in 2017, compared with 5 rivers in 2016. The compliance figures are summarised, separately, for rivers in England and Wales below:
61
Salmon Stocks and Fisheries in England and Wales, 2017

Rivers in England
Stock status category Probability of meeting the management objective
2017 2022
Number of rivers
% Number of rivers
%
Not at risk >95% 0 0 0 0
Probably not at risk 50–95% 6 14 9 21
Probably at risk 5–50% 27 64 29 69
At risk <5% 9 21 4 10
Rivers in Wales
Stock status category Probability of meeting the management objective
2017 2022
Number of rivers
% Number of rivers
%
Not at risk >95% 0 0 0 0
Probably not at risk 50–95% 1 5 2 9
Probably at risk 5–50% 11 50 12 55
At risk <5% 10 45 8 36
For rivers in England (Figure 33a) there has been a general decrease in the proportion of rivers regarded as ‘at risk’ over the past 14 years, and this is forecast to continue. However, while the percentage of rivers classified as ‘not at risk’ was relatively stable, at about 20%, over the early part of the time series, none have been assessed as ‘not at risk’ in the last four years, and this is projected to continue in 2022. There was a small increase in the number of rivers classified as ‘probably not at risk’ in 2017 compared with 2016, and the majority of rivers (64%) continue to fall in the ‘probably at risk’ category as in the previous three years. The 2017 assessment suggests that the majority (79%) of English rivers will fall in the ‘probably at risk’ and ‘at risk’ categories in 2022.
For Wales (Figure 33b), a higher proportion of rivers have fallen in the ‘at risk’ category over the time series and very few rivers have been classed as ‘not at risk’. In 2017, all the rivers except one are classified as either ‘at risk’ (45%) or ‘probably at risk’ (50%). The projected trend suggests that 91% of rivers will fall in the same two categories in 2021, but with the majority classed as ‘probably at risk’.
The latest assessment thus indicates that the majority of salmon stocks in England and Wales remain in a depleted state.
Assessment of pre-fishery abundance (PFA) for England and Wales
Each year, ICES makes an assessment of the status of the salmon stocks in the Northeast Atlantic (NEAC) area as a basis for advising managers and providing catch advice for the distant water fisheries. A key part of this assessment is the estimation of the pre-fishery abundance (PFA) of all NEAC stocks, which is defined as the number of fish alive in the sea on January 1 in their first sea winter. This is split between maturing (potential 1SW) and non-maturing (potential
Salmon Stocks and Fisheries in England and Wales, 2017
62

MSW) fish. The PFA estimates for the period since 1971 provide our best interpretation of what the available catch and effort data tell us about changes in the status of the total national stock of salmon over the past four to five decades.
The estimated PFA of salmon from England and Wales has declined by around 45% from the early 1970s to the present time (Figure 34). Over much of the period, the decrease has tended to be somewhat greater for the non-maturing (i.e. potential MSW) component of the PFA than the maturing 1SW (i.e. potential grilse) component. However, there has been a marked reduction in the PFA of 1SW salmon in the last seven years, and the decline in PFA between the start and the end of the time series is now greater for 1SW fish (~60%) than for MSW salmon (~40%). It should be noted that these trends mask conflicting changes in individual river stocks. Many rivers have experienced more serious declines but these are obscured by the very substantial improvements and recovery in others. The results also suggest that there was a marked decline in PFA around 1990, which is consistent with the general perception of a decrease in the marine survival for many stocks around the North Atlantic at about this time. [NB the model cannot provide an estimate of PFA of potential MSW fish for the most recent year, as this relies on an assessment of the returns to homewaters of these fish, which will not occur until the subsequent year].
The estimated numbers of salmon returning to rivers in England and Wales (prior to exploitation in homewater fisheries) are also derived from the ICES national assessment. These estimates show a similar downward trend to the PFA (Figure 35), although the decrease is less marked due to the reduction in net exploitation in distant water fisheries. Thus, numbers of returning fish are estimated to have declined by about 40% between the early 1970s and the present time. As with the PFA, the decline in returning MSW fish has tended to be greater than that of the 1SW (grilse) returns over much of the time period. However, a higher proportion of MSW fish has been observed in recent years and the percentage reduction in returning fish between the start and the end of the times series is now substantially greater for 1SW fish.
The difference between the estimated numbers of returning fish and those surviving to spawn has reduced progressively over the time series and the total spawning escapement has remained reasonably consistent over the period (Figure 35). This reflects the marked reduction in levels of exploitation in homewater net and rod fisheries, including the increasing use of catch and release. The recent upturn in MSW returns means that MSW spawner numbers are now similar to those at the start of the time period. This will be expected to have a disproportionate effect on egg deposition, given the substantially higher fecundity of these larger fish.
63
Salmon Stocks and Fisheries in England and Wales, 2017

Tab
le 2
6. C
on
serv
atio
n L
imit
s (C
L) a
nd
th
e p
erce
nta
ge
of
the
CL
atta
ined
fo
r th
e p
rin
cip
al s
alm
on
riv
ers
in E
ng
lan
d a
nd
Wal
es, 2
008-
2017
. C
urr
ent
com
plia
nce
ag
ain
st t
he
man
agem
ent
ob
ject
ive
and
pre
dic
ted
co
mp
lian
ce in
202
2 ar
e sh
ow
n in
th
e ri
gh
t h
and
co
lum
ns
(see
Bac
kgro
un
d r
epo
rt f
or
det
ails
).
EA
Reg
ion/
NR
W
Riv
erA
cces
sibl
e w
ette
d ar
ea
(ha)
CL
eggs
/ 10
0m2
CL
eggs
(x
106 )
Mgm
t Ta
rget
egg
s (x
106 )
2017
egg
de
posi
tion
(x10
6 )
Per
cent
age
of C
onse
rvat
ion
Lim
it at
tain
ed (%
) [a]
Cur
rent
co
mpl
ianc
e [b
] 20
17
Pre
dict
ed
com
plia
nce
[b]
in 2
022
2008
2009
2010
2011
2012
2013
2014
2015
2016
2017
NE
Coq
uet
144
218
3.14
5.84
5.97
337
185
370
325
366
228
134
9316
019
0P
aRP
aRTy
ne [c
]54
220
811
.25
22.7
745
.33
218
214
519
518
277
436
408
434
541
403
PN
aRP
NaR
Wea
r23
225
05.
8011
.38
17.9
923
618
138
346
032
152
635
119
622
831
0P
NaR
PN
aRTe
es62
024
014
.90
17.0
53.
2055
1414
2150
234
813
21A
RP
aRE
sk-Y
orks
8623
62.
022.
623.
5113
344
120
105
8910
084
7310
017
4P
aRP
NaR
So
uth
ern
Test
138
246
3.40
4.24
4.35
100
6256
6664
6868
137
9912
8P
aRP
NaR
Itch
en69
234
1.63
2.01
1.40
8335
103
9682
6710
912
545
86P
aRP
aRS
WA
von-
Han
ts36
917
56.
487.
314.
0544
4831
5043
6137
5985
63P
aRP
aRS
tour
142
149
2.12
2.18
0.29
1010
711
913
813
1814
AR
AR
Pid
dle
1817
70.
310.
390.
2387
5596
129
5033
2766
6374
PaR
PaR
From
e88
171
1.50
2.22
2.26
161
102
179
239
9357
5213
312
815
1P
aRP
aRA
xe83
175
1.45
1.73
0.23
7451
2558
7726
1637
3716
AR
AR
Exe
282
253
7.14
13.4
77.
6030
519
222
134
127
970
4813
086
106
PaR
PaR
Teig
n98
251
2.47
3.91
2.34
304
9613
317
520
712
310
012
172
95P
aRP
aRD
art
137
218
2.98
4.00
1.29
107
5396
9314
337
1823
5243
AR
PaR
Avo
n-D
evon
3520
20.
700.
920.
4212
057
151
122
127
5069
6364
60P
aRP
aRE
rme
2018
00.
370.
510.
6463
4787
8666
7613
1931
176
PaR
PaR
Yeal
m11
212
0.24
0.28
0.03
4856
8064
5749
2925
2412
AR
AR
Ply
m29
188
0.55
0.67
0.17
7115
5491
4324
3532
730
AR
PaR
Tavy
6820
11.
371.
841.
9610
268
152
8410
264
4513
037
143
PaR
PaR
Tam
ar
293
395
11.5
614
.80
12.5
118
610
413
910
412
674
7711
184
108
PaR
PaR
Lynh
er29
233
0.68
1.13
2.08
131
149
266
104
162
150
7527
717
230
6P
NaR
PN
aRFo
wey
4220
70.
861.
420.
9926
620
634
519
615
326
113
923
510
011
5P
aRP
aRC
amel
5617
60.
981.
960.
9930
117
046
224
114
215
888
8811
210
1P
aRP
aRTa
w27
421
15.
789.
3514
.12
221
158
134
287
199
5210
925
313
924
4P
aRP
NaR
Torr
idge
198
207
4.10
5.08
4.14
128
5880
6813
158
4991
8310
1P
aRP
aRLy
n27
359
0.97
1.74
2.50
305
9022
729
116
685
103
9560
257
PaR
PaR
Mid
lan
ds
Sev
ern
898
143
12.8
519
.09
22.8
012
088
8816
111
315
699
270
196
177
PN
aRP
NaR
NW
Rib
ble
351
202
7.10
10.5
712
.34
276
202
240
210
189
120
124
111
111
174
PaR
PaR
Wyr
e67
730.
490.
590.
1591
4631
4437
1416
232
31A
RP
aRLu
ne42
323
710
.01
13.8
713
.21
213
210
190
190
132
112
9411
111
213
2P
aRP
aR
Salmon Stocks and Fisheries in England and Wales, 2017
64

Ken
t68
223
1.52
2.62
1.73
136
148
326
275
160
138
7055
105
113
PaR
PaR
Leve
n46
182
0.83
1.19
1.04
9542
175
109
5811
917
018
662
125
PaR
PaR
Cra
ke16
194
0.32
0.44
0.19
2857
104
152
119
9145
2913
60P
aRP
aRD
uddo
n (&
Lic
kle)
2612
10.
310.
771.
7078
335
742
754
034
331
617
723
034
254
8P
NaR
PN
aRE
sk20
181
0.37
0.58
0.98
249
7864
176
112
156
147
9818
026
6P
NaR
PN
aRIr
t35
198
0.69
1.03
0.60
158
8119
219
214
316
442
4463
87P
aRP
aRE
hen
4123
00.
941.
981.
7033
521
651
337
122
027
916
275
116
181
PaR
PaR
Cal
der
1326
10.
330.
520.
1415
879
204
174
124
9134
2216
42A
RA
RD
erw
ent
213
185
3.93
6.99
6.37
309
211
306
271
152
144
8258
9016
2P
aRP
aRE
den
688
200
13.7
517
.29
12.8
314
813
912
811
510
565
5299
114
93P
aRP
aRE
sk-B
orde
r [d
]30
625
57.
7911
.15
6.32
164
113
196
191
125
6768
7184
81A
RP
aRW
ales
Wye
1,
721
224
38.5
749
.26
36.9
859
3525
5079
7943
9513
296
PaR
PN
aRU
sk40
724
810
.11
15.0
523
.79
211
9799
137
222
122
9716
022
823
5P
NaR
PN
aRTa
ff &
Ely
146
219
3.19
3.45
0.55
1514
2534
2530
1543
2617
AR
PaR
Ogm
ore
6118
01.
101.
360.
2874
4811
052
4717
3632
2725
AR
AR
Taw
e88
211
1.85
2.35
0.54
9858
114
5534
3724
2628
29A
RA
RTy
wi
500
226
11.3
015
.31
13.2
114
685
178
120
7884
4152
8211
7P
aRP
aRTa
f90
189
1.70
2.67
0.90
115
6826
812
278
5853
8531
53P
aRP
aRE
&W
Cle
ddau
8717
91.
551.
800.
7589
6961
4455
3735
4524
48A
RA
RTe
ifi32
626
58.
6512
.60
6.16
151
8123
515
511
690
8070
6571
PaR
PaR
Rhe
idol
3122
20.
680.
870.
0412
431
3762
4666
3524
306
AR
AR
Nev
ern
1925
90.
480.
590.
5588
3391
5760
8189
127
7211
4P
aRP
aRD
yfi17
923
54.
215.
592.
3612
356
9312
570
2416
2950
56A
RP
aRD
ysin
ni31
216
0.68
0.73
0.07
1313
110
3018
617
2411
PaR
PaR
Maw
ddac
h57
242
1.37
2.02
2.29
148
9923
619
919
973
7510
614
416
7P
aRP
aRD
wyr
yd9
201
0.19
0.34
0.35
357
7252
116
4456
7483
4818
6P
aRP
aRG
lasl
yn25
191
0.48
0.63
0.40
146
106
7812
210
719
310
414
768
84P
aRP
aRD
wyf
awr
3325
80.
861.
020.
0353
1579
4327
1930
1538
4A
RA
RS
eion
t21
226
0.48
0.79
0.20
219
9921
412
715
849
2115
3741
AR
AR
Ogw
en24
362
0.87
1.65
2.29
365
216
347
244
231
112
3913
510
126
5P
aRP
aRC
onw
y63
185
1.17
1.90
2.54
212
153
331
200
164
107
7610
013
421
7P
aRP
aRC
lwyd
8423
71.
993.
430.
9121
210
423
317
513
833
1514
1746
AR
AR
Dee
617
248
15.3
016
.83
11.1
593
106
8085
8779
8068
6673
AR
AR
E &
W T
ota
l26
2.75
369.
7132
9.04
Key
to
com
plia
nce
asse
ssm
ents
:
PN
aR
Pro
babl
y no
t at
ris
k
PaR
P
roba
bly
at r
isk
A
R
At
risk
Key
: [a
] E
stim
ates
incl
ude
eggs
con
trib
uted
by
rod-
rele
ased
fish
.
[b]
Bas
is f
or c
urre
nt a
nd p
redi
cted
com
plia
nce
expl
aine
d in
Bac
kgro
und
Rep
ort
(see
tex
t fo
r de
tails
).
[c]
Pro
visi
onal
sal
mon
cou
nts
now
use
d on
the
Tyn
e to
est
imat
e eg
g de
posi
tion.
[d
] P
rior
to 1
Apr
il 20
05, B
orde
r E
sk e
gg d
epos
ition
est
imat
es w
ere
base
d on
ly
on E
nglis
h ro
d ca
tch
and
likel
y to
be
unde
rses
timat
es.
Not
es:
Som
e en
trie
s in
thi
s ta
ble
have
bee
n up
date
d fr
om t
hat
pres
ente
d in
pre
viou
s re
port
s as
a r
esul
t of
riv
er-s
peci
fic r
efine
men
ts a
nd c
orre
ctio
ns.
O
n so
me
river
s, c
atch
ret
urns
fro
m fi
sher
y ow
ners
(rat
her
than
dec
lare
d ca
tche
s) o
r da
ta f
rom
co
unte
rs/t
raps
hav
e be
en u
sed
to d
eriv
e es
timat
es o
f eg
g de
posi
tion
whe
re t
hese
are
con
side
red
to
prov
ide
the
mos
t co
mpl
ete
reco
rd o
f th
e re
turn
ing
stoc
k.
For
river
s w
here
ass
essm
ents
are
bas
ed o
n de
clar
ed r
od c
atch
dat
a, a
djus
tmen
ts h
ave
been
mad
e si
nce
2015
to
acco
unt
for
redu
ced
leve
ls o
f re
port
ing
(see
tex
t fo
r de
tails
).
Dat
a fo
r 20
17 a
re p
rovi
sion
al.
65
Salmon Stocks and Fisheries in England and Wales, 2017
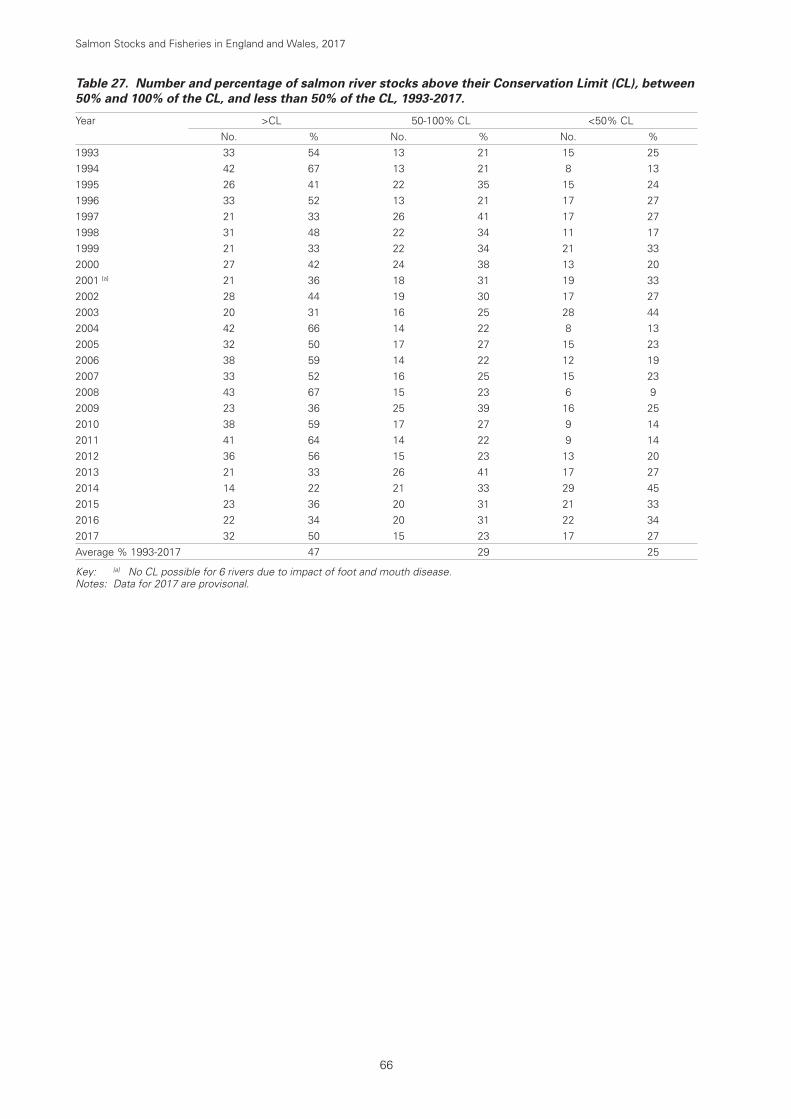
Table 27. Number and percentage of salmon river stocks above their Conservation Limit (CL), between 50% and 100% of the CL, and less than 50% of the CL, 1993-2017.
Year >CL 50-100% CL <50% CLNo. % No. % No. %
1993 33 54 13 21 15 251994 42 67 13 21 8 131995 26 41 22 35 15 241996 33 52 13 21 17 271997 21 33 26 41 17 271998 31 48 22 34 11 171999 21 33 22 34 21 332000 27 42 24 38 13 202001 [a] 21 36 18 31 19 332002 28 44 19 30 17 272003 20 31 16 25 28 442004 42 66 14 22 8 132005 32 50 17 27 15 232006 38 59 14 22 12 192007 33 52 16 25 15 232008 43 67 15 23 6 92009 23 36 25 39 16 252010 38 59 17 27 9 142011 41 64 14 22 9 142012 36 56 15 23 13 202013 21 33 26 41 17 272014 14 22 21 33 29 452015 23 36 20 31 21 332016 22 34 20 31 22 342017 32 50 15 23 17 27Average % 1993-2017 47 29 25
Key: [a] No CL possible for 6 rivers due to impact of foot and mouth disease.Notes: Data for 2017 are provisonal.
Salmon Stocks and Fisheries in England and Wales, 2017
66

© Crown Copyright. All rights reserved. Environment Agency, 100024198 [2018]
Percentage of salmon conservation limit attained in 2017Black fill indicates the percentage of salmon conservation limit attained
Limit met or exceeded
50% of limit attained
Figure 30. Pie charts for individual rivers for which Conservation Limits (CLs) have been set showing the % of the CLs attained in 2017.
67
Salmon Stocks and Fisheries in England and Wales, 2017

0%
20%
40%
60%
80%
100%
1993 1995 1997 1999 2001 2003 2005 2007 2009 2011 20152013 2017
<50% CL
50–100% CL
>CL
Figure 31. Percentage of salmon river stocks exceeding their Conservation Limit (CL), between 50% and 100% of the CL, and less than 50% of the CL, 1993-2017.
Salmon Stocks and Fisheries in England and Wales, 2017
68

© Crown copyright and database rights [2018]. Ordnance Survey licence number 100024198.
Status of salmon population assessed against management objective (probability of achieving objective) in 2017
No management objective
Not at risk (Pr>0.95)Probably not at risk (0.50<Pr<0.95)Probably at risk (0.05>Pr>0.50)At risk (Pr<0.05)
Compliance with management objectives
Figure 32. Status of river catchments in 2017 assessed against the management objective (i.e. that the CL is met or exceeded in at least 4 years out of 5).
69
Salmon Stocks and Fisheries in England and Wales, 2017

Not at risk Probably not at risk Probably at risk At risk
0%
20%
40%
60%
80%
100%
2004 2006 2008 2010 2012 2014 2016 2018 2020 2022
% o
f riv
ers
0%
20%
40%
60%
80%
100%
a) England only
b) Wales only
2004 2006 2008 2010 2012 2014 2016 2018 2020 2022
% o
f riv
ers
Figure 33. Percentage of principal salmon rivers in each risk category, assessed against the management objective, for 2004-2017, and as projected for 2022 for rivers in (a) England and (b) Wales.
Salmon Stocks and Fisheries in England and Wales, 2017
70

0
100,000
200,000
300,000
400,000
500,000
1971
1975
1979
1983
1987
1991
1995
1999
2003
2007
2011
2015
Num
bers
of f
ish
MSW 1SW
Figure 34. Estimated Pre Fishery Abundance (PFA) of salmon from UK (England & Wales), 1971-2017, as derived from the ICES-NEAC PFA model, 2017.
0
50,000
100,000
150,000
200,000
250,000
300,000
1970
No. R
etur
ns/S
paw
ners
1975 1980 1985 1990 1995 2000 2005 2010 2015
Returns Spawners Conservation Limit
Figure 35. Estimated numbers of returning and spawning salmon for UK (England & Wales), 1971-2017, as derived from the ICES-NEAC PFA model, 2017, together with the national conservation limit (derived from the sum of river-specific CLs).
71
Salmon Stocks and Fisheries in England and Wales, 2017

9. FACTORS AFFECTING STOCKS, FISHERIES AND CATCHES
9.1 Management measures
Viewed against historical data, current stock estimates and catches provide ongoing cause for concern and the conservation of salmon remains a priority. As a result, the Environment Agency and Natural Resources Wales have developed a range of new measures to protect salmon stocks in England and Wales. This followed an initial consultation to better understand how further regulation of salmon fishing might help to safeguard stocks. The measures include proposals for closure of many net fisheries (or for requirements to release salmon where a fishery is authorised to continue to operate for sea trout) and for requirements to achieve very high levels of catch-and-release in rod fisheries (including mandatory catch-and-release on rivers with the lowest stock status in England and for all rivers in Wales). Some restrictions have also been proposed on the number, size and type of hooks that can be used when fishing. These proposals have been subject to public consultation and new measures will be implemented through appropriate legislative provisions. Final proposals (post-consultation) will be subject to approval by the regulatory bodies and government; the aim is to introduce the measures in 2019.
In England, reducing the catch of salmon by rods and nets is only one part of the Environment Agency’s larger programme – the Salmon Five Point Approach, which has been jointly developed by the Environment Agency, Defra, its agencies and partner organisations. This sets out actions to address the key pressures that affect the different life stages of salmon. The priorities are:
• Improving marine survival;
• Further reducing exploitation by nets and rods;
• Removing barriers to migration and enhancing habitat;
• Safeguarding sufficient flows; and
• Maximising spawning success by improving water quality.
Progress on actions to address these priorities, and similar activities in Wales, are summarised in the England and Wales Annual Progress Reports to NASCO, available at: http://www.nasco.int/implementation_plans_cycle2.html
A number of measures aimed at better management of this valuable resource have also been implemented or strengthened in England and Wales in recent years. The following provides a brief overview:
• The number of licences issued for nets and fixed engines in all parts of England and Wales has continued to decline as a result of measures taken to reduce levels of exploitation and the declining commercial viability of some fisheries. Overall, the number of net licences has decreased by 76% since 1971.
Salmon Stocks and Fisheries in England and Wales, 2017
72

• The national spring salmon measures introduced in 1999 have reduced the proportion of the net catch taken before June from a 5-year average of 6.7% in the mid-1990’s to 0.3%, on average, from 1999; these latter fish are all required to be released. These measures were renewed for another ten years in December 2008 and are proposed to continue.
• Several net fisheries are being (or have been) phased out because they exploit migratory salmonids returning to more than one river (i.e. mixed stock fisheries). Arrangements have also been made to reduce netting effort in some fisheries by either compensating netsmen not to fish for a particular period (buy-offs), or through voluntary agreement to return salmon alive. Catch limits have also been imposed on some net and fixed engine fisheries. Further restrictions, if approved, will be introduced in 2019.
• In Ireland, action by the Government and fisheries authorities in 2007 imposed new restrictions on their fisheries and ended legal coastal drift netting for salmon. This change is estimated to have resulted in up to 5,000 more grilse returning to homewaters, particularly to rivers in the south and west of England and Wales.
• The national spring salmon measures have also affected rod fisheries. The proportion of the rod catch taken before June fell from a mean of 10.9% over the period 1994–1998 to an average of 6.4% for the period since 1999, and these fish are required to be released.
• Non-statutory restrictions on methods and fishing areas imposed by fishery owners and angling associations include weekly and seasonal bag limits, and there are ongoing efforts to promote catch and release. As a consequence, the proportion of salmon released by anglers has increased steadily from 10% in 1993 to at or above 60% in the last eight years (83%, provisionally, in 2017, the highest in the time series). Tracking studies suggest that, if handled appropriately, the majority (~85%) of released salmon go on to spawn successfully.
9.2 Other factors
Other, non-regulatory, factors may also contribute to changes in stocks and catches, for example, the condition of returning fish, weather conditions, water quality, extreme flow events and the market prices of wild and farmed fish. Further information on these factors is provided in the background report. The following provides brief details of factors pertinent to 2017:
The effect of river flows on angler effort and catches
For rod fisheries, river flow is a key factor affecting angler effort. In 2017, river flows were above the long-term average in March, below average in April and May due to a dry spring, and slightly above or close to the long-term average over the summer and early autumn (Figure 36). However, river flows were typically less variable than in many recent years when periods of the year have experienced particularly wet and dry periods. As such, conditions for angling are likely to have been reasonably favourable in 2017, particularly during the summer and early autumn which is commonly an important period for many rod fisheries. This, in turn, may have affected angler fishing effort.
73
Salmon Stocks and Fisheries in England and Wales, 2017

Monthly rod catch data for the majority of the rivers featured in Figure 36, expressed in the same format as the flow data, as a percentage of the long-term average, are presented in Figure 37. This excludes the River Cynon, which has no catch of salmon, and includes the catch for the whole River Tyne rather than just the South Tyne tributary. The long-term average for the rod data has only been extended back as far as 1999, which is when the national measures were introduced imposing compulsory catch and release in the early part of the season. Fishing patterns are likely to have been different prior to this time. The monthly rod catch data have also been restricted to the period February to October, since for most rivers fishing seasons do not extend outside this period.
Median monthly rod catches in 2017 were below the long-term average in February and March, close to the long-term average for much of the spring and summer (April to August inclusive), but then well below average at the end of the fishing season in September and October. The particularly low catches in February and March need to be treated with caution since there is relatively little fishing at this time of year, catches are typically very small and fishing is restricted to only some rivers. The above average catches in spring and summer, probably reflect, in part at least, the improved returns of MSW salmon, many of which return earlier in the year. The low abundance of 1SW salmon (Figure 19) is likely to have been the main factor affecting the relatively poor late season catches. It is important to remember that differing proportions of 1SW and MSW fish in the runs and the timing of the return migrations of these fish will also have an impact on catch rates, in addition to river flows.
First sale price of salmon
The first sale price of salmon has potential implications for fishing effort and the economic viability of those net fisheries that target these fish. The average monthly price of wild salmon varies seasonally, reflecting both availability and the size of fish. Figure 38 provides an indication of trends in the first sale price of both wild and farmed salmon since 1978. The data are provided for a single month, August; data for 2017 are not available. Further discussion on these price changes is provided in the background report.
Salmon Stocks and Fisheries in England and Wales, 2017
74

% o
f lon
g-te
rm a
vera
ge
0
50
150
100
200
250
350
300
Jan Jun Jul Aug Sep Oct Nov Dec Feb Mar Apr May
Solid line displays 2017 median value for selected rivers. Dashed line denotes long-term average.
Figure 36. Monthly mean river flows (cubic metres per second) in 2017 for 12 rivers (South Tyne, Itchen, Avon, Exe, Taw, Severn, Wye, Cynon, Teifi, Dee, Lune and Eden) in England & Wales, expressed as a percentage of the long-term average on each river for the same month. (Data supplied courtesy of the National River Flow Archive at the Centre for Ecology and Hydrology.) The long-term average is calculated for the available time series, which varies from river to river, but is in the range of 25-40 years.
% o
f lon
g-te
rm a
vera
ge
0
50
100
150
200
300
250
Jan Jun Jul Aug Sep Oct Nov Dec Feb Mar Apr May
Solid line displays 2017 median value for selected rivers. Dashed line denotes long-term average.
Figure 37. Monthly rod catches in 2017 for 11 rivers (Tyne, Itchen, Avon, Exe, Taw, Severn, Wye, Teifi, Dee, Lune and Eden) in England & Wales, expressed as a percentage of the long-term average on each river for the same month. The long-term average is derived from data for the period since 1999.
75
Salmon Stocks and Fisheries in England and Wales, 2017

0
5
10
15
20
25 Pr
ice
(£/K
g)
1977 19871982 1992 1997 2002 2007 2012 2017
Farmed August Price £/kg Wild August Price £/kg
Figure 38. The average price of farmed salmon and wild Scottish salmon sold in August at Billingsgate, London, 1978 to 2016.
Salmon Stocks and Fisheries in England and Wales, 2017
76

10. EXISTING AND EMERGING THREATS TO SALMON POPULATIONS
Further information on the various factors impacting on salmon stocks in England and Wales, and progress with actions to protect and enhance these stocks, is reported in the NASCO Implementation Plan and in the annual progress reports to NASCO. These reports are available at: http://www.nasco.int/implementation_plans_cycle2.html. Some additional information is also available in the background report. The following provides brief details on three issues:
Red Vent Syndrome and other diseases
The occurrence of salmon returning to rivers in England and Wales with swollen and/or bleeding vents has been noted since 2004. The condition, referred to as Red Vent Syndrome (RVS), has continued to be observed since this time, and has been subject to ongoing monitoring. Monitoring programmes on salmon ‘index’ rivers provide the most consistent measure of the incidence of RVS. Since 2007, this consistency has been improved through the introduction of a system whereby symptoms have been classified according to their apparent severity (with samplers referring to a set of standard photographs and descriptions to assist their judgement). Available time series of RVS incidence in returning fish are presented in Table 28 for the Rivers Tyne, Tamar, Dee, Lune and Caldew (a tributary of the River Eden). However, no sampling has been possible at one of these sites in the last four years and sampling effort has been substantially reduced at two others. The relatively high reported incidence of RVS for the River Lune in 2017 is understood to include a greater proportion of fish than usual exhibiting mild symptoms of the disease.
Fish affected by RVS show a degree of recovery in freshwater and appear to be able to spawn successfully.
In response to increased reports of fungal (Saprolegnia) infections in salmon (and sea trout), the Environment Agency and Natural Resources Wales continue to monitor disease problems in all the major salmon rivers across England and Wales. Over the last decade, there have been increased reports of fish infected with Saprolegnia. In some rivers, resulting mortalities have been above those considered usual from this disease. At a national level, relatively few instances of Saprolegnia were reported in 2017, although the number of reports of the disease were higher for some rivers than in 2016. In most cases, the reports received were within expected ‘natural’ levels, although higher and more persistent levels of Saprolegnia have been recorded in recent years in rivers in the south-west of England. The Environment Agency has part funded a collaborative project with Cardiff University to further improve the understanding of Saprolegnia and to help identify potential drivers for infection that could explain recent observations.
Poor juvenile recruitment in 2016
The densities of juvenile salmon, and 0+ salmon fry in particular, were very low in English and Welsh rivers in 2016 and well below long-term averages. Abnormal conditions associated with severe storms and abnormally high winter temperatures, as well as low numbers of spawners, particularly in rivers where 1SW fish normally comprise the main component of the run, are believed to have contributed to this. A more detailed appraisal of this issue was included in last year’s assessment report. It is noteworthy, however, that the smolt run estimate for the River Frome in 2017 (Table 23), where almost all smolts migrate at one year old, was the lowest in the time series. This is consistent with the poor recruitment in 2016. For rivers where the majority of smolts migrate as two-year-olds, smolt output may well be below average in 2018.
77
Salmon Stocks and Fisheries in England and Wales, 2017

Pink Salmon
There have been occasional reports of pink salmon captures in England and Wales in previous years. Most recent reports have occurred in odd years (e.g. 2007, 2009 and 2015) consistent with the fish originating from established populations of pink salmon in northern parts of the Russian Federation and northern Norway. Pink salmon have a strict two-year life-cycle and thus have distinct populations breeding in even and odd years. It is principally only odd year populations that have established in these areas.
In 2017, there were widespread reports of pink salmon captures across North Atlantic countries (ICES, 2018). Relatively large numbers of pink salmon (perhaps around 200) were taken in the English north east coast fishery and there were also reports of fish being captured in a number of river systems across the country. In Scotland, pink salmon were observed spawning in some rivers and eggs are known to have hatched successfully. It is, as yet, unclear whether the marked increase in pink salmon numbers in 2017 represented a one-off occurrence, due to particularly favourable conditions for a particular cohort of fish, or whether this might mark the start of a wider range expansion by the species.
A small sample of frozen pink salmon (9 fish) arising from captures in rivers in the north-east and south-west of England were subject to post-mortem examination. Although the freezing of samples limited comprehensive assessment of parasites, a number of common metazoan species were recovered. All samples were found to be negative for the viruses Infectious Haematopoietic Necrosis (IHN), Viral Haemorrhagic Septicaemia (VHS), Infectious Salmon Anaemia virus (ISA) and Infectious Pancreatic Necrosis (IPN).
Table 28. Percentage of returning salmon showing signs of Red Vent Syndrome in monitored rivers in England and Wales, 2004–2017.
River Tyne # Tamar Dee Lune Caldew #Region/NRW NE SW N. Wales NW NWSample source Upper river
broodstockLower river trap Lower river trap Lower river trap Sub-catchment trap
% incidence of RVS in returning fish2004 0.42005 3.2 02006 9.2 1.42007 1.4 60.2 29.9 23.1 5.3 [a]
2008 0.8 45.3 20.9 24.7 0.3 [a]
2009 3.4 41.5 28.2 21.2 10.22010 5.3 57.1 23.7 18.8 5.12011 3.8 45.6 10.9 16.3 6.42012 5.2 26.1 13.2 0 [a] 6.12013 10.1 44.5 # 20.5 41.6 0.8 [a]
2014 7.5 n/a 25.3 9.5 # n/a 2015 10.3 35.5 # 24.4 13.6 # n/a 2016 3.5 24.6 # 21.7 19.0 # n/a 2017 4.9 17.7 # 22.5 60.2 # n/a
Note: Except where indicated (#), these estimates are based on fish sampled over a common (June-October) period and have been weighted according to monthly run totals. Three of the traps (not the Caldew) are located at or close to head-of-tide.
The relatively high reported incidence of RVS for the River Lune in 2017 is understood to include a greater proportion of fish than usual exhibiting mild symptoms of the disease.
[a] Considered minimum values.
Salmon Stocks and Fisheries in England and Wales, 2017
78
11. REFERENCES
Environment Agency, 2017. Salmonid and freshwater fisheries statistics for England and Wales, 2016, 42 pp. https://www.gov.uk/government/collections/salmonid-and-freshwater-fisheries-statistics
ICES. 2018. Report of the Working Group on North Atlantic Salmon. ICES CM 2018/ACOM:21, 386pp.
Potter, E.C.E., Crozier, W.W., Schön, P-J., Nicholson, M.D., Prévost, E., Erkinaro, J., Gudbergsson, G., Karlsson, L., Hansen, L.P., Maclean, J.C., Ó Maoiléidigh, N. and Prusov S. 2004. Estimating and forecasting pre-fishery abundance of Atlantic salmon (Salmo salar L.) in the north-east Atlantic for the management of mixed stock fisheries. ICES Journal of Marine Science 61: 1359-1369.
79
Salmon Stocks and Fisheries in England and Wales, 2017
ANNEX 1. NASCO’s request for scientific advice from ICES in 2018
1. With respect to Atlantic salmon in the North Atlantic area:
1.1 provide an overview of salmon catches and landings by country, including unreported catches and catch and release, and production of farmed and ranched Atlantic salmon in 20171;
1.2 report on significant new or emerging threats to, or opportunities for, salmon conservation and management2;
1.3 provide a review of examples of successes and failures in wild salmon restoration and rehabilitation and develop a classification of activities which could be recommended under various conditions or threats to the persistence of populations3;
1.4 provide a compilation of tag releases by country in 2017; and
1.5 identify relevant data deficiencies, monitoring needs and research requirements.
2. With respect to Atlantic salmon in the North-East Atlantic Commission area:
2.1 describe the key events of the 2017 fisheries4;
2.2 review and report on the development of age-specific stock conservation limits including updating the time series of the number of river stocks with established CL’s by jurisdiction;
2.3 describe the status of the stocks including updating the time series of trends in the number of river stocks meeting CL’s by jurisdiction;
2.4 provide catch options or alternative management advice for the 2018/19-2020/21 fishing seasons, with an assessment of risks relative to the objective of exceeding stock conservation limits, or pre-defined NASCO Management Objectives, and advise on the implications of these options for stock rebuilding5; and
2.5 update the Framework of Indicators used to identify any significant change in the previously provided multi-annual management advice.
3. With respect to Atlantic salmon in the North American Commission area:
3.1 describe the key events of the 2017 fisheries (including the fishery at St Pierre and Miquelon)4;
3.2 update age-specific stock conservation limits based on new information as available including updating the time series of the number of river stocks with established CL’s by jurisdiction;
3.3. describe the status of the stocks including updating the time series of trends in the number of river stocks meeting CL’s by jurisdiction;
3.4 provide catch options or alternative management advice for 2018-2021 with an assessment of risks relative to the objective of exceeding stock conservation limits, or pre-defined NASCO Management Objectives, and advise on the implications of these options for stock rebuilding5; and
3.5 update the Framework of Indicators used to identify any significant change in the previously provided multi-annual management advice.
Salmon Stocks and Fisheries in England and Wales, 2017
80

4. With respect to Atlantic salmon in the West Greenland Commission area:
4.1 describe the key events of the 2017 fisheries4;
4.2 describe the status of the stocks6;
4.3 provide catch options or alternative management advice for 2018-2020 with an assessment of risk relative to the objective of exceeding stock conservation limits, or pre-defined NASCO Management Objectives, and advise on the implications of these options for stock rebuilding5; and
4.4 update the Framework of Indicators used to identify any significant change in the previously provided multi-annual management advice.
Notes:
1. With regard to question 1.1, for the estimates of unreported catch the information provided should, where possible, indicate the location of the unreported catch in the following categories: in-river; estuarine; and coastal. Numbers of salmon caught and released in recreational fisheries should be provided.
2. With regard to question 1.2, ICES is requested to include reports on any significant advances in understanding of the biology of Atlantic salmon that is pertinent to NASCO, including information on any new research into the migration and distribution of salmon at sea and the potential implications of climate change for salmon management.
3. With respect to question 1.3, NASCO is aware that the WGERAAS final report is being prepared and will be submitted to ICES in 2017.
4. In the responses to questions 2.1, 3.1 and 4. 1, ICES is asked to provide details of catch, gear, effort, composition and origin of the catch and rates of exploitation. For homewater fisheries, the information provided should indicate the location of the catch in the following categories: in-river; estuarine; and coastal. Information on any other sources of fishing mortality for salmon is also requested. For 4.1 ICES should review the results of the recent phone surveys and advise on the appropriateness for incorporating resulting estimates of unreported catch into the assessment process.
5. In response to questions 2.4, 3.4 and 4.3, provide a detailed explanation and critical examination of any changes to the models used to provide catch advice and report on any developments in relation to incorporating environmental variables in these models.
6. In response to question 4.2, ICES is requested to provide a brief summary of the status of North American and North-East Atlantic salmon stocks. The detailed information on the status of these stocks should be provided in response to questions 2.3 and 3.3.
81
Salmon Stocks and Fisheries in England and Wales, 2017
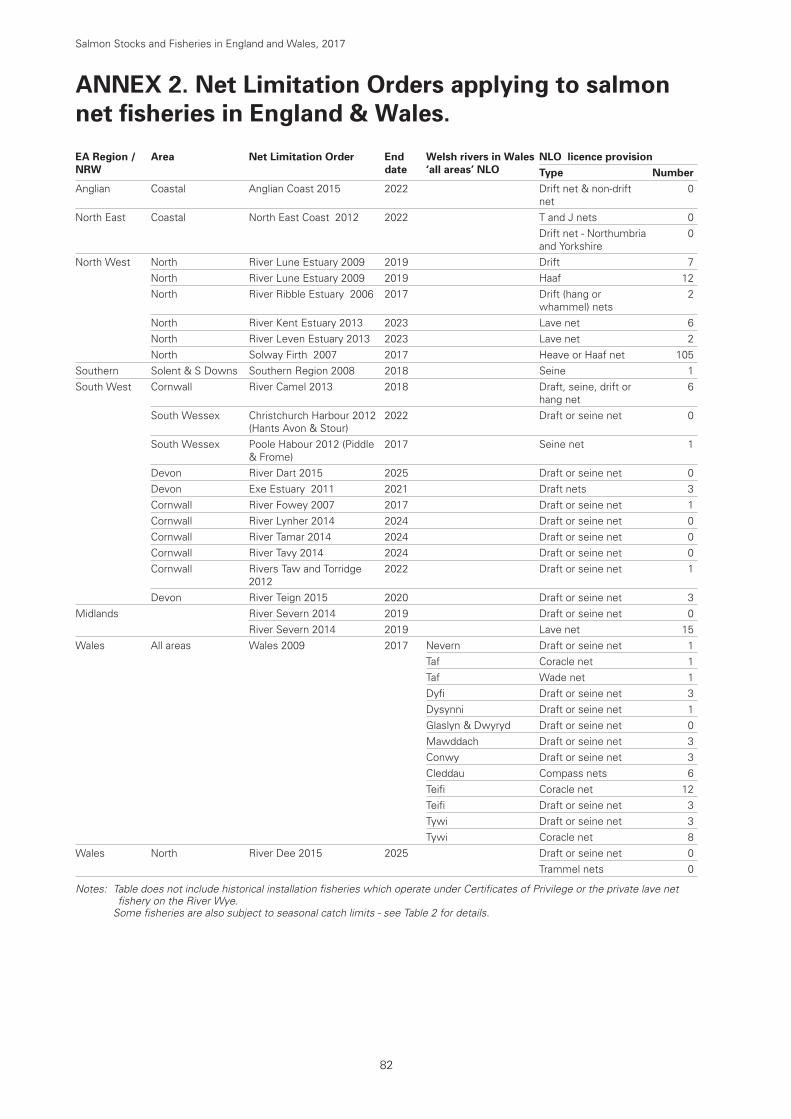
ANNEX 2. Net Limitation Orders applying to salmon net fisheries in England & Wales.
EA Region / NRW
Area Net Limitation Order End date
Welsh rivers in Wales ‘all areas’ NLO
NLO licence provisionType Number
Anglian Coastal Anglian Coast 2015 2022 Drift net & non-drift net
0
North East Coastal North East Coast 2012 2022 T and J nets 0Drift net - Northumbria and Yorkshire
0
North West North River Lune Estuary 2009 2019 Drift 7North River Lune Estuary 2009 2019 Haaf 12North River Ribble Estuary 2006 2017 Drift (hang or
whammel) nets2
North River Kent Estuary 2013 2023 Lave net 6North River Leven Estuary 2013 2023 Lave net 2North Solway Firth 2007 2017 Heave or Haaf net 105
Southern Solent & S Downs Southern Region 2008 2018 Seine 1South West Cornwall River Camel 2013 2018 Draft, seine, drift or
hang net6
South Wessex Christchurch Harbour 2012 (Hants Avon & Stour)
2022 Draft or seine net 0
South Wessex Poole Habour 2012 (Piddle & Frome)
2017 Seine net 1
Devon River Dart 2015 2025 Draft or seine net 0Devon Exe Estuary 2011 2021 Draft nets 3Cornwall River Fowey 2007 2017 Draft or seine net 1Cornwall River Lynher 2014 2024 Draft or seine net 0Cornwall River Tamar 2014 2024 Draft or seine net 0Cornwall River Tavy 2014 2024 Draft or seine net 0Cornwall Rivers Taw and Torridge
20122022 Draft or seine net 1
Devon River Teign 2015 2020 Draft or seine net 3Midlands River Severn 2014 2019 Draft or seine net 0
River Severn 2014 2019 Lave net 15Wales All areas Wales 2009 2017 Nevern Draft or seine net 1
Taf Coracle net 1Taf Wade net 1Dyfi Draft or seine net 3Dysynni Draft or seine net 1Glaslyn & Dwyryd Draft or seine net 0Mawddach Draft or seine net 3Conwy Draft or seine net 3Cleddau Compass nets 6Teifi Coracle net 12Teifi Draft or seine net 3Tywi Draft or seine net 3Tywi Coracle net 8
Wales North River Dee 2015 2025 Draft or seine net 0Trammel nets 0
Notes: T able does not include historical installation fisheries which operate under Certificates of Privilege or the private lave net fishery on the River Wye.
Some fisheries are also subject to seasonal catch limits - see Table 2 for details.
Salmon Stocks and Fisheries in England and Wales, 2017
82

ANNEX 3. Byelaws applying to salmon rod fisheries in England and Wales.
EA Region / NRW
River Salmon Season (inclusive dates)
*Method Restrictions *Bag limits/Catch and Release etc.
Effective from (date); expires (date)
NE Aln 1.2 -31.10Coquet 1.2 -31.10Tyne 1.2 -31.10Wear 1.2 -31.10Tees 1.2 -31.10Esk (Yorks.) 6.4 -31.10Ouse (Yorks.)
6.4 -31.10
Anglian Region 1.3 -28.9 Thames Thames 1.4 -30.9 2 salmon bag limit a daySW Avon
(Hants.)1.2 -31.8 Artificial fly only before
15/5Piddle 1.3 -31.8 Artificial fly only before
15/5Frome 1.3 -31.8 Artificial fly only before
15/5Axe 15.3 -31.10 No shrimp, prawn, worm
or maggot. Fly only after 31/7 below Axbridge
Exe 14.2 -30.9 (trial extension to 14.10)
No worm or maggot Fly only and mandatory catch and release during trial extension period.
Teign 1.2 -30.9 No worm or maggot before 1/6
Dart 1.2 -30.9 No worm or maggot. No shrimp/prawn etc. below Staverton Bridge.
Avon (Devon)
15.4 -30.11 No worm or maggot
Plym 1.4 -15.12 No worm, maggot, shrimp or prawn after 31/8
Tavy 1.3 -14.10 No worm, maggot, shrimp or prawn after 31/8
Tamar 1.3 -14.10 No worm, maggot, shrimp or prawn after 31/8
Lynher 1.3 -14.10 No worm, maggot, shrimp or prawn after 31/8
Fowey 1.4 -15.12Camel 1.4 -15.12Taw 1.3 -30.9 No shrimp, prawn, worm
or maggot. Fly only 1/4 to 31/5
Numbers for Taw, Torridge in brackets: 2 (2) salmon a day, 3 (2) a week and 10 ( 7 ) a season, (2 salmon limit before June 1st) & return of all salmon > 70 cm after Aug 1st.
Torridge 1.3 -30.9 No shrimp, prawn, worm or maggot. Fly only 1/4 to 31/5
Lyn 1.2 -31.10 No worm or maggot before 1/6
Yealm 1.4 -15.12 No worm, maggot, shrimp or prawn after 31/8
Midlands Severn 1.2 -7.10 No float fishing with lure or bait
83
Salmon Stocks and Fisheries in England and Wales, 2017
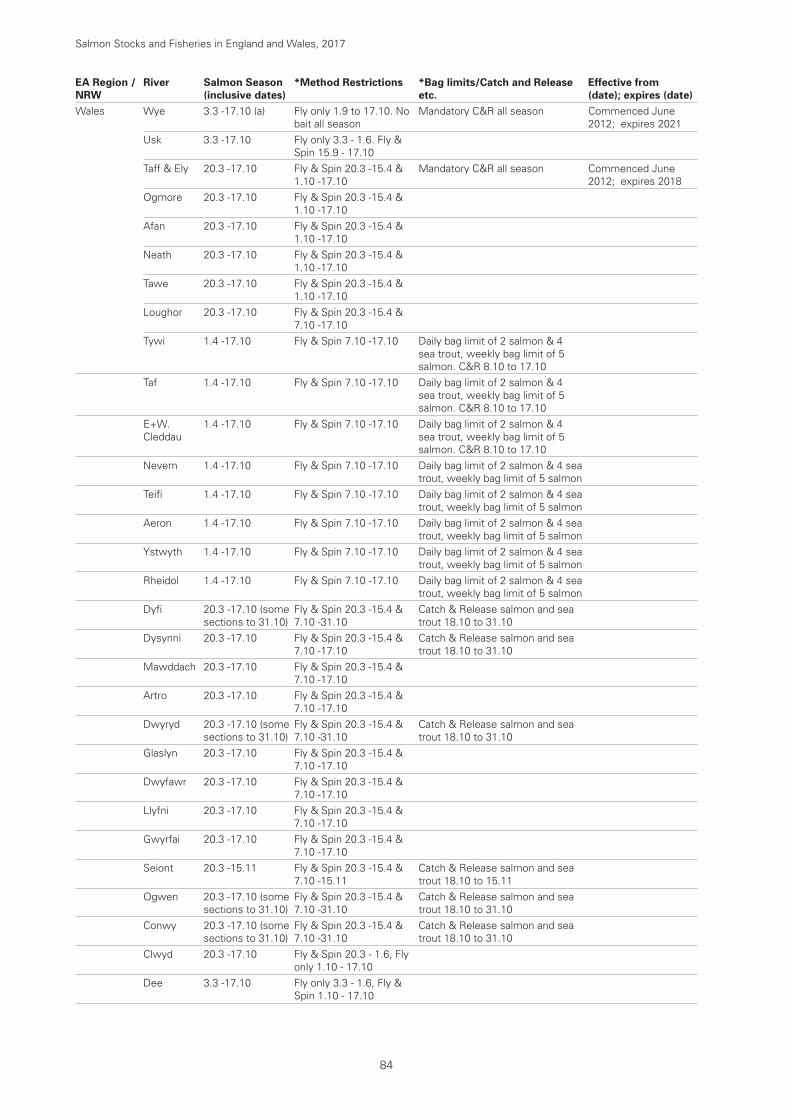
EA Region / NRW
River Salmon Season (inclusive dates)
*Method Restrictions *Bag limits/Catch and Release etc.
Effective from (date); expires (date)
Wales Wye 3.3 -17.10 (a) Fly only 1.9 to 17.10. No bait all season
Mandatory C&R all season Commenced June 2012; expires 2021
Usk 3.3 -17.10 Fly only 3.3 - 1.6. Fly & Spin 15.9 - 17.10
Taff & Ely 20.3 -17.10 Fly & Spin 20.3 -15.4 & 1.10 -17.10
Mandatory C&R all season Commenced June 2012; expires 2018
Ogmore 20.3 -17.10 Fly & Spin 20.3 -15.4 & 1.10 -17.10
Afan 20.3 -17.10 Fly & Spin 20.3 -15.4 & 1.10 -17.10
Neath 20.3 -17.10 Fly & Spin 20.3 -15.4 & 1.10 -17.10
Tawe 20.3 -17.10 Fly & Spin 20.3 -15.4 & 1.10 -17.10
Loughor 20.3 -17.10 Fly & Spin 20.3 -15.4 & 7.10 -17.10
Tywi 1.4 -17.10 Fly & Spin 7.10 -17.10 Daily bag limit of 2 salmon & 4 sea trout, weekly bag limit of 5 salmon. C&R 8.10 to 17.10
Taf 1.4 -17.10 Fly & Spin 7.10 -17.10 Daily bag limit of 2 salmon & 4 sea trout, weekly bag limit of 5 salmon. C&R 8.10 to 17.10
E+W.Cleddau
1.4 -17.10 Fly & Spin 7.10 -17.10 Daily bag limit of 2 salmon & 4 sea trout, weekly bag limit of 5 salmon. C&R 8.10 to 17.10
Nevern 1.4 -17.10 Fly & Spin 7.10 -17.10 Daily bag limit of 2 salmon & 4 sea trout, weekly bag limit of 5 salmon
Teifi 1.4 -17.10 Fly & Spin 7.10 -17.10 Daily bag limit of 2 salmon & 4 sea trout, weekly bag limit of 5 salmon
Aeron 1.4 -17.10 Fly & Spin 7.10 -17.10 Daily bag limit of 2 salmon & 4 sea trout, weekly bag limit of 5 salmon
Ystwyth 1.4 -17.10 Fly & Spin 7.10 -17.10 Daily bag limit of 2 salmon & 4 sea trout, weekly bag limit of 5 salmon
Rheidol 1.4 -17.10 Fly & Spin 7.10 -17.10 Daily bag limit of 2 salmon & 4 sea trout, weekly bag limit of 5 salmon
Dyfi 20.3 -17.10 (some sections to 31.10)
Fly & Spin 20.3 -15.4 & 7.10 -31.10
Catch & Release salmon and sea trout 18.10 to 31.10
Dysynni 20.3 -17.10 Fly & Spin 20.3 -15.4 & 7.10 -17.10
Catch & Release salmon and sea trout 18.10 to 31.10
Mawddach 20.3 -17.10 Fly & Spin 20.3 -15.4 & 7.10 -17.10
Artro 20.3 -17.10 Fly & Spin 20.3 -15.4 & 7.10 -17.10
Dwyryd 20.3 -17.10 (some sections to 31.10)
Fly & Spin 20.3 -15.4 & 7.10 -31.10
Catch & Release salmon and sea trout 18.10 to 31.10
Glaslyn 20.3 -17.10 Fly & Spin 20.3 -15.4 & 7.10 -17.10
Dwyfawr 20.3 -17.10 Fly & Spin 20.3 -15.4 & 7.10 -17.10
Llyfni 20.3 -17.10 Fly & Spin 20.3 -15.4 & 7.10 -17.10
Gwyrfai 20.3 -17.10 Fly & Spin 20.3 -15.4 & 7.10 -17.10
Seiont 20.3 -15.11 Fly & Spin 20.3 -15.4 & 7.10 -15.11
Catch & Release salmon and sea trout 18.10 to 15.11
Ogwen 20.3 -17.10 (some sections to 31.10)
Fly & Spin 20.3 -15.4 & 7.10 -31.10
Catch & Release salmon and sea trout 18.10 to 31.10
Conwy 20.3 -17.10 (some sections to 31.10)
Fly & Spin 20.3 -15.4 & 7.10 -31.10
Catch & Release salmon and sea trout 18.10 to 31.10
Clwyd 20.3 -17.10 Fly & Spin 20.3 - 1.6, Fly only 1.10 - 17.10
Dee 3.3 -17.10 Fly only 3.3 - 1.6, Fly & Spin 1.10 - 17.10
Salmon Stocks and Fisheries in England and Wales, 2017
84

EA Region / NRW
River Salmon Season (inclusive dates)
*Method Restrictions *Bag limits/Catch and Release etc.
Effective from (date); expires (date)
NW Ribble 1.2 -31.10 Byelaw - no more than two salmon may be killed between 16.6 and 31.10
20.06.2017 – 19.06.2027
Wyre 1.2 -31.10 Lune 1.2 -31.10 Byelaw - no more than four salmon
may be killed during the season. 26.11.2009 – 26.11.2019
Kent 1.2 -31.10 Leven 1.2 -31.10 Byelaw requiring release of all
salmon after capture. Derogation allows anglers to take some fish (currently 3 for whole season) provided these marked with carcass tag.
10.06.2016 – 09.06.2026
Crake 1.2 -31.10 Byelaw requiring release of all salmon after capture. Derogation allows anglers to take some fish (currently 3 for whole season) provided these marked with carcass tag.
10.06.2016 – 09.06.2026
Duddon 1.2 -31.10 Esk (Cumb.)
1.2 -31.10
Irt 1.2 -31.10 Calder 1.2 -31.10 Ehen 1.2 -31.10 Derwent 1.2 -31.10 Ellen 1.2 -31.10 Eden 15.1 -14.10 Byelaw - 2 salmon bag limit a day
between between 16.6 and 14.1013.11.2007 – 12.11.2017
Byelaw - prohibits retention of female salmon 10.9 to 14.10
13.11.2007 – 12.11.2017
Esk (Border)
1.2 -31.10 Byelaw - 2 salmon bag limit a day between 16.6 and 31.10
13.11.2007 – 12.11.2017
Byelaw - prohibits retention of female salmon 10.9 to 31.10
13.11.2007 – 12.11.2017
Others 1.2 -31.10 (b)
Notes: (a) Season 3.3 to 25.10 Rivers Irfon, Ithon and main River Wye upstream of Llanwrthwl Bridge (b) Applies to all other watercourses in the North West not named specifically above. * National spring salmon byelaws apply. Natural Resources Wales – variations apply to Anglesey and the Lleyn Peninsula (check local byelaws). Always check local byelaws before fishing.
85
Salmon Stocks and Fisheries in England and Wales, 2017

Centre for Environment, Fisheries & Aquaculture ScienceLowestoft LaboratoryPakefield RoadLowestoftSuffolkNR33 0HTwww.cefas.co.uk
Tel: 01502 562244Twitter: @cefasgovuk
Environment AgencyNational Customer Contact CentrePO Box 544RotherhamS60 1BYwww.Gov.uk
Tel: 03708 506 506 (Mon-Fri, 8am – 6pm)Email: [email protected]: https://www.facebook.com/environmentagencyTwitter: https://twitter.com/envagency
Cyfoeth Naturiol Cymru /Natural Resources WalesCambria House29 Newport RoadCardiffCF24 0TP.www.naturalresourceswales.gov.uk
Tel: Customer contact centre 0300 065 3000 Email: [email protected]: www.facebook.com/NatResWalesTwitter: @NatResWales
Front cover images (clockwise from top left)
1 – Rotary screw trap on the River Tyne (photo courtesy of Environment Agency)2 – T net at South Shields (photo courtesy of Environment Agency)3 – Salmon smolt from the River Frome (photo courtesy of Game and Wildlife Conservation Trust)4 – Salmon crossing the River Test Nursling fish counter (photo courtesy of Environment Agency)
1 2
4 3