north pacific salmon fisheries economic measurement estimates · north pacific salmon fisheries...
TRANSCRIPT

North Pacific Salmon Fisheries Economic Measurement Estimates
Chinook (Oncorhynchus tshawytscha)
Chum (Oncorhynchus keta)
Coho (Oncorhynchus kisutch)
Pink (Oncorhynchus gorbuscha)
Sockeye (Oncorhynchus nerka)
Cherry (Oncorhynchus masou)
Notes: Depicted fish size relational to each other is correct for average North Pacific harvests.Sources: Photos courtesy of BC Salmon Marketing Council and FishPix (cherry photo by T.
Suzuki KPM-NR0000085).
Wild Salmon CenterPortland, Oregon

North Pacific Salmon Fisheries Economic Measurement Estimates
Version 1.2
prepared by
The Research GroupCorvallis, Oregon
prepared for
Wild Salmon CenterPortland, Oregon
December 2009

i D:\Data\Documents \swd\WSC North Pacific salmon.doc
ACKNOWLEDGEMENTS
This project was sponsored by the Wild Salmon Center (WSC). The projectparticipants wish to recognize the project manager Brian Caouette (SeniorProgram Manager, WSC Sustainable Fisheries Program) for his thoughtfulguidance. Dr. Hans Radtke (natural resource economic consultant) assisted in theproject documentation and provided the regional economic model relationships.His participation was critical for the level of investigation the project resourcesallowed. Many other individuals in government, academia, private consulting,and the salmon fishing industry provided input about the study area fisheries andseafood markets. They deserve thanks, but in an anonymous fashion becausepermission was not sought for revealing their names.
This report was reviewed in draft form for the purpose of providing candid andcritical comments that were to assist in making study results as sound as possibleand to ensure that the report meets standards for objectivity, evidence, andresponsiveness to the study charges. Although the reviewers have provided manyuseful comments and suggestions, they were not asked to endorse study findingsand recommendations. The authors are solely responsible for making certainindependent examination of this report was carried out in accordance withaccustomed procedures and that review comments were carefully considered.
The authors' interpretations and conclusions should prove valuable for thisproject's purpose, but no absolute assurances can be given that the describedresults will be realized. Government legislation and policies, marketcircumstances, and other situations can affect the basis of assumptions inunpredictable ways and lead to unanticipated changes. The information shouldnot be used for investment or operational decision making. The authors do notassume any liability for the information and shall not be responsible for anydirect, indirect, special, incidental, or consequential damages in connection withthe use of the information.
Authorization is granted for the study report's contents to be quoted either orallyor in written form without prior consent of the authors. Customary reference toauthorship, however, is requested.

ii D:\Data\Documents \swd\WSC North Pacific salmon.doc
TABLE OF CONTENTS
Acknowledgements.......................................................................................................................... iTable of Contents............................................................................................................................ iiList of Acronyms and Abbreviations ............................................................................................. iii
Executive Summary.........................................................................................................................1
A. Background ..........................................................................................................................2
B. Harvest and Abundance Data Sources .................................................................................3
C. Economic Measurements and Models .................................................................................4
D. Economic Measurement Estimates ......................................................................................51. Harvests2. Economic Value3. Markets
E. Illegal, Unreported, and Unregulated Catch ........................................................................6
F. Hatchery Production ............................................................................................................7
G. Measurement Uncertainties and Research Recommendations ............................................9
H. Bibliography ......................................................................................................................10
List of Tables and Figures
Table 1: North Pacific Harvests and Economic Value Measurement in 2005 to 2007Table 2: Economic Modeling Assumptions and Derived Results in 2005 to 2007Table 3: Hatchery Releases of Salmon Fry and Smolts by Species and Country in 2006
Figure 1: North Pacific Salmon Abundance Estimates by Natural and Hatchery Origin for1990 through 2007
Figure 2: Salmon Natural and Hatchery Abundance Trends in 1990 to 2005Figure 3: North Pacific Salmon Abundance Natural and Hatchery Origin Share by Species
in 2005Figure 4: North Pacific Salmon Abundance Hatchery Origin Proportion by Rearing Region
for 1990 to 2005Figure 5: North Pacific Salmon Regional Economic Contributions in 2005 to 2007Figure 6: Alaska Commercial Salmon Price Trends in 1994 to 2008Figure 7: Currency Trends in 1999 to 2008Figure 8: Japanese Wholesale Prices of Alaska Wild and Chilean Aquaculture Frozen
Salmon Products in 1990 to 2006
Appendix

iii D:\Data\Documents \swd\WSC North Pacific salmon.doc
LIST OF ACRONYMS AND ABBREVIATIONS
CWT coded wire tag
EEZ exclusive economic zone
FAO Food and Agriculture Organization of the United Nations
IUU illegal, unreported, and unregulated catch
MALBEC Model for Assessing Links Between Ecosystems
NPAFC North Pacific Anadromous Fish Commission
SAFE Select Area Fishery Enhancement
SAR smolt-to-adult return rate
SAUP Sea Around Us Project
TRG The Research Group
WSC Wild Salmon Center

1 D:\Data\Documents \swd\WSC North Pacific salmon.doc
NORTH PACIFIC SALMON FISHERIES ECONOMIC MEASUREMENT ESTIMATES
EXECUTIVE SUMMARY
The Wild Salmon Center desired desk level, first order estimates for North Pacificcommercial salmon fisheries economic measures. The measures were to include directeffects (fish numbers, volume, and harvest/first wholesale value) and were to includecomparable indicators so that the importance of salmon fishing industry could be shownwithin regional economies. The proportional share of the effects from salmon origin(natural or hatchery) was also of interest. These measurements are not universallyavailable for all fisheries and it was necessary to use proxy modeling, scale-up methods,and impute information to fill gaps in limited spatial and temporal measurements torepresent area-wide estimates.
Value at the harvest level (ex-vessel value) was a particularly vexing statistic to procure.It was necessary to use Alaska reported ex-vessel prices to fill gaps. This is a reasonableapproach because fish products are exchanged in world markets and the U.S. is a majorproducer as well as export/import trader. (Alaska dominates U.S. salmon production.)World market price determination factors are going to be reflected in U.S. seafoodtrading prices. Also, it was not possible to develop economic regional impact models forthe investigation. Instead, a model for Alaska was used to proxy effects in othercountries. Using Alaska fishing industry modeling is apropos because many similarharvest species, fishing techniques, seafood product mix, and destination markets are thesame for other North Pacific countries.
Enhancement of salmonid species natural production using artificial propagation takesplace in all regions of the North Pacific. In some areas, such as the Columbia River,public hatcheries are part of mitigation agreements for dam construction and habitatalterations. In other areas such as Alaska, hatcheries are a public/private partnershipdesigned to increase natural production. In the Russian Far East, both private and publichatcheries have been developed to increase overall harvests. Based on the limitedamount of information available, in many cases the revenues that may be received fromthese harvests are not adequate to cover the costs of producing fry/smolts. Fisheryenhancement hatcheries are often the political response to societal demands forincreasing salmon and steelhead harvests or replacing production lost to other manmadewater developments; and, economic analysis rarely plays a role in decision making forthat response.
Study area salmonid abundance by origin estimates show that hatcheries contributesignificantly to North Pacific capture fisheries using the assumption that ocean harvestsare not appreciably selective. Hatchery production varies considerably by region andspecies. Less than 10 percent of total salmon production in Russia originated fromhatcheries, but hatchery production has been increasing in recent years. Hatchery salmonrepresented more than 70 percent of both total pink salmon and total chum salmon inPrince William Sound, and more than 55 percent of chum salmon in southeast Alaska.Nearly all of Japan's production is from hatchery origin chum salmon. Using a 1990-2005 annual average, hatchery-origin adult salmon abundance averaged 78 million chum,54 million pink, and 3.2 million sockeye salmon per year, or approximately 62 percent,13 percent, and four percent, respectively, of the combined total of wild and hatcherysalmon abundance.
2 D:\Data\Documents \swd\WSC North Pacific salmon.doc
The average annual catch of anadromous fish in the North Pacific between 2003 and2007 is 432 million fish. Catches in 2007 (preliminary estimates of 511 million fish)were the highest on record. Largest catches were reported by Alaska (213 million fish),Russia (213 million fish), and Japan (76 million fish). Pink and chum salmon constitutedthe majority of the catch (68 percent and 19 percent by fish numbers, respectively),sockeye salmon were 12 percent, while coho and Chinook salmon were 1.0 and 0.2percent, respectively. Pink salmon catches were considerably higher than recent years,sockeye and chum salmon catches were similar to the means, while Chinook and cohosalmon catches were lower.
The total ex-vessel value from the commercial fisheries in 2007 is estimated to be $USD818 million and the value at the first wholesale level is estimated to be $USD 2.2 billion.Of the total $USD 3.0 billion personal income generated from the salmon fishing industryin 2007, 43 percent was in the U.S., 32 percent in Russia, and 23 percent in Japan. Theother Pacific salmon countries of Canada and Korea had two percent of the summedeconomic contribution. Harvesting and processing jobs are estimated to be an equivalent35 thousand in 2007 in the North Pacific countries.
Several recent studies have investigated illegal, unreported, and unregulated catch (IUU).For example, estimates IUU in the Kamchatka region means reported harvests should beincreased by a factor of 1.5 to 2.0 to represent total catch. All of the studies recommenda careful approach to resolving reporting because harvests do contribute to localeconomies. The importance for resolution is to make sure the catch counts are includedin sustainable fishery management practices.
The study recommends specific detailed data and economic analysis tasks to resolvemissing data issues and economic measurement uncertainties. Despite the uncertainties,there can be useful outcomes for making qualified estimates. Pulling togetherexplanations of measurement units provides instructional information. And focusingefforts to overcome unknowns and uncertainties will lead to more realistic estimates insuccessive investigations.
A. Background
The Wild Salmon Center (WSC) desireddesk level, first order estimates for NorthPacific Ocean commercial salmon fisherieseconomic measures.1 The measures were toinclude direct effects (fish numbers, volume,and harvest/first wholesale value) and wereto include comparable indicators so that theimportance of salmon fishing industry couldbe shown within regional economies. Theproportional share of the effects fromsalmon origin (natural or hatchery) was alsoof interest. Where existing studies and
datasets did not exist, proxy information wasto be used to complete the assessments.2
Key areas of uncertainty for the estimateswere to be discussed and recommendationsfor further research were to be made.3
It was realized that underlying problems indata and information available about harvestand processing activities as well as regionaleconomies would contribute to imperfectestimates. Finding dependable relationshipsto model, scale-up, or impute information tofill gaps in limited spatial and temporalmeasurements to represent area-wide

3 D:\Data\Documents \swd\WSC North Pacific salmon.doc
estimates could be questioned. Still, therecan be useful outcomes for undertaking suchassessments. Pulling together explanationsof measurement units provides instructionalinformation. Providing qualified estimatescan be a starting point for future estimationcorrection. And focusing efforts toovercome unknowns and uncertainties willlead to more realistic estimates in successiveinvestigations.
B. Harvest and Abundance DataSources
The North Pacific Ocean area is defined forthe study to be inclusive of the harvestingreported by the United States, Canada,Russia, Japan, China, and the Koreas. Thusthe harvested fish origins should beencompassed in the ecosystems defined byAugerot (2005) for the term "Pacificsalmon."4 The defined area has the dataadvantage of being coincident with theConvention Area for the North PacificAnadromous Fish Commission (NPAFC).5
The NPAFC through its science andenforcement programs provide catch, fisheryenhancement and other technicalinformation pertaining to areas from whichanadromous stocks migrate into theConvention Area.6
The United Nations Food and AgricultureOrganization (FAO) provides software(named FishStat+) and databases thatcontain estimates by country and species forcapture and aquaculture production. Thedatabase includes fishery product volumeand value; and, countries' import and exportsvolume and value. The NPAFC data isgenerally consistent with the FAOdatabases, but recent year data is usuallyavailable sooner from NPAFC.
Neither the FAO nor the NPAFC providethe harvest value of capture fisheries.Sumaila et al. (2005) describes an attempt tocreate a global ex-vessel fish pricedatabase.7 It was found that priceinformation is widely scattered andincomplete. The authors devised a rule-based decision process to fill gaps usingU.S. reported ex-vessel prices. This is areasonable approach because fish productsare exchanged in world markets and the U.S.is a major producer as well as export/importtrader. Except for isolated examples,product market value is going to be reflectedin prices paid at the fisherman level.
Based on Sumaila et al. (2005), it wasdecided to use Alaska reported prices to fillgaps in other North Pacific harvestreporting. Alaska capture salmon fisheriesdominate the U.S. capture production.Except for local and niche markets, theAlaska production is a direct substitute forany U.S. West Coast capture fisheryproduct. The reliance on U.S. prices toestimate salmon harvest value for NorthPacific countries is further justified becauseJapan is the major seafood consumer nationand the U.S. is the highest producer nationof the North Pacific countries.8 Alaskafisheries price trends are shown on Figure 6.
Pacific salmon abundances (adult harvestsplus freshwater escapements) are a modeledmeasurement. Of recent research aboutsalmon abundances, the MALBEC Project(Mantua et al. 2007) is a comprehensive andthorough investigation. The Project relieson observed data and scaling to determineactual abundance trends in the North Pacificbetween 1952 and 2000.9 A densitydependent model was developed to forecastabundances for chum, sockeye, and pinksalmon for the period 2007-2050.10 Themodel was based on specified changes in thecarrying capacity or productivity for marine

4 D:\Data\Documents \swd\WSC North Pacific salmon.doc
or freshwater habitat or both due to humanor natural causes.
The MALBEC Project reports are especiallyuseful because the itemization can beinterpreted to be harvest stock contributionsfrom natural and hatchery origin. MostNorth Pacific ocean salmon fisheries do nothave origin select harvesting so that derivedestimates for abundance origin proportionscan be assumed to approximate harvestproportions.11
C. Economic Measurements andModels
Economic measurements used in this studyare both from secondary sources andmodeled. Harvest statistics are generallyavailable in physical units (numbers of fishand weight) and sometimes available invalue units (harvest level prices), howeverthere is only a scattering of economicmeasurements available from North Pacificcountries. Prices paid at the fisherman levelare readily available for U.S. fisheries, butnot in other North Pacific countries. Ex-processor sale prices for capture fisheries arenot regularly reported for all countries.Alaska processing businesses must reportthe first wholesale value of their products,but other U.S. states do not require thisreporting. The cost to operate hatcheriesand the cost for management andenforcement is sometimes available (Radtke2009). It was necessary to use assumptions(see Table 2) and scaling factors to completemeasurement estimation.
The economic modeled measurementsinclude the regional economic contributionsmade from business activities associatedwith the commercial salmon fishingindustry. Regional economic contributionunits include the amount of household
income generated in a defined regionthrough the activities of the economicventure analyzed. Within the salmon fishingindustry, income generation can beassociated with hatchery programs, as wellas the harvesting and processing of salmon.The contributions would include the directearnings generated for participants inhatchery programs andharvesting/processing. Contributions alsoinclude indirect earnings resulting fromlabor requirements at supporting industriesin the region. Finally, the income includesinduced earnings from money re-spent inregions. The summation of direct, indirect,and induced is sometimes referred to a themultiplier effect of an industry.
It was not possible to develop or evencompile and scale economic regional impactmodels for this investigation. Instead, amodel for Alaska was used to proxy effectsin other countries. The Alaska FEAMmodel developed by William Jensen andHans Radtke was utilized. The modeldescription is aptly described by Seung andWaters (2006). Hans Radtke provided theAlaska FEAM relationships.12
Using Alaska fishing industry modeling isapropos because many similar harvestspecies, fishing techniques, seafood productmix, and destination markets are the samefor other North Pacific countries. TheSinyakov (2005) economic model outputswere reviewed for consistency with theAlaska FEAM adaptations for harvestingand processing in Russia. The Japan fishingindustry socio-economic characterizationprovided by Carl-Christian Schmidt (2003)and Japan Fisheries Agency (2008) wereuseful for cross checking applicability of theAlaska FEAM to the Japan economy.
Another modeled economic measurementunit is added value jobs. It is a calculated
5 D:\Data\Documents \swd\WSC North Pacific salmon.doc
unit based on the labor burden and averageannual full time income received fromparticipants in the fishing industry. The jobmeasurements assumed a $25,000 earningsratio for both the harvesting and processingsector. Job counts for the harvesting sectorinclude owners skippers, crew members; andfor the processing sector includemanagement and line workers.13 The use ofjob equivalent counts is necessary becauseof an enumeration issue for fishing industryoccupations. Capture salmon fisheries areseasonal and the same workers whoparticipate in salmon fisheries harvest andprocessing sectors will also participate inother fisheries. Employment reporting fromcountries (when available) does not usuallyrefine or associate worker counts withparticular fisheries.
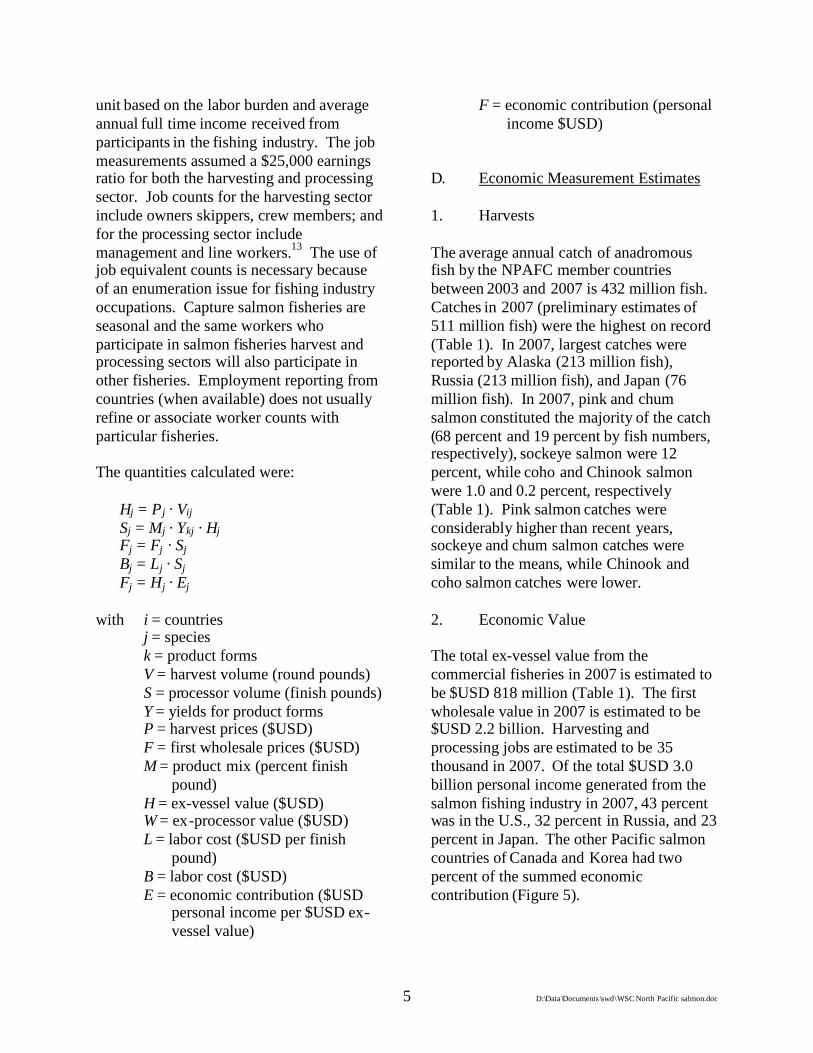
The quantities calculated were:
Hj = Pj · Vij
Sj = Mj · Ykj · HjFj = Fj · SjBj = Lj · SjFj = Hj · Ej
with i = countriesj = speciesk = product formsV = harvest volume (round pounds)S = processor volume (finish pounds)Y = yields for product formsP = harvest prices ($USD)F = first wholesale prices ($USD)M = product mix (percent finish
pound)H = ex-vessel value ($USD)W = ex-processor value ($USD)L = labor cost ($USD per finish
pound)B = labor cost ($USD)E = economic contribution ($USD
personal income per $USD ex-vessel value)
F = economic contribution (personalincome $USD)
D. Economic Measurement Estimates
1. Harvests
The average annual catch of anadromousfish by the NPAFC member countriesbetween 2003 and 2007 is 432 million fish.Catches in 2007 (preliminary estimates of511 million fish) were the highest on record(Table 1). In 2007, largest catches werereported by Alaska (213 million fish),Russia (213 million fish), and Japan (76million fish). In 2007, pink and chumsalmon constituted the majority of the catch(68 percent and 19 percent by fish numbers,respectively), sockeye salmon were 12percent, while coho and Chinook salmonwere 1.0 and 0.2 percent, respectively(Table 1). Pink salmon catches wereconsiderably higher than recent years,sockeye and chum salmon catches weresimilar to the means, while Chinook andcoho salmon catches were lower.
2. Economic Value
The total ex-vessel value from thecommercial fisheries in 2007 is estimated tobe $USD 818 million (Table 1). The firstwholesale value in 2007 is estimated to be$USD 2.2 billion. Harvesting andprocessing jobs are estimated to be 35thousand in 2007. Of the total $USD 3.0billion personal income generated from thesalmon fishing industry in 2007, 43 percentwas in the U.S., 32 percent in Russia, and 23percent in Japan. The other Pacific salmoncountries of Canada and Korea had twopercent of the summed economiccontribution (Figure 5).
6 D:\Data\Documents \swd\WSC North Pacific salmon.doc
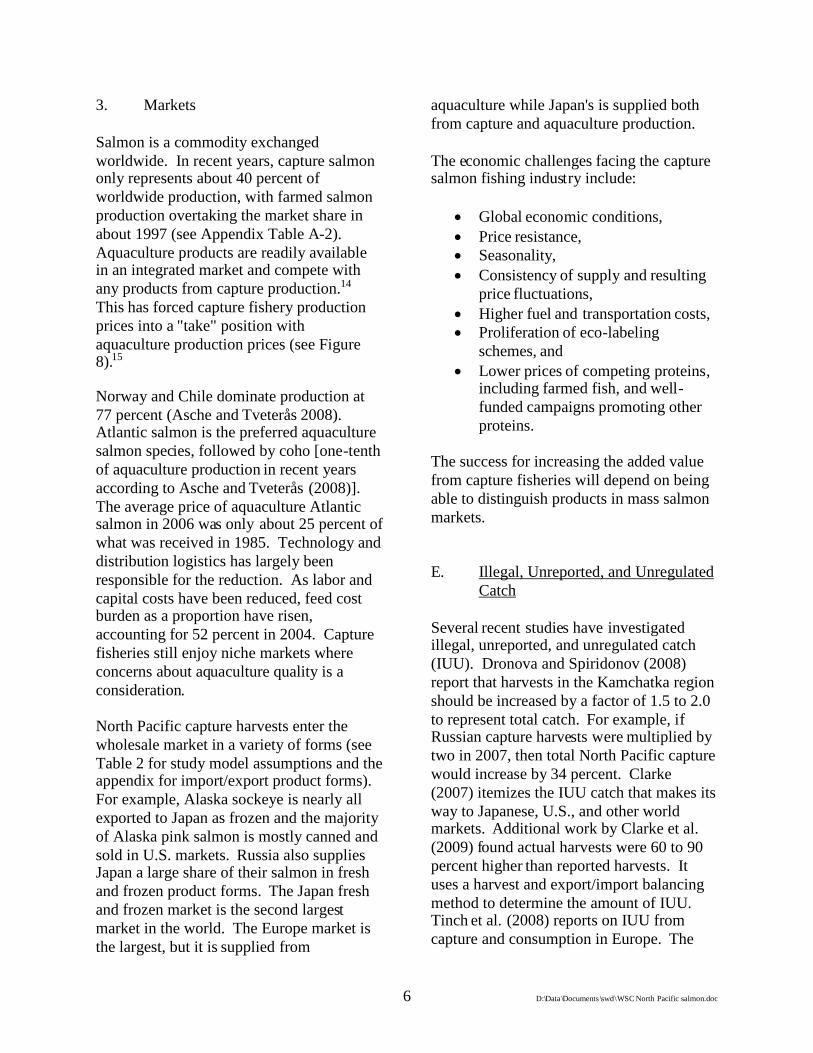
3. Markets
Salmon is a commodity exchangedworldwide. In recent years, capture salmononly represents about 40 percent ofworldwide production, with farmed salmonproduction overtaking the market share inabout 1997 (see Appendix Table A-2).Aquaculture products are readily availablein an integrated market and compete withany products from capture production.14
This has forced capture fishery productionprices into a "take" position withaquaculture production prices (see Figure8).15
Norway and Chile dominate production at77 percent (Asche and Tveterås 2008).Atlantic salmon is the preferred aquaculturesalmon species, followed by coho [one-tenthof aquaculture production in recent yearsaccording to Asche and Tveterås (2008)].The average price of aquaculture Atlanticsalmon in 2006 was only about 25 percent ofwhat was received in 1985. Technology anddistribution logistics has largely beenresponsible for the reduction. As labor andcapital costs have been reduced, feed costburden as a proportion have risen,accounting for 52 percent in 2004. Capturefisheries still enjoy niche markets whereconcerns about aquaculture quality is aconsideration.
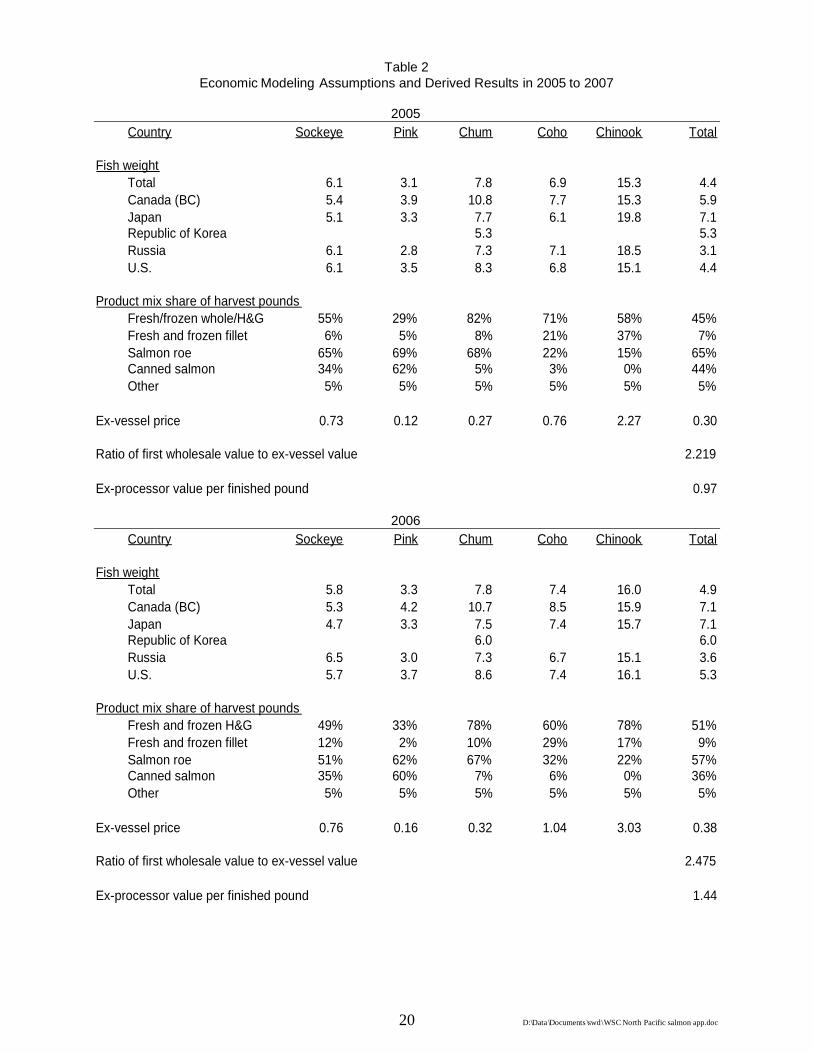
North Pacific capture harvests enter thewholesale market in a variety of forms (seeTable 2 for study model assumptions and theappendix for import/export product forms).For example, Alaska sockeye is nearly allexported to Japan as frozen and the majorityof Alaska pink salmon is mostly canned andsold in U.S. markets. Russia also suppliesJapan a large share of their salmon in freshand frozen product forms. The Japan freshand frozen market is the second largestmarket in the world. The Europe market isthe largest, but it is supplied from
aquaculture while Japan's is supplied bothfrom capture and aquaculture production.
The economic challenges facing the capturesalmon fishing industry include:
Global economic conditions, Price resistance, Seasonality, Consistency of supply and resulting
price fluctuations, Higher fuel and transportation costs, Proliferation of eco-labeling
schemes, and Lower prices of competing proteins,
including farmed fish, and well-funded campaigns promoting otherproteins.
The success for increasing the added valuefrom capture fisheries will depend on beingable to distinguish products in mass salmonmarkets.
E. Illegal, Unreported, and UnregulatedCatch
Several recent studies have investigatedillegal, unreported, and unregulated catch(IUU). Dronova and Spiridonov (2008)report that harvests in the Kamchatka regionshould be increased by a factor of 1.5 to 2.0to represent total catch. For example, ifRussian capture harvests were multiplied bytwo in 2007, then total North Pacific capturewould increase by 34 percent. Clarke(2007) itemizes the IUU catch that makes itsway to Japanese, U.S., and other worldmarkets. Additional work by Clarke et al.(2009) found actual harvests were 60 to 90percent higher than reported harvests. Ituses a harvest and export/import balancingmethod to determine the amount of IUU.Tinch et al. (2008) reports on IUU fromcapture and consumption in Europe. The

7 D:\Data\Documents \swd\WSC North Pacific salmon.doc
SFM (2008) investigates IUU salmon and allother species harvests in the Asia-Pacific.All of these studies recommend a carefulapproach to resolving reporting becauseharvests do contribute to local economies.The importance for resolution is to makesure the catch counts are included insustainable fishery management practices.
The NPAFC has continued pressure onmember countries to eliminate IUU catch.The NPAFC coordinates boat patrols andaerial surveys by member countries toenforce the prohibition of high seas directedfisheries for anadromous fish species. TheUnited Nations FAO on November 22,2009, adopted and opened for signature the"Agreement on Port State Measures toPrevent, Deter and Eliminate Illegal,Unreported and Unregulated Fishing." TheAgreement is specifically designed toaddress IUU fishing through actions by portStates.16 The U.S. is considering legislationto reduce the problem through H.R. 1080:Illegal, Unreported, and Unregulated FishingEnforcement Act of 2009.17 The act wouldmodify existing statutes and authorizeadditional enforcement measures relating tosearch or inspection of facilities orconveyances, records inspection, shipmentdetention, arrest, search and seizure, andservice of civil or criminal processes.
F. Hatchery Production
Study area abundance by origin estimatesfrom the MALBEC Project data show thathatcheries contribute significantly to overallabundance in some regions (Figure 1). Lessthan 10 percent of total salmon productionin Russia originated from hatcheries, buthatchery production has been increasing inrecent years (Radtke et al. 2009). Hatcherysalmon represented more than 70 percent ofboth total pink salmon and total chum
salmon in Prince William Sound, and morethan 55 percent of chum salmon in southeastAlaska. Nearly all of Japan's production isfrom hatchery origin chum salmon.18
During 1990-2005, hatchery-origin adultsalmon abundance averaged 78 millionchum, 54 million pink, and 3.2 millionsockeye salmon per year, or approximately62 percent, 13 percent, and four percent,respectively, of the combined total of wildand hatchery salmon abundance. Knapp etal. (2007) reports recent years hatcheryorigin harvest proportions in Alaska to beabout 38 percent of total capture salmonfisheries, including about 40 percent of pinkand 69 percent of chum salmon catches.
The economic influence of hatchery versusnatural origin contribution to capturefisheries markets has not receivedsignificant research. Ex-vessel prices can beinfluenced by the timing and volume ofcatch. Terminal salmon fisheries (such asthe Alaska cost-recovery fisheries) canshock the amount of catch available toprocessors and lead to downward pricepressures. Generally market promotionefforts emphasize "wild" caught salmonwhich can include hatchery and naturalorigin. Some marketing campaigns forniche markets (for example Copper Riversalmon) will mention the fish origin is fromnatural spawning. The concern is thatmarket information about hatcheryoperations will undermine consumerperception about the premium quality fromwild capture as compared to aquacultureproducts.
Some research work has been accomplishedon the cost and benefits from hatcheryproduction. Radtke (2009) provides areview of Russian, Alaskan, and ColumbiaRiver hatcheries that are operated for fisheryenhancement purposes. The conclusion ofthis and other reviews is that harvest value

8 D:\Data\Documents \swd\WSC North Pacific salmon.doc
received is highly influenced by oceanconditions that determined adult survival,and that in most years, hatchery productionand capital costs exceed harvest benefits.
Radtke (2009) found the cost of hatcheryreleased smolts fits three general productioncategories:
Hatchery operation costs. Thiscategory includes the primaryhatchery plus other hatcheries wherethe fish might be taken for rearingand liberation.
Agency headquarters costs. Thesecosts are calculated as an indirectaccounting rate on some hatcherycosts.
Capital or fixed costs. These costsare not typically included in annualbudgets showing hatchery operationcosts. It is usually necessary to useother studies or methods to estimateconstruction and upgrade costs.
Radtke (2009) made the following generalhatchery cost analysis observations aboutproduction costs.
Size at release will vary from lessthan one gram (454 fry per pound) to45 grams (10 smolts per pound).
Releases are generally described as"river fish" (spring/summer Chinookor coho) or "ocean fish" (pink orchums). Sockeye are generallyreleased into fresh water systems(including lakes) before they migrateinto the ocean.
The river fish are generally releasedafter 18 months in the hatcherysystem at around 20 to 45 grams perrelease. The ocean fish are generallyreleased after about six to eightmonths in the hatchery system ataround one to two grams per release.
Fall Chinook are generally lowerriver spawners that are kept in thehatchery system about nine to 12months to reach a size of 30 to 100grams at release.
Production costs vary with thespecies and size at release.
Labor costs are generally the largestcomponent of total variable costs andfeed costs for ocean fish are not alarge component of the total variablecost. The reverse is true foraquaculture raised fish.
Capital costs are generally notincluded in annual budgetingprocesses.
The indicator for the share of hatcheryreared smolts that escape natural mortalityand are either harvested or return tohatcheries is usually called smolt-to-adultreturn rate (SAR's). Expected SAR'scompared to actual rates are an importantcomponent in hatchery policy andmanagement decisions.19 SAR's vary byspecies, by area of release, and byfreshwater and ocean conditions.20 Pastexperience can be an indicator of expectedSAR's of released fry or smolts. SAR's havebeen as low as 0.001 for upper ColumbiaBasin released fish, or 0.0003 forKamchatka area chum releases, to as high as0.10 in some Alaska coho programs.
Each hatchery program will have aminimum SAR necessary to show whetherthe program's benefits exceed the costs.(The benefit measure can be summedharvest value or summed society economicvalue when the costs are a commensurateproduction measurement. Annualizedcapital costs should be included in anybenefit and cost analysis.) Carter (1999)found that hatcheries operated by theOregon Department of Fish and Wildlifeseldom have SAR's that generate a society

9 D:\Data\Documents \swd\WSC North Pacific salmon.doc
level positive benefit to cost relationship.The same was found by other investigatorsfor Alaska (Boyce et al. 1993) and BritishColumbia (Pearse 1994) hatchery programs.
Enhancement of salmonid species usingartificial propagation takes place in allregions of the North Pacific. In some areas,such as the Columbia River, publichatcheries are part of mitigation agreementsfor dam construction and habitat alterations.In other areas such as Alaska, hatcheries area public/private partnership designed toincrease natural production. In the RussianFar East, both private and public hatcherieshave been developed to increase overallharvests of salmonids. Total hatcheryproduction releases in 2006 were 4.8 billion(Table 3).
Hatcheries have been referred to as a foolishbargain (Walters 1996), but Heard (undated)and Smoker and Linley (1997) argue that theAlaska Prince William Sound pink salmonhatchery program has been successful inovercoming limitations in freshwatersurvival. More recently, Naish et al. (2008)discusses hatchery production in contextwith the political response to societaldemands for salmon and steelhead harvestand conservation. They found thateconomic analysis rarely plays a role indecision making for that response. Theyconclude that knowledge gaps may haveprevented that information being generatedin the past, but suggest that future politicalresponses need not be made in ignorance ofeconomic implications.
G. Measurement Uncertainties andResearch Recommendations
The economic measurement estimatespresented in this report were systematicallyderived to provide the best evaluations that
were possible. The quality and detail of thedata and modeling results gathered hasincreased the understanding of themagnitude and comparative involvement ofthe salmon industry in local economies.However, recommendations for further workwould be in general to refine data analysisand modeling resolutions. Five particularresearch recommendations are made.
(1) The economics of hatchery productionbenefits and costs at a society level werefound to have a paucity ofinvestigations. Conclusions by Radtke(2009), Naish et al. (2008), and othershave provided information that thebusiness outcomes are a salmon industrysubsidy, and at most, could beconsidered local economic developmentprojects from employment andpurchasing at hatcheries. Any linkagesof the deleterious effects from hatcheryproduction on wild stocks need to beincluded on the cost side of theeconomic value relationships for societylevel assessments of hatcheryproduction. Radtke (2009)accomplished some pioneering work onproduction costs in North Pacificcountries, but more work is needed at thesociety cost and benefit level associatedwith hatcheries.
(2) The conservation of natural productionwill have a much greater effect onsalmon industry profitability for NorthPacific countries for several reasons:
This study has estimated thatabundances from natural origincomprise 76 percent by harvest valueand 72 percent by harvest weight ofthe total natural and hatchery fishreaching market. (The proportion ofharvests from natural origin is fromabundance estimates.)

10 D:\Data\Documents \swd\WSC North Pacific salmon.doc
There are biological risks (geneticeffects, competitive interactions,disease transfer, etc.) associated withsalmon hatcheries and economicanalysis shows hatcheries to be asubsidy program.
Hatcheries can interfere with markets(through timing and volume) andcause management issues(exploitation rates of natural originneed to be lower than hatcheryorigin).
Recommendations for further researchshould address the effectiveness ofnatural conservation programs ascompared to further proliferation offishery enhancement hatchery programs.
(3) The prorating of harvests by natural andhatchery origin deserves further study.Ocean survival and escapement wereused to estimate abundances for naturaland hatchery origin fish. The sameproportion was then applied to harvestsfor the measurement. But managementtechniques for avoidance (time, area, andgear) and species size as well as selectfisheries (retaining marked fish) mayinvalidate that assumption.
(4) Capture fisheries processing productforms is highly dynamic in response to
aquaculture supplies, previous yearinventories, and current economicconditions. Market information exists torefine processing product form mix bycountry. Static averages will degradeaccuracy for first wholesale valueestimates and economic contributionestimates.
(5) The regional economic contributionmodel used in this study was developedfor the Alaska economy and resultingeconomic relationships were used as aproxies for the other North Pacificcountries. Consistency was crosschecked where other investigative resultswere available. However, a focused andsufficiently scoped/funded study todevelop an international econometricmodel would be a better approach. Themodeling would have usefulness beyondjust profiling the importance of thesalmon fishing industry. It could beapplied to policy deliberations amongcountries on regulations and possiblemitigation compensation. Anotherexample use would be its connection tobiological models predicting deleteriouseffects of hatchery programs. The NorthPacific supply/demand and open marketsystems have features and merits thatjustify such model development.
H. Bibliography
Alaska Department of Labor Alaska Economic Trends. Volume 29, Number 11. ISSN 0160-3345. http://labor.alaska.gov/trends/nov09.pdf. November 2009.
Asche, Frank and Sigbjørn Tveterås. "Salmon Aquaculture: Production Growth and NewMarkets." University of Stavanger, Norway.www.globefish.org/filedownload.php?fileId=532. 2008.
Asche, Frank, Atle G. Guttormsen, Tom Sebulonsen, and Elin H. Sissener. "CompetitionBetween Farmed and Wild Salmon: The Japanese Salmon Market." Working paper No.

11 D:\Data\Documents \swd\WSC North Pacific salmon.doc
44/03. http://bora.nhh.no/bitstream/2330/418/1/A44_03.pdf. Institute for Research inEconomics and Business Administration, Bergen. December 2003.
Augerot, Xanthippe. Atlas of Pacific Salmon: The First Map-Based Status Assessment ofSalmon in the North Pacific. The University of California Press. 2005.
Boyce, J., Herrmann, M., Bischak, D. and Greenberg, J. "The Alaska Salmon EnhancementProgramme: A Cost/benefit Analysis." Mar. Resour. Econ. 8, 293–312. 1993.
Carter, Chris. Coastal Salmonid and Willamette Trout Hatchery Program Review, Appendix C -Economic Considerations. Oregon Department of Fish and Wildlife. Draft. March 15,1999.
Clarke, Shelley. Trading Tails: Linkages Between Russian Salmon Fisheries and East AsianMarkets. Visiting researcher, Imperial College, London. 2007.
Clarke, S.C., M.K. McAllister, and R.C. Kirkpatrick. "Estimating Legal and Illegal Catches ofRussian Sockeye Salmon From Trade and Market Data." ICES Journal of Marine Science,66: 532-545. http://icesjms.oxfordjournals.org/cgi/content/abstract/66/3/532. 2009.
Crapo, Chuck, Brian Paust, and Jerry Babbitt. "Recoveries and Yields from Pacific Fish andShellfish." University of Alaska Marine Advisory Bulletin #37.http://www.commerce.state.ak.us/oed/seafood/recoveries/home.cfm. 1993.
Dronova, Natalia and Vassily Spiridonov. Illegal, Unreported, and Unregulated Pacific SalmonFishing in Kamchatka. 2008.
FAO FishStat database, November 2009 extraction.
FAO. "Conversion Factors: Landed Weight to Live Weight." FAO Fisheries Circular 847.Food and Agriculture Organization of the United Nations, Rome. 2000.
Heard, William R. "Alaska Salmon Enhancement: A Successful Program for Hatchery andWild Stocks." http://www.lib.noaa.gov/retiredsites/japan/aquaculture/proceedings/report30/report30pdf/Heard.pdf. UJNR Technical Report No. 30. Undated.
Institute of Social and Economic Research. A Village Fish Processing Plant: Yes or No? APlanning Handbook. http://ced.uaa.alaska.edu/publications/manuals/villagefishplant.pdf.University of Alaska Anchorage. March 2008.
Japan Fisheries Agency, Ministry of Agriculture, Forestry and Fisheries. White Paper onFisheries of Japan and Fisheries Policy for FY2008. Draft. April 2008.
Johnson, Terry and Craig Wiese. "Understanding Salmon Markets." Alaska Sea Grant, MarineAdvisory Program. Seagram No. 33. http://nsgl.gso.uri.edu/aku/akug95002.pdf. 1995.
Knapp, Gunnar, Cathy A. Roheim, and James L. Anderson. The Great Salmon Run:Competition Between Wild and Farmed Salmon.

12 D:\Data\Documents \swd\WSC North Pacific salmon.doc
http://www.worldwildlife.org/what/globalmarkets/wildlifetrade/WWFBinaryitem4985.pdf.TRAFFIC North America, World Wildlife Fund. January 2007.
Mantua, N.J., N.G. Taylor, G.T. Ruggerone, K.W. Myers, D. Preikshot, X. Augerot, N.D. Davis,B. Dorner, R. Hilborn, R.M. Peterman, P. Rand, D. Schindler, J. Stanford, R.V. Walker, andC.J. Walters. "The Salmon MALBEC Project: A North Pacific-Scale Study to SupportSalmon Conservation Planning." NPAFC Doc. 1060, 49 pp. School of Aquatic and FisherySciences, University of Washington, Seattle, WA 98195-5020, U.S.A. Available athttp://www.npafc.org. 2007.
Naish, Kerry A., Joseph E. Taylor, III, Phillip S. Levin, Thomas P. Quinn, James R. Winton,Daniel Huppert, and Ray Hilborn. "An Evaluation of the Effects of Conservation andFishery Enhancement Hatcheries on Wild Populations of Salmon." Advances in MarineBiology, Volume 53. 2008.
North Pacific Anadromous Fish Commission (NPAFC). Statistical Yearbook. Annual.http://www.npafc.org/new/publications/Statistical%20Yearbook/Data/2006/2006page.htm.
Pearse, P.H. Salmon Enhancement: An Assessment of the Salmon Stock DevelopmentProgramme on Canada's Pacific Coast. Final Report of the Programme Review of theSalmonid Enhancement Programme Internal Audit and Evaluation Branch. Department ofFisheries and Oceans Canada, Ottawa, Canada. 1994.
Peterson, William T., Rian C. Hooff, Cheryl A. Morgan, Karen L. Hunter, Edmundo Casillas,and John W. Ferguson. Ocean Conditions and Salmon Survival in the Northern CaliforniaCurrent. Fish Ecology Division, Northwest Fisheries Science Center, National MarineFisheries Service, Newport, Oregon. 2006.
Radtke, Hans. Notes on Production Costs of Artificial Salmon Propagation Programs in theNorth Pacific: Cost/Revenue Relationships of Artificial Salmon Propagation Programs in theNorth Pacific. Forthcoming 2009.
Schmidt, Carl-Christian. Fisheries and Japan: A case of Multiple Roles? Paper prepared for theInternational Symposium on Multiple Roles and Functions of Fisheries and FishingCommunities in Aomori, Japan. February 2003.
Seafood Market Information Service, Seafood Market Bulletins (through a contract with theMcDowell Group). June 2007 edition. http://www.alaskaseafood.org/fishingprocessing/seafoodweb_june07/salmonprod.html.
Seung, Chang K. and Edward C. Waters. "A Review of Regional Economic Models forFisheries Management in the U.S." Marine Resource Economics, Volume 21, pp. 101-1240738-1360/00. 2006.
Sinyakov, S.A. Review and Analysis of Socioeconomic Importance of Salmon for the Far EastRegions of Russia. Petropavlovsk-Kamchatsky. 2005.

13 D:\Data\Documents \swd\WSC North Pacific salmon.doc
Smoker, W.W. and T.J. Linley. "Are Prince William Sound salmon hatcheries a fool's bargain?"http://www.adfg.state.ak.us/pubs/afrb/vol4_n1/smokv4n1.pdf. Alaska Fish. Res. Bull.4(1):75-78. 1997.
Sumaila, U. Rashid, A. Dale Marsden, Reg Watson, and Daniel Pauly. Global Ex-Vessel FishPrice Database: Construction, Spatial, and Temporal Applications. University of BritishColumbia, Fisheries Centre, working paper # 2005-01.http://www2.fisheries.com/archive/publications/working/2005/series1.pdf. 2005.
Sustainable Fisheries Management (SFM). Assessment of Impacts of Illegal, Unreported andUnregulated (IUU) Fishing in the Asia-Pacific. Asia-Pacific Economic Cooperation,Fisheries Working Group. November 2008.
Tinch, Rob, Ian Dickie, and Bruno Lanz. Costs of Illegal, Unreported and Unregulated (IUU)Fishing in EU Fisheries. http://www.pewtrusts.org/uploadedFiles/wwwpewtrustsorg/Reports/Protecting_ocean_life/eftec_Costs_IUU_Fishing.pdf. Economics for theEnvironment Consultancy. Commissioned by The Pew Environment Group. November2008.
Walters, Carl J. Presentation at Towards Sustainable Fisheries: Balancing the Conservation andUse of Salmon and Steelhead in the Pacific Northwest. Conference in Victoria, B.C. duringApril 26 - 30, 1996.
Watson, R., A. Kitchingman, A. Gelchu, and D. Pauly. "Mapping Global Fisheries: SharpeningOur Focus." Fish and Fisheries, 5: 168-177. 2004.

14 D:\Data\Documents \swd\WSC North Pacific salmon.doc
End notes
1. Desk level and first order means existing information from synthesized secondary sources is pulled together andsome linear transformations are made that may help characterize subject matter. This is done knowing full-well that fish production, management, and participant behavior may have causal relationships that are non-linear.
2. The proxy information was utilized without statistical testing. A more thorough research approach wouldprovide for tests of repeated measures data with missing values. Simulations would be used to compare testresults using proxy information instead of just simply utilizing available data.
3. Harvest value is the monetary exchange paid by processors to harvesters or when the harvester sells directly tothe public. The term is sometimes used interchangeably in this report with ex-vessel value. When the value isexpressed as price, the weight used in the denominator is equivalent round pounds of fish. Fish can be landeddressed and partially processed, and there are conversion factors to transform a fish weight as if it was sold aswhole. First wholesale value is the sale price of processor products. The term is sometimes usedinterchangeably in this report with ex-processor value. When expressed as price, the weight used in thedenominator is finish pounds. Finish pounds are a measurement after a product form's yield is incorporated.Yields from Crapo et al. (1993) and FAO (2000) were used if data did not use a finish measurement. There isanother related cost incurred that must be paid by restaurants and retailers when purchasing seafood productsthat usually is not reflected in ex-processor value. It is for transportation, cold storage, import/export fees, andother distribution costs.
4. The vernacular for study area used in the report will follow the use of the term by Augerot (2005) for "NorthPacific."
5. The Convention Area is waters of the North Pacific Ocean and its adjacent seas, north of 33 degrees northlatitude beyond 200 miles zones of the coastal States. The main objective of the Convention is to promote theconservation of anadromous stocks in the Convention Area. The conservation measures under the Conventionare: (1) Prohibition of directed fishing for anadromous fish (chum, coho, pink, sockeye, Chinook, and cherrysalmon and steelhead) in the Convention Area; (2) minimization to the maximum extent of the incidental takingof anadromous fish; and, (3) prohibition of the retention on board a fishing vessel of anadromous fish taken asan incidental catch during fishing for non-anadromous fish.
6. The NPAFC annual statistical reports include commercial and sport harvests by country and species. Hatcheryreleases by country are also itemized. Documents from their science program sponsorship and other fundedresearch are conveniently hosted on their website. The documents detail the biology and population trendinfluences for the North Pacific salmon species.
7. The Sumaila et al. (2005) rule-based method is being maintained by the Sea Around Us Project (SAUP). Theprice database is combined with the catch database developed by Watson et al. (2004). The database isavailable on the Internet at www.seaaroundus.org. The most recent year in the database is 2004. The outputsfor North Pacific countries were incomplete for salmon harvests and data that did exist differed considerablyfrom FAO FishStat and individual country reports. It was decided not to rely on SAUP outputs for estimates.
8. Japan has consistently purchased 35 to 45 percent of world salmon production (Johnson and Wiese1995; andKnapp et al. 2007). Japan's salmon market size and integration of capture and aquaculture products has beenfodder for a number of studies concerning price relationships. In Japan's salmon market, capture andaquaculture products compete freely. Capture production dominated the Japan salmon market until the late1980's, but by 2000 salmon aquaculture market share was 69 percent (Asche et al. 2003).
9. More recent estimates available through personal communication with the Project authors have extended theperiod used in this report to 2005.
10. The Project limited the modeled species to chum, sockeye, and pink salmon. These species represent 93 percentof all salmon harvests (volume) in 2007 (FAO FishStat, November 2009 extraction).

15 D:\Data\Documents \swd\WSC North Pacific salmon.doc
11. There are terminal fisheries with time and area restrictions used to target hatchery origin fish, such as Alaskacost-recovery program fisheries and the Columbia River Select Area Fishery Enhancement Project (SAFE).The SAFE uses a fish mark (clipped adipose fin) to distinguish hatchery origin fish.
12. Personal communication, November 2009.
13. The job count measure for equivalents may differ from other estimating methods. For example, job counts inAlaska fisheries (Alaska Department of Labor 2009) are a 12 month average of actual employment. Alaskafishing industry employment in 2008 had a July high of 16,308 in the harvesting sector and about an equalnumber in the processing sector, but the annual average was only 16,297.
14. A number of factors will play into negotiated prices including expected supplies, remaining inventories, generaleconomic conditions, other protein prices, and currency conversion rates (Figure 7).
15. Asche et al. (2003) talks about the Law of One Price and how it applies, depending on the availability ofsubstitutes. The Japanese salmon price is influenced by aquaculture price because it is a near perfect substitutefor capture production.
16. Delegates of 91 FAO member countries concluded two years of negotiations on the Agreement. The Agreementwas concluded under Article XIV of the FAO Constitution and was formally adopted by the FAO Conference. Itis now open for signature and will enter into force 30 days after the 25th ratification is received by theDirector-General of the FAO. The Agreement has already been signed by: Angola, Brazil, Chile, the EuropeanCommunity, Japan, Indonesia, Norway, Samoa, the United States, and Uruguay.
17. The Act's legislative status as of December 23, 2009 is that it passed the House and was referred by the Senateto the Committee on Commerce, Science, and Transportation.
18. Japan EEZ capture fisheries also intercept migration of Russian origin salmon. The Russian EEZ foreign catchis not reported for 2006 and 2007, and is not included in this study. Dronova and Spiridonov (2008) reportsthis fishery is allowed under agreement between the two countries. This means the Russian government getsagreement funds, but the regional economic impacts from harvesting and processing accrue to Japanese ratherthan Russia economies.
19. In the Pacific Northwest, SAR's are tracked by recovery of coded wire tags (CWT's) inserted in a sample ofreleased smolts. The compilation of the CWT information is expanded to represent the universe sampled. Thisallows estimates of the origins of fish harvested in the different ocean and river locations by commercial andrecreational anglers to be made. For "ocean fish" releases, where marking and tagging become impracticaland expensive, a system of temperature marking (otolith growth ring changes according to temperaturevariations in production facilities) is used. The NPAFC maintains a database of fish country origin based onotolith marking. Genetic stock identification using DNA testing is also being evaluated and applied.
20. Freshwater conditions causing smolt mortality would include effects from passage interruptions (such ashydroelectric dams), water quality degradations (such as municipal sewer treatment plant and agriculture non-point discharges), water withdrawals (effects cause elevated water temperatures and salinity intrusions), andpredation. Ocean conditions contributing to mortality are less understood, but generally are associated withfood availability during migrations (Peterson et al. 2006).

16 D:\Data\Documents \swd\WSC North Pacific salmon app.doc
Table 1North Pacific Harvests and Economic Value Measurement in 2005 to 2007
2005Country Sockeye Pink Chum Coho Chinook Total
HarvestTotal 51,176 343,567 88,481 5,990 1,944 491,158Canada (BC) 384 7,026 2,157 327 289 10,183Japan 3 10,588 63,779 26 10 74,406Republic of Korea 0 0 23 0 0 23Russia 7,193 164,313 10,004 277 68 181,855U.S. 43,596 161,640 12,518 5,360 1,577 224,691
VolumeTotal 313,836 1,073,865 691,014 41,034 29,771 2,149,520Canada (BC) 2,057 27,752 23,201 2,507 4,427 59,943Japan 15 35,013 490,722 159 198 526,108Republic of Korea 0 0 121 0 0 121Russia 43,689 453,308 72,613 1,967 1,261 572,837U.S. 268,075 557,792 104,357 36,402 23,885 990,511
Ex-vessel valueTotal 229,100 128,864 186,574 31,186 67,580 643,304Canada (BC) 1,502 3,330 6,264 1,905 10,049 23,050Japan 11 4,202 132,495 121 450 137,279Republic of Korea 0 0 33 0 0 33Russia 31,893 54,397 19,605 1,495 2,863 110,252U.S. 195,695 66,935 28,176 27,666 54,218 372,690
Finish poundsTotal 247,109 797,689 594,559 31,945 21,200 1,692,501Canada (BC) 1,620 20,614 19,963 1,951 3,152 47,300Japan 12 26,009 422,225 124 141 448,510Republic of Korea 0 0 104 0 0 104Russia 34,400 336,726 62,477 1,531 898 436,032U.S. 211,077 414,340 89,790 28,339 17,008 760,555
Labor costTotal 68,854 339,930 90,081 4,761 3,394 507,020Canada (BC) 451 8,785 3,025 291 505 13,056Japan 3 11,083 63,971 18 23 75,098Republic of Korea 0 0 16 0 0 16Russia 9,585 143,494 9,466 228 144 162,917U.S. 58,814 176,568 13,604 4,224 2,723 255,933
Ex-processor valueTotal 240,820 777,389 579,429 31,132 20,660 1,649,431Canada (BC) 1,578 20,090 19,455 1,902 3,072 46,097Japan 12 25,347 411,480 120 138 437,097Republic of Korea 0 0 102 0 0 102Russia 33,524 328,157 60,887 1,492 875 424,936U.S. 205,706 403,795 87,505 27,618 16,575 741,200
Regional economic contributionTotal 455,597 787,501 789,351 58,474 112,633 2,203,556Canada (BC) 2,986 20,351 26,503 3,572 16,748 70,160Japan 22 25,677 560,555 226 751 587,231Republic of Korea 0 0 139 0 0 139Russia 63,423 332,426 82,946 2,802 4,771 486,368U.S. 389,166 409,048 119,208 51,873 90,364 1,059,658
Direct jobsTotal 30,574Canada (BC) 891Japan 5,200Republic of Korea 1Russia 8,281U.S. 16,200

17 D:\Data\Documents \swd\WSC North Pacific salmon app.doc
Table 1 (cont.)
2006Country Sockeye Pink Chum Coho Chinook Total
HarvestTotal 55,056 225,689 101,444 5,424 1,394 389,007Canada (BC) 4,198 755 2,041 145 264 7,403Japan 28 7,146 61,441 29 8 68,652Republic of Korea 0 0 45 0 0 45Russia 8,414 144,950 14,715 430 109 168,618U.S. 42,417 72,838 23,202 4,820 1,013 144,290
VolumeTotal 319,098 736,559 792,706 40,159 22,284 1,910,806Canada (BC) 22,280 3,155 21,803 1,228 4,198 52,663Japan 132 23,790 463,248 214 126 487,510Republic of Korea 0 0 271 0 0 271Russia 54,339 439,994 107,957 2,866 1,649 606,805U.S. 242,349 269,620 199,426 35,851 16,314 763,561
Ex-vessel valueTotal 242,516 117,849 253,666 41,765 67,527 723,324Canada (BC) 16,933 505 6,977 1,277 12,719 38,410Japan 101 3,806 148,239 222 381 152,749Republic of Korea 0 0 87 0 0 87Russia 41,298 70,399 34,546 2,981 4,997 154,220U.S. 184,186 43,139 63,816 37,285 49,432 377,858
Finish poundsTotal 242,595 553,310 673,874 30,264 17,560 1,517,604Canada (BC) 16,938 2,370 18,535 925 3,307 42,076Japan 101 17,871 393,804 161 99 412,036Republic of Korea 0 0 231 0 0 231Russia 41,311 330,528 91,774 2,160 1,299 467,072U.S. 184,246 202,541 169,531 27,018 12,854 596,190
Labor costTotal 71,440 225,904 111,569 5,463 2,198 416,574Canada (BC) 4,988 968 3,069 167 414 9,605Japan 30 7,296 65,199 29 12 72,567Republic of Korea 0 0 38 0 0 38Russia 12,165 134,947 15,194 390 163 162,859U.S. 54,257 82,693 28,068 4,877 1,609 171,504
Ex-processor valueTotal 348,844 795,641 969,008 43,519 25,250 2,182,262Canada (BC) 24,356 3,408 26,653 1,331 4,756 60,503Japan 145 25,698 566,277 232 142 592,494Republic of Korea 0 0 331 0 0 331Russia 59,404 475,287 131,967 3,106 1,868 671,633U.S. 264,939 291,248 243,779 38,851 18,484 857,300
Regional economic contributionTotal 482,277 720,191 1,073,202 78,310 112,546 2,466,525Canada (BC) 33,673 3,085 29,519 2,395 21,198 89,868Japan 200 23,261 627,167 417 635 651,679Republic of Korea 0 0 367 0 0 367Russia 82,126 430,216 146,157 5,589 8,328 672,416U.S. 366,278 263,629 269,992 69,910 82,386 1,052,195
Direct jobsTotal 28,236Canada (BC) 999Japan 5,347Republic of Korea 3Russia 8,982U.S. 12,906

18 D:\Data\Documents \swd\WSC North Pacific salmon app.doc
Table 1 (cont.)
2007Country Sockeye Pink Chum Coho Chinook Total
HarvestTotal 58,966 349,615 96,316 5,177 1,086 511,160Canada (BC) 646 6,207 1,010 276 182 8,321Japan 1 15,557 60,727 6 9 76,300Republic of Korea 0 0 56 0 0 56Russia 10,852 183,763 17,280 1,191 137 213,223U.S. 47,468 144,088 17,243 3,705 758 213,262
VolumeTotal 349,742 1,149,476 698,285 34,897 15,805 2,248,205Canada (BC) 3,880 24,685 10,717 1,790 2,919 43,991Japan 2 47,134 437,084 35 99 484,355Republic of Korea 0 0 322 0 0 322Russia 66,319 572,819 119,648 8,181 1,766 768,733U.S. 279,543 504,838 130,515 24,890 11,023 950,809
Ex-vessel valueTotal 279,795 218,400 237,417 33,501 48,527 817,641Canada (BC) 3,104 4,690 3,644 1,719 8,961 22,117Japan 2 8,956 148,609 34 305 157,904Republic of Korea 0 0 109 0 0 109Russia 53,055 108,836 40,680 7,854 5,421 215,846U.S. 223,635 95,919 44,375 23,894 33,841 421,664
Finish poundsTotal 265,892 863,498 593,608 26,298 12,455 1,761,751Canada (BC) 2,950 18,544 9,110 1,349 2,300 34,252Japan 2 35,408 371,562 27 78 407,077Republic of Korea 0 0 274 0 0 274Russia 50,419 430,307 101,712 6,165 1,391 589,995U.S. 212,522 379,239 110,950 18,757 8,685 730,153
Labor costTotal 78,301 352,547 98,279 4,747 1,559 535,433Canada (BC) 869 7,571 1,508 244 288 10,479Japan 0 14,456 61,517 5 10 75,988Republic of Korea 0 0 45 0 0 45Russia 14,847 175,685 16,840 1,113 174 208,659U.S. 62,584 154,835 18,369 3,386 1,087 240,261
Ex-processor valueTotal 329,783 1,070,985 736,244 32,618 15,447 2,185,077Canada (BC) 3,659 22,999 11,299 1,673 2,852 42,483Japan 2 43,916 460,844 33 97 504,892Republic of Korea 0 0 339 0 0 339Russia 62,534 533,705 126,152 7,647 1,726 731,763U.S. 263,589 470,366 137,609 23,264 10,772 905,600
Regional economic contributionTotal 556,411 1,334,670 1,004,456 62,814 80,879 3,039,230Canada (BC) 6,173 28,662 15,415 3,222 14,935 68,407Japan 4 54,728 628,729 63 508 684,031Republic of Korea 0 0 463 0 0 463Russia 105,507 665,107 172,109 14,726 9,035 966,485U.S. 444,728 586,173 187,740 44,802 56,401 1,319,844
Direct jobsTotal 34,500Canada (BC) 773Japan 5,566Republic of Korea 4Russia 11,800U.S. 16,357

19 D:\Data\Documents \swd\WSC North Pacific salmon app.doc
Table 1 (cont.)
Notes: 1. Harvests are thousands of fish. Volume is in thousands of round pounds.2. All values are in thousands of $USD (nominal).3. Steelhead, cherry, and other salmon species are not included in the estimates.4. Regional economic contribution is household personal income and includes the "multiplier"
effect.5. Ex-processor value (first wholesale value) is based on a ratio of selected products: fresh and
frozen whole and H&G, fresh and frozen fillet, salmon roe, canned salmon, and other.6. Direct jobs are harvesting and processing industry full time equivalent assuming 40 percent
labor burdens for the harvest sector and various labor requirements for different salmonproduct forms for the processing sector.
7. U.S. is Alaska and West Coast salmon fisheries.8. Russia excludes foreign fleets in Russian EEZ, which were 14 million pounds in 2005, and
not available for 2006 and 2007.Sources: NPAFC Statistical Yearbooks (2005 and 2006); State of Alaska; regional economic
contribution ratio is from Dr. Hans Radtke (personal communication), who based hisestimates on the Alaska FEAM relationships; Seafood Market Information Service, SeafoodMarket Bulletins (1997); Institute of Social and Economic Research (2008); Crapo et al.(1993).
20 D:\Data\Documents \swd\WSC North Pacific salmon app.doc
Table 2Economic Modeling Assumptions and Derived Results in 2005 to 2007
2005Country Sockeye Pink Chum Coho Chinook Total
Fish weightTotal 6.1 3.1 7.8 6.9 15.3 4.4Canada (BC) 5.4 3.9 10.8 7.7 15.3 5.9Japan 5.1 3.3 7.7 6.1 19.8 7.1Republic of Korea 5.3 5.3Russia 6.1 2.8 7.3 7.1 18.5 3.1U.S. 6.1 3.5 8.3 6.8 15.1 4.4
Product mix share of harvest poundsFresh/frozen whole/H&G 55% 29% 82% 71% 58% 45%Fresh and frozen fillet 6% 5% 8% 21% 37% 7%Salmon roe 65% 69% 68% 22% 15% 65%Canned salmon 34% 62% 5% 3% 0% 44%Other 5% 5% 5% 5% 5% 5%
Ex-vessel price 0.73 0.12 0.27 0.76 2.27 0.30
Ratio of first wholesale value to ex-vessel value 2.219
Ex-processor value per finished pound 0.97
2006Country Sockeye Pink Chum Coho Chinook Total
Fish weightTotal 5.8 3.3 7.8 7.4 16.0 4.9Canada (BC) 5.3 4.2 10.7 8.5 15.9 7.1Japan 4.7 3.3 7.5 7.4 15.7 7.1Republic of Korea 6.0 6.0Russia 6.5 3.0 7.3 6.7 15.1 3.6U.S. 5.7 3.7 8.6 7.4 16.1 5.3
Product mix share of harvest poundsFresh and frozen H&G 49% 33% 78% 60% 78% 51%Fresh and frozen fillet 12% 2% 10% 29% 17% 9%Salmon roe 51% 62% 67% 32% 22% 57%Canned salmon 35% 60% 7% 6% 0% 36%Other 5% 5% 5% 5% 5% 5%
Ex-vessel price 0.76 0.16 0.32 1.04 3.03 0.38
Ratio of first wholesale value to ex-vessel value 2.475
Ex-processor value per finished pound 1.44

21 D:\Data\Documents \swd\WSC North Pacific salmon app.doc
Table 2 (cont.)
2007Country Sockeye Pink Chum Coho Chinook Total
Fish weightTotal 5.9 3.3 7.2 6.7 14.6 4.4Canada (BC) 6.0 4.0 10.6 6.5 16.0 5.3Japan 2.2 3.0 7.2 5.9 11.0 6.3Republic of Korea 5.7 5.7Russia 6.1 3.1 6.9 6.9 12.9 3.6U.S. 5.9 3.5 7.6 6.7 14.5 4.5
Product mix share of harvest poundsFresh and frozen H&G 49% 33% 78% 60% 78% 51%Fresh and frozen fillet 12% 2% 10% 29% 17% 9%Salmon roe 51% 62% 67% 32% 22% 57%Canned salmon 35% 60% 7% 6% 0% 36%Other 5% 5% 5% 5% 5% 5%
Ex-vessel price 0.80 0.19 0.34 0.96 3.07 0.36
Ratio of first wholesale value to ex-vessel value 2.173
Ex-processor value per finished pound 1.24
2005 to 2007Country Sockeye Pink Chum Coho Chinook Total
YieldFresh/frozen whole/H&G 85% 85% 85% 85% 85%Fresh and frozen fillet 50% 50% 50% 50% 50%Salmon roe 4% 6% 8% 7% 6%Canned salmon 67% 65% 67% 67% 50%Other 67% 65% 67% 67% 50%
Labor cost per finished poundFresh/frozen whole/H&G 0.09Fresh and frozen fillet 0.33Salmon roe 0.50Canned salmon 0.65Other 0.18
Ratio of personal income to 1.989 6.111 4.231 1.875 1.667ex-vessel value
Notes: 1. Price is $USD (nominal).divided by round pounds.2. The shares of product forms will not equal 100 percent because roe yield is in addition to
other product form yield. Roe yield is for female fish.3. "Other" product form includes all other product forms including smoked products.4. Some analog products manufactured from whole and H&G are not included in ex-processor
valuations.Sources: NPAFC Statistical Yearbooks (2005 and 2006); State of Alaska; regional economic
contribution ratio is from Dr. Hans Radtke (personal communication), who based hisestimates on the Alaska FEAM relationships; Seafood Market Information Service, SeafoodMarket Bulletins (1997); Institute of Social and Economic Research (2008); Crapo et al.(1993).

22 D:\Data\Documents \swd\WSC North Pacific salmon app.doc
Table 3Hatchery Releases of Salmon Fry and Smolts by Species and Country in 2006
Country Sockeye Pink Chum Coho Chinook Total
Total 311.2 1,300.7 2,894.3 74.9 223.1 4,838.2Canada 230.2 20.3 121.1 11.8 41.1 425.1Japan 0.3 147.2 1,858.3 0.0 0.0 2,017.2Republic of Korea 0.0 0.0 7.4 0.0 0.0 7.4Russia (Far East) 5.4 323.7 336.1 1.9 0.8 670.3U.S. 75.3 809.5 578.8 61.1 181.3 1,725.6Alaska 53.5 808.6 541.2 22.7 10.2 1,436.2West Coast 21.9 0.9 37.6 38.4 171.1 289.4
Notes: 1. Table numbers are millions of fish.Sources: NPAFC Statistical Yearbook 2006.

23 D:\Data\Documents \swd\WSC North Pacific salmon app.doc
Figure 1North Pacific Salmon Abundance Estimates by Natural and Hatchery Origin for 1990 through 2007
0
100
200
300
400
500
600
700
Nat
ural
Hat
cher
yN
atur
alH
atch
ery
Nat
ural
Hat
cher
yN
atur
alH
atch
ery
Nat
ural
Hat
cher
yN
atur
alH
atch
ery
Nat
ural
Hat
cher
y
Nat
ural
Hat
cher
y
Nat
ural
Hat
cher
y
Nat
ural
Hat
cher
y
Nat
ural
Hat
cher
y
Nat
ural
Hat
cher
y
Nat
ural
Hat
cher
y
Nat
ural
Hat
cher
yN
atur
alH
atch
ery
Nat
ural
Hat
cher
yN
atur
alH
atch
ery
Nat
ural
Hat
cher
y
200720062005200420032002200120001999199819971996199519941993199219911990
Ab
unda
nce
(mill
ion
s)
SockeyeChumPink
Figure 2Salmon Natural and Hatchery Abundance Trends in 1990 to 2005
0
100
200
300
400
500
600
700
800
200
7
200
6
200
5
200
4
200
3
200
2
200
1
200
0
199
9
199
8
199
7
199
6
199
5
199
4
199
3
199
2
199
1
199
0
Ab
unda
nce
(mill
ion
s)
HatcheryNatural
Notes: 1. Abundance is expressed in adult fish counts for harvest plus freshwater escapement.2. Years 2006 and 2007 are scaled using harvests and 2005 relationships between origin
abundance and harvests.Source: Mantua et al. (2007).

24 D:\Data\Documents \swd\WSC North Pacific salmon app.doc
Figure 3North Pacific Salmon Abundance Natural and Hatchery Origin Share by Species in 2005
Pink Salmon Chum Salmon
Sockeye Salmon Total Salmon
Natural86%
Hatchery14%
Total560 million
Natural38%
Hatchery62%
Total132 million
Natural99%
Hatchery1%
Total80 million
Natural80%
Hatchery20%
Total760 million
Note: Abundance is expressed in adult fish counts for harvest plus freshwater escapement.
Figure 4North Pacific Salmon Abundance Hatchery Origin Proportion by Rearing Region for 1990 to 2005
0 0.2 0.4 0.6 0.8 1
Japan
Russia
Western AK
Kodiak
PWS
SE AK
North BC
South BC
West Coast
All areas
Proportion hatchery salmon
SockeyeChumPink
Notes: PWS = Prince William Sound; BC = British Columbia; AK = Alaska.Source: Mantua et al. (2007).

25 D:\Data\Documents \swd\WSC North Pacific salmon app.doc
Figure 5North Pacific Salmon Regional Economic Contributions in 2005 to 2007
2005
Canada (BC)3%
Japan27%
Russia22%
U.S.48%
Republic of Korea0.01%
2006
Canada (BC)4%
Japan26%
Russia27%
U.S.43%
Republic of Korea0.01%
2007
Canada (BC)2%
Japan23%
Russia32%
U.S.43% Republic of Korea
0.02%
Notes: 1. Regional economic contribution is household personal income and includes the "multiplier" effect.2. U.S. is the regional economic contribution from Alaska and West Coast salmon fisheries.
Sources: The Research Group.

26 D:\Data\Documents \swd\WSC North Pacific salmon app.doc
Figure 6Alaska Commercial Salmon Price Trends in 1994 to 2008
0.00
0.50
1.00
1.50
2.00
2.50
3.00
3.50
4.00
4.50
19
94
19
95
19
96
19
97
19
98
19
99
20
00
20
01
20
02
20
03
20
04
20
05
20
06
20
07
20
08
Pri
ce($
/lb)
ChinookSockeyeCohoPinkChum
Notes: 1. Prices adjusted to 2007 dollars using the GDP implicit price deflator developed by the U.S.Bureau of Economic Analysis.
Source: Alaska Dept. of Fish and Game, Division of Commercial Fisheries, Alaska CommercialSalmon Harvests and Ex-vessel Values tables.
Figure 7Currency Trends in 1999 to 2008
0.6
0.7
0.8
0.9
1.0
1.1
1.2
1.3
199
9
200
0
200
1
200
2
200
3
200
4
200
5
200
6
200
7
200
8
Inde
x
Yen per U.S. $Euros per U.S. $Rubles per U.S. $
Notes: 1. Currencies are indexed to Year 1999=1.Source: Exchange rates from Board of Governors of the Federal Reserve System for Yen and Euros.
Rubles from Wikipedia.

27 D:\Data\Documents \swd\WSC North Pacific salmon app.doc
Figure 8Japanese Wholesale Prices of Alaska Wild and ChileanAquaculture Frozen Salmon Products in 1990 to 2006
$6.24
$5.46
$4.68
$3.90
$3.12
$2.34
$1.56
$0.78
$0.00
1990
1991
1992
1993
1994
1995
1996
1997
1998
1999
2000
2001
2002
2003
2004
2005
2006
Pric
e(N
omin
alD
olla
rsP
erPo
und)
Notes: 1. Prices are nominal low list prices for four to six pound No. 1 grade fish.2. Yen to dollar conversion from Board of Governors of the Federal Reserve System for Year
2006.Source: Knapp et al. (2007).

APPENDIX

1 D:\Data\Documents \swd\WSC North Pacific salmon app.doc
Table A-1Global Aquaculture and Capture Production by Salmon Species in 2003 to 2007
Species 2003 2004 2005 2006 2007
Aquaculture
Atlantic salmon Quantity 1,147,862 1,267,447 1,255,905 1,328,556 1,433,708Chinook(=Spring=King)salmon Quantity 22,030 8,146 10,191 9,832 11,542Chum(=Keta=Dog)salmon Quantity 2 1Coho(=Silver)salmon Quantity 105,869 98,192 115,623 130,959 115,376Masu(=Cherry) salmon QuantityPacific salmons nei QuantitySalmonoids nei Quantity 2,689 2,479 1,650 1,532 3,249Sockeye(=Red)salmon QuantityTotal Quantity 1,278,452 1,376,265 1,383,369 1,470,879 1,563,875Share 59% 63% 59% 63% 61%
Atlantic salmon Value 3,439,930 4,175,932 4,910,917 6,695,519 7,578,273Chinook(=Spring=King)salmon Value 55,727 48,912 61,127 72,321 83,272Chum(=Keta=Dog)salmon Value 14 7Coho(=Silver)salmon Value 341,114 335,562 525,448 523,913 456,091Masu(=Cherry) salmon ValuePacific salmons nei ValueSalmonoids nei Value 4,658 4,487 3,739 2,780 6,054Sockeye(=Red)salmon ValueTotal Value 3,841,444 4,564,900 5,501,231 7,294,534 8,123,690
Capture Production
Atlantic salmon Quantity 3,648 4,081 3,727 3,084 2,989Chinook(=Spring=King)salmon Quantity 15,046 15,899 13,571 10,482 8,906Chum(=Keta=Dog)salmon Quantity 360,429 351,188 318,389 331,900 303,205Coho(=Silver)salmon Quantity 16,995 24,546 18,791 18,226 17,200Masu(=Cherry) salmon Quantity 1,944 1,608 1,563 834 810Pacific salmons nei Quantity - <0.5 <0.5 - <0.5Pink(=Humpback)salmon Quantity 377,749 266,554 456,350 319,005 495,986Salmonoids nei Quantity 3,140 2,746 1,984 23,006 19,944Sockeye(=Red)salmon Quantity 109,822 142,385 147,151 151,123 164,222Total Quantity 888,773 809,007 961,526 857,660 1,013,262Share 41% 37% 41% 37% 39%
Total Aquaculture Plus Capture Production
Atlantic salmon Quantity 1,151,510 1,271,528 1,259,632 1,331,640 1,436,697Chinook(=Spring=King)salmon Quantity 37,076 24,045 23,762 20,314 20,448Chum(=Keta=Dog)salmon Quantity 360,431 351,189 318,389 331,900 303,205Coho(=Silver)salmon Quantity 122,864 122,738 134,414 149,185 132,576Masu(=Cherry) salmon Quantity 1,944 1,608 1,563 834 810Pacific salmons nei Quantity - <0.5 <0.5 - <0.5Pink(=Humpback)salmon Quantity 377,749 266,554 456,350 319,005 495,986Salmonoids nei Quantity 5,829 5,225 3,634 24,538 23,193Sockeye(=Red)salmon Quantity 109,822 142,385 147,151 151,123 164,222Total Quantity 2,167,225 2,185,272 2,344,895 2,328,539 2,577,137Share 100% 100% 100% 100% 100%
Notes: 1. Aquaculture value is first wholesale value in nominal U.S. dollars.2. Quantity is tonnes (1,000 kg). Tonnes (metric tons) are equal to 2,204.62 pounds.
Source: FAO FishStat database, November 2009 extraction.

2 D:\Data\Documents \swd\WSC North Pacific salmon app.doc
Table A-2Capture for North Pacific Countries by Salmon Species and Fishing Areas in 2004 to 2007
Country Species Fishing area 2004 2005 2006 2007Canada Atlantic salmon Atlantic, Northwest - - - -Canada Chinook(=Spring=King)salmon Pacific, Northeast 2,460 2,008 1,831 1,323Canada Chum(=Keta=Dog)salmon Pacific, Northeast 14,112 10,523 9,889 4,861Canada Coho(=Silver)salmon Pacific, Northeast 1,143 1,137 510 811Canada Pink(=Humpback)salmon Pacific, Northeast 3,575 12,588 1,430 11,196Canada Salmonoids nei America, North - Inland waters - - - -Canada Sockeye(=Red)salmon Pacific, Northeast 4,323 933 10,048 1,758Japan Chinook(=Spring=King)salmon Pacific, Northwest 109 156 140 130Japan Chum(=Keta=Dog)salmon Asia - Inland waters 19,103 16,269 . .Japan Chum(=Keta=Dog)salmon Pacific, Northwest 242,476 226,249 201,000 192,900Japan Coho(=Silver)salmon Pacific, Northwest 89 129 100 100Japan Masu(=Cherry) salmon Asia - Inland waters 667 629 . .Japan Masu(=Cherry) salmon Pacific, Northwest 932 922 820 800Japan Pink(=Humpback)salmon Asia - Inland waters 628 852 . .Japan Pink(=Humpback)salmon Pacific, Northwest 12,360 16,220 14,400 13,830Japan Salmonoids nei Asia - Inland waters - - 17,477 16,465Japan Sockeye(=Red)salmon Asia - Inland waters 39 33 . .Japan Sockeye(=Red)salmon Pacific, Northwest 2,587 2,744 2,440 2,340Korea, Republic of Salmonoids nei Asia - Inland waters . . 1,878 20Korea, Republic of Salmonoids nei Pacific, Northwest 16 15 37 102Russian Federation Atlantic salmon Atlantic, Northeast 75 85 72 55Russian Federation Atlantic salmon Europe - Inland waters 31 13 15 25Russian Federation Chinook(=Spring=King)salmon Europe - Inland waters 105 205 264 254Russian Federation Chinook(=Spring=King)salmon Pacific, Northwest 263 395 578 575Russian Federation Chum(=Keta=Dog)salmon Europe - Inland waters 11,019 20,250 27,834 28,561Russian Federation Chum(=Keta=Dog)salmon Pacific, Northeast - 409 546 909Russian Federation Chum(=Keta=Dog)salmon Pacific, Northwest 13,816 8,117 23,997 26,469Russian Federation Coho(=Silver)salmon Europe - Inland waters 797 442 671 2,303Russian Federation Coho(=Silver)salmon Pacific, Northwest 1,510 679 1,052 1,650Russian Federation Masu(=Cherry) salmon Europe - Inland waters 7 9 6 9Russian Federation Masu(=Cherry) salmon Pacific, Northwest 2 3 8 1Russian Federation Pink(=Humpback)salmon Atlantic, Northeast - 136 3 171Russian Federation Pink(=Humpback)salmon Europe - Inland waters 23,576 42,680 29,161 43,593Russian Federation Pink(=Humpback)salmon Pacific, Northeast - 64 1 120Russian Federation Pink(=Humpback)salmon Pacific, Northwest 91,261 159,454 173,420 219,572Russian Federation Salmonoids nei Europe - Inland waters 873 772 1,282 1,203Russian Federation Salmonoids nei Pacific, Northeast - 2 - -Russian Federation Salmonoids nei Pacific, Northwest 703 247 1,344 1,227Russian Federation Sockeye(=Red)salmon Europe - Inland waters 11,263 15,742 16,338 21,370Russian Federation Sockeye(=Red)salmon Pacific, Northeast - - - 337Russian Federation Sockeye(=Red)salmon Pacific, Northwest 9,231 7,845 14,052 12,959United States of America Atlantic salmon Atlantic, Northwest . . . .United States of America Chinook(=Spring=King)salmon America, North - Inland waters 531 298 403 271United States of America Chinook(=Spring=King)salmon Pacific, Eastern Central 2,992 2,205 538 724United States of America Chinook(=Spring=King)salmon Pacific, Northeast 9,438 8,302 6,727 5,628United States of America Chum(=Keta=Dog)salmon America, North - Inland waters 136 951 971 867United States of America Chum(=Keta=Dog)salmon Pacific, Northeast 50,526 35,621 67,663 48,638United States of America Coho(=Silver)salmon America, North - Inland waters 1,478 735 769 690United States of America Coho(=Silver)salmon Pacific, Eastern Central - - - -United States of America Coho(=Silver)salmon Pacific, Northeast 19,529 15,669 15,124 11,646United States of America Pacific salmons nei Pacific, Northeast <0.5 <0.5 - <0.5United States of America Pink(=Humpback)salmon America, North - Inland waters - - - -United States of America Pink(=Humpback)salmon Pacific, Eastern Central - - - -United States of America Pink(=Humpback)salmon Pacific, Northeast 135,154 224,356 100,590 207,504United States of America Sockeye(=Red)salmon America, North - Inland waters 29 - - -United States of America Sockeye(=Red)salmon Pacific, Northeast 114,913 119,854 108,245 125,458
Country 2004 2005 2006 2007Canada 25,613 27,189 23,708 19,949Japan 278,990 264,203 236,377 226,565Korea, Republic of 16 15 1,915 122Russian Federation 164,532 257,549 290,644 361,363United States of America 334,726 407,991 301,030 401,426
Species 2004 2005 2006 2007Atlantic salmon 106 98 87 80Chinook(=Spring=King)salmon 15,898 13,569 10,481 8,905Chum(=Keta=Dog)salmon 351,188 318,389 331,900 303,205Coho(=Silver)salmon 24,546 18,791 18,226 17,200Masu(=Cherry) salmon 1,608 1,563 834 810Pacific salmons nei <0.5 <0.5 - <0.5Pink(=Humpback)salmon 266,554 456,350 319,005 495,986Salmonoids nei 1,592 1,036 22,018 19,017Sockeye(=Red)salmon 142,385 147,151 151,123 164,222
Fishing area 2004 2005 2006 2007America, North - Inland waters 2,174 1,984 2,143 1,828Asia - Inland waters 20,437 17,783 19,355 16,485Atlantic, Northeast 75 221 75 226Atlantic, Northwest - - - -Europe - Inland waters 47,671 80,113 75,571 97,318Pacific, Eastern Central 2,992 2,205 538 724Pacific, Northeast 355,173 431,466 322,604 420,189Pacific, Northwest 375,355 423,175 433,388 472,655
Notes: 1. Quantity is tonnes (1,000 kg). Tonnes (metric tons) are equal to 2,204.62 pounds.Source: FAO FishStat database, November 2009 extraction.

3 D:\Data\Documents \swd\WSC North Pacific salmon app.doc
Table A-3Export, Import, and Production Quantity and Value by North Pacific Country and Product Forms in 2007
Export QuantityCanada Japan Korea, Dem. People's RepKorea, Republic ofRussian FederationU.S.
Atlantic and Danube salmons, fresh or chilled 69,657 3,513Salmon steaks, frozen -Sockeye salmon (red salmon)(Oncorhynchus nerka), frozen 466 224 3 31,974Salmon steaks, fresh or chilled -Salmon nei, not minced, prepared or preserved 62 - 131 503 2,706Coho salmon, not minced, prepared or preserved 23Salmonoids fillets, frozen 1,323 345Pacific salmon, fresh or chilled 5,742 1 6,918Salmon fillets, fresh or chilled 5,079Salmon minced, preparations 305 - 1,017Pacific salmon, frozen, nei 7,577 57,050 - 954 55,804 90,142Salmonoids, salted or in brine -Atlantic salmon and Danube salmon, frozen 90 1 4 123 926Salmons, fresh or chilled, nei 50 - 40 356Salmon nei, not minced, prep.or pres, in airtight containers - -Salmonoids, fresh or chilled, nei 2 - - - 2 372Salmon fillets, frozen -Chum salmon, not minced, prepared or preserved 35 594Sockeye salmon, not minced, prepared or preserved, nei 3,214 27,341Salmons, salted or in brine 43 - - - -Pacific salmons nei, not minced, prepared or preserved 114Salmonoids, frozen 51 2 - 38 971 14,290Salmon roes, cured 91 - 779Salmon nei, not minced, in oil, prepared or preserved 516Salmon roes, frozen 363 11,010Salmonoids fillets, fresh or chilled 3Salmons, smoked 245 1 1 45 281Pink salmon, not minced, prepared or preserved, nei 3,094 19,628
Export ValueCanada Japan Korea, Dem. People's RepKorea, Republic ofRussian FederationU.S.
Atlantic and Danube salmons, fresh or chilled 394,825 16,279Salmon steaks, frozen -Sockeye salmon (red salmon)(Oncorhynchus nerka), frozen 3,742 1,204 18 129,457Salmon steaks, fresh or chilled -Salmon nei, not minced, prepared or preserved 890 - 833 576 9,640Coho salmon, not minced, prepared or preserved 139Salmonoids fillets, frozen 11,934 1,736Pacific salmon, fresh or chilled 42,149 8 26,010Salmon fillets, fresh or chilled 50,869Salmon minced, preparations 2,909 - 4,626Pacific salmon, frozen, nei 25,615 110,320 - 5,641 133,619 247,469Salmonoids, salted or in brine -Atlantic salmon and Danube salmon, frozen 428 6 24 347 4,365Salmons, fresh or chilled, nei 281 - 46 2,685Salmon nei, not minced, prep.or pres, in airtight containers - -Salmonoids, fresh or chilled, nei 8 - - - 17 2,261Salmon fillets, frozen -Chum salmon, not minced, prepared or preserved 157 1,597Sockeye salmon, not minced, prepared or preserved, nei 29,792 128,671Salmons, salted or in brine 410 - - - -Pacific salmons nei, not minced, prepared or preserved 902Salmonoids, frozen 190 36 - 89 2,219 38,553Salmon roes, cured 1,564 - 12,392Salmon nei, not minced, in oil, prepared or preserved 2,064Salmon roes, frozen 4,443 110,396Salmonoids fillets, fresh or chilled 35Salmons, smoked 4,015 25 6 353 5,127Pink salmon, not minced, prepared or preserved, nei 13,936 56,994

4 D:\Data\Documents \swd\WSC North Pacific salmon app.doc
Table A-3 (cont.)Import Quantity
Canada Japan Korea, Dem. People's RepKorea, Republic ofRussian FederationU.S.Atlantic and Danube salmons, fresh or chilled 3,940 21,577 81,162Salmonoids, fresh or chilled, nei 269 - - - - 46Sockeye salmon (red salmon)(Oncorhynchus nerka), frozen 3,864 45,731 - 4 45 77Salmonoids, not minced, prepared or preserved 1Pacific salmons nei, not minced, prepared or preserved 18,587Chum salmon, not minced, prepared or preserved -Salmons nei, frozen - 25,103Pacific salmon, fresh or chilled 3,453 930 4,903Salmonoids, dried, salted or in brine -Salmon steaks, fresh or chilled -Salmon roes, cured 40Pacific salmon, frozen, nei 5,295 77,892 176 1,317 5,172 2,085Salmonoids, salted or in brine -Salmon fillets, frozen 7,014 - 482 31,737Salmons, fresh or chilled, nei 386 - - 3,379 40,692 703Salmon nei, not minced, prep.or pres, in airtight containers 334 1,270 12 -Salmon roes, frozen 27Salmons, smoked 199 482 - 56 61 3,561Pink salmon, not minced, prepared or preserved, nei 3,872Salmonoids, frozen 182 178 - 100 966 348Salmon fillets, fresh or chilled - 71 90,971Sockeye salmon, not minced, prepared or preserved, nei 100Atlantic salmon and Danube salmon, frozen 79 2,394 22 7,573 2,992Salmon nei, not minced, prepared or preserved 1,020 9,565 - 53 134 2,142Salmon minced, preparations 62 3,841Salmon nei, not minced, in oil, prepared or preserved 39 172Salmon steaks, frozen -Salmonoids fillets, fresh or chilled 7,634Salmonoids fillets, frozen 181 - 21,390Salmons, salted or in brine - - 92
Import ValueCanada Japan Korea, Dem. People's RepKorea, Republic ofRussian FederationU.S.
Atlantic and Danube salmons, fresh or chilled 18,730 147,414 457,209Salmonoids, fresh or chilled, nei 1,650 2 - - 3 312Sockeye salmon (red salmon)(Oncorhynchus nerka), frozen 19,399 209,393 - 19 93 505Salmonoids, not minced, prepared or preserved 8Pacific salmons nei, not minced, prepared or preserved 70,106Chum salmon, not minced, prepared or preserved -Salmons nei, frozen - 93,164Pacific salmon, fresh or chilled 16,985 7,628 32,190Salmonoids, dried, salted or in brine 4Salmon steaks, fresh or chilled -Salmon roes, cured 963Pacific salmon, frozen, nei 14,817 303,251 248 5,214 8,648 10,551Salmonoids, salted or in brine -Salmon fillets, frozen 41,938 - 2,301 241,495Salmons, fresh or chilled, nei 2,878 - - 21,261 185,746 4,603Salmon nei, not minced, prep.or pres, in airtight containers 1,613 6,721 137 -Salmon roes, frozen 347Salmons, smoked 2,375 7,400 - 1,075 731 44,846Pink salmon, not minced, prepared or preserved, nei 16,798Salmonoids, frozen 642 977 - 288 1,499 1,745Salmon fillets, fresh or chilled - 353 705,506Sockeye salmon, not minced, prepared or preserved, nei 764Atlantic salmon and Danube salmon, frozen 538 12,149 111 42,636 16,053Salmon nei, not minced, prepared or preserved 6,126 61,487 - 879 861 15,281Salmon minced, preparations 244 25,112Salmon nei, not minced, in oil, prepared or preserved 127 876Salmon steaks, frozen -Salmonoids fillets, fresh or chilled 67,528Salmonoids fillets, frozen 715 - 98,065Salmons, salted or in brine - - 182

5 D:\Data\Documents \swd\WSC North Pacific salmon app.doc
Table A-3 (cont.)
Production QuantityCanada Japan Korea, Republic ofRussian FederationU.S.
Chinook salmon, not minced, prepared or preserved - -Chum salmon, not minced, prepared or preserved 35 2,437Salmons, salted or in brine 43 109,044 . 46Salmon fillets, fresh or chilled 11,822Salmon roes, cured 91 8,200 612Salmon steaks, fresh or chilled .Pacific salmons nei, not minced, prepared or preserved 3,787Salmonoids fillets, fresh or chilled 16Salmonoids, dried, salted or in brine -Salmonoids, smoked -Salmon roes, frozen 363 11,010Pacific salmon, frozen, nei 7,577 172,310 149,362 78,360Salmon steaks, frozen -Salmon fillets, frozen 22,475Salmonoids, frozen 38Salmons, smoked 245 . . 6,946Pink salmon, not minced, prepared or preserved, nei 3,094 38,367Sockeye salmon, not minced, prepared or preserved, nei 3,214 23,803Salmonoids fillets, frozen -Coho salmon, not minced, prepared or preserved 23 -Salmon nei, not minced, prepared or preserved 131 10,607 -Sockeye salmon (red salmon)(Oncorhynchus nerka), frozen 35,830Salmons nei, frozen 90
Source: FAO FishStat database, November 2009 extraction.