saline groundwater in mono basin, california 2. … · saline groundwater in mono basin, california...
TRANSCRIPT

WATER RESOURCES RESEARCH, VOL. 31, NO. 12, PAGES 3151-3169, DECEMBER 1995
Saline groundwater in Mono Basin, California 2. Long-term control of lake salinity by groundwater
David B. Rogers • and Shirley J. Dreiss 2 Earth Sciences Department, University of California, Santa Cruz
Abstract. Mono Lake is a perennial, closed-basin lake that has existed for at least 700 kyr. This 46-m-deep alkaline lake's present concentration is about 90,000 ppm total dissolved solids. Well logs show that beneath part of the lake, saline groundwater of concentration >18,000 ppm extends to the bottom of the basin fill aquifer (Rogers and Dreiss, this issue). Numerical simulations indicate that redistribution of the basin's solutes between the lake and underlying saline groundwater body, driven by late Quaternary lake level changes, may be responsible for the high present-day solute content of Mono Lake. At low lake levels, the high lake concentration causes solute loss via free convection; this .might occur more rapidly through faults or fractures. The saline-fresh groundwater interface position reflects a balance between the saline groundwater density and the force of inflowing fresh groundwater discharging near the shoreline. At higher lake stages, the shoreline discharge zone moves toward the basin edge, and the unrestrained saline groundwater mass subsides, drawing solutes from the lake into the basin sediments. Falling lake levels again constrict the saline groundwater beneath the lake, forcing saline water into the lake and increasing its solute content. The sediment permeability below the lake is the major control on the solute transfer rate between the lake and the groundwater reservoir. Only the larger, longer-term lake stage changes cause saline groundwater movement; depending on the assumed basin fill aquifer permeability, equilibration of the saline groundwater and lake solute content with lake stage changes requires hundreds to thousands of years. Simulations suggest that the historical conditions, where a more saline Mono Lake (50,000-90,000 ppm) overlies less concentrated groundwater (apparently -18,000 ppm), could be due to the still present impact of late Pleistocene lake high stands. Mono Lake's historical salinity data have a large scatter, but suggest a 5% decrease in the lake's solute content over the last 50 years. We estimated the diffusive solute flux into lacustrine sediments for this period from core data. The salinity data are consistent with a combination of solute diffusion into sediments and an equal, or greater, model-predicted advective solute loss to groundwater.
Introduction
In a seminal paper, Langbein [1961] noted the wide variation in salinity among hydrologically closed lakes: Walker Lake, Nevada, has a total dissolved solids (TDS) concentration of 2500 ppm, compared to 270,000 ppm for the Great Salt Lake, Utah. In his opening paragraph, Langbein [1961] remarked that "These differences in salt content need to be explained." We propose that such salinity and solute content differences may originate, in some cases, from the effect of past lake stage fluctuations on the basin's groundwater system. By changing the position and volume of the underlying saline groundwater body, lake level fluctuations drive solute redistribution be- tween a saline lake and groundwater system. Large changes in a lake's total solute mass can result from this phenomenon, even when the underlying saline groundwater is, at times, much less concentrated than the lake. These changes in distribution
•Now at Water Quality and Hydrology Group, Los Alamos National Laboratory, Los Alamos, New Mexico.
2Deceased December 14, 1993.
Copyright 1995 by the American Geophysical Union.
Paper number 95WR02109. 0043-1397/95/95 WR-02109505.00
of the saline groundwater and the lake's solute content may persist for hundreds to thousands of years. Similarly, the salt- water interface in a coastal aquifer may not be in equilibrium with current hydrological conditions, as a result of Pleistocene sea level changes [EssaM, 1990].
At the outset it is important to point out the distinction between the salinity and solute content of a saline lake. For example, we demonstrate here that Mono Lake's solute con- tent has apparently decreased by about 5% during the past 100 years, while its salinity has ranged between 50,000 and 90,000 ppm. The large change in lake salinity mainly reflects changes in lake level and has been controlled by the surface water balance of the basin. In this paper we address the solute bal- ance of the basin and the processes that partition the total mass of dissolved solutes between the lake and groundwater. We will show that both the salinity and solute content of a saline lake are important drivers in this sblute redistribution process, but lake salinity need not be the primary driver.
At Mono Lake, California, Pleistocene-scale lake level fluc- tuations appear to be capable of causing significant solute redistribution between the lake and the basin's groundwater. In this paper we show that the past lake stage changes may be responsible for the lake's relatively high present-day solute content. Mono Basin has one of the steepest closed-basin to-
3151

3152 ROGERS AND DREISS: SALINE GROUNDWATER IN MONO BASIN, CALIFORNIA, 2
Mon. o
Extended Lake Russell Basin
3500 BP 1981 m
Spill
Mono Lake
Hydrographic Basin
N
o 5 lO i I ! I I I I I I I I
o 5 lO • [ [ I I I I I I I I
Figure 1. Map of Mono Lake and late Pleistocene Lake Russell showing the hydrographic basin for each lake, the extent of Mono Lake at its historical low stand, during the late Holocene, and the maximum extent of Lake Russell (after Lajoie [1968], Vorster [1985], and topographic maps). Numbered sites are locations of shallow cores collected by L. G. Miller (U.S. Geological Survey (USGS), personal communication, 1989) (1 and 2) and Domagalski et al. [1990] (3, 4, and 5).
pographies in the U.S. Great Basin; therefore lake level re- sponds strongly to small climate fluctuations [Benson and Thompson, 1987]. For this reason, Mono Basin is a unique place to examine this aspect of lake-groundwater relationships.
Mono Lake is at least 700 lejr old [Gilbert et al., 1968; Lajoie, 1968; Christensen et al., 1969]. (We follow the convention that time periods are referred to as kyr or Myr and dates before present as ka or Ma.) The 46-m-deep lake is saline (with a 1992 concentration of about 90,000 ppm TDS) and alkaline (pH -9.7). It is located roughly in the center of Mono Basin (Fig- ure 1), a hydrologically closed 3-4-Myr-old sedimentary basin lying on the eastern slope of the Sierra Nevada range [Gilbert et al., 1968; Christensen et al., 1969]. Mono Basin contains up to
2100 m of late Pliocene and younger glacial, fluvial, lacustrine, and volcanic ash deposits [Pakiser, 1976]. Well logs show that saline groundwater, of concentration >18,000 ppm, extends beneath the lake to the bottom of the basin fill aquifer [Rogers, 1993b; Rogers and Dreiss, this issue]. This saline groundwater probably originated both as connate water in lacustrine sedi- ments and as a result of dense lake water recirculating into the basin fill.
In a related study [Rogers, 1993b; Rogers and Dreiss, this issue] we used a groundwater flow model to evaluate the hy- drologic factors affecting the distribution of saline groundwater beneath Mono Lake. The saline groundwater acts as a distinct unit, and a relatively thin interface separates it from fresh

ROGERS AND DREISS: SALINE GROUNDWATER IN MONO BASIN, CALIFORNIA, 2 3153
groundwater recharge. In simulations with recharge rates char- acteristic of the Sierra Nevada side of the lake, the interface is pushed beneath the lake, far from the shoreline [Rogers, 1993b; Rogers and Dreiss, this issue]. The interface probably lies di- rectly beneath the lakeshore around much of the rest of the lake. On the low-recharge northeastern lakeshore the top of the interface may be located outside the shoreline. These sim- ulation results account for the spring chemistry and distribu- tion of saline groundwater observed in Mono Basin. We also demonstrated that the lake and saline groundwater are hydro- logically connected, with a continual exchange of solutes aris- ing from density-driven circulation.
In this paper we use this variable-density groundwater flow and solute transport model to examine how the saline ground- water body underlying Mono Lake reacts to Pleistocene-scale lake level fluctuations. This allows us to quantify the resultant movement of solutes between the lake and the saline ground- water. The permeability of the basin fill beneath the lake is a major factor controlling the rate of solute transfer between the lake and groundwater. Therefore we use three separate per- meability models of the basin fill to evaluate how sediment permeability affects solute transfer between the lake and groundwater.
We use the model (1) to investigate the response of the lake's solute content and salinity, and the position of the saline groundwater body, to idealized sinusoidal lake fluctuations of varying stage and period and (2) to explore the specific reac- tion of the lake-groundwater system to the lake level chronol- ogy inferred for Mono Basin during the last 36 kyr. These exercises provide insight into the hydrological and temporal factors that influence both the saline groundwater distribution and lake-groundwater solute exchange, and they extend the conceptual model of closed-basin hydrology developed by Rog- ers and Dreiss [this issue].
Closed-Basin Solute Balance
A critical characteristic of closed-basin lakes is their large fluctuation in level, and hence volume and salinity, through time. Factors affecting accumulation of saline groundwater include salinity differences between the lake and groundwater [Bowler, 1986], the length of time the basin has been hydro- logically closed [Macumber, 1992], sediment permeability and transport processes [Rudolph et al., 1991; Konikow and Rodrfguez Ar•valo, 1993], and the degree of subsurface basin leakage [Wood and Sanford, 1990; Sanford and Wood, 1991]. The sediment pore water in closed lakes plays an unusually large role in storage of solutes, owing to large changes in lake level and salinity [Spencer et al., 1985a]. In many cases the total .......................... [L ngb btJlUtC 111i:tbb 111 tile li:tl•C uecreases as a lake recedes a ein, 1961; Lerman and Jones, 1973; Van Denburgh, 1975]. As con- centration in the falling lake increases, the solutes may diffuse into the lake sediments. When the lake rises and freshens, solutes diffuse back into the lake water [Lerman and Jones, 1973]. Free convection also may transport solutes into the underlying groundwater.
Jones et al. [1969] and Van Denburgh [1975] showed that the lake bottom and playa sediments of Abert Lake, Oregon, con- tain a significant dissolved solids load and that the solute con- centrations in the pore fluid greatly exceed that of the lake. Lerman and Jones [1973] modeled the diffusive redistribution of solutes between the pore fluids and lake water and con- cluded that flux out of the sediments contributed 45% of the
solutes that entered Abert Lake over a 25-year period. Surface water inflow added only 0.1% of the lake's solutes during this interval. Spencer et al. [1985b] found that accounting for solute storage in sediment pore water enabled them to balance the Great Salt Lake's solute budget over the last 30 kyr. They noted, however, that uncertainties in the quantity of solutes stored within the basin's sediments range up to an order of magnitude and uncertainties are 10-20% for pore fluids.
Lerman and Jones [1973] concluded that even very small rates of groundwater flow from the sediments into Abert Lake (i.e., >-0.1 cm/yr) are inconsistent with the sediment pore water concentration profiles observed within 1 m of the lake bottom. Groundwater inflow estimates based on lake bottom core anal-
yses may underestimate inflow by overlooking another fluid pathway: At Mono Lake, much of the sublacustrine ground- water inflow (and possibly outflow) may occur through faults and fractures, bypassing the shallow lake bottom sediments. The basin fill appears to be densely faulted: Along a 10-km section of the southern shoreline, a map by Stine [1987] shows 11 faults intersecting the lakeshore. For inflow to the lake this bypassing is enhanced by calcite self-sealing, where calcium- rich groundwater recharge precipitates calcite on encountering the alkaline lake water [Mariner et al., 1977; Cloud and Lajoie, 1980]. Numerous springs issue from the lake floor, apparently along faults [Lee, 1969; Oremland et al., 1987]. Many of these springs are fresh and related to tufa formation [Russell, 1889; Lajoie, 1968; Stine, 1987]. Other springs, such as the Paoha Island hot springs, have a salinity of 22,000-26,000 ppm TDS [Lee, 1969; Mariner et al., 1977].
Mono Lake During the Late Quaternary Lake Russell (Figure 1) is the name given to the late Pleis-
tocene lake that occupied Mono Basin. At its greatest extent, Lake Russell overflowed Mono Basin, and occupied Alkali Valley to the northeast [Russell, 1889]. Mono Basin may have overflowed southeast to Adobe Valley and Owens Valley at some time during the late Pleistocene but apparently did not spill during the last 35 kyr [Benson et al., 1990]. The present- day lake occupies only a fraction of its former basin (Figure 2).
Historical Lake Levels and Salinity
The level of Mono Lake (Figure 3) rose from the time of the earliest reports in the 1850s, to its historical high stand at 1959.2 rn in 1919 [Stine, 1987]. Los Angeles began diverting surface water from Mono Basin for municipal use in November 1940. As a result the lake level has fallen 14 m, salinity has doubled, and lake volume has decreased by more than half. The lake reached its historical low stand of 1942.2 m in 1982
[Stine, 1987]. Figure 3 shows Mono Lake's historical lake level and salin-
ity. Several published salinity values are omitted, either be- cause no density is reported for them or the TDS and density values are inconsistent with other data and apparently in error. The salinity data collected at six to eight stations on four dates in 1974 (29 values) and two dates in 1979 (15 values) by Los Angeles Department of Water and Power (LADWP) [1987] show that the lake salinity is difficult to precisely characterize (ver- tical bars in Figure 3 (bottom)). The values for one surface station near the Sierra Nevada were as low as 20 g/L TDS (data not shown) [LADWP, 1987]. This low value reflects freshwater inflow from the tributary streams. The standard deviation of the six to eight salinity measurements ranges from 0.33 to

3154 ROGERS AND DREISS: SALINE GROUNDWATER IN MONO BASIN, CALIFORNIA, 2
a) 2200
2100
2000
1900
b) 2200
2100
2000
1900
- - -Basin spill level (2180 m)- ---/' Average basin
topographic profile / ]'
'-3500 BP Lake 1968 Lake Level--•..•" median gradient .... ...r_•,L ,ake ,Bo,tto• !19,08 ,m): r ,
5000 10000 15000
Basin Radius (m)
0 15
/ 3500 BP Lake Level (1980 m)-- ! 1968 Lake Level (1947 m)•
Lake Bottom (1908 m)
5 10
Basin Volume (m 3 x 101%
Figure 2. (a) Mono Basin-Lake Russell Basin average topo- graphic profile, with index lake levels and assumed water table elevations, at the basin median water table gradient, and (b) stage-volume relationship (based on data from Los Angeles Department of Water and Power (LADWP) [1987], Stine [1988], K. R. Lajoie (personal communication, 1990), and topographic maps).
29.1% of the mean TDS for a particular date. Without the west end lake surface values, the TDS for a particular date has a variation of 2-5 g/L, and standard'deviations are 0.33-1.5% of the mean TDS.
We calculated Mono Lake's historical total solute content
(Figure 3) from the salinity and stage-volume data of Russell [1889], Lee [1906], LADWP [1987], and Rogers [1993b]. The ovals (Figure 3 (bottom)) show the range of total solute mass for the 1974 and 1979 data [LADWP, 1987]. The mean solute mass in Mono Lake from 1940 to 1980 was 2.64 x 10 TM kg. The spread of the 1974 and 1979 values is _+0.1 x 10 TM kg, or +_3.8% of this average mass. A linear fit (Figure 3, correlation coefficient equals 0.5) to the solute mass data suggests a solute loss rate of 1.24 x 10⁸ kg/yr, or a yearly loss of 0.05% of the lake's average mass. This fit omits the 1974 and 1979 values, because no density is reported for them (calculated densities were used). Depending on how they are interpreted, the data suggest that Mono Lake has lost about 5% of its solute mass since either 1882 or 1940. The solute loss rates estimated from
data for only the last 40 or 50 years range from 2.5 x 10⁸ to 4.0 x 10⁸ kg/yr, with correlation coefficients of 0.6-0.8.
Late Quaternary Lake Levels and Salinity
Stine [1987, 1990] used geomorphic evidence to determine the late Holocene lake level history of Mono Lake. Lajoie [1968] and Benson et al. [1990] described Lake Russell's late Pleistocene fluctuations. The lake fluctuated within a 36-m
range above its present elevation during the last 10 kyr (Figure 4) [Benson et al., 1990; Stine, 1987, 1990; K. R. Lajoie, personal communication, 1990]. During the Late Wisconsin, from about 35 to 10 ka, Mono Lake was between 90 and 210 m deeper than today [Benson et al., 1990].
The calculated lake concentration in Figure 4 assumes that the solute mass in the lake has remained constant through time at the 1940-1980 mean of 2.64 x 10 TM kg. Stine [1988] esti- mated the paleosalinity of Mono Lake with a similar method. He considered the change in lake volume due to uplift and eruption of Paoha Island, and the estimated sediment accu- mulation in the lake. The highest salinity over the last 3.5 kyr (--•95 g/L) is likely to have occurred in 1982, at the lake's historical low stand (Figure 3) [Stine, 1988]. Limited paleon- tological evidence indicates that the lake's salinity during most
1960
1955
1950
1945
Year
1860 1880 1900 1920 1940 1960 1980
_
_
[Lake elevation I - _
I I I I I I I I I I
6430
6410 •'•
6390 •
6370
2.6
2.4
i i i i i i i i i i i I i I ,•
- o - Tothl soiute •ass- • 9 100 •
• /•-- Average lake salinity ' •- .... 8o :•
9 '• ß r•
60 1860 1880 1900 1920 1940 1960 1980
Year
Figure 3. (top) Historical lake levels and (bottom) lake salinity and total solute mass for Mono Lake. Lake level and salinity curves modified from Stine [1988, 1991]; total solute mass calculated using data from Russell [1889], Lee [1906], LADWP [1987], Stine [1988, 1991], G. Coufal (LADWP, written communication, 1992), Schlichting and Cain [1993], and Rogers [1993b]. Bars show the range of salinity, and ovals the calculated solute mass range, for analyses by LADWP [1987] in 1974 (29 values) and 1979 (15 values).

ROGERS AND DREISS: SALINE GROUNDWATER IN MONO BASIN, CALIFORNIA, 2 3155
of the last 36 kyr was much lower than in historical time [Benson et al., 1990].
The record of lake level variations derived from geomorphic evidence is less well resolved at times further in the past. The high-frequency lake level fluctuations (Figure 4 (top)) de- scribed for the last 1.8 kyr by Stine [1987, 1990], derived from a detailed analysis of exposed strata, probably apply as well to the period before 1.8 ka. For this earlier period, only the record of the most extreme changes in lake level is still dis- cernible.
The fluctuations of Mono Lake prior to 35 ka may be in- ferred from the history of the Pleistocene Owens River system. Mono Basin is at the northern end of this chain of pluvial lakes, which extends to Death Valley [Smith, 1976]. Jannik et al. [1991] produced a lake level chronology for the paleo-Owens River Basin, covering the last 2 Myr, by analyzing cores from Searles Lake and Panamint Valley. Their chronology shows that the dominant periods of lake level fluctuations during the last 700 kyr are in the 15-50 kyr range.
Simulating the Late Quaternary Groundwater System Conceptual Model
Our model encompasses the floor of Mono Basin (the area occupied by Pleistocene Lake Russell) and represents the un- derlying basin fill aquifer. These two areas are nearly coinci- dent [Vorster, 1985]. In this paper we extend our conceptual- ization of groundwater flow in Mono Basin, as presented by Rogers and Dreiss [this issue] to include the effect of changing lake levels. This is achieved through modifying the upper boundary conditions to reflect a fluctuating lake with varying extent. We assume that the basin's water table rises along with the lake, maintaining the same gradient (Figure 2). This means that total groundwater recharge decreases at higher lake levels, owing to a smaller basin floor area. We investigate how three separate permeability models of the basin fill (discussed below) affect the lake fluctuation-induced solute transfer between the
lake and groundwater system. Our analysis is designed to ex- amine the solute interchange that occurs mainly through the eastern part of the lake bottom, beneath which most of the saline groundwater is apparently located [Rogers and Dreiss, this issue].
Our model does not include direct solute diffusion into lake
bottom sediments but treats the lake as a separate, well-mixed reservoir which exchanges solutes and water with the ground- water by advection. The effect of lacustrine sedimentation is not explicitly included either. The high rates of sediment dep- osition characteristic of closed basins can bury large quantities of solutes in pore water [Y•tretich and Ceriing, 198.3; Ceriing, 1986]. The sedimentation rates in Mono Basin (0.06 cm/yr [Lajoie, 1968] to 0.08 cm/yr [Christensen et al., 1969], for com- pacted lacustrine sediments with porosities of 50-60%) amount to 28 m of sedimentation over 35 kyr.
Mathematical Model and Model Design
We simulated the groundwater system of Mono Basin with the finite element, variable-density flow and solute transport model SUTRA [Voss, 1984]. The analysis of groundwater sol- ute transport requires the simultaneous solution of mass bal- ance equations for both fluid flow and solute transport. The mathematical model, model design, and parameters are dis- cussed separately [Rogers and Dreiss, this issue]. We model
1980
1960
1940
2200
2100
2000
-X, /½.',/i!
, 10
?
• 0 4000 3000 2000 1000 0
Years BP
10
--Basin Spill Level
? Elevation
Concentration
5
1900 ¾ø' ' : .... :'" ' '"" ' ' 0 40000 30000 20000 10000 0
Years BP
Figure 4. Elevation and calculated concentration for Mono Lake during (top) the last 4 kyr [after Stine, 1987, 1990] and (bottom) the last 36 kyr (after K. R. Lajoie, personal commu- nication, 1990). The concentration estimate assumes a con- stant mass of solutes in the lake (see text).
Mono Basin as radially symmetric, with dimensions and prop- erties representative of the basin fill aquifer (Figure 5) [Rogers and Dreiss, this issue]. This choice incorporates the basin's radial geometry but presumes uniformity of recharge along the basin circumference.
Permeability Models for the Basin Fill Aquifer
The permeability of the basin fill beneath the lake is a major factor controlling the rate of solute transfer between the lake and groundwater. This applies especially to the sediments un- derlying the lake at its minimum extent: The lake water is most concentrated at its lower stages, and larger concentration or density gradients between the lake and groundwater may lead to the highest solute fluxes. We use three separate permeability models of the basin fill to examine the importance of perme- ability (Figure 6). Figure 6a shows the conceptual lithologic model synthesized from geological and geophysical studies and well logs [Rogers and Dreiss, this issue].
The actual permeability in the basin fill is uncertain, owing to both a lack of aquifer tests and the unknown role of fracture permeability. Our permeabilities are based on a groundwater flow model study of Smith Creek Valley, Nevada [Thomas et al., 1989], which is comparable in geology and scale to Mono Basin. While other basin-scale hydrologic studies have found permeability anisotropies as large as kx/kz = 104 [Bethke, 1989], our results indicate that a dense saline groundwater mass is not stable below the lake even with an overall anisot-
ropy as low as kx/kz = 10 [Rogers and Dreiss, this issue]. For highly faulted or fractured media, basin-scale permeability may be 3 orders of magnitude greater than for small samples [Neu- zil, 1986] and the vertical permeability may even exceed the horizontal permeability [Freeze and Cherry, 1979].
The "uniform" permeability model (Figure 6b) uses the

3156 ROGERS AND DREISS: SALINE GROUNDWATER IN MONO BASIN, CALIFORNIA, 2
lake
• basin
' -•---P = pghlake • -'-p = pghwatffr table ,•, •--•Cin = Clake • • Cin = 0
=• • •• lake •11• basin floor-•• 12 m Cno no
ß , 16,000 rn
center of outer edge lake of basin
Figure 5. Mono Basin radially symmetric flow model (upper left) with expanded radial section showing the geometry and boundary conditions.
"basin-average" permeability of 9.34 x 10 -14 m 2 that we de- termined from an estimate of Mono Basin's groundwater re- charge [Rogers and Dreiss, this issue]. This permeability lies near the lower end of the range for silty sand [Freeze and Cherry, 1979] and is in the permeability range that Thomas et al. [1989] found for either playa margin and deep playa sedi- ments or mixed grain size deposits at the playa margin. Simu- lation results with this relatively high permeability model illus- trate a possible upper limit on lake-groundwater solute interchange rates.
The other two models (Figures 6c and 6d) are designed to investigate the hydrological effect of the lower-permeability lacustrine deposits that dominate the basin fill below the present lake [Christensen et al., 1969; Rogers and Dreiss, this issue]. These models both assume an inner 4000-m lithologic zone with a low permeability of 3.11 x 10 -ls m 2. This perme- ability is in the range for till and silt [Freeze and Cherry, 1979]. Thomas et al. [1989] found this value appropriate for playa surface deposits, their lowest-permeability lithologic group. Beyond 9000 m from the lake center, the permeability is uni- form at our basin-average permeability of 9.34 x 10 -14 m 2. For the transition zone between 4000 and 9000 m, the fraction of lacustrine deposits in the stratigraphic column varies linearly (Figure 6a).
These two models (Figures 6c and 6d) differ in the perme- ability of the transition zone between 4000 and 9000 m. The "zoned" model assumes a linear permeability variation, calcu- lated from the horizontal average (or equivalent) permeability formula [Freeze and Cherry, 1979]. The "average" permeability model is anisotropic in this zone, with different horizontal and vertical permeabilities based on the average permeability for- mulas. Bredehoeft et al. [1988] used a similar permeability con- struction to explain the pore pressure distribution in the south Caspian Basin.
Interface positions simulated with the average permeability model are qualitatively consistent with hydrologic observations at Mono Lake [Rogers and Dreiss, this issue]. The zone of anisotropy broadens the shoreline groundwater discharge zone, channeling flow farther beneath the lake, as shown by Pfannkuch and Winter [1984]. Both the zoned and average models have much lower permeabilities beneath the lake than
the uniform permeability model. The average permeability model has the lowest overall vertical permeability of the three models (Figure 6d). We anticipate that the zoned or average models may best represent the hydrologic behavior of the sediments filling Mono Basin.
Boundary Conditions
The boundary conditions are described by Rogers and Dreiss [this issue]; modifications are discussed here. The upper boundary (Figure 5) is specified pressure, corresponding to the lake and water table elevations. The choice of a specified pressure boundary condition is convenient for the simulation of changing lake levels. EssaM [1990] used this type of bound- ary condition to simulate the response of seawater intrusion in a coastal aquifer to Pleistocene sea level changes. The lake's depth and shoreline position are determined at each time step from the lake's stage, using the relationship depicted in Figure 2.
Above the lake the pressure boundary condition reflects the lake elevation. Landward of the lake edge the pressure corre- sponds to the water table elevation, which we approximated with a linear gradient (Figure 2a). With fixed model perme- ability, changing the water table gradient is analogous to vary- ing recharge. The uniform and zoned permeability models (Figure 6) use the basin mean water table gradient of 0.0308 (Table 1). The average permeability model, with the lowest vertical permeability beneath the lake, uses a gradient of 0.0075. This lower gradient results in approximately the same
a) Basin lithology model • lake • • basin floor •-•
b) Uniform permeability model 10-13
i ' • k =k =9.3x10'14m •/• • 10 -14 X Z
• Lake • •_• k/k X
10-151 , , , t , , , t , , ,
10
c) Zoned permeability model 10-13
,• 10 '14 k = k x
• k/k , x z
10_15 ß . ..........
10
d) Average permeability model 10-13
.•10 -14
10-15 kx/k z
, i i i , • i 0
0 4000 8000 12000 16000
Model Radius (m)
Figure 6. (a) Lithologic model of the basin fill aquifer and (b-d) plots of permeabilities and anisotropy for the three per- meability models.

ROGERS AND DREISS: SALINE GROUNDWATER IN MONO BASIN, CALIFORNIA, 2 3157
Table 1. Initial Condition Characteristics for the Three Permeability Models
Permeability Water Groundwater Groundwater 0.9 Wt % 0.9 Wt % Model Table Recharge, Solute Mass, Contour Top Contour Toe
(Figure 6) Gradient kg/s kg Position, m Position, m
Uniform 0.0308 2.76 X 10 3 1.053 X 10¹² 6333 6914 Zoned 0.0308 2.74 X 10 3 0.998 X 10¹² 6150 6760 Average 0.0075 6.70 x 10² 1.084 x 10 •2 5900 7800
steady state saline groundwater configuration as for the other two cases, but lower net groundwater recharge and flow veloc- ities (Table 1). This choice is discussed further below.
For solute boundary conditions any water entering the aqui- fer through the lake bottom has the concentration of the lake. Water entering through the basin floor has zero concentration. The lake's total solute mass is updated each time step by keeping track of solute losses or gains in the underlying aqui- fer. The lake concentration (TDS in grams per liter) is recal- culated at each step by dividing the total mass of solutes in the lake by the current time step's lake volume, determined from the hypsometric relationship shown in Figure 2. The lake con- centration in parts per million is calculated from the grams per liter values using a concentration-density relationship for Mono Lake water (Table 2) [Rogers, 1993b].
Our simulations assume that a constant addition of solutes
to the lake occurs, representing solute input by rock weather- ing and precipitation. The accumulation rate for solutes is 0.03 kg/s, on the basis of estimates of the basin-averaged input of chloride from rainfall [Rogers, 1993b]. As the rainfall has an approximate chloride concentration of 0.3 mg/L [Whitehead and Feth, 1961; Feth et al., • 1964; Rogers, 1993b], the total meteoric chloride input for the basin is 2.2., x 105 kg/yr. We also assume that the lake's total solute input is related to chloride input by [C1] (parts per million) -0.23 x TDS (parts per million), on the basis of Mono Lake ,composition data of LADWP [1987] [Rogers, 1993b]. This small addition of solutes has little effect on the results; both because the total solute mass in the system is high compared to that delivered by weathering over the time modeled and because the long-term average lake-groundwater solute exchange rates are an order of magnitude larger than the assumed weathering input rate.
Model Parameters
The selection of a value for storativity poses a problem for our model formulation. The specific pressure storativity for the aquifer matrix, with units of Pa- •, is Sop = (1 - e) a + e/3, with e porosity, a the porous matrix compressibility, and/3 the fluid compressibility [Voss arid Souza, 1987]. As lake level rises in our simulations, the water table rises above the ground surface on former lakeshore. The concept of storativity is based on the premise that weight of overburden is constant [Freeze and Cherry, 1979]; this assumption is therefore violated in our simulations. Further, the one-dimensional vertical aqui- fer compressibility constant a derives from the concept of changing effective stress [Freeze and Cherry, 1979]. Changing the water column height above the ground surface does not change the effective stress: The overburden pressure and fluid pressure change by the same amount, so the effective stress (the difference between these values) is zero. The storativity formulation in SUTRA [Voss, 1984] does not properly handle this situation, so we set a to zero to avoid a nonphysical change of aquifer pore volume resulting from the significant changes
in overlying water depth. Other parameters are listed in Table 2 and are discussed by Rogers and Dreiss [this issue].
Initial Conditions
The initial conditions used for these simulations represent an idealized pseudo steady state flow system with the hydro- logic characteristics of Mono Basin in 1968, the time of Lee's [1969] hydrological investigation [Rogers and Dreiss, this issue]. The 1968 lake level was 1947.4 m. The initial pressure and solute conditions are the final steady state results for each permeability model (Figure 6) and water table gradient (Table 1), as described by Rogers and Dreiss [this issue]. In producing these results we assumed an initial uniform groundwater con- centration of 18,000 ppm TDS below the lake. In order to achieve a steady state we used the same concentration value for the lake and groundwater. For the current initial conditions the lake has an initial concentration of 65,700 ppm, higher than the groundwater. The initial solute mass in the lake is 2.64 x 10 • • kg, the 1940-1980 mean. Thus the initial condition is unstable and represents our interpretation of the present sit- uation at Mono Lake, where the lake apparently has a much higher salinity than the underlying groundwater [Rogers and Dreiss, this issue].
The initial conditions for the uniform and zoned permeabil- ity models are similar (Table 1). The permeability below the basin floor (Figure 6), which controls the recharge rate in the steady state flow system, is the same for these two models. Using the average permeability model with the same recharge pushes the interface well beneath the lake floor. In our analysis we want to examine the solute interchange that happens across the floor of the eastern part of lake, below which most of the saline groundwater is evidently located [Rogers and Dreiss, this issue]. For the average permeability case initial condition, we used a lower water table gradient so that the interface is lo- cated near the shoreline; thus all of the cases have about the same initial mass of groundwater solutes. Because of this lower water table gradient the average permeability model case has only 25% of the net groundwater recharge in the other models and lower flow velocities. Table 1 lists the position of the 0.9 wt % (weight percent, 1 wt % = 10,000 ppm) concentration con-
Table 2. Model Parameters
Parameter Value
Density (kg/m3)-concentration (kg TDS/kg fluid) relation
Dynamic viscosity, kg m-• s- • Molecular diffusion coetficient, m2/s Fluid compressibility, Pa -• Basin fill porosity Longitudinal dispersivity, m Transverse dispersivity, m
p = 1000 + 875.36C
10 -3 1.5 X 10 -9 4.5 x 10 -•ø
0.35
200
50
TDS denotes total dissolved solids.
3158 ROGERS AND DREISS: SALINE GROUNDWATER IN MONO BASIN, CALIFORNIA, 2
tour for each initial condition. For the initial condition simu-
lations this is the 50% concentration contour for the base
concentration of 1.8 wt % and reflects the saline-fresh ground- water interface position.
Transient Sensitivity Analysis Sinusoidal Lake Stage Fluctuations
Our transient sensitivity analysis looks at how a range of lake level fluctuations, of various magnitudes and durations, control solute partitioning between the lake and groundwater and af- fect saline groundwater distribution. We use sinusoidal lake level fluctuations and examine how varying the amplitude and period changes the simulation results. This allows us to infer the role that past lake stage fluctuations have played in deter- mining Mono Basin's solute balance.
Stage as a function of time is based on a sine function, beginning at a specified minimum stage:
Srnax- Smi n 2t
S = Smin -3- 2 {1 + sin [ (•+ 3•)z-] } (1) with Smi n and Smax the minimum and maximum stages, respec- tively; t time; and T the period of fluctuation. This function equals Smi n at t = 0 and t = n T, and equals Sm•,, at t = n T/2, where n is a positive integer.
We investigated sinusoidal oscillations with periods ranging from 0.625 to 80 kyr. At even shorter periods, no significant movement of the saline groundwater or change in lake solute mass occur (see below). The chronology of Jannik et al. [1991] shows that the dominant fluctuation periods for lake levels in the paleo-Owens River Basin since 700 ka are in the 15-50 kyr range. We explored two maximum stage values: 2155 m, rep- resenting late Pleistocene Lake Russell, and 1980 m for the major late Holocene fluctuation that occurred between 2 and 5 ka (Figures 1 and 4). These two values sutficiently represent past variations in the lake's extent, relative to the basin mor- phology (Figure 2), for us to draw conclusions about other stage changes. The minimum stage was set at 1947.4 m, the 1968 lake level.
Voss and Souza [1987] discuss the selection of time steps for accurate numerical solution. We ran each simulation for 2000
time steps. The time steps were of size 0.002T, or 500 steps for each full lake level oscillation. For example, a time step of 40 years was used for a 20-kyr period.
Sinusoidal Lake S•age Results In this section we discuss some representative simulations to
illustrate the processes which transfer solutes between the lake and saline groundwater. The examples show how these pro- cesses change with variations in maximum stage, lake oscilla- tion period, and permeability model. The parameters used to compare the simulation results are the temporal variations of lake concentration, the total solute mass in the lake and groundwater, and the saline groundwater interface position. The interface is tracked using the position of the top and toe of the 0.9 wt % (9000 ppm) contour, which is the 50% concen- tration contour for the initial condition simulations. In subse-
quent sections we summarize how solute transfer between the lake and groundwater systems varies with lake stage, oscillation period, and permeability.
Figure 7 shows the simulation results for the uniform per- meability model, T = 20 kyr, and Sm•, , = 2155 m. The lake
salinity, solute mass distribution, and saline groundwater in- terface position follow a periodic cycle in response to the forcing of changing lake level. Figure 8 depicts representative time steps during the cycle; subsequent simulation examples show similar stages in the sequence of lake levels and saline groundwater movement. At low lake levels (Figure 8b) the position of the saline-fresh groundwater interface reflects a balance between the saline groundwater density and the force of inflowing fresh groundwater discharging near the shoreline [Rogers and Dreiss, this issue]. This flow regime is described as mixed convection, where buoyancy forces and external forces are both important in the flow system [Domenico and Schwartz, 1990].
During rising lake stage the lake edge moves toward the outside of the basin (Figures 7c and 8c). This moves the shore- line's intense groundwater discharge zone outward, and the now unrestrained saline groundwater mass subsides toward new stable position at the bottom of the basin fill (Figure 8a). At higher lake stages the flow regime beneath the expanded lake includes zones of both fresh and saline groundwater but is dominated by free convection, Where buoyancy forces domi- nate [Domenico and Schwartz, 1990]. While the lake is high, the interface toe moves steadily outward, and the top of the inter- face becomes detached from the saline lake water. Note (Fig- ure 8a) that groundwater flow beneath the lake floor and above the subsiding saline groundwater mass is predominantly down- ward, while groundwater flow in front of the advancing toe is toward the basin edge. The subsidence of the saline ground- water body draws saline water through the lake floor into the underlying basin fill, further decreasing the lake's total solute mass (Figure 7b). This mechanism is more pronounced in subsequent simulations.
With falling lake levels, the inward moving shoreline groundwater discharge zone encounters the interface and pushes the saline groundwater back toward the basin center (Figure 8b). The inward constriction of the saline groundwater forces solutes back up into the lake (Figure 7b). The motion of the interface lags the retreating shoreline, and the interface continues to move inward even after the lake reaches its min-
imum stage (Figure 7c). The near coincidence of the lake's minimum volume and highest solute content produces a high lake concentration at low stand.
The impact on the simulation results of the unstable initial condition, with an assumed initial lake salinity higher than that of the groundwater, is minimal. In fact, it is a fortuitous choice, because the consequence is that solutes initially drain from lake (Figure 7b). This anticipates the pattern following each subsequent return of the lake to its low stand. At very short lake oscillation periods, on the other hand, this initial solute drainage dominates the lake's solute mass history, and the interface moves generally outward.
Two advective mechanisms account for solute loss from the
lake to the groundwater: (1) lake water drawn through the lake floor above the subsiding saline groundwater mound (forced convection, Figure 8a) and (2) density-driven free convection of high-salinity lake water into the groundwater during lake low stands (Figure 8b). The quantity of solutes lost from the lake by free convection depends on several factors including lake salinity, the permeability beneath the lake, and the length of time the lake is at low stand, when the lake's concentration is highest. Given enough time at low stand relative to the permeability of sediments below the lake bottom, density- driven free convection eificiently transfers solutes into the

ROGERS AND DREISS: SALINE GROUNDWATER IN MONO BASIN, CALIFORNIA, 2 3159
groundwater (Figures 7b and 8b). For this reason the basin fill permeability structure beneath the lake at low stand is the most important stratigraphic control on solute loss from the lake.
Of the three permeability models (Figure 6) the uniform model has the largest permeability below the low stand lake and permits the greatest solute loss by free convection through the lake floor. This loss occurs at the center of the lake (Figure 8b) because the interface is still moving inward (Figure 7c) and saline groundwater is discharging through the portion of the lake floor nearest the shoreline. As lake level begins to rise again, the interface toe moves out from its minimum point (Figure 8c), and lake water enters along the entire lake floor. This entry of still concentrated lake water near the lakeshore creates the closest approach of the interface top (the 0.9 wt % contour) to the lakeshore (Figure 7c). With further increase of lake stage and subsidence of the saline groundwater mass, the groundwater mixes, and the convection cells are no longer apparent (Figure 8a). In the present example the mechanisms causing solute loss from the lake dominate those operating in the other direction, and the system achieves a repeated cycle after one oscillation.
a) 2200 10
2100
2000
1900
0.0
Concentration
• ,
Uniform Permeability, T=20k, Smax=2155 m , , , i i i
Stage
20000 60000 - 0
0 40000 80000
Total Solute Groundwater" Mass
0
Lake.
20000 40000 60000 80000
C) 16000
12000
8000
40O0 ['"'... Interface/'"! e ['"i ['i .'•
, ,i, "i,, ,i, ':!, ,/, 0 20000 40000 60000 80000
Years
Figure 7. Simulation results for uniform permeability model, T = 20 kyr, and Smax = 2155 m: (a) lake levels and modeled lake concentration, (b) solute distribution between lake and groundwater, and (c) position of lake edge and interface top and toe (0.9 wt % (9000 ppm) concentration contour). The irregularity in the curves in Figure 7c reflects the element spacing of 200 m.
Uniform Permeability, T = 20 kyr, Smax = 2155 m
a) 36 kyr t•ke 0 5000 Radius (m) 10000 15000
, , • , i , • , , i , , i
b) 40 kyr
2.0 r •-- <'• <--- <--- •-- <--- <-- <-- •--- •,
1908 ,.• 1500 .• 1000 •
708 m
c) 42 kyr .•-• , ,, , ., •2.5 2.0*-,,x•,, '½1.0•(0.5 ß v... • • • • • • •
• 4.5 •yr • 1.4 •yr * 0.45 •yr } O. 14 •yr
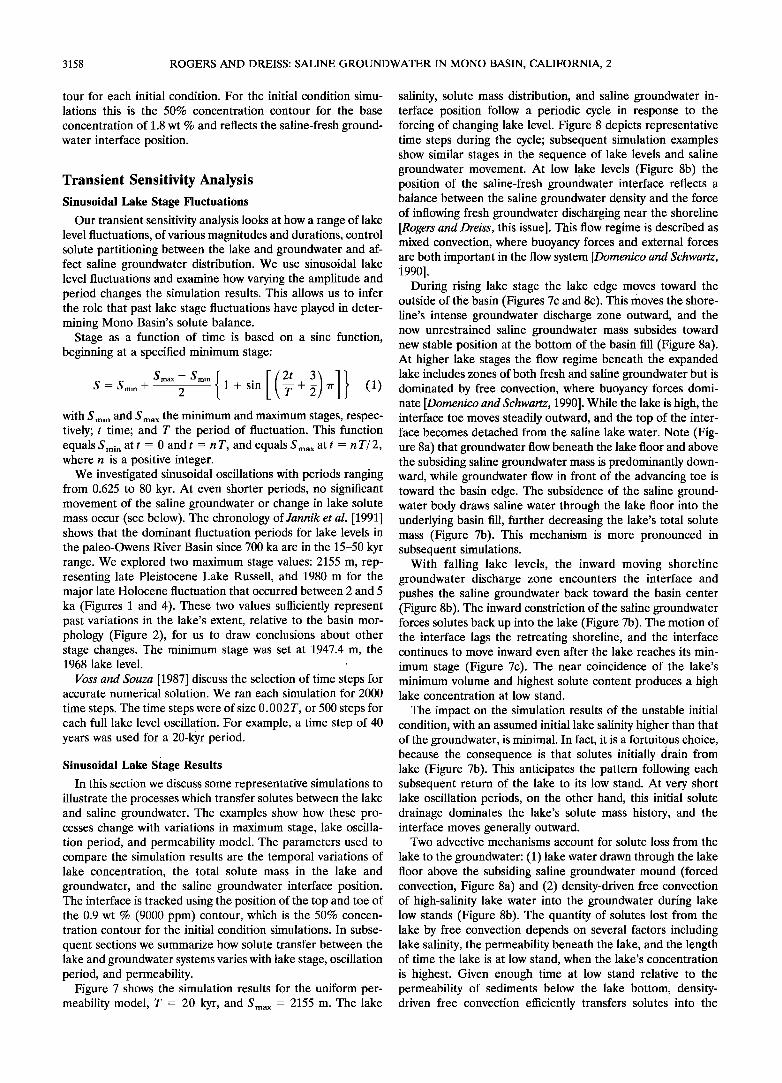
Figure 8. Simulation examples for uniform permeability model, T = 20 kyr, and Smax = 2155 m (vertical exaggeration equals 2) at three different times: (a) the interface toe has reached its maximum extension, (b) the lake has returned to its minimum stage and maximum solute content, and (c) the in- terface toe is near its minimum extension. Velocities are scaled
logarithmically over 2 orders of magnitude (for clarity, only one fourth of the element rows and columns are shown). Con- centration contours in weight percent; the contour interval is 0.5 wt % (5000 ppm). Large arrow shows position of the lake- shore for each time step. The convection cells are influenced by the two-din!ensional model geometry and the mesh size and do not ne'cessarily represent the actual convection pattern in Mono Basin.
For a shorter lake stage fluctuation period of 5 kyr (Figures 9 and 10), the interface toe moves a smaller distance than in the previous example. With falling lake level, the reduced movement of the interface drives a smaller quantity of solutes into the lake (Figure 9a). Constriction of the saline groundwa- ter continues to drive solutes into the lake even after it reaches
minimum stage (Figure 9b); this input exceeds solute loss from the lake and lasts until the lake expands again. The lower lake concentration and shorter time at low stand provide less op- portunity for solutes to escape by free convection. The solute loss rate decreases rather abruptly as the rising lake stage lowers the lake's concentration (Figure 9a), and solute loss by entry of lake water above the subsiding saline groundwater (Figure 10a) becomes a more important mechanism in this case.
Once again, the main solute loss from the lake during low stand occurs at the lake's center (Figure 10b), causing a brief nlc•f .... in fho lr•rmtirm c•f tho intorfnco tnn (Vitaire Oh• as it I • -vI- X- -c> ...... / - -
returns to the low stand lakeshore. When the lake expands again, solutes enter the groundwater across the entire lake floor (Figure 10c). As a result of the shorter time at low stand, solutes cannot escape from the lake as readily in this case, and the lake's solute mass increases over several stage oscillations. Eventually, the lake's concentration will increase to the point where free convection is more effective, balancing solute trans- fer in each direction.
To illustrate how lowering the maximum lake stage alters this picture, Figures 11 and 12 show results for T = 5 kyr and Sma x = 1980 m. The lower average lake level keeps the inter- face closer to the basin center. The smaller excursion of the
lakeshore causes the interface toe to extend about 500 m less

3160 ROGERS AND DREISS: SALINE GROUNDWATER IN MONO BASIN, CALIFORNIA, 2
Uniform Permeability, T=5k, Smax=2155 m a 1.o ................... lO
0.5
0.0
Concentration
Lake ,
solute ,
mass
',, 2 ø
0 5000 10000 15000 20000
b) 16000 .... , . . t
• , ,Lake / , / , / ' / ', Edge / • / '
,_, 12000
.• ,'Interface', / ', ,' ', ,' ', • 8000 ' Toe ' ,' ' ' ,' ' • '.. ..:' '.. i:: ;i '
• 4000 "-- "", :' ,. ..i '. ." Interface "-. :' "... "'" Top
0 , , , , i , , , • i , , , , i
0 5000 10000 15000 20000 Years
Figure 9. Simulation results for uniform permeability model, T = 5 kyr, and Smax = 2155 m: (a) modeled lake concentra- tion and lake solute mass and (b) position of lake edge and interface top and toe (0.9 wt % concentration contour).
than the case for Sma x = 2155 m, but the overall amplitude of the toe movement is about the same (compare Figures 9b and 11c). With a lower maximum stage the lake's concentration remains higher for a longer period (compare Figures 9a and 11a). Free convection of lake solutes back into the groundwa- ter is more effective than for a higher stage and continues after the lake begins to expand again (Figure 12c). The system establishes a repeated cycle after one oscillation. Because sol- utes loss from the lake is greater, the lake has a smaller solute content at its high stand than for the previous case and a larger difference between maximum and minimum solute contents.
Compared to the uniform model, the lower vertical perme-
Uniform Permeability, T = 5 kyr, Smax = 2155 m
a) 14 kyr ua• •- I 0 5000 Radius (m) 10000 15000
, , f,08 ' ' •'•c..2 • •,•'^ ;' ; • '• •, I¾ ,•'n•-.•L .a ß •10 •• • • • • %• • • •15• •
b)
c) 16 kyr
• 4.4 •yr o 1.4 •yr * 0.• •yr } 0.14 •yr
Figure 10. Simulation examples for uniform permeability model, T = 5 •r, and Sm• = 2155 m (see hgure 8 for explanation).
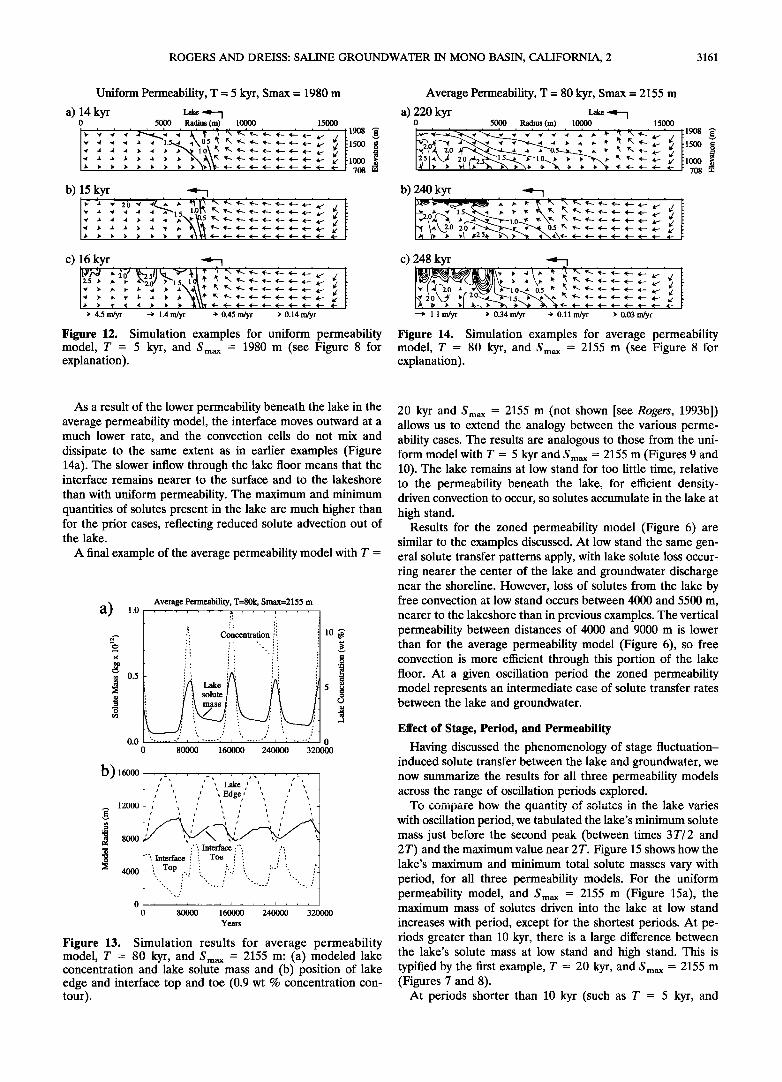
ability of the average permeability model (Figure 6) greatly slows solute advection between the lake and groundwater. The solute transfer processes operating between the lake and groundwater are the same as in the previous examples but require longer time periods to be as effective. The results for the average permeability model with T = 80 kyr and Sma x = 2155 m (Figures 13 and 14) are comparable to those from the uniform model with T = 20 kyr and Smax = 2155 m (Figures 7 and 8). The amplitude of interface toe movement is abQut the same distance in each case, and the average permeability ex- ample approaches a repeated cycle.
Even though the interface continues to move inward and push solutes into the lake after it reaches minimum stage (Figures 13 and 14), free convection operates effectively enough so that a substantial portion of the solutes reenter the groundwater (Figure 13a). Free convection ceases as the lake's rising level reduces its concentration, and forced convection continues to remove solutes at a lower pace •Figures i3a and 14a). Once again, solutes enter the aquifer by free convection through the central part of lake floor during low starid, while saline groundwater discharges into the lake through the' l•tke floor nearer the lakeshore (Figure 14b).
a) UniformPermeability, T=5k, Smax=1980m ..... , .... , .... , .... 10
Stage
en
5
1940 .... t .....
1960
b) 1.5
i
0 5000 10000 15000 o
20000
Total Solute Groundwater Mass
0.5
0.0 .... , ......... , ....
o 5000 lOOOO 15000 20000
C) 16000 .... , .... , .... , ....
12000 •' Interface Lake '• Toe Edge
- - / -x -- / -x
• / x t / .,' ', ,
4000 Interface Top
0 .... i , , , i i , , • i i , ,
0 5000 10000 15000 •0000 Years
Figure 11. Simulation results for uniform permeability model, T = 5 kyr, and Smax = 1980 m: (a) lake levels and modeled lake concentration, (b) solute distribution between lake and groundwater, and (c) position of lake edge and inter- face top and toe (0.9 wt % 'concentration contour).
ROGERS AND DREISS: SALINE GROUNDWATER IN MONO BASIN, CALIFORNIA, 2 3161
Uniform Permeability, T = 5 kyr, Smax = 1980 m
a) 14 kyr • 0 5000 Radius (m) 10000 15000
' ' ',.z.,• •' •'• ...... :19os •'
708 m
c) 16 kyr . • _. . 2.5 ß t, ' r,,, •... •_ •.._ •__ • •.._ a, •
• 4.5 •yr 4 1.4 •yr • 0.45 •yr } 0.14 •yr
Figure 12. Simulation examples for uniform permeability model, T = 5 kyr, and Smax = 1980 m (see Figure 8 for explanation).
Average Permeability, T = 80 kyr, Smax = 2155 m
a) 220 kyr Lake • 0 5000 Radius (m) 10000 15000
5 1. • •'" <-- <"' 1000 g • •-- •- •- •- 708 •
b) 240 kyr •-•
c) 248 kyr
I ¾ ß •l.O •' • • • • • g2o• }('• •lS_ •N* •••
• i.i •yr • 0.34 •yr e 0. i i •yr > 0.03
Figure 14. Simulation examples for average permeability model, T = 80 kyr, and Smax = 2155 m (see Figure 8 for explanation).
As a result of the lower permeability beneath the lake in the average permeability model, the interface moves outward at a much lower rate, and the convection cells do not mix and dissipate to the same extent as in earlier examples (Figure 14a). The slower inflow through the lake floor means that the interface remains nearer to the surface and to the lakeshore
than with uniform permeability. The maximum and minimum quantities of solutes present in the lake are much higher than for the prior cases, reflecting reduced solute advection out of the lake.
A final example of the average permeability model with T =
a)
¾ 0.5 • :: i' Lake: i i ! 5 • ! i solute ' : '
0.0 0 0 80000 160000 240000 320000
b) 16000
Average Permeability, T=80k, Smax=2155 m 1.0 ....... ?: .......
,
.. Concentration i' 10 •'
..•
'-' ' • ' 2x ' ' ' /,., , i , /L ' / Lake / •, • ' ' ' Edge, • ,' ',
g
• 8000 " "i Interface" 'i •o "". Interface i Toe . .
• 4000 '.. Top :' : ' :',.. /' ß :'.i : : !'" ß .
0 , , , i , , , i , , , i 0 80000 160000 240000 320000
Years
Figure 13. Simulation results for average permeability model, T = 80 kyr, and Smax = 2155 m: (a) modeled lake concentration and lake solute mass and (b) position of lake edge and interface top and toe (0.9 wt % concentration con- tour).
20 kyr and Sma x = 2155 m (not shown [see Rogers, 1993b]) allows us to extend the analogy between the various perme- ability cases. The results are analogous to those from the uni- form model with T = 5 kyr and Smax = 2155 m (Figures 9 and 10). The lake remains at low stand for too little time, relative to the permeability beneath the lake, for efficient density- driven convection to occur, so solutes accumulate in the lake at high stand.
Results for the zoned permeability model (Figure 6) are similar to the examples discussed. At low stand the same gen- eral solute transfer patterns apply, with lake solute loss occur- ring nearer the center of the lake and groundwater discharge near the shoreline. However, loss of solutes from the lake by free convection at low stand occurs between 4000 and 5500 m, nearer to the lakeshore than in previous examples. The vertical permeability between distances of 4000 and 9000 m is lower than for the average permeability model (Figure 6), so free convection is more efficient through this portion of the lake floor. At a given oscillation period the zoned permeability model represents an intermediate case of solute transfer rates between the lake and groundwater.
Effect of Stage, Period, and Permeability
Having discussed the phenomenology of stage fluctuation- induced solute transfer between the lake and groundwater, we now summarize the results for all three permeability models across the range of oscillation periods explored.
To UUIIII.)alC t. .... .t.. ...... .1.....42 •.-.1.,.•-,-,,-, ;.., •-1.,,• 1.•1• ' 11UW UlC ttuailuty u1 .UlUtWO us tuw •cux• vanes
with oscillation period, we tabulated the lake's minimum solute mass just before the second peak (between times 3T/2 and 2 T) and the maximum value near 2 T. Figure 15 shows how the lake's maximum and minimum total solute masses vary with period, for all three permeability models. For the uniform permeability model, and Smax = 2155 m (Figure 15a), the maximum mass of solutes driven into the lake at low stand
increases with period, except for the shortest periods. At pe- riods greater than 10 kyr, there is a large difference between the lake's solute mass at low stand and high stand. This is typified by the first example, T = 20 kyr, and Smax -- 2155 m (Figures 7 and 8).
At periods shorter than 10 kyr (such as T = 5 kyr, and

3162 ROGERS AND DREISS: SALINE GROUNDWATER IN MONO BASIN, CALIFORNIA, 2
0.6 0.5
0.4
0.3
0.2
0.1
0.0 102
b) 0.6 • 0.5
•o 0.4
:• 0.3
-• 0.2
• 0.1
Maximum Stage 2155 m
Initial mass
in lake
!
--<>--- Uniform Perm ' []
.... •---- Zoned Penn . ¾'
..... Average Perin/, ,•
10 3 10 4 10 • Period (ye•s)
Maximum Stage 1980 m
• Uniform Perm
.... •--- Zoned Perm
- - * - - Average Perm
Initial [] ..... []'" '
mass []"'o-:..:..•,-- in lake ,.--
10 2 10 3 10 4 l0 s Period (years)
Figure 15. Dependence of the maximum and minimum lake solute mass (for the second lake stage oscillation) on fluctua- tion period for all three permeability models: (a) Smax = 2155 m and (b) Sm• = 1980 m. The initial mass is the 1940-1980 mean of 2.64 • 10 TM kg.
Sma x = 2155 m, Figures 9 and 10), the minimum lake solute mass (Figure 15a) is higher. This identifies the period below which free convection becomes less effective at removing sol- utes from the lake owing to the short duration of the high- concentration low stand. At the shortest periods of 0.625 and 1 kyr, lake stage change has little effect on the position of the saline groundwater, and thus there is little variation in the lake's solute mass. For these short periods the mass in the lake is determined by the rate at which the solutes initially present have drained out of the lake. This rate is low in the case where
Sm•x = 2155 m: With large changes in stage and volume the lake's average concentration is low, and free convection less effective.
The zoned and average permeability models follow the same trend as the uniform model (Figure 15a) but are shifted to longer periods, corresponding to the lower rates at which the solute transfer mechanisms operate with lower permeabilities. The lower permeability beneath the lake slows the lake's solute loss, while displacement of solutes into the lake by constriction of the saline groundwater mass, which occurs near the lake- shore, retains its effectiveness. The shortest period at which lake fluctuations have a major impact on the lake's solute mass is greater for lower permeabilities, and the maximum solute mass in the lake at longer periods is larger.
Figure 16 shows how the maximum and minimum lake sol- ute concentrations vary with period. For Smax - 2155 m (Fig- ure 16a) the maximum concentration at the shorter periods follows a trend similar to the lake's maximum solute mass. The
concentration decreases at first with increasing period and then increases dramatically. At the longest periods, however, the maximum concentration decreases again. In these latter
cases the lakeshore retreat-driven movement of solutes into
the lake causes the lake's maximum solute mass to occur prior to low stand (see Figures 7 and 8). By the time the lake finally reaches low stand, when the lake's volume is minimum, it has already lost most of its solutes by free convection. For uniform permeability the minimum period at which this occurs is T = 20 kyr. The lake's small minimum concentrations (Figure 16a) are a result of the lake's large volume at high stand. The three permeability models follow the same pattern, shifted to longer periods with lower permeability.
The interface toe (the 0.9 wt % contour) movement is the best secondary indicator of how much solute mass transfers between the lake and groundwater. On the other hand, solute inflow through the lake floor often determines the position of the interface top (see Figures 7 and 8). The minimum and maximum interface toe positions for the simulations are shown in Figure 17. In all the cases, interface displacement increases with increasing period. The pattern for each permeability model is similar, but shifted with period. At short enough periods, there is negligible movement of the interface toe, corresponding to the point where the lake's minimum and maximum solute mass converge (Figure 15). The interface toe converges to a slightly different model radius for each of the three permeability models, reflecting the differences in bound- ary and initial conditions discussed earlier.
The interface toe moves out much farther for higher maxi- mum lake stage (Smax = 2155 m, Figure 17a) than for the lower stage (Smax = 1980 m, Figure 17b). For the higher stage the shoreline moves so far out that the interface is uncon-
strained until the lake has almost returned to its low stand
(Figure 9c). For Stoa x -- 1980 m the maximum toe displace- ment at longer periods is smaller (Figure 17b), because the
a) 12 Maximum Stage 2155 m
•' 10 --o-- Uniform Perm ,• ......... Zoned Perm • 8 ..... Average Perm ..' , '... '• ' t t []
• Inltlal o.,•' •. o ' -. - - u 4
concen- •j
• 2 tration 0 .... • , •. ,-'- .... -•----• .... '" • •..•,,I 10 2 10 3 10 4 l0 s
Period (years)
b) , , _
12 Maximum Stage 1980 m
• 10 --•--- Uniform Perm ,• .... [] .... Zoned Perm • 8 - - ß - - Average Perm
.,•
.•3.. •" - 6 Initial .-- - ;.[] . • lake rO 4 concen- [] ,, • tration - • 2
0---0 ......
0 ...... ,ø77,, ,'ø',": ,-•-, ,',•"':• 10 2 10 3 10 4 l0 s
Period (years)
Figure 16. Dependence of the maximum and minimum lake concentrations (for the second lake stage oscillation) on fluc- tuation period for all three permeability models: (a) Smax = 2155 m and (b) Sma x = 1980 m.

ROGERS AND DREISS: SALINE GROUNDWATER IN MONO BASIN, CALIFORNIA, 2 3163
lakeshore expands less (Figure 11c) and toe movement almost keeps up with the expanding lakeshore.
For Smax = 1980 m (Figure 15b) the maximum solute mass in the lake increases with period, except at the shortest periods, as for Smax -- 2155 m (Figure 15a). At larger periods the maximum mass levels off and decreases at the longest periods, unlike the earlier case. The maximum and minimum masses
present in the lake for Smax = 1980 m are lower than for Smax -- 2155 m, because solute loss occurs more rapidly and solute influx more slowly with a lower maximum stage. Because the lake's volume changes less, its average concentration is higher. The lake is at low stand for such a long time that free convection is very effective, relative to the slower displacement of solutes into the lake by the inward moving saline ground- water mass.
The concentration maxima and minima for Smax = 1980 m (Figure 16b) also follow the pattern for the higher stage. De- spite lower minimum solute mass the minimum concentration (at high stand) is greater than for Smax = 2155 m, because the lake volume is less.
For all of the cases shown, the minimum solute mass in the lake is less than the initial value. Large, long-term changes in lake stage effectively cycle solutes between the lake and groundwater. With Smax -- 2155 m and at periods exceeding 5 kyr the solute mass and concentration of the lake return to Mono Lake's typical historical values (i.e., 2.64 x 10 TM kg and 50,000-90,000 ppm). For Smax -- 1980 m and periods exceed- ing 5 kyr the lake's solute mass and concentration approach historical values. Thus the mechanism described here is capa- ble of having produced the current lake salinity, despite an
a) 12000 ........ , .................
Maximum Stage 2155 m • 10000 • Lakeshore .• at minimum
i 8000 • stage ---".... -'•_. '.'-'•i• • 6000 • Uniform
......... Zoned Perm
..... Average
4000 ...... 10 2 10 3 10
b) 12000
10000
8000
6000
Period (years)
4000 102
Maximum Stage 1980 m
Lakeshore . at minimum . ....- -- ' _•
stage ..• ..... '"-'- - - - • Uniform Perm
......... Zoned Perm
..... Average Perm
10 3 10 4 10 5 Period (years)
Figure 17. Dependence of the maximum and minimum in- terface toe position (for the second lake stage oscillation) on fluctuation period for all three permeability models: (a) Smax - 2155 m and (b) Smax - 1980 m. Note that for each permeability the toe position converges to a different model radius at shorter periods.
Figure 18. Definition sketch for duration of the concentra- tion or solute mass peak.
assumed groundwater salinity much lower than the lake salin- ity. We next turn our attention to the duration of these effects.
Duration of Lake Solute Content Changes
The large variations of lake stage give rise to pulses of higher total lake solute mass and concentration. Lake level histories
of the Great Basin lakes consist of intricate series of fluctua-
tions with variable duration and magnitude. We want to know how long these changes in lake solute content endure, in order to determine the relative importance of parts of the lake stage history. To quantify how long the changes in lake salinity and solute content last, we need to define what we mean by the duration of the resultant peaks. This is complicated by the asymmetric variation of the lake's solute mass with time in some cases (e.g., Figure 9a). The concentration peaks have a much simpler shape; this analysis confirms that lake stage exerts the dominant control on lake concentration. We define
the peak's duration as its full width at half amplitude (Figure 18). The amplitude is referenced to the prepeak solute mass or concentration minimum. Results based on this definition are
less sensitive to cases where there is a trend of increasing mass with time, as in Figure 9a.
To compare how the peak duration varies with period, we normalized duration to the oscillation period (Figure 19). The figure shows the normalized peak duration for the concentra- tion and solute mass peaks for all three permeability models. With uniform permeability and Sma x = 2155 m (Figure 19a) the solute mass peak duration has a resonance at periods of 2.5-5 kyr. The pulse of solutes displaced into the lake exceeds half the maximum solute mass for up to 80% of the oscillation period, compared to about 10% at other periods. Comparing the mass profiles for T = 20 kyr (Figure 7b) and T = 5 kyr (Figure 9a) shows that this resonance reflects the decreasing effectiveness of free convection in removing solutes from the lake at shorter periods, as seen in the minimum mass values (Figure 15a). The transition occurs at 10 kyr but does not show up until 5 kyr in Figure 19a, because the minimum solute mass is slightly less than half the maximum for this case. At the shortest periods such a small amount of solutes enters the lake ,h•, tho n,,lc• ;c chart lixzocl Tho pattorn far the c•thor nerrne- ability models is similar, just shifted with respect to period as before.
In the case of Smax = 1980 m (Figure 19b) the resonance at shorter periods is less. The pulse of solutes displaced into the lake exceeds half the maximum for only 50% of the oscillation period, compared to about 15% at other periods. These results and those for the minimum solute mass in the lake (Figure 15b) indicate that for uniform permeability and the lower max- imum stage the effectiveness of free convection decreases at periods of 5 kyr and less (Figure lib). The solute pulses for Smax = 1980 m generally last longer (minimum 15% of T) than for the higher stage. This results from the constraint on inter- face movement imposed by the shorter excursion of the lake-

3164 ROGERS AND DREISS: SALINE GROUNDWATER IN MONO BASIN, CALIFORNIA, 2
a) Maximum Stage •1• m
• Uniform Perm • Mass ......... Zoned Perm /,•'""•.•'•k
m ..... Average Pe•:,:,,,,,' i 0.:5 • Concen- / :: \ ,' ',,. • trationx / .: \
0.0 ............ : ...... ,7 --(....., 10 2 10 3 10 4 10 5
Period (years)
b) ......................... Maximum Stage 1980 rn
•o • Uniform Perm ß • ......... Zoned Perm • ..... Average Perm Mass
'• 0.5 Concen- '• trafionx. p,.-" . .'x,•. '-. • • 'i•. , -
• . ß
0.0 ........ • ........ ' ........ 10 2 10 3 10 4 10 5
Period (years)
Figure 19. Dependence of normalized peak duration for concentration and solute mass peaks (for the second lake stage oscillation) on fluctuation period for all three permeability models: (a) Sm•,, = 2155 m and (b) Sm•x = 1980 m. The peak duration is normalized to the oscillation period.
shore, and the longer interval of solute displacement into the lake as the lake level falls. At T - 80 kyr the duration of the solute mass peak increases again, because the lakeshore moves so slowly that the interface keeps up with it. For this case the solute content history of the lake almost directly reflects the shoreline movement.
The concentration peaks have a much simpler interpretation (Figure 19); this analysis confirms that the lake's stage (regard- less of history) exerts the dominant control on lake concentra- tion. For most of the cases represented, the duration of the concentration peak is roughly constant for a given maximum stage: about 0.2T for Stoa x -- 2155 m and 0.3T for Srnax -- 1980 m. The longer duration of the peaks for Sm•,, -- 1980 m, compared to the higher stage, reflects the lake's smaller vol- ume change and the lower differences between maximum and minimum concentrations (Figure 16b).The slight increase of duration for periods shorter than 10 kyr with Stoa x = 2155 m and uniform permeability (Figure 19a) again reflects the point where free convection is less efficient at removing solutes from the lake.
Implications
These results show that Mono Lake's decline in stage from pluvial high stands (Figure 4) could produce a long-lasting effect on its solute content. For a fall from 2155 m and assum-
ing T -- 40 kyr, the duration of the solute mass pulse entering the lake ranges from 12 kyr for the average permeability model to 4 kyr for uniform permeability (Figure 19a). For a fall from 1980'm with T = 2.5-5 kyr, the pulse duration for average permeability is 1 kyr, and for uniform permeability, 1.25-2 kyr (Figure 19b).
Besides sediment permeability the major factors controlling solute transfer between groundwater and the lake are the ex- tent and rate of lakeshore movement. The time and distance
over which the lakeshore expands and contracts determine the quantity of solutes that the receding lakeshore displaces into the lake, as the moving shoreline discharge zone constricts the saline groundwater volume. The rate of lake level decline de- termines the rate at which solutes are displaced into the lake. The time at low stand, when lake concentration is high, con- trols the lake's solute loss by free convection.
The results of the transient sensitivity analysis indicate that the larger, slower stage changes are the most significant in determining the lake's solute content. The mechanics of solute transfer between the lake and groundwater act as a low-pass filter. For a more complex lake stage sequence, with higher- frequency, low-amplitude fluctuations superimposed on larger oscillations, this means that the lower-frequency and larger- amplitude stage changes control the lake's solute content. The small changes in the lake solute content caused by the much smaller lake stage-induced oscillations of the interface are superimposed on any larger changes already under way.
Late Quaternary Basin Solute Balance We now examine how the model responds to Mono Lake's
late Quaternary stage fluctuation history (Figure 4). We use the lake stage chronology determined for the last 36 kyr by K. R. Lajoie (personal communication, 1990) and Benson et al. [1990] and simplify the higher-frequency fluctuation pattern deduced by Stine [1987, 1990] for the last 4 kyr. In addressing how Mono Lake's late Quaternary stage changes may have affected its s61ute content, we conclude that the high-frequency fluctuations documented by Stine [1987, 1990] (including the post-1940 lake level decline) have a negligible impact. The results of the previous sections show that lake stage fluctua- tions with periods shorter than 0.625 kyr do not affect the lake's solute mass through redistribution of the saline groundwater. However, through their control on salinity these fluctuations do affect the lake's rate of solute loss by free convection and diffusion. The results of this and the previous sections suggest that Mono Lake's earlier longer-period, larger stage fluctua- tions exert the main control on the lake's late Holocene solute
content. Other simulation experiments, specifically examining the lake's fluctuations during the last 2 kyr, bear this out [Rogers, 1993a, b].
Late Quaternary Lake Level Changes
The lake level chronology of K. R. Lajoie (personal com- munication, 1990) and Benson et al. [1990] begins with a rela- tive lake low stand at 36 ka and covers the most recent glacial period. No definitive chronology exists for the time prior to 36 ka. We arbitrarily assumed that for 4 kyr, beginning at 40 ka, the lake remained at our initial condition elevation of 1947.4 m
(Figure 20a). As in the previous sections, we began the simu- lations with the particular initial condition for each permeabil- ity model. Each simulation lasted for 2000 time steps of 20 years. Figure 20 shows the simulation results for all three permeability models. Figure 21 shows the simulated lake con- centrations for the last 12 kyr in more detail. The "constant mass" lake concentration (as in Figure 4, bottom) in Figures 20a and 21 is shown for comparison.
The main feature of the first 4-kyr period at low lake level is that solutes drain from the lake (Figure 20b). The results for
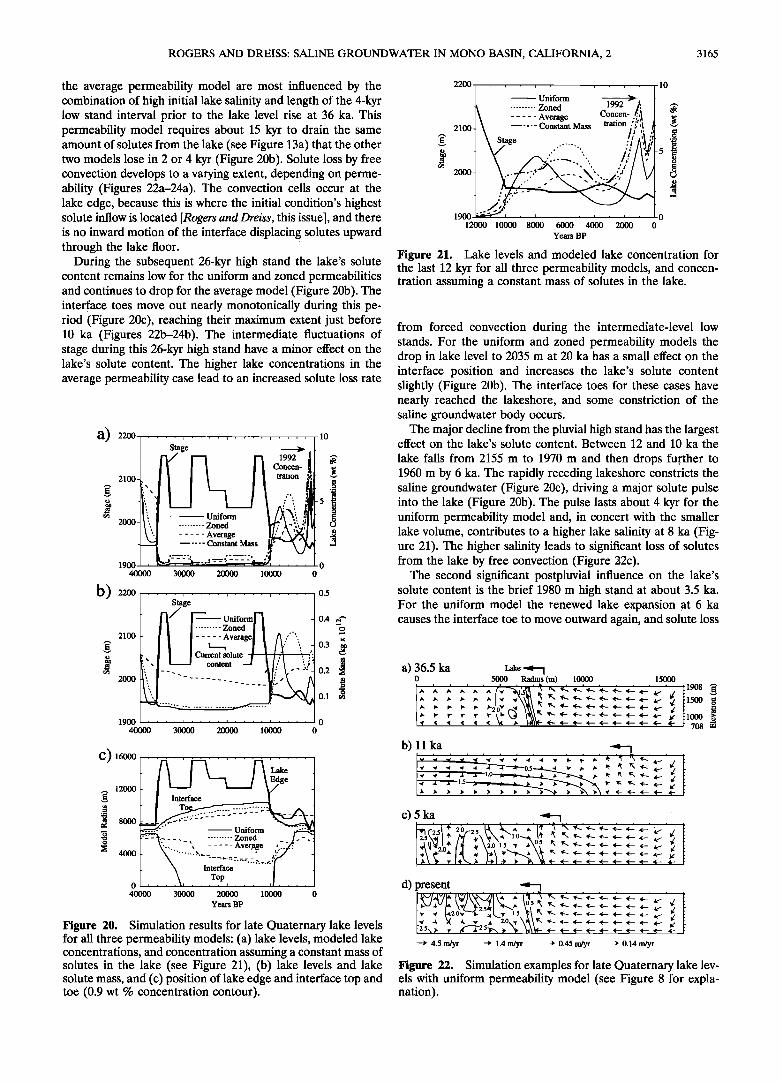
ROGERS AND DREISS: SALINE GROUNDWATER IN MONO BASIN, CALIFORNIA, 2 3165
the average permeability model are most influenced by the combination of high initial lake salinity and length of the 4-kyr low stand interval prior to the lake level rise at 36 ka. This permeability model requires about 15 kyr to drain the same amount of solutes from the lake (see Figure 13a) that the other two models lose in 2 or 4 kyr (Figure 20b). Solute loss by free convection develops to a varying extent, depending on perme- ability (Figures 22a-24a). The convection cells occur at the lake edge, because this is where the initial condition's highest solute inflow is located [Rogers and Dreiss, this issue], and there is no inward motion of the interface displacing solutes upward through the lake floor.
During the subsequent 26-kyr high stand the lake's solute content remains low for the uniform and zoned permeabilities and continues to drop for the average model (Figure 20b). The interface toes move out nearly monotonically during this pe- riod (Figure 20c), reaching their maximum extent just before 10 ka (Figures 22b-24b). The intermediate fluctuations of stage during this 26-kyr high stand have a minor effect on the lake's solute content. The higher lake concentrations in the average permeability case lead to an increased solute loss rate
•/ • ["l 1992 II [ I [• Cøncen-!ll 2100 [ ! • t eation •,,•
• 2000 t ", ......... Zoned 'i':2-fl \".l ..... L'
1900 ß , .k•.,-,-.--¾.Z•._.• • •' -•.•.._ •, .... I 0 40000 30000 20000 10000 0
I ..........
:1oo 2000 _
1900 0 40000 30000 20000 10000 0
0.4 •
0.3 .•
0.2 • 0.1 •
C) 16000
,_, 12000
..•
• 8000
0 40000 30000 20000 lOOOO o
Years BP
Figure 20. Simulation results for late Quaternary lake levels for all three permeability models: (a) lake levels, modeled lake concentrations, and concentration assuming a constant mass of solutes in the lake (see Figure 21), (b) lake levels and lake solute mass, and (c) position of lake edge and interface top and toe (0.9 wt % concentration contour).
2200 . , .... 10
- Uniform ......... Zoned 1992
1• ..... Avera e Concen-/.:,,•: g . 2100 ..... Constant Mass trataon ,• I \ Stage .... '!^',!:?t
4 \/ ... '",,, 2000
1900 '-•'-• • , • , • , , , , , 12000 10000 8000 6000 4000 2000 0
Years BP
Figure 21. Lake levels and modeled lake concentration for the last 12 kyr for all three permeability models, and concen- tration assuming a constant mass of solutes in the lake.
from forced convection during the intermediate-level low stands. For the uniform and zoned permeability models the drop in lake level to 2035 m at 20 ka has a small effect on the interface position and increases the lake's solute content slightly (Figure 20b). The interface toes for these cases have nearly reached the lakeshore, and some constriction of the saline groundwater body occurs.
The major decline from the pluvial high stand has the largest effect on the lake's solute content. Between 12 and 10 ka the
lake falls from 2155 m to 1970 m and then drops further to 1960 m by 6 ka. The rapidly receding lakeshore constricts the saline groundwater (Figure 20c), driving a major solute pulse into the lake (Figure 20b). The pulse lasts about 4 kyr for the uniform permeability model and, in concert with the smaller lake volume, contributes to a higher lake salinity at 8 ka (Fig- ure 21). The higher salinity leads to significant loss of solutes from the lake by free convection (Figure 22c).
The second significant postpluvial influence on the lake's solute content is the brief 1980 m high stand at about 3.5 ka. For the uniform model the renewed lake expansion at 6 ka causes the interface toe to move outward again, and solute loss
a) 36.5 ka L• •-• 0 5000 Radius (m) 10000 15000
ß . .
......... 1908 •50o
•708
d) present • ....
¾ • 2 2.5 .5 • • •-• <--- <--- •-- •-- •-- • •
• 4.5 •yr o 1.4 •yr * 0.45 •r } 0.14 •yr
Figure 22. Simulation examples for late Quaterna• lake lev- els with uniform permeabili• model (see Figure 8 for expla- nation).

3166 ROGERS AND DREISS: SALINE GROUNDWATER IN MONO BASIN, CALIFORNIA, 2
a) 36.5 ka Lake • 0 5000 Radius (m) 10000 15000
.... ,•' ß r ß ß ß •' •'" •" <'--- <--- <--- <--- <--- <--- 4-• • 1000 o ß ß < < • ß • •-<---<--<--<--<--<--<--n- •- 708 •
d) present •-1
• 4.5 •yr • 1.4 •yr * 0.45 •yr } 0.14 •yr
Figure 23. Simulation examples for late Quaterna• lake lev- els with zoned permeabili• model (see Figure 8 for explana- tion).
from the lake slows owing to lower salinity. The fall from 1980 m causes a smaller repetition of the previous pattern: For the uniform model a solute pulse enters the lake at 2 ka and peaks at 1 ka. The minor stage change after 1 ka, representative of the late Holocene fluctuations (Figure 4), has no discernible effect on the lake's solute content. The higher concentrations resulting from lower lake levels cause rapid free convection of solutes from the lake to groundwater (Figure 22d).
For the zoned permeability model the solute pulse produced by the major 10-ka lake recession lasts about 8 kyr (Figure 20b). At 6 ka this results in the highest lake concentration and solute content of all the models (Figure 21). The rise to the 3.5-ka high stand does not have much effect, because solutes displaced into the lake by the 10-ka recession are still draining from the lake (Figure 23c). The decline from 1980 m to mod- ern lake levels drives a second solute pulse into the lake, which is superimposed on the previous pulse. The result is a final salinity near that of the present lake.
The average permeability model has a very different re- sponse to the 10-ka recession. The interface in this case adjusts to lake level decline much more slowly, and solute displace- ment into the lake occurs at a lower rate. The slower interface
response reflects the lower water table gradient boundary con- dition (thus lower recharge) for this model, characteristic of Mono Lake's eastern shoreline. The slower response also is affected by the lower permeability and the broader shoreline discharge zone created by the anisotropic permeability zone. The lower lake levels since 10 ka continue to constrict the
saline groundwater and drive solutes into the lake, up to the present time (Figures 20b, 20c, 24c, and 24d). The rise to the 3.5-ka high stand reduces constriction of the saline groundwa- ter and slows the increase of the lake's solute content. The fall
in lake level after 3.5 ka renews the pace of solute displace- ment into the lake. The final lake salinity also reaches the modern values (Figure 21).
Late Holocene Lake Level Changes
Preliminary model results confirm that the more rapid Ho- locene lake level fluctuations evident during the last 2 kyr (Figure 4) do not have the same effect on the saline ground- water body and lake salinity as did the larger late Quaternary changes [Rogers, 1993a, b]. There is a potentially large effect on shoreline groundwater quality, however. When the lake falls to the low levels characteristic of the last 2 kyr, the saline ground- water is squeezed up into a compact mass below the lake. Some of the saline groundwater discharges across the lake floor near the shoreline. As lake levels decline further, the mass of solutes discharged across the lake bottom increases. In some simula- tions the solute flux near the shoreline nearly quadruples over the last 100 years as lake level falls and the lake's area de- creases. These simulation results represent the "average" Mono Lake. At a point on the northeastern shoreline, which may now overlie the saline interface [Rogers and Dreiss, this issue], the increased solute discharge occurs directly on the exposed playa surface. The water evaporates, leading to high shallow groundwater concentrations and formation of a sur- face salt crust.
Sediment Diffusion Versus Groundwater Advection
Table 3 summarizes modeled rates of solute loss from the
lake during the initial and final parts of the late Quaternary simulations and loss rates based on historical data. The model
results suggest that solute loss related to redistribution of deep saline groundwater could be of the same order of magnitude as the lake's historical solute loss rate. The historical data for
Mono Lake (Figure 3) have a large scatter, and the rate of decrease of the lake's solute content is subject to a fairly large uncertainty. For the last 100 years the average rate is about 1.2 x 10 s kg/yr. For only the last 50 years the solute loss rate ranges from 2.5 x 10 s to 4.0 x 10 s kg/yr, depending on data
a) 36.5 ka Lake • 0 5000 Radius (m) 10000 15000
b) 11 ka •-1
:1908
ß
708
c) 5 ka •
15. 'a-'"l.O ß ß 05
d) present , . 4 •__•W,•x ; •.,• , ,
• 1.1 •yr • 0.34•yr • 0.11 •yr • 0.03 •yr
Figure 24. Simulation examples for late Quaterna• lake lev- els with average permeabili• model (see Figure 8 for expla- nation).

ROGERS AND DREISS: SALINE GROUNDWATER IN MONO BASIN, CALIFORNIA, 2 3167
interpretation. Mass loss rates for the zoned and uniform per- meability models range from 0.5 to 1.8 x 10⁸ kg/yr; these values are at the lower end of the historical range. For the average permeability model, loss rates are lower: 0.1 x 10⁸ to 0.2 x 10⁸ kg/yr. The simulations indicate a solute gain of 0.15 x 10⁸ kg/yr over the last 1000 years for the average model.
Conventional analyses of sediment pore water concentration profiles often conclude that the advective component of solute transport is negligible and molecular diffusion adequately ac- counts for the observed profiles [e.g., Lerman and Jones, 1973]. This approach implicitly assumes that groundwater flow across the lake bottom is uniformly distributed in space. An alterna- tive conceptualization of groundwater passage through the lake bottom (Figure 25) is that part of the flow occurs through faults and fractures and bypasses the bulk of the lacustrine sediments. In this case, lake-groundwater solute interchange occurs both by advective transport through faults and by mo- lecular diffusion into the lacustrine sediments.
The lake bottom boundary condition in our groundwater flow model only includes lake-groundwater solute interchange by advection. Accurate simulation of both advective and dif- fusive transport across the lake bottom presents a problem, because diffusion occurs on much smaller spatial and temporal scales than we have considered. Nonetheless, we would like to determine the relative contribution of both advection and dif- fusion to the recent solute loss from Mono Lake (Figure 3).
Information on the shallow sediment pore water solute con- tent, obtained from cores [Domagalski et al., 1990; L. G. Miller, USGS, personal communication, 1989; J. L. Domagalski, per- sonal communication, 1993], indicates that at four of five sites (Figure 1), pore water chloride concentration decreases mark- edly with depth. This is typified by core 2 (Figure 26), where chloride concentration drops to 50% of the current lake con- centration within 90 cm of the lake bottom. On the other hand, the chloride concentrations at site 1 (not shown) are constant to 40 cm depth, at the current lake value, which may be the result of downward lake water advection. The shallow sedi- ment porosities in the cores are high, ranging from 75 to 93% [L. G. Miller, USGS, personal communication, 1989].
In the absence of core data covering the last 50 years, we can estimate the mass of solutes which could have entered the shallow sediments by diffusion since 1940, in response to the subsequent increase in lake concentration. Only the shallowest 2 m of lake bottom sediments respond to changes in lake salinity over a 50-year period [Spencer et al., 1985a]. For the 80 years prior to 1940, the concentration of Mono Lake was fairly constant, at 40-60 g/L (Figure 3). We assume that by 1940 the upper 2 m of sediment pore water had established a uniform
Table 3. Observed and Modeled Solute Loss Rates From Mono Lake
Permeability Model, 108 kg/yr
Time Period Uniform Zoned Average
Average: 40-39 ka -1.4 + 0.3 -0.6 _+ 0.1 -0.12 _+ 0.01 Maximum: 40-36 ka - 1.8 -0.7 -0.20 Average: last 1000 years -0.5 _+ 0.1 -0.6 +_ 0.3 0.15 + 0.04 Maximum: last 1000 years -0.6 - 1.0 0.1
The loss rates inferred from Mono Lake salinity data are -1.2 x 10⁸ kg/yr for the last 100 years and -3 + 1 x 10⁸ kg/yr for the last 50 years.
Lake/Groundwater Solute
Exchange Pathways
sedimenu
Ad:'ve½fion
:.:.:.:.:.:.:.:.
.......
Springs Fractures and tufa and faults
Figure 25. Conceptual sketch of different pathways along which solute loss from the lake may occur: by diffusion into the sediments or via advection through discrete fractures and faults.
concentration with depth of 45,000 ppm TDS (46.8 g/L). The core data (Figure 26) indicate that at about 1 m depth the pore water concentration is in the pre-1940 range, so we assume that only the top 1 m of sediment has been affected by the recent increase in lake salinity.
For Mono Lake at its 1968 level of 1947.4 m, the lake area
is 1.94 x 10⁸ m 2 [LADWP, 1987]. With a porosity of 85% the upper 1 m of sediment holds 1.65 x 10⁸ m 3 of pore water. If the pore water concentration is 45,000 ppm TDS, its density is 1039 kg/m 3 (Table 2), and the upper 1 m of sediment initially contains 7.7 x 10 9 kg of solutes. If the post-1940 increase of lake salinity to 90,000 ppm (97.1 g/L) has established a linear concentration gradient within the uppermost 1 m, as suggested by Figure 26 and data of Domagalski et al. [1990], then an additional 4.0 x 10 9 kg of Solutes has entered the sediment pore water over the succeeding 50 years. The resultant "Solute loss rate is 8.0 x 10 7 kg/yr. As the data between 1940 and 1990 in Figure 3 reveal a higher loss rate of 2.5 x 10⁸ to 4.0 x 10⁸ kg/yr, the estimated diffusive loss to pore water can account for only 20-30% of the observed decline. Thus despite large un- certainty the historical lake solute content data are consistent with the simultaneous loss of solutes from the lake by both sediment diffusion and groundwater advection, the latter evi- dently dominating.

3168 ROGERS AND DREISS: SALINE GROUNDWATER IN MONO BASIN, CALIFORNIA, 2
0.0
•oc• 0-5
1.0
TDS (g/l) 20 40 60 80 100
ß i ß i . i ß i ß i ß i . i . i .
Idealized
1940, profile
/ .
/• / 1990
.... i .... ii/ .... i .... i . .
5 10 15 20
c1 (•)
Figure 26. Sediment pore water chloride concentration for a core (location 2 in Figure 1) in 25 m of water (L. G. Miller, USGS, personal communication, 1989). The pore water TDS is estimated from chloride content using Mono Lake analyses [LADWP, 1987]. The vertical and diagonal dashed lines are idealized pore water concentration profiles for 1940 and 1990.
Conclusions
Mono Lake's current salinity of about 90,000 ppm TDS is 4 or 5 times the apparent groundwater salinity. We propose that the lake's high solute content is a result of the lake's fall in stage, over the last 10 kyr, from pluvial high stands. This de- cline in lake level has forced lower-salinity groundwater up into the lake, where it has been concentrated by evaporation and decreasing lake volume. Mono Basin's hydrogeology is complicated by large differences in recharge and stratigraphy along its lakeshore. We have explored the groundwater-lake solute interchange capacity of this system by examining some possible end-member basin fill permeability models. The model results confirm that the present high salinity of Mono Lake could be a lingering result of past lake level changes.
Although the solute loss rate from Mono Lake over the last 50 years is uncertain, it could arise from diffusion into the lacustrine sediments, which we have estimated, and simulta- neous advection into the groundwater. The data are consistent with a combination of solute diffusion into sediments and an
equal, or greater, advective loss to groundwater. This advective loss may occur through lake bottom faults and fractures and might not be detected by ordinary sediment core studies, which sample the lake bottom at only a few locations. The uniform and zoned permeability models predict that as a result of Mono Lake's large late Quaternary stage variations, the lake is currently losing solutes; the average permeability model pr,e- dicts that an increase is still occurring. The historical lake salinity data are not precise enough to rule out either option when diffusive flux into lake bottom sediments is accounted
for. Given the large data uncertainty the model-predicted ad- vective solute loss rates for the uniform and zoned permeabil- ity models are consistent with our interpretation of Mono Lake's historical solute content.
The basin fill permeability beneath the lake at its minimum extent controls the rate of solute exchange between lake and groundwater. Advective transport of solutes from the lake to groundwater occurs by density-driven free convectio n at low lake levels, when lake concentration is high. Loss of solutes from the lake occurs by forced convection during rising lake stage, as a subsiding saline groundwater mass draws lake water
into the basin sediments. Declining lake levels constrict the saline groundwater body and force solutes back into the lake. For this reason the basin fill permeability structure beneath the lake at low stand is the most important stratigraphic control on the lake's solute balance.
Besides sediment permeability the major factors controlling solute transfer between groundwater and the lake are the ex- tent and rate of lakeshore movement. The rate of lake level
decline determines the rate at which solutes are displaced into the lake. The time at low stand, when lake concentration is high, controls the lake's solute loss by free convection. Hun- dreds to thousands of years are required for equilibration of the saline groundwater and lake salinity with lake stage changes. The lake-groundwater system acts as a low-pass filter, responding to the slower, larger changes of lake level. For a more complex sequence of changing lake stage, with higher- frequency, low-amplitude fluctuations superimposed on larger oscillations, this means that the lower-frequency and larger- amplitude stage changes control the lake's solute content.
Major solute losses from closed basins are thought to occur during basin overflows associated with pluvial high stands [Smith, 1976; Jannik et al., 1991]. Our simulations suggest that during prolonged periods of high lake levels, much of the lake's solutes enter the groundwater and therefore may not be lost by basin overflow. The implication for the long-term solute mass balance of closed basins may be that in addition to losses through basin overflow, major solute removal must also occur by eolian deflation from the playa at low lake stands or through groundwater seepage out of the basin.
Acknowledgments. D. B. Rogers was supported by grant 14-08- 0001-G1652 from the Department of the Interior, U.S. Geological Survey; the Great Basin Unified Air Pollution Control District, using pass-through funds from the Los Angeles Department of Water and Power; and grants from the Geological Society of America and the Association of Groundwater Scientists and Engineers (National Ground Water Association). Robert S. Anderson suggested part of the approach taken in this paper; David P. Groeneveld of the Great Basin Unified Air Pollution Control District and Kenneth R. Lajoie of the U.S. Geological Survey provided helpful discussion; Larry G. Miller and Joseph L. Domagalski of the U.S. Geological Survey provided data and discussion regarding lake bottom cores. Blair F. Jones and Chris- topher J. Duffy greatly improved this paper through careful reviews. I am grateful to my dissertation adviser Shirley J. Dreiss for more than six years of friendship, for her example of grace under duress, and for lending me her car for two months when mine broke down while I was finishing my dissertation.
References
Benson, L., and R. S. Thompson, The physical record of lakes in the Great Basin, in The Geology of North America, vol. K-3, North Amer- ica and Adjacent Oceans During the Last Deglaciation, edited by W. F. Ruddiman and H. E. Wright Jr., pp. 241-260, Geol. Soc. of Am., Boulder, Colo., 1987.
Benson, L. V., D. R. Currey, R. I. Dorn, K. R. Lajoie, C. G. Oviatt, S. W. Robinson, G. I. Smith, and S. Stine, Chronology of expansion and contraction of four Great Basin lake systems during the past 35,000 years, Palaeogeogr. Palaeoclimatol. Palaeoecol., 78, 241-286, 1990.
Bethke, C. M., Modeling subsurface flow in sedimentary basins, Geol. Rundsch., 78, 129-154, 1989.
Bowler, J. M., Spatial variability and hydrologic evolution of Austra- lian lake basins: Analogue for Pleistocene hydrologic change and evaporite formation, Palaeogeogr. Palaeoclimatol. Palaeoecol., 54, 21-41, 1986.
Bredehoeft, J. D., R. D. Djevanshir, and K. R. Belitz, Lateral fluid flow in a compacting sand-shale sequence: South Caspian Basin, AAPG Bull., 72, 416-424, 1988.
ROGERS AND DREISS: SALINE GROUNDWATER IN MONO BASIN, CALIFORNIA, 2 3169
Cerling, T. E., A mass-balance approach to basin sedimentation: Con- straints on the recent history of the Turkana basin, Palaeogeogr. Palaeoclimatol. Palaeoecol., 54, 63-86, 1986.
Christensen, M. N., C. M. Gilbert, K. R. Lajoie, and Y. A1-Rawi, Geological-geophysical investigation of Mono Basin, California- Nevada, J. Geophys. Res., 74, 5221-5239, 1969.
Cloud, P., and K. R. Lajoie, Calcite-impregnated defluidization struc- tures in littoral sands of Mono Lake, California, Science, 210, 1009- 1012, 1980.
Domagalski, J. L., H. P. Eugster, and B. F. Jones, Trace metal geo- chemistry of Walker, Mono, and Great Salt Lakes, in Fluid-Mineral interactions: A Tribute to H. P. Eugster, edited by R. J. Spencer and I. Chou, Spec. Publ. Geochem. Soc., 2, 315-353, 1990.
Domenico, P. A., and F. W. Schwartz, Physical and Chemical Hydro- geology, 824 pp., John Wiley, New York, 1990.
Essaid, H. I., A multilayered sharp interface model of coupled fresh- water and saltwater flow in coastal systems: Model development and application, Water Resour. Res., 26, 1431-1454, 1990.
Feth, J. H., S. M. Rogers, and C. E. Roberson, Chemical composition of snow in the northern Sierra Nevada and other areas, U.S. Geol. Surv. Water Supply Pap., 1535-J, 39 pp., 1964.
Freeze, R. A., and J. A. Cherry, Groundwater, 604 pp., Prentice-Hall, Englewood Cliffs, N.J., 1979.
Gilbert, C. M., M. N. Christensen, Y. A1-Rawi, and K. R. Lajoie, Structural and volcanic history of Mono Basin, California-Nevada, Mem. Geol. Soc. Am., 116, 275-331, 1968.
Jannik, N. O., F. M. Phillips, G. I. Smith, and D. Elmore, A 36C1 chronology of lacustrine sedimentation in the Pleistocene Owens River system, Geol. Soc. Am. Bull., 103, 1146-1159, 1991.
Jones, B. F., A. S. Van Denburgh, A. H. Truesdell, and S. L. Rettig, Interstitial brines in playa sediments, Chem. Geol., 4, 253-262, 1969.
Konikow, L. F., and J. Rodriguez Arfivalo, Advection and diffusion in a variable-salinity confining layer, Water Resour. Res., 29, 2747-2761, 1993.
Lajoie, K. R., Quaternary stratigraphy and geologic history of Mono Basin, eastern California. Ph.D. dissertation, Univ. of Calif., Berke- ley, 1968.
Langbein, W. B., Salinity and hydrology of closed lakes, U.S. Geol. Surv. Prof Pap., 412, 409 pp., 1961.
Lee, K., Infrared exploration for shoreline springs, a contribution to the hydrogeology of Mono Basin, California, Ph.D. dissertation, Stanford Univ., Stanford, Calif., 1969.
Lee, W. T., Geology and water resources of Owens Valley, California, U.S. Geol. Surv. Water Supply Irrig. Pap., 181, 28 pp., 1906.
Lerman, A., and B. F. Jones, Transient and steady-state salt transport between sediments and brine in closed lakes, Limnol. Oceanogr., 18, 72-85, 1973.
Los Angeles Department of Water and Power (LADWP), Mono Basin geology and hydrology, report, LADWP Aqueduct Div., Hydrol. Sect., Los Angeles, Calif., 1987.
Macumber, P. G., Hydrological processes in the Tyrrell Basin, south- eastern Australia, Chem. Geol., 96, 1-18, 1992.
Mariner, R. H., T. S. Presser, and W. C. Evans, Hot springs of the central Sierra Nevada, California, U.S. Geol. Surv. Open File Rep., 77-559, 27 pp., 1977.
Neuzil, C. E., Groundwater flow in low-permeability environments, Water Resour. Res., 22, 1163-1195, 1986.
Oremland, R. S., L. G. Miller, and M. J. Whiticar, Sources and flux of natural gases from Mono Lake, California, Geochim. Cosmochim. Acta., 51, 2915-2929, 1987.
Pakiser, L. C., Seismic exploration of Mono Basin, California, J. Geo- phys. Res., 81, 3607-3618, 1976.
Pfannkuch, H. O., and T. C. Winter, Effect of anisotropy and ground- water system geometry on seepage through lakebeds, 1, Analog and dimensional analysis, J. Hydrol., 75, 213-217, 1984.
Rogers, D. B., Hydrological processes and salt flat development on the shorelands of Mono Lake, California: Implications of lake level for future dust production, final report for the State Implementation Plan and the Mono Basin EIR, to the Great Basin Unified Air Pollution Control District, Bishop, Calif., 27 pp., 1993a.
Rogers, D. B., Saline groundwater circulation and solute balance at Mono Basin, California, Ph.D. dissertation, Univ. of Calif., Santa Cruz, 1993b.
Rogers, D. B., and S. J. Dreiss, Saline groundwater in Mono Basin, California, 1, Distribution, Water Resour. Res., this issue.
Rudolph, D. L., J. A. Cherry, and R. N. Farvolden, Groundwater flow and solute transport in fractured lacustrine clay near Mexico City, Water Resour. Res., 27, 2187-2201, 1991.
Russell, I. C., Quaternary history of Mono Valley, California, Annu. Rep. U.S. Geol. Sum., 8th, 267-394, 1889.
Sanford, W. E., and W. W. Wood, Brine evolution and mineral dep- osition in hydrologically open evaporite basins, Am. J. Sci., 291, 687-710, 1991.
Schlichting, B., and J. Cain, Mono Lake is finally on the rise!, Mono Lake Newsl., 15, 3, 1993.
Smith, G. I., Origin of lithium and other components in the Searles Lake evaporites, California, in Lithium Resources and Requirements by the Year 2000, edited by J. D. Vine, U.S. Geol. Surv. Prof Pap., 1005, 92-103, 1976.
Spencer, R. J., H. P. Eugster, B. F. Jones, and S. L. Rettig, Geochem- istry of Great Salt Lake, Utah, I, Hydrochemistry since 1850, Geochim. Cosmochim. Acta, 49, 727-737, 1985a.
Spencer, R. J., H. P. Eugster, and B. F. Jones, Geochemistry of Great Salt Lake, Utah, II, Pleistocene-Holocene evolution, Geochim. Cos- mochim. Acta, 49, 739-747, 1985b.
Stine, S. W., Mono Lake: The past 4000 years, Ph.D. dissertation, Univ. of Calif., Berkeley, 1987.
Stine, S. W., Geomorphic and geohydrographic aspects of the Mono Lake controversy, in The Future of Mono Lake, Univ. Calif Water Resour. Rep. 68, edited by D. Botkin et al., Append. D-l, 135 pp., Riverside, 1988.
Stine, S. W., Late Holocene fluctuations of Mono Lake, eastern Cal- ifornia, Palaeogeogr. Palaeoclimatol. Palaeoecol., 78, 333-381, 1990.
Stine, S. W., Geomorphic, geographic, and hydrographic basis for resolving the Mono Lake controversy, Environ. Geol. Water Sci., 17, 67-83, 1991.
Thomas, J. M., S. M. Carlton, and L. B. Hines, Ground-water hydrol- ogy and simulated effects of development in Smith Creek Valley, a hydrologically closed basin in Lander County, Nevada, U.S. Geol. Surv. Prof. Pap., 1409-E, 57 pp., 1989.
Van Denburgh, A. S., Solute balance at Abert and Summer Lakes, south-central Oregon, U.S. Geol. Surv. Prof Pap., 502-C, 29 pp., 1975.
Vorster, P., A water balance forecast model for Mono Lake, Califor- nia, M.S. thesis, Calif. State Univ., Hayward, 1985.
Voss, C. I., SUTRA: A finite-element simulation model for saturated- unsaturated, fluid-density-dependent ground-water flow with energy transport or chemically-reactive single species solute transport, U.S. Geol. Surv. Water Resour. Invest., 84-4369, 409 pp., 1984.
Voss, C. I., and W. R. Souza, Variable density flow and solute trans- port simulation of regional aquifers containing a narrow freshwater- saltwater transition zone, Water Resour. Res., 23, 1851-1866, 1987.
Whitehead, H. C., and J. H. Feth, Recent chemical analyses of waters from several closed-basin lakes and their tributaries in the western
United States, Geol. Soc. Am. Bull., 72, 1421-1426, 1961. Wood, W. W., and W. E. Sanford, Ground-water control of evaporite
deposition, Econ. Geol., 85, 1226-1235, 1990. Yuretich, R. F., and T. E. Cerling, Hydrochemistry of Lake Turkana,
Kenya: Mass balance and mineral reactions in an alkaline lake, Geochim. Cosmochim. Acta, 47, 1099-1109, 1983.
D. B. Rogers, Water Quality and Hydrology Group, ESH-18, MS K497, Los Alamos National Laboratory, Los Alamos, NM 87545. (e- mail: [email protected])
(Received October 1, 1994; revised March 29, 1995; accepted July 6, 1995.)