sailing yacht transom sterns – a systematic cfd...
TRANSCRIPT
5th High Performance Yacht Design Conference Auckland, 10-12 March, 2015
SAILING YACHT TRANSOM STERNS – A SYSTEMATIC CFD INVESTIGATION
Jens Allroth1, [email protected] Ting-Hua Wu2, [email protected] Michal Orych3, [email protected]
Lars Larsson4, [email protected]
Abstract. The question adressed in this project is whether modern hull lines with wide, box-shaped transoms, that seem to originate from extreme racing machines, are also beneficial for modern performance cruisers from a hydrodynamic performance point of view. A new 41 ft (12.3 m) hull was designed as an average of contemporary performance hulls in the 40 ft segment. The aft part of the hull was stretched stepwise and cut at constant length overall in order to systematically increase the transom size. Six hull variations with box shaped transoms were created in this way. To investigate the influence of the transom shape, the six hull variants were redesigned with a more rounded transom. The resistance was calculated for all twelve hulls in the upright and heeled conditions at Froude numbers 0.35 and 0.60. The computations were carried out using a Reynolds-Averaged Navier-Stokes (RANS) solver with a Volume of Fluid (VOF) representation of the free surface. The solver was validated against several hulls in the Delft Systematic Yacht Hull Series (DSYHS). Very different optima are found for the low and high speed cases. In an upwind-downwind race the round transoms performed best for the three fastest transom sizes. The fastest hull around the course has an immersed transom area to midship area ratio of 0.16 and it has a rounded shape. It is 1.9 % faster than a more box like transom. Overall the round transoms are faster around the race course.
1 Naval Architect, Danish Yachts A/S, Skagen, Denmark 2 Naval Architect, Volvo Penta AB, Gothenburg, Sweden 3 Lic Eng, FLOWTECH International AB, Gothenburg, Sweden 4 Professor, Department of Shipping and Marine Technology, Chalmers University of Technology, Gothenburg, Sweden
1. INTRODUCTION
The development of modern lightweight materials and building techniques has allowed yacht designers to move the limits of what is possible to achieve with wind being the only power source. Lighter, stronger and stiffer materials allow for more powerful boats today than when wood was the only option when it came to hull and rig construction materials.
Development of the design rules with which the yachts must comply when competing in yacht races has influenced the appearance of performance yachts. Numerous rules have passed over the centuries, some more influential than others, and they have usually affected not only the top end racing yachts but also the segment of more performance oriented cruising yachts, often called performance cruisers.
These are some of the parameters that have contributed to the development of the looks of what has been considered a modern sailing yacht over the years. On top of them, there is usually a rather large component of aesthetics and fashion.
Today one can see a trend of convergence in design amongst the producers of performance cruisers around the world. Over the last thirty years or so the designers have moved from round hull lines and narrow transoms, towards straighter hull lines and very wide, box-shaped transoms.
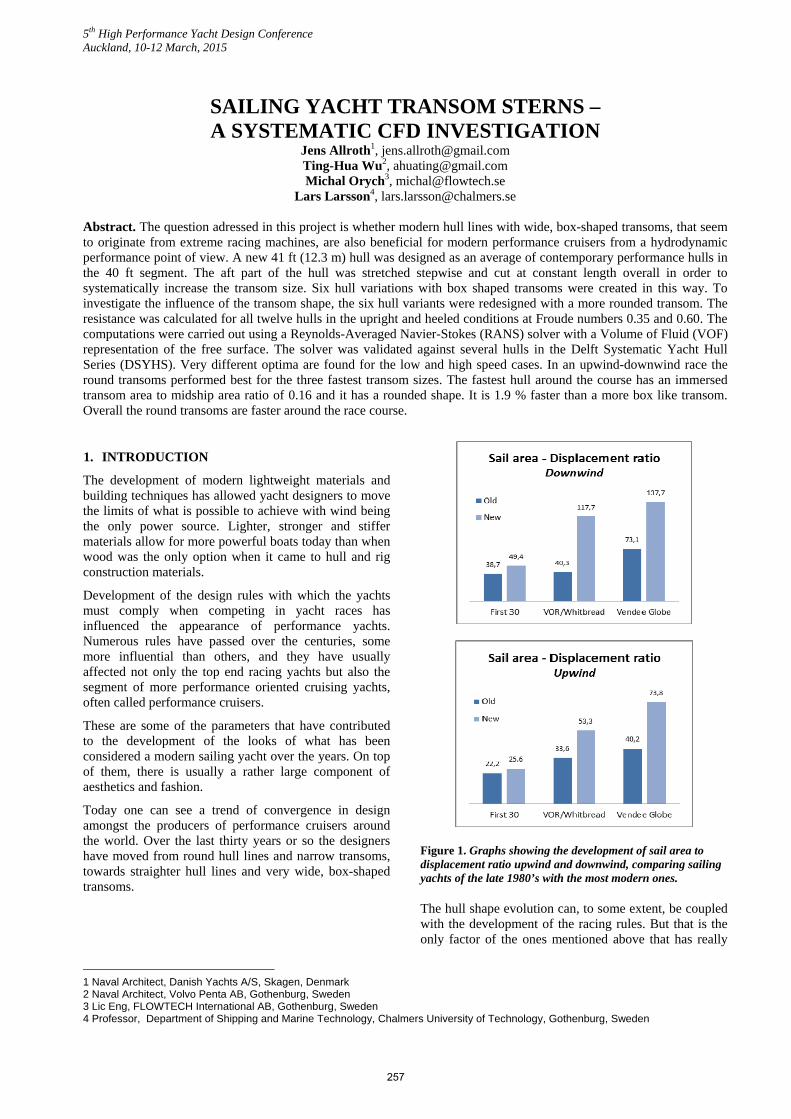
Figure 1. Graphs showing the development of sail area to displacement ratio upwind and downwind, comparing sailing yachts of the late 1980’s with the most modern ones.
The hull shape evolution can, to some extent, be coupled with the development of the racing rules. But that is the only factor of the ones mentioned above that has really
257
changed considerably during the same time span. These performance cruisers still have hulls built in glass fibre reinforced polyester and rigs with aluminium mast and stainless steel rigging. The building techniques have of course improved, but looking at the sail area to weight ratio (Figure 1), the improvement is marginal.
For high-end race yachts the development is different. Here, new materials such as aramid fibre, and today carbon fibre reinforced epoxy and titanium have made their entry into both hull and rig construction. So has new advanced manufacturing techniques, and the result is a significantly improved product. This is also where the development of the modern hull lines now seen on performance cruisers has its origin.
The question studied in this paper, and reported in detail in [1], is whether modern hull lines with wide, box-shaped transoms that seem to originate from extreme racing machines are also beneficial for modern performance cruisers, from a hydrodynamic performance point of view. Parameters that are primarily considered and evaluated are total, frictional and pressure resistance, longitudinal center of buoyancy, prismatic coefficient, and transom size, shape and immersion.
General advantages and disadvantages related to large transoms are introduced in Section 2 and in Section 3 the tool used for the investigation, a CFD code, is presented and validated. In Section 4 a generic sailing yacht hull is designed as an “average” of a number of contemporary 40 ft designs. 18 different designs are developed from this parent, with varying transom size and shape. CFD results from 12 of these hulls are discussed in Section 5 and in Section 6 the performance of the different hulls on a race course is evaluated. Finally, the findings are summarised in the Conclusions section.
2. ADVANTAGES AND DISADVANTAGES OF A LARGE BOX-SHAPED TRANSOM
In theory the large box shaped transom, and the straight hull lines that come with it, has both upsides and downsides. The four main advantages are;
Larger planing area at small heel angles
Smaller wetted surface at large heel angles
Improved righting moment when heeled
Reduced wave resistance due to submerged transom effect at high Fn
while the main disadvantages are; Larger wetted surface at small heel angles
Larger transom resistance at low Froude numbers
Larger weather helm when heeled
Bow down trim when heeled Rudder lifted out of the water when heeled
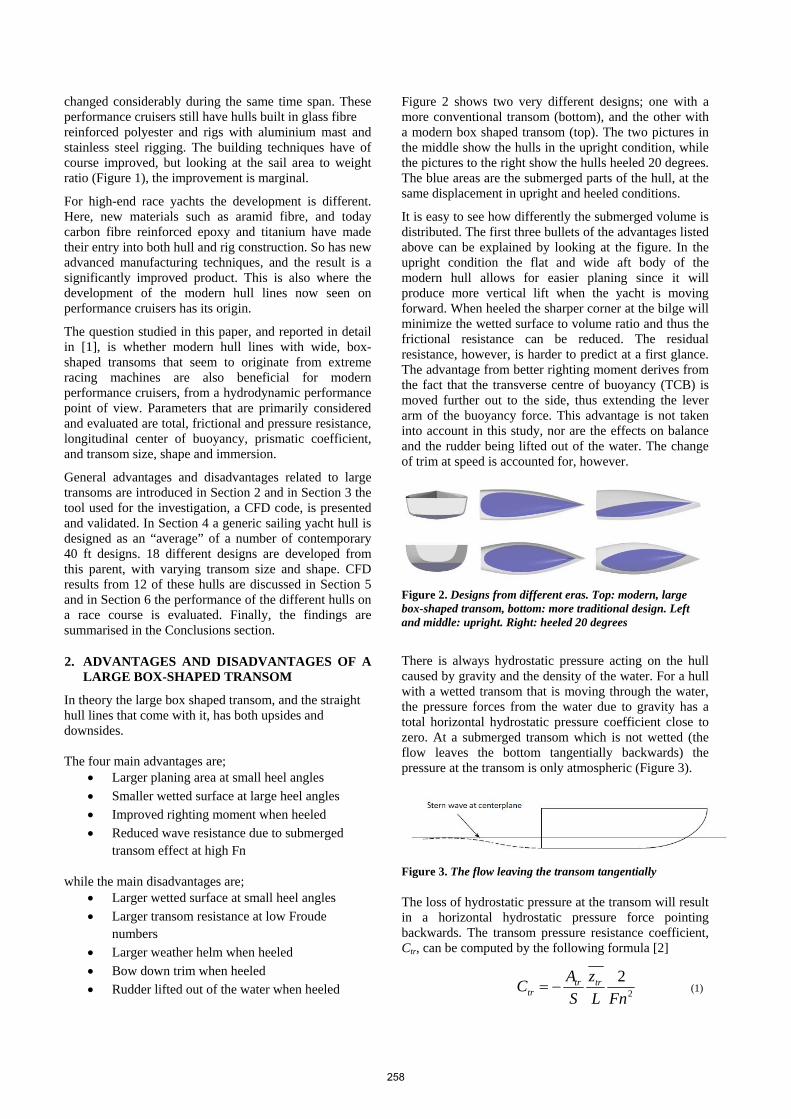
Figure 2 shows two very different designs; one with a more conventional transom (bottom), and the other with a modern box shaped transom (top). The two pictures in the middle show the hulls in the upright condition, while the pictures to the right show the hulls heeled 20 degrees. The blue areas are the submerged parts of the hull, at the same displacement in upright and heeled conditions.
It is easy to see how differently the submerged volume is distributed. The first three bullets of the advantages listed above can be explained by looking at the figure. In the upright condition the flat and wide aft body of the modern hull allows for easier planing since it will produce more vertical lift when the yacht is moving forward. When heeled the sharper corner at the bilge will minimize the wetted surface to volume ratio and thus the frictional resistance can be reduced. The residual resistance, however, is harder to predict at a first glance. The advantage from better righting moment derives from the fact that the transverse centre of buoyancy (TCB) is moved further out to the side, thus extending the lever arm of the buoyancy force. This advantage is not taken into account in this study, nor are the effects on balance and the rudder being lifted out of the water. The change of trim at speed is accounted for, however.
Figure 2. Designs from different eras. Top: modern, large box-shaped transom, bottom: more traditional design. Left and middle: upright. Right: heeled 20 degrees
There is always hydrostatic pressure acting on the hull caused by gravity and the density of the water. For a hull with a wetted transom that is moving through the water, the pressure forces from the water due to gravity has a total horizontal hydrostatic pressure coefficient close to zero. At a submerged transom which is not wetted (the flow leaves the bottom tangentially backwards) the pressure at the transom is only atmospheric (Figure 3).
Figure 3. The flow leaving the transom tangentially
The loss of hydrostatic pressure at the transom will result in a horizontal hydrostatic pressure force pointing backwards. The transom pressure resistance coefficient, Ctr, can be computed by the following formula [2]
2
2
FnL
z
S
AC trtr
tr (1)
258

where Atr is the submerged transom area, S the wetted surface and ztr the submergence of the transom centre of gravity. L is Lpp and Fn is the Froude number. At low Froude numbers, just above the critical speed where the transom is cleared from water, the transom resistance can be much larger than the resistance due to the hydrodynamic pressure. At very low Froude numbers where the transom is wetted, the resistance increases rapidly when eddies are formed behind the hull as the boundary layer separates from the hull surface. This is referred to as base drag.
So, what is then the upside of the submerged transom? At high speeds round buttock lines and waterlines create a low pressure region that increases the trim and sinkage which increase the wave resistance. If, instead, the buttocks are straightened they will cause the aft part of the hull to generate more vertical lift and consequently the wave resistance will decrease. Further, rounded waterlines will generate a low pressure on the sides of the aft body, which will deepen the wave trough found in this region at high speed. The stern wave system is then amplified, and the resulting wave resistance is increased. Straighter buttocks and waterlines will in practice result in a larger transom area, as is the case for newer designs.
Note from equation (1) that transom resistance is inversely proportional to Froude number squared, and thus a large transom at high speed could be beneficial. Hydrodynamic pressure resistance, however, increases with speed and therefore a small transom is desired when speed decreases as the transom resistance is a relatively large part of the total residual resistance.
3. NUMERICAL METHOD
The CFD software used in the study is SHIPFLOW 5.0 developed by FLOWTECH International AB in Gothenburg which is a spinoff company from the research done at the Hydrodynamics group of Chalmers University of Technology. It is primarily being developed for applications within ship design and can handle several disciplines within this area covering both viscid and inviscid solutions. The software is divided into several modules handling different aspects of the computations;
XPAN is a free surface potential flow panel solver
XBOUND calculates the thin boundary layer on the hull based on the potential flow pressure. Alternatively the viscous resistance can be obtained using the ITTC -57 formula [2]. This was employed in the present study.
XMESH generates the mesh used by XPAN and XBOUND
XCHAP is a finite volume RANS solver. In the
present work the k- SST turbulence model was employed. No wall functions are used in
XCHAP and the y+ of the first grid point is kept below 1.
XVOF is the viscous free surface capturing module that uses the volume of fluids method. The module is utilized by XCHAP.
XGRID generates the grids used by XCHAP and XVOF
Computations were carried out using both XPAN/XBOUND (i.e. with a potential flow/boundary layer approach) and XCHAP/XVOF (RANS approach). In [1] all results are reported. Here only the RANS results will be given. It should be noted, however, that the sinkage and trim used in the RANS solution were taken from XPAN, where it is possible to specify the height of the driving force, here specified at the centre of effort of the sails.
The grid is contained in a cylinder with a radius of 3L, extending upstream 1L and downstream 3L. Note that the grid is extended above the undisturbed free surface in order to capture the waves. A close-up of the grids is seen in Figure 4. Based on a verification study (see [1]) a total of 2.5 million cells were used in the symmetric upright cases and for the asymmetric heeled cases a total of 4.7 million cells were used.
Validation was carried out using several hulls from the Delft Systematic Yacht Hull Series (DSYHS [3]) at different speeds to see how well the solver handles different geometries without changing the grid resolution. The results from the CFD calculations are compared with those from series 40 in the DHSYS database. These hulls, denoted Sysser 4X, are the ones most similar to contemporary yacht hulls. For the upright case verification was made using Sysser 46, 47, 48, 49 and 50. The heeled case was validated with Sysser 47 and 48. For all details of the validation, see [1].
Since the most interesting cases are upwind, heeled at Fn=0.35 and downwind, upright at Fn= 0.6 the validation is shown for these cases in Figures 5 and 6. To trust the solver in the optimization phase, it is important that the difference in resistance between the hulls is reflected in the results. It is seen in the figures that the upright resistance is generally under predicted, while the opposite is true for the heeled case. However, since the trends are systematic, the differences between the hulls are well predicted.
259
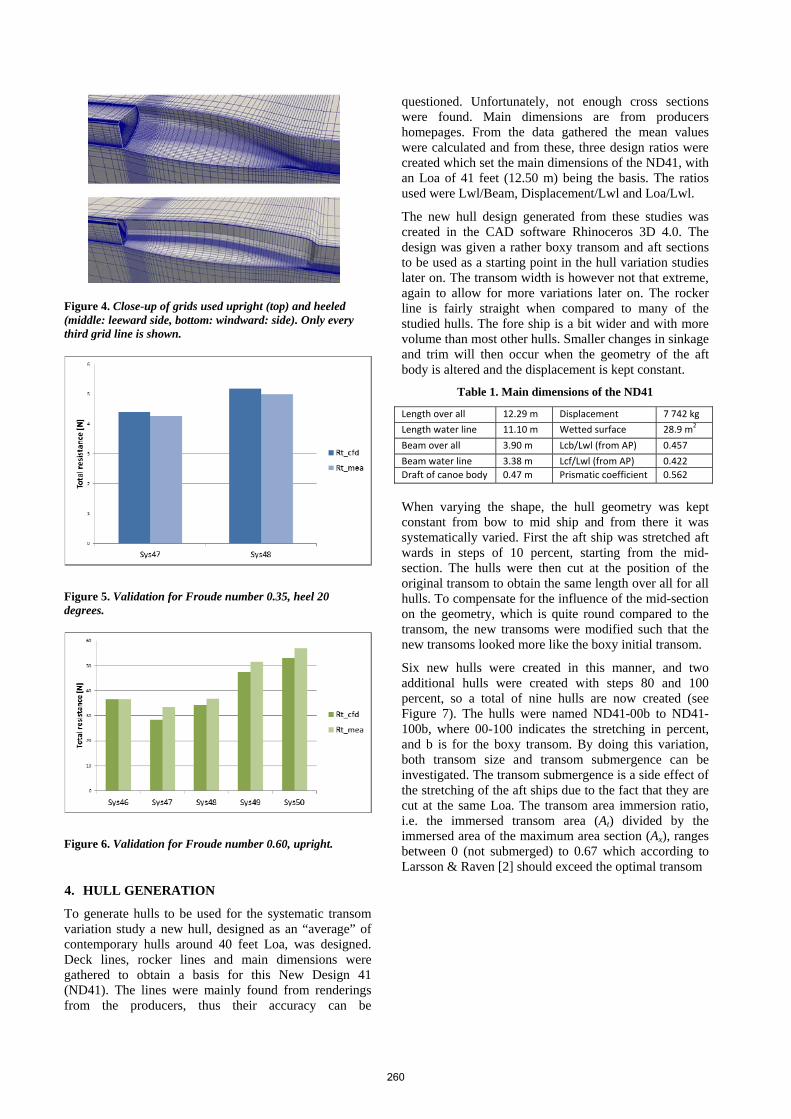
Figure 4. Close-up of grids used upright (top) and heeled (middle: leeward side, bottom: windward: side). Only every third grid line is shown.
Figure 5. Validation for Froude number 0.35, heel 20 degrees.
Figure 6. Validation for Froude number 0.60, upright.
4. HULL GENERATION
To generate hulls to be used for the systematic transom variation study a new hull, designed as an “average” of contemporary hulls around 40 feet Loa, was designed. Deck lines, rocker lines and main dimensions were gathered to obtain a basis for this New Design 41 (ND41). The lines were mainly found from renderings from the producers, thus their accuracy can be
questioned. Unfortunately, not enough cross sections were found. Main dimensions are from producers homepages. From the data gathered the mean values were calculated and from these, three design ratios were created which set the main dimensions of the ND41, with an Loa of 41 feet (12.50 m) being the basis. The ratios used were Lwl/Beam, Displacement/Lwl and Loa/Lwl.
The new hull design generated from these studies was created in the CAD software Rhinoceros 3D 4.0. The design was given a rather boxy transom and aft sections to be used as a starting point in the hull variation studies later on. The transom width is however not that extreme, again to allow for more variations later on. The rocker line is fairly straight when compared to many of the studied hulls. The fore ship is a bit wider and with more volume than most other hulls. Smaller changes in sinkage and trim will then occur when the geometry of the aft body is altered and the displacement is kept constant.
Table 1. Main dimensions of the ND41
Length over all 12.29 m Displacement 7 742 kg
Length water line 11.10 m Wetted surface 28.9 m2
Beam over all 3.90 m Lcb/Lwl (from AP) 0.457
Beam water line 3.38 m Lcf/Lwl (from AP) 0.422
Draft of canoe body 0.47 m Prismatic coefficient 0.562
When varying the shape, the hull geometry was kept constant from bow to mid ship and from there it was systematically varied. First the aft ship was stretched aft wards in steps of 10 percent, starting from the mid-section. The hulls were then cut at the position of the original transom to obtain the same length over all for all hulls. To compensate for the influence of the mid-section on the geometry, which is quite round compared to the transom, the new transoms were modified such that the new transoms looked more like the boxy initial transom.
Six new hulls were created in this manner, and two additional hulls were created with steps 80 and 100 percent, so a total of nine hulls are now created (see Figure 7). The hulls were named ND41-00b to ND41-100b, where 00-100 indicates the stretching in percent, and b is for the boxy transom. By doing this variation, both transom size and transom submergence can be investigated. The transom submergence is a side effect of the stretching of the aft ships due to the fact that they are cut at the same Loa. The transom area immersion ratio, i.e. the immersed transom area (At) divided by the immersed area of the maximum area section (Ax), ranges between 0 (not submerged) to 0.67 which according to Larsson & Raven [2] should exceed the optimal transom
260
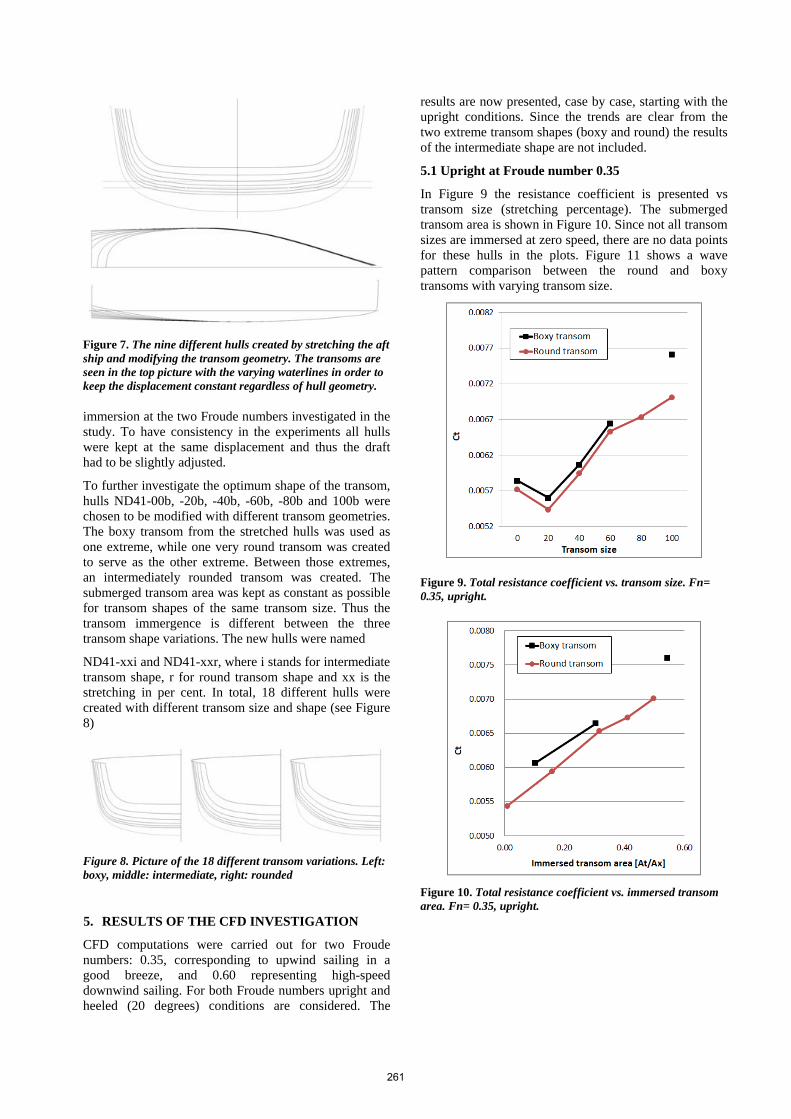
Figure 7. The nine different hulls created by stretching the aft ship and modifying the transom geometry. The transoms are seen in the top picture with the varying waterlines in order to keep the displacement constant regardless of hull geometry.
immersion at the two Froude numbers investigated in the study. To have consistency in the experiments all hulls were kept at the same displacement and thus the draft had to be slightly adjusted.
To further investigate the optimum shape of the transom, hulls ND41-00b, -20b, -40b, -60b, -80b and 100b were chosen to be modified with different transom geometries. The boxy transom from the stretched hulls was used as one extreme, while one very round transom was created to serve as the other extreme. Between those extremes, an intermediately rounded transom was created. The submerged transom area was kept as constant as possible for transom shapes of the same transom size. Thus the transom immergence is different between the three transom shape variations. The new hulls were named
ND41-xxi and ND41-xxr, where i stands for intermediate transom shape, r for round transom shape and xx is the stretching in per cent. In total, 18 different hulls were created with different transom size and shape (see Figure 8)
Figure 8. Picture of the 18 different transom variations. Left: boxy, middle: intermediate, right: rounded
5. RESULTS OF THE CFD INVESTIGATION
CFD computations were carried out for two Froude numbers: 0.35, corresponding to upwind sailing in a good breeze, and 0.60 representing high-speed downwind sailing. For both Froude numbers upright and heeled (20 degrees) conditions are considered. The
results are now presented, case by case, starting with the upright conditions. Since the trends are clear from the two extreme transom shapes (boxy and round) the results of the intermediate shape are not included.
5.1 Upright at Froude number 0.35
In Figure 9 the resistance coefficient is presented vs transom size (stretching percentage). The submerged transom area is shown in Figure 10. Since not all transom sizes are immersed at zero speed, there are no data points for these hulls in the plots. Figure 11 shows a wave pattern comparison between the round and boxy transoms with varying transom size.
Figure 9. Total resistance coefficient vs. transom size. Fn= 0.35, upright.
Figure 10. Total resistance coefficient vs. immersed transom area. Fn= 0.35, upright.
261

Figure 11. Wave pattern for ND41-00 to ND41-100. Upper half in each figure: boxy, lower half: rounded. Fn= 0.35, upright.
In this condition the transom is wetted for all hulls, even for the 00 hulls. The bow wave (not shown here) decreases with growing transom size and the same tendency is seen for the stern wave systems. So, from judging from the wave patterns one could expect that the hulls with larger transoms should have less total resistance.
This is, however, not the case. Instead the total resistance has a minimum for the 20 hulls. The explanation is likely to be a rapid growth of the viscous pressure resistance for larger transoms. It is caused by separation of the viscous boundary layer at the transom. This is known as base drag and occurs in the wake after a blunt cut off geometry. The ratio of area of this blunt cut off edge compared to the maximum cross section area of the body has great impact on the base drag, see Hoerner [4]. For high ratios the base drag is dramatically increased, and this is likely to be the case for the hulls with large immersed transom area.
Thus, there are two large resistance components that have different optima. The wave resistance has a minimum for the largest transom, while the viscous pressure resistance, the base drag, that has a minimum for the transom with smallest wetted transom area. The combined optimum of the two components is the ND41-20. It is worth noticing that the round transom is significantly better than the boxy one. This is probably explained by the smaller buttock angle.
5.2 Upright at Froude number 0.60
Plots corresponding to Figures 9-11 but for the higher Froude number are presented in Figures 12-14. At this
Figure 12. Total resistance coefficient vs. transom size. Fn= 0.60, upright.
Figure 13. Total resistance coefficient vs. immersed transom area. Fn= 0.60, upright.
Froude number no optimum in transom size is found, although the total resistance curve seems to be converging near the largest transoms. In contrast with the upright Froude number 0.35 condition, all transoms are now cleared. The base drag is thus replaced by the transom resistance, equation (1). It increases with the immersed transom area, but decreases with the Froude number squared. At this rather high Froude number the upsides of larger transom (straighter waterline, smaller buttock angle) weighs heavier than the downside from increased transom drag.
The fact that no optimum transom immersion is found despite the very large At/Ax ratio is rather unexpected. Larsson & Raven [2] propose a maximum ratio of 0.18 at Froude number 0.60, while the ratio for the fastest hull at the same speed is as much as 0.67. But this ratio from
ND41-00 ND41-20
ND41-100
ND41-40 ND41-60
262
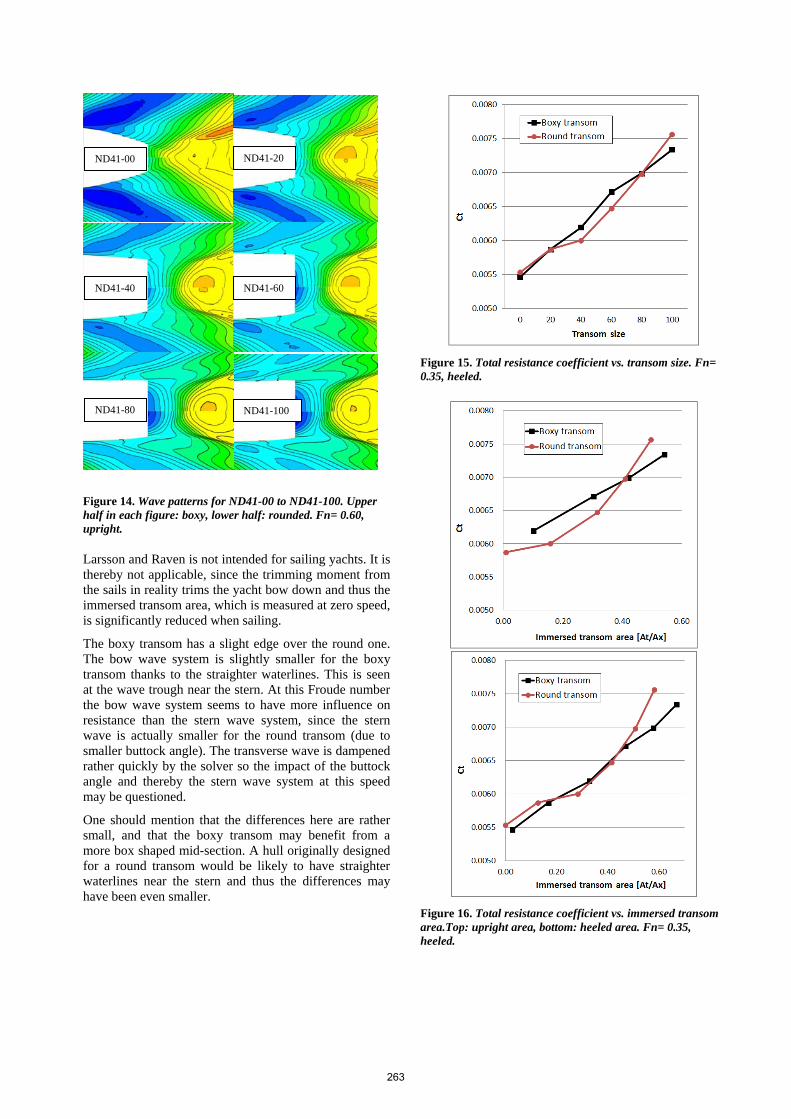
Figure 14. Wave patterns for ND41-00 to ND41-100. Upper half in each figure: boxy, lower half: rounded. Fn= 0.60, upright.
Larsson and Raven is not intended for sailing yachts. It is thereby not applicable, since the trimming moment from the sails in reality trims the yacht bow down and thus the immersed transom area, which is measured at zero speed, is significantly reduced when sailing.
The boxy transom has a slight edge over the round one. The bow wave system is slightly smaller for the boxy transom thanks to the straighter waterlines. This is seen at the wave trough near the stern. At this Froude number the bow wave system seems to have more influence on resistance than the stern wave system, since the stern wave is actually smaller for the round transom (due to smaller buttock angle). The transverse wave is dampened rather quickly by the solver so the impact of the buttock angle and thereby the stern wave system at this speed may be questioned.
One should mention that the differences here are rather small, and that the boxy transom may benefit from a more box shaped mid-section. A hull originally designed for a round transom would be likely to have straighter waterlines near the stern and thus the differences may have been even smaller.
Figure 15. Total resistance coefficient vs. transom size. Fn= 0.35, heeled.
Figure 16. Total resistance coefficient vs. immersed transom area.Top: upright area, bottom: heeled area. Fn= 0.35, heeled.
ND41-00 ND41-20
ND41-40 ND41-60
ND41-80 ND41-100
263
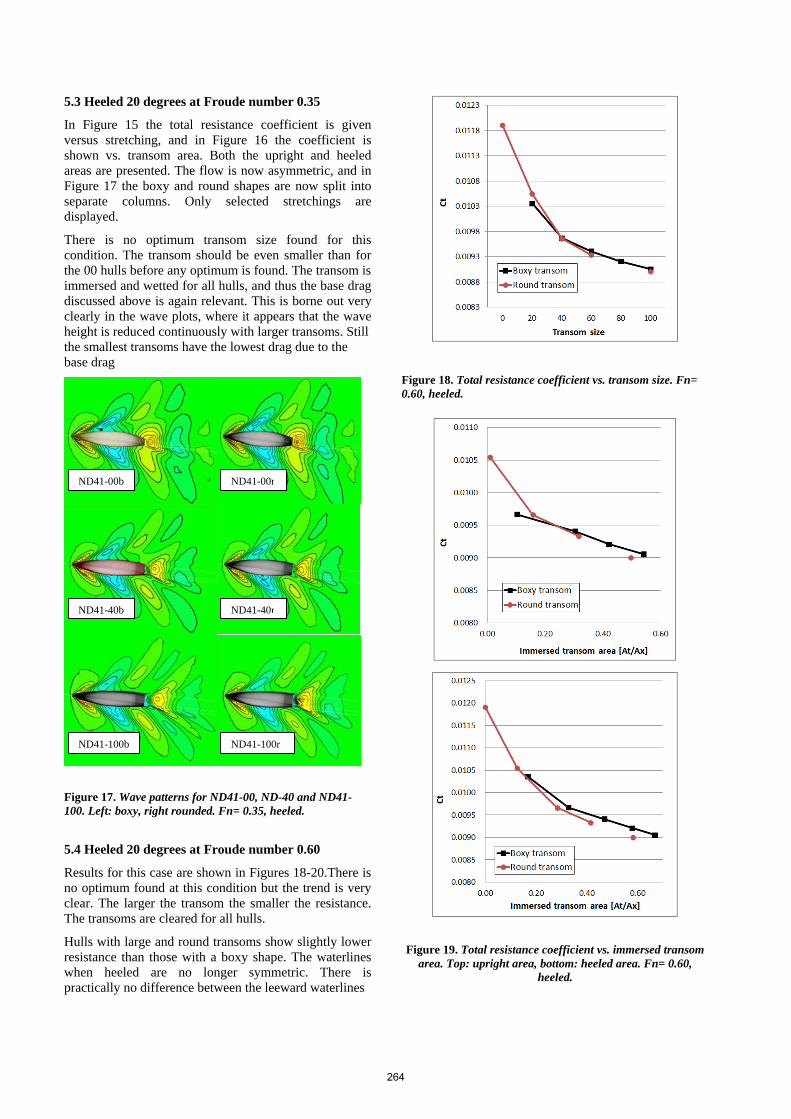
5.3 Heeled 20 degrees at Froude number 0.35
In Figure 15 the total resistance coefficient is given versus stretching, and in Figure 16 the coefficient is shown vs. transom area. Both the upright and heeled areas are presented. The flow is now asymmetric, and in Figure 17 the boxy and round shapes are now split into separate columns. Only selected stretchings are displayed.
There is no optimum transom size found for this condition. The transom should be even smaller than for the 00 hulls before any optimum is found. The transom is immersed and wetted for all hulls, and thus the base drag discussed above is again relevant. This is borne out very clearly in the wave plots, where it appears that the wave height is reduced continuously with larger transoms. Still the smallest transoms have the lowest drag due to the base drag
Figure 17. Wave patterns for ND41-00, ND-40 and ND41-100. Left: boxy, right rounded. Fn= 0.35, heeled.
5.4 Heeled 20 degrees at Froude number 0.60
Results for this case are shown in Figures 18-20.There is no optimum found at this condition but the trend is very clear. The larger the transom the smaller the resistance. The transoms are cleared for all hulls.
Hulls with large and round transoms show slightly lower resistance than those with a boxy shape. The waterlines when heeled are no longer symmetric. There is practically no difference between the leeward waterlines
Figure 18. Total resistance coefficient vs. transom size. Fn= 0.60, heeled.
Figure 19. Total resistance coefficient vs. immersed transom area. Top: upright area, bottom: heeled area. Fn= 0.60,
heeled.
ND41-00b ND41-00r
ND41-40b ND41-40r
ND41-100b ND41-100r
264
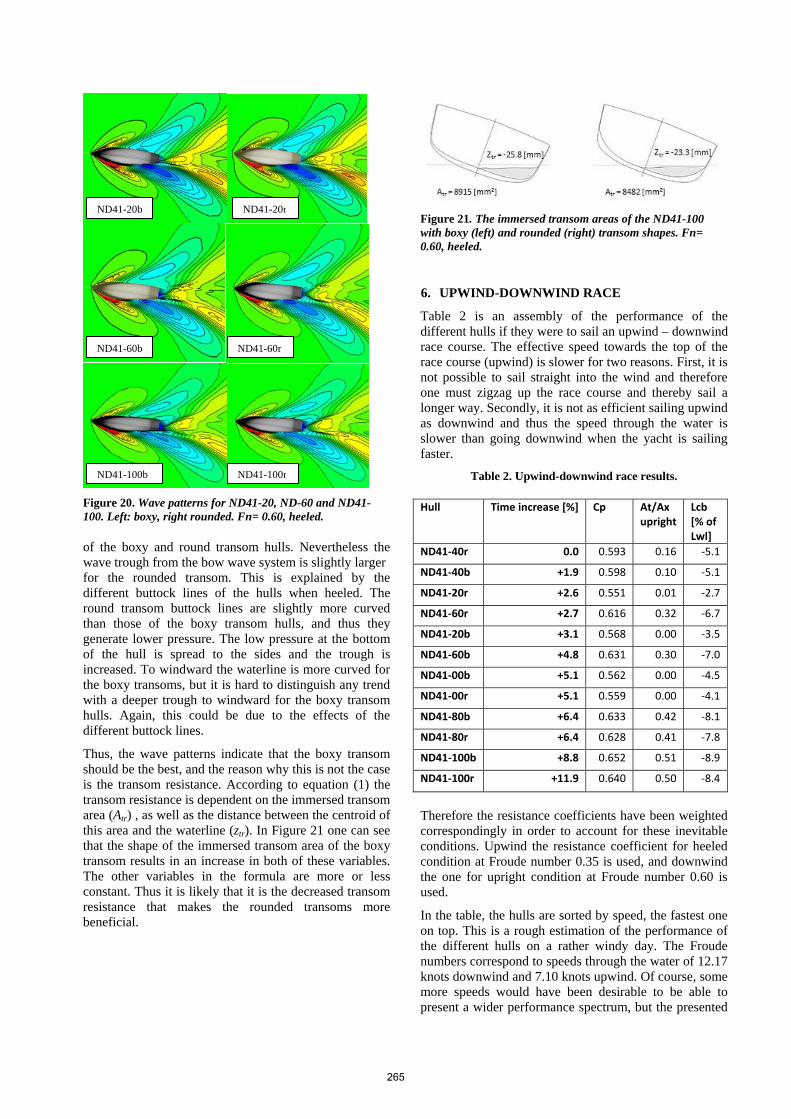
Figure 20. Wave patterns for ND41-20, ND-60 and ND41-100. Left: boxy, right rounded. Fn= 0.60, heeled.
of the boxy and round transom hulls. Nevertheless the wave trough from the bow wave system is slightly larger for the rounded transom. This is explained by the different buttock lines of the hulls when heeled. The round transom buttock lines are slightly more curved than those of the boxy transom hulls, and thus they generate lower pressure. The low pressure at the bottom of the hull is spread to the sides and the trough is increased. To windward the waterline is more curved for the boxy transoms, but it is hard to distinguish any trend with a deeper trough to windward for the boxy transom hulls. Again, this could be due to the effects of the different buttock lines.
Thus, the wave patterns indicate that the boxy transom should be the best, and the reason why this is not the case is the transom resistance. According to equation (1) the transom resistance is dependent on the immersed transom area (Atr) , as well as the distance between the centroid of this area and the waterline (ztr). In Figure 21 one can see that the shape of the immersed transom area of the boxy transom results in an increase in both of these variables. The other variables in the formula are more or less constant. Thus it is likely that it is the decreased transom resistance that makes the rounded transoms more beneficial.
Figure 21. The immersed transom areas of the ND41-100 with boxy (left) and rounded (right) transom shapes. Fn= 0.60, heeled.
6. UPWIND-DOWNWIND RACE
Table 2 is an assembly of the performance of the different hulls if they were to sail an upwind – downwind race course. The effective speed towards the top of the race course (upwind) is slower for two reasons. First, it is not possible to sail straight into the wind and therefore one must zigzag up the race course and thereby sail a longer way. Secondly, it is not as efficient sailing upwind as downwind and thus the speed through the water is slower than going downwind when the yacht is sailing faster.
Table 2. Upwind-downwind race results.
Hull Time increase [%] Cp At/Ax upright
Lcb [% of Lwl]
ND41‐40r 0.0 0.593 0.16 ‐5.1
ND41‐40b +1.9 0.598 0.10 ‐5.1
ND41‐20r +2.6 0.551 0.01 ‐2.7
ND41‐60r +2.7 0.616 0.32 ‐6.7
ND41‐20b +3.1 0.568 0.00 ‐3.5
ND41‐60b +4.8 0.631 0.30 ‐7.0
ND41‐00b +5.1 0.562 0.00 ‐4.5
ND41‐00r +5.1 0.559 0.00 ‐4.1
ND41‐80b +6.4 0.633 0.42 ‐8.1
ND41‐80r +6.4 0.628 0.41 ‐7.8
ND41‐100b +8.8 0.652 0.51 ‐8.9
ND41‐100r +11.9 0.640 0.50 ‐8.4
Therefore the resistance coefficients have been weighted correspondingly in order to account for these inevitable conditions. Upwind the resistance coefficient for heeled condition at Froude number 0.35 is used, and downwind the one for upright condition at Froude number 0.60 is used.
In the table, the hulls are sorted by speed, the fastest one on top. This is a rough estimation of the performance of the different hulls on a rather windy day. The Froude numbers correspond to speeds through the water of 12.17 knots downwind and 7.10 knots upwind. Of course, some more speeds would have been desirable to be able to present a wider performance spectrum, but the presented
ND41-20b ND41-20r
ND41-60b ND41-60r
ND41-100b ND41-100r
265

results should give a good indication of the performance of the different hulls.
The second column of the table gives the time increase when sailing one nautical mile upwind, followed by one downwind, relative to the fastest hull. There are also three columns with geometrical data of interest for each hull, such as Cp, At/Ax (upright) and LCB (distance behind midship in percent of Lwl, negative backwards). It is seen that the fastest hulls are those with an intermediate stretching of 40%, namely ND41-40r and ND41-40b. These have submerged transoms upright, with a submerged area of 16% and 10% respectively of the midship section. The prismatic coefficient is around 0.60 and LCB is 5.1 % of the waterline length behind midship.
The round transoms outperform the boxy ones with corresponding transom size for all hulls at the top half of the scoreboard. In the lower half, the boxy transoms are equally good for hulls 00 and 80. It is not until the last pair of hulls, the 100 hulls, that the boxy transom is actually faster around the course.
7. CONCLUSIONS
A modern 41 ft performance cruiser (the ND41) was designed as an average of yachts in the 40 ft segment presently on the market. The aft ship of the ND41 was then stretched stepwise and cut at constant length overall in order to systematically increase the transom size. Six hull variations with box shaped transoms were created in this way. To investigate the influence of the transom shape, the six hull variants were also equipped with a more rounded transom. The resistance was calculated for all twelve hulls in upright and heeled condition at Froude numbers 0.35 and 0.60.
At the lower speed upright there is a resistance minimum for the second smallest transom and the rounded shape is the best. In the heeled condition there is no minimum found; even the smallest transom in the series is too large. There is a marginal advantage of the boxy shape.
At Froude number 0.60 no optimum is found and the largest transom has the smallest resistance in both upright and heeled conditions. The difference in resistance between the transom shapes is small, but the boxy one is marginally better for the upright condition, while the round is better for the heeled condition.
In an upwind-downwind race the round transoms performed best for the three fastest transom sizes. The fastest hull around the course has an immersed transom ratio (At/Ax) of 0.16 and it is 1.9 % faster with a round transom than with a boxy one. Overall the round transoms are faster around the race course.
Most likely, the hulls with boxy transoms are favoured in the study since the original hull is designed with a boxy transom and thus the mid-ship section fits this transom shape better. With that in mind there is reason to question whether there is any gain in performance with the modern box shaped transoms. From a hydrodynamic
point of view this does not seem to be the case, but there could be other gains that are not considered in this study (e.g. improved righting moment).
The study has led to better understanding of the relationship between hydrostatic and hydrodynamic resistance at high Froude numbers where the gain from a large immersed transom area is larger than the loss from increased transom resistance. For low Froude numbers where the transom is wetted the effect from viscous pressure resistance, base drag, has been pinpointed.
8. REFERENCES
1. Allroth, J. and Wu, T.-H. (2013), A CFD Investigation of Sailing Yacht Transom Sterns, MSc Thesis, Dept. Shipping and Marine Technology, Chalmers University of Technology, Gothenburg, Sweden
2. Larsson, L. & Raven, H. (2010), Ship Resistance and Flow, PNA Series, Society of Naval Architects and Marine Engineers, USA.
3. Keuning, J.A., Katgert, M. (2008): A Bare Hull Resistance Prediction Method Derived from the Results of the Delft Systematic Yacht Hull Series Extended to Higher Speeds, International Conference on Innovation in High Performance Sailing Yachts, Lorient, France
4. Hoerner, S.F. (1965): Fluid-Dynamic Drag. Hoerner Fluid Dynamics, Bricktown New Jersey, USA
266