saif financial statements-statutory basis as of and for
TRANSCRIPT
SAIF Corporation
Financial Statements—Statutory Basis
as of and for the Years Ended December 31, 2020 and 2019, Supplementary Schedules
as of December 31, 2020, and Report of
Independent Auditors
SAIF CORPORATION
TABLE OF CONTENTS
Page
REPORT OF INDEPENDENT AUDITORS 1–2
FINANCIAL STATEMENTS—STATUTORY BASIS AS OF AND FOR
THE YEARS ENDED DECEMBER 31, 2020 AND 2019:
Statements of Admitted Assets, Liabilities, and Capital and
Surplus—Statutory Basis 3
Statements of Revenues, Expenses, and Capital and Surplus—
Statutory Basis 4
Statements of Cash Flows—Statutory Basis 5
Notes to Financial Statements—Statutory Basis 6–33
SUPPLEMENTARY SCHEDULES:
Appendix A—Summary Investment Schedule
Appendix B—Supplemental Investment Risks Interrogatories
Appendix C—General Interrogatories (Reinsurance)

1
Report of Independent Auditors on Internal Control Over Financial Reporting
and on Compliance and Other Matters Based on an Audit of Financial
Statements Performed in Accordance with Government Auditing Standards
The Board of Directors of
SAIF Corporation
The Secretary of State Audits Division of
The State of Oregon
We have audited, in accordance with the auditing standards generally accepted in the United States
of America and the standards applicable to financial audits contained in Government Auditing
Standards issued by the Comptroller General of the United States, the financial statements of SAIF
Corporation (“SAIF”) as of and for the year ended December 31, 2020, and the related notes to the
financial statements, which collectively comprise SAIF Corporation’s basic financial statements, and
have issued our report thereon dated July 27, 2021.
Internal Control over Financial Reporting
In planning and performing our audit of the financial statements, we considered SAIF’s internal
control over financial reporting (internal control) to determine the audit procedures that are
appropriate in the circumstances for the purpose of expressing our opinions on the financial
statements, but not for the purpose of expressing an opinion on the effectiveness of SAIF’s internal
control. Accordingly, we do not express an opinion on the effectiveness of SAIF’s internal control.
A deficiency in internal control exists when the design or operation of a control does not allow
management or employees, in the normal course of performing their assigned functions, to prevent,
or detect and correct, misstatements on a timely basis. A material weakness is a deficiency, or a
combination of deficiencies, in internal control, such that there is a reasonable possibility that a
material misstatement of the entity's financial statements will not be prevented, or detected and
corrected on a timely basis. A significant deficiency is a deficiency, or a combination of deficiencies,
in internal control that is less severe than a material weakness, yet important enough to merit
attention by those charged with governance.
Our consideration of internal control was for the limited purpose described in the first paragraph of
this section and was not designed to identify all deficiencies in internal control that might be material
weaknesses or significant deficiencies. Given these limitations, during our audit we did not identify
any deficiencies in internal control that we consider to be material weaknesses. However, material
weaknesses may exist that have not been identified.

2
Compliance and Other Matters
As part of obtaining reasonable assurance about whether SAIF’s financial statements are free from
material misstatement, we performed tests of its compliance with certain provisions of laws,
regulations, contracts, and grant agreements, noncompliance with which could have a direct and
material effect on the determination of financial statement amounts. However, providing an opinion on
compliance with those provisions was not an objective of our audit, and accordingly, we do not
express such an opinion. The results of our tests disclosed no instances of noncompliance or other
matters that are required to be reported under Government Auditing Standards.
Purpose of this Report
The purpose of this report is solely to describe the scope of our testing of internal control and
compliance and the results of that testing, and not to provide an opinion on the effectiveness of the
entity’s internal control or on compliance. This report is an integral part of an audit performed in
accordance with Government Auditing Standards in considering the entity’s internal control and
compliance. Accordingly, this communication is not suitable for any other purpose.
Portland, Oregon
July 27, 2021
- 3 -
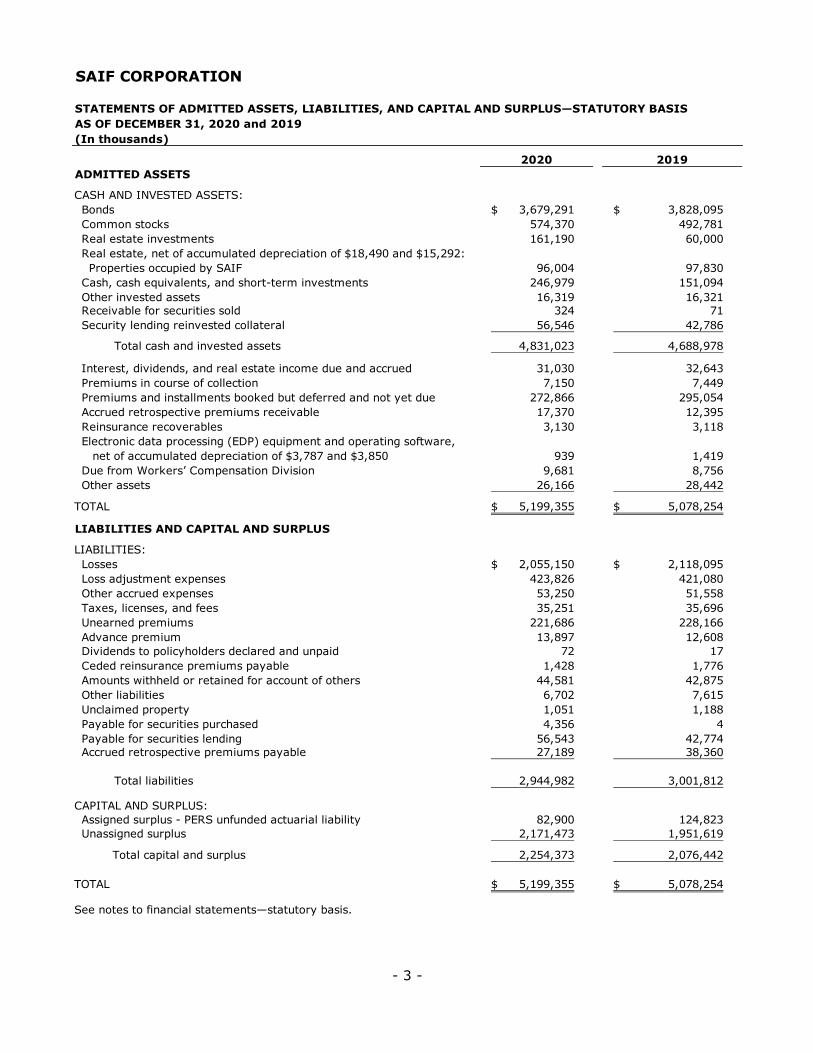
SAIF CORPORATION
STATEMENTS OF ADMITTED ASSETS, LIABILITIES, AND CAPITAL AND SURPLUS—STATUTORY BASIS
AS OF DECEMBER 31, 2020 and 2019
(In thousands)
2020 2019
ADMITTED ASSETS
CASH AND INVESTED ASSETS:
Bonds 3,679,291$ 3,828,095$
Common stocks 574,370 492,781
Real estate investments 161,190 60,000
Real estate, net of accumulated depreciation of $18,490 and $15,292:
Properties occupied by SAIF 96,004 97,830
Cash, cash equivalents, and short-term investments 246,979 151,094
Other invested assets 16,319 16,321
Receivable for securities sold 324 71
Security lending reinvested collateral 56,546 42,786
Total cash and invested assets 4,831,023 4,688,978
Interest, dividends, and real estate income due and accrued 31,030 32,643
Premiums in course of collection 7,150 7,449
Premiums and installments booked but deferred and not yet due 272,866 295,054
Accrued retrospective premiums receivable 17,370 12,395
Reinsurance recoverables 3,130 3,118
Electronic data processing (EDP) equipment and operating software,
net of accumulated depreciation of $3,787 and $3,850 939 1,419
Due from Workers’ Compensation Division 9,681 8,756
Other assets 26,166 28,442
TOTAL 5,199,355$ 5,078,254$
LIABILITIES AND CAPITAL AND SURPLUS
LIABILITIES:
Losses 2,055,150$ 2,118,095$
Loss adjustment expenses 423,826 421,080
Other accrued expenses 53,250 51,558
Taxes, licenses, and fees 35,251 35,696
Unearned premiums 221,686 228,166
Advance premium 13,897 12,608
Dividends to policyholders declared and unpaid 72 17
Ceded reinsurance premiums payable 1,428 1,776
Amounts withheld or retained for account of others 44,581 42,875
Other liabilities 6,702 7,615
Unclaimed property 1,051 1,188
Payable for securities purchased 4,356 4
Payable for securities lending 56,543 42,774
Accrued retrospective premiums payable 27,189 38,360
Total liabilities 2,944,982 3,001,812
CAPITAL AND SURPLUS:
Assigned surplus - PERS unfunded actuarial liability 82,900 124,823
Unassigned surplus 2,171,473 1,951,619
Total capital and surplus 2,254,373 2,076,442
TOTAL 5,199,355$ 5,078,254$
See notes to financial statements—statutory basis.
- 4 -
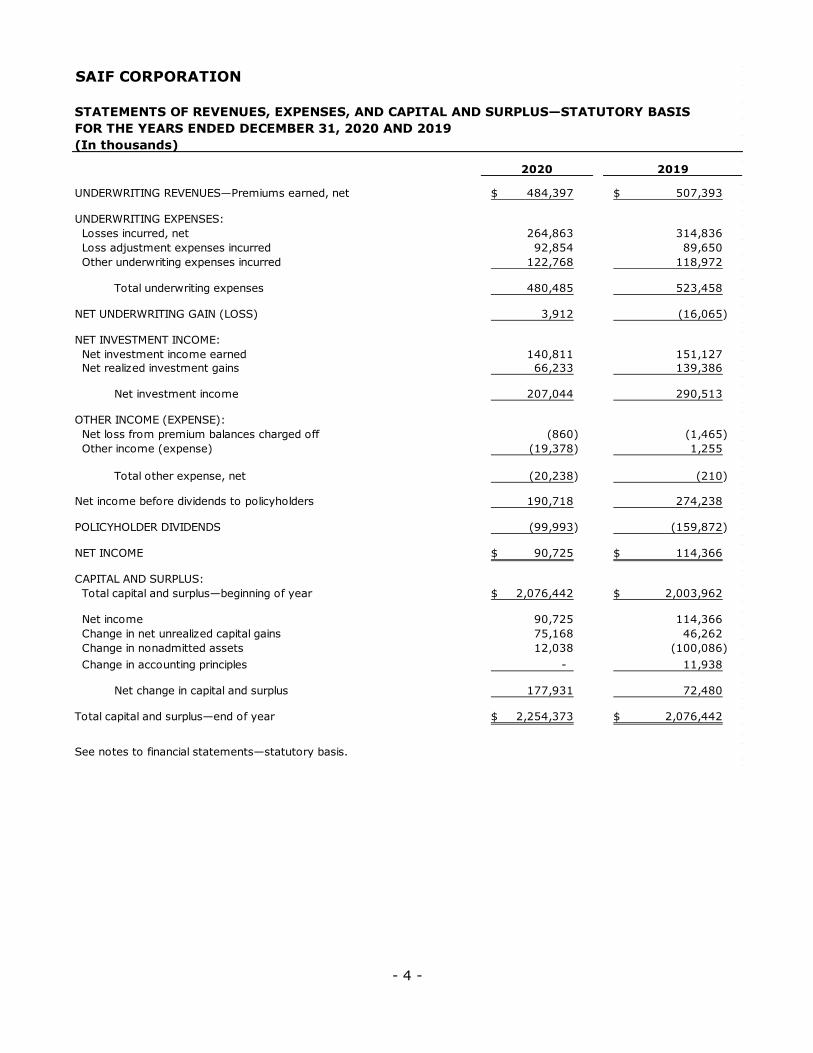
SAIF CORPORATION
STATEMENTS OF REVENUES, EXPENSES, AND CAPITAL AND SURPLUS—STATUTORY BASIS
FOR THE YEARS ENDED DECEMBER 31, 2020 AND 2019
(In thousands)
2020 2019
UNDERWRITING REVENUES—Premiums earned, net 484,397$ 507,393$
UNDERWRITING EXPENSES:
Losses incurred, net 264,863 314,836
Loss adjustment expenses incurred 92,854 89,650
Other underwriting expenses incurred 122,768 118,972
Total underwriting expenses 480,485 523,458
NET UNDERWRITING GAIN (LOSS) 3,912 (16,065)
NET INVESTMENT INCOME:
Net investment income earned 140,811 151,127
Net realized investment gains 66,233 139,386
Net investment income 207,044 290,513
OTHER INCOME (EXPENSE):
Net loss from premium balances charged off (860) (1,465)
Other income (expense) (19,378) 1,255
Total other expense, net (20,238) (210)
Net income before dividends to policyholders 190,718 274,238
POLICYHOLDER DIVIDENDS (99,993) (159,872)
NET INCOME 90,725$ 114,366$
CAPITAL AND SURPLUS:
Total capital and surplus—beginning of year 2,076,442$ 2,003,962$
Net income 90,725 114,366
Change in net unrealized capital gains 75,168 46,262
Change in nonadmitted assets 12,038 (100,086)
Change in accounting principles - 11,938
Net change in capital and surplus 177,931 72,480
Total capital and surplus—end of year 2,254,373$ 2,076,442$
See notes to financial statements—statutory basis.

- 5 -
Supplemental schedule of noncash transactions: Noncash investment transactions were $65.6 million and $29.2 million for both investment acquisitions and dispositions resulting from tax-free exchange transactions for the years ended December 31, 2020 and 2019, respectively.
SAIF CORPORATION
STATEMENTS OF CASH FLOWS—STATUTORY BASIS
FOR THE YEARS ENDED DECEMBER 31, 2020 AND 2019
(In thousands)
2020 2019
CASH FROM (USED IN) OPERATIONS:
Cash from underwriting:
Premiums collected, net of reinsurance 485,701$ 503,969$
Net investment income 158,332 167,982
Net cash from underwriting 644,033 671,951
Miscellaneous income (expense) (20,238) (211)
Benefits and loss related payments (327,820) (325,844)
Underwriting expenses paid (203,930) (199,224)
Policyholder dividend payments (99,938) (159,909)
Net cash from (used in) operations (7,893) (13,237)
CASH FROM (USED IN) INVESTMENTS:
Proceeds from investments sold, matured, or repaid:
Bonds 1,707,246 1,322,226
Common stocks 253 181,611
Other invested assets (13,769) 106,278
Cash and short-term investments 47 (1)
Miscellaneous payments (255) (3)
Total proceeds from investments sold, matured, or repaid 1,693,522 1,610,111
Cost of investments acquired:
Bonds 1,508,078 1,239,720
Common stocks 40,618 107
Real estate 1,372 5,533
Other invested assets 50,354 160,701
Miscellaneous receipts (4,351) (1)
Total cost of investments acquired 1,596,071 1,406,060
Net cash from (used in) investments 97,451 204,051
CASH FROM (USED IN) FINANCING AND MISCELLANEOUS SOURCES:
Other cash provided (270) 2,644
Other cash applied 6,597 (104,380)
Net cash from (used in) financing and miscellaneous sources 6,327 (101,736)
RECONCILIATION OF CASH, CASH EQUIVALENTS, AND SHORT-TERM
INVESTMENTS—Net increase (decrease) in cash, cash equivalents, and
short-term investments 95,885 89,078
CASH, CASH EQUIVALENTS, AND SHORT-TERM INVESTMENTS—Beginning of year 151,094 62,016 CASH, CASH EQUIVALENTS, AND SHORT-TERM INVESTMENTS—End of year 246,979$ 151,094$
See notes to financial statements—statutory basis.
- 6 -
SAIF CORPORATION
NOTES TO FINANCIAL STATEMENTS—STATUTORY BASIS
AS OF AND FOR THE YEARS ENDED DECEMBER 31, 2020 AND 2019
1. NATURE OF OPERATIONS
SAIF Corporation (SAIF) is a public corporation created by an act of the Oregon Legislature. It traces its origins to 1914 when its predecessor organization commenced business.
SAIF is an insurance company authorized to write workers’ compensation coverage in Oregon and is a servicing carrier for accounts in the assigned risk pool. SAIF also provides coverage governed by the Longshore and Harbor Workers’ Compensation Act, Jones Act, and Federal Employers Liability Law. SAIF partners with Zurich Insurance Group Ltd. (Zurich) and United States Insurance Services (USIS) to provide other states coverage. SAIF’s Board of Directors is appointed by the governor of the State of Oregon and consists of Oregon business and community leaders not otherwise in the employ of SAIF. Certain members of SAIF’s Board of
Directors are SAIF policyholders or are employed by SAIF policyholders. The transactions between SAIF and these policyholders were within SAIF’s standard terms and conditions.
SAIF writes business on a direct basis as well as through agents. Premiums written on a direct basis were 18.1 percent of standard premium during 2020 and 2019. SAIF issues workers’ compensation insurance policies to individual Oregon employers including state agencies.
The Oregon Department of Consumer and Business Services (DCBS) enforces workers’ compensation laws under the Oregon Revised Statutes (ORS). Under the reporting requirements of DCBS, Division of Financial Regulation (Insurance Division), SAIF is subject to Risk Based Capital (RBC) requirements of the National Association of Insurance Commissioners (NAIC), which establishes that certain amounts of capital and surplus be maintained. SAIF’s Company Action Level (CAL) RBC calculated minimum capital and surplus amount was $362.1 million and $316.3 million at December 31, 2020 and 2019, respectively. At December 31,
2020 and 2019, the statutory capital and surplus of SAIF exceeded the minimum RBC requirements. While SAIF is not subject to the minimum capital and surplus requirements set forth in ORS 731.554, SAIF uses various benchmarking and risk level techniques to monitor and maintain an adequate level of capital and surplus.
On January 30, 2020 the World Health Organization declared a global health emergency in response to the coronavirus outbreak discovered in China. Significant policyholder layoffs
associated with the coronavirus pandemic and economic downturn impacted SAIF’s 2020 premium which are based on employers’ reported payroll. In addition, many of SAIF’s policyholders were affected by wildfires across Oregon. In accordance with the Oregon Department of Consumer and Business Services (DCBS) orders, SAIF took measures to suspend non-voluntary non-renewals and cancellations, provide grace periods for payments, and extend other deadlines for affected policyholders. Despite high unemployment and the economic environment, SAIF’s premiums dropped just 4.5% during 2020. The financial
statements include a provision for both estimated payroll and premium impacts, but due to significant uncertainty, the actual results will vary.
SAIF also has exposure to coronavirus related claims. SAIF had over 2,000 coronavirus related claims reported through December 31, 2020, with the majority being time-loss claims. Total incurred losses on these claims were $3.7 million. SAIF continues to monitor claims exposure, premium levels, and other operational impacts related to the coronavirus pandemic.

- 7 -
The significant economic downturn initially impacted SAIF’s investment holdings before fully recovering. SAIF is continuing to monitor investments that have been hardest hit by the crisis.
2. SUMMARY OF SIGNIFICANT ACCOUNTING POLICIES
Basis of accounting—SAIF prepares its financial statements—statutory basis in conformity with accounting practices prescribed or permitted by the Insurance Division. The Insurance Division requires that insurance companies domiciled in the State of Oregon prepare their financial statements—statutory basis in accordance with the NAIC Accounting Practices and Procedures Manual—Version effective March 2020 and 2019, subject to any deviations prescribed or permitted by the Insurance Division.
Accounting practices and procedures of the NAIC as prescribed or permitted by the Insurance
Division comprise a comprehensive basis of accounting other than accounting principles generally accepted in the United States of America (GAAP). The more significant differences are as follows:
(a) Investments in bonds are generally carried at amortized cost, while under GAAP they are carried at fair value with changes in fair value recorded as investment income (loss).
(b) Changes in the fair value of common stock are charged directly to capital and surplus, whereas, under GAAP, changes in fair value are recorded as investment income (loss).
(c) Changes in fair value for investments considered to be other-than-temporarily impaired (OTTI) are recognized as realized losses, while under GAAP they are recorded as investment income (loss).
(d) Assets are reported under Statutory Accounting Principles (SAP) at “admitted asset” value and “nonadmitted” assets are excluded through a charge against capital and surplus, while under GAAP such assets are reinstated to the balance sheet, net of any valuation allowance. The statutory Statement of Concepts states that assets that cannot be used to fulfill policyholder obligations or are subject to third party interests shall not be recognized on the Statements of Admitted Assets, Liabilities, and Capital and Surplus. Nonadmitted assets include such assets as premiums receivable past due for more than ninety days, furniture and equipment, and application software.
(e) Short-term investments include securities with maturities, at the time of acquisition, of one year or less, while under GAAP short-term investments have maturities of over 90 days but less than one year.
(f) Cumulative effects of changes in accounting are reported as an adjustment to surplus in the period of the change in accounting principle.
(g) A liability for reinsurance balances is provided for unsecured unearned premiums, unpaid losses ceded to reinsurers unauthorized by license to assume such business, and certain overdue reinsurance balances. Changes in those amounts are credited and charged directly to unassigned surplus.
(h) The statements of cash flows differ in certain respects from the presentation required by GAAP, including the presentation of the changes in cash and short-term investments instead of cash and cash equivalents and absence of a reconciliation between net income and cash provided by operating activities. Under SAP, SAIF offsets accounts with negative cash balances with accounts with positive balances instead of presenting with negative balances as short-term liabilities.
- 8 -
(i) Accounting for the multiple employer benefit plan differs from SAP to GAAP accounting. SAIF participates in a cost-sharing multiemployer defined benefit pension plan administered by the Oregon Public Employees Retirement System (PERS) (see Note 10). PERS has a net Unfunded Actuarial Liability (UAL) which represents the estimated unfunded pension benefits. GAAP accounting requires the UAL to be recorded as a liability while SAP does not allow for recording of the UAL as a liability. Instead for SAP, SAIF
established a special surplus fund in 2017 to identify its portion of the PERS UAL and has adjusted the fund based on an allocation provided by PERS as of June 30, 2020 and the Oregon Department of Administration Services as of June 30, 2019. Due to the timing delay, SAIF has evaluated subsequent events that may impact the assets and liabilities of the plan and determined that the valuation of liability is still materially accurate. Based on this information, the special surplus fund for the unfunded pension benefits is $82.9 million and $124.8 million at December 31, 2020 and 2019, respectively.
(j) On December 30, 2019, SAIF funded a PERS side account totaling $97.0 million which represented approximately 90 percent of SAIF's UAL based on a preliminary actuarial valuation from PERS (See Note 10). This side account does not impact employee benefits received under PERS; instead, it represents a prepayment of SAIF's on-going contributions. On SAIF’s GAAP statements, this balance is subject to a different amortization period and is grouped with deferred outflows as a difference between employer contributions and employer’s proportionate share of system contributions.
Investments—Bonds and short-term investments not backed by mortgages or other assets are generally carried at amortized cost using the scientific interest method. Noninvestment grade bonds (NAIC designation 3 to 6) are carried at the lower of amortized cost or fair value. There were no bonds held by SAIF which were in or near default at December 31, 2020 and
2019. Residential and commercial mortgage-backed securities are carried at the lower of amortized cost or fair value based on the financial model provided by the NAIC. Other asset-backed securities are carried at either amortized cost (NAIC designation 1 and 2) or the lower of amortized cost or fair value (NAIC designation 3 to 6). Premiums and discounts on mortgage-backed bonds and structured securities are amortized using the retrospective method based on anticipated prepayments at the date of purchase. Prepayment assumptions are obtained from Bloomberg. Changes in estimated cash flows from the original purchase
assumptions are accounted for using the retrospective method. The prospective method is used for securities recognized as OTTI, when collection of all contractual cash flows is not probable. Interest-only securities and securities where the yield has become negative are valued using the prospective method.
Common stocks are carried at fair value. The change in the stated value is recorded as a change in net unrealized capital gains (losses), a component of unassigned surplus.
Investments in real estate funds held by limited partnerships are valued using net asset value (NAV). The change in the stated value is recorded as a change in net unrealized capital gains (losses), a component of unassigned surplus.
The fair values for investment securities for 2020 and 2019 were obtained from Thomson Reuters, IDC, JPM Direct, and Bloomberg. Equity securities traded on a national exchange are
valued at the last reported sales price. Debt securities are valued using evaluated bid prices at December 31, 2020 and 2019.
For all investments, impairments are recorded in the Statement of Revenues, Expenses, and Capital and Surplus when it is determined that the decline in fair value of an investment below its amortized cost is other-than-temporary. The measurement of OTTI for equity securities, bonds, and securities not backed by other assets is measured by the difference between amortized cost and fair value. OTTI for mortgage and other asset-backed securities is based
- 9 -
upon the difference between amortized cost and future projected discounted cash flows. SAIF considers several factors in determining if an impairment is OTTI, including the extent and duration of impairment, the financial condition and short-term prospects of the issuer, cash flows of underlying collateral for mortgage and other asset-backed securities, SAIF’s ability to hold the investment to allow for any anticipated recovery in value, as well as management’s intent to sell the investment. OTTI changes are reflected in net realized investment gains
(losses). The cost basis of the investment is then adjusted to reflect the OTTI.
Net investment income earned consists primarily of interest and dividends less investment expenses. Interest income is recognized on an accrual basis, and dividends are recorded as earned at the ex-dividend date. Interest income on mortgage-backed and asset-backed securities is determined using the effective yield method based on estimated principal prepayments. Accrual of income is suspended for bonds and mortgage loans that are in default or when the receipt of interest payments is in doubt. Realized capital gains and losses are determined on a specific identification basis.
Investment income due and accrued with amounts over 90 days past due is nonadmitted. At December 31, 2020 and 2019, no accrued interest or other investment income due and accrued was required to be nonadmitted.
SAIF’s policy requires a minimum of 102 percent of the fair value of securities purchased under repurchase agreements to be maintained as collateral. The collateral securities are held at State Street Bank and Trust Company (State Street). There were no securities purchased under repurchase agreements at December 31, 2020 and 2019.
Cash, cash equivalents, and short-term investments—SAIF places its temporary cash
investments with the Oregon Short-Term Fund (OSTF). The OSTF is a cash and investment pool that operates as a demand deposit account. As a result, SAIF’s investment is not impacted by changes in the market value of the OSTF. By statute, the OSTF may hold securities with maturities no greater than three years. Audited financial statements and monthly compliance summaries, which include information about the OSTF’s maturity distribution and credit quality, may be obtained at the Oregon State Treasury’s web site: https://www.oregon.gov/treasury/public-financial-services/oregon-short-term-funds/pages/default.aspx. As of December 31, 2020 and 2019, SAIF’s balance in the OSTF was $33.0 million and $50.3 million, respectively.
Oregon’s State Treasurer employs the services of two external investment managers to manage SAIF’s fixed income portfolios. The cash balances of the fixed income managers are invested in money market funds with the objective of maximizing current income while maintaining a stable net asset value. The average maturity of the Institutional U.S.
Government Money Market Fund at December 31, 2020 and 2019, was 47 days and 35 days, respectively. The Institutional U.S. Government Money Market Fund had a credit quality rating of AAAm at December 31, 2020 and 2019. At December 31, 2020 and 2019, SAIF’s balance in the Institutional U.S. Government Money Market Fund was $8.2 million and $4.1 million, respectively. There were no Treasury bills held as of December 31, 2020. At December 31, 2019, SAIF held $18.2 million in Treasury bills which matured in January 2020. At December 31, 2020 and 2019, SAIF held $196.1 million and $71.7 million in short-term bonds,
respectively.
Concentrations of credit risk—Financial instruments, which potentially subject SAIF to concentrations of credit risk, consist principally of temporary cash investments and debt securities. SAIF places its investment securities with financial institutions approved by the State of Oregon and limits the amount of credit exposure to any one financial institution. Concentrations of credit risk with respect to investments in debt securities are limited due to
- 10 -
the large number of such investments and their distribution among many different industries and geographic regions.
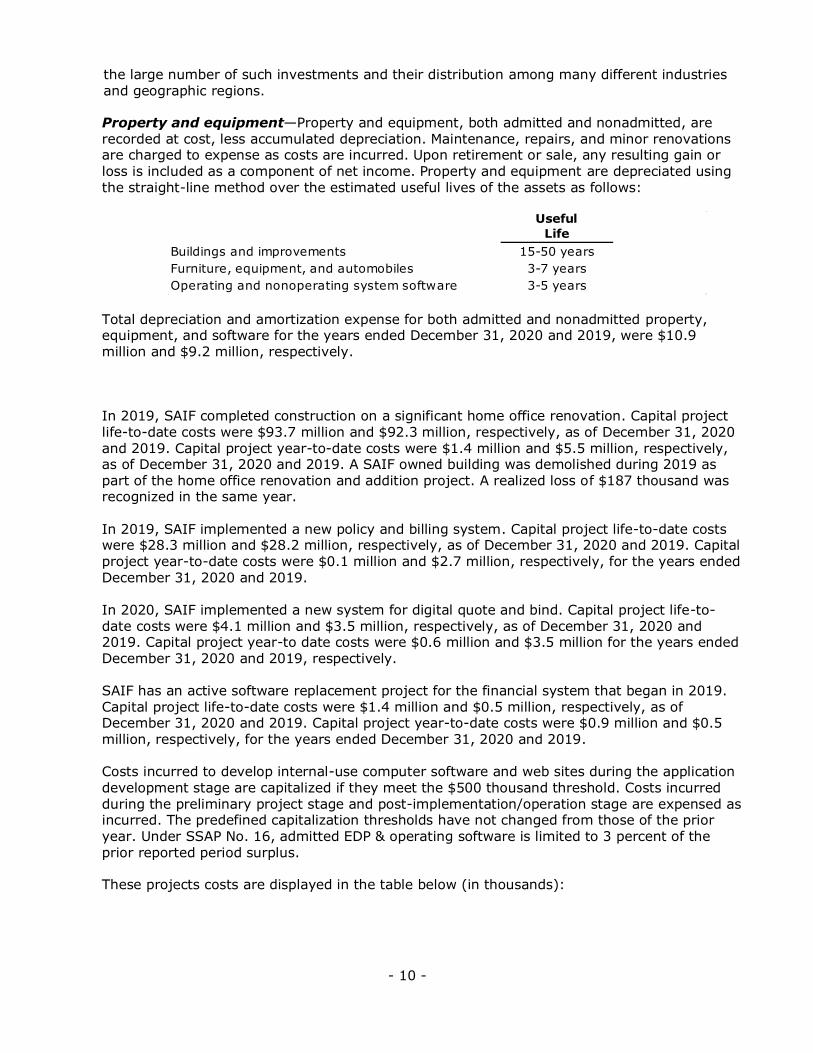
Property and equipment—Property and equipment, both admitted and nonadmitted, are recorded at cost, less accumulated depreciation. Maintenance, repairs, and minor renovations are charged to expense as costs are incurred. Upon retirement or sale, any resulting gain or
loss is included as a component of net income. Property and equipment are depreciated using the straight-line method over the estimated useful lives of the assets as follows:
Total depreciation and amortization expense for both admitted and nonadmitted property, equipment, and software for the years ended December 31, 2020 and 2019, were $10.9 million and $9.2 million, respectively.
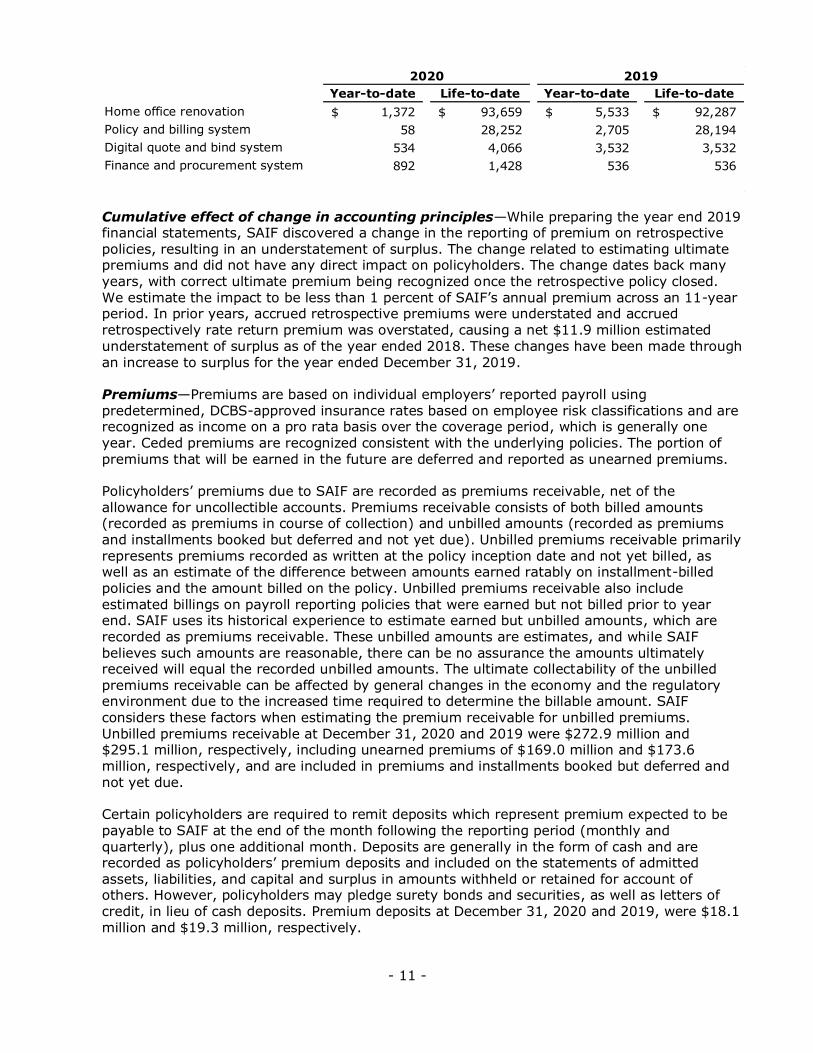
In 2019, SAIF completed construction on a significant home office renovation. Capital project life-to-date costs were $93.7 million and $92.3 million, respectively, as of December 31, 2020 and 2019. Capital project year-to-date costs were $1.4 million and $5.5 million, respectively, as of December 31, 2020 and 2019. A SAIF owned building was demolished during 2019 as part of the home office renovation and addition project. A realized loss of $187 thousand was recognized in the same year.
In 2019, SAIF implemented a new policy and billing system. Capital project life-to-date costs were $28.3 million and $28.2 million, respectively, as of December 31, 2020 and 2019. Capital project year-to-date costs were $0.1 million and $2.7 million, respectively, for the years ended December 31, 2020 and 2019.
In 2020, SAIF implemented a new system for digital quote and bind. Capital project life-to-date costs were $4.1 million and $3.5 million, respectively, as of December 31, 2020 and 2019. Capital project year-to date costs were $0.6 million and $3.5 million for the years ended December 31, 2020 and 2019, respectively. SAIF has an active software replacement project for the financial system that began in 2019. Capital project life-to-date costs were $1.4 million and $0.5 million, respectively, as of December 31, 2020 and 2019. Capital project year-to-date costs were $0.9 million and $0.5 million, respectively, for the years ended December 31, 2020 and 2019.
Costs incurred to develop internal-use computer software and web sites during the application development stage are capitalized if they meet the $500 thousand threshold. Costs incurred during the preliminary project stage and post-implementation/operation stage are expensed as incurred. The predefined capitalization thresholds have not changed from those of the prior
year. Under SSAP No. 16, admitted EDP & operating software is limited to 3 percent of the prior reported period surplus.
These projects costs are displayed in the table below (in thousands):
Useful
Life
Buildings and improvements 15-50 years
Furniture, equipment, and automobiles 3-7 years
Operating and nonoperating system software 3-5 years
- 11 -
Cumulative effect of change in accounting principles—While preparing the year end 2019 financial statements, SAIF discovered a change in the reporting of premium on retrospective policies, resulting in an understatement of surplus. The change related to estimating ultimate premiums and did not have any direct impact on policyholders. The change dates back many
years, with correct ultimate premium being recognized once the retrospective policy closed. We estimate the impact to be less than 1 percent of SAIF’s annual premium across an 11-year period. In prior years, accrued retrospective premiums were understated and accrued retrospectively rate return premium was overstated, causing a net $11.9 million estimated understatement of surplus as of the year ended 2018. These changes have been made through an increase to surplus for the year ended December 31, 2019.
Premiums—Premiums are based on individual employers’ reported payroll using predetermined, DCBS-approved insurance rates based on employee risk classifications and are recognized as income on a pro rata basis over the coverage period, which is generally one year. Ceded premiums are recognized consistent with the underlying policies. The portion of premiums that will be earned in the future are deferred and reported as unearned premiums.
Policyholders’ premiums due to SAIF are recorded as premiums receivable, net of the
allowance for uncollectible accounts. Premiums receivable consists of both billed amounts (recorded as premiums in course of collection) and unbilled amounts (recorded as premiums and installments booked but deferred and not yet due). Unbilled premiums receivable primarily represents premiums recorded as written at the policy inception date and not yet billed, as well as an estimate of the difference between amounts earned ratably on installment-billed policies and the amount billed on the policy. Unbilled premiums receivable also include
estimated billings on payroll reporting policies that were earned but not billed prior to year end. SAIF uses its historical experience to estimate earned but unbilled amounts, which are recorded as premiums receivable. These unbilled amounts are estimates, and while SAIF believes such amounts are reasonable, there can be no assurance the amounts ultimately received will equal the recorded unbilled amounts. The ultimate collectability of the unbilled premiums receivable can be affected by general changes in the economy and the regulatory environment due to the increased time required to determine the billable amount. SAIF
considers these factors when estimating the premium receivable for unbilled premiums. Unbilled premiums receivable at December 31, 2020 and 2019 were $272.9 million and $295.1 million, respectively, including unearned premiums of $169.0 million and $173.6 million, respectively, and are included in premiums and installments booked but deferred and not yet due.
Certain policyholders are required to remit deposits which represent premium expected to be
payable to SAIF at the end of the month following the reporting period (monthly and quarterly), plus one additional month. Deposits are generally in the form of cash and are recorded as policyholders’ premium deposits and included on the statements of admitted assets, liabilities, and capital and surplus in amounts withheld or retained for account of others. However, policyholders may pledge surety bonds and securities, as well as letters of credit, in lieu of cash deposits. Premium deposits at December 31, 2020 and 2019, were $18.1 million and $19.3 million, respectively.
Year-to-date Life-to-date Year-to-date Life-to-date
Home office renovation 1,372$ 93,659$ 5,533$ 92,287$
Policy and billing system 58 28,252 2,705 28,194
Digital quote and bind system 534 4,066 3,532 3,532
Finance and procurement system 892 1,428 536 536
2020 2019
- 12 -
In addition to its regular premium plans, SAIF offers employers retrospective premium rating plans under which premiums are adjusted annually for up to 10½ years following the plan year based on policyholders’ loss experience. Adjustments to the original premiums are paid to or collected from the policyholders six months following the expiration of the policy and annually thereafter for up to 10½ years. The amounts of expected ultimate settlements are included in the accompanying statements of admitted assets, liabilities, and capital and surplus as accrued
retrospective premiums receivable and payable. Changes in estimated settlements are recorded in premiums earned at the time they are known.
SAIF estimates accrued retrospective premiums receivable and payable by reviewing historical loss and premium development patterns at various stages of maturity and using these historical patterns to arrive at the best estimate of return and additional retrospective premiums on all open retrospectively rated policies. Premiums written on retrospective workers’ compensation policies for 2020 and 2019 were $72.0 million and $74.5 million, respectively, or 15.1 and 14.6 percent of net premiums written, respectively, for each year. While preparing the year end 2019 financial statements, SAIF discovered an error in the reporting of premium on retrospective policies causing a net understatement of $11.9 million (see note on change in accounting principles).
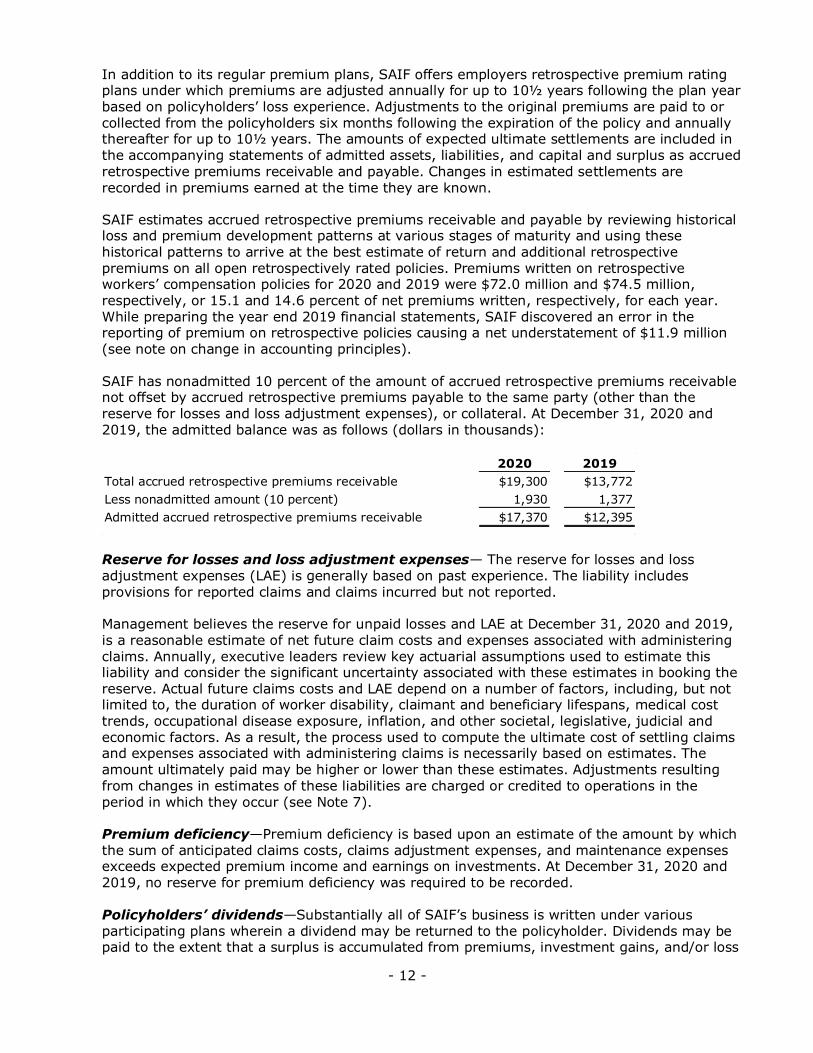
SAIF has nonadmitted 10 percent of the amount of accrued retrospective premiums receivable not offset by accrued retrospective premiums payable to the same party (other than the reserve for losses and loss adjustment expenses), or collateral. At December 31, 2020 and 2019, the admitted balance was as follows (dollars in thousands):
Reserve for losses and loss adjustment expenses— The reserve for losses and loss adjustment expenses (LAE) is generally based on past experience. The liability includes provisions for reported claims and claims incurred but not reported.
Management believes the reserve for unpaid losses and LAE at December 31, 2020 and 2019, is a reasonable estimate of net future claim costs and expenses associated with administering claims. Annually, executive leaders review key actuarial assumptions used to estimate this liability and consider the significant uncertainty associated with these estimates in booking the reserve. Actual future claims costs and LAE depend on a number of factors, including, but not limited to, the duration of worker disability, claimant and beneficiary lifespans, medical cost
trends, occupational disease exposure, inflation, and other societal, legislative, judicial and economic factors. As a result, the process used to compute the ultimate cost of settling claims and expenses associated with administering claims is necessarily based on estimates. The amount ultimately paid may be higher or lower than these estimates. Adjustments resulting from changes in estimates of these liabilities are charged or credited to operations in the period in which they occur (see Note 7).
Premium deficiency—Premium deficiency is based upon an estimate of the amount by which the sum of anticipated claims costs, claims adjustment expenses, and maintenance expenses exceeds expected premium income and earnings on investments. At December 31, 2020 and 2019, no reserve for premium deficiency was required to be recorded. Policyholders’ dividends—Substantially all of SAIF’s business is written under various participating plans wherein a dividend may be returned to the policyholder. Dividends may be paid to the extent that a surplus is accumulated from premiums, investment gains, and/or loss
2020 2019
Total accrued retrospective premiums receivable $19,300 $13,772
Less nonadmitted amount (10 percent) 1,930 1,377
Admitted accrued retrospective premiums receivable $17,370 $12,395

- 13 -
reserve reductions. In 2020 and 2019, policyholder dividends of $100.0 million and $159.9 million, respectively, were incurred and paid to qualifying policyholders.
Taxes and assessments—The Oregon Department of Justice has determined that SAIF is exempt from federal and state income taxes, because it is an integral part of the State of Oregon and, alternatively, exempt under either or both Sections 501(c)(27)(B) and 115(1) of
the Internal Revenue Code.
SAIF collects and remits levies on behalf of their policyholders to the Oregon Workers’ Compensation Division of DCBS. Such assessments constitute an in-lieu-of-tax relative to premiums. Premium assessment expenses were $38.1 million and $38.9 million for the years ended December 31, 2020 and 2019, respectively. Premium assessments were accrued in the amount of $35.8 million and $37.2 million as of December 31, 2020 and 2019, respectively.
Premium assessment income net of premium assessment expense for the years ended December 31, 2020 and 2019, was $(0.2) million and $(1.6) million, respectively, and is included as a component of other underwriting expenses incurred. The negative premium assessment for 2019 is related to the accounting error that was discussed previously in the change in accounting principles.
Use of estimates—The preparation of financial statements in accordance with SAP requires
management to make estimates and assumptions that affect the reported amounts of admitted assets and liabilities, the reported amounts of revenues and expenses during the reporting period, and disclosures of contingent assets and liabilities at the date of the financial statements. Actual results could differ from those estimates.
Allocable expenses—The material components of loss adjustment expenses, other
underwriting expenses, and investment expenses were as follows (dollars in thousands):
Prior year presentation—Certain prior year balances have been modified to conform to the
current year presentation.
Subsequent events—On March 10, 2021, SAIF’s Board of Directors declared a $210.0 million dividend for policyholders on policies that expired in 2020. The valuation date for eligible policies will be June 4, 2021 and will be paid before July 31, 2021.
Subsequent events have been considered through July 27, 2021, which is the date the
financial statements were available to be issued.
3. NEW STATUTORY ACCOUNTING PRINCIPLES
No applicable new Statutory Accounting Principles were adopted by SAIF for the years ended December 31, 2020 or 2019.
Loss Other Loss Other
Adjustment Underwriting Adjustment Underwriting
Expenses Expenses Investment Expenses Expenses Investment
Incurred Incurred Expenses Incurred Incurred Expenses
Salaries, wages, & other benefits 75,075$ 65,067$ 2,887$ 71,520$ 61,446$ 2,726$
Commissions - 33,132 - - 34,462 -
Other 17,779 24,569 9,405 18,130 23,064 9,755
Total allocable expenses 92,854$ 122,768$ 12,292$ 89,650$ 118,972$ 12,481$
2020 2019
- 14 -
4. INVESTMENTS
SAIF’s investment policies are governed by statute and the Oregon Investment Council (Council). The State Treasurer (Treasurer) is the investment officer for the Council and is responsible for the funds on deposit in the State Treasury. In accordance with ORS 293.726, the investment funds are required to be invested, and the investments of those funds
managed, as a prudent investor would do, exercising reasonable care, skill, and caution. While the Treasurer is authorized to use demand deposit accounts and fixed income investments, equity investment transactions must be directed by external investment managers that are under contract with the Council. Equity investments are limited to not more than 50 percent of the monies contributed to the Industrial Accident Fund (SAIF Corporation). However, SAIF’s adopted investment policy as approved by the Council limits equity holdings to a range of 7 percent to 13 percent of the market value of invested assets with a target allocation of 10
percent.
Effective April 24, 2019, the Council approved a revised asset allocation policy for SAIF. The new allocation reaffirms a 5 percent target allocation to real estate in the form of private or publicly traded funds, allows for an 8 percent combined target allocation to bank loans and private credit, and reduced the target allocation to fixed income holdings from 90 percent to
77 percent. The target allocation to global equities of 10 percent remains unchanged.
Bond, mortgage-backed, asset-backed, and equity security transactions are recorded on a trade-date basis, generally three business days prior to the settlement date. However, the number of days between trade and settlement dates for mortgage-backed securities can be up to 30 days or longer, depending on the security. Receivables for securities not received within 15 days from the settlement date are nonadmitted. There were no such receivables at
December 31, 2020 and 2019.
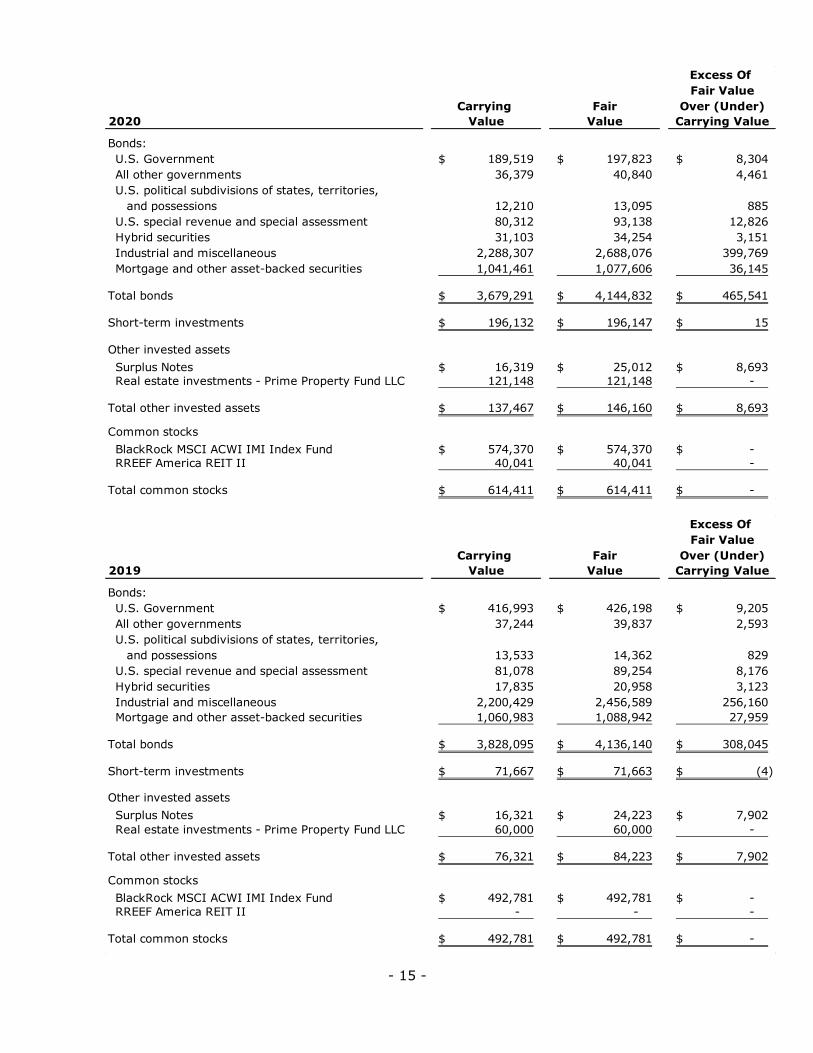
The carrying value and fair value of SAIF’s investment securities at December 31, 2020 and 2019, were as follows (dollars in thousands):
- 15 -
Excess Of
Fair Value
Carrying Fair Over (Under)
2020 Value Value Carrying Value
Bonds:
U.S. Government 189,519$ 197,823$ 8,304$
All other governments 36,379 40,840 4,461
U.S. political subdivisions of states, territories,
and possessions 12,210 13,095 885
U.S. special revenue and special assessment 80,312 93,138 12,826
Hybrid securities 31,103 34,254 3,151
Industrial and miscellaneous 2,288,307 2,688,076 399,769
Mortgage and other asset-backed securities 1,041,461 1,077,606 36,145
Total bonds 3,679,291$ 4,144,832$ 465,541$
Short-term investments 196,132$ 196,147$ 15$
Other invested assets
Surplus Notes 16,319$ 25,012$ 8,693$
Real estate investments - Prime Property Fund LLC 121,148 121,148 -
Total other invested assets 137,467$ 146,160$ 8,693$
Common stocks
BlackRock MSCI ACWI IMI Index Fund 574,370$ 574,370$ -$
RREEF America REIT II 40,041 40,041 -
Total common stocks 614,411$ 614,411$ -$
Excess Of
Fair Value
Carrying Fair Over (Under)
2019 Value Value Carrying Value
Bonds:
U.S. Government 416,993$ 426,198$ 9,205$
All other governments 37,244 39,837 2,593
U.S. political subdivisions of states, territories,
and possessions 13,533 14,362 829
U.S. special revenue and special assessment 81,078 89,254 8,176
Hybrid securities 17,835 20,958 3,123
Industrial and miscellaneous 2,200,429 2,456,589 256,160
Mortgage and other asset-backed securities 1,060,983 1,088,942 27,959
Total bonds 3,828,095$ 4,136,140$ 308,045$
Short-term investments 71,667$ 71,663$ (4)$
Other invested assets
Surplus Notes 16,321$ 24,223$ 7,902$
Real estate investments - Prime Property Fund LLC 60,000 60,000 -
Total other invested assets 76,321$ 84,223$ 7,902$
Common stocks
BlackRock MSCI ACWI IMI Index Fund 492,781$ 492,781$ -$
RREEF America REIT II - - -
Total common stocks 492,781$ 492,781$ -$

- 16 -
Proceeds from the sale of bonds were $1.7 billion and $1.3 billion during 2020 and 2019, respectively. Proceeds from the sale of stocks were $0.3 million and $181.6 million during 2020 and 2019, respectively.
The carrying value and fair value of bonds at December 31, 2020 and 2019, by contractual maturity, except for asset-backed securities which are by expected maturity, are shown as
follows (dollars in thousands). Expected maturities will differ from contractual maturities because borrowers may have the right to call or prepay obligations with or without call or prepayment penalties.
Net investment income earned for the years ended December 31, 2020 and 2019, was comprised of the following (dollars in thousands):
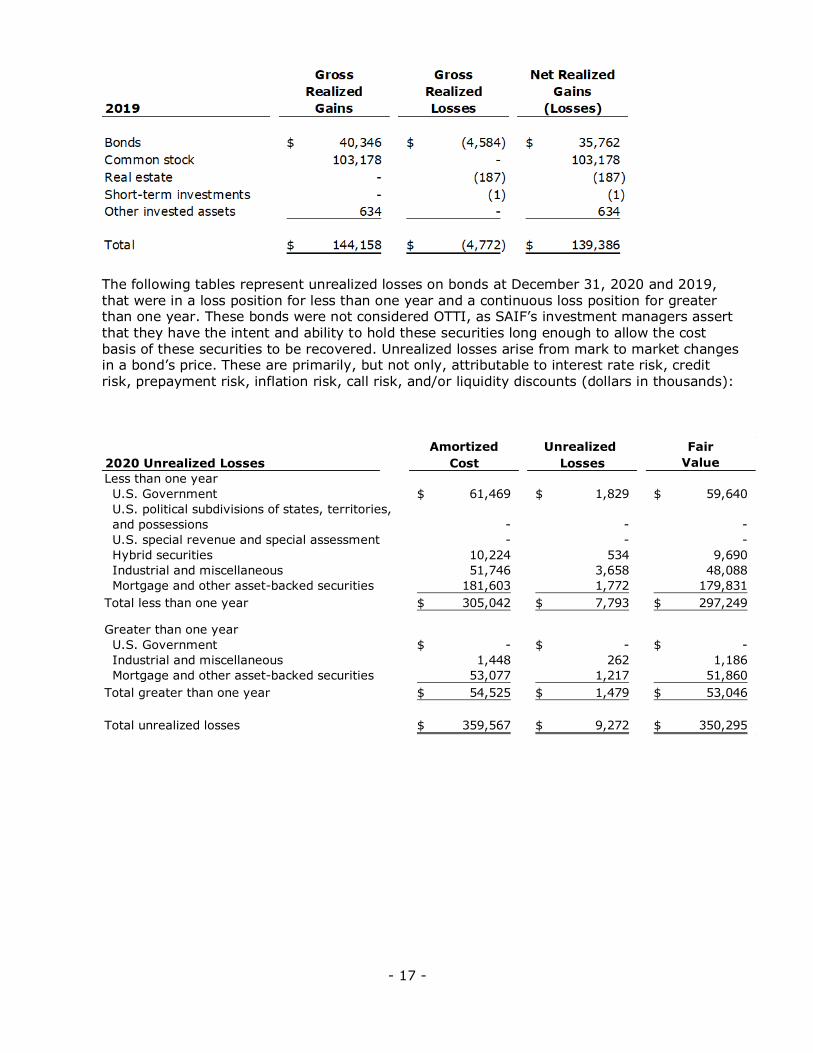
Gross realized gains and losses and the net realized gains (losses) for the years ended December 31, 2020 and 2019, were as follows (dollars in thousands):
Carrying Fair Carrying Fair
Value Value Value Value
Due in one year or less 55,816$ 56,770$ 48,800$ 49,064$
Due after one year through five years 640,218 693,727 764,471 791,777
Due after five years through ten years 1,083,327 1,218,151 1,164,682 1,249,608
Due after ten years 1,899,930 2,176,184 1,850,142 2,045,691
Total bonds 3,679,291$ 4,144,832$ 3,828,095$ 4,136,140$
2020 2019
2020 2019
Bonds 142,201$ 156,597$
Common stock 188 106
Real estate 4,879 -
Other invested assets 5,835 6,905
Total gross investment income earned 153,103 163,608
Less investment expenses 12,292 12,481
Net investment income earned 140,811$ 151,127$
Gross Gross Net Realized
Realized Realized Gains
2020 Gains Losses (Losses)
Bonds 75,394$ (9,348)$ 66,046$
Common stock 140 - 140
Real estate - - -
Short-term investments 47 - 47
Other invested assets - - -
Total 75,581$ (9,348)$ 66,233$
- 17 -
The following tables represent unrealized losses on bonds at December 31, 2020 and 2019, that were in a loss position for less than one year and a continuous loss position for greater than one year. These bonds were not considered OTTI, as SAIF’s investment managers assert that they have the intent and ability to hold these securities long enough to allow the cost basis of these securities to be recovered. Unrealized losses arise from mark to market changes in a bond’s price. These are primarily, but not only, attributable to interest rate risk, credit
risk, prepayment risk, inflation risk, call risk, and/or liquidity discounts (dollars in thousands):
Amortized Unrealized Fair
2020 Unrealized Losses Cost Losses Value
Less than one year
U.S. Government 61,469$ 1,829$ 59,640$
U.S. political subdivisions of states, territories,
and possessions - - -
U.S. special revenue and special assessment - - -
Hybrid securities 10,224 534 9,690
Industrial and miscellaneous 51,746 3,658 48,088
Mortgage and other asset-backed securities 181,603 1,772 179,831
Total less than one year 305,042$ 7,793$ 297,249$
Greater than one year
U.S. Government -$ -$ -$
Industrial and miscellaneous 1,448 262 1,186
Mortgage and other asset-backed securities 53,077 1,217 51,860
Total greater than one year 54,525$ 1,479$ 53,046$
Total unrealized losses 359,567$ 9,272$ 350,295$
- 18 -
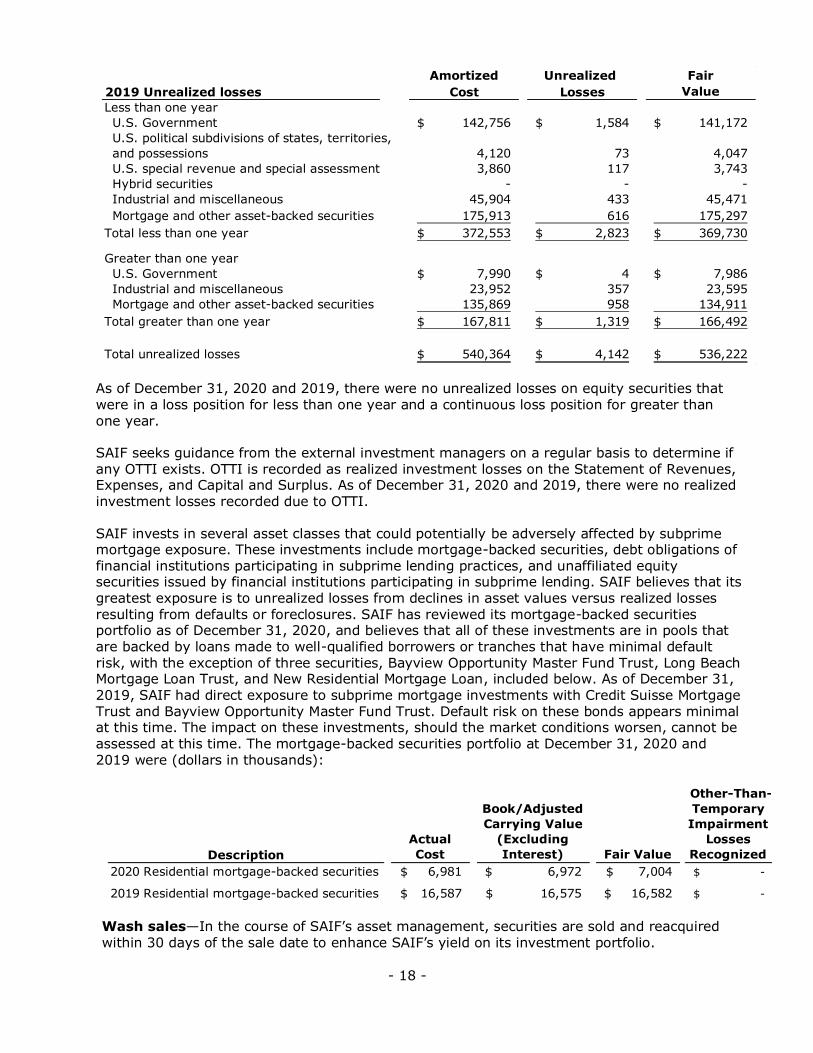
As of December 31, 2020 and 2019, there were no unrealized losses on equity securities that were in a loss position for less than one year and a continuous loss position for greater than one year.
SAIF seeks guidance from the external investment managers on a regular basis to determine if any OTTI exists. OTTI is recorded as realized investment losses on the Statement of Revenues, Expenses, and Capital and Surplus. As of December 31, 2020 and 2019, there were no realized
investment losses recorded due to OTTI.
SAIF invests in several asset classes that could potentially be adversely affected by subprime mortgage exposure. These investments include mortgage-backed securities, debt obligations of financial institutions participating in subprime lending practices, and unaffiliated equity securities issued by financial institutions participating in subprime lending. SAIF believes that its greatest exposure is to unrealized losses from declines in asset values versus realized losses
resulting from defaults or foreclosures. SAIF has reviewed its mortgage-backed securities portfolio as of December 31, 2020, and believes that all of these investments are in pools that are backed by loans made to well-qualified borrowers or tranches that have minimal default risk, with the exception of three securities, Bayview Opportunity Master Fund Trust, Long Beach Mortgage Loan Trust, and New Residential Mortgage Loan, included below. As of December 31, 2019, SAIF had direct exposure to subprime mortgage investments with Credit Suisse Mortgage Trust and Bayview Opportunity Master Fund Trust. Default risk on these bonds appears minimal at this time. The impact on these investments, should the market conditions worsen, cannot be assessed at this time. The mortgage-backed securities portfolio at December 31, 2020 and 2019 were (dollars in thousands):
Wash sales—In the course of SAIF’s asset management, securities are sold and reacquired
within 30 days of the sale date to enhance SAIF’s yield on its investment portfolio.
Amortized Unrealized Fair
2019 Unrealized losses Cost Losses Value
Less than one year
U.S. Government 142,756$ 1,584$ 141,172$
U.S. political subdivisions of states, territories,
and possessions 4,120 73 4,047
U.S. special revenue and special assessment 3,860 117 3,743
Hybrid securities - - -
Industrial and miscellaneous 45,904 433 45,471
Mortgage and other asset-backed securities 175,913 616 175,297
Total less than one year 372,553$ 2,823$ 369,730$
Greater than one year
U.S. Government 7,990$ 4$ 7,986$
Industrial and miscellaneous 23,952 357 23,595
Mortgage and other asset-backed securities 135,869 958 134,911
Total greater than one year 167,811$ 1,319$ 166,492$
Total unrealized losses 540,364$ 4,142$ 536,222$
Description
Actual
Cost
Book/Adjusted
Carrying Value
(Excluding
Interest) Fair Value
Other-Than-
Temporary
Impairment
Losses
Recognized
2020 Residential mortgage-backed securities 6,981$ 6,972$ 7,004$ -$
2019 Residential mortgage-backed securities 16,587$ 16,575$ 16,582$ -$
- 19 -
No securities with NAIC designations of 3 or below were sold during the years ended December 31, 2020 and 2019, and reacquired within 30 days of the sale.
Securities on deposit—U.S. Treasury obligations with a carrying value of $8.3 million and $8.0 million were on deposit with the Federal Reserve as required by the U.S. Department of Labor under the Longshore and Harbor Workers’ Compensation Act at December 31, 2020 and
2019, respectively. Certificates of deposit with a carrying value of $458 thousand and $333 thousand were on deposit at U.S. Bank as required by DCBS at December 31, 2020 and 2019, respectively. U.S. Treasury obligations with a carrying value of $35.1 million were on deposit with Wilmington Trust for loss payments with Zurich, a reinsurer for other states coverage, as of December 31, 2020 and 2019.
5. SECURITIES LENDING
In accordance with state investment policies, SAIF participates in securities lending transactions. The Oregon State Treasury has, through a Securities Lending Agreement, authorized State Street to lend SAIF’s securities to broker-dealers and banks pursuant to a form of loan agreement. Both SAIF and the borrowers maintain the right to terminate all securities lending transactions on demand. There have been no significant violations of the provisions of securities lending agreements.
During 2020 and 2019, State Street loaned SAIF’s fixed income securities and received cash and noncash collateral denominated in U.S. dollars. Borrowers were required to deliver collateral for each loan equal to at least 102 percent of the fair value of the loaned security. SAIF did not impose any restrictions on the amount of the loans State Street made on its behalf. Securities received as collateral may not be sold or pledged by SAIF, except in the
event of borrower default. SAIF was fully indemnified by State Street against losses due to borrower default, and there were no losses during the year from the failure of borrowers to return loaned securities.
State Street is authorized by the Securities Lending Agreement to invest cash collateral received for securities loaned in the State Street Bank and Trust Company Oregon Short-Term Investment Fund (the Fund). SAIF’s participation in this fund is voluntary. The fair value of
investments held by this fund is based upon valuations provided by a recognized pricing service. This fund is not registered with the Securities and Exchange Commission, but the custodial agent is subject to the oversight of the Federal Reserve Board and the Massachusetts Commissioner of Banks. No income from the Fund was assigned to another fund by the custodial agent during 2020 and 2019. At December 31, 2020 and 2019, the Fund had an average life-final maturity of 87 days and 202 days, respectively.
The cash collateral held at December 31, 2020 and 2019, was $56.5 million and $42.8 million, respectively. Securities received as collateral at December 31, 2020 and 2019, were $1.9 million and $0.2 million, respectively. At December 31, 2020 and 2019, the fair value, including accrued investment income related to the securities on loan, was $57.4 million and $42.0 million, respectively. For 2020 and 2019, securities lending income was $0.5 million and $2.6 million and securities lending expense was $0.3 million and $2.3 million, respectively. These amounts are reported net in the accompanying financial statements as a component of
net investment income earned.
6. FAIR VALUE OF FINANCIAL INSTRUMENTS
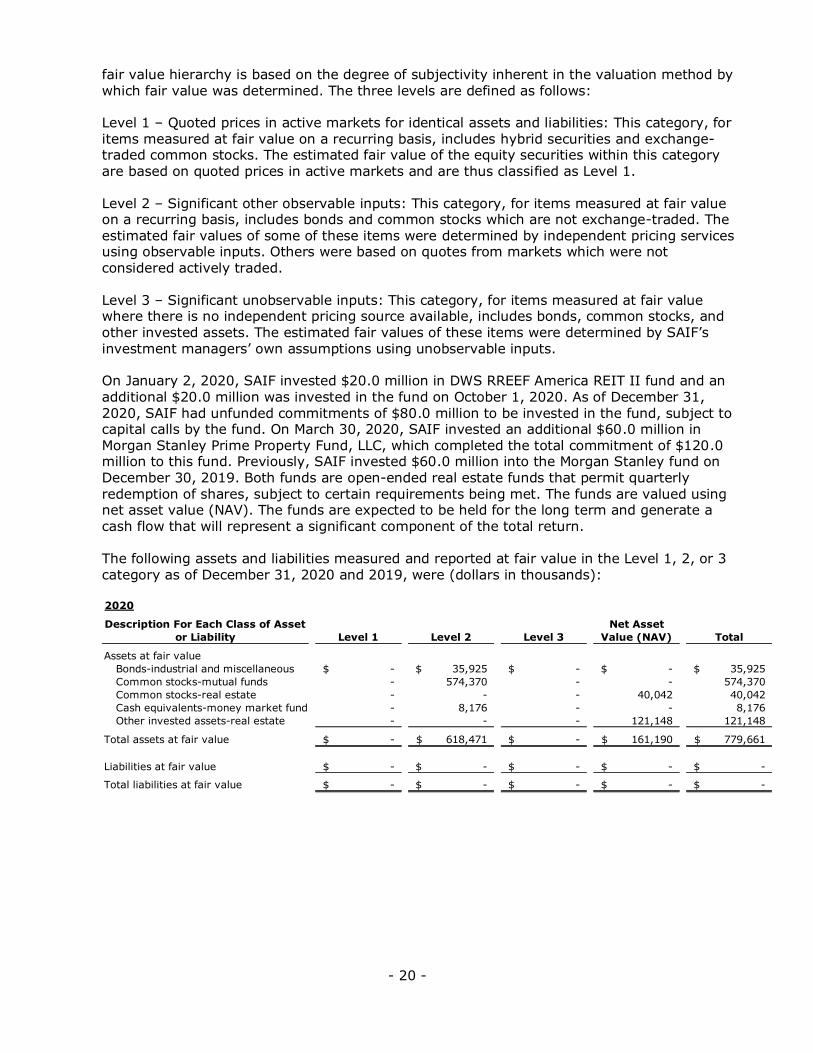
In accordance with the NAIC disclosure requirements of SSAP No. 100, Fair Value Measurements, SAIF has categorized its assets and liabilities that are measured at fair value into the three-level fair value hierarchy as reflected in the table that follows. The three-level
- 20 -
fair value hierarchy is based on the degree of subjectivity inherent in the valuation method by which fair value was determined. The three levels are defined as follows:
Level 1 – Quoted prices in active markets for identical assets and liabilities: This category, for items measured at fair value on a recurring basis, includes hybrid securities and exchange-traded common stocks. The estimated fair value of the equity securities within this category
are based on quoted prices in active markets and are thus classified as Level 1.
Level 2 – Significant other observable inputs: This category, for items measured at fair value on a recurring basis, includes bonds and common stocks which are not exchange-traded. The estimated fair values of some of these items were determined by independent pricing services using observable inputs. Others were based on quotes from markets which were not considered actively traded.
Level 3 – Significant unobservable inputs: This category, for items measured at fair value where there is no independent pricing source available, includes bonds, common stocks, and other invested assets. The estimated fair values of these items were determined by SAIF’s investment managers’ own assumptions using unobservable inputs.
On January 2, 2020, SAIF invested $20.0 million in DWS RREEF America REIT II fund and an
additional $20.0 million was invested in the fund on October 1, 2020. As of December 31, 2020, SAIF had unfunded commitments of $80.0 million to be invested in the fund, subject to capital calls by the fund. On March 30, 2020, SAIF invested an additional $60.0 million in Morgan Stanley Prime Property Fund, LLC, which completed the total commitment of $120.0 million to this fund. Previously, SAIF invested $60.0 million into the Morgan Stanley fund on December 30, 2019. Both funds are open-ended real estate funds that permit quarterly
redemption of shares, subject to certain requirements being met. The funds are valued using net asset value (NAV). The funds are expected to be held for the long term and generate a cash flow that will represent a significant component of the total return. The following assets and liabilities measured and reported at fair value in the Level 1, 2, or 3 category as of December 31, 2020 and 2019, were (dollars in thousands):
2020
Description For Each Class of Asset
or Liability Level 1 Level 2 Level 3
Net Asset
Value (NAV) Total
Assets at fair value
Bonds-industrial and miscellaneous -$ 35,925$ -$ -$ 35,925$
Common stocks-mutual funds - 574,370 - - 574,370
Common stocks-real estate - - - 40,042 40,042
Cash equivalents-money market fund - 8,176 - - 8,176
Other invested assets-real estate - - - 121,148 121,148
Total assets at fair value -$ 618,471$ -$ 161,190$ 779,661$
Liabilities at fair value -$ -$ -$ -$ -$
Total liabilities at fair value -$ -$ -$ -$ -$
- 21 -
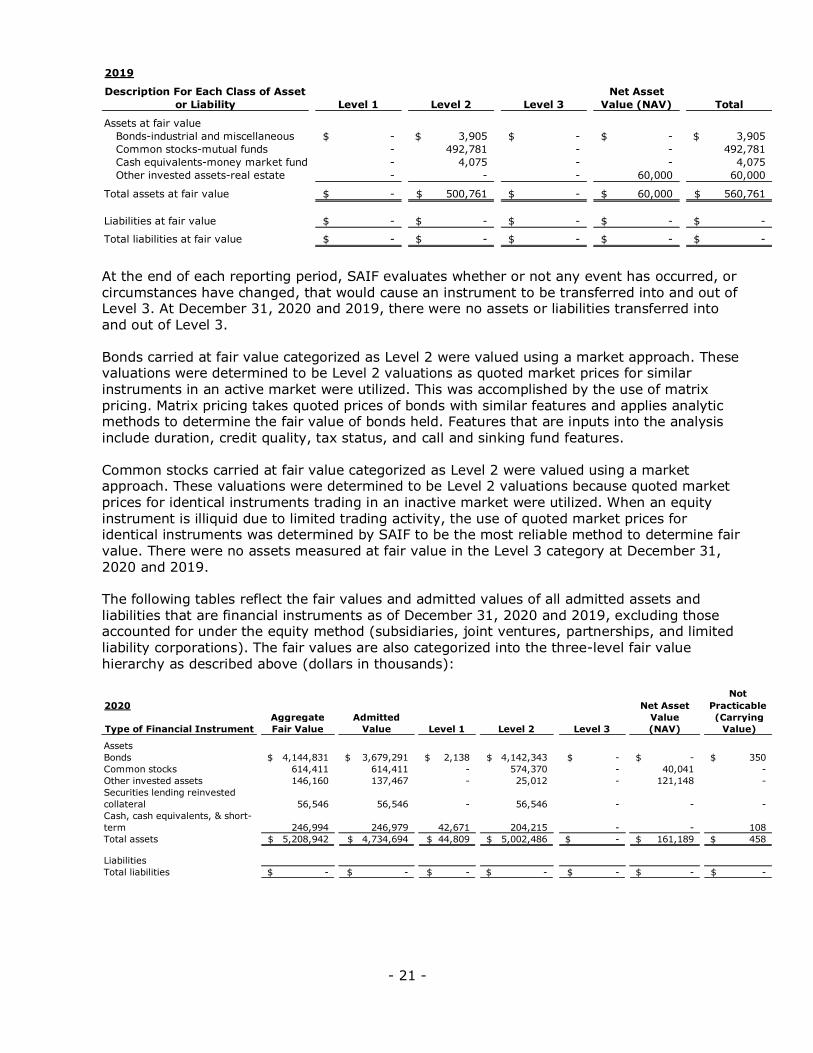
At the end of each reporting period, SAIF evaluates whether or not any event has occurred, or circumstances have changed, that would cause an instrument to be transferred into and out of Level 3. At December 31, 2020 and 2019, there were no assets or liabilities transferred into and out of Level 3.
Bonds carried at fair value categorized as Level 2 were valued using a market approach. These valuations were determined to be Level 2 valuations as quoted market prices for similar
instruments in an active market were utilized. This was accomplished by the use of matrix pricing. Matrix pricing takes quoted prices of bonds with similar features and applies analytic methods to determine the fair value of bonds held. Features that are inputs into the analysis include duration, credit quality, tax status, and call and sinking fund features.
Common stocks carried at fair value categorized as Level 2 were valued using a market approach. These valuations were determined to be Level 2 valuations because quoted market
prices for identical instruments trading in an inactive market were utilized. When an equity instrument is illiquid due to limited trading activity, the use of quoted market prices for identical instruments was determined by SAIF to be the most reliable method to determine fair value. There were no assets measured at fair value in the Level 3 category at December 31, 2020 and 2019.
The following tables reflect the fair values and admitted values of all admitted assets and
liabilities that are financial instruments as of December 31, 2020 and 2019, excluding those accounted for under the equity method (subsidiaries, joint ventures, partnerships, and limited liability corporations). The fair values are also categorized into the three-level fair value hierarchy as described above (dollars in thousands):
2019
Description For Each Class of Asset
or Liability Level 1 Level 2 Level 3
Net Asset
Value (NAV) Total
Assets at fair value
Bonds-industrial and miscellaneous -$ 3,905$ -$ -$ 3,905$
Common stocks-mutual funds - 492,781 - - 492,781
Cash equivalents-money market fund - 4,075 - - 4,075
Other invested assets-real estate - - - 60,000 60,000
Total assets at fair value -$ 500,761$ -$ 60,000$ 560,761$
Liabilities at fair value -$ -$ -$ -$ -$
Total liabilities at fair value -$ -$ -$ -$ -$
Not
2020 Net Asset Practicable
Aggregate Admitted Value (Carrying
Type of Financial Instrument Fair Value Value Level 1 Level 2 Level 3 (NAV) Value)
Assets
Bonds 4,144,831$ 3,679,291$ 2,138$ 4,142,343$ -$ -$ 350$
Common stocks 614,411 614,411 - 574,370 - 40,041 -
Other invested assets 146,160 137,467 - 25,012 - 121,148 -
Securities lending reinvested
collateral 56,546 56,546 - 56,546 - - -
Cash, cash equivalents, & short-
term 246,994 246,979 42,671 204,215 - - 108
Total assets 5,208,942$ 4,734,694$ 44,809$ 5,002,486$ -$ 161,189$ 458$
Liabilities
Total liabilities -$ -$ -$ -$ -$ -$ -$

- 22 -
It was not practicable to determine the fair values of the bonds in the following table as of December 31, 2020 and 2019, for purposes of the above disclosures, as these items are not traded, and therefore, quoted market prices are not available. Also, the cost of obtaining estimates of fair values from other sources was considered excessive given the immateriality of the bonds (dollars in thousands):
7. LOSSES AND LOSS ADJUSTMENT EXPENSES
SAIF has established a reserve for both reported and unreported insured events, which includes estimates of future payments of losses and related LAE. In estimating the reserve for losses and LAE, SAIF considers prior experience, industry information, currently recognized trends affecting data specific to SAIF, and other factors relating to workers’ compensation insurance underwritten by SAIF.
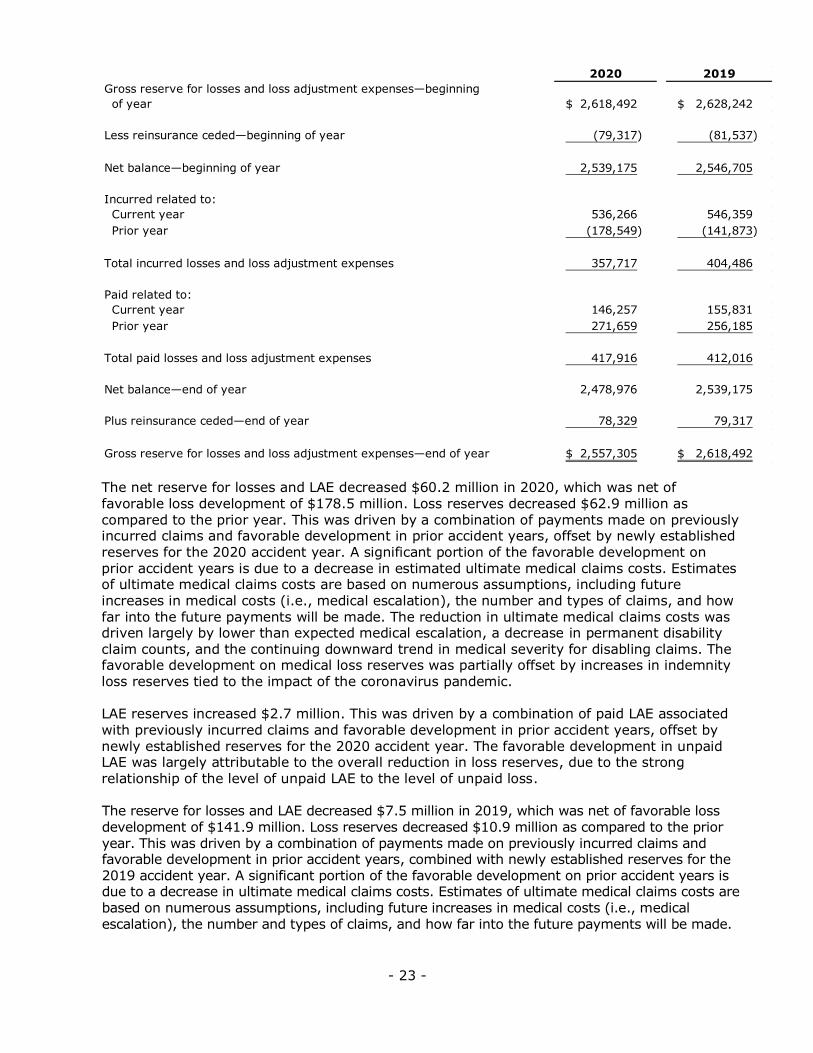
The following table provides a reconciliation of the beginning and ending reserve for losses and LAE at December 31, 2020 and 2019 (dollars in thousands):
Not
2019 Net Asset Practicable
Aggregate Admitted Value (Carrying
Type of Financial Instrument Fair Value Value Level 1 Level 2 Level 3 (NAV) Value)
Assets
Bonds 4,136,140$ 3,828,094$ 2,085$ 4,133,722$ -$ -$ 333$
Common stocks 492,781 492,781 - 492,781 - - -
Other invested assets 84,223 76,321 - 24,223 - 60,000 -
Securities lending reinvested
collateral 42,786 42,786 - 42,786 - - -
Cash, cash equivalents, & short-
term 151,091 151,094 57,106 93,985 - - -
Total assets 4,907,021$ 4,591,076$ 59,191$ 4,787,497$ -$ 60,000$ 333$
Liabilities
Total liabilities -$ -$ -$ -$ -$ -$ -$
2020
Type or Class of Carrying Effective Maturity
Financial Instrument Value Interest Rate Date
Bonds
U.S. Bank certificate of deposit 108$ 0.01% 10/8/2021
U.S. Bank certificate of deposit 225 2.05% 4/1/2024
U.S. Bank certificate of deposit 125 0.25% 10/7/2025
Total 458$
2019
Type or Class of Carrying Effective Maturity
Financial Instrument Value Interest Rate Date
Bonds
U.S. Bank certificate of deposit 108$ 1.10% 10/12/2020
U.S. Bank certificate of deposit 225 2.05% 4/1/2024
Total 333$
- 23 -
The net reserve for losses and LAE decreased $60.2 million in 2020, which was net of
favorable loss development of $178.5 million. Loss reserves decreased $62.9 million as compared to the prior year. This was driven by a combination of payments made on previously incurred claims and favorable development in prior accident years, offset by newly established reserves for the 2020 accident year. A significant portion of the favorable development on prior accident years is due to a decrease in estimated ultimate medical claims costs. Estimates of ultimate medical claims costs are based on numerous assumptions, including future increases in medical costs (i.e., medical escalation), the number and types of claims, and how
far into the future payments will be made. The reduction in ultimate medical claims costs was driven largely by lower than expected medical escalation, a decrease in permanent disability claim counts, and the continuing downward trend in medical severity for disabling claims. The favorable development on medical loss reserves was partially offset by increases in indemnity loss reserves tied to the impact of the coronavirus pandemic.
LAE reserves increased $2.7 million. This was driven by a combination of paid LAE associated
with previously incurred claims and favorable development in prior accident years, offset by newly established reserves for the 2020 accident year. The favorable development in unpaid LAE was largely attributable to the overall reduction in loss reserves, due to the strong relationship of the level of unpaid LAE to the level of unpaid loss. The reserve for losses and LAE decreased $7.5 million in 2019, which was net of favorable loss
development of $141.9 million. Loss reserves decreased $10.9 million as compared to the prior year. This was driven by a combination of payments made on previously incurred claims and favorable development in prior accident years, combined with newly established reserves for the 2019 accident year. A significant portion of the favorable development on prior accident years is due to a decrease in ultimate medical claims costs. Estimates of ultimate medical claims costs are based on numerous assumptions, including future increases in medical costs (i.e., medical escalation), the number and types of claims, and how far into the future payments will be made.
2020 2019
Gross reserve for losses and loss adjustment expenses—beginning
of year 2,618,492$ 2,628,242$
Less reinsurance ceded—beginning of year (79,317) (81,537)
Net balance—beginning of year 2,539,175 2,546,705
Incurred related to:
Current year 536,266 546,359
Prior year (178,549) (141,873)
Total incurred losses and loss adjustment expenses 357,717 404,486
Paid related to:
Current year 146,257 155,831
Prior year 271,659 256,185
Total paid losses and loss adjustment expenses 417,916 412,016
Net balance—end of year 2,478,976 2,539,175
Plus reinsurance ceded—end of year 78,329 79,317
Gross reserve for losses and loss adjustment expenses—end of year 2,557,305$ 2,618,492$
- 24 -
The reduction in ultimate medical claims costs was driven largely by lower than expected medical escalation and fewer permanent disability claims in more recent years than previously forecasted. LAE reserves increased $3.4 million in 2019. This was driven by a combination of paid LAE associated with previously incurred claims and favorable development in prior accident years, offset by newly established reserves for the 2019 accident year. The favorable development in
unpaid LAE was largely attributable to the overall reduction in loss reserves, due to the strong relationship of the level of unpaid LAE to the level of unpaid loss. SAIF discounts the indemnity case reserves for workers’ compensation claims on a tabular basis using the 2007 United States Life Tables, the 1997 United States of America Railroad Retirement Board Remarriage Table, and a discount rate of 3.5 percent. SAIF does not discount any incurred but not reported reserves, medical reserves, or any LAE reserves, except
for assumed IBNR reserves reported by the National Workers Compensation Reinsurance Pool. Net reserves subject to tabular discounting were $196.3 million and $202.8 million as of December 31, 2020 and 2019, respectively. The discounts were $94.9 million and $95.3 million as of December 31, 2020 and 2019, respectively.
Anticipated salvage and subrogation of $43.4 million and $39.6 million was included as a
reduction of the reserve for losses and LAE at December 31, 2020 and 2019, respectively.
SAIF’s exposure to asbestos claims arose from the sale of workers’ compensation policies. Reserves of $13.0 million and $13.3 million for losses and LAE are related to asbestos claims as of December 31, 2020 and 2019, respectively. Amounts paid for asbestos-related claims were $363 thousand and $569 thousand for the years ended December 31, 2020 and 2019, respectively.
8. RISK MANAGEMENT
The State of Oregon administers property and casualty insurance programs covering state government agencies through its Insurance Fund, an internal service fund. The Insurance Fund services claims for: direct physical loss or damage to state property; tort liability claims brought against the state, its officers, employees, or agents; and employees, elected officials, and members of commissions and boards for faithful performance. The Insurance Fund is backed by a commercial excess property policy with limits of $425 million and a blanket commercial excess bond with limits of $4.7 million.
SAIF participates in the Insurance Fund. The cost of servicing insurance claims and payments is covered by charging an assessment to each participating state entity based on its share of services provided in a prior period. The total statewide assessment of each type of coverage is
based on independent biennial actuarial forecasts and administrative expenses, less any available fund balance of the Insurance Fund from the prior biennium. In addition, SAIF elects to purchase additional coverage, including cyber insurance, through the fund. SAIF’s assessment was $0.7 million for the years ended December 31, 2020 and 2019.
SAIF is self-insured for workers’ compensation insurance. SAIF’s employees do not participate in the State of Oregon’s health insurance plans.
9. DEFERRED COMPENSATION PLAN
SAIF provides a deferred compensation plan, authorized under and consistent with Internal Revenue Code Section 457(b), as a benefit available to all its employees. The plan authorizes the employee to execute an individual agreement with the plan’s record keeper, Empower Retirement, whereby the employee defers a portion of their current income until future years
as a retirement savings vehicle in which funds are sheltered from federal and state taxation

- 25 -
until withdrawal. Participants cannot receive the funds until certain circumstances are met. Funds withheld from employee compensation and remitted to the plan are invested by the employee in a variety of mutual funds, collective investment trusts, and other offerings selected by SAIF’s Deferred Compensation Plan Committee. Plan assets are generally held in a trust account with Great-West Trust Company, LLC and administered by Empower Retirement for the exclusive benefit of the participants or their beneficiary(ies). Participants’ rights under
the plan are equal to the fair market value (or book value in the case of the stable value option) of the deferred compensation plan account for each participant. SAIF has no rights to participant funds and does not perform the investing function for the participant, except in the instance where a participant fails to make an affirmative investment election. SAIF’s primary fiduciary responsibilities for the plan extends to selection of the investment options that are made available to the participants as well as the monitoring of plan service providers. Thus, plan assets and any related liability to plan participants have been excluded from the financial
statements.
10. RETIREMENT PLAN
SAIF’s employees hired prior to August 29, 2003, participate in the Oregon Public Employees’ Retirement System (PERS), a cost-sharing multiemployer defined benefit pension plan. The
PERS Board of Trustees under the guidelines of ORS Chapter 238 administers PERS. The PERS retirement allowance, payable monthly for life, may be selected from multiple retirement benefit options. Options include survivorship benefits, non-survivorship benefits, and lump-sum benefits. The basic benefit formula is 1.67 percent of a member’s final average salary multiplied by the member’s number of years of service. Benefits may also be calculated under either a money match or an annuity-plus-pension computation if a greater benefit results. PERS also provides death and disability benefits. Employees’ Retirement System annual
financial report may be obtained by writing to PERS, Fiscal Services Division, PO Box 23700, Tigard, Oregon 97281-3700. The report may also be accessed online at: http://www.oregon.gov/PERS/pages/financials/actuarial-financial-information.aspx.
On December 30, 2019, SAIF funded a PERS side account totaling $97.0 million which represented approximately 90 percent of SAIF's unfunded actuarial liability based on a preliminary actuarial valuation from PERS. This side account does not impact employee
benefits received under PERS; instead, it represents a prepayment of SAIF's on-going contributions. SAIF will see the benefit of lower contribution rates over the next 16 years as the account is amortized. For 2020, SAIF received rate relief of 10.34 percent of each covered employee’s salary for its otherwise required pension contribution rates. The balance is included in aggregate write-ins for other-than-invested assets. This appears as a nonadmitted asset and a reduction of surplus because it represents a prepayment and the assets are held in the PERS trust, so they cannot be repurposed.
Beginning January 1, 2004, all covered employees are required by state statute to contribute 6.00 percent of their salary to the Individual Account Program (IAP), a defined contribution plan. Current law permits employers to pay employees’ contributions to PERS, which SAIF has elected to do. Additionally, SAIF is required by statute to contribute a percentage of each covered employee’s salary to fund the PERS program. Beginning on July 1, 2020, certain amounts of the IAP contributions are “redirected” under Oregon statute from employee accounts to fund the pension UAL. This provision remains in effect until the pension reaches a certain funded status.
As of December 31, 2020, SAIF contributes 21.21 percent of each employee’s covered salary to the PERS program. This contribution is the minimum contribution required for future periods. For the required contributions, 10.34 percent of employees’ salaries is covered by the side account rate relief, and SAIF contributes the remaining 10.87 percent of salary. Rates are
subject to change as a result of subsequent actuarial valuations.

- 26 -
SAIF employees hired on or after August 29, 2003, participate in the Oregon Public Service Retirement Plan (OPSRP) after completing six months of service. OPSRP is a hybrid pension plan (cost-sharing multiple-employer plan) administered by the PERS Board of Trustees under the guidelines of ORS Chapter 238A with two components: the Pension Program (defined benefit) and the IAP (defined contribution). As of December 31, 2020, SAIF contributes 14.75 percent of each covered employee’s salary to the Pension Program and 6.00 percent to the
IAP. This contribution is the minimum contribution required for future periods. For the required OPSRP Pension Program contributions, 10.34 percent of employee’s salaries is covered by the side account rate relief, and SAIF contributes the remaining 4.41 percent of salary. Rates are subject to change as a result of subsequent actuarial valuations.
SAIF participates, along with other State of Oregon agencies, in paying debt service for State of Oregon general obligation bonds issued in October 2003 to reduce the unfunded PERS liability. The bonds are scheduled to mature 25 years after the date of issuance. Currently, the repayment rate is 5.60 percent of payroll each month. The payment rate is recalculated periodically, as needed.
The total amount contributed by SAIF for all plans for the years ended December 31, 2020 and 2019, consist of the following (dollars in thousands):
For the years ended December 31, 2020 and 2019, SAIF’s employer contributions were equal
to the annual required contributions. SAIF’s contributions were less than 5.00 percent of each plan’s total contributions. There are no funding improvement or rehabilitation plans implemented or pending for any of the plans SAIF participates in. SAIF did not pay any surcharges during the year ended December 31, 2020. SAIF is a funder of last resort, embodied in the scheme of ORS Chapter 238, along with every other employer in PERS. PERS’ board from time to time will evaluate the liabilities of PERS and set the amount of contributions to be made by SAIF to ensure that those liabilities will be funded no more than
40 years after the date on which the determination is made.
11. POST RETIREMENT BENEFITS AND COMPENSATED ABSENCES
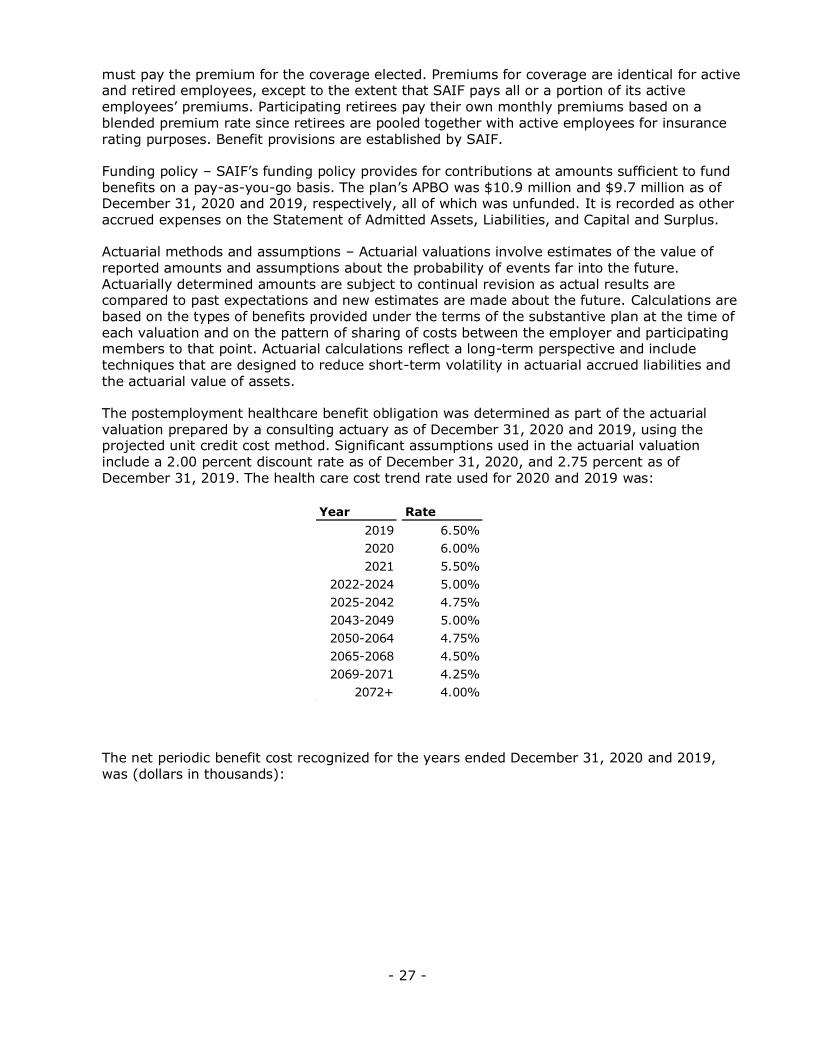
Plan description – SAIF administers a single-employer defined benefit healthcare plan which is accounted for in accordance with SSAP No. 92. SAIF employees retiring under Oregon PERS
are eligible to receive medical coverage for self and eligible dependents until age 65. Retirees
2020 2019
Employer contributions:
Debt service 4,833$ 5,060$
PERS-Pension Program 8,150 6,425
OPSRP-Pension Program 6,784 6,308
Total employer contributions 19,767 17,793
PERS side account rate relief: (9,014) -
Net employer contributions 10,753 17,793
Employee contributions paid by SAIF:
PERS-IAP 1,915 1,988
OPSRP-IAP 3,315 2,975
Total employee contributions 5,230 4,963
Total contributions 15,983$ 22,756$
- 27 -
must pay the premium for the coverage elected. Premiums for coverage are identical for active and retired employees, except to the extent that SAIF pays all or a portion of its active employees’ premiums. Participating retirees pay their own monthly premiums based on a blended premium rate since retirees are pooled together with active employees for insurance rating purposes. Benefit provisions are established by SAIF.
Funding policy – SAIF’s funding policy provides for contributions at amounts sufficient to fund benefits on a pay-as-you-go basis. The plan’s APBO was $10.9 million and $9.7 million as of December 31, 2020 and 2019, respectively, all of which was unfunded. It is recorded as other accrued expenses on the Statement of Admitted Assets, Liabilities, and Capital and Surplus.
Actuarial methods and assumptions – Actuarial valuations involve estimates of the value of reported amounts and assumptions about the probability of events far into the future.
Actuarially determined amounts are subject to continual revision as actual results are compared to past expectations and new estimates are made about the future. Calculations are based on the types of benefits provided under the terms of the substantive plan at the time of each valuation and on the pattern of sharing of costs between the employer and participating members to that point. Actuarial calculations reflect a long-term perspective and include techniques that are designed to reduce short-term volatility in actuarial accrued liabilities and
the actuarial value of assets.
The postemployment healthcare benefit obligation was determined as part of the actuarial valuation prepared by a consulting actuary as of December 31, 2020 and 2019, using the projected unit credit cost method. Significant assumptions used in the actuarial valuation include a 2.00 percent discount rate as of December 31, 2020, and 2.75 percent as of December 31, 2019. The health care cost trend rate used for 2020 and 2019 was:
The net periodic benefit cost recognized for the years ended December 31, 2020 and 2019, was (dollars in thousands):
Year Rate
2019 6.50%
2020 6.00%
2021 5.50%
2022-2024 5.00%
2025-2042 4.75%
2043-2049 5.00%
2050-2064 4.75%
2065-2068 4.50%
2069-2071 4.25%
2072+ 4.00%
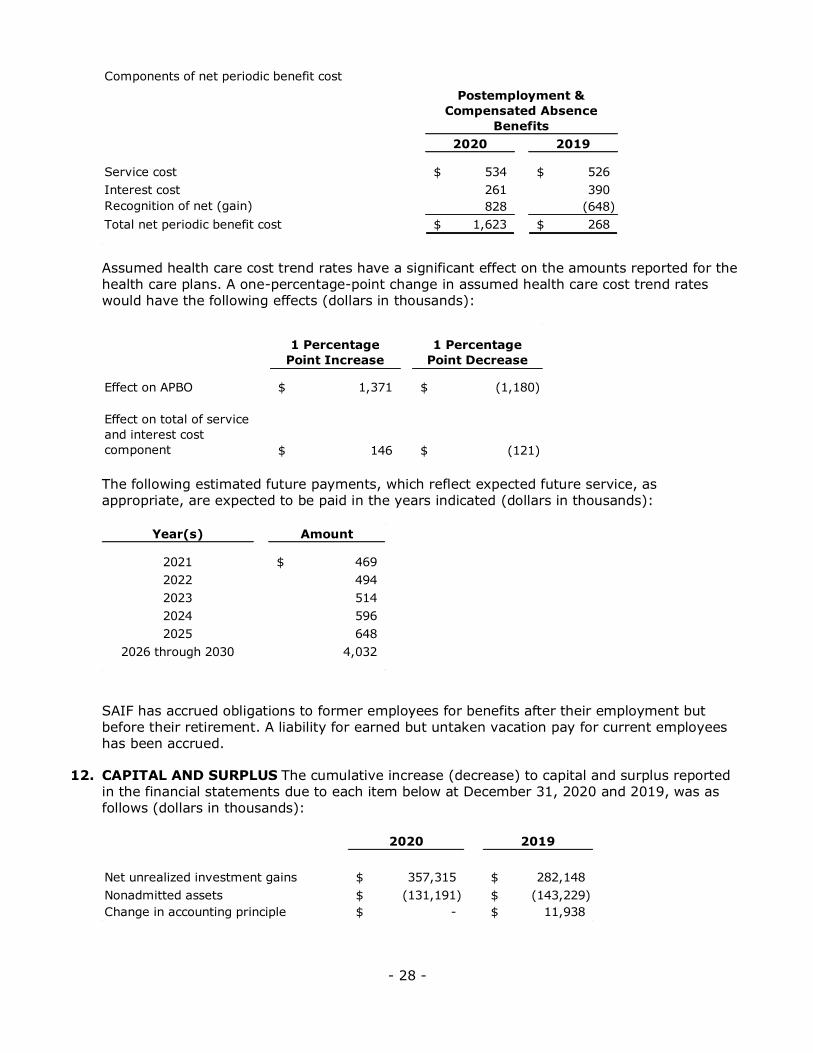
- 28 -
Assumed health care cost trend rates have a significant effect on the amounts reported for the
health care plans. A one-percentage-point change in assumed health care cost trend rates would have the following effects (dollars in thousands):
The following estimated future payments, which reflect expected future service, as
appropriate, are expected to be paid in the years indicated (dollars in thousands):
SAIF has accrued obligations to former employees for benefits after their employment but
before their retirement. A liability for earned but untaken vacation pay for current employees has been accrued.
12. CAPITAL AND SURPLUS The cumulative increase (decrease) to capital and surplus reported in the financial statements due to each item below at December 31, 2020 and 2019, was as follows (dollars in thousands):
Components of net periodic benefit cost
2020 2019
Service cost 534$ 526$
Interest cost 261 390
Recognition of net (gain) 828 (648)
Total net periodic benefit cost 1,623$ 268$
Postemployment &
Compensated Absence
Benefits
1 Percentage
Point Increase
1 Percentage
Point Decrease
Effect on APBO 1,371$ (1,180)$
Effect on total of service
and interest cost
component 146$ (121)$
Year(s) Amount
2021 469$
2022 494
2023 514
2024 596
2025 648
2026 through 2030 4,032
2020 2019
Net unrealized investment gains 357,315$ 282,148$
Nonadmitted assets (131,191)$ (143,229)$
Change in accounting principle -$ 11,938$
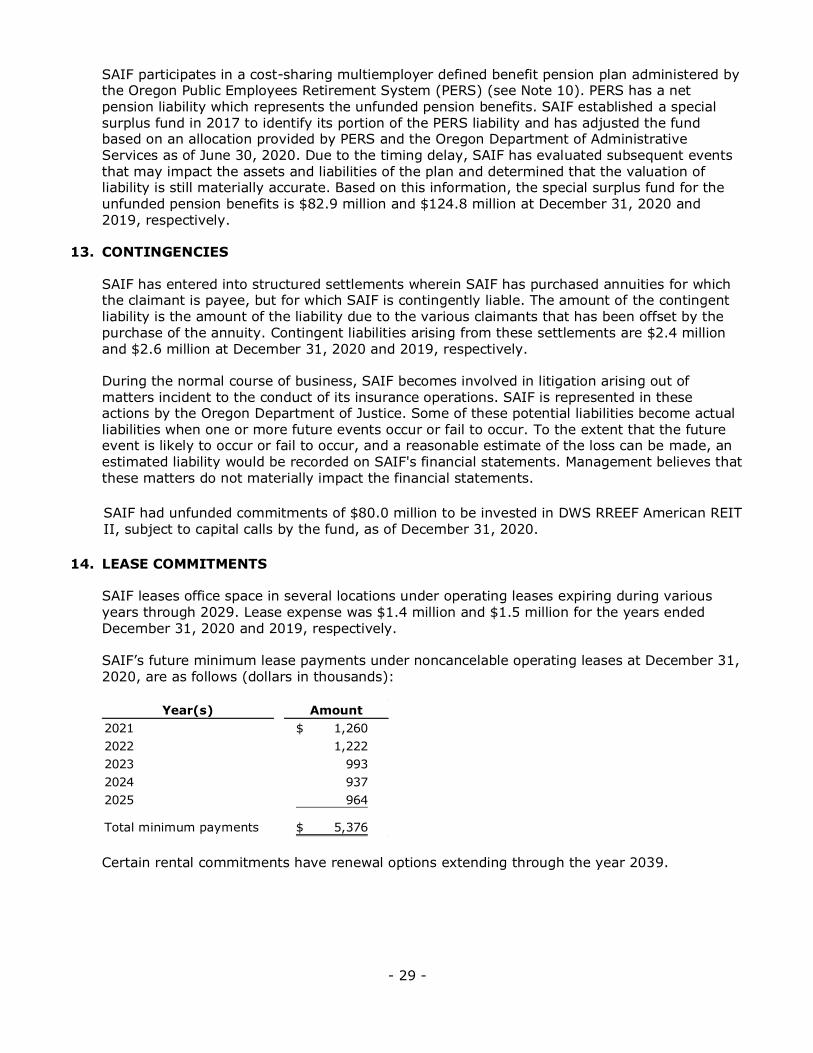
- 29 -
SAIF participates in a cost-sharing multiemployer defined benefit pension plan administered by the Oregon Public Employees Retirement System (PERS) (see Note 10). PERS has a net pension liability which represents the unfunded pension benefits. SAIF established a special surplus fund in 2017 to identify its portion of the PERS liability and has adjusted the fund based on an allocation provided by PERS and the Oregon Department of Administrative Services as of June 30, 2020. Due to the timing delay, SAIF has evaluated subsequent events
that may impact the assets and liabilities of the plan and determined that the valuation of liability is still materially accurate. Based on this information, the special surplus fund for the unfunded pension benefits is $82.9 million and $124.8 million at December 31, 2020 and 2019, respectively.
13. CONTINGENCIES
SAIF has entered into structured settlements wherein SAIF has purchased annuities for which the claimant is payee, but for which SAIF is contingently liable. The amount of the contingent liability is the amount of the liability due to the various claimants that has been offset by the purchase of the annuity. Contingent liabilities arising from these settlements are $2.4 million and $2.6 million at December 31, 2020 and 2019, respectively.
During the normal course of business, SAIF becomes involved in litigation arising out of
matters incident to the conduct of its insurance operations. SAIF is represented in these actions by the Oregon Department of Justice. Some of these potential liabilities become actual liabilities when one or more future events occur or fail to occur. To the extent that the future event is likely to occur or fail to occur, and a reasonable estimate of the loss can be made, an estimated liability would be recorded on SAIF's financial statements. Management believes that these matters do not materially impact the financial statements.
SAIF had unfunded commitments of $80.0 million to be invested in DWS RREEF American REIT II, subject to capital calls by the fund, as of December 31, 2020.
14. LEASE COMMITMENTS
SAIF leases office space in several locations under operating leases expiring during various
years through 2029. Lease expense was $1.4 million and $1.5 million for the years ended December 31, 2020 and 2019, respectively.
SAIF’s future minimum lease payments under noncancelable operating leases at December 31, 2020, are as follows (dollars in thousands):
Certain rental commitments have renewal options extending through the year 2039.
Year(s) Amount
2021 1,260$
2022 1,222
2023 993
2024 937
2025 964
Total minimum payments 5,376$
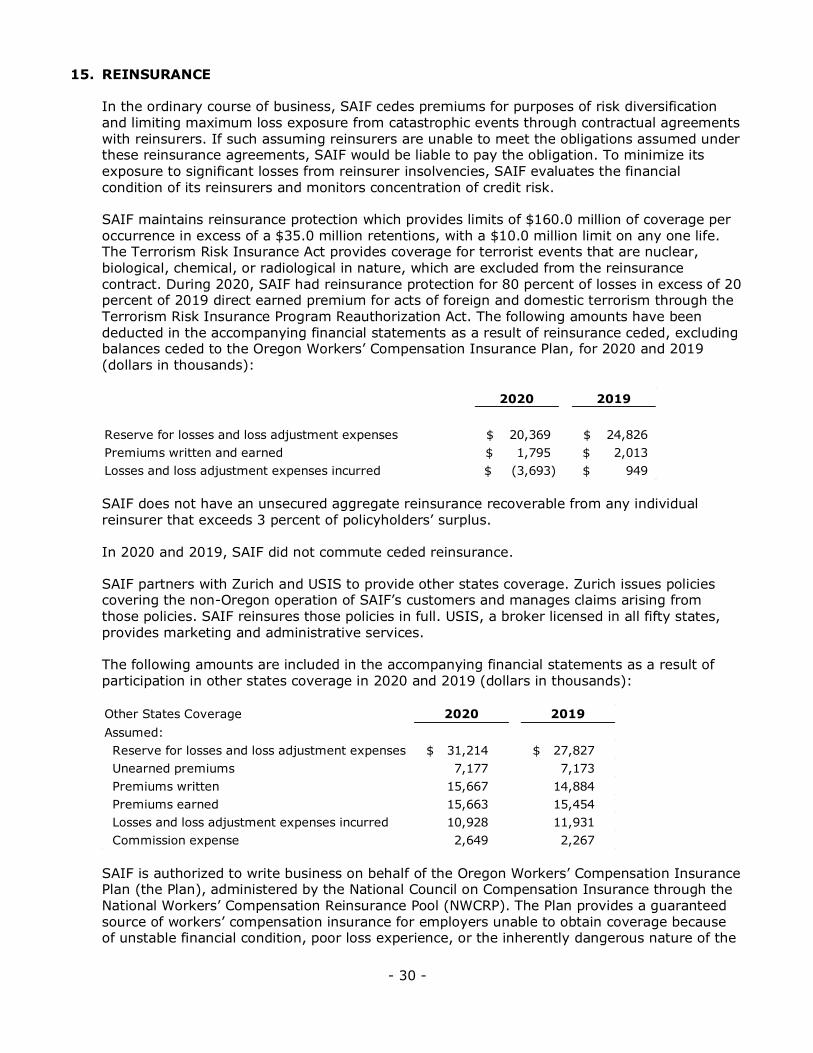
- 30 -
15. REINSURANCE
In the ordinary course of business, SAIF cedes premiums for purposes of risk diversification and limiting maximum loss exposure from catastrophic events through contractual agreements with reinsurers. If such assuming reinsurers are unable to meet the obligations assumed under these reinsurance agreements, SAIF would be liable to pay the obligation. To minimize its
exposure to significant losses from reinsurer insolvencies, SAIF evaluates the financial condition of its reinsurers and monitors concentration of credit risk.
SAIF maintains reinsurance protection which provides limits of $160.0 million of coverage per occurrence in excess of a $35.0 million retentions, with a $10.0 million limit on any one life. The Terrorism Risk Insurance Act provides coverage for terrorist events that are nuclear, biological, chemical, or radiological in nature, which are excluded from the reinsurance
contract. During 2020, SAIF had reinsurance protection for 80 percent of losses in excess of 20 percent of 2019 direct earned premium for acts of foreign and domestic terrorism through the Terrorism Risk Insurance Program Reauthorization Act. The following amounts have been deducted in the accompanying financial statements as a result of reinsurance ceded, excluding balances ceded to the Oregon Workers’ Compensation Insurance Plan, for 2020 and 2019 (dollars in thousands):
SAIF does not have an unsecured aggregate reinsurance recoverable from any individual reinsurer that exceeds 3 percent of policyholders’ surplus.
In 2020 and 2019, SAIF did not commute ceded reinsurance.
SAIF partners with Zurich and USIS to provide other states coverage. Zurich issues policies covering the non-Oregon operation of SAIF’s customers and manages claims arising from
those policies. SAIF reinsures those policies in full. USIS, a broker licensed in all fifty states, provides marketing and administrative services.
The following amounts are included in the accompanying financial statements as a result of participation in other states coverage in 2020 and 2019 (dollars in thousands):
SAIF is authorized to write business on behalf of the Oregon Workers’ Compensation Insurance Plan (the Plan), administered by the National Council on Compensation Insurance through the National Workers’ Compensation Reinsurance Pool (NWCRP). The Plan provides a guaranteed source of workers’ compensation insurance for employers unable to obtain coverage because of unstable financial condition, poor loss experience, or the inherently dangerous nature of the
2020 2019
Reserve for losses and loss adjustment expenses 20,369$ 24,826$
Premiums written and earned 1,795$ 2,013$
Losses and loss adjustment expenses incurred (3,693)$ 949$
Other States Coverage 2020 2019
Assumed:
Reserve for losses and loss adjustment expenses 31,214$ 27,827$
Unearned premiums 7,177 7,173
Premiums written 15,667 14,884
Premiums earned 15,663 15,454
Losses and loss adjustment expenses incurred 10,928 11,931
Commission expense 2,649 2,267
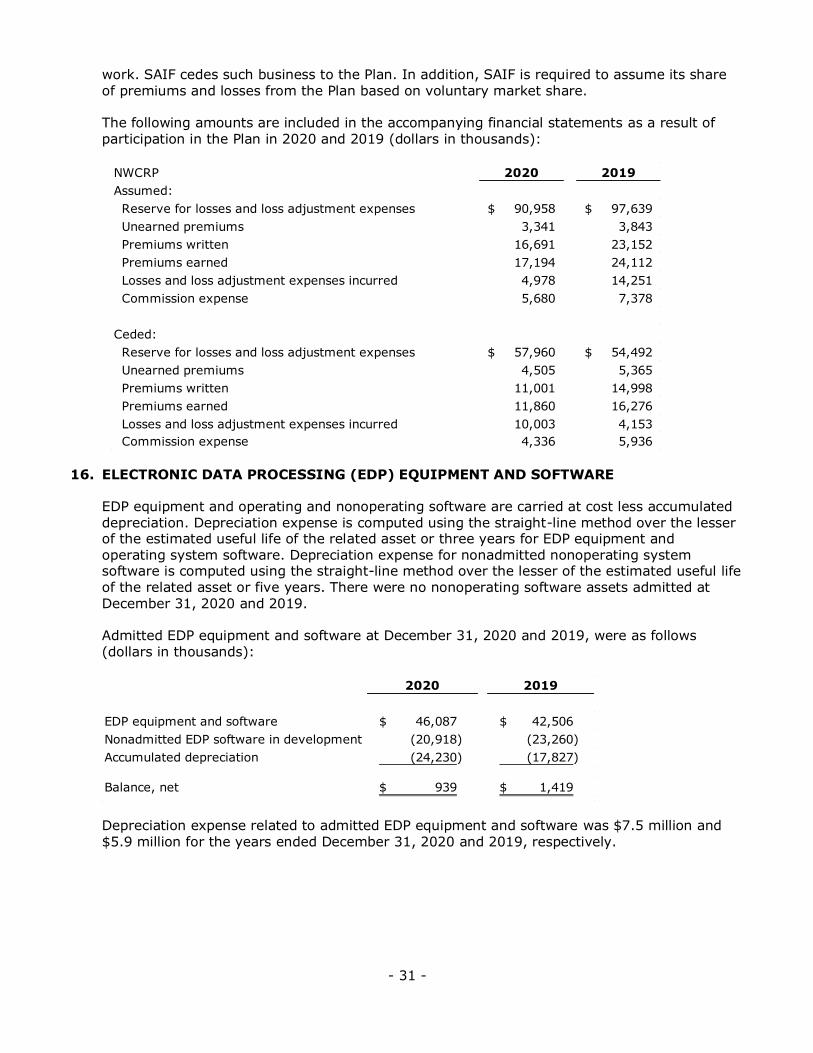
- 31 -
work. SAIF cedes such business to the Plan. In addition, SAIF is required to assume its share of premiums and losses from the Plan based on voluntary market share.
The following amounts are included in the accompanying financial statements as a result of participation in the Plan in 2020 and 2019 (dollars in thousands):
16. ELECTRONIC DATA PROCESSING (EDP) EQUIPMENT AND SOFTWARE
EDP equipment and operating and nonoperating software are carried at cost less accumulated depreciation. Depreciation expense is computed using the straight-line method over the lesser of the estimated useful life of the related asset or three years for EDP equipment and operating system software. Depreciation expense for nonadmitted nonoperating system software is computed using the straight-line method over the lesser of the estimated useful life of the related asset or five years. There were no nonoperating software assets admitted at December 31, 2020 and 2019.
Admitted EDP equipment and software at December 31, 2020 and 2019, were as follows (dollars in thousands):
Depreciation expense related to admitted EDP equipment and software was $7.5 million and
$5.9 million for the years ended December 31, 2020 and 2019, respectively.
NWCRP 2020 2019
Assumed:
Reserve for losses and loss adjustment expenses 90,958$ 97,639$
Unearned premiums 3,341 3,843
Premiums written 16,691 23,152
Premiums earned 17,194 24,112
Losses and loss adjustment expenses incurred 4,978 14,251
Commission expense 5,680 7,378
Ceded:
Reserve for losses and loss adjustment expenses 57,960$ 54,492$
Unearned premiums 4,505 5,365
Premiums written 11,001 14,998
Premiums earned 11,860 16,276
Losses and loss adjustment expenses incurred 10,003 4,153
Commission expense 4,336 5,936
2020 2019
EDP equipment and software 46,087$ 42,506$
Nonadmitted EDP software in development (20,918) (23,260)
Accumulated depreciation (24,230) (17,827)
Balance, net 939$ 1,419$
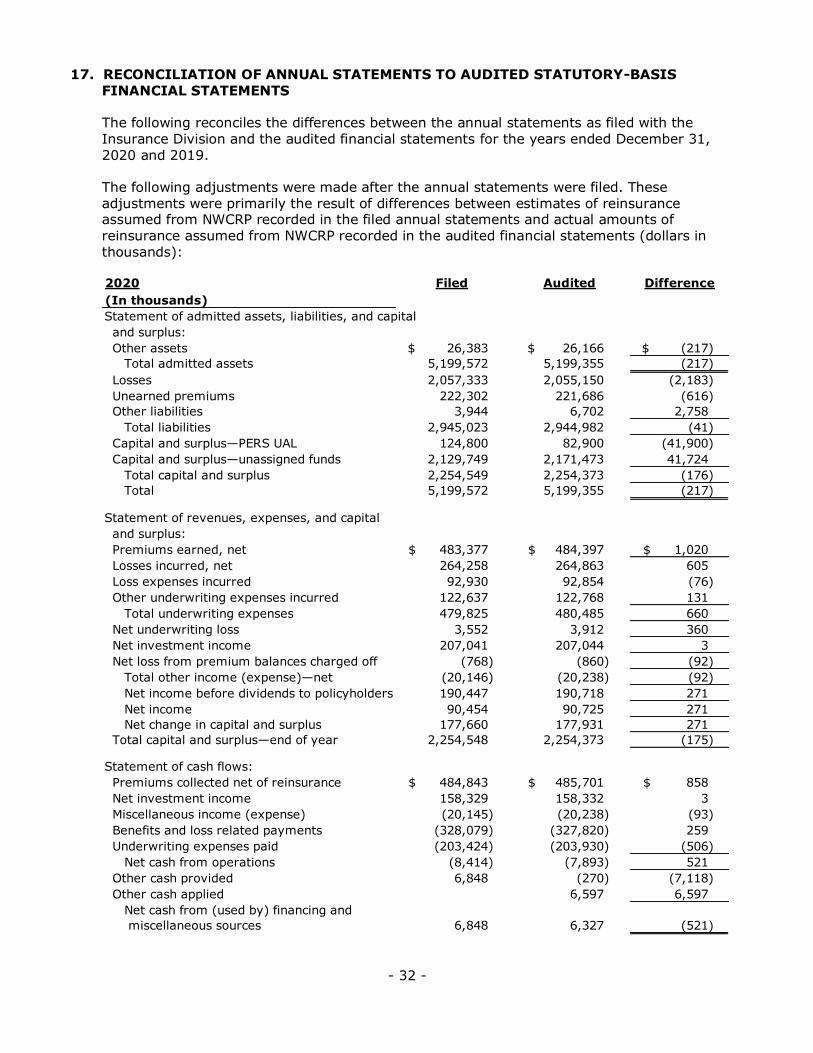
- 32 -
17. RECONCILIATION OF ANNUAL STATEMENTS TO AUDITED STATUTORY-BASIS FINANCIAL STATEMENTS
The following reconciles the differences between the annual statements as filed with the Insurance Division and the audited financial statements for the years ended December 31, 2020 and 2019.
The following adjustments were made after the annual statements were filed. These adjustments were primarily the result of differences between estimates of reinsurance assumed from NWCRP recorded in the filed annual statements and actual amounts of reinsurance assumed from NWCRP recorded in the audited financial statements (dollars in thousands):
2020 Filed Audited Difference
(In thousands)
Statement of admitted assets, liabilities, and capital
and surplus:
Other assets 26,383$ 26,166$ (217)$
Total admitted assets 5,199,572 5,199,355 (217)
Losses 2,057,333 2,055,150 (2,183)
Unearned premiums 222,302 221,686 (616)
Other liabilities 3,944 6,702 2,758
Total liabilities 2,945,023 2,944,982 (41)
Capital and surplus—PERS UAL 124,800 82,900 (41,900)
Capital and surplus—unassigned funds 2,129,749 2,171,473 41,724
Total capital and surplus 2,254,549 2,254,373 (176)
Total 5,199,572 5,199,355 (217)
Statement of revenues, expenses, and capital
and surplus:
Premiums earned, net 483,377$ 484,397$ 1,020$
Losses incurred, net 264,258 264,863 605
Loss expenses incurred 92,930 92,854 (76)
Other underwriting expenses incurred 122,637 122,768 131
Total underwriting expenses 479,825 480,485 660
Net underwriting loss 3,552 3,912 360
Net investment income 207,041 207,044 3
Net loss from premium balances charged off (768) (860) (92)
Total other income (expense)—net (20,146) (20,238) (92)
Net income before dividends to policyholders 190,447 190,718 271
Net income 90,454 90,725 271
Net change in capital and surplus 177,660 177,931 271
Total capital and surplus—end of year 2,254,548 2,254,373 (175)
Statement of cash flows:
Premiums collected net of reinsurance 484,843$ 485,701$ 858$
Net investment income 158,329 158,332 3
Miscellaneous income (expense) (20,145) (20,238) (93)
Benefits and loss related payments (328,079) (327,820) 259
Underwriting expenses paid (203,424) (203,930) (506)
Net cash from operations (8,414) (7,893) 521
Other cash provided 6,848 (270) (7,118)
Other cash applied 6,597 6,597
Net cash from (used by) financing and
miscellaneous sources 6,848 6,327 (521)
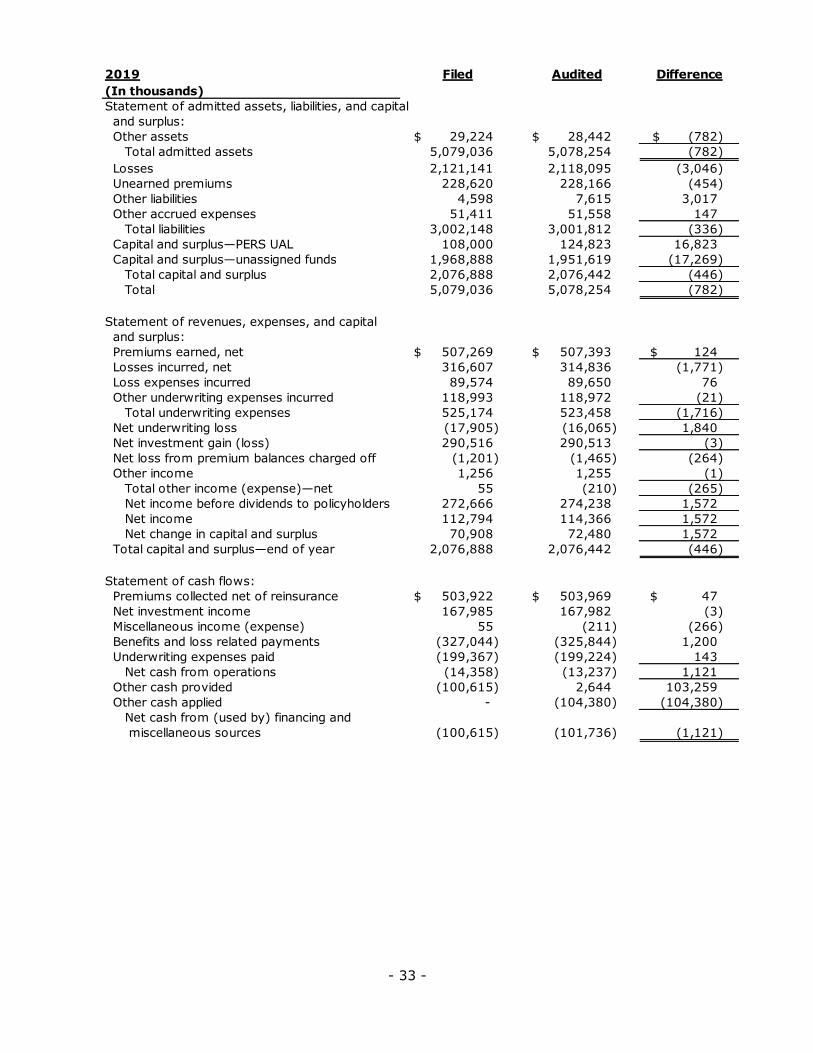
- 33 -
2019 Filed Audited Difference
(In thousands)
Statement of admitted assets, liabilities, and capital
and surplus:
Other assets 29,224$ 28,442$ (782)$
Total admitted assets 5,079,036 5,078,254 (782)
Losses 2,121,141 2,118,095 (3,046)
Unearned premiums 228,620 228,166 (454)
Other liabilities 4,598 7,615 3,017
Other accrued expenses 51,411 51,558 147
Total liabilities 3,002,148 3,001,812 (336)
Capital and surplus—PERS UAL 108,000 124,823 16,823
Capital and surplus—unassigned funds 1,968,888 1,951,619 (17,269)
Total capital and surplus 2,076,888 2,076,442 (446)
Total 5,079,036 5,078,254 (782)
Statement of revenues, expenses, and capital
and surplus:
Premiums earned, net 507,269$ 507,393$ 124$
Losses incurred, net 316,607 314,836 (1,771)
Loss expenses incurred 89,574 89,650 76
Other underwriting expenses incurred 118,993 118,972 (21)
Total underwriting expenses 525,174 523,458 (1,716)
Net underwriting loss (17,905) (16,065) 1,840
Net investment gain (loss) 290,516 290,513 (3)
Net loss from premium balances charged off (1,201) (1,465) (264)
Other income 1,256 1,255 (1)
Total other income (expense)—net 55 (210) (265)
Net income before dividends to policyholders 272,666 274,238 1,572
Net income 112,794 114,366 1,572
Net change in capital and surplus 70,908 72,480 1,572
Total capital and surplus—end of year 2,076,888 2,076,442 (446)
Statement of cash flows:
Premiums collected net of reinsurance 503,922$ 503,969$ 47$
Net investment income 167,985 167,982 (3)
Miscellaneous income (expense) 55 (211) (266)
Benefits and loss related payments (327,044) (325,844) 1,200
Underwriting expenses paid (199,367) (199,224) 143
Net cash from operations (14,358) (13,237) 1,121
Other cash provided (100,615) 2,644 103,259
Other cash applied - (104,380) (104,380)
Net cash from (used by) financing and
miscellaneous sources (100,615) (101,736) (1,121)

- 34 -
SUPPLEMENTARY SCHEDULES

- 35 -
APPENDIX A
SUMMARY INVESTMENT SCHEDULE
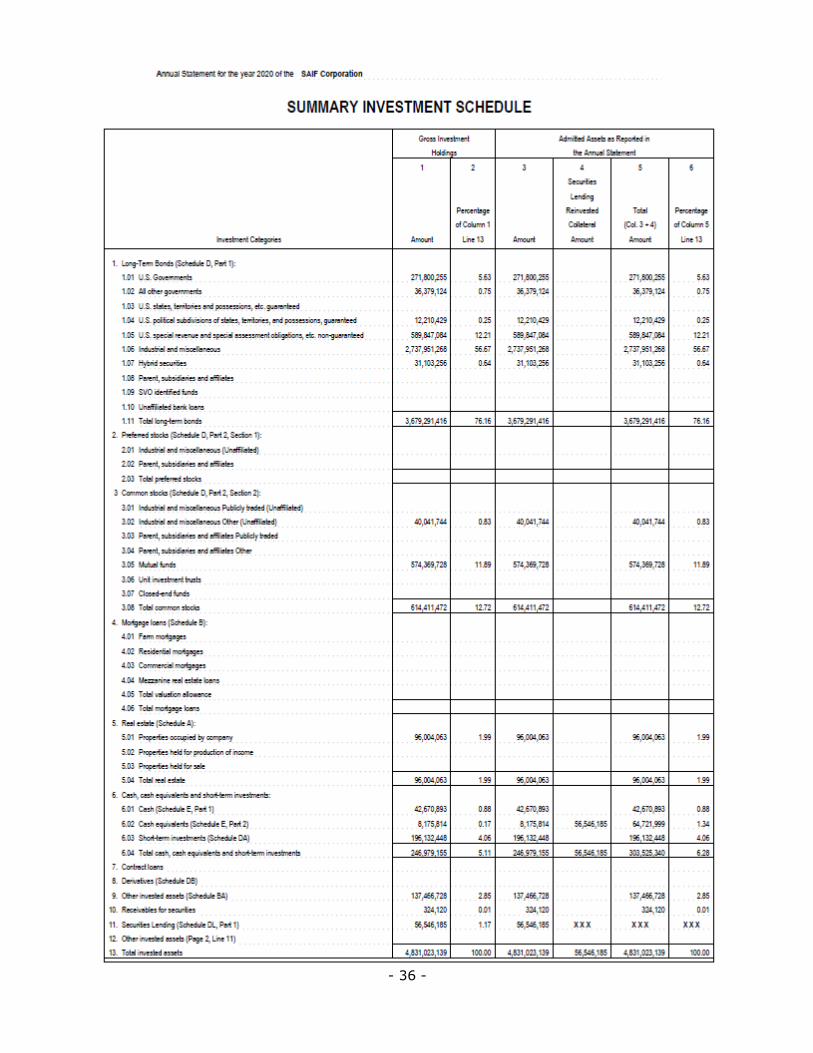
- 36 -
- 37 -
APPENDIX B
SUPPLEMENTAL INVESTMENT RISKS INTERROGATORIES
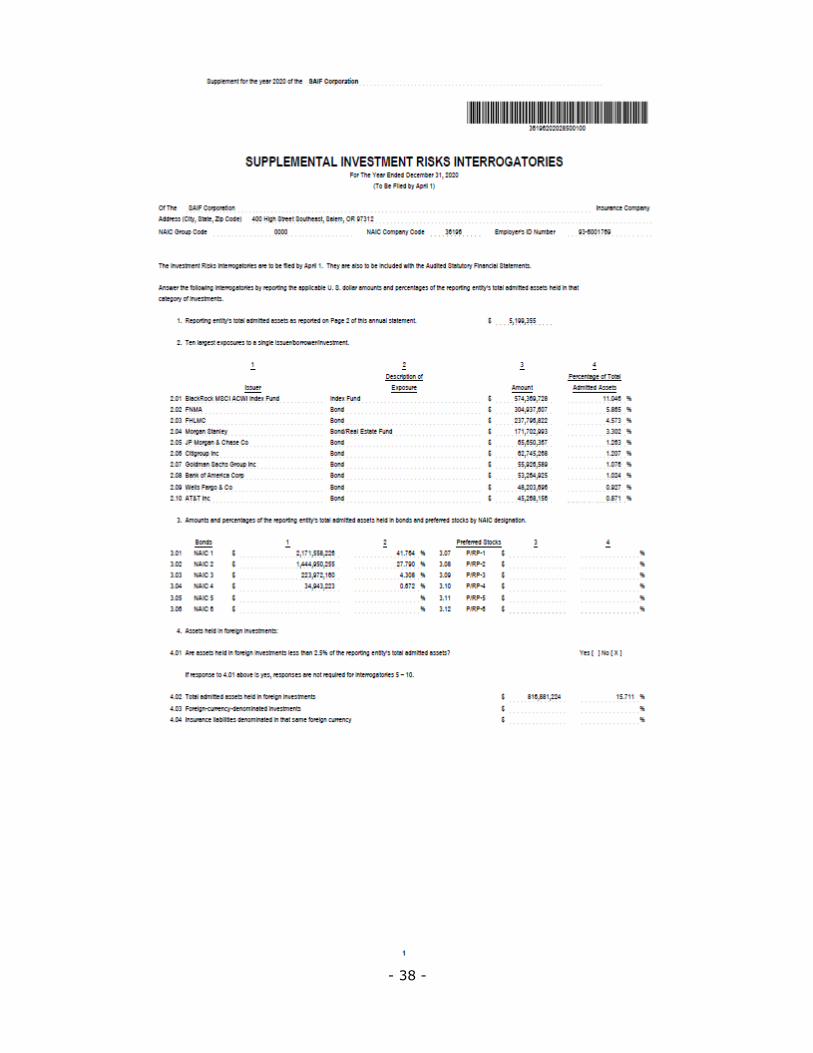
- 38 -

- 39 -
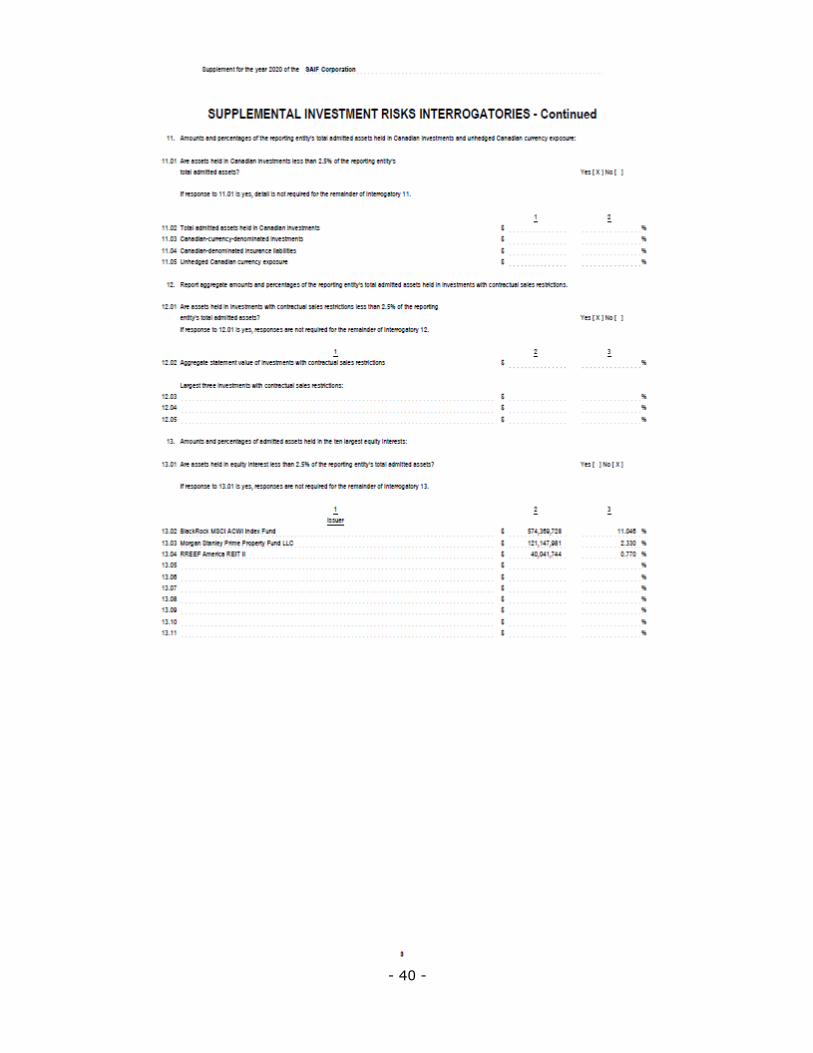
- 40 -
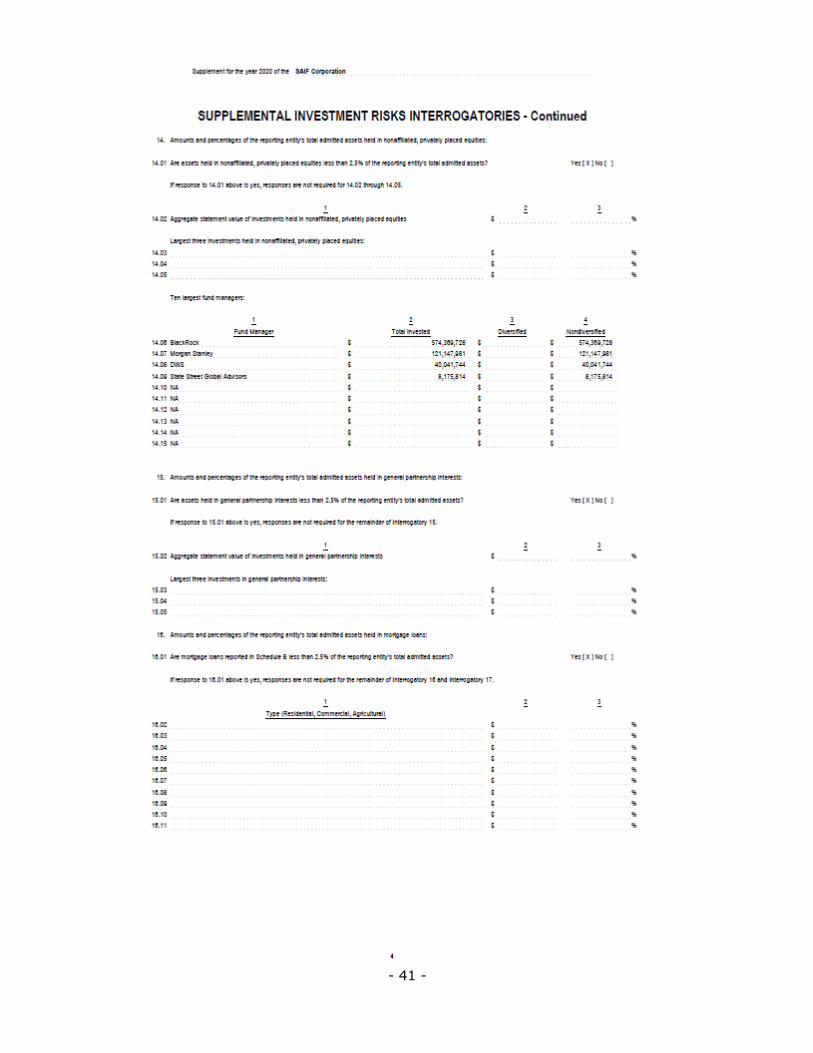
- 41 -
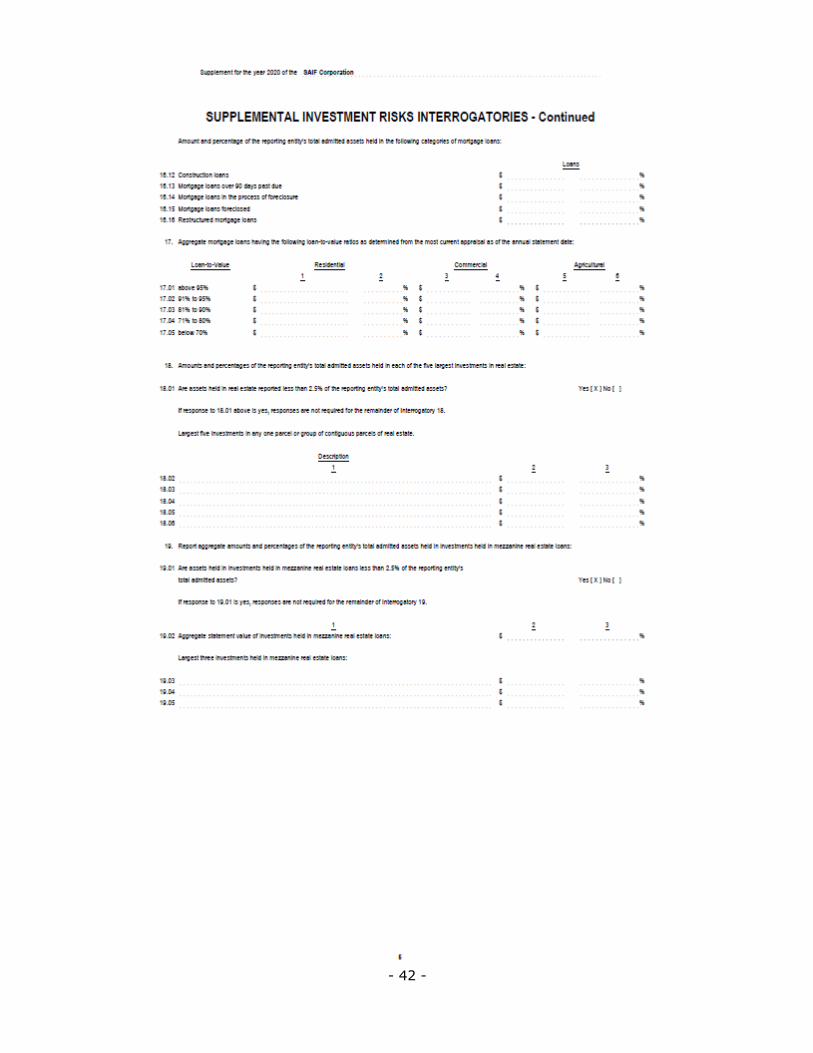
- 42 -
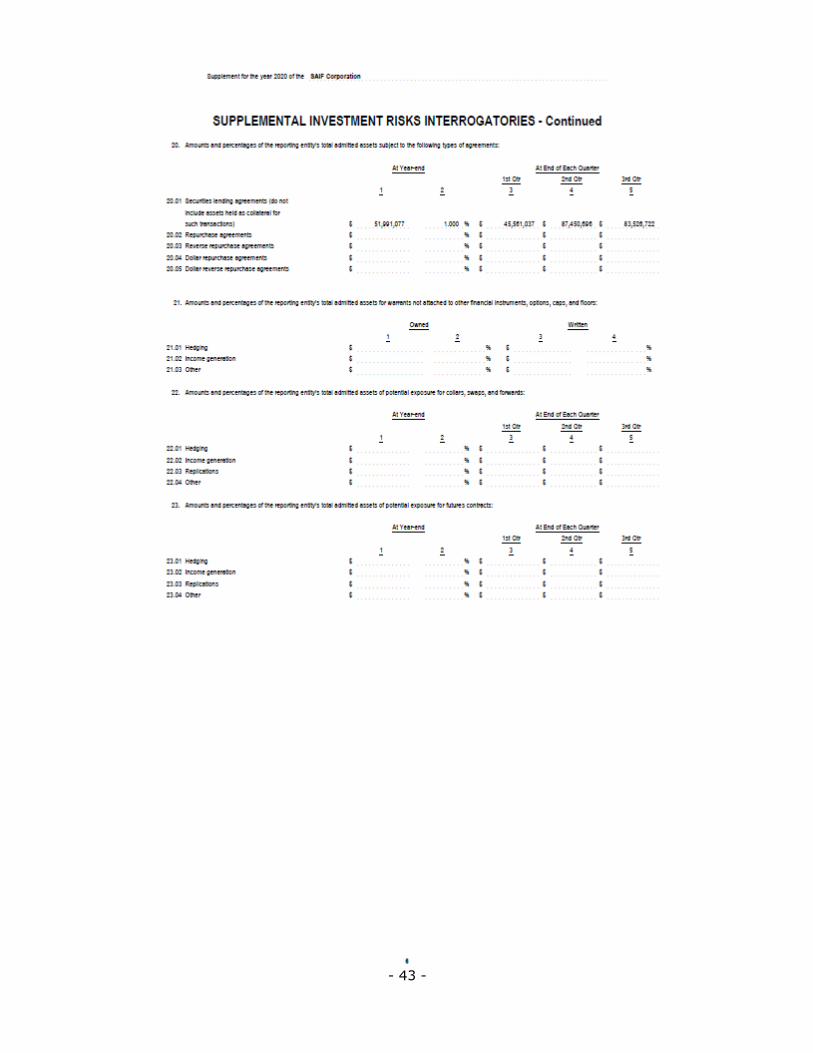
- 43 -
- 44 -
APPENDIX C
GENERAL INTERROGATORIES (REINSURANCE)
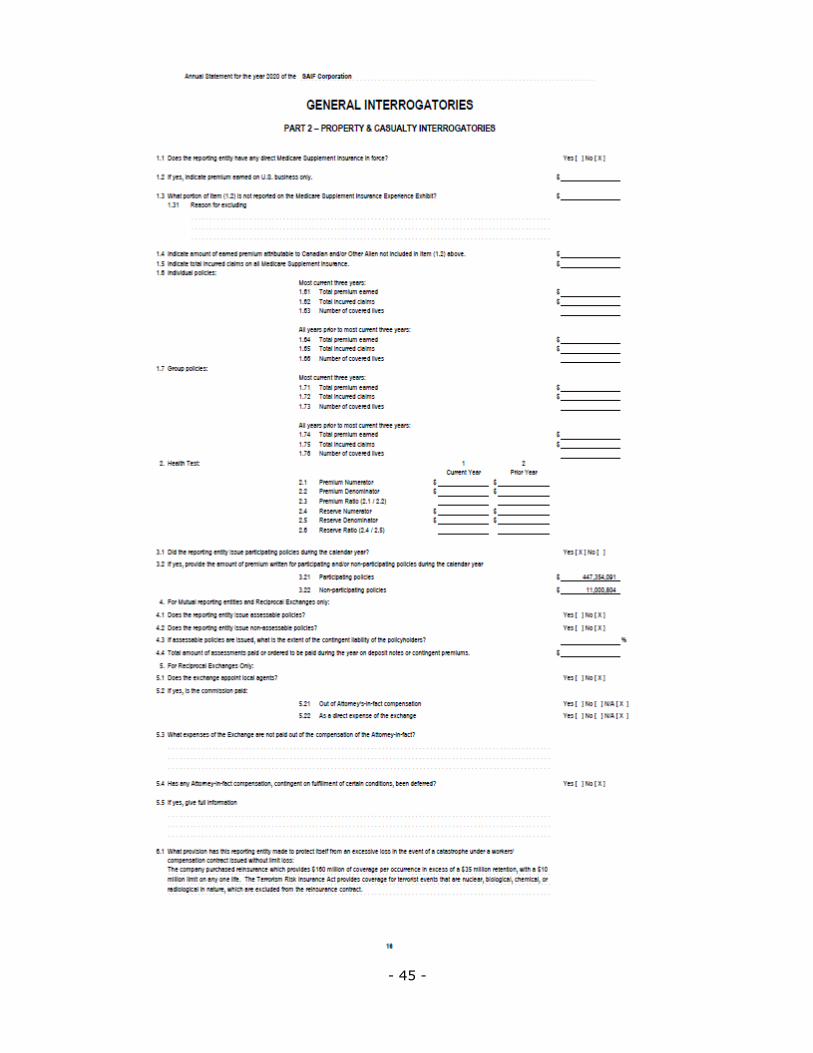
- 45 -
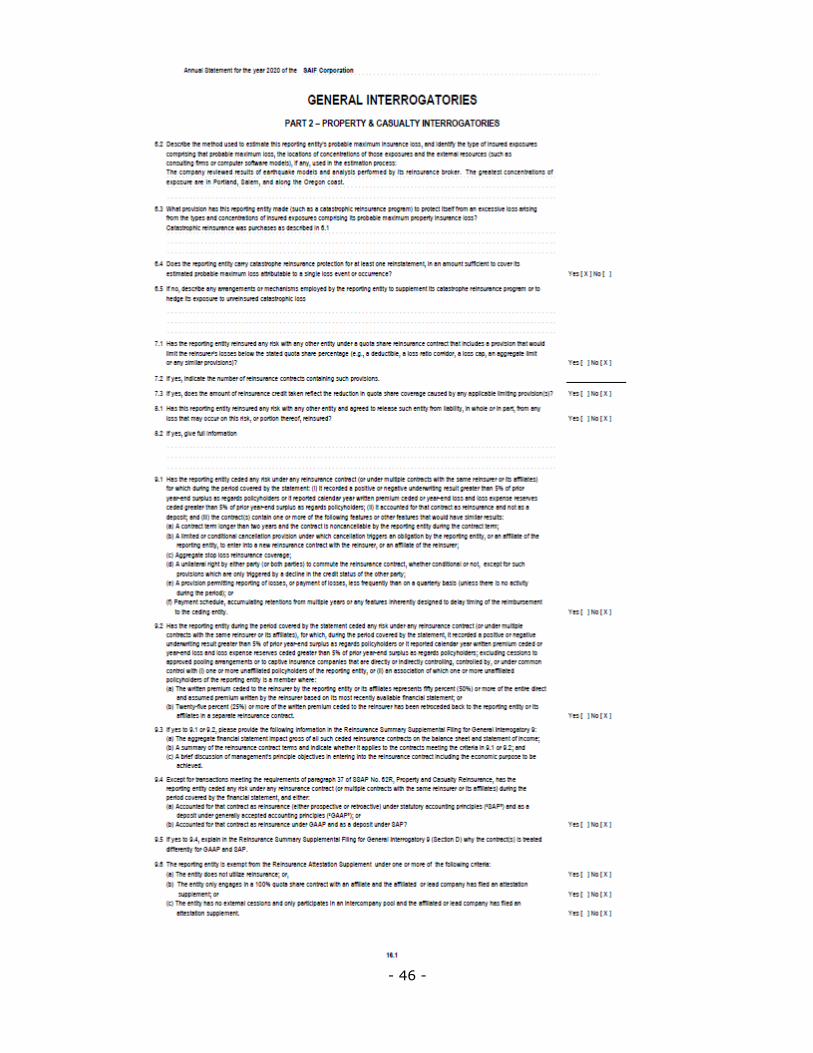
- 46 -