sage-grouse management plan for south dakota …
TRANSCRIPT
SAGE-GROUSE MANAGEMENT
PLAN FOR SOUTH DAKOTA
2014-2018
SOUTH DAKOTA DEPARTMENT OF GAME, FISH AND PARKS PIERRE, SOUTH DAKOTA WILDLIFE DIVISION REPORT 2014-02

- 2 -
Division of Wildlife Mission
The Division of Wildlife will manage South Dakota's wildlife and fisheries resources and their
associated habitats for their sustained and equitable use, and for the benefit, welfare and
enjoyment of the citizens of this state and its visitors.
Mission Motto: “Serving People, Managing Wildlife"
““TThhee vviissiioonn ooff tthhee SSoouutthh DDaakkoottaa SSaaggee--GGrroouussee MMaannaaggeemmeenntt PPllaann iiss ttoo mmaaiinnttaaiinn aabbuunnddaanntt
ppooppuullaattiioonnss ooff ssaaggee--ggrroouussee ffoorr SSoouutthh DDaakkoottaannss aanndd oouurr vviissiittoorrss bbyy ffoosstteerriinngg aa ppaarrttnneerrsshhiipp--
ddrriivveenn aapppprrooaacchh ffoorr hhaabbiittaatt ddeevveellooppmmeenntt aanndd mmaannaaggeemmeenntt,, ttoo eennssuurree ppuubblliicc aacccceessss
ooppppoorrttuunniittiieess,, aanndd ttoo iinnccrreeaassee ppuubblliicc aawwaarreenneessss ooff tthhee bbrrooaadd bbeenneeffiittss ooff qquuaalliittyy hhaabbiittaatt aanndd
hhuunnttiinngg..””
This document is for general, strategic guidance for the Division of Wildlife (DOW) and serves
to identify the role that the DOW plays, how we function and what we strive to accomplish
related to the Sage-Grouse Management Plan for South Dakota 2014-2018. The planning
process is more important than the actual document. By itself this document is of little value; the
value is in its implementation. This process will emphasize working cooperatively with private
landowners, other government agencies or entities and interested publics in both the planning
process and the regular program activities related to the management of sage-grouse.
Important sections of this plan include:
Introduction
Greater sage-grouse ecology
Historical information and current status
Monitoring and current status
Core area mapping
Harvest strategy and trends
Sage-grouse research in South Dakota
Habitat trends
Priority Issues, challenges, and opportunities in South Dakota
Management goal, objectives, and strategies

- 3 -
ACKNOWLEDGMENTS
This plan is a product from hours of discussion, debate, effort and input of many wildlife
professionals. In addition, those comments and suggestions received from private landowners,
hunters, and those who recognize the value of sage-grouse and their associated habitats were also
considered.
Management Plan Team—Tom Berdan, Paul Coughlin, Lauren Wiechmann, John Kanta, Dennie
Mann (retired), Tim Olson, Travis Runia, Alex Solem, Stan Michals, Matt Grunig, Silka
Kempema, Luke Meduna, Mark Norton, Dave Ode, Chad Switzer, and Tom Kirschenmann of
South Dakota Department of Game, Fish and Parks.
Recommended citation:
South Dakota Department of Game, Fish and Parks, Division of Wildlife. 2014. Sage-grouse
management plan for South Dakota 2014-2018. Wildlife Division Report Number 2014-02.
South Dakota Department of Game, Fish and Parks, Pierre, South Dakota.
PUBLIC INVOLVEMENT
A draft sage-grouse management plan for South Dakota 2014 – 2018 was available for public
comment from March 1 – April 15, 2014. In addition to a press release to make the public aware
of the draft plan and comment period, 90 direct mailings were sent to producers within and near
the sage-grouse core area. Public meetings were also held in Belle Fourche (March 11, 2014)
and Buffalo (March 12, 2014) to facilitate additional opportunity for public involvement.
- 4 -
TABLE OF CONTENTS
Page
Table of Contents .............................................................................................................................4
List of Figures ..................................................................................................................................5
List of Tables ...................................................................................................................................6
Introduction ......................................................................................................................................7
Greater Sage-grouse Ecology ..........................................................................................................8
Historical Information and Current Distribution ...........................................................................10
Monitoring and Current Status.......................................................................................................11
Core Area Mapping........................................................................................................................14
Harvest Strategy and Trends ..........................................................................................................17
Sage-grouse Research in South Dakota .........................................................................................20
Habitat Trends ................................................................................................................................21
Priority Issues, Challenges, and Opportunities in South Dakota ...................................................22
Goal, Objectives, and Strategies ....................................................................................................32
Literature Cited ..............................................................................................................................37

- 5 -
LIST OF FIGURES
Page
1. Pre-settlement distribution of potential sage-grouse habitat and current sage-
grouse range (Schroeder et al. 2004). ..................................................................................8
2. From Doherty et al. (2010). Range-wide sage-grouse breeding density areas
represent spatial locations of 25%, 50%, 75%, and 100% of the known breeding
population, differentiated by color .....................................................................................11
3. Total males, active leks, and males per active lek for 17 priority sage-grouse leks
that have been surveyed annually 2005 – 2014 in Butte and Harding counties
South Dakota. .....................................................................................................................13
4. Male sage-grouse per lek (including counts of 0) for the 22 priority sage-grouse
leks in Butte, Harding, and Fall River counties South Dakota 1990 – 2014. ....................13
5. South Dakota sage-grouse leks and sage-grouse locations (Swanson 2009) used in
development of sage-grouse core areas. ............................................................................15
6. South Dakota sage-grouse core areas and surface ownership. ..........................................16
7. Producing oil wells in South Dakota 1954 – 2013 (SD DENR 2014). ..............................27
8. Producing gas wells in South Dakota 1979 – 2013 (SD DENR 2014). .............................27
9. Relation of producing oil and gas wells to sage-grouse core areas in South
Dakota. ...............................................................................................................................28
10. Subsurface mineral ownership in relation to sage-grouse core areas in
northwestern South Dakota. ...............................................................................................29
11. Wind power classification in relation to South Dakota sage-grouse core areas ................31
12. Comparison of number of coyotes and red fox removed by aerial gunning by the Multi-
County Predator Control District in Lawrence, Butte, Harding, and Meade counties and
male sage-grouse per lek counted 1990 – 2013. ............................................................................ 32
- 6 -
LIST OF TABLES
Page
1. South Dakota sage-grouse core area surface ownership acreage. ......................................17
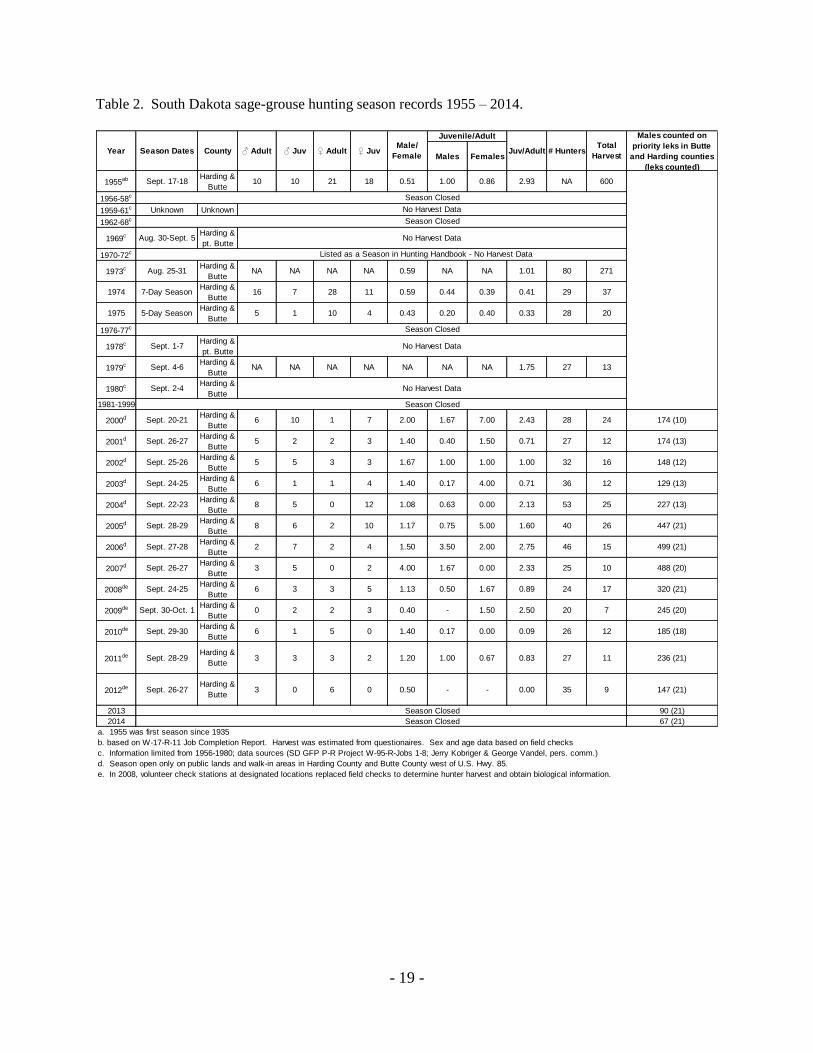
2. South Dakota sage-grouse hunting season records 1955 – 2014. ......................................19
3. Sage-grouse season recommendation guidelines for South Dakota 2014 – 2018.... .........20
4. Subsurface ownership acreage in South Dakota sage-grouse core areas. ..........................30

- 7 -
INTRODUCTION
The greater sage-grouse (Centrocercus urophasianus; hereafter sage-grouse) is the largest of all
North American grouse, and often referred to as sage-hen, sage-chicken, or sage-cock. Adult
males can weigh in excess of 5 pounds (2.3 kg) and measure 27-34 inches (69 – 86 cm) in
length, while adult females can weigh between 2-3 pounds (0.9 – 1.4 kg) and measure 18-24
inches (46 – 61 cm). Both the male and female sage-grouse have a grayish-brown appearance,
narrow pointed tail feathers, and feathering to the toes. Female grouse are more cryptic in
coloration and adult males are distinguished by a dark throat surrounded by a V-shaped patch of
white feathers on the neck. During courtship display activities, males extend two skin sacs of a
yellow-green coloration found near the throat and possess pronounced yellow eyecombs.
Sage-grouse are a sagebrush obligate “landscape species” and thus require large contiguous
tracts of sage steppe habitat for population subsistence (Aldridge et al. 2008, Wisdom et al.
2011). Sage-grouse populations have experienced range-wide declines estimated at 3.1%
annually from 1965 – 2007 (WAFWA 2008). Sage-grouse inhabit only 56% of their
presettlement distribution (Figure 1; Schroeder et al. 2004). Loss and degradation of sagebrush
(Artemisia spp.), improper livestock grazing, fire, construction of anthropogenic infrastructure,
oil and gas development, and increased mortality due to West Nile virus (WNV) have been
identified as the major contributing factors (Knick and Connelly 2011, multiple chapters).
Overhunting was also a historic factor in the population decline. Declines in sage-grouse
abundance and distribution in South Dakota (SD) are consistent with range-wide trends. Sage-
grouse once inhabited the western third of the state outside of the Black Hills, but now primarily
inhabit only portions of Butte and Harding counties (Smith et al. 2004).
Escalating concern about declining sage-grouse populations range-wide has prompted species
designations at the state and federal level. Sage-grouse have been petitioned for listing under the
federal Endangered Species Act several times with the most recent petition decision of warranted
but precluded in 2010. Listing factors A (loss and degradation of habitat) and B (inadequate
regulatory mechanisms) were identified as contributing to the warranted but precluded finding
(USFWS 2010). Sage-grouse will remain a candidate species on the endangered species list until
a final listing decision is made during federal fiscal year 2015.
Sage-grouse is listed as a species of greatest conservation need in the South Dakota Wildlife
Action Plan because the species is indicative of or depends upon a unique or declining habitat in
SD (SDWAP; SD GFP 2006). According to NatureServe (2012), sage-grouse is a G3G4-ranked
species indicating they are uncommon but not rare (G4) but in some areas have a moderate risk
of extinction or elimination (G3). The G rankings are based on a global geographic scale. More
specifically within SD, sage-grouse have a S2-ranking indicating that within state borders this
species is considered to have a high risk of extinction. NatureServe is a non-profit conservation
organization whose mission is to provide the scientific basis for effective conservation action.
This management plan identifies and provides detailed objectives and strategies which will be
used to meet the goal for sage-grouse management in SD. The future of sage-grouse is primarily
dependent upon sagebrush steppe habitat, thus the bulk of this plan focuses on habitat
management. Because habitat important to sage-grouse intersects many ownership boundaries,

- 8 -
this plan addresses issues related to both public and private land. Only with cooperation among
private and public entities can the goal for sage-grouse management be reached.
Figure 1. Pre-settlement distribution of potential sage-grouse habitat and current sage-grouse range
(Schroeder et al. 2004).
GREATER SAGE-GROUSE ECOLOGY
Sage-grouse are sagebrush obligates. At broad scales, contiguous sagebrush cover is the single
most important variable influencing population subsistence (Aldridge et al. 2008, Wisdom et al.
2011). Wyoming big sagebrush (Artemesia tridentata ssp. wyomingensis) and silver sagebrush
(A. cana) are the dominant sagebrush species within SD’s occupied sage-grouse range. Sage-
grouse depend entirely on sagebrush for both food and cover during winter and rely heavily on
sagebrush during the rest of their annual life cycle (Connelly et al. 2000). In SD, sage-grouse
selected areas with higher sagebrush canopy cover when compared to random locations
(Swanson 2009). Winter locations were associated with areas of 15% sagebrush canopy cover
with an average height of 7.9 in (20 cm). These habitat characteristics appeared to meet winter
habitat needs during mild winters as evidenced by the high observed survival (Swanson 2009).
Other published literature suggests higher sagebrush canopy cover >20% and height > 7.9 in (20
cm) is selected when available (Connelly et al. 2000). Sagebrush height and density is lower in
SD when compared to sage-grouse “main range” states such as Wyoming (Lewis 2004). Sage-

- 9 -
grouse are known to make long distance (>~ 18 mi, 30 km) seasonal migrations especially
between summer and winter ranges (Dalke et al. 1963, Hulet 1983, and Berry and Eng 1985), but
seasonal migrations in SD appear minimal (Swanson 2009).
Leks, or display areas are the center of breeding behavior where males gather to defend
territories and perform courtship displays to attract and copulate with females. Sage-grouse are
polygynous, meaning one male can breed with many females during a single breeding season. It
is common for a few dominant males to perform a majority of the copulations on a lek
(Schroeder et al. 1999). There is evidence that off-lek copulations by subordinate males increase
the number of individual males that father chicks (Bush 2009). Both males and females can
attend multiple leks during the breeding season or even during the same day (Walsh 2004).
Display activity on leks starts well before dawn and can last several hours. Display activity
during evening hours is less intense and shorter in duration. In SD, lekking activity typically
begins as early as late February, peaks in April and tapers off by June.
Leks are typically located on exposed knolls or ridges with sparse vegetation within landscapes
that contain favorable nesting habitat (Connelly et al. 2000). However, in SD leks are typically
located on large clay flats with sparse vegetation. On average, hens initiate nests within 1.8 – 5
mi (3 – 8 km) of the lek where they were observed (Schroeder et al. 1999). Research in SD
found 97% and 68% of sage grouse nests were within 4.3 and 1.9 mi (7 and 3 km) of the nearest
known lek, respectively (Kaczor 2008).
Sage-grouse typically select nest sites that possess canopy cover provided by sagebrush and
visual obstruction provided by grass and forbs. Ideal nest sites have been described to have
sagebrush canopy cover of 15 – 25% with a height of 12 – 32 in (30 – 80 cm) with associated
grass and forb cover of 7 in (18 cm) (Connelly et al. 2000). At large scales, sage-grouse also
select nest sites within intact landscapes (Aldridge and Boyce 2007). In SD, sage-grouse
selected nest sites with higher available sage-brush canopy cover and grass height than found at
random locations. Nest sites were composed of lower sagebrush canopy cover (10%) but higher
grass height (10.6 in, 27 cm) and visual obstruction (4.2 in, 10.7 cm) than nest sites of sage-
grouse within their core range of the Intermountain West (Kaczor 2008). Sage-grouse build
ground nests that are usually located under sagebrush and lined with vegetation and feathers
from the hen’s brood patch.
Most (~90%) sage-grouse hens will initiate at least one nest per breeding season (Schroeder et al.
1999). If the initial nest fails, renesting rates average 29% (Connelly et al. 2004). Kaczor (2008)
found 96% of hens initiated a nest and of those whose initial nests failed, 29% renested. Mean
nest initiation date was April 24 and May 9 for renesting attempts. Clutch size for initial nests
averaged 6.3 – 9.1 with an overall average of 7.3 for 11 studies throughout their range
(Schroeder et al. 1999). Kaczor (2008) observed an average clutch size of 8.3 and 6.4 for initial
and renest attempts, respectively.
Reported nest success (percentage of nests that hatch ≥ 1 egg) rates ranged from 15 – 86% with
an average of 48% for 16 studies (Connelly 2004 et al.). Kaczor (2008) estimated nest success
of 45.6%. Nest survival has been found to increase with increasing grass height and sagebrush
canopy cover at the nest site (Connelly et al. 2000, Kaczor 2008).

- 10 -
Successful sage-grouse nests hatch after 27 days of incubation and the precocial chicks leave the
nest with the hen within a day. Ideal brood-rearing habitat is characterized by sage-brush canopy
cover of 10 - 25% adjacent to areas rich in forbs and associated insects (Connelly et al. 2000).
Sage-grouse hens lead broods to areas of higher herbaceous and forb cover likely because these
areas have higher insect production (Holloran 1999, Kaczor 2008). Sage-grouse chicks rely on
protein rich insects for a majority of their diet during the first 3 weeks of life and insect
availability can influence chick survival (Johnson and Boyce 1990, Drut et al. 1994).
Chick survival during the first few weeks of age is low at 12–22% (Aldridge and Boyce 2007,
Gregg et al. 2007) with only an estimated 10% of chicks surviving to breeding age (Crawford et
al. 2004). Adult survival is much higher with annual estimates often exceeding 60% (Reviewed
in Connelly et al. 2004). A two year study in SD found annual adult survival rates of 35% and
70% (Swanson 2009).
HISTORICAL INFORMATION AND CURRENT DISTRIBUTION
Sage-grouse were once found in 12 states and 3 provinces, but have since been extirpated from
Nebraska and British Columbia (Schroeder et al. 2004). Their current range-wide distribution
(259,000 mi2, 670,000 km
2) represents 56% of their estimated pre-settlement distribution
(Schroeder et al. 2004; Figure 1). Sage-grouse once inhabited much of the western one-third of
SD outside of the Black Hills, but are now primarily restricted to portions of Butte and Harding
counties. Fall River County had an attended lek as recently as 2006, but no leks have been
observed from 2007 – 2014 (Hodorff 2013). Less than 1% of the range-wide sage-grouse
breeding distribution occurs in SD (Doherty et al. 2010; Figure 2).
During pre-settlement times, this species was considered abundant in the western part of the state
and present as far east as Corson County (Reviewed in Smith et al. 2004). Sage-grouse were still
found as far east as Sage Creek in or around Badlands National Park as late as 1907, but were
absent from this area by 1913 (Visher 1914). In 1910, sage-grouse were considered abundant in
areas with sagebrush in Butte and Harding counties (Visher 1914). Hornaday (1916) identified
Butte, Harding and Perkins counties as the only counties with sage-grouse by 1916. In the early
1920s, the South Dakota Geological and Natural History Survey indicated that sage grouse were
found in Fall River, Butte, and Harding counties (Over and Thoms 1921). In the mid-1950s,
sage-grouse were documented in Fall River, Butte, Harding, Meade, and Perkins counties;
however the number of birds was considerably less in Meade and Perkins counties (Reviewed in
Smith et al. 2004). In 1955, it was believed that the breeding population in Butte and Harding
counties was roughly 15,000 breeding birds (Nelson 1955).
After settlement, the sage-grouse range became more restricted likely in response to cropland
expansion and other direct loss of sage-brush which impacted the natural vegetative communities
and reduced available habitat (Smith 2004). The current sage-grouse range is similar to slightly
reduced from than that of the 1950s. Most birds are found in the more extensive sagebrush range
within Butte and Harding counties, with incidental sightings in Perkins, Meade and Fall River
counties.
- 11 -
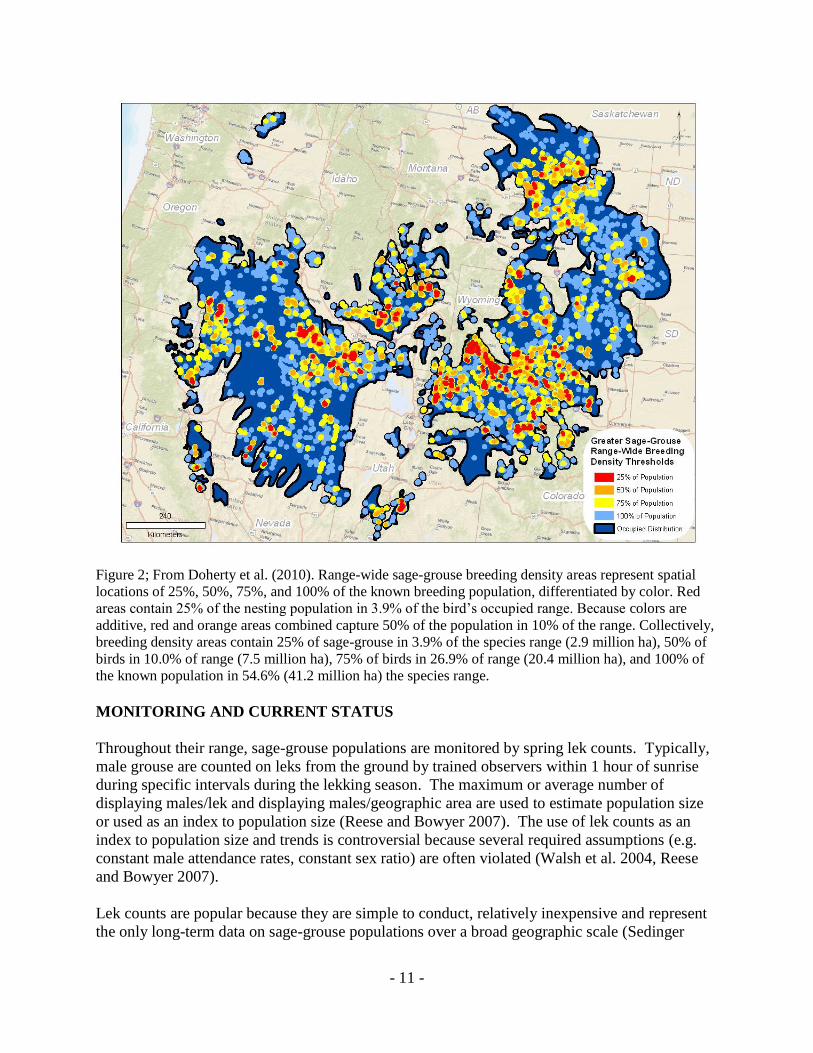
Figure 2; From Doherty et al. (2010). Range-wide sage-grouse breeding density areas represent spatial
locations of 25%, 50%, 75%, and 100% of the known breeding population, differentiated by color. Red
areas contain 25% of the nesting population in 3.9% of the bird’s occupied range. Because colors are
additive, red and orange areas combined capture 50% of the population in 10% of the range. Collectively,
breeding density areas contain 25% of sage-grouse in 3.9% of the species range (2.9 million ha), 50% of
birds in 10.0% of range (7.5 million ha), 75% of birds in 26.9% of range (20.4 million ha), and 100% of
the known population in 54.6% (41.2 million ha) the species range.
MONITORING AND CURRENT STATUS
Throughout their range, sage-grouse populations are monitored by spring lek counts. Typically,
male grouse are counted on leks from the ground by trained observers within 1 hour of sunrise
during specific intervals during the lekking season. The maximum or average number of
displaying males/lek and displaying males/geographic area are used to estimate population size
or used as an index to population size (Reese and Bowyer 2007). The use of lek counts as an
index to population size and trends is controversial because several required assumptions (e.g.
constant male attendance rates, constant sex ratio) are often violated (Walsh et al. 2004, Reese
and Bowyer 2007).
Lek counts are popular because they are simple to conduct, relatively inexpensive and represent
the only long-term data on sage-grouse populations over a broad geographic scale (Sedinger
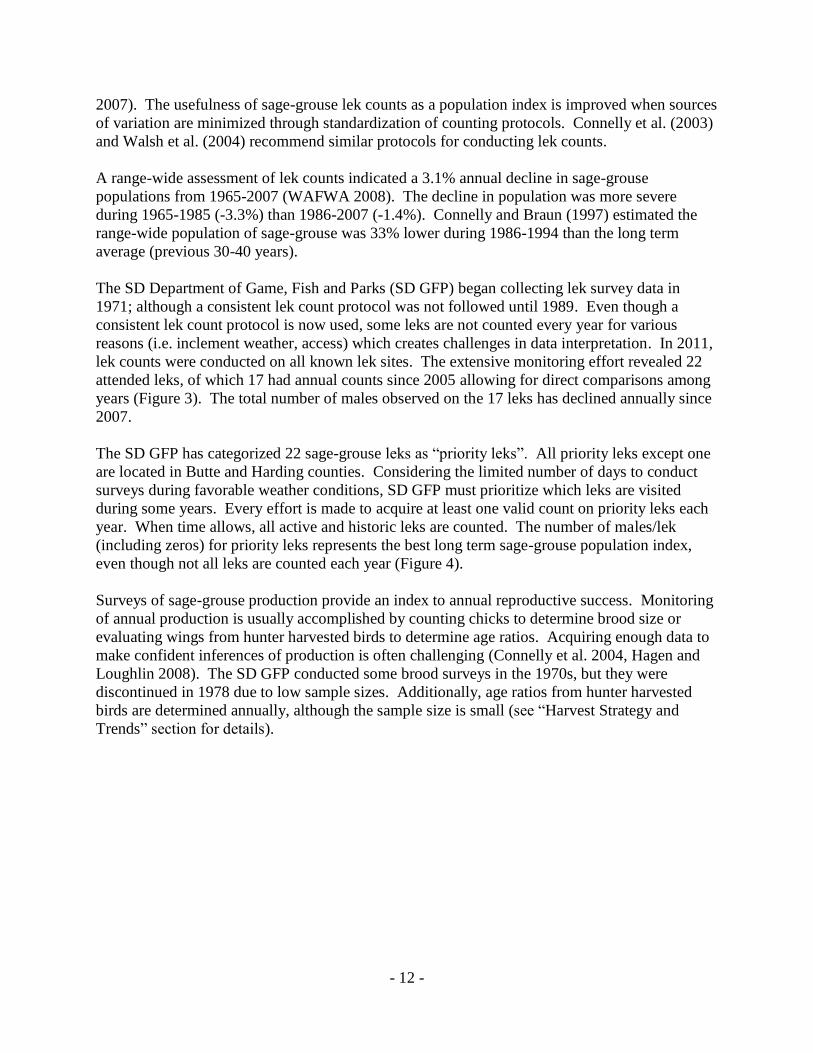
- 12 -
2007). The usefulness of sage-grouse lek counts as a population index is improved when sources
of variation are minimized through standardization of counting protocols. Connelly et al. (2003)
and Walsh et al. (2004) recommend similar protocols for conducting lek counts.
A range-wide assessment of lek counts indicated a 3.1% annual decline in sage-grouse
populations from 1965-2007 (WAFWA 2008). The decline in population was more severe
during 1965-1985 (-3.3%) than 1986-2007 (-1.4%). Connelly and Braun (1997) estimated the
range-wide population of sage-grouse was 33% lower during 1986-1994 than the long term
average (previous 30-40 years).
The SD Department of Game, Fish and Parks (SD GFP) began collecting lek survey data in
1971; although a consistent lek count protocol was not followed until 1989. Even though a
consistent lek count protocol is now used, some leks are not counted every year for various
reasons (i.e. inclement weather, access) which creates challenges in data interpretation. In 2011,
lek counts were conducted on all known lek sites. The extensive monitoring effort revealed 22
attended leks, of which 17 had annual counts since 2005 allowing for direct comparisons among
years (Figure 3). The total number of males observed on the 17 leks has declined annually since
2007.
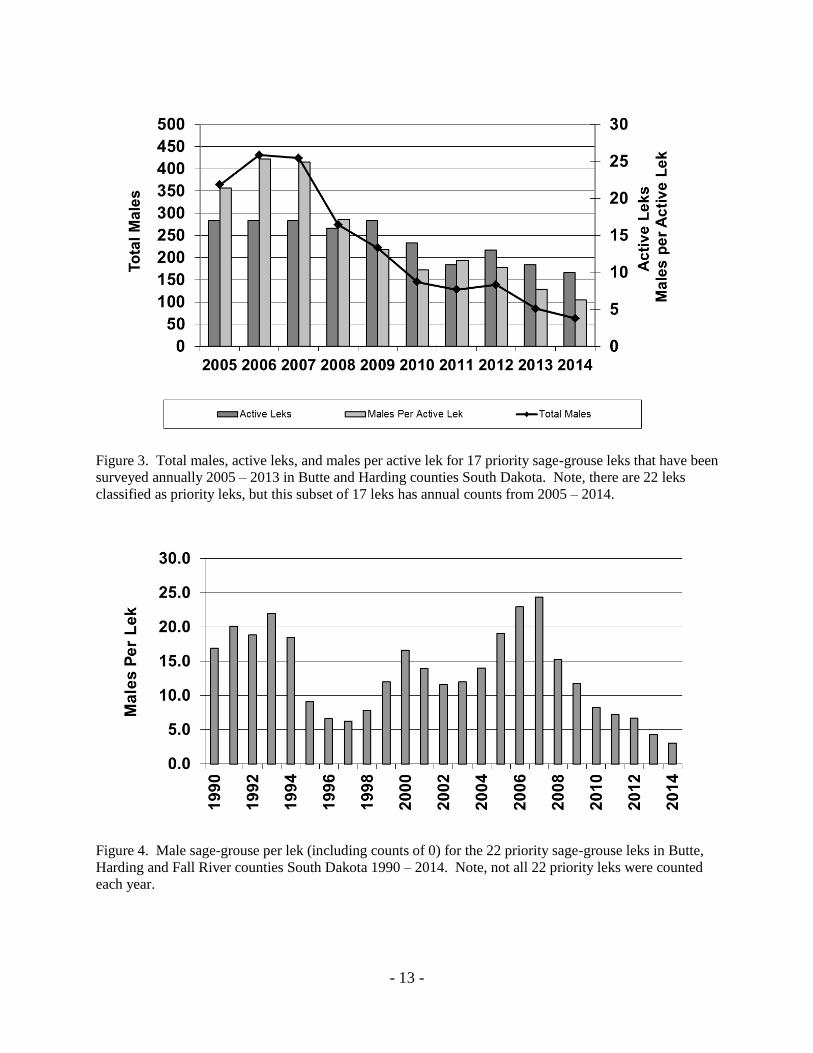
The SD GFP has categorized 22 sage-grouse leks as “priority leks”. All priority leks except one
are located in Butte and Harding counties. Considering the limited number of days to conduct
surveys during favorable weather conditions, SD GFP must prioritize which leks are visited
during some years. Every effort is made to acquire at least one valid count on priority leks each
year. When time allows, all active and historic leks are counted. The number of males/lek
(including zeros) for priority leks represents the best long term sage-grouse population index,
even though not all leks are counted each year (Figure 4).
Surveys of sage-grouse production provide an index to annual reproductive success. Monitoring
of annual production is usually accomplished by counting chicks to determine brood size or
evaluating wings from hunter harvested birds to determine age ratios. Acquiring enough data to
make confident inferences of production is often challenging (Connelly et al. 2004, Hagen and
Loughlin 2008). The SD GFP conducted some brood surveys in the 1970s, but they were
discontinued in 1978 due to low sample sizes. Additionally, age ratios from hunter harvested
birds are determined annually, although the sample size is small (see “Harvest Strategy and
Trends” section for details).
- 13 -
Figure 3. Total males, active leks, and males per active lek for 17 priority sage-grouse leks that have been
surveyed annually 2005 – 2013 in Butte and Harding counties South Dakota. Note, there are 22 leks
classified as priority leks, but this subset of 17 leks has annual counts from 2005 – 2014.
Figure 4. Male sage-grouse per lek (including counts of 0) for the 22 priority sage-grouse leks in Butte,
Harding and Fall River counties South Dakota 1990 – 2014. Note, not all 22 priority leks were counted
each year.
- 14 -
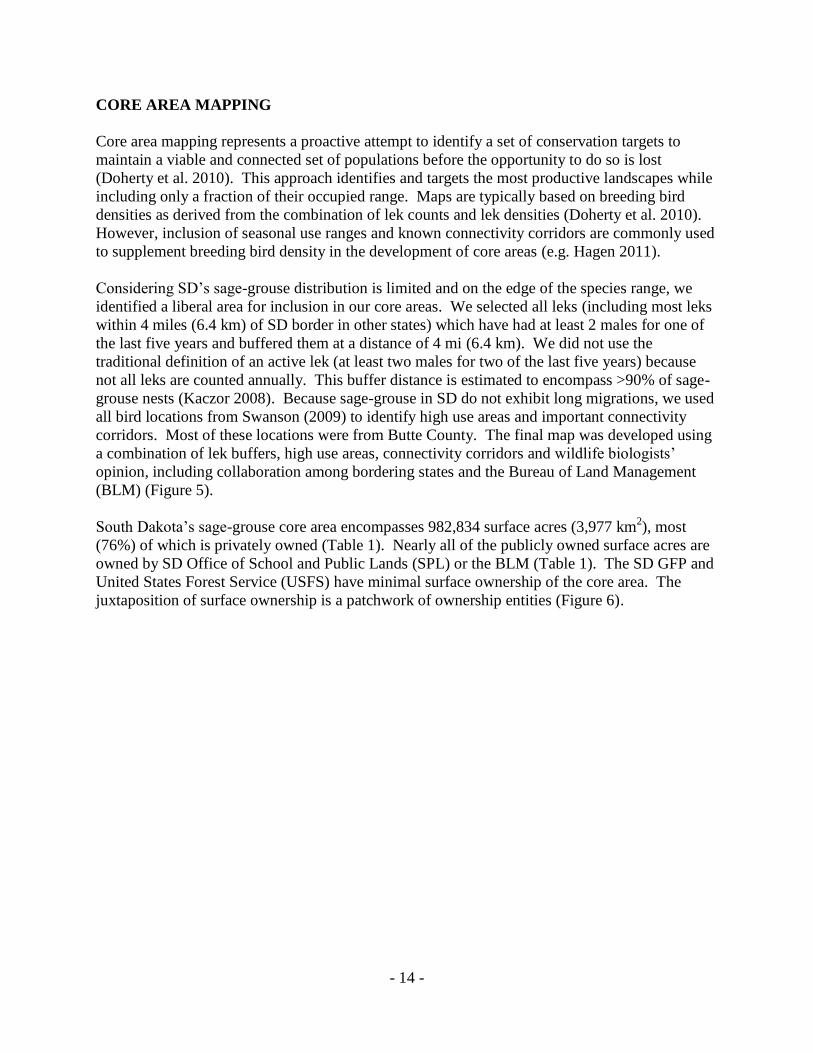
CORE AREA MAPPING
Core area mapping represents a proactive attempt to identify a set of conservation targets to
maintain a viable and connected set of populations before the opportunity to do so is lost
(Doherty et al. 2010). This approach identifies and targets the most productive landscapes while
including only a fraction of their occupied range. Maps are typically based on breeding bird
densities as derived from the combination of lek counts and lek densities (Doherty et al. 2010).
However, inclusion of seasonal use ranges and known connectivity corridors are commonly used
to supplement breeding bird density in the development of core areas (e.g. Hagen 2011).
Considering SD’s sage-grouse distribution is limited and on the edge of the species range, we
identified a liberal area for inclusion in our core areas. We selected all leks (including most leks
within 4 miles (6.4 km) of SD border in other states) which have had at least 2 males for one of
the last five years and buffered them at a distance of 4 mi (6.4 km). We did not use the
traditional definition of an active lek (at least two males for two of the last five years) because
not all leks are counted annually. This buffer distance is estimated to encompass >90% of sage-
grouse nests (Kaczor 2008). Because sage-grouse in SD do not exhibit long migrations, we used
all bird locations from Swanson (2009) to identify high use areas and important connectivity
corridors. Most of these locations were from Butte County. The final map was developed using
a combination of lek buffers, high use areas, connectivity corridors and wildlife biologists’
opinion, including collaboration among bordering states and the Bureau of Land Management
(BLM) (Figure 5).
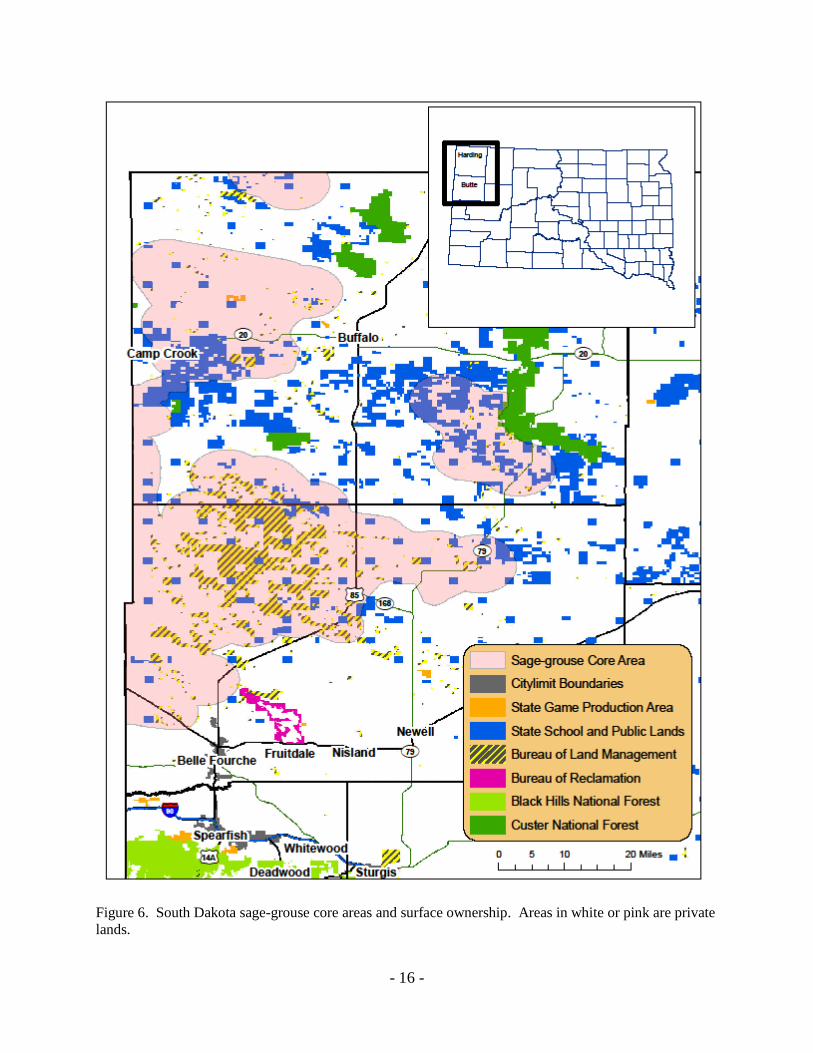
South Dakota’s sage-grouse core area encompasses 982,834 surface acres (3,977 km2), most
(76%) of which is privately owned (Table 1). Nearly all of the publicly owned surface acres are
owned by SD Office of School and Public Lands (SPL) or the BLM (Table 1). The SD GFP and
United States Forest Service (USFS) have minimal surface ownership of the core area. The
juxtaposition of surface ownership is a patchwork of ownership entities (Figure 6).

- 15 -
Figure 5. South Dakota sage-grouse leks and sage-grouse locations (Swanson 2009) used in development
of sage-grouse core areas.
- 16 -
Figure 6. South Dakota sage-grouse core areas and surface ownership. Areas in white or pink are private
lands.

- 17 -
Table 1. South Dakota sage-grouse core area surface ownership acreage.
Acres % of Total
State
School and Public Lands 126,347 12.86%
Game, Fish and Parks 408 0.04%
Total 126,755 12.90%
Federal
Bureau of Land Management 116,354 11.84%
Forest Service 1,383 0.14%
Total 117,737 11.98%
Private
Total 738,342 75.12%
Grand Total 982,834
HARVEST STRATEGY AND TRENDS
Range-wide, sage-grouse have been hunted throughout recorded history, but harvest strategy and
the understanding of the effect of harvest on populations has changed substantially during the
past century. Excessive and under-regulated hunting in the late 1800s and early 1900s in
combination with other factors obliterated sage-grouse populations (Patterson 1952). The crash
in sage-grouse populations prompted many states to prohibit hunting until populations
rebounded. Once populations rebounded, liberal hunting regulations were in place during much
of the mid and late 20th
century. Hunting seasons were crafted with the notion that hunting
mortality was compensatory to natural mortality. This strategy assumes many young are
produced, but over-winter survival is low, thus fall harvest has minimal influence on the next
years breeding population (e.g. ring-necked pheasant, Phasianus colchicus).
Emerging research during the 1980s and 1990s suggested that the sage-grouse life history
strategy of high annual survival (especially during winter) and relatively low reproductive output
was different than many other upland game birds and thus required different harvest
management. Throughout the 1990s many states shifted hunting seasons to encourage more
restrictive harvest of sage-grouse. Although biologists now recognize that sage-grouse harvest
must be highly regulated to be sustainable, an appropriate harvest rate has not been determined.
Sustainable harvest rates of 5-10% of fall populations have been suggested (Reviewed in Reese
and Connelly 2011), but regulations should be tailored for specific populations and
circumstances.
In SD, early hunting records are sparse; however it is thought that high harvest in the early
1900’s was a factor that led to the rapid decline of sage-grouse (Reviewed in Smith et al. 2004).
Department records indicate that the sage-grouse season reopened in 1955 for the first time since
1935 and approximately 600 birds were harvested. During the 1955 season, sage-grouse
numbers were fairly abundant, as hunter interviews revealed that most hunters bagged their birds
- 18 -
in less than one hour (Podoll 1957). Although abundant, the number of birds harvested was still
quite low because of local opposition to the season.
From 1956-1999, the sage-grouse hunting season was intermittently closed (Table 2). From
2000 - 2012, an average of 33 hunters harvested an average of 16 sage-grouse annually. The
2000 - 2012 sage-grouse hunting season was very restrictive. Sage-grouse hunting was limited
to two days in late September (Wednesday and Thursday), with a one bird season limit per
hunter. Sage-grouse hunting was only open on public lands (BLM, USFS, SPL, and private land
leased by SD GFP for public hunting as Walk-In Area) in Harding County and west of US
Highway 85 in Butte County. Hunters were interviewed in the field to collect age and sex
information from harvested birds. The season was closed in 2013 because the number of males
counted on priority leks dipped below 100, the threshold identified to have a season in the
previous management plan. Since 1990, the SD sage-grouse population index has risen and
fallen prior to and after the restrictive hunting season was resumed in 2000 (Figure 3). This
suggests the observed harvest under the 2000 - 2012 restrictive season structure alone had a
negligible effect on population trends.
Given the difficulty to generate accurate sage-grouse population estimates (Anderson 2001,
Baumgardt 2011), setting season structures to achieve specific harvest rates can be challenging.
Reese and Connelly (2011) provide useful advice and state “A conservative, yet data-centered,
approach to harvest may be warranted given the results of recent studies and the continuing
concerns over population and habitat trends of greater sage-grouse.” Although concern over
harvest is warranted, no study has identified harvest as a primary cause of population decline
while many studies have linked habitat loss and degradation to population declines (Reese and
Connelly 2011). Recently however, Gibson et al. (2013) found that harvest mortality was
additive to natural mortality in an isolated sage-grouse population subject to conservative
hunting seasons in California. In Gibson et al.’s study, total sage-grouse harvest explained
substantial variation in inter-annual population change suggesting additive hunting mortality
resulted in a population decline. Results from Connelly et al. (2003) also suggest hunting
mortality is additive in sage-grouse.
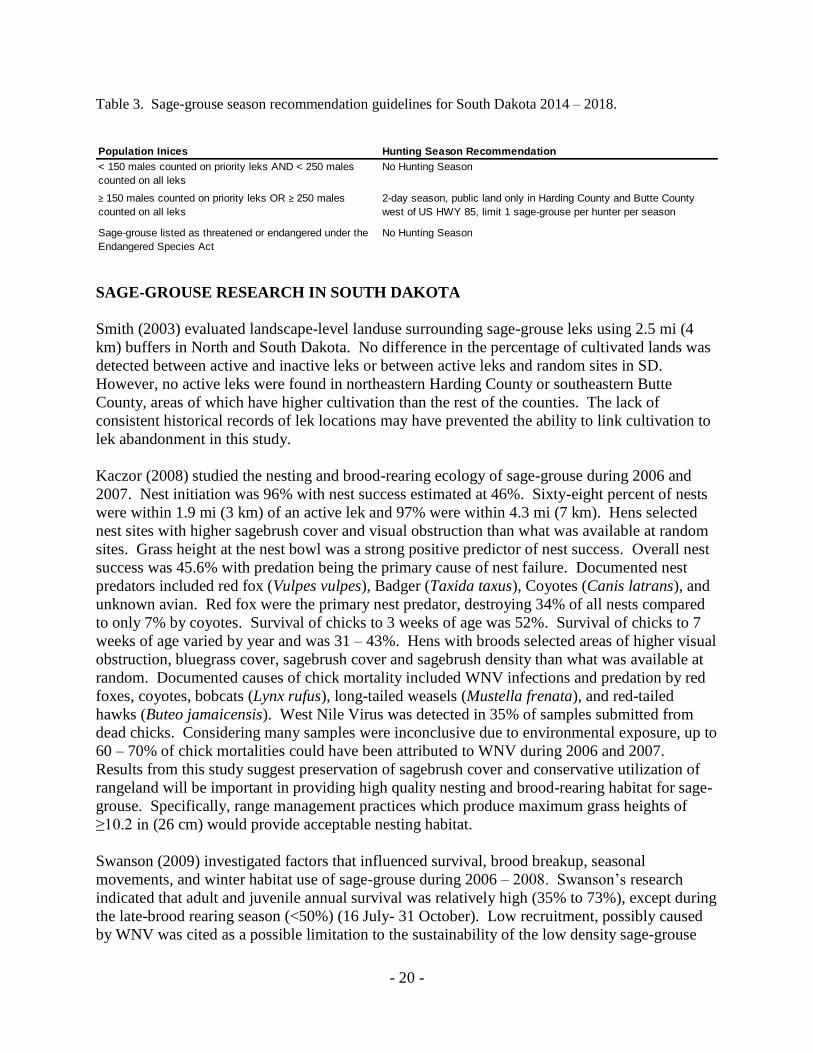
The plan will use a science-based adaptive harvest strategy for future hunting season
recommendations. The total males counted population index from the 21 priority leks in Butte
and Harding counties and total males counted on all leks in Butte and Harding counties will be
the primary source of data to base hunting season recommendations. It is unlikely that the
population would reach a high enough level to warrant a liberal hunting season because SD’s
fringe habitat is inherently marginal. Population indices will be used to determine the threshold
for when a conservative hunting season will be recommended (Table 3). The threshold selected
is based on deviance from long term average lek counts, expert opinion, past input from the
public, landowners, and sage-grouse hunters. From 2000 - 2012, the number of males counted
on priority leks dipped below 150 birds three times. However, this only occurred once when
greater than 13 of the 21 priority leks were counted. In 2012, only 147 males were counted on
all 21 priority leks. As recent as 2006 the number of males counted on priority leks nearly
reached 500 birds. The threshold of 150 males on priority leks to recommend a season
represents a low population level when compared to the last decade.
- 19 -
Table 2. South Dakota sage-grouse hunting season records 1955 – 2014.
Males Females
1955ab Sept. 17-18Harding &
Butte10 10 21 18 0.51 1.00 0.86 2.93 NA 600
1956-58c
1959-61c Unknown Unknown
1962-68c
1969c Aug. 30-Sept. 5Harding &
pt. Butte
1970-72c
1973c Aug. 25-31Harding &
ButteNA NA NA NA 0.59 NA NA 1.01 80 271
1974 7-Day SeasonHarding &
Butte16 7 28 11 0.59 0.44 0.39 0.41 29 37
1975 5-Day SeasonHarding &
Butte5 1 10 4 0.43 0.20 0.40 0.33 28 20
1976-77c
1978c Sept. 1-7Harding &
pt. Butte
1979c Sept. 4-6Harding &
ButteNA NA NA NA NA NA NA 1.75 27 13
1980c Sept. 2-4Harding &
Butte
1981-1999
2000d Sept. 20-21Harding &
Butte6 10 1 7 2.00 1.67 7.00 2.43 28 24 174 (10)
2001d Sept. 26-27Harding &
Butte5 2 2 3 1.40 0.40 1.50 0.71 27 12 174 (13)
2002d Sept. 25-26Harding &
Butte5 5 3 3 1.67 1.00 1.00 1.00 32 16 148 (12)
2003d Sept. 24-25Harding &
Butte6 1 1 4 1.40 0.17 4.00 0.71 36 12 129 (13)
2004d Sept. 22-23Harding &
Butte8 5 0 12 1.08 0.63 0.00 2.13 53 25 227 (13)
2005d Sept. 28-29Harding &
Butte8 6 2 10 1.17 0.75 5.00 1.60 40 26 447 (21)
2006d Sept. 27-28Harding &
Butte2 7 2 4 1.50 3.50 2.00 2.75 46 15 499 (21)
2007d Sept. 26-27Harding &
Butte3 5 0 2 4.00 1.67 0.00 2.33 25 10 488 (20)
2008de Sept. 24-25Harding &
Butte6 3 3 5 1.13 0.50 1.67 0.89 24 17 320 (21)
2009de Sept. 30-Oct. 1Harding &
Butte0 2 2 3 0.40 - 1.50 2.50 20 7 245 (20)
2010de Sept. 29-30Harding &
Butte6 1 5 0 1.40 0.17 0.00 0.09 26 12 185 (18)
2011de Sept. 28-29Harding &
Butte3 3 3 2 1.20 1.00 0.67 0.83 27 11 236 (21)
2012de Sept. 26-27Harding &
Butte3 0 6 0 0.50 - - 0.00 35 9 147 (21)
2013 90 (21)
2014 67 (21)
a. 1955 was first season since 1935
b. based on W-17-R-11 Job Completion Report. Harvest was estimated from questionaires. Sex and age data based on field checks
c. Information limited from 1956-1980; data sources (SD GFP P-R Project W-95-R-Jobs 1-8; Jerry Kobriger & George Vandel, pers. comm.)
d. Season open only on public lands and walk-in areas in Harding County and Butte County west of U.S. Hwy. 85.
e. In 2008, volunteer check stations at designated locations replaced field checks to determine hunter harvest and obtain biological information.
Season Closed
Season Closed
No Harvest Data
Season Closed
Listed as a Season in Hunting Handbook - No Harvest Data
Season Closed
No Harvest Data
No Harvest Data
♀ Adult ♀ JuvTotal
Harvest
Juvenile/Adult
Juv/Adult # Hunters
Season Closed
Males counted on
priority leks in Butte
and Harding counties
(leks counted)
Year Season Dates CountyMale/
Female♂ Adult ♂ Juv
Season Closed
No Harvest Data
- 20 -
Table 3. Sage-grouse season recommendation guidelines for South Dakota 2014 – 2018.
Population Inices Hunting Season Recommendation
< 150 males counted on priority leks AND < 250 males
counted on all leks
No Hunting Season
≥ 150 males counted on priority leks OR ≥ 250 males
counted on all leks
2-day season, public land only in Harding County and Butte County
west of US HWY 85, limit 1 sage-grouse per hunter per season
Sage-grouse listed as threatened or endangered under the
Endangered Species Act
No Hunting Season
SAGE-GROUSE RESEARCH IN SOUTH DAKOTA
Smith (2003) evaluated landscape-level landuse surrounding sage-grouse leks using 2.5 mi (4
km) buffers in North and South Dakota. No difference in the percentage of cultivated lands was
detected between active and inactive leks or between active leks and random sites in SD.
However, no active leks were found in northeastern Harding County or southeastern Butte
County, areas of which have higher cultivation than the rest of the counties. The lack of
consistent historical records of lek locations may have prevented the ability to link cultivation to
lek abandonment in this study.
Kaczor (2008) studied the nesting and brood-rearing ecology of sage-grouse during 2006 and
2007. Nest initiation was 96% with nest success estimated at 46%. Sixty-eight percent of nests
were within 1.9 mi (3 km) of an active lek and 97% were within 4.3 mi (7 km). Hens selected
nest sites with higher sagebrush cover and visual obstruction than what was available at random
sites. Grass height at the nest bowl was a strong positive predictor of nest success. Overall nest
success was 45.6% with predation being the primary cause of nest failure. Documented nest
predators included red fox (Vulpes vulpes), Badger (Taxida taxus), Coyotes (Canis latrans), and
unknown avian. Red fox were the primary nest predator, destroying 34% of all nests compared
to only 7% by coyotes. Survival of chicks to 3 weeks of age was 52%. Survival of chicks to 7
weeks of age varied by year and was 31 – 43%. Hens with broods selected areas of higher visual
obstruction, bluegrass cover, sagebrush cover and sagebrush density than what was available at
random. Documented causes of chick mortality included WNV infections and predation by red
foxes, coyotes, bobcats (Lynx rufus), long-tailed weasels (Mustella frenata), and red-tailed
hawks (Buteo jamaicensis). West Nile Virus was detected in 35% of samples submitted from
dead chicks. Considering many samples were inconclusive due to environmental exposure, up to
60 – 70% of chick mortalities could have been attributed to WNV during 2006 and 2007.
Results from this study suggest preservation of sagebrush cover and conservative utilization of
rangeland will be important in providing high quality nesting and brood-rearing habitat for sage-
grouse. Specifically, range management practices which produce maximum grass heights of
≥10.2 in (26 cm) would provide acceptable nesting habitat.
Swanson (2009) investigated factors that influenced survival, brood breakup, seasonal
movements, and winter habitat use of sage-grouse during 2006 – 2008. Swanson’s research
indicated that adult and juvenile annual survival was relatively high (35% to 73%), except during
the late-brood rearing season (<50%) (16 July- 31 October). Low recruitment, possibly caused
by WNV was cited as a possible limitation to the sustainability of the low density sage-grouse

- 21 -
population. The median date of brood breakup was observed around the 4th
of October when the
chicks were near a median age of 134 days old. Sage-grouse displayed a moderate level of
migration, with more pronounced movements occurring in spring and more subtle movements in
summer and winter. Most sage-grouse were considered non-migratory. Winter habitat use in the
region demonstrated that 15% sagebrush canopy cover and 7.9 in (20 cm) sagebrush height met
their winter habitat requirements during winters with below normal snowfall. Swanson (2009)
recommended that critical winter habitat areas be identified and management of the sagebrush
community structure be implemented.
The SD GFP will be funding additional sage-grouse research through South Dakota State
University beginning in spring 2016. The research will be similar to Kaczor (2008), but will be
conducted in Harding County and include more intense monitoring of hens and nests. Hen sage-
grouse will be captured and fitted with radio collars, then tracked throughout the nesting and
brood-rearing season. Hens will be tracked daily with the intent of determining cause-specific
mortality including loss from WNV. Cameras will be placed at each nest to document cause-
specific nest failure. Results of this study will further our understanding of survival and
reproduction of sage-grouse as well as help refine the core area map within Harding County.
HABITAT TRENDS
At one time it was estimated that sagebrush occupied a region of about 243,000 mi2 (630,000
km2); however over one-third of sagebrush habitat has been destroyed or otherwise drastically
altered over the past 150 years (Tweit 2000). Knick (2011) estimated current sage-brush habitat
to be the major land cover on 187,940 mi2 (486,770 km
2) within a designated sage-grouse
conservation area (SGCA; 31 mi (50 km) buffer of Schroeder et al. (2004) pre-settlement
distribution). Range-wide, sagebrush communities have been altered from pre-settlement
condition by many factors at multiple spatial scales.
Range-wide, conversion of sagebrush to cropland was the primary cause of direct loss of
sagebrush habitat (Knick et al. 2011). The conversion of sage-steppe to agriculture has been
most severe in the western portion of the sage-grouse range (Knick et al. 2011). Most of the
conversion occurred in the early 1900s, although some conversion still occurs today (reviewed in
Knick et al. 2011). An estimated 11% of the range-wide pre-settlement sagebrush acreage has
been converted to cropland (Knick et al. 2011). Only 0.27% of the SD sage-grouse core area is
classified as cropland by the 2013 Cropland Data Layer (National Agricultural Statistics Service
2013). In SD, it appears that direct loss of sagebrush through conversion to agricultural land has
been negligible for the past four decades. A study evaluating sage-grouse in northwestern SD
determined that the percentage of tilled ground within 2.5 mi (4 km) of active leks was no
different in 1999-2000 compared to 1972-1976, nor was there a difference between the
percentage of tilled ground near active and non-active leks for the same time periods (Smith
2003, 2005).
Sagebrush has also been reduced by herbicide, plowing, burning, and direct removal from
grazing lands to increase forage production for livestock. Between 77,000 mi2 (200,000 km
2)
and 93,000 mi2 (40,000 km
2) were treated during a 30-year period starting in the 1940s
(Schneegas 1967). Other studies estimate that 10% of sagebrush acreage was treated by the
1970s (Pechanec et al. 1965, Vale 1974,). Between 1940 and 1994, 70,000 mi2 (180,000 km
2) of
- 22 -
sagebrush was treated on BLM lands alone (Miller and Eddleman 2001). It is unknown how
much of the pre-settlement sage-brush in SD was impacted by herbicides, plowing, burning, or
direct removal. The total acreage of sage-brush within the sage-grouse distribution in SD is also
unknown. However, we have no evidence that these destructive activities are occurring at a
meaningful level in SD. A recent sagebrush mapping effort of portions of Butte and Harding
Counties has mapped occurrence and density of sagebrush habitat on some public lands (Wright
and Wegner 2007). This inventory identified important sage-grouse habitat as well as areas
where sage-brush habitat restoration opportunities exist.
In addition to obvious direct losses of sage-steppe habitat, the cumulative effects of human
actions on the landscape have influenced the ecological function of much of the remaining sage
steppe habitat available to sage-grouse. For instance, although roads and power lines may
physically occupy a small area, they may influence ecological function at large scales (e.g.
decline in nest and brood survival due to increase in predators benefiting from human-altered
landscape). It is estimated that 40% of the landscape within the current sage-grouse range is
influenced by paved roads alone (Knick et al. 2011). Approximately half of the SGCA is
influenced by major power lines (Knick et al. 2011). An evaluation of the human footprint
intensity within the current sage-grouse range indicated over half of the landscape is classified as
having an intermediate or high-intensity human footprint (Leu and Hanser 2011). Even noise
associated with energy development has impacted sage-grouse behavior (Blickley and Patricelli
2012, Blickley et al. 2012), and populations (Holloran 2005), although the proportion of the
landscape within the SGCA that is influenced by noise is unknown.
Exotic annual grasses, increased fire frequency, and overgrazing are inter-related threats that
have reduced the value of sage-steppe as sage-grouse habitat in portions of their range, primarily
outside of SD. Overgrazing is the continued heavy grazing which exceeds the recovery capacity
of the plant community and creates a deteriorated range (Society for Range Management 1998).
Downy brome (Bromus tectorum) and Japanese brome (B. japonicus), invasive annual grasses,
have invaded sage-steppe primarily throughout the Intermountain West. Because these invasive
grasses mature and dry up by late spring, they produce fuel for fires which can destroy sagebrush
which is not well adapted to frequent fire. Overgrazing has helped the spread of these
undesirable annual grasses and the subsequent change in fire regime (Young et al. 1976).
Overgrazing of herbaceous resources can also reduce understory concealment cover which can
reduce nest survival (Kaczor 2008). We do not consider overgrazing, invasion of cheatgrass, or
fire as a widespread threat to sage-grouse habitat in SD.
PRIORITY ISSUES, CHALLENGES, AND OPPORTUNITIES IN SOUTH DAKOTA
The impending Endangered Species Act listing decision of greater sage-grouse in 2015 will
closely evaluate how identified threats in the United States Fish and Wildlife Services’
Conservation Objectives Team (COT) report (USFWS 2013) are addressed by state-level
management plans. Threats to sage-grouse listed as present and widespread in the Dakotas’
population include isolated/small population size, fire, energy development, mining, and
infrastructure. Threats identified as present but localized in the Dakotas’ population included
sagebrush elimination, agricultural conversion, weeds/annual grasses, and overgrazing. The
COT report also suggests that local conservation plans use local data on threats when considering
management strategies.

- 23 -
The loss and degradation of sage-brush habitat that has historically plagued sage-grouse
populations range-wide will continue to be the main threat to sage-grouse populations in the
future. Fortunately, direct habitat loss has been localized in SD in recent years. Although
habitat quantity is relatively stable, opportunities still exist to address specific threats to sage-
grouse and sagebrush habitat. Sage-grouse are sensitive to subtle changes in habitat quality and
quantity, thus preservation and management of existing habitat is critical.
Livestock grazing is the most common use of sage-steppe lands in SD. It has been demonstrated
throughout the sage-grouse range that proper grazing management has improved sage-steppe
habitat, enhancing both nesting and brood-rearing cover for sage grouse. Where grazing is
improperly managed, degradation of sage-steppe habitat can occur, resulting in decreased
concealment due to fewer grasses and forbs, encourage the spread of exotic annual grasses, and
increase fire frequency. Although overgrazing can degrade sage-steppe rangeland, properly
applied grazing management is essential to maintain diverse sage, grass, and forb communities
which are necessary to support annual life cycle needs of sage-grouse. The presence of livestock
has also been found to increase sage-grouse nest survival (Foster et al. 2014). Although difficult
to quantify, rangeland condition within the sage-grouse range of SD is thought to be in good
condition. On BLM lands, over 90% of allotments are meeting rangeland ecological standards
(BLM 2014). Conservation actions aimed at enhancing already sound grazing management and
elevating those which could be bolstered will greatly benefit sage-grouse and their habitats in
SD. Ranching activities aimed at achieving long term sustained rangeland production is
beneficial to livestock production and maintenance of stage-steppe habitat for sage-grouse.
In addition to property damage and loss of livestock forage, wildfires can result in long term loss
of sage-steppe habitat. Prevention of and prompt response to wildfires is within the best interest
of property owners and residents and is necessary to protect sage-steppe habitat. The SD GFP
has addressed the threat of wildfire primarily during the firearm antelope season when fire
conditions can be favorable and hunter activity can increase the threat of wildfire ignition. When
wildfire conditions are favorable during the firearm antelope season, the SD GFP has conducted
aerial reconnaissance in areas of high hunter density so wildfires could be quickly located and
addressed. The SD GFP has also mobilized additional firefighting equipment including tanker
aircraft to high risk areas. Press releases have also been used to make hunters and other
members of the public aware of elevated wildfire risk situations and ways to prevent wildfires.
The SD GFP will continue to take these actions in the future.
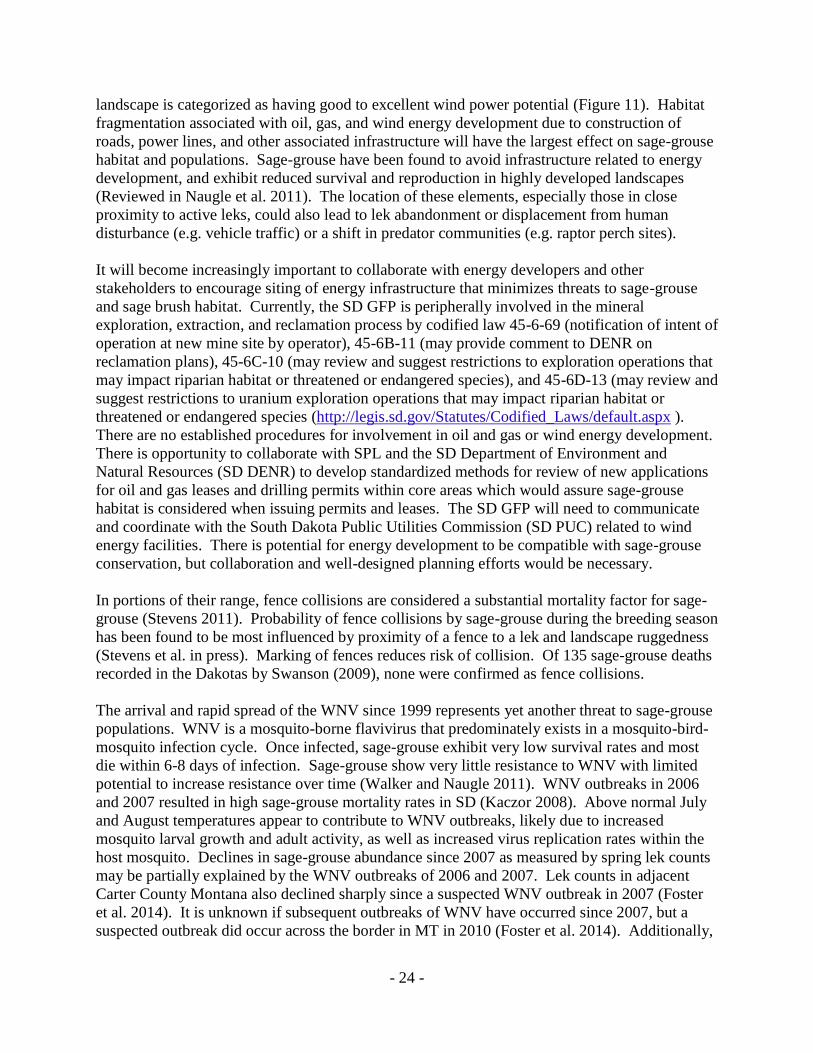
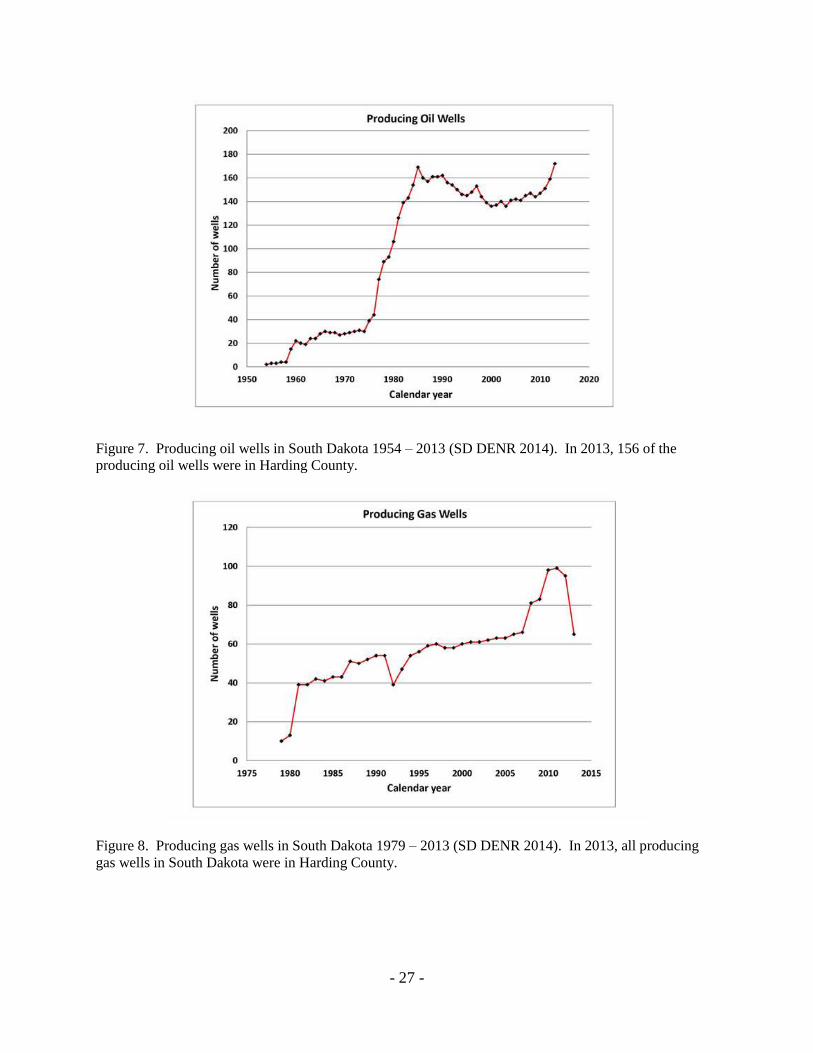
Across its range, the discussion of energy development and the impacts on sage grouse habitat
and populations has expanded and intensified. Within SD’s sage-grouse range, oil and gas
development has been limited (Figures 7, 8, and 9). However, with new technologies and
soaring demand for energy, increased exploration and development are possible. Currently,
there are only 16 proposed or approved oil/gas drilling permits (SD DENR 2014). Drilling
permits are valid for one year and not all permitted wells are drilled (SD DENR 2014). There is
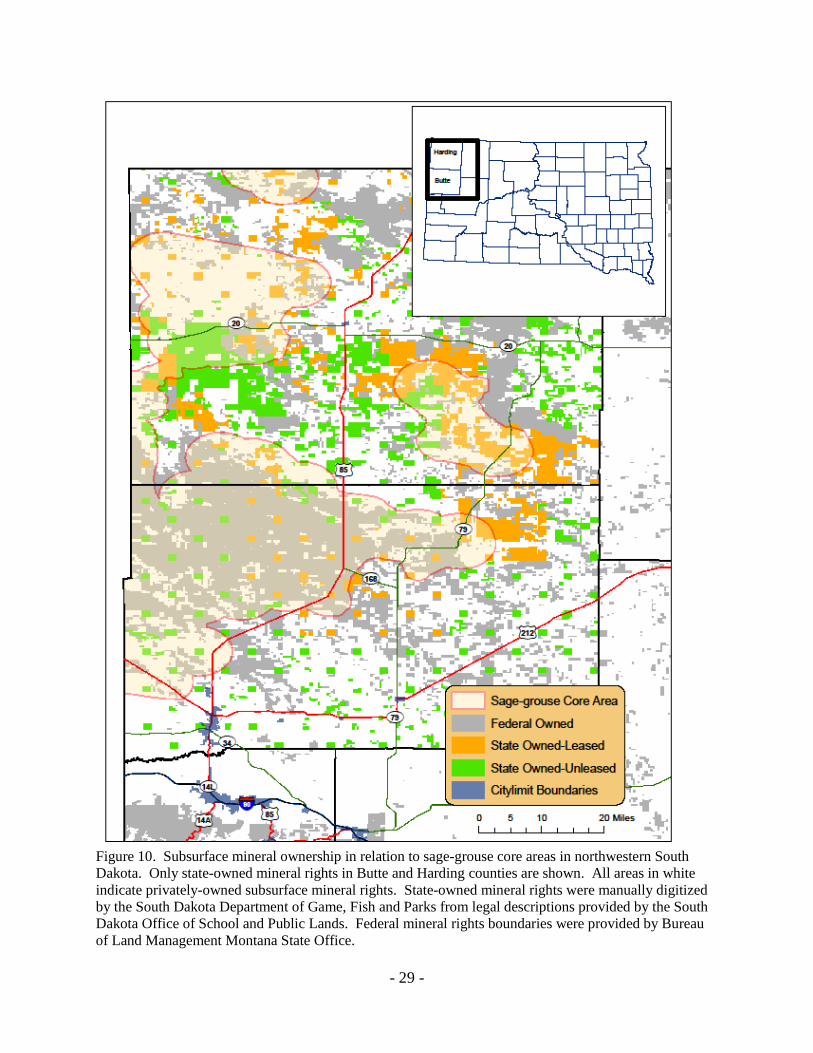
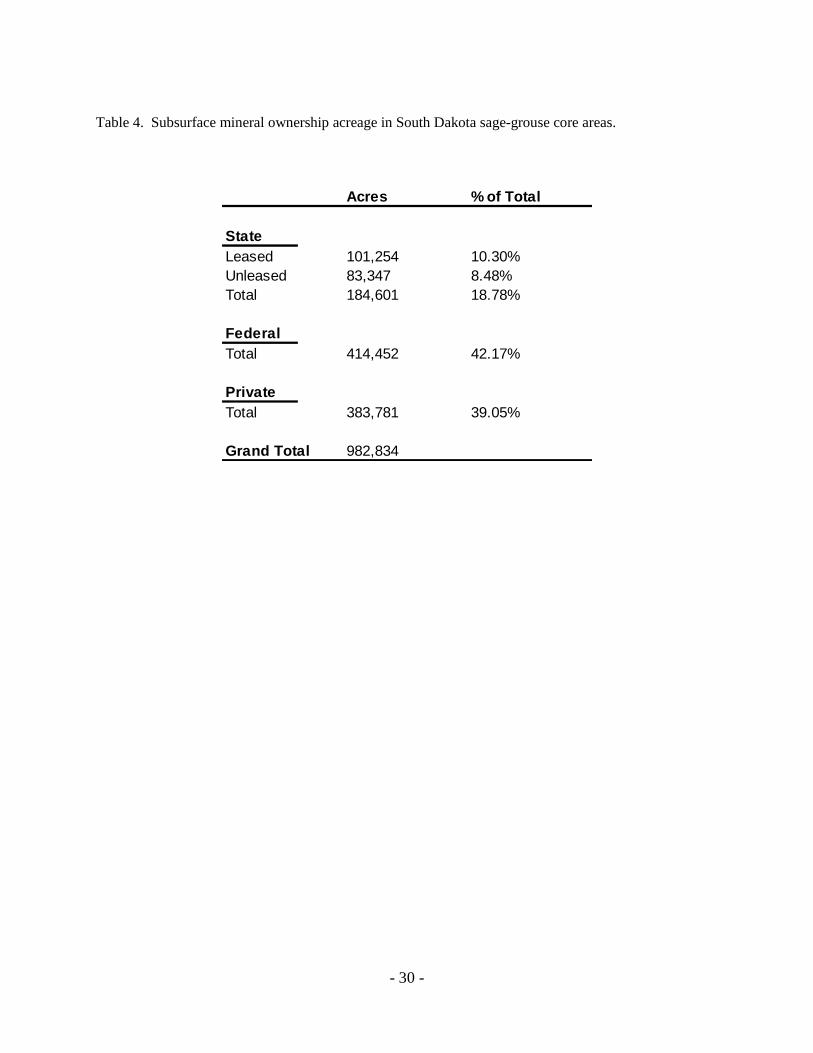
also localized potential for mining, primarily for bentonite. Within core areas, about 60% of
mineral rights are publicly owned (Figure 10, Table 4). The growing popularity and expansion
of wind power and associated infrastructure is also a concern, although most wind power
development has occurred in the eastern half of the state. Within core areas, 76% of the
- 24 -
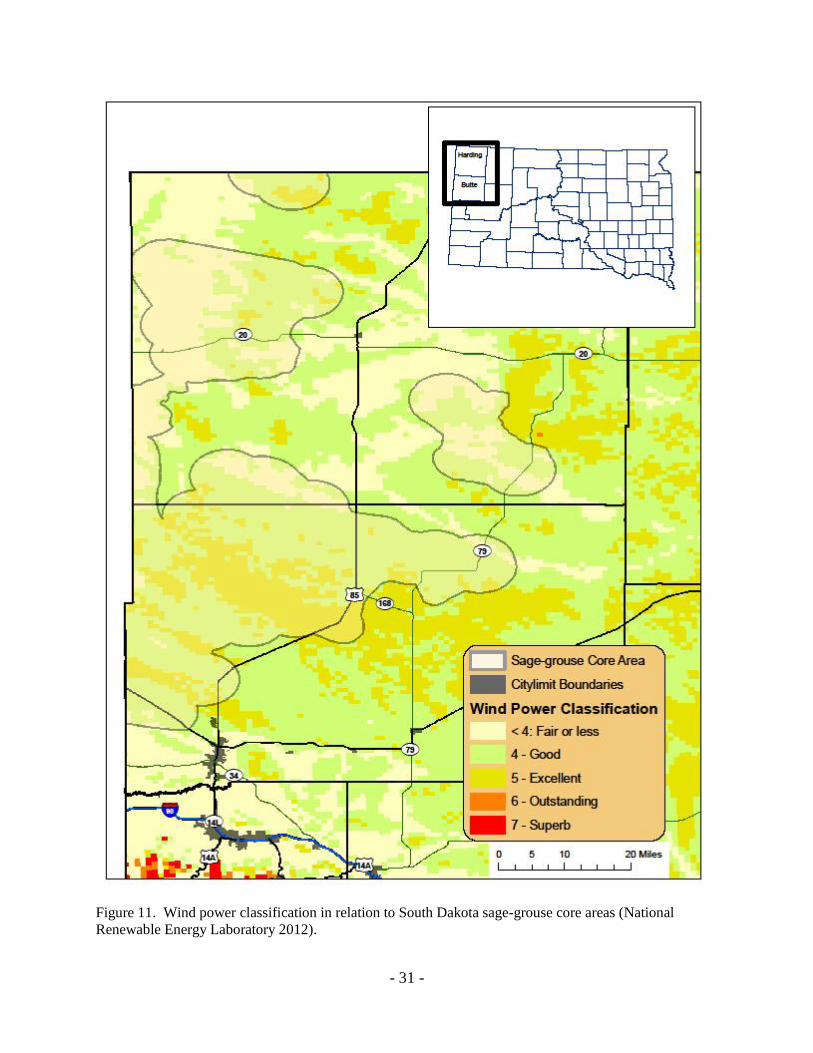
landscape is categorized as having good to excellent wind power potential (Figure 11). Habitat
fragmentation associated with oil, gas, and wind energy development due to construction of
roads, power lines, and other associated infrastructure will have the largest effect on sage-grouse
habitat and populations. Sage-grouse have been found to avoid infrastructure related to energy
development, and exhibit reduced survival and reproduction in highly developed landscapes
(Reviewed in Naugle et al. 2011). The location of these elements, especially those in close
proximity to active leks, could also lead to lek abandonment or displacement from human
disturbance (e.g. vehicle traffic) or a shift in predator communities (e.g. raptor perch sites).
It will become increasingly important to collaborate with energy developers and other
stakeholders to encourage siting of energy infrastructure that minimizes threats to sage-grouse
and sage brush habitat. Currently, the SD GFP is peripherally involved in the mineral
exploration, extraction, and reclamation process by codified law 45-6-69 (notification of intent of
operation at new mine site by operator), 45-6B-11 (may provide comment to DENR on
reclamation plans), 45-6C-10 (may review and suggest restrictions to exploration operations that
may impact riparian habitat or threatened or endangered species), and 45-6D-13 (may review and
suggest restrictions to uranium exploration operations that may impact riparian habitat or
threatened or endangered species (http://legis.sd.gov/Statutes/Codified_Laws/default.aspx ).
There are no established procedures for involvement in oil and gas or wind energy development.
There is opportunity to collaborate with SPL and the SD Department of Environment and
Natural Resources (SD DENR) to develop standardized methods for review of new applications
for oil and gas leases and drilling permits within core areas which would assure sage-grouse
habitat is considered when issuing permits and leases. The SD GFP will need to communicate
and coordinate with the South Dakota Public Utilities Commission (SD PUC) related to wind
energy facilities. There is potential for energy development to be compatible with sage-grouse
conservation, but collaboration and well-designed planning efforts would be necessary.
In portions of their range, fence collisions are considered a substantial mortality factor for sage-
grouse (Stevens 2011). Probability of fence collisions by sage-grouse during the breeding season
has been found to be most influenced by proximity of a fence to a lek and landscape ruggedness
(Stevens et al. in press). Marking of fences reduces risk of collision. Of 135 sage-grouse deaths
recorded in the Dakotas by Swanson (2009), none were confirmed as fence collisions.
The arrival and rapid spread of the WNV since 1999 represents yet another threat to sage-grouse
populations. WNV is a mosquito-borne flavivirus that predominately exists in a mosquito-bird-
mosquito infection cycle. Once infected, sage-grouse exhibit very low survival rates and most
die within 6-8 days of infection. Sage-grouse show very little resistance to WNV with limited
potential to increase resistance over time (Walker and Naugle 2011). WNV outbreaks in 2006
and 2007 resulted in high sage-grouse mortality rates in SD (Kaczor 2008). Above normal July
and August temperatures appear to contribute to WNV outbreaks, likely due to increased
mosquito larval growth and adult activity, as well as increased virus replication rates within the
host mosquito. Declines in sage-grouse abundance since 2007 as measured by spring lek counts
may be partially explained by the WNV outbreaks of 2006 and 2007. Lek counts in adjacent
Carter County Montana also declined sharply since a suspected WNV outbreak in 2007 (Foster
et al. 2014). It is unknown if subsequent outbreaks of WNV have occurred since 2007, but a
suspected outbreak did occur across the border in MT in 2010 (Foster et al. 2014). Additionally,

- 25 -
researchers conducting raptor research in Harding County documented raptor mortalities with
symptoms consistent with WNV in 2013 and 2014 (Personal communication, Dr. Troy
Grovenburg).
Predation was not listed as a listing factor for the warranted but precluded status of the sage-
grouse under the Endangered Species Act, nor was it listed as a threat in the COT report.
However, predation is the primary cause of adult and chick mortality and nest failure. Predation
is a natural component of sage-grouse ecology and typically does not influence long term
population trends when adequate habitat is available. Sage-grouse populations are more likely to
respond to artificial changes in predator abundance than naturally fluctuating predator
populations. For example, several comments received from landowners during the public
comment period of this management plan indicated sage-grouse populations were very high
when broadband predator control substance such as sodium fluoroacetate (1080) were
extensively used prior to 1972. They indicated sage-grouse populations declined in response to
increasing predator abundance until the late 1990s when mange decimated predator populations
and sage-grouse populations increased once again. Consistent predator abundance data is not
available to investigate this relationship. It is possible that broadband predator control
substances and mange could have artificially suppressed predator numbers to a level in which
sage-grouse populations responded positively.
Although predation is the primary source of sage-grouse mortality and nest failure, we do not
recommend predator control for several reasons. Results from Kaczor (2008) and Swanson
(2009) indicate population vital rates likely would have been adequate for a stable population
without the high mortality experienced during late summer and early fall due to suspected WNV
outbreaks. Raptors and mammals caused 42 and 58% of known predation mortalities. Raptors
are protected under the 1918 Migratory Bird Treaty Act and eagles are further protected under
the 1940 Bald and Golden Eagle Protection Act. The SD GFP, in cooperation with USDA’s
Animal and Plant Health Inspection Service does conduct predator control primarily on coyotes
to protect livestock. From 2010 – 2013, approximately 200 – 400 coyotes were removed
annually in Butte and Harding counties. Prior to 2010, county-level data is not available. Local
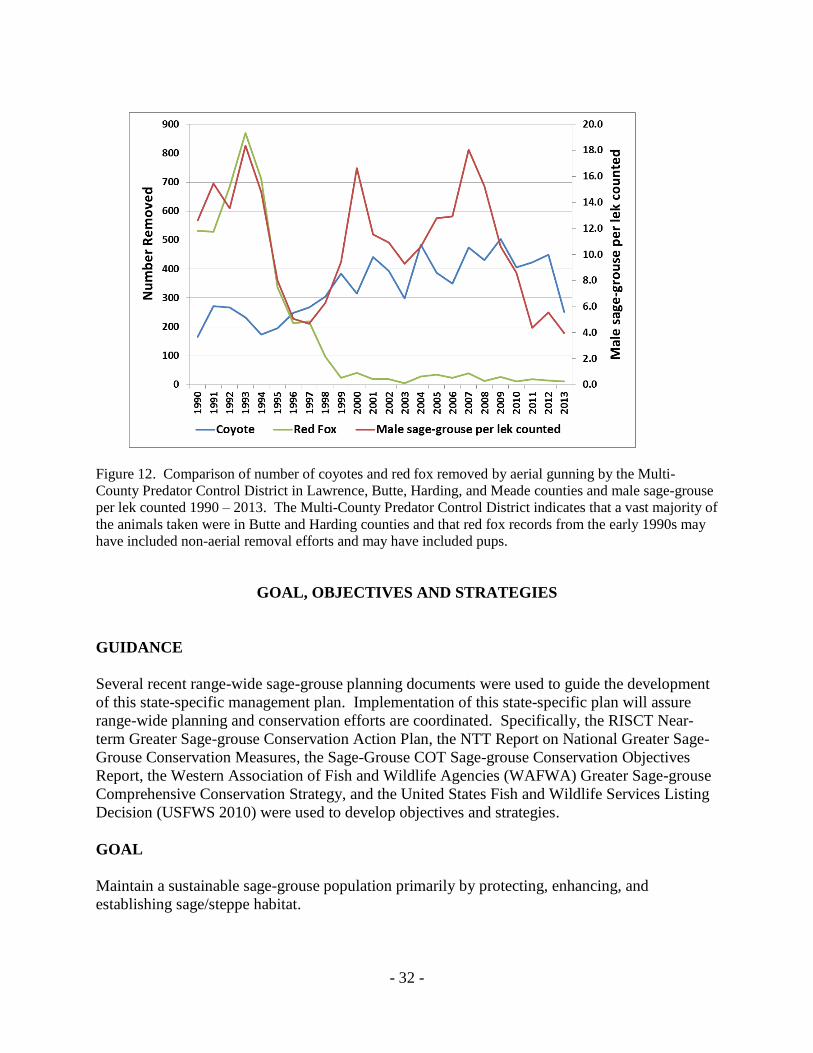
predator control districts also remove predators (Figure 12). It is unknown if these efforts have
an impact on the sage-grouse population, but no obvious correlation with lek count data exist.
However, intense coyote control could allow for an increase in red fox abundance which are
more likely to prey on sage-grouse hens and nests (Mezquida et al. 2006, Levi and Wilmers
2012). Predator control is only effective if all predators are controlled which is expensive and
requires intense effort. Previous broadband predator control substances such as sodium
fluoroacetate (1080), which are now banned for general use, may have controlled mammalian
predators to a degree at which sage-grouse populations would benefit. We recommend
managing habitat for the benefit of sage-grouse which will have long term and large scale
benefits for survival and reproduction of sage-grouse.
Augmentation, or release of translocated sage-grouse, has been used with success to increase
sage-grouse population size, particularly for small and isolated populations. Releases conducted
in the spring near lek sites in areas where physical barriers (e.g. mountain range) prevent large
outward movements have been most successful (e.g. Duvuvuei 2013). It is unknown whether
augmentations could be used successfully in SD. South Dakota’s sage-grouse range lacks a

- 26 -
physical barrier with populations to the west which could allow released sage-grouse to disperse
over long distances, thus not benefiting the target area. Furthermore, without a long-term
solution to address high sage-grouse mortality caused by WNV, augmentation would not be an
effective recovery tool.
Issues and challenges facing sage-grouse and sagebrush habitat represent conservation
opportunities. In 2010, the United States Department of Agriculture (USDA) launched a new
effort to sustain working ranches and conserve greater sage-grouse populations. Known as the
Sage-grouse Initiative, the cooperative effort between the USDA’s Natural Resources
Conservation Service (NRCS), Pheasants Forever, and the SD GFP has established a Farm Bill
biologist/rangeland specialist position in the Belle Fourche NRCS field office. The biologist will
have the unique opportunity to encourage habitat improvements for sage-grouse by utilizing
federal conservation funds such as the Environment Qualities Incentives Program (EQIP). The
SD GFP has worked closely with the NRCS to ensure funds distributed through EQIP for sage-
grouse conservation will address specific habitat needs. SD GFP private lands biologists will
also continue to administer and improve upon private lands habitat programs that improve or
establish habitat for sage-grouse. Because a considerable amount of the land and subsurface
mineral rights in SD’s sage-grouse range are owned by the BLM, continued collaboration,
especially during the ongoing resource management plan revisions will be crucial. Continued
and elevated collaboration with SPL and SPL lessees could result in improved management of
SPL-owned lands in the sage-grouse range of SD.
Multiple sage-grouse management resources exist with no reference superseding another as
science and information continually evolve. As such, it is recommended that components are
used from the Sage-grouse National Technical Team (NTT) habitat-related conservation
measures (Sage-grouse National Technical Team 2011), the COT conservation measures
(USFWS 2013), and the Range-wide Interagency Sage-grouse Conservation Team (RISCT)
Near-term Greater Sage-grouse Conservation Action Plan conservation actions (Range-wide
Interagency sage-grouse conservation team 2012) to implement sage-grouse conservation. These
documents will be used to guide voluntary, incentive-based, and policy-related habitat
management within sage-grouse core areas where appropriate and practical.
Sage-grouse local working groups which include a partnership among private landowners,
wildlife biologists, policy makers, and other stakeholders with a common goal of conserving
sage-grouse and their habitats have been successful in many western states. The first meeting of
the SD sage-grouse local working group occurred in September 2013. There is an opportunity to
expand and strengthen the working group to include more stakeholders, especially private
landowners.
There is an opportunity to continue the tradition of sage-grouse hunting by tailoring regulations
in response to the annual population status. A conservative and science-based approach to
harvest management can balance hunting opportunity with population sustainability. A specific
adaptive harvest strategy is outlined in detail in this management plan. Finally, outreach and
education is crucial to assure all stakeholders are aware and informed of issues facing sage-
grouse conservation.
- 27 -
Figure 7. Producing oil wells in South Dakota 1954 – 2013 (SD DENR 2014). In 2013, 156 of the
producing oil wells were in Harding County.
Figure 8. Producing gas wells in South Dakota 1979 – 2013 (SD DENR 2014). In 2013, all producing
gas wells in South Dakota were in Harding County.

- 28 -
Figure 9. Relation of producing oil and gas wells to sage-grouse core areas in South Dakota.
- 29 -
Figure 10. Subsurface mineral ownership in relation to sage-grouse core areas in northwestern South
Dakota. Only state-owned mineral rights in Butte and Harding counties are shown. All areas in white
indicate privately-owned subsurface mineral rights. State-owned mineral rights were manually digitized
by the South Dakota Department of Game, Fish and Parks from legal descriptions provided by the South
Dakota Office of School and Public Lands. Federal mineral rights boundaries were provided by Bureau
of Land Management Montana State Office.
- 30 -
Table 4. Subsurface mineral ownership acreage in South Dakota sage-grouse core areas.
Acres % of Total
State
Leased 101,254 10.30%
Unleased 83,347 8.48%
Total 184,601 18.78%
Federal
Total 414,452 42.17%
Private
Total 383,781 39.05%
Grand Total 982,834
- 31 -
Figure 11. Wind power classification in relation to South Dakota sage-grouse core areas (National
Renewable Energy Laboratory 2012).
- 32 -
Figure 12. Comparison of number of coyotes and red fox removed by aerial gunning by the Multi-
County Predator Control District in Lawrence, Butte, Harding, and Meade counties and male sage-grouse
per lek counted 1990 – 2013. The Multi-County Predator Control District indicates that a vast majority of
the animals taken were in Butte and Harding counties and that red fox records from the early 1990s may
have included non-aerial removal efforts and may have included pups.
GOAL, OBJECTIVES AND STRATEGIES
GUIDANCE
Several recent range-wide sage-grouse planning documents were used to guide the development
of this state-specific management plan. Implementation of this state-specific plan will assure
range-wide planning and conservation efforts are coordinated. Specifically, the RISCT Near-
term Greater Sage-grouse Conservation Action Plan, the NTT Report on National Greater Sage-
Grouse Conservation Measures, the Sage-Grouse COT Sage-grouse Conservation Objectives
Report, the Western Association of Fish and Wildlife Agencies (WAFWA) Greater Sage-grouse
Comprehensive Conservation Strategy, and the United States Fish and Wildlife Services Listing
Decision (USFWS 2010) were used to develop objectives and strategies.
GOAL
Maintain a sustainable sage-grouse population primarily by protecting, enhancing, and
establishing sage/steppe habitat.

- 33 -
OBJECTIVE 1: Maintain or increase/improve the existing status and range of sage/steppe
habitat in SD.
STRATEGIES
1.1 Provide financial and technical assistance through the SD GFP private lands habitat
program for sage/steppe habitat enhancement or establishment.
1.1a By the end of 2014, develop a brochure which outlines specifically how the SD
GFP private lands habitat program can be used to establish or enhance sage-
grouse habitat on private and select public lands.
1.2 Continually use results from the recent sagebrush mapping project (Wright and Wegner
2007) to identify and target potential areas for sagebrush restoration.
1.2a Continually seek out funding sources to expand the sagebrush mapping project
(Wright and Wegner 2007) to all land ownerships within the entire sage-grouse
range in SD.
1.3 The SD GFP recommends the use of, or parts thereof, the WAFWA Greater Sage-grouse
Comprehensive Conservation Strategy, the Sage-grouse NTT habitat-related conservation
measures, the COT conservation measures, and the RISCT Near-term Greater Sage-
grouse Conservation Action Plan conservation actions as they all provide sources of
guidance. These documents will be used to guide voluntary, incentive-based, and policy-
related habitat management within sage-grouse core areas where appropriate and
practical.
1.3a Integrate conservation measures and actions from documents listed in Strategy 1.4
into SD GFP produced environmental review documents for proposed projects
within sage-grouse core areas where SD GFP has the opportunity to provide a
review.
1.3b Use conservation measures and actions from the referenced documents in Strategy
1.4 to make recommendations to policy makers on regulatory mechanisms that
could reduce negative impacts to sage-grouse habitat.
1.4 Continue to support the NRCS Sage-Grouse Initiative by collaborating with the
development and annual review of threat checklists, approved practice lists
ranking criteria, and constraints for implementing conservation practices for program
applications.
1.5 Maintain existing partnership with NRCS and other conservation organizations such as
Pheasants Forever to fund Farm Bill Biologist position in SD NRCS field offices
focusing on the implementation of available practices in the Sage Grouse Initiative.

- 34 -
1.6 Using the Belle Fourche Farm Bill Biologist, offer to conduct rangeland assessments and
write conservation plans for SPL and SPL lessees for SPL-owned lands within core areas.
1.6a Encourage SPL and SPL Lessees to implement conservation plans developed
under Strategy 1.7.
1.6b Encourage SPL to inform lessees of programs available through the
NRCS’s Sage-Grouse Initiative.
1.7 Advocate for current and future USDA Farm Bill programs and policies in the
Commodities, Conservation, Energy, and Crop Insurance titles that incentivize native
grassland preservation, protection, and enhancement.
1.8 Advocate for land use policies and procedures, including local zoning and property tax
assessment, which preserve and protect native grassland functions and values in a fair and
equitable manner. Note, the South Dakota legislature created the Agricultural Land
Assessment Implementation and Oversight Advisory Task Force to provide guidance to
the Department of Revenue on the implementation of the productivity system of
assessing agricultural land. The Task Force holds meetings during the legislature’s
interim calendar to review assessment information and make recommendations to the
legislature for potential revisions to the productivity system.
1.9 Use recent research in SD and other published literature to guide habitat management of
SD GFP owned land within the sage-grouse range.
1.10 Annually monitor oil, gas, and other mineral development and status (leased vs.
unleased) of mineral activities within sage-grouse core areas.
1.11 By January 2015, establish a memorandum of understanding with SPL to standardize a
procedure for SD GFP to review new applications for oil and gas leases for SPL-owned
mineral rights within sage-grouse core areas.
1.12 By January 2015, utilize an agreed upon process whereby the SD DENR notifies the SD
GFP of new applications for oil and gas drilling permits and provides GFP the
opportunity to share with and recommend management strategies to permit applicants.
1.13 By January 2015, establish an internal process to evaluate and provide management
recommendations on wind energy projects. In South Dakota, wind farm projects greater
than 100 megawatts require a permit issued by the SD PUC per SDCL 49-41B (including
a terrestrial ecosystem evaluation; administrative rule 20:10:22:16). Projects less than
100 megawatts do not require a permit but are submitted to the PUC for informal
purposes (SDCL 49-41B-25.1).
1.14 Implement measures to prevent destructive wildfires within the occupied sage-grouse
range during the firearm antelope hunting season when fire danger is high. Measures
may include aerial monitoring to quickly identify and respond to wildfires and
- 35 -
mobilization of firefighting equipment including air tankers to increase firefighting
readiness. Press releases will also be used to inform hunters and members of the public
of elevated fire risk situations and ways to prevent wildfires.
OBJECTIVE 2: Annually monitor sage-grouse population status and distribution.
STRATEGIES
2.1 Annually conduct lek counts on “priority leks” using standard protocol. Priority leks are
a selected subset of leks which are counted annually and used to determine changes in
population status.
2. 2 Survey historic, recently inactive, and non-priority leks every 2-4 years to document their
status.
2.3 Use aircraft to search for new leks or to aid in the implementation of Strategy 2.2.
2.4 By July 2015, develop an annual survey to be sent to all producers within the SD sage-
grouse range which will gather information related to local factors which could influence
sage-grouse populations or habitat. The survey will also gather information related to
potential lek locations unknown to the SD GFP.
OBJECTIVE 3: Use results from lek counts and inference from past hunting seasons to guide
recommendations for the annual hunting season.
STRATEGIES
3.1 Recommend a hunting season based on season recommendation matrix in Table 3.
3.2 Monitor annual sage-grouse harvest via hunter check stations and field interviews.
3.2a By the end of 2015, explore the feasibility of requiring a special permit to hunt
sage-grouse so a more confident measure of the number of hunters and harvest
can be attained.
OBJECTIVE 4. Develop a public outreach and educational plan that informs the public,
landowners, stakeholders, and wildlife/conservation agencies on sage grouse
management and the issues of highest concern.
STRATEGIES
4.1 By the end of 2015 write and distribute an informational brochure for the public
emphasizing sage grouse habitat requirements, management options, and greatest risks to
future populations.

- 36 -
4.2 Provide timely information updates on sage-grouse and sagebrush habitat through
popular articles found in the SD Conservation Digest, local newspapers, and other media.
4.3 By the end of 2015, translate scientific data and reports into public friendly brochures
that can provide helpful and useful management options to landowners and agency
personnel.
4.4 By the end of 2015, provide updated sage-grouse management information and issues of
concern impacting populations on the SD GFP web page under the small game section.
OBJECTIVE 5: Support local, interstate and interagency sage-grouse research projects
and collaborative conservation planning efforts.
STRATEGIES
5.1 Continue to have the senior upland game biologist serve on the WAFWA Sage and
Columbian Sharp-tailed Grouse Subcommittee and the Range-wide Interagency Sage-
grouse Conservation Team and attend the SD sage-grouse local working group meetings.
5.2 Provide state-specific data (e.g. lek counts, harvest data, feathers for genetic analyses) for
use in collaborative research or assessment projects.
5.3 Collaborate with the BLM on sage-grouse management, particularly during the
development and revision of resource management plans, allotment management plans,
and other resource use and management planning efforts conducted through BLM.
5.4 Participate in the BLM’s National Sage-grouse Planning Strategy.
5.5 Annually develop and prioritize a list of state-specific research needs and apply for
funding opportunities when available.
5.6 Continue to collaborate with WAFWA and the WGA on sage-grouse issues.
OBJECTIVE 6. Document disease outbreaks and develop management responses.
STRATEGIES
6.1 Annually document reports of sage-grouse mortalities where disease may be the cause of
death and when possible, test for WNV or other diseases.
6.2 Explore the development of a research project to determine the distribution, abundance,
preferred breeding habitats, and preferred weather conditions for Culex tarsalis
mosquitos in Butte and Harding counties.
6.3 Use results from research to develop management recommendations which could reduce
Culex tarsalis mosquito abundance and subsequent WNV outbreaks.

- 37 -
LITERATURE CITED
Aldridge, C. L., S. E. Nielsen, H. L. Beyer, M. S. Boyce, J. W. Connelly, S. T. Knick, and M. A.
Schroeder. 2008. Range-wide patterns of greater sage-grouse persistence. Diversity and
Distributions 14:983–994.
Aldridge, C. L. and M. S. Boyce. 2007. Linking occurrence and fitness to persistence: habitat
based approach for endangered greater sage-grouse. Ecological Applications 17:508–
526.
Anderson, D. R. 2001. The need to get the basics right in wildlife field studies. Wildlife
Society Bulletin 29:1294-1297.
Baumgardt, J. A. 2011. Probability of attendance and sightability of greater sage-grouse on
leks: relating lek-based indices to population abundance. Ph.D. Dissertation. University
of Idaho.
Berry, J. D. and R. L. Eng. 1985. Interseasonal movements and fidelity to seasonal use areas by
female sage-grouse. Journal of Wildlife Management 49:237-240.
Blickley, J. L., D. Blackwood, and G. L. Patricelli. 2012. Experimental evidence for the effects
of chronic anthropogenic noise on abundance of greater sage-grouse at leks.
Conservation Biology 26:461-471.
Blickley, J. L. and G. L. Patricelli. 2012. Potential acoustic masking of greater sage-grouse
(Centrocercus urophasianus) display components by chronic industrial noise. 2012.
Ornithological Monographs 74:23-35.
Bush, K. L. Genetic diversity and paternity of endangered Canadian greater sage-grouse
(Centrocercus urophasianus). 2009. Ph.D. Dissertation, University of Alberta,
Edmonton, Alberta. 202 pp.
Connelly, J. W., S. T. Knick, M. A. Schroeder, and S. J. Stiver. 2004. Conservation Assessment
of Greater Sage-grouse and Sagebrush Habitats. Western Association of Fish and
Wildlife Agencies. Cheyenne, Wyoming.
Connelly, J. W., K. P. Reese, and M. A. Schroeder. 2003. Monitoring of greater sage-grouse
habitats and populations. Experiment Station Bulletin 80, University of Idaho, Moscow.
Connelly, J. W., M. A. Schroeder, A. R. Sands, and C. E. Braun. 2000. Guidelines to manage
Sage-grouse populations and their habitats. Wildlife Society Bulletin 28:967-985.
Connelly, J. W., and C. E. Braun. 1997. Long-term changes in sage-grouse Centrocercus
urophasianus populations in western North America. Wildlife Biology 3:229-234.
- 38 -
Crawford, J. A., R. A. Olson, N. E. West, J. C. Mosley, M. A. Schroeder, T. D. Whitson, R. F.
Miller, M. A. Gregg, and C. S. Boyd. 2004. Ecology and management of sage-grouse
and sage-grouse habitat. Journal of Range Management 57:2-19.
Dalke, P. D., D. B. Pyrah, D. C. Stanton, J. E. Crawford, and E. F. Schlatterer. 1963. Ecology,
productivity, and management of sage-grouse in Idaho. Journal of Wildlife Management
27:811-841.
Doherty, K. E., J. D. Tack, J. S. Evans, and D. E. Naugle. 2010. Mapping breeding densities of
greater sage-grouse: A tool for rangewide conservation planning. BLM completion
report. 29 pp.
Duvuvuei, O. V. 2013. Vital rates, population trends, and habitat-use patterns of a translocated
greater sage-grouse population: implications for future translocations. M.S. Thesis, Utah
State University, Logan.
Drut, M. S., W. H. Pyle, and J. A. Crawford. 1994. Diets and food selection of sage-grouse
chicks in Oregon. Journal of Range Management 47:90-93.
Foster, M. A., J. T. Ensign, W. N. Davis, and D. C. Tribby. 2014. Greater sage-grouse in the
southeast Montana sage-grouse core area. Final Report. Montana Fish, Wildlife and
Parks and United States Department of the Interior Bureau of Land Management.
Gibson, R. M., V. C. Bleich, C. W. McCarthy, and T. L. Russi. 2013. Hunting lowers
population size in greater sage-grouse. Pp. 307 – 315 in B. K. Sandercock, K. Martin,
and G. Segelbacher (editors). Ecology, Conservation, and Management of Grouse.
Studies in Avian Biology 39. University of California Press, Berkley.
Gregg, M. A., M. R. Dunbar, and J. A. Crawford. 2007. Use of implanted radiotransmitters to
estimate survival of greater sage-grouse chicks. Journal of Wildlife Management 71:646-
651.
Hagen, C. A. 2011. Greater sage-grouse conservation assessment and strategy for Oregon: a
plan to maintain and enhance populations of habitat. Oregon Department of Fish and
Wildlife, Salem.
Hagen, C. and T. M. Loughin. 2008. Productivity estimates from upland bird harvest:
estimating variance and necessary sample sizes. Journal of Wildlife Management
72:1369–1375.
Hodorff, B. 2013. Biological assessment and evaluation for the range allotment management
plan in the Fall River West and Oglala geographic areas. United States Department of
Agriculture, Forest Service.
Holloran, M. J. 1999. Sage-grouse (Centrocercus urophasianus) seasonal habitat use near
Casper, Wyoming. M.S. Thesis, University of Wyoming, Laramie.
- 39 -
Holloran, M. J. 2005. Greater sage-grouse (Centrocercus urophasianus) population response to
natural gas field development in western Wyoming. Dissertation, University of
Wyoming, Laramie.
Hornaday, W. T. 1916. Save the sage grouse from extinction: a demand from civilization to the
western states. New York Zoological Park Bulletin 5:179-219.
Hulet B. V. 1983. Selected responses of sage-grouse to prescribed fire, predation and grazing
by domestic sheep in southeastern Idaho. M.S. Thesis, Brigham Young University,
Provo, UT.
Johnson, G. D. and M. S. Boyce. 1990. Feeding trials with insects in the diet of sage-grouse
chicks. Journal of Wildlife Management 54:89-91.
Kaczor, N. W. 2008. Nesting and brood-rearing success and resource selection of greater sage-
grouse in northwestern South Dakota. M. S. Thesis, South Dakota State University,
Brookings.
Knick, S. T. 2011. Historical development, principal federal legislation, and current
management of sagebrush habitats. Pp. 13-31 in S. T. Knick and J. W. Connelly
(editors). Greater Sage-Grouse: ecology and conservation of a landscape species and its
habitat. Studies in Avian Biology 38. University of California Press, Berkeley.
Knick S. T. and J. W. Connelly (editors). 2011. Greater Sage-Grouse: ecology and conservation
of a landscape species and its habitat. Studies in Avian Biology 38. University of
California Press, Berkeley.
Knick, S. T., S.E. Hanser, R. F. Miller, D. A. Pyke, M. J. Wisdom, S. P. Finn, E. T. Rinkes, and
C. J. Henny. 2011. Ecological influence and pathways of land use in sagebrush. Pp.
203-251 in S. T. Knick and J. W. Connelly (editors). Greater Sage-Grouse: ecology and
conservation of a landscape species and its habitat. Studies in Avian Biology 38.
University of California Press, Berkeley.
Leu, M. and S. E. Hanser. 2011. Influences of the human footprint on sagebrush landscape
patterns. Pp. 253-271 in S. T. Knick and J. W. Connelly (editors). Greater Sage-Grouse:
ecology and conservation of a landscape species and its habitat. Studies in Avian
Biology 38. University of California Press, Berkeley.
Levi, T and C. C. Wilmers. 2012. Wolves-coyotes-foxes: a cascade among carnivores. Ecology
93:921-929.
Lewis A. R. 2004. Sagebrush steppe habitats and their associated bird species in South Dakota,
North Dakota, and Wyoming: life on the edge of the sagebrush ecosystem. Ph.D.
Dissertation, South Dakota State University, Brookings.
- 40 -
Mezquida, E. T., S. J. Slater, and C. W. Benkman. 2006. Sage-grouse and indirect interactions:
potential implications of coyote control on sage-grouse populations. Condor 108:747-
759.
Miller, R. F. and L. Eddleman. 2001. Spatial and temporal changes of sage grouse habitat in the
sagebrush biome. Technical Bulletin 151. Oregon State University Agricultural
Experiment Station, Corvalis.
National Agricultural Statistics Service. United States Department of Agriculture. 2013
Cropland Data Layer. Accessed 10/24/14.
National Renewable Energy Laboratory. 2012. Wind Data.
http://www.nrel.gov/gis/data_wind.html. Accessed 11/8/12.
Naugle, D. E., K. E. Doherty, B. L. Walker, M. J. Holloran, and H. E. Copeland. 2011. Energy
development and greater sage-grouse. Pp. 489-503 in S. T. Knick and J. W. Connelly.
Greater Sage-Grouse: ecology and conservation of a landscape species and its habitat.
Studies in Avian Biology 38. University of California Press, Berkeley.
NatureServe. 2012. NatureServe Explorer: An online encyclopedia of life [web application].
Version 7.1. NatureServe, Arlington, Virginia. Available at
http://www.natureserve.org/explorer. (Accessed: 11/29/12).
Nelson, B. A. 1955. Some interesting facts about our pheasants and sage-grouse seasons. South
Dakota Conservation Digest 22:2-4.
Over, W. H., and C. S. Thoms. 1921. Birds of South Dakota. Bulletin 9. University of South
Dakota, Vermilion.
Patterson, R. L. 1952. The sage-grouse in Wyoming. Wyoming Game and Fish Commission
and Sage Books, Inc., Denver, Colorado.
Pechanec, J. F. 1965. Sagebrush control on rangelands. United States Department of
Agriculture Handbook No. 277. US Department of Agriculture, Washington, DC.
Podoll, E. 1957. Sage Grouse Hunting Season, 1955. Completion Report. Project W-17-R-11.
Department of Game, Fish, and Parks.
Range-wide Interagency Sage-grouse Conservation Team. 2012. Near-term greater sage-grouse
conservation action plan.
Reese, K. P. and J. W. Connelly. 2011. Harvest management of greater sage-grouse. Pp. 101-
111 in S. T. Knick and J. W. Connelly. Greater Sage-Grouse: ecology and conservation
of a landscape species and its habitat. Studies in Avian Biology 38. University of
California Press, Berkeley.
- 41 -
Reese, K. P. and R. T. Bowyer (editors). 2007. Monitoring populations of sage-grouse. College
of Natural Resources Experiment Station Bulletin 88. University of Idaho, Moscow.
Sage-grouse National Technical Team. 2011. A report on national greater sage-grouse
conservation measures.
Schneegas, E. R. 1967. Sage-grouse and sagebrush control. Transactions of the North
American Wildlife and Natural Resources Conference 32:270-274.
Schroeder, M. A., C. L. Aldridge, A. D. Apa, J. R. Bohne, C. E. Braun, S. D. Bunnell, J. W.
Connelly, P. A. Deibert, S. C. Gardner, M. A. Hilliard, G. D. Kobriger, S. M. McAdam,
C. W. McCarthy, J. J. McCarthy, D. L. Mitchell, E. V. Rickerson, and S. J. Stiver. 2004.
Distribution of sage-grouse in North America. Condor 106:363-376.
Schroeder, M. A., J. R. Young, and C. E. Braun. 1999. Sage-grouse (Centrocercus
urophasianus). No. 425 in: The birds of North America, A. Poole, and F. Gill, editors.
The Academy of Natural Sciences, Philadelphia, Pennsylvania; The American
Ornithologists' Union, Washington, D.C.
Sedinger, J. S. 2007. Improving understanding and assessment of greater sage-grouse
populations. Pp 43-56 in K. P. Reese and R. T. Bowyer. Monitoring Populations of
sage-grouse. College of Natural Resources Experiment Station Bulletin 88. University
of Idaho, Moscow.
Smith, J. T., L. D. Flake, K. F. Higgins, G. D. Kobriger, and C. G. Homer. 2005. Evaluating lek
occupancy of greater sage-grouse in relation to landscape cultivation in the Dakotas.
Western North American Naturalist 65:310-320.
Smith, J. T., L. D. Flake, K. F. Higgins, and G. D. Kobriger. 2004. History of greater sage-
grouse in the Dakotas: Distribution and population trends. Prairie Naturalist 36:213-230.
Smith, J. 2003. Greater sage grouse on the edge of their range: leks and surrounding landscapes
in the Dakotas. M. S. Thesis, South Dakota State University, Brookings.
South Dakota Department of Game, Fish and Parks. 2006. South Dakota Comprehensive
Wildlife Conservation Plan. South Dakota Dept. of Game, Fish and Parks, Pierre,
Wildlife Division Report 2006-08.
South Dakota Department of Environment and Natural Resources, Minerals and Mining
Program. 2014. Oil and Gas Production. http://denr.sd.gov/des/og/producti.aspx.
Accessed 5/16/2014.
South Dakota Department of Environment and Natural Resources, Minerals and Mining
Program. 2014. Oil and Gas Drilling Permits.
http://denr.sd.gov/des/og/newpermit.aspx. Accessed 10/27/2014.

- 42 -
Stevens, B. S. 2011. Impacts of Fences on Greater Sage-Grouse in Idaho: Collision, Mitigation,
and Spatial Ecology. Thesis, University of Idaho, Moscow.
Stevens, B. S., D. E. Naugle, B. Dennis, J. W. Connelly, T. Griffiths, and K. P. Reese. In Press.
Mapping sage-grouse fence-collision risk: Spatially-explicit models to target
conservation implementation. Wildlife Society Bulletin.
Swanson, C. C. 2009. Ecology of greater sage-grouse in the Dakotas. Ph.D. Dissertation, South
Dakota State University, Brookings.
Tweit, S. J. 2000. The next spotted owl. Audubon 102:64-70.
U. S. Fish and Wildlife Service. 2010. 50 CFR Part 17 Endangered and threatened wildlife and
plants; 12-month findings for petitions to list the greater sage-grouse (Centrocercus
urophasianus) as threatened or endangered. Proposed Rule. 105 pp.
U.S Fish and Wildlife Service. 2013. Greater Sage-grouse (Centrocercus urophasianus)
Conservation Objectives: Final Report.
Vale, T. R. 1974. Sagebrush conversion projects: an element of contemporary environmental
change in the western United States. Biological Conservation 6:274-284.
Visher, S. S. 1914. A preliminary report on the Biology of Harding County, northwestern South
Dakota. United States Geological Survey, South Dakota Geological Survey Bulletin 6.
Walker B. L. and D. E. Naugle. 2011. West Nile virus in sagebrush habitat and impacts on
greater sage-grouse populations. Pp. 127-142 in S. T. Knick and J. W. Connelly. Greater
Sage-Grouse: ecology and conservation of a landscape species and its habitat. Studies in
Avian Biology 38. University of California Press, Berkeley.
Walsh, D. P., G. C. White, T. E. Remington, and D. C. Bowden. 2004. Evaluation of the lek-
count index for greater sage-grouse. Wildlife Society Bulletin 32:56-68.
Western Association of Fish and Wildlife Agencies (WAFWA). 2008. Greater sage-grouse
population trends: An analysis of lek count databases 1965-2007. Sage and Columbian
Sharp-tailed grouse Technical Committee, WAFWA. 126 pp.
Wisdom, M. J., C. W. Meinke, S. T. Knick, and M. A. Schroeder. 2011. Factors associated with
extirpation of sage-grouse. Studies in Avian Biology 38:451-474.
Wright, P. and D. Wegner. 2007. Mapping sagebrush for sage-grouse habitat in Butte and
Harding Counties, South Dakota. Technical Memorandum No. 86-68260-08-01. Science
Applications International Corporation under contract with the Bureau of Reclamation.
Final Report. 35pp.

- 43 -
Young, J. A., R. A. Evans, and P.T. Tueller. 1976. Great Basin plant communities-pristine and
grazed. Pp. 187-215 in R. Elston and P. Headrick (eds). Holocene environmental
change in the Great Basin. Nevada Archaeological Survey, Research Paper 6, University
of Nevada, Reno, NV.