safety of investment grade bonds - asset dedication · safety of investment grade bonds ... asset...
TRANSCRIPT

Safety of Investment Grade Bonds Examining Credit Ratings and Default Rates of
Municipal and Corporate Bonds
Asset Dedication White Paper Series* February 2011
Stephen J. Huxley, Ph.D.
Chief Investment Strategist, Asset Dedication, LLC
Professor of Analytic Modeling, University of San Francisco
Brent Burns
President, Asset Dedication, LLC
Executive Summary
With a few alarmists calling for a massive increase in municipal bond defaults and many
investors still stinging from the Lehman Bros. bond defaults, should investors be worrying about
their bonds? High quality municipal and corporate bonds have long been considered “safe”
asset classes. Volatility in the stock market is enough to keep many investors up at night and
now many may be losing sleep over their bonds too. This paper takes an historical look at the
risks and relative safety of high quality municipal and corporate bonds. We will show that
although investors need to carefully analyze their bond investments, they can still rely on high
rated investment grade bonds to deliver predictable income and relative stability in their
portfolios.
*Asset Dedication is affiliated with BondDesk Group LLC, owner of BondDesk Trading LLC, a leading fixed-income electronic trading platform, and one of the largest market destinations for trading odd-lot fixed income securities in the U.S.
Engineered Retirement Income

© Asset Dedication, 2011 For Advisor Use Only 2
Credit Ratings and Default Rates
CONTENTS
Section Page
Introduction 3
Bond Default 4
Municipal Bonds 6
Comparing Corporate and Municipal Bonds 11
Risk Premiums 14
Managing Risks 15
Conclusion 16
Appendix 17
Moody‟s Long Term Municipal Obligation Ratings Definitions 18
Moody‟s Long-Term Corporate Obligation Ratings Definitions 19
Equivalent Credit Ratings by Different Companies 20
Comparing Moody‟s and S&P Default Rates 21

© Asset Dedication, 2011 For Advisor Use Only 3
Credit Ratings and Default Rates
Introduction
The incidence of default for high quality municipal and corporate bonds is generally very low.
99.97% of all Aaa and Aa rated municipal bonds and 98.96% similarly rated corporate bonds
have generated coupon payments and redemptions as promised over the past 40 years without
a single missed or even late payment.
There are, however, rare periods when default rates see a significant spike. Following
economic crises like the Great Depression, bond issuers have experienced much higher. The
bond markets now have much greater transparency and there are modern safeguards to help
protect investors from widespread defaults.
With yields at historic lows, investors seeking slightly higher yield may be willing to accept the
slightly higher risk of municipal or corporate bonds. In this paper, we examine default and
recovery data and revisit the historical record to uncover the risks associated with high quality
municipal and corporate bonds. The credit rating agencies Moody‟s, Standard and Poors (S&P)
and Fitch have evaluated default rates and recovery and provide insight into the impact that
economic shocks have on bonds of various quality ratings.
We find a significant difference in the safety of municipal bonds compared to corporate bonds.
Although municipal bonds are generally much safer than corporate bonds, they are not without
risk. Furthermore, they have had isolated periods with much higher than average default rates.
We will show that credit quality is the most important decision for bond investors looking to
benefit from the tax advantage of municipal bonds or relative higher yields on corporate bonds.
Bonds with higher credit quality tend to be stronger financially and have more room to slide
before becoming distressed. They also tend to recover quicker in the event of default.
Since bonds are thought of as a safe asset class, investors expect their bond investments to
provide stability to their overall portfolio. For investors using an income-matching strategy, they
also expect bonds to deliver predictable income. In fact, the mathematical precision of an
income-matching strategy hinges on bond issuers making their coupon and principal payments
on time. Bond investors, especially those looking for income, must evaluate the risks that
default can have on their portfolio, whether using municipal or corporate bonds.

© Asset Dedication, 2011 For Advisor Use Only 4
Credit Ratings and Default Rates
Bond Default
Bonds, whether issued by a corporation or a government entity, represent legal obligations to
pay the investor coupon interest and return the face value of the bond at maturity. A bond is
said to be in default if either the principal or interest payments are not paid when due. Default,
however, does not necessarily mean the investor loses the entire investment. Complete loss is
actually a rare event as even bonds in default usually have some sort of salvage value. Default
simply means that the exact conditions for payments have not been met as originally promised.
Not all bonds are subject to default risk. Treasury bonds (Treasuries), are considered be
essentially free from default risk because the federal government is can always print more
money to pay investors. FDIC insured certificates of deposit (CDs) are “backed by the full faith
and credit of the United States government.”1 US Agency bonds (agencies) have a similar
implied backing of the government.
Typically, investors approach their decision to use municipal bonds differently than corporate
bonds. Municipal bonds are used in taxable accounts if they provide superior after-tax income
as compared to Treasuries and other safe investments like CDs and agencies. This is primarily
a tax-planning decision. Corporate bonds, on the other hand, are selected simply for their
higher relative returns.
Municipal and Corporate Bond Default Rates
Historically, defaults on investment grade bonds are rare for both municipal and corporate
bonds. Table 1 shows the default rates of municipal bonds compared to corporate bonds over
the same time period, 1970-2009. As can be seen, no Aaa municipal bonds and only 0.5% of
Aaa corporate bonds defaulted with 10 years. Examining Table 1 reveals that portfolios
consisting of Aaa and Aa bonds have a very low probability of default.
Table 1. Average Cumulative Bond Default Rates at Various Years, 1970-20092
RATING 1 2 3 4 5 6 7 8 9 10
Mu
nic
ipal
Bo
nd
s Aaa 0.00% 0.00% 0.00% 0.00% 0.00% 0.00% 0.00% 0.00% 0.00% 0.00% In
ves
tme
nt
Gra
de
Aa 0.00% 0.00% 0.01% 0.01% 0.01% 0.02% 0.02% 0.02% 0.03% 0.03%
A 0.00% 0.00% 0.01% 0.01% 0.01% 0.01% 0.02% 0.02% 0.02% 0.03%
Baa 0.01% 0.02% 0.04% 0.06% 0.08% 0.10% 0.11% 0.13% 0.14% 0.16%
Ba 0.22% 0.71% 1.06% 1.33% 1.57% 1.91% 2.27% 2.52% 2.71% 2.80%
No
t
Inv
es
tme
nt
Gra
de
B 3.65% 6.00% 7.88% 9.91% 11.73% 12.40% 12.40% 12.40% 12.40% 12.40%
Caa-C 7.07% 8.97% 11.03% 11.60% 11.60% 11.60% 11.60% 11.60% 11.60% 11.60%
Co
rpo
rate
Bo
nd
s Aaa 0.00% 0.01% 0.01% 0.04% 0.11% 0.17% 0.25% 0.32% 0.41% 0.50% In
ves
tme
nt
Gra
de
Aa 0.02% 0.06% 0.09% 0.16% 0.23% 0.31% 0.38% 0.45% 0.49% 0.54%
A 0.05% 0.17% 0.34% 0.52% 0.72% 0.94% 1.18% 1.46% 1.76% 2.05%
Baa 0.18% 0.49% 0.91% 1.40% 1.93% 2.47% 3.00% 3.53% 4.15% 4.85%
Ba 1.17% 3.19% 5.58% 8.12% 10.40% 12.49% 14.32% 16.15% 18.03% 19.96%
No
t
Inv
es
tme
nt
Gra
de
B 4.55% 10.43% 16.19% 21.26% 25.90% 30.30% 34.47% 38.11% 41.42% 44.38%
Caa-C 17.72% 29.38% 38.68% 46.09% 52.29% 56.62% 59.77% 63.56% 67.42% 71.38%
1 www.fdic.gov

© Asset Dedication, 2011 For Advisor Use Only 5
Credit Ratings and Default Rates
In comparing the riskiness of municipal and corporate bonds, at least in terms of expected
default, municipal bonds can be considered much safer than equally rated corporate bonds.
According the rating agency Moody‟s, there have been only 54 defaults by municipal bond
issuers since 1970. Research firm Robini Global Economics estimates the size of the U.S.
municipal bond market to be $2.7 trillion. On the other hand, there were 191 defaults by
corporate bond issuers in 2009 alone. According the Fitch, the size of the US corporate bond
market is about $4 trillion.
Default and Recovery
On the rare occasions when defaults do occur, it is important to note how much investors may
lose. Over time, bond issuers, municipal or corporate, may face times of financial distress and
are forced to default on their obligations. Default can range from as simple as making a single
late coupon payment, to renegotiating principal repayment to declaring bankruptcy.
That means investors do not usually lose all of their money. Table 2 compares average
recovery rates for municipal and corporate bonds. The contrast between the bond types is
clear. In the event of a default, corporate bond investors can expect to recover a little more than
half of what municipal bond investors could recover. Full recovery, where issuers simply get
caught up on coupon payments and continue to make payments on time, occurs for about 20
percent of municipal defaults and 11 percent of corporate defaults.
Table 2.
Average Bond Default Recovery
30-Days
post default
Ultimate
Recovery
Municipal Bonds3 59.9% 67.0%
Corporate Bonds4 31.0% 41.0%
3 Moody’s U.S. Municipal Bond Defaults and Recoveries, 1970-2009
4 Moody’s Corporate Default and Recovery Rates, 1920-2009

© Asset Dedication, 2011 For Advisor Use Only 6
Credit Ratings and Default Rates
Taxable Equivalent Yield Calculation
R(te) =
R(te) = taxable equivalent yield to the investor
R(tf) = tax-free yield (municipal bond yield to
maturity)
t = investor's marginal tax rate
5.62% =
Municipal Bonds
There are more than 60,000 issuers of tax-exempt municipal bonds, including state and local
governments, plus various non-profit organizations such as hospitals and universities. These
issuers range from the large and well known, such as the state of California, to small school
districts in rural areas. A 2004 study by the SEC found that about 74 percent of municipal bond
issues are for $1 million or less.5
Municipal bonds can generally be categorized as either general obligation (GO) or revenue
bonds. GO bonds are backed by the taxing power of the issuing government and generally
viewed as the safest of municipal bonds, along with revenue bonds that are backed by the
ratepayers of public water and sewer utilities. Other revenue bonds, backed by less essential
projects, are less secure.
Tax-free Income
The primary advantage of municipal bonds is tax-free income. Especially for investors in high
tax brackets, their after-tax yield can be much higher than Treasuries, CDs or agencies.
Interest from most types of municipal bonds is exempt from federal income tax. Most states do
not tax interest payments on municipal bonds issued in their state. Alaska, Florida, Indiana,
Nevada, South Dakota, Texas, Washington State and Wyoming do not tax their residents on
interest from other states‟ bonds either.
Currently, municipal bonds are yielding roughly
the same as Treasuries on a before-tax basis,
making municipal bonds particularly attractive.
On a taxable equivalent basis, municipal bonds
have a considerable advantage. For example, if
a 10 year Aaa rated municipal bond has a
nominal yield of 3.65% and the investor‟s
marginal tax rate is 35%, the investor‟s taxable
equivalent yield would be 5.62% (see callout for
the calculation).6
On an after-tax basis, municipal bonds present a substantial yield advantage over Treasuries.
Given that, over the long term, 10-year municipal bonds usually yield only 83% of Treasuries on
a before-tax basis.7 Even if the yield is discounted by the average default rate, municipal bonds
are still superior given the low incidence of defaults since 1970. It would require a period of
higher defaults to dramatically reduce this advantage.
5 SEC Report on Transactions in Municipal Securities, 2004
6 Price quote from February 16, 2011
7 Source: BondDesk Group January 31, 2011
© Asset Dedication, 2011 For Advisor Use Only 7
Credit Ratings and Default Rates
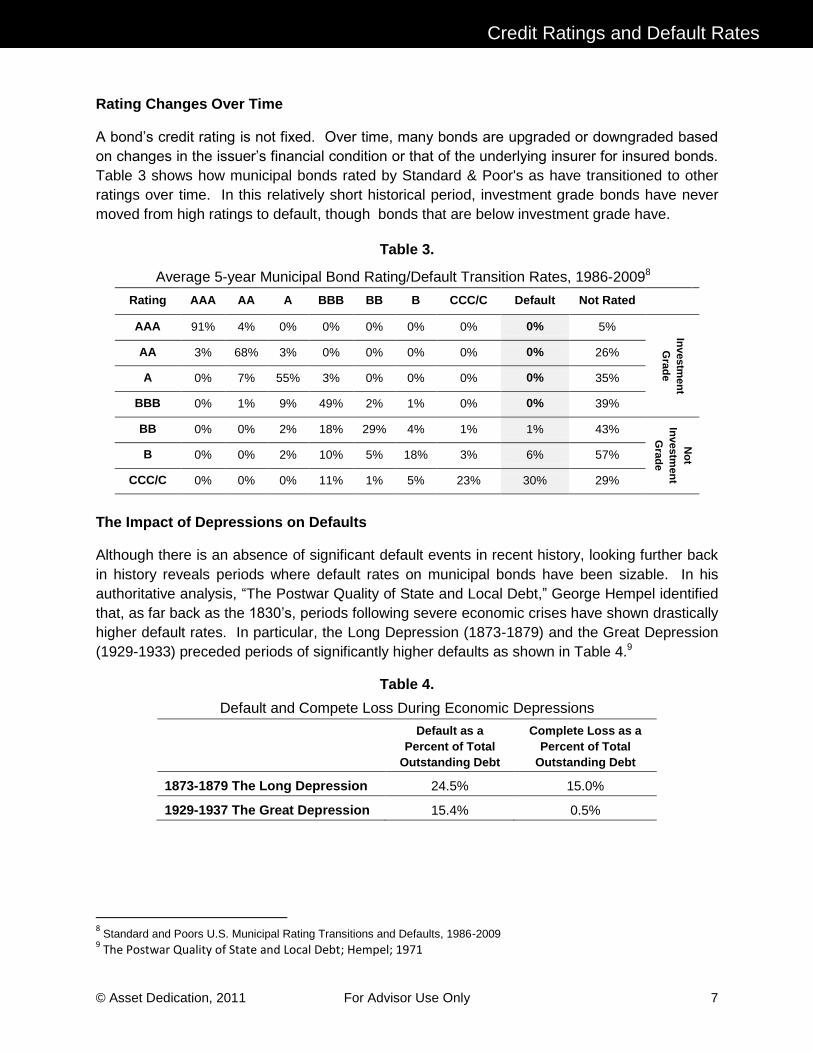
Rating Changes Over Time
A bond‟s credit rating is not fixed. Over time, many bonds are upgraded or downgraded based
on changes in the issuer‟s financial condition or that of the underlying insurer for insured bonds.
Table 3 shows how municipal bonds rated by Standard & Poor's as have transitioned to other
ratings over time. In this relatively short historical period, investment grade bonds have never
moved from high ratings to default, though bonds that are below investment grade have.
Table 3.
Average 5-year Municipal Bond Rating/Default Transition Rates, 1986-20098
Rating AAA AA A BBB BB B CCC/C Default Not Rated
AAA 91% 4% 0% 0% 0% 0% 0% 0% 5%
Inv
estm
en
t
Gra
de
AA 3% 68% 3% 0% 0% 0% 0% 0% 26%
A 0% 7% 55% 3% 0% 0% 0% 0% 35%
BBB 0% 1% 9% 49% 2% 1% 0% 0% 39%
BB 0% 0% 2% 18% 29% 4% 1% 1% 43%
No
t
Inv
estm
en
t
Gra
de
B 0% 0% 2% 10% 5% 18% 3% 6% 57%
CCC/C 0% 0% 0% 11% 1% 5% 23% 30% 29%
The Impact of Depressions on Defaults
Although there is an absence of significant default events in recent history, looking further back
in history reveals periods where default rates on municipal bonds have been sizable. In his
authoritative analysis, “The Postwar Quality of State and Local Debt,” George Hempel identified
that, as far back as the 1830‟s, periods following severe economic crises have shown drastically
higher default rates. In particular, the Long Depression (1873-1879) and the Great Depression
(1929-1933) preceded periods of significantly higher defaults as shown in Table 4.9
Table 4.
Default and Compete Loss During Economic Depressions
Default as a
Percent of Total
Outstanding Debt
Complete Loss as a
Percent of Total
Outstanding Debt
1873-1879 The Long Depression 24.5% 15.0%
1929-1937 The Great Depression 15.4% 0.5%
8 Standard and Poors U.S. Municipal Rating Transitions and Defaults, 1986-2009
9 The Postwar Quality of State and Local Debt; Hempel; 1971

© Asset Dedication, 2011 For Advisor Use Only 8
Credit Ratings and Default Rates
Comparing the Current Economic Crisis to the Great Depression
In assessing the chances of a spike in defaults, a central part of the analysis is to determine
whether the crisis of 2008 was significant enough of an economic event to substantially impair
issuers‟ ability to pay on their obligations. Table 5 compares economic factors in the first three
years of the Great Depression (1929-1931) and the three years following the crisis of 2008
(2008-2010). But for the steep correction in housing prices in 2008, it is clear that to this point in
time the Great Depression was a much more severe economic event. However, since many
municipalities rely on property taxes, the correction in housing could provide enough pressure
on revenues to tip municipalities into default if budgets are not managed prudently.
Table 5.
Comparing The Great Depression and The Current Economic Crisis
1929 1930 1931 2008 2009 2010
S&P 500 Total Return -10.5% -27.9% -43.4% -36.5% 27.5% 15.1%
Unemployment10
3.1% 8.7% 16.1% 5.8% 9.3% 9.6%
Housing Prices11
-2.1% -4.3% -8.2% -18.3% -2.4% -0.4%
Change in GDP12
6.4% -12.0% -16.1% 2.6% -1.3% 2.6%
Risks to Consider
There are many Wall Street analysts, Meredith Whitney being one of the most vocal, who are
warning about the potential for a significant increase in municipal bond defaults. They warn
that if municipal bond issuers fail to address key problems, then investors could face a period of
defaults similar to the Great or Long Depressions. The issues below help shape Whitney and
other‟s concerns.
1. Reliance on falling real estate values for tax revenues
2. Over-extended state and local budgets and lack of will to make needed cuts
3. Un-funded pension and health care liabilities
4. Lack of transparency in disclosure of financial condition of local issuers
Modern Safeguards
Despite the risks outlined above, there are a number of safeguards in the municipal bond
market that reduce the likelihood of high default rates like investors experienced during the Long
or Great Depressions. Improved regulation, transparency and oversight have brought more
structure to the market. Bond insurance provides investors with an added layer of protection.
In 1975 the Municipal Securities Rulemaking Board (MSRB) was established by Congress as a
self-regulatory organization to protect investors by improving the efficiency of the municipal
10
Bureau of Labor Statistics 11
S&P Case-Shiller HPI home index 12
www.usgovernmentspending.com/us_20th_century_chart.html

© Asset Dedication, 2011 For Advisor Use Only 9
Credit Ratings and Default Rates
bond market. The MSRB‟s role, under the oversight of the Securities and Exchange
Commission, includes developing rules to regulate underwriting, trading, and selling of
municipal bonds. Most notably, SEC Rule 15c2-12 has led to much greater transparency with
required filing of annual financial information and material event notices. This information is
made public on the MSRB‟s Electronic Municipal Market Access (EMMA) website. The SEC
continues to seek improved transparency so that investors can make more informed decisions
about the financial health of the issuers.
The main credit rating agencies,
Moody‟s, Standard and Poors and
Fitch, started providing analysis prior to
the Great depression, however their
analyses were primarily available to
large institutional investors like banks
and insurance companies. Following
the debt crisis of 1931, regulators and
individual investors began to have
broader access to ratings and analysis.
Although ratings tend to more reactive
than predictive, they provide
benchmarking and analysis for
investors to make decisions.13 Ratings
show trends in financial condition as a
bond‟s rating deteriorated and
transitions from one rating to another (as seen in Table 3). It is important for investors to
remember that bond ratings cannot detect fraud or predict extreme financial crisis, which often
precipitate default. However, rating agencies bring increased scrutiny and transparency to bond
markets. Under most normal market conditions, bond ratings can help investors see problems
and take action in advance of a default, especially as ratings begin to fall below investment
grade.
First introduced in 1971, bond insurance provides investors with a backstop if an issuer does
default. Municipal bond insurance guarantees the payment of principal and interest on a bond
if the issuer defaults and usually reduces interest costs, depending upon the issuer's underlying
credit and market conditions. In addition to interest cost savings, higher bond rating associated
with insurance also improves liquidity for insured bonds.
Bond insurers are in shakier financial condition as they have been in the past due to the recent
financial crisis. Issuers are also less willing to pay premiums, reducing revenue as the threat of
rising municipal defaults looms. Nevertheless, bond insurers can still provide some level of
stability to the market.
13
To err is human: rating agencies and the interwar foreign government debt crisis; 2010
Federal backing for municipal bonds?
Although the federal government does not have an
official obligation to bail out troubled municipalities,
Warren Buffett, whose Berkshire Hathaway owns both a
significant holding of municipal bonds and municipal
bond insurer Berkshire Hathaway Assurance, questions
whether the federal government will allow a major
default event. At the firm‟s 2010 annual shareholder
meeting, Buffett said:
“It would be hard in the end for the federal government
to turn away a state having extreme financial difficulty
when they‟ve gone to General Motors and other entities
and saved them… I don‟t know how you would tell a
state you‟re going to stiff-arm them with all the bailouts
of corporations.”

© Asset Dedication, 2011 For Advisor Use Only 10
Credit Ratings and Default Rates
Practical Deterrents to Default
In addition to the number of safeguards that help improve investors‟ ability to evaluate municipal
bonds, from a practical perspective, defaulting on bonds would essentially lock the issuer out of
the market. Since the bond market is the best source of financing for municipalities, defaulting
simply does not make sense. For most issuers, the total debt service on their outstanding
bonds is less than 10% or their budget. The legal fees and increased borrowing costs
(assuming any credit is still available) associated with default is not cost effective. Even Orange
County in California, which declared bankruptcy in 1994, never defaulted on its bonds.

© Asset Dedication, 2011 For Advisor Use Only 11
Credit Ratings and Default Rates
Comparing Corporate and Municipal Bonds
A corporate bond is issued by a company to raise money in order to expand its business.
Compared to municipal bonds, corporate bonds have a much higher risk of default. Unlike a
municipality that can tax residents and is assumed to go on in perpetuity so long as there are
residents, corporations have to repay debt from revenue and can simply go out of business
when the debt load becomes too great.
Municipal bonds and corporate bonds have different ratings schemes. For example, an Aa
rated general obligation municipal bond would be equivalent to a Aaa corporate bond in terms of
likelihood of default. Moody's generally bases its municipal bond ratings on the fiscal strength
of the municipality that issues the bonds. For corporate bonds, on the other hand, Moody's
rating is based on risk of loss. Table 6 maps corporate bond ratings to municipal bonds.
Table 6.
Mapping Muni to Corporate Scale Ratings14
Corporate scale equivalents, by sector
Muni
Scale
Ratings
State
GO
Local GO,
State, Lease,
Wtr/Swr
COPS; Special
Tax; Public
Higher Ed.;
Airports
Hospitals and
Universities
Start-up TIFs and
Toll Roads,
CCRC, Multifam
Aaa Aaa Aaa Aaa Aaa Aaa
Aa Aaa Aaa Aa-Aaa Aa-Aaa Aa
A Aa-Aaa Aa A A-Aa A-Aa
Baa Aa A-Aa A A Baa-A
Ba A-Aa A Baa-A Baa Ba-Baa
B Baa-A Baa Ba-Baa B-Ba B-Ba
Caa Baa Ba-Baa B-Ba Caa-B Caa-B
Notes: Abbreviations represent bonds sold for specific funding purposes: GO = General Obligation,
COPs = Certificate of Participation, TIFs = Tax Increment Financing, CCRC = Continuing Care
Retirement Community
The speed with which corporate bonds transition to default depends on their original rating.
They generally move to lower ratings before default actually occurs. Table 7 shows the time it
has taken for corporate bonds deteriorate and transition to default.
Table 7.
Cumulative Default Among Global Corporate Bonds From Original Rating (1981-2008)15
Defaulting Within: AAA AA A BBB BB B CCC/C Total
One year
3 10 53 39 105
Three years
6 28 122 429 75 660
Five years
2 13 64 250 724 93 1146
Seven years 2 4 27 93 330 861 100 1417
Total 7 25 84 176 486 1048 107 1933
14
Moody’s 15
Standard & Poor's Global Fixed Income Research and Standard & Poor's CreditPro®.

© Asset Dedication, 2011 For Advisor Use Only 12
Credit Ratings and Default Rates
Credit Spread
Credit spread reflects the additional yield an investor requires to assume more credit risk in one
bond type relative to one with less default risk. As of February, 2011, the spread between Aaa
corporate bonds and government agency bonds was about 20 basis points (4.2% for corporate
bonds versus 4.0% for agency bonds). This spread has narrowed dramatically since the spike
in 2008, meaning the relative risk of corporate bonds has diminished. It is important to note that
following 2008, only a small number of corporate issuers are still Aaa rated.
Recall that Table 1 listed cumulative default rates back to 1970. Table 8 shows cumulative
default rates on corporate bonds at 1 to 10 years going back to 1920. It shows that about 1% of
Aaa rated corporate bonds defaulted over a 10-year period. As shown in Table 2, the average
expected recovery is 41%. Institutional investors may prefer corporate bonds because they
hold a slight advantage over government agency bonds from a purely mathematical
perspective. But individual investors may not view this slight yield advantage to be enough to
compensate for the uncertainty and worry that the added risk of default, albeit small, entails.
Table 8.
Average Cumulative Corporate Bond Default Rates, 1920-200916
RATING 1 2 3 4 5 6 7 8 9 10
Aaa 0.0% 0.0% 0.0% 0.1% 0.2% 0.2% 0.4% 0.5% 0.7% 0.9% Inv
es
tme
nt
Gra
de
Aa 0.1% 0.2% 0.3% 0.5% 0.7% 1.0% 1.3% 1.6% 1.9% 2.2%
A 0.1% 0.3% 0.6% 0.9% 1.3% 1.6% 2.0% 2.4% 2.9% 3.3%
Baa 0.3% 0.8% 1.5% 2.3% 3.1% 4.0% 4.7% 5.5% 6.4% 7.2%
Ba 1.4% 3.3% 5.5% 7.7% 9.9% 11.9% 13.8% 15.7% 17.4% 19.2%
No
t
Inv
es
tme
nt
Gra
de
B 4.0% 9.0% 14.0% 18.5% 22.4% 25.9% 29.1% 31.9% 34.3% 36.4%
Caa-C 14.3% 24.0% 31.4% 36.9% 41.2% 44.3% 46.7% 48.8% 50.9% 52.8%
Surprise Defaults
Economic crisis or financial fraud can often lead to rapid deterioration and default on corporate
bonds. Lehman Brothers is a perfect example. In 2007, the 150 year old financial firm had
posted its 4th straight year of record earnings. By September 15th, 2008, Lehman still
maintained an A credit rating, but was forced to file for bankruptcy. Despite the fact that the
government had bailed out smaller and less diversified Bear Stearns, Lehman did not receive
the backing it needed to remain liquid. An S&P special report on the Lehman collapse said, “the
U.S. government may have needed a „moral hazard example,‟ to demonstrate that it would not
be willing to rescue floundering major financial institutions in all circumstances.”
Enron and WorldCom stand as examples where fraud can veil financial distress. In these
cases, the firms eventually imploded, but investors and rating agencies did not have much
insight into the real financial state of the firms and therefore could not make informed decisions.
16
Moody‟s Investor Services, Corporate Bond Defaults and Recoveries, 1920-2009

© Asset Dedication, 2011 For Advisor Use Only 13
Credit Ratings and Default Rates
These examples made headlines when they occurred and, like Orange County in the 1990‟s,
warped the public‟s perspective on the safety of investment grade bonds. Rather than report on
the 99% of Aaa bonds that have not defaulted in all the years since 1920, broadcasters and
reports prefer to shout about the few that did.

© Asset Dedication, 2011 For Advisor Use Only 14
Credit Ratings and Default Rates
Risk Premiums
In their groundbreaking work “Common risk factors in the returns on stocks and bonds,” Fama
and French isolate the risk factors that explain the majority of a security‟s return.17 Risk factors
are premiums that investors are paid for taking on risk above risk free assets (i.e. Treasury
bills). For corporate bonds, the most meaningful factors were term risk (the bond‟s time to
maturity) and default rate. Fama and French found three risk factors that proved to be
significant. Simply investing in the stock market was the first factor. Style (value vs. growth)
and size (small vs. large) also contribute to a security‟s premium over T-bills.
The differences among the premium are noteworthy. As shown in Table 9, in terms of average
monthly risk premiums, investors receive a large premium for choosing to invest in stocks as
well as tilting to small cap and value. For corporate bonds, taking on risk, albeit much smaller,
receives only a small premium.
Table 9.
Monthly Equity and Bond Risk Premiums
Equity Premiums
Market 0.43%
Size 0.46%
Style 0.40%
Bond Premiums
Term 0.06%
Default 0.02%
Investors who are not comfortable with the higher default rate on corporate bonds or the
prospect of higher defaults on municipal bonds, can trade off some bonds risk for some equity
risk. Given the much higher return premium for taking on incremental risk in their stock
portfolios, investors could build a portfolio with the same risk return profile by substituting safer
Treasury, CDs or agencies and making small increases in small cap and value tilts.
17
Common risk factors in the returns on stocks and bonds; Journal of Financial Economics; 1993.

© Asset Dedication, 2011 For Advisor Use Only 15
Credit Ratings and Default Rates
Managing Risks
The risks associated with investing in high quality municipal and corporate bonds can be
managed in a few simple ways that can greatly reduce an investor‟s exposure.
1. For investors who prefer corporate bonds, diversification reduces the risk a single bond
by spreading security risk across several issues. But how many bonds are needed to
effectively diversify a portfolio? A recent study by BondDesk Group revealed that as few
as 10 bonds provide 97% of the diversification benefit of hundreds of bonds.18 Figure 1
highlights the effect of diversification on a portfolio of corporate bonds.
Figure 1.
2. Selecting higher quality bonds can greatly reduce the probability of default. Aaa rated
bonds, municipal or corporate, have a very low incident of default even in severe
economic turmoil. Modern safeguards like improved transparency and insurance
provide added protection against default
3. Although the risk of default in high quality municipal and corporate bonds is low, the risks
still exist. For investors with low tolerance for ratings downgrades and the possibility of
default, they can come close to eliminating default risks by investing in Treasury bonds,
FDIC insured CDs and government agency bonds.
To maintain a similar risk/return profile, investors can substitute Treasury/CDs/agency
bonds for municipal or corporate bonds and increase tilts within their equity portfolios to
higher returning style and size factors (i.e. small cap and value). The slightly lower
yield/expected return on the safer bonds would be offset by taking on slightly more
equity risk.
18
BondDesk Group, “How Many Bonds?,” 2010
0.0%
0.5%
1.0%
1.5%
2.0%
2.5%
3.0%
3.5%
2 3 4 5 6 7 8 9 10 11 12 13 14 15 16 17 18 19 20 50
Pro
ba
bilit
y o
f L
os
s
Number of Bonds
Diversification Benefits

© Asset Dedication, 2011 For Advisor Use Only 16
Credit Ratings and Default Rates
Conclusion
Historical evidence is quite clear that investment grade bonds with Aaa ratings are very safe
investments. If held to maturity, there is less than a 1% probability of default based on statistics
back to 1920, which includes the Great Depression. Since 1970, the record has been even
better. The only investments with lower expected default rates are Treasuries, CDs and
agencies, which also offer investors lower yields.
As we have shown, high grade municipal and corporate bonds have a low incident of default,
particularly over the last 40 years. Under most circumstances, investors can expect high grade
municipal and corporate bonds to return slightly higher yields with low expected defaults. They
are not, however, risk free. There have been isolated periods of higher defaults, some of which
have caught analysts by surprise. Investors looking for predictable cash flows from their bond
investments must carefully weigh the after tax-benefit of municipal bonds and return premium of
corporate bonds against the safety of Treasuries, CDs and agencies.
Municipal bonds are generally thought of as the second safest bond class behind Treasuries,
CDs and agencies. Since 1970, there have only been 54 cases of default among the more that
1,000,000 outstanding issues. Investors need to keep in mind that periods of more serious
economic crisis like the Great Depression have led to significant spikes in default rates.
Although largely untested, modern safeguards like stricter regulation by the MSRB and backing
by bond insurers should help reduce the impact of severe economic meltdowns. Still, investors
who are not comfortable trading off higher after-tax returns for the prospect of higher defaults in
periods of economic crisis should invest in Treasuries, CDs or agencies.
Corporate bonds are riskier than municipal bonds with the same rating. They have historically
experienced higher default rates and lower recovery rates. Currently the credit spread between
corporate bonds and safer bonds is narrow, which means that the premium investors are paid to
take on higher risk is low. Investors may be better compensated by sticking with CD‟s and
agency bonds and taking on slightly higher tilts toward small cap, value or emerging market
stocks where the payoff for taking risk is, on average, higher.
© Asset Dedication, 2011 For Advisor Use Only 17
Credit Ratings and Default Rates
Appendix
Long Term Municipal Obligation Ratings
Long-Term Corporate Obligation Ratings
Equivalent Credit Ratings by Different Companies
Comparing Moody’s and S&P Default Rates

© Asset Dedication, 2011 For Advisor Use Only 18
Credit Ratings and Default Rates
Moody’s Long Term Municipal Obligation Ratings
Municipal Long-Term Rating Definitions
1. Aaa Issuers or issues rated Aaa demonstrate the strongest creditworthiness
relative to other US municipal or tax-exempt issuers or issues.
2. Aa Issuers or issues rated Aa demonstrate very strong creditworthiness relative
to other US municipal or tax-exempt issuers or issues.
3. A Issuers or issues rated A present above-average creditworthiness relative to
other US municipal or tax-exempt issuers or issues.
4. Baa Issuers or issues rated Baa represent average creditworthiness relative to
other US municipal or tax exempt issuers or issues.
5. Ba Issuers or issues rated Ba demonstrate below-average creditworthiness
relative to other US municipal or tax-exempt issuers or issues.
6. B Issuers or issues rated B demonstrate weak creditworthiness relative to other
US municipal or tax exempt issuers or issues.
7. Caa Issuers or issues rated Caa demonstrate very weak creditworthiness relative
to other US municipal or tax-exempt issuers or issues.
8. Ca Issuers or issues rated Ca demonstrate extremely weak creditworthiness
relative to other US municipal or tax-exempt issuers or issues.
9. C Issuers or issues rated C demonstrate the weakest creditworthiness relative to
other US municipal or tax-exempt issuers or issues.

© Asset Dedication, 2011 For Advisor Use Only 19
Credit Ratings and Default Rates
Moody’s Long-Term Corporate Obligation Ratings
Moody‟s long-term obligation ratings are opinions of the relative credit risk of fixed-income
obligations with an original maturity of one year or more. They address the possibility that a
financial obligation will not be honored as promised. Such ratings use Moody‟s Global Scale and
reflect both the likelihood of default and any financial loss suffered in the event of default.
1. Aaa Obligations rated Aaa are judged to be of the highest quality, with minimal credit
risk.
2. Aa Obligations rated Aa are judged to be of high quality and are subject to very low
credit risk.
3. A Obligations rated A are considered upper-medium grade and are subject to low credit
risk.
4. Baa Obligations rated Baa are subject to moderate credit risk. They are considered
medium grade and as such may possess certain speculative characteristics.
5. Ba Obligations rated Ba are judged to have speculative elements and are subject to
substantial
credit risk.
6. B Obligations rated B are considered speculative and are subject to high credit risk.
7. Caa Obligations rated Caa are judged to be of poor standing and are subject to very
high credit
risk.
8. Ca Obligations rated Ca are highly speculative and are likely in, or very near, default,
with some prospect of recovery of principal and interest.
9. C Obligations rated C are the lowest rated class of bonds and are typically in default,
with little prospect for recovery of principal or interest.
Note: Moody's appends numerical modifiers 1, 2, and 3 to each generic rating
classification from Aa through Caa. The modifier 1 indicates that the obligation ranks in
the higher end of its generic rating category; the modifier 2 indicates a mid-range
ranking; and the modifier 3 indicates a ranking in the lower end of that generic rating
category.

© Asset Dedication, 2011 For Advisor Use Only 20
Credit Ratings and Default Rates
Equivalent Credit Ratings by Different Companies
Fitch and Duff & Phelps are two other ratings companies, but records of their default rates are
not readily available. All four have rating categories similar to Moody‟s as shown below
Credit Risk Moody's*
Standard
& Poor's*
Fitch
IBCA**
Duff &
Phelps**
INVESTMENT GRADE
Highest quality Aaa AAA AAA AAA
High quality (very strong) Aa AA AA AA
Upper medium grade (strong) A A A A
Medium grade Baa BBB BBB BBB
NOT INVESTMENT GRADE
Lower medium grade (somewhat speculative) Ba BB BB BB
Low grade (speculative) B B B B
Poor quality (may default) Caa CCC CCC CCC
Most speculative Ca CC CC CC
No interest being paid or bankruptcy petition filed C C C C
In default C D D D
* The ratings from Aa to Ca by Moody's may be modified by the addition of a 1, 2 or 3 to show relative
standing within the category, with 1 the highest.
**The ratings from AA to CC by Standard & Poor's, Fitch IBCA and Duff & Phelps may be modified by the
addition of a plus or minus sign to show relative standing within the category.
Source: The Bond Market Association

© Asset Dedication, 2011 For Advisor Use Only 21
Credit Ratings and Default Rates
Comparing Moody’s and S&P Default Rates
The other large credit rating company for which default rates are readily available is Standard
and Poor‟s. Although its ratings are highly correlated with Moody‟s, they are generally
considered to be slightly more lenient. A comparison of the default rates for each company
reveals this to be true.
19
http://frwebgate.access.gpo.gov/cgi-bin/getdoc.cgi?dbname=110_cong_reports&docid=f:hr835.110
Cumulative Historic Default Rates, 1970-200619
Muni Corporate
Ratings Categories Moody's S&P Moody's S&P
Investment Grade
Aaa/AAA 0.00% 0.00%
0.52% 0.60%
Aa/AA 0.06% 0.00%
0.52% 1.50%
A/A 0.03% 0.23%
1.29% 2.91%
Baa/BBB 0.13% 0.32% 4.64% 10.29%
Not Investment Grade
Ba/BB 2.65% 1.74%
19.12% 29.93%
B/B 11.86% 8.48%
43.34% 53.72%
Caa-C/CCC-C 16.58% 44.81% 69.18% 69.19%
Investment Grade 0.07% 0.20%
2.09% 4.14%
Non-Investment Grade 4.29% 7.37% 31.37% 42.35%
All 0.10% 0.29% 9.70% 12.98%

© Asset Dedication, 2011 For Advisor Use Only 22
Credit Ratings and Default Rates
Disclosures
Projections, results and assumptions used herein reflect past performance of the referenced
asset classes, exclusive of fees, expenses, and taxes. Past performance is no guarantee of
future results. Total returns include reinvestment of dividends and capital gains. The
investment return and principal value of an investment will fluctuate such that an investment, if
and when redeemed, may be worth more or less than its original cost. Defaults on interest
payments and/or principal may also occur. Investment results will vary depending on market
conditions, length of planning horizon, inflation protection, and level of withdrawals. Investors
should consider investment objectives, risks, and all fees, expenses and tax consequences of
an investment before investing.
Asset Dedication, LLC is a registered investment advisor. Asset Dedication is affiliated with
BondDesk Group LLC, owner of BondDesk Trading LLC, a leading fixed-income electronic
trading platform, and one of the largest market destinations for trading odd-lot fixed income
securities in the U.S. Asset Dedication employees may access the BondDesk ATS for pricing
and execution purposes.