safety analyses for bulk carriers using metamodels of still water loads
TRANSCRIPT

7/28/2019 Safety analyses for bulk carriers using metamodels of still water loads
http://slidepdf.com/reader/full/safety-analyses-for-bulk-carriers-using-metamodels-of-still-water-loads 1/8
1 INTRODUCTION
In the last two decades the attention of IMO and IACS has been focused on various kind of legisla-tion leading to improvement of safety of bulk carri-
ers.At the beginning of 1996 came into force amend-ments called the Enhanced Survey Programme(ESP) in order to enhance bulk carrier inspection. InDecember 2002 the Maritime Safety Committee(MSC) adopted amendments to SOLAS chapter XIIand the 1988 Load Lines Protocol. The revisions of
bulk carrier safety concern, bow height and reserve buoyancy, fore deck fittings, water level detectorsand pimping arrangements, hatch covers and secur-ing mechanisms, harmonized notations and designloading conditions, means of access, immersionsuits, free-fall lifeboats, double side skin, using of loading instrument for ships with length over 150 mcapable of providing information on hull girder shear forces and bending moments.
Following the 1998 publication of the report intothe sinking of the bulk carrier Derbyshire, the Mari-time Safety Committee initiated a further review of
bulk carrier safety, involving the use of FormalSafety Assessment (FSA) studies to help assess whatfurther changes in regulations might be needed. FSAis a structured and systematic methodology, aimed at
enhancing maritime safety, including protection of life, health, the marine environment and property, byusing risk analyses and cost benefit assessment(MSC 2007). The main steps in FSA are: identifica-tion of hazards; risk analysis; risk control options;
cost benefit assessment; and recommendations for decision making.
All revised and newly developed rules are im- plemented in Common Structural Rules (CSR) for bulk carriers that are applicable for ships contracted
for construction on or after 1 April 2006. For theships are to be assigned one of the following addi-tional service notations: BC-A; BC-B or BC-C. For BC-A ship design loading conditions shall include atleast one cargo loaded condition with specified holdsempty, with cargo density 3.0 t/m3, and the samefilling ratio in all loaded cargo holds at maximumdraught with all ballast tanks empty. Additionally,CSR define procedure for determination of hold mass curves that specify the maximum and mini-mum mass of cargo in each cargo hold and in anytwo adjacent holds as a function of the draught atmiddle position.
In the operation of ships, the BLU (Bulk Loadingand Unloading) Code provides guidance to mastersof bulk carriers, terminal operators and other partiesconcerned with the safe handling, loading and unloading of solid bulk cargoes. In resent years theship operators have experienced increased pressurefrom terminals to load cargo as quickly as possible.INTERCARGO carried out a confidential survey of ships’ masters and the main conclusions (MSC2008) are: there are terminal instructions, requiring a
14-hour turn-round and 16,000 t/hr loading rate, for capesize bulk carriers; the maximum loading rateshould be approximately twice the ballast pump ca-
pacity, i.e., typically ~ 10,000 t/hr ; the BLU Code isnot being universally applied.
Safety analyses for bulk carriers using metamodels of still water loads
P. GeorgievTechnical University of Varna, Bulgaria
ABSTRACT: This paper presents an approach that combines metamodeling technique and Monte-Carlosimulation for safety analyses of still water loads for bulk carriers. The approach is applied to study the influ-ence of deviations from cargo loading plan on net load of double bottom and still water bending moments. Asexample a Handymax BC-A type ship is used. The metamodels approximate the work of installed on board
mandatory loading instrument and give the relation between the distribution of cargo and the trim and stillwater bending moments in controlled sections. The Monte-Carlo simulation uses the fitted metamodels to ob-tain a rich set of statistical data that permit preparing event tree analysis for possible overloading of double
bottom and the evaluation of likelihood for exceeding of permissible bending moments.

7/28/2019 Safety analyses for bulk carriers using metamodels of still water loads
http://slidepdf.com/reader/full/safety-analyses-for-bulk-carriers-using-metamodels-of-still-water-loads 2/8
The loading condition and loading/unloading plans are prepared by on-board loading instrumentand the results to a great extent depend on the inputinformation for cargo distribution between the holds.According to the conclusions of ISSC 2006 (ISSC2006), based on (Rizzuto 2006) for dry bulk cargoes,no accurate and direct measurement of cargo level inhold is available. The information has always been
derived from the final draft surveys. This type of data, however, does not help in finding out the cargoweight distribution in the various compartments.Even in the event of a very accurate monitoring of drafts, it is not possible to derive the actual distribu-tion of cargo in every single hold. Discrepanciesfrom the loading plan in content of single holds areexpected to be substantial but are not quantifiable bythe crew. At the present stage of the investigation,no model has been developed to quantify these un-certainties for bulk carriers.
Taking into account the above, the research ques-
tions for the investigation is: “What is the influenceof deviation from loading plan on still water loadsand are there any hazards?” At the same time, ac-cording to FSA methodology for hazard identifica-tion and risk analyses where data is unavailable, cal-culation or simulation and analysis techniques could
be used. These techniques are fault tree and eventtree analysis, failure mode and effect analysis, whatif analysis, etc.
The present study combines metamodeling tech-nique, on-board loading instrument and Monte-Carlo
simulation for safety analyses of bulk carriers and toanswer the question. This combine approach is pro-
posed by Georgiev (2010) for probabilistic presenta-tion of bending moments.
As example ship a 42700 tDW Handymax bulk carrier type BC-A with main dimensionsLpp/B/D=177/30/16.2 m and five cargo holds isused.
2 METAMODELING TECNHIQUE
2.1 Background
Statistical techniques and design of computer ex- periments are used successfully in ship design(Georgiev & Damyanliev 2005, Georgiev 2008).The basic approach is to construct approximation of the analyses code (software) i.e. to construct a“model of the model” or metamodel (Kleijnen &Sargent 2000). The main steps of the metamodeling
process are as follows: 1) Determine the goal of themetamodel; 2) Identify the inputs ant their character-
istics; 3) Specify the domain of applicability; 4)Identify the output variable and its characteristics; 5)Specify the metamodel; 6) Specify a computer ex-
perimental design; 7) Fit the metamodel; 8) Deter-mine the validity of the fitted metamodel.
Figure 1. Connection between metamodeling tecnique and Monte-Carlo simulation
The left hand side of Figure 1 presents schemati-cally the metamodeling technique.
2.2 Metamodels of still water bending moments and trim
The still water bending moment (SWBM) dependson cargo distribution. The uncertainties in this dis-tribution lead to uncertainties in calculated by theloading instrument SWBM. The example ship isequipped with ALCOS v. 2.5 ( Auto Loading Com-
puter On-board System) loading instrument, devel-oped by specialist from Technical University of Varna and in the metamodeling process it is consid-ered as computer simulation. The goal of the meta-
models is to obtain the relationship between theamount of cargo in the holds and SWBM and thetrim of the ship. The metamodels will eliminate thenecessity of calculation by loading instrument of thousands loading conditions in Monte-Carlo simu-lation.
For present study an alternate loaded condition(holds No 1, 3 and 5 are loaded) with cargo density3.0 t/m3. However, variability in bending momentsdue to different cargo distribution could occur onlywhen the cargo holds are partially filled. The cargo
loading plan is at 100% consumables and zero trim.The input variables for the metamodel are devia-
tions dPi, i=1,2,3 from planned amount of cargo inthe three loaded holds. For each deviation three val-ues are considered: -10%, 0 and +10%. The coded values in range (-1,1) are calculated by the followingformula:
3,2,1,10
== idP
x ii
(1)
The amount of cargo in each hold is obtained by:
3,2,1)10/1( 0 =±= iP xP iii , (2)
where P0 is the planned amount of cargo.The output variables are SWBM at different sec-
tions related to the permissible ones and the trim.
7/28/2019 Safety analyses for bulk carriers using metamodels of still water loads
http://slidepdf.com/reader/full/safety-analyses-for-bulk-carriers-using-metamodels-of-still-water-loads 3/8
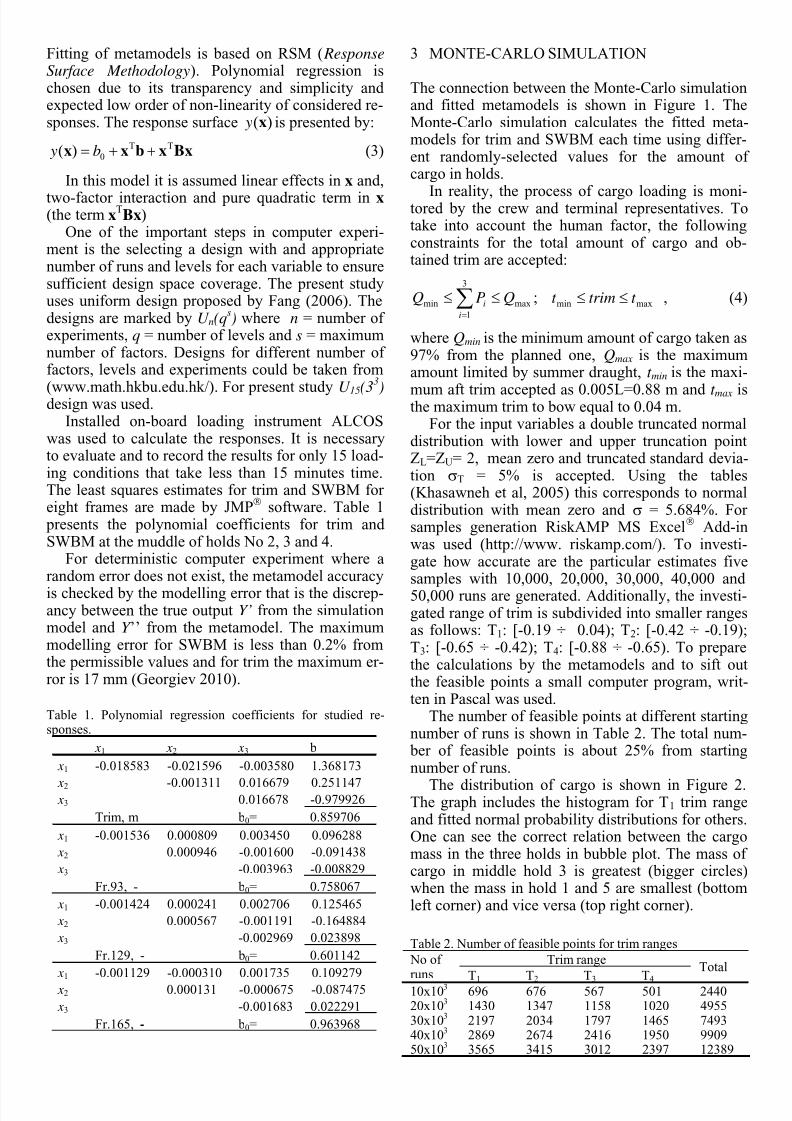
Fitting of metamodels is based on RSM ( ResponseSurface Methodology). Polynomial regression ischosen due to its transparency and simplicity and expected low order of non-linearity of considered re-sponses. The response surface )(x y is presented by:
BxxbxxTT ++= 0)( b y (3)
In this model it is assumed linear effects in x and,
two-factor interaction and pure quadratic term in x (the term x
TBx)
One of the important steps in computer experi-ment is the selecting a design with and appropriatenumber of runs and levels for each variable to ensuresufficient design space coverage. The present studyuses uniform design proposed by Fang (2006). Thedesigns are marked by U n(q
s) where n = number of
experiments, q = number of levels and s = maximumnumber of factors. Designs for different number of factors, levels and experiments could be taken from
(www.math.hkbu.edu.hk/). For present study U 15(3
3
)design was used.Installed on-board loading instrument ALCOS
was used to calculate the responses. It is necessaryto evaluate and to record the results for only 15 load-ing conditions that take less than 15 minutes time.The least squares estimates for trim and SWBM for eight frames are made by JMP® software. Table 1
presents the polynomial coefficients for trim and SWBM at the muddle of holds No 2, 3 and 4.
For deterministic computer experiment where arandom error does not exist, the metamodel accuracy
is checked by the modelling error that is the discrep-ancy between the true output Y’ from the simulationmodel and Y ’’ from the metamodel. The maximummodelling error for SWBM is less than 0.2% fromthe permissible values and for trim the maximum er-ror is 17 mm (Georgiev 2010).
Table 1. Polynomial regression coefficients for studied re-sponses.
x1 x2 x3 b
x1 -0.018583 -0.021596 -0.003580 1.368173
x2 -0.001311 0.016679 0.251147 x3 0.016678 -0.979926
Trim, m b0= 0.859706
x1 -0.001536 0.000809 0.003450 0.096288
x2 0.000946 -0.001600 -0.091438
x3 -0.003963 -0.008829
Fr.93, - b0= 0.758067
x1 -0.001424 0.000241 0.002706 0.125465
x2 0.000567 -0.001191 -0.164884
x3 -0.002969 0.023898
Fr.129, - b0= 0.601142
x1 -0.001129 -0.000310 0.001735 0.109279
x2 0.000131 -0.000675 -0.087475
x3 -0.001683 0.022291
Fr.165, - b0= 0.963968
3 MONTE-CARLO SIMULATION
The connection between the Monte-Carlo simulationand fitted metamodels is shown in Figure 1. TheMonte-Carlo simulation calculates the fitted meta-models for trim and SWBM each time using differ-ent randomly-selected values for the amount of cargo in holds.
In reality, the process of cargo loading is moni-tored by the crew and terminal representatives. Totake into account the human factor, the followingconstraints for the total amount of cargo and ob-tained trim are accepted:
max
3
1
min QPQi
i ≤≤∑=
; maxmin t trimt ≤≤ , (4)
where Qmin is the minimum amount of cargo taken as97% from the planned one, Qmax is the maximumamount limited by summer draught, t min is the maxi-
mum aft trim accepted as 0.005L=0.88 m and t max isthe maximum trim to bow equal to 0.04 m.
For the input variables a double truncated normaldistribution with lower and upper truncation pointZL=ZU= 2, mean zero and truncated standard devia-tion σT = 5% is accepted. Using the tables(Khasawneh et al, 2005) this corresponds to normaldistribution with mean zero and σ = 5.684%. For samples generation RiskAMP MS Excel® Add-inwas used (http://www. riskamp.com/). To investi-gate how accurate are the particular estimates fivesamples with 10,000, 20,000, 30,000, 40,000 and 50,000 runs are generated. Additionally, the investi-gated range of trim is subdivided into smaller rangesas follows: T1: [-0.19 ÷ 0.04); T2: [-0.42 ÷ -0.19);T3: [-0.65 ÷ -0.42); T4: [-0.88 ÷ -0.65). To preparethe calculations by the metamodels and to sift outthe feasible points a small computer program, writ-ten in Pascal was used.
The number of feasible points at different startingnumber of runs is shown in Table 2. The total num-
ber of feasible points is about 25% from startingnumber of runs.
The distribution of cargo is shown in Figure 2.The graph includes the histogram for T1 trim rangeand fitted normal probability distributions for others.One can see the correct relation between the cargomass in the three holds in bubble plot. The mass of cargo in middle hold 3 is greatest (bigger circles)when the mass in hold 1 and 5 are smallest (bottomleft corner) and vice versa (top right corner).
Table 2. Number of feasible points for trim ranges
Trim range No of runs
T1 T2 T3 T4
Total
10x103 696 676 567 501 244020x103 1430 1347 1158 1020 495530x10
32197 2034 1797 1465 7493
40x103 2869 2674 2416 1950 990950x103 3565 3415 3012 2397 12389

7/28/2019 Safety analyses for bulk carriers using metamodels of still water loads
http://slidepdf.com/reader/full/safety-analyses-for-bulk-carriers-using-metamodels-of-still-water-loads 4/8
11200 11600 12000 12400 12800 13200
Cargo mass, t
0
200
400
600
800
1000
F r e q u e n c y
-T1
-T2
-T3
-T4
Hold No 1
12400 12800 13200 13600 14000 14400 14800 15200
Cargo mass, t
0
200
400
600
800
F r e q u e n c y
-T1
-T2
-T3
-T4
Hold No 3
a) b)
12000 12400 12800 13200 13600 14000 14400
Cargo mass, t
0
200
400
600
800
1000
1200
F r e q u e n c y
-T1
-T2
-T3
-T4
Hold No 5
c) d)
Figure 2. Cargo distribution for different trim ranges: -a); -b); -c). Bubble plot for cargo distribution in the holds – d).
An approximate (1-α)100% confidence intervalfor unknown population mean m is
⎟ ⎠
⎞⎜⎝
⎛ ± −
N z
σ µ
α 2/1 (5)
where µ is sample mean ,σ is standard deviation, N is number of runs, and z1-α/2 is the number thatΦ(zγ)= γ (Φ denotes the standard normal c.d.f). It iscommon practice in simulation to use and report theabsolute (wa) and relative (wr ) widths of the confi-dence interval (CI), defined as
µ
σ
α
ar a
ww
N zw == − and 2/12 (6)
In Figure 3 the relative width in percent (wr ) for α = 5% and =1% significance levels is shown. The re-sults include all trim ranges and as one can see fromthe trend lines, the accuracy of estimation of themean is proportional to N-0.5. The maximum relativewidth of CI is less than 1% and goes down to lessthan 0.4% at 50,000 starting runs. The descriptive
statistics for mass of cargo distribution in the holdsat T1 range for sample size N=3565 are shown inTable 3. The table presents the planned and maxi-mum permissible ( MaxLoad ) amount of cargo.
0 1000 2000 3000 4000Numberof runs, N
0.2
0.4
0.6
0.8
1.0
R e l a t i v e w i d t h o f C I , w r
%
-T1
-T2
-T3
-T4
95%CI-Fitted function
99%CI-Fitted function
wr=14.686N-0.4921
wr=19.255N-0.4917
R2=0.997
R2=0.997
Figure 3. Relative width for 95% and 99% confidence for cargo mass in Hold No 3.
Table 3. Descriptive statistics for mass of cargo in holds at T1 trim range
Item Hold 1 Hold 3 Hold 5
Plan P0, t 12536 13884 13186 MaxLoad, t 12536 13884 13.835
µ , t 12446.0 13818.4 13141.595% CI, t ± 9.6 ± 18.3 + 11.2
99% CI, t ±12.6 ± 24.0 ± 14.7σ , t 291.9 556.8 341.7CoV, % 2.3 4.0 2.6Skewness -0.0001 0.0314 -0.0299Ex. Kurtosis -0.1283 -0.4916 -0.2440

7/28/2019 Safety analyses for bulk carriers using metamodels of still water loads
http://slidepdf.com/reader/full/safety-analyses-for-bulk-carriers-using-metamodels-of-still-water-loads 5/8
4 SAFETY ANALYSES
4.1 Possible overloading of double bottom
According to CSR, the maximum allowable or mini-mum required cargo mass in a cargo hold, or in twoadjacently loaded holds, is related to the net load onthe double bottom. This load is a function of draft,
cargo mass in the cargo hold, as well as the mass of fuel oil and ballast water contained in double bottomtanks. The relation between the draft and the load isgiven by hold mass curves prepared for every singlehold and for two adjacent holds as well. In operationthe maximum allowable cargo mass shall be limited to MHD that is the maximum cargo mass allowed to
be carried with specified holds empty at maximumdraught.
The event tree analysis method is used to analysethe probability of occurrence (Kuo 2007). Theevents are examined using a binary logic (Yes/No)
and the process goes in one direction to derive out-comes. The tree consists of nodes, branches and leaves. The probability of the outcome is obtained multiplying along the branches (Fig.4).
At present study, we consider two events. Letevent B is the overloading of double bottom and T isthe trim range. The overloading exists when themass of cargo is greater than maximum permissiblefrom corresponding hold mass curve. The twoevents are considered as not independent and theconditional probability of B, given that T has oc-
curred is given by
.P(T)T P
T BPT BP 0
)(
)()( ≠
∩= , (7)
Let the trim ranges T i i=1,2…4 are events that partition the whole trim range T . Following the theo-rem of the total probability we obtain
( ) 4...2,1)(.)(4
1
==∑=
iT PT BP BPi
ii, (8)
For conditional probability of B, given that T i hasoccurred the following is valid:
4,...,2,10)(
)()( =≠
∩= i)P(T
T P
T BPT BP i
i
ii
; , (9)
In case where it is necessary to reverse the order in conditional probabilities the Bayes’ theorem isused:
( )( )
4...2,1)(
)(== i
BP
T BPT P BT P
ii
i , (10)
The masses of cargo in the holds are considered as not independent and the event of overloading islabelled B1, B3 and B5. The outcome for every
branch is marked with a string that includes thenumber of trim range and combination of three char-
acters (‘1’ or ‘0’) that represent the overloading inholds No 1, 3 and 5 respectively. The sample withtotal 12389 points is used and the event tree isshown in Table 4. The last column includes the val-ues of product rules.
Having the results from the event tree we candraw different conclusions. The probability of over-loading of every separate hold and combination of
holds for whole trim range is shown in Figure 5. The probability that there is no overloading is about 31%and probability for overloading of hold No 3 (themiddle hold) is about 39%.
Figure 4. Event tree for two events A and B
Table 4. Event tree for overloading of double bottom
Ti B1 B3 B5 Outcome
0/228 Y 1111 0.0228/1369
Y228/228 N 1110 0.01840
67/1141 Y 1101 0.00541
1369/3565
Y
1141/1369 N 1074/1141 N 1011 0.086690/1403 Y 1011 0.01403/
2196Y
1403/1403 N 1010 0.113250/793 Y 1001 0.0
3565/12389
2196/3565
N793/2196
N793/793 N 1000 0.064010/37 Y 2111 0.037/
811Y
37/37 N 2110 0.00299154/774 Y 2101 0.01243
811/3415
Y774/811
N620/774 N 2011 0.050040/1488 Y 2011 0.01488/
2604Y
1488/1488 N 2010 0.120100/1116 Y 2001 0.0
3415/12389
2604/3415
N1116/
2604
N
1116/1116 N 2000 0.090080/1 Y 3111 0.01/406
Y1/1 N 3110 0.00008273/405 Y 3101 0.02204
406/3012
Y405/406
N132/405 N 3011 0.0106513/1306 Y 3011 0.001051306/
2606Y
1293/1306 N 3010 0.1043736/1300 Y 3001 0.00291
3012/12389
2606/3012
N1300/2606
N1264/1300 N 3000 0.10203
4111 0.00/156
Y4110 0.0
155/156 Y 4101 0.07199
156/2397
Y156/156
N1/156 N 4011 0.00046
56/1036 Y 4011 0.003021036/2241
Y980/1036 N 4010 0.05292
234/1205 Y 4001 0.01264
2397/
123892241/2397
N1205/2241
N971/1205 N 4000 0.05244

7/28/2019 Safety analyses for bulk carriers using metamodels of still water loads
http://slidepdf.com/reader/full/safety-analyses-for-bulk-carriers-using-metamodels-of-still-water-loads 6/8
T1 T2 T3 T40
20
40
60
80
100
P r o b a b i l i t y ,
%
22.232.7
42.0
27.1
30.118.2
4.4
0.2
39.443.6
42.9
27.4
No H1 only H3 only H5 only1.2
6.5
Figure 5. Probability (%) of overloading of Figure 6. Probability for overloading of separate holds atevery cargo hold and combination of holds given trim range T1-T4
Table 5. Descriptive statistics for SWBM at trim range T1
Statistic Frames
Fr. 75 Fr. 86 Fr. 93 Fr.111 Fr.129 Fr.139 Fr.147 Fr.165 Fr.183µ , - 0.5259 0.7732 0.8483 0.7473 0.5907 0.6292 0.7302 0.9520 0.644995% CI .10
2, - ±0.089 ±0.138 ±0.171 ±0.258 ±0.301 ±0.287 ±0.256 ±0.195 ±0.110
99% CI .102, - ±0.117 ±0.182 ±0.225 ±0.339 ±0.395 ±0.377 ±0.336 ±0.256 ±0.145σ , - 0.0271 0.0421 0.0522 0.0785 0.0916 0.0873 0.0780 0.0593 0.0335CoV, % 5.2% 5.4% 6.2% 10.5% 15.5% 13.9% 10.7% 6.2% 5.2%Skewness -0.0512 -0.0582 -0.0584 -0.0596 -0.0604 -0.0601 -0.0591 -0.0561 -0.0538Ex. Kurtosis -0.4256 -0.4047 -0.3919 -0.3858 -0.3851 -0.3783 -0.3672 -0.3335 -0.3238
Plan, - 0.5372 0.7845 0.8595 0.7579 0.6010 0.6399 0.7413 0.9639 0.6515
X/L 0.3245 0.3721 0.4023 0.4801 0.5579 0.6011 0.6357 0.7135 0.7913
Conditional probabilities for overloading of everyhold separately at given trim region can be seen inFigure 6. From that figure several conclusions can
be drown:− The probability to have no overloading is greatest
(42%) at trim range T3: [-0.65 ÷ -0.42) m;− An overloading of hold No 3 (that is with greatest
probability of about 39%) could be expected rather at trim range T2 or T3 than T4;
− The overloading of hold No 1 is most probable(30.1%) at trim range T1: [-0.19 ÷ 0.04) m.The information obtained from the event tree
analyses could be useful during the operation of theship to stress the crew attention to most critical
places during the cargo loading and how to interpretthe situation in case of considerable deviation fromcargo plan. The same information could be used dur-ing the design process to evaluate the vulnerabilityof the ship to the deviations from cargo loading plan.
4.2 Still water bending moments
During the Monte-Carlo simulation for feasible
points the SWBM is calculated by fitted metamod-els. Descriptive statistics and confidence interval for the mean at all controlled sections for trim range T1 are shown in Table 5. The last two rows include val-ues for SWBM for the planned loading condition
and location of the section. The relative width of 95% confidence interval for three sections and cor-responding trend line are shown in Figure 7. Theleast accuracy of estimation of the mean is obtained for frame 129. The frame is located at the middle of the ship and the standard deviation of SWBM for this frame is greatest.
0 1000 2000 3000 4000Number of runs, N
0.0
0.5
1.0
1.5
2.0
2.5
3.0
R e l a t i v e w i d t h , w r ,
%
Fr. 111 Fr. 129 Fr. 165
wr =42.475N-0.5013 ; R2=0.9956
wr =64.005N-0.5038 ; R2=0.9946
wr =24.328N-0.4971 ; R2=0.9966
Figure 7. Relative width (wr ) for 95% confidence for SWBMfor three frames

7/28/2019 Safety analyses for bulk carriers using metamodels of still water loads
http://slidepdf.com/reader/full/safety-analyses-for-bulk-carriers-using-metamodels-of-still-water-loads 7/8
0.3 0.4 0.5 0.6 0.7 0.8
x/L2
4
6
8
10
12
14
16 %
- CoV
- σ
Figure 8. Standard deviation and CoV along ship length
0.4 0.6 0.8x/L0.2
0.4
0.6
0.8
1.0
S W B M , -
µ−2σ
µ+2σ
µ
Plan
max permissible
Figure 9. Region around the mean value of SFBM
The standard deviation and CoV are biggest at themiddle sections. From Figure 8 one can see that the
maximum standard deviation is about 9% from the permissible SFBM and CoV is about 16%.The most important remark based on the descrip-
tive statistics of SWBM is illustrated in Figure 9.The plot includes the SWBM related to the permis-sible values for initial loading condition (the plan),and obtained for controlled sections mean and mean± 2 × σ. The shaded area corresponds to 95.45% of all possible values for SWBM that could exist for this trim range. Due to the deviation from cargo planand uncertainties in cargo distribution we will have arange of possible SWBM values. For frame 165
(X/L=0.71) there are values greater than the permis-sible ones (rounded rectangle) and overloading mayoccur. The relative frequency for such overloadingfor considered trim ranges is as follows: T1 -
780/3565 = 0.22; T2 - 741/3415 = 0.22; T3 – 576/3012=0.19 and T4 - 362/2397 = 0.15.
The curve for mean values is very close to thecurve of the plan i.e. the values obtained by loadinginstrument. For all frames the samples for SFBMhave negative excess kurtosis that shows distributionwith lower, wider peak around the mean and thinner tails. A negative skew for all frames indicates longer
left tail in the distribution, but the values are verysmall and one can conclude that the data are notskewed.
5 CONCLUSIONS
It has been recognized nowadays that the safety of the ship is permanent concern of IMO, IACS and world maritime community, especially in case of
bulk carriers where much is done. The present inves-tigations worldwide are based on the new FSA
methodology whose goal is to discover hazards and quantify the risk.
In this study an attempt has been made to com- bine metamodeling technique and Monte-Carlosimulation to investigate the influence of uncertain-ties in cargo distribution on still water loads. Theseuncertainties originate from possible deviations fromcargo plan during loading of cargo.
For bulk carriers with length over 150 m it ismandatory to have installed loading software on
board. The loading computer should check compli-
ance with the limits not only for the global still wa-ter bending moment and shear force but also in thelocal strength diagram for the hold. The localstrength diagram stipulates the limits with respect to:− The allowable cargo intakes in each individual
cargo hold as a function of the actual draught;− The allowable cargo intake for two adjacent cargo
holds as a function of the actual draught.In most cases the cargo mass and consumables
are given by the user as input to the loading com- puter. The work of loading instrument is approxi-mated by metamodels that give very accurate results.
The Monte-Carlo simulation calculates the fitted metamodels for trim and SWBM each time usingdifferent randomly-selected values for the amount of cargo in holds. To take into account the role of thecrew during the loading some constraints concerningthe trim range and total amount of cargo are ac-cepted. The constraints eliminate about 75% fromthe number of starting runs. Notwithstanding, theobtained relative width of 95% confidence intervalwith reasonable number of starting runs (50,000) isless than 0.3% for the mean of cargo mass in the
holds and less than 1.1 % for SWBM.The results obtained from the proposed approach
give new kind of information that could be useful for the crew at preparing and monitoring the loading
plan. Based on the results from studied ship it can be

7/28/2019 Safety analyses for bulk carriers using metamodels of still water loads
http://slidepdf.com/reader/full/safety-analyses-for-bulk-carriers-using-metamodels-of-still-water-loads 8/8
concluded that the probability that there is no over-loading is about 31% and probability for overloadingof hold No 3 (the middle hold) is about 39% in trimrange from 0.04 m fore to 0.88 m aft. The probabil-ity to have no overloading is greatest (42%) at trimrange -0.65 ÷ -0.42 m. An overloading of hold No 3(that is with greatest probability of about 39%) could
be expected rather at trim range -0.65 ÷ -0.19 than
for greater trim aft. The overloading of hold No 1 ismost probable (30.1%) at trim that is close to evenkeel.
Considering SWBM there is a strong dependency between ship length and standard deviation and CoVin full load condition and the values are greater for middle sections. Taking into account the variation incargo mass in loaded holds it is possible to obtainregion of variation of SWBM, and study the prob-ability for exceeding of some critical value
The proposed procedure is applicable in the de-sign phase and during the operation as well. In de-
sign the procedure can evaluate the vulnerability of the ship to deviations in cargo plan during the load-ing and in operation the results could be useful tostress the crew attention to most critical places dur-ing the cargo loading and how to interpret the situa-tion in case of considerable deviation from cargo
plan.The procedure may be implemented as separate
module in loading software to study the effects of uncertainties in cargo distribution on still water loads and safety of bulk carriers.
Finally, it could be useful to present shortly theactions taken from DNV to increase the loadingflexibility of bulk carriers (Vårheim 2008). DNV hasintroduced a new class notation called Easy Load-ing, EL. This is a voluntary notation which will pro-vide more automated control of the critical parame-ters during the loading and allow for easier and moreflexible loading sequences. In order to obtain the ELnotation, the following must be complied with:− The EL notation can only be assigned to bulk car-
riers with a BC-A or BC-B class notation and anadditional GRAB [X] notation.
− Relevant loading sequences, with average loadingrates, must be stated.
− Each step in the loading sequence must be docu-mented, from the commencement of cargo load-ing until full deadweight is reached, step-wisesynchronized with the de-ballasting operation.
− There must be sufficient de-ballasting capacity tomeet the average loading rate requirements.
− The ship must be designed such that at least 50%of the maximum permissible cargo intake per cargo hold can be loaded in one pour.
− An automatic draught-reading system must be fit-ted.
− An on-line ballast tank level monitoring system,linked to the loading computer, must be fitted.
ACKNOLEDGMENT
This work has been performed in the frame of EC 6th Framework Programme Specific Targeted Project“Handling waves” TST5-CT-2006-031489,www.mar.ist.utl.pt/handlingwaves/.
REFERENCES
Fang, Kai-Tai, Runze Li, Sudjianto A. 2006. Design and mod-eling for computer experiments. Taylor & Francis Group.
ISSC. 2006. Special task committee VI.1, Reliability Based Structural Design and Code Development, 16th Interna-tional Ship and Offshore Structures Congress, 20-25 Au-gust, 2006 Southampton, UK Vol. 2, 317-389
Georgiev, P. & Damyanliev, T. 2005. Metamodels in Ship De-sign. Second International Congress on Mechanical and Electrical Engineering and Marine Industry (MEEMI),Varna, Bulgaria, 7-9 October 2005, Vol. 2, pp 268 – 278
Georgiev, P. 2008. Implementation of metamodels in ship de-sign. Maritime Industry, Ocean Engineering and CoastalResources, eds. C. Guedes Soares & P. Kolev, Taylor &Francis Group, London, 2008, pp. 419-428
Georgiev, P. 2010. Probabilistic presentation of the bendingmoments of bulk carriers using metamodels. Tenth Interna-tional Conference on Marine Sciences and Technologies -Black Sea 2010, October 7-9, 2010, Varna, pp. 82 – 89:ISSN 1314-0957
Khasawneh, M. T, Bowling S.R., Kaewkuekool S., Cho B.R.Tables of a truncated standard normal distribution:A doublytruncated case. Quality Engineering , 17:227-241, 205,Taylor & Francis Inc.
Kleijnen, J. P. C. & Sargent, R.G. A methodology for fittingand validating metamodels in simulation. European Journal
of Operations Research, Vol. 120, No. 1, 2000, 14–29Kuo, Ch. 2007. Safety management and its maritime applica-
tion. The Nautical InstituteMSC. 83rd session. 2007. Formal Safety Assessment. Consoli-
dated text of the Guidelines for Formal Safety Assessment(FSA) for use in the IMO rule-making process(MSC/Circ.1023-MEPC/Circ.392). MSC 83/INF.2,14 May2007.IMO
MSC,84th session. 2008. Dangerous goods, solid cargoes and containers. Bulk carrier loading rates. MSC 84/INF.8,3March 2008. IMO
Rizzutto, E. 2006. Uncertainties in still water loads of tankersand bulkers. Proceedings of the International Conference onShip and Shipping Research, NAV 2006. Genoa, Italy,Centro per gli Studi di Technica Navale.
Vårheim, R. 2008. Bulk carrier update. 1, 2008, DNV, pp. 6-7