sabores latinos: a needs assessment of food …sabores latinos: a needs assessment of food...
TRANSCRIPT

SABORES LATINOS: A NEEDS ASSESSMENT OF
FOOD PREFERENCES OF LATINO FOOD BANK CLIENTS
A Project Report
Presented to
The Faculty of the Department of Anthropology
San José State University
In Partial Fulfillment
of the Requirements for the Degree
Masters of Arts
By
Sara Mia Salinas
May 2013

© Copyright 2013
Sara Mia Salinas
ALL RIGHTS RESERVED
SAN JOSÉ STATE UNIVERSITY
The Undersigned Graduate Committee Approves the Project Report Titled
SABORES LATINOS: A NEEDS ASSESSMENT OF
FOOD PREFERENCES OF LATINO FOOD BANK CLIENTS
by
Sara Mia Salinas
APPROVED FOR THE DEPARTMENT OF ANTHROPOLOGY
_________________________________________________________________________
Dr. Charles Darrah, Department of Anthropology Date
_________________________________________________________________________
Dr. Guadalupe Salazar, Department of Anthropology Date
_________________________________________________________________________
Dr. Elizabeth Weiss, Department of Anthropology Date

ACKNOWLEDGMENTS
I could not begin this section without thanking the person responsible for so much of what I have achieved as a graduate student. Dr. Charles Darrah is one of the wisest people I have had the opportunity of knowing. Throughout my graduate experience, he has been a constant source of motivation and encouragement and helped guide my transformation from a student into a confident researcher dedicated to utilizing my “tool kit” to conduct applied research and help others.
A big thank you is due to Dr. Guadalupe Salazar for her invaluable feedback on my project and amazing suggestions. Her passion for Latino communities is contagious and her tireless work as not only an assistant professor but also a mother is awe-inspiring.
Another very important person I would like to acknowledge is my remaining committee member, Dr. Elizabeth Weiss. The amount of time and energy she spent advising me on the statistical aspects of my research project is greatly appreciated.
I want to thank my wonderful and supportive father, siblings, family, “maties,” and sons, Mason and Miles for being my support system and always encouraging me to keep my eye on the prize. I also wish to thank all the Latino participants of this research project for allowing me pry into their lives and speaking so candidly about their food consumption practices.
Last but not least, I must thank my rock, my best friend and my mother, Flora Salinas. Her wisdom, unwavering support and encouragement undeniably helped get me through my graduate career. Knowing that I have made her proud has made all of my stresses and efforts worthwhile.
¡Muchísimas gracias a todos!

DEFINITIONS/TERMINOLOGY
Since self-identification of ethnicity is so varied and multifarious, there is no
solitary term that is universally recognized by all persons of Latin American descent.
According to the U.S. Census Bureau (2011), “Latino” refers to persons who trace their
ancestry to Latin America, while “Hispanic” refers to those who come from Spanish-
speaking countries. Because the individuals who were studied in this project are from
Latin America, Latino seemed to be the most appropriate term. Moreover, although this
report employs the term “Latino/a”, it is in no way deliberately reducing or discounting the
complexity or multiplicity of ways individuals might identify themselves in different
contexts.
ABSTRACT
The primary purpose of this ethnographic needs assessment was to gather
information to aid the Community Food Bank of San Benito County (CFBSBC) in
understanding the dietary needs of its Latino clients. The research included an
anthropological mixed methods design in the form of quantitative and qualitative methods
to: (1) gain knowledge of eating practices, (2) identify food preferences, (3) explore food
preparation techniques and (4) determine which dietary services the Latino clients are most
interested in receiving. Results from this study will be used to plan and implement a
nutrition education program based on cooking and nutrition classes for its Latino clients as
well as appropriate food inventory. The research data will also be utilized by the CFBSBC
to obtain federal aid to implement the suggested services and programs.

TABLE OF CONTENTS
CHAPTER
I. Introduction and Background …………………………………………………...1
The Community Food Bank of San Benito County ………………………..2Project Objective …………………………………………………………...3Anthropological Perspective ……………………………………………….4
II. Food Insecurity in the U.S ……………………………………………………....5
III. Health Disparities Among Latinos ……………………………………………..7
Acculturation ……………………………………………………………….7Obesity ……………………………………………………………………..8Diabetes …………………………………………………………………….9
IV. Literature Review …………………………………………………………….10
Food and Nutrition Needs Assessments in the U.S ………………………10Acculturation ……………………………………………………………...12Nutrition Intervention Guided by Theory ………………………………...14The Network for a Healthy California ……………………………………14
V. Conceptual Frameworks ………………………………………………………16
Natural Helper Model …………………………………………………….16Social Cognitive Theory ………………………………………………….17
VI. Methods ………………………………………………………………………20
Project Instruments ……………………………………………………….20Population Sample ………………………………………………………..21
Participant Recruitment …………………………………………………..21Strengths and Limitations ………………………………………………...23
VII. Data Collection ………………………………………………………………24
Participant Observation …………………………………………………...24Surveys ……………………………………………………………………25Focus Groups ……………………………………………………………..27
VIII. Key Findings ………………………………………………………………..29
Data Analysis ……………………………………………………………..31Results of Quantitative Analysis ………………………………………….32Discussion ………………………………………………………………...35Focus Group and Interview Themes ……………………………………...37Food Preferences and Resisting Acculturation …………………………...39Under Enrollment …………………………………………………………39
IX. Recommendations for the CFBSBC ………………………………………….40
Nutrition Counseling ……………………………………………………...41Healthy Recipes …………………………………………………………..42Cooking Classes …………………………………………………………..43Customizing the Food Bank’s Inventory …………………………………43Conducting Outreach to Increase Enrollment …………………………….44
X. Implications for Applied Anthropology ……………………………………….45
XI. Conclusions …………………………………………………………………...45
XII. Works Cited ………………………………………………………………….47
XIII. Appendices ………………………………………………………………….53
A. Consent Forms ………………………………………………………...53 B. Survey Instruments …………………………………………………….55
C. Focus Group Instruments ……………………………………………...57D. Interview Instruments …………………………………………………59
E. Survey Statistical Data Tables …………………………………………61 F. Survey Statistical Data …………………………………………………66
Interviews …………………………………………………………………29

LIST OF FIGURES
Page
Figure 1. Map of San Benito County ………………………………………………………2
Figure 2. Latino Food Bank Clients Picking up Food From a Mobile Distribution Area ……………………………………………………………………………...6
Figure 3. Social Cognitive Theory Model ………………………………………………..18
Figure 4. Food Bank Clients’ Countries of Origin ……………………………………….32
Figure 5. Most Commonly Mentioned Food Staples ……………………………………..33
Figure 6. Vegetable Enchilada Recipe ……………………………………………………42

LIST OF TABLES
Page
Table 1. Customized Food Bank Inventory ………………………………………………43
INTRODUCTION AND BACKGROUND
I grew up in the rural town of Hollister, CA, which has a prominent Latino
population with a large percentage being migrant and agricultural laborers who mainly
work in the fields and canneries. Since I myself come from a Latino family whose parents
and grandparents did the same work, I know first-hand that laborers cannot afford most of
the foods that they cultivate. For these reasons, I co-founded a not-for-profit grassroots
organization in 2009, called Comstock Community Farm. With the help of community
volunteers and support from the Community Food Bank of San Benito County (CFBSBC),
we have been growing organic fruits and vegetables for low-income families and laborers
at no cost, which is distributed via the CFBSBC.
When I began to contemplate potential research projects to fulfill my MA
requirement, I wanted it to be a project that would assist low-income Latinos and the
CFBSBC. After several meetings with the CFBSBC’s director, it became clear that the
Latino population in San Benito County is growing at a rapid rate and the food bank (as
well as the county) is ill equipped to accommodate their diverse needs. She also candidly
voiced her concerns about the health statistics of the Latino population and the enrollment
rates of Latinos plateauing at the food bank. During the ideation phase for this project, I
asked the food bank director what she hoped to accomplish for the upcoming year (2013).
Her response was to understand the following things: (1) what foods the Latino clients
would prefer to receive, (2) if they would be willing to participate in nutritional education
programs and (3) why so many low-income Latino families in San Benito County are not
enrolling in food bank services
11

The Community Food Bank of San Benito County
The CFBSBC is a non-profit organization located in the town of Hollister, CA and
serves the entire county of San Benito. The CFBSBC plays an important role in offsetting
hunger for food insecure individuals and families living in San Benito County. It receives
food from state and federally funded food distribution programs, as well as food drives,
private donations and grants that allow them to purchase specific foods in order to meet
their clients’ needs. The food bank distributes 1,750 bags of food weekly to over 5,000
residents residing in the towns of
Hollister, Tres Pinos, Paicines,
Panoche, San Juan Bautista and
Aromas. To compensate for its
location on the outskirts of town
and the lack of accessibility for
those without transportation, the
food bank has several distribution
areas: they are situated in
apartment complexes and labor camps, and range from church parking lots to
under bridges where the homeless population lives.
San Benito County’s estimated population in 2012 was 56,072, with Latinos
making up over half of the population (56.9%) (census.gov). The percentage of this
population has continued to be virtually the same for the past three decades, which is not
surprising since the county has a large agricultural industry (cosb.us). Children under the
12
age of 18 comprise 28.4% of Benito County’s population and 11.4% of them live below
the poverty level (census.gov). Based on a survey I conducted for the CFBSBC in 2012,
56% of the food bank’s consumers identified themselves as Latino or Hispanic (Salinas,
n.d.).
Projective Objective
My project objective was to conduct an anthropological needs assessment of Latino
client’s food preferences at the CFBSBC. A needs assessment is a methodical approach to
studying the state of knowledge, abilities, interests, or attitudes of a defined audience or
group involving a particular issue (Davidson, 2005). Thus, my first goal was to collect data
to learn what Latino food bank clients already know and think so that I could determine
what nutritional programs and services are needed. A second goal was to understand what
the CFBSBC could do to make their educational programs more accessible, acceptable and
useful.
In November 2012, I was commissioned by the CFBSBC to conduct a countywide
survey, focus groups and interviews with its Latino clients. My goal was to understand
their perspectives on issues such as obesity, diabetes, food preferences and accessibility
and potential nutritional programs. By beginning with qualitative research, I was able to
better understand the target population, which helped me decide what key variables and
domains to investigate quantitatively. The data gained from this assessment can be utilized
to customize the food bank’s inventory, introduce educational programs and gain funding
to support new services. The food bank director also plans on sharing the results of this
research project with sister food banks in California.
13

Anthropological Perspective
The CFBSBC was interested in commissioning an anthropologist because of my
potential to apprehend the different layers of the Latino clients’ dietary practices and
ability to investigate the acculturation and cultural factors that contribute to a lack of
enrollment of Latinos at the food bank and their declining health statuses. Since food is
inextricably related to culture, variables that influence culture will also affect food habits
(Benavides-Vaello, 2005). In order for a nutrition education program to be culturally
appropriate, it should include traditional consumption patterns and at the same time
recognize newly attained food habits.
Anthropologist have always been interested in the study of human diets, especially
(a) the environmental and market availabilities of foods; (b) the sociocultural
classifications of foods (e.g. “edible” or inedible”), rankings of foods (e.g. “preferred” or
“less preferred”) and rules of distribution; and (c) the nutritional and medical effects of
certain consumption patterns, such as patterns of food sharing (Mesner, 1984). While
anthropologists tend to explain the folkloric factors that contribute to particular patterns of
food acceptance, food preference, and dietary constructions, they are also interested in
material factors that play a large part in the choices of foods (Pelto, 1981). This is referred
to as nutritional anthropology, a subfield that covers a wide-ranging variety of theoretical
perspectives while employing a wide range of research techniques.
Some investigators focus on the cultural context, seeking to understand the
meaning of food in cultural and symbolic terms (Pelto, 1981). However, this research
project is distinctive in that my emphasis is also on applied research, an investigation that
14

has been carried out for the purposes of general nutrition planning and specific program
development for the CFBSBC.
FOOD INSECURITY IN THE U.S.
According to The United States Department of Agriculture (USDA), a household is
food secure if all of its members have access to enough food at all times to live an active
and healthy lifestyle (USDA.gov). Thus, a household that is food insecure is classified as
such if at times its members are unsure of having, or incapable of acquiring enough food
for all members due to insufficient funds or resources. Subcategories of food insecure
households are identified as having either low food security or very low food security
(Nord et al., 2008).
As of 2009, 14.6% of households in the U.S. were food insecure, which is the
highest record since 1995 (Nord et al., 2009). Numerous factors may affect whether or not
a household experiences food insecurity such as lower incomes, inability to find
employment, lower education levels, a large number of household members, and living in
a household headed by an African American, Latino or single mother (Mazur et. al, 2003).
It is estimated that more than 48.4 million Latinos reside in the U.S. (cdc.gov,
2009). Besides being the largest minority group in the country, it is also the fastest growing
with a 3.3% increase between 2006 and 2007. Sixty-four percent of Latinos in the U.S. are
of Mexican origin, trailed by Puerto-Rican and Cuban. By 2050, it is projected that the
Latino population will increase to 30% of the U.S. population (census.gov, 2008).
In comparison to any other reported racial or ethnic category, food insecurity is most
prevalent in Latino households (USDA.gov). In 2010, approximately 13.3 million Latinos,
15

including 5.1 million children, lived in food-insecure households in the United States and
the numbers have been rapidly increasing (USDA.gov).
More than one-quarter (27.9%) of all Latinos in the U.S. live with food insecurity,
a rate similar to previous years and more than two times higher than the rate for non-
Hispanic Whites (11.4%) (USDA.gov). These statistics mirror those in San Benito County
since Latinos/Hispanics make up a majority of the food bank’s clientele.
Figure 2: Latino food bank clients picking up food from a mobile distribution area. Courtesy of the CFBSBC.
What’s even more alarming is that a limited amount of research has been done on food
insecurity among this nonwhite population. This is of particular importance as this group,
compared to non-Hispanic whites, is at the greatest risk for poverty, poor dietary intake
and the development of diet-related chronic diseases, such as obesity (USDA.gov).
16

HEALTH DISPARITIES AMONG LATINOS
Although the U.S. population as a whole is experiencing high rates of diabetes,
obesity and overweight, Latinos are even more susceptible to developing these and other
nutrition-related conditions that are linked to low socioeconomic status (Roney, 2006,
Ramirez et al., 2007). Legal issues such as immigration status prevent some individuals
from qualifying for governmental food-assistance programs or Medicaid/Medi-Cal,
leaving them food insecure and without health care. Limited English proficiency can also
hinder Latinos from the ability to read food labels or understand nutrition and other health
information printed on food products (Haldeman et al., 2000). What’s more, there is little
to no dietary educational materials available to nonwhite populations that specifically meet
their needs (Parra-Medina et al., 2004). These issues also affect low-income Latino
families in San Benito County and therefore became a major focus for my research, which
I will discuss later.
Acculturation
Health disparities among Latino immigrants in the U.S. may be due in part to
acculturation, which is defined as the process of adopting the cultural habits, traits, and
ideals of another population through continued contact, while simultaneously losing
previously held traits (Cruz et al. 2008, Torres 2009). Evidence shows that the health status
of immigrants begins to deteriorate after a certain amount of time in the U.S., and many
scholars have viewed acculturation as the primary reason for disparities (Antecol and
Bedard 2006; Frisbie, Cho, and Hummer 2001; Singh and Siahpush 2002). In other words,
assimilation into the “culture” of mainstream society negatively influences the health
17

status of immigrants. The CFBSBC has become aware of these issues and realizes that
their food insecure clients are at risk of deteriorating health statuses, which has also been a
driving motivation for this research.
Obesity
Thirty-eight percent of low-income California Latino adults are now overweight,
and 31% of low-income California Latino adults are obese according to self-reported
heights and weights (UCLA Center for Health Policy Research, 2007). Overweight is
associated with an increased prevalence of cardiovascular disease, type 2 diabetes,
hypertension, dyslipidemia, osteoarthritis, stroke and some cancers (Burton et al., 1985).
Also of worry is the fact that more than 1 out of 3 (37%) Latino youths in California are
overweight or at risk of being (California Department of Public Health, 2005).
It is concerning that San Benito County has a higher percentage of obese children
than any other county in California (First5sanbenito.org). According to a study conducted
by the California Center for Public Health Advocacy (CCPHA) and the UCLA Center for
Health Policy Research (2011), 42.2% of school-aged children in San Benito County are
obese. This statistic is not surprising to me since a majority of the children I observed who
were accompanying their parents at the food bank warehouse and distribution areas were
apparently overweight.
Diabetes
Overweight and obesity is prevalent in San Benito County and are major risk
factors for diabetes. According to the Latino Coalition for a Healthy California (LCHC),
the statuses of health among Latino immigrants are a “paradox” (LCHC, 2005). Latino
18

immigrants have a tendency to be “younger and healthier;” however, economic and social
factors result in worsening health conditions (LCHC, 2005). Eleven percent of adult
Latinos in California have been diagnosed with diabetes. Approximately one in five
Latinos over the age of 50 (19.7%) have diabetes, which is double the rate for non-Latinos
(10.1%), and have the highest rates in comparison to all racial and ethnic groups (LCHC,
2005). Of those with diabetes, sixty-seven percent have type 2 diabetes. Moreover, in
California, diabetes accounts for 5.6 percent of all deaths among Latinos.
During my fieldwork and interactions with Latino food bank clients at least twenty
(mainly those over the age of 50) had diabetes or are at risk of developing diabetes. For
instance, when I assisted with distributing food, numerous clients did not accept the
pastries because they either had pre diabetes or were diabetic. Also, question number seven
on the survey asked: Are you able to use all of the food you receive from this food bank?
Almost sixteen percent of clients responded that they could not; however they did not
mention why. My conversations with them during interviews suggest that it is due to
having diabetes and or other dietary restrictions. Question number ten on the survey also
addressed diabetes and asked: Do you know that diabetes is common among
Latinos/Hispanics? Nearly 20% did not respond to the question or did not know it was
prevalent among their Latino counterparts and 67.3% responded that they were interested
in receiving nutritional counseling. Since the food bank routinely distributes sweets
donated from Starbucks and bakery items from local grocery stores, the food items
diabetic clients managing their disease can actually consume is limited; this needs to be
addressed and remedied.
19
LITERATURE REVIEW
Although there is a high prevalence of food insecurity among the Latino population
in the U.S., the only existing research that describes the effects of food insecurity among
them and how to improve their food behaviors and practices is being carried out by
nutritional anthropologists. I will review the literature that is available and highlight
discoveries and contributions that previous studies have been able to make in the form of
food and nutrition assessments, generational studies on acculturation, and a current
program that is aimed towards assisting Latino low-income families in improving their
health statuses.
Food and Nutrition Needs Assessments in the U.S.
From late 2002 to 2003, three researchers conducted a study in Pennsylvania to
explore factors of health and well being such as food choices, nutrition, food sufficiency
practices and nutrition education needs of Latino migrant workers. Focus group interviews
among Latinos in 5 different counties found issues that affect their food choices, which
included flavor, habit, tradition, and pleasure (Cason, Nieto-Montenegro and Chavez-
Martinez, 2006). This study found that acculturation led to dramatic changes in the
participants’ eating habits since their arrival in the U.S., such as not consuming as many
fresh fruits and vegetables because they consider them to be of poor quality and high price.
Palmeri et al. conducted a needs assessment of the dietary needs of low-income
Latina mothers in Denver, Colorado in order to provide nutrition education to them
(Palmeri et al., 1998). This research aimed to assess nutrition education necessities and
preferences, and to evaluate the Latina group’s obstacles and motivators to varying their
20

dietary behaviors. Four bilingual, bicultural researchers conducted interviews and asked
open-ended questions concerning nutrition education needs of the Latina group with
results indicating that they were interested in information regarding childhood nutrition,
lessons on preparing healthy meals and assistance with how to avert the unhealthy impacts
of acculturation. The most prominent barriers to change among the Latinas included a
shortage of money and time, food preferences, familial customs and differing nutritional
messages they received. In summary, the Latina group preferred interactive hands-on
learning methods to textual information since they were not fluent in English (Palmeri et
al., 1998).
In contrast, Hartman et al. (1994) conducted a two-phase study to develop
culturally appropriate nutrition education materials targeting low-income minorities. Five
focus-group discussions were led with participants including 39 female and 2 male clients
of the Expanded Food and Nutrition Education Program (EFNEP). The focus groups
included 23 African Americans, 9 Whites, 4 Southeast Asians, 1 American Indian, 2
Hispanic Americans, and 2 Middle Eastern EFNEP participants (Hartman et al., 1994).
Their main objective was to acquire information to design and develop a nutrition
intervention program targeted at a low-literacy audience. Their findings indicated that the
most requested means of receiving nutrition information involved printed materials
participants could keep, specifically healthy recipes and brochures.
Palmeri’s (1998) and Hartman et al.’s (1994) findings address the importance of
using multiple tools to disseminate information. Based on these two studies, and my own
21

research findings, it would be fruitful for the CFBSBC to utilize printed materials as well
as hands-on educational experiences, which I will discuss later in the report.
Acculturation
In a generational study of Latinos and their dietary behaviors, researchers found
that first generation Latinos consumed higher amounts of fruits and vegetables in their
countries of origin and lower soda consumption than whites. Post migration, fruit and
vegetable consumption declined and the consumption of soda increased significantly
among later generations. By the third generation, the nutrition of adolescents was poorer
than Whites (Allen et al., 2007). This study illustrated the Latino paradox—poor Latino
immigrants have better health than Whites when they first arrive in the U.S. despite
poverty and poor access to health care. The longer they are in the U.S. their health
deteriorates.
Similar to the previous study, Romero-Gwynn and Gwynn (1997) studied the
traditional and contemporary foods consumed by Latinos and provide examples of rapid
dietary adaptation, which is a commonly researched topic in nutritional anthropology.
Overall, there are healthy and less healthy trends in the modifications occurring in the core
diets of Mexican immigrants and first-generation Mexican Americans (Romero-Gwynn
and Gwynn, 1997). They mention healthy changes such as a moderate increase in the
consumption of vegetables and fruits, and a large decrease in the consumption of lard.
Nonetheless, they argue that this should not be interpreted as a decrease in fat in the diet.
Several non-traditional sources of fat have been integrated into the diets of many Latino
immigrants and Mexican Americans.
22

Although there has been a slight increase in the consumption of vegetables (13%),
the way in which vegetables are used are less healthy. What is resulting is lower
consumption of nutrient-dense vegetables in favor of less nutritious ones (Romero-Gwynn
and Gwynn, 1997). Other less healthy trends are increasing and impacting consumers’
health. For instance, although two fat-rich items have decreased in diets (lard and cream),
they have been replaced with fat-rich foods such as butters, oils, mayonnaise, salad
dressing, sour cream, ice cream, cookies and flour tortillas (Romero-Gwynn and Gwynn,
1997) Some of the other less healthy changes the authors discovered were the large
increase in sources of sugars (high-sugar drinks, cookies and perhaps breakfast cereals).
There has also been a major decline in the consumption of traditional, beverages such as
aguas frescas, atole, horchata, and teas and have been replaced by Kool Aid®, Tang® and
soft drinks (Romero-Gwynn and Gwynn, 1997).
The authors conclude that understanding the past and present dietary patterns of
Latinos can directly benefit this growing population in two distinct ways: “(1) use of
certain traditional foods can help maintain self-esteem and group solidarity while
decreasing cost-of-living expenses for Latino families, and (2) nutrition-related health
conditions associated both with less healthy food practices and with low-income status can
be decreased through appropriate intervention,” just as the CFBSBC will attempt to do in
the near future (Romero-Gwynn and Gwynn, 1997).
Nutrition Intervention Guided by Theory
Literature shows that food banks can play an important role in offering food and
nutrition education to low-income families. Community food banks that do provide recipes
23
and cooking demonstrations that are low-cost, simple and nutritious claim that their clients
heavily rely on such services. However, it is crucial that nutrition interventions that are
geared towards food bank clients consider the specific needs and barriers of its minority
populations. A “natural helper model,” a theory that has helped explain how an individual
who is trustworthy and knowledgeable about cooking and is culturally sensitive to the
needs of the population can be effective example for others to observe and develop new
behaviors (Auld and Fulton, 1995). Along with natural helpers, the “social cognitive
theory” (SCT) can help support interactive learning approaches by illustrating how
participants can expand their understanding and abilities by observing and modeling
behaviors (Glanz et al., 2002).
The Network for a Healthy California
The Network for a Healthy California—Latino Campaign, also referred to, as the
Network is a public health campaign, created in 1997. Its objective has been to “empower
low-income Latino adults and their families to consume the recommended amount of fruits
and vegetables and enjoy physical activity every day” (cdph.ca.gov, Latino Campaign).
Since the USDA funds the Network campaign, it has established guidelines requiring that
Network programs be targeted only to Supplemental Nutrition Assistance Progam (SNAP)
or food stamp recipients and households whose incomes are at or below 185% of the
Federal Poverty Level (cdph.ca.gov, About Us).
In addition to encouraging low-income Latinos to eat the suggested amounts of
fruits and vegetables and to engage in physical activity daily, the Network also strives to
work with Latino communities throughout California to “create environments where these
24

behaviors are socially supported and accessible” (cdph.ca.gov, Latino Campaign). Thus,
the Latino campaign employs a combination of “culturally and linguistically suitable
media” and community-based methods to aid in its objectives. The media comprises of a
“Toolbox Kit” including lessons with supporting handouts, evaluation tools, a poster,
music CD, two educational videos (English and Spanish), five decks of fruit, vegetable and
physical activity playing cards and a produce guide (cdph.ca.gov, Network Toolbox). The
toolbox kit also has a companion Web site to further aid the user(s) in learning about how
to consume more fruits and vegetables and participate in physical activities.
The Network Latino campaign has been in place for over fifteen years; however,
heart disease, cancer, stroke and diabetes still account for 60% of all deaths among
California Latinos and the numbers are rising (cdph.ca.gov, Death Records). I would
consider this campaign not as effective as it has the potential to be since the statistics are
not reflecting any improvements in health disparities among Latinos. This may be due in
part to the manner in which the notion of risk is being addressed. Moreover, although some
food education programs and campaigns like the Network exist, they can be improved by
being integrated into an overall food access plan. Coordinated communication and
collaborative educational goals among farmer’s markets, government programs, school
curriculums and food banks may leverage resources and offer a stronger impact on healthy
lifestyles.
This is a daunting task; however, it is possible. What would be beneficial is to
place less emphasis on race and ethnicity as dominant elements of culture. It would be
fruitful for programs and campaigns to take into account the barriers to “healthy
25

behaviors” diverse populations face based on elements such as age, gender, geographic
location, socioeconomic status and cultural beliefs.
CONCEPTUAL FRAMEWORKS
The aforementioned literature review reveals that some studies have failed to link
development projects to a behavioral theory, which may aid in connecting positive
behavior changes to desirable health outcomes. This project utilized the social cognitive
theory (SCT) and natural helper model as conceptual frameworks since the latter has aided
me in strategizing the development of effective nutrition education programs at the
CFBSBC and the latter may help with the execution of my recommendations.
Natural Helper Model
An emerging theory known as the “natural helper model” is being employed by
researchers to organize focus groups and pre-testing of educational nutrition materials
(Eng & Parker, 2002). The term “natural helper” refers to a person who others rely on for
guidance and support with different situations (Eng & Parker, 2002). Natural helpers can
offer spontaneous and informal guidance or support to others in their community. Public
health agencies like the Centers for Disease Control are familiar with the considerable
influence social networks have on an individual’s health and fruitful interventions
involving nonprofessional health mentors.
In my research, identifying and recruiting natural helpers already proved to be
instrumental. One way this needs assessment relied on the natural helper model was by
recruiting the help of a bilingual community organizer, Dolores, to help organize the focus
group sessions. Dolores has a wide-ranging social network of low-income Latina women
26
and children and is often turned to for advice and referrals due to her ability to speak
English and her connections and familiarity with agencies and resources in San Benito
County.
Natural helpers may also be utilized to disseminate the information provided by the
CFBSBC after the development of the educational programs and distribution of materials.
What will hopefully occur is what is metaphorically referred to as a domino or mechanical
effect where a chain reaction occurs and a small change causes a similar change nearby,
which then causes another similar change in a linear sequence (Lorenz, 1963). In regards
to nutritional education, someone who attends the nutritional and cooking classes and
learns alternative recipes to common Latino meals will then teach friends, family and
neighbors what they have learned. This interactive learning approach illustrates a facet of
the social cognitive theory where participants increase their knowledge and skills by
observing and modeling behaviors (Glanz, Rimer, and Lewis, 2002).
Social Cognitive Theory
“Social cognitive theory” (SCT) is a multidimensional causal theory in which self-
efficacy beliefs function along with goals, outcome expectations, and perceived obstacles,
including social and environmental barriers to behaviors, motivations and well being
(Bandura, 2004). An individual’s thoughts and behaviors are constantly shifting since they
are affected by their surroundings; thus, SCT helps to explain the complex connections
between the causes of obesity and the personal, behavioral, and environmental influences
that affect eating behaviors (Baranowski et al., 2003). SCT incorporates the individual, his
27

or her environment, behaviors, and explains how a change in one of these dimensions
causes a change in the others (Baranowski et al., 1997).
Figure 3: Social Cognitive Theory Model.
The concept of reciprocal determinism (central to SCT) explains how the person,
behavior and environment continuously influence one another. SCT encompasses other
concepts such as situation, behavioral capability, expectations, expectancies, self-control,
reinforcements and emotional coping responses (Baranowski et al., 1997). However, I will
be focusing on the following concepts since each have unique implications for guiding
health interventions and will help enhance the design of the proposed nutritional programs
for the CFBSBC. They include self-efficacy, behavioral capability, observational learning,
outcome expectations, and reciprocal determinism.
28

According to SCT, self-efficacy describes an individual’s level of confidence in
performing a behavior—an example relevant to this project is cooking healthy low fat
foods. Studies have shown that dietary interventions and educational materials aid
individuals in realizing their goals (Haldeman et al., 2000, Parra-Medina et al., 2004).
Behavioral capability and observational learning denotes observing and developing the
knowledge and skills to perform a new behavior. Guiding individuals with new skills
through watching and repetition gives one more confidence and the ability to foster a sense
of achievement. Outcome expectations are the preemptive costs or returns that result from
performing a certain behavior. For example, choosing to consume more fruits and
vegetables versus high-caloric snacks could lead to weight loss. Moreover, if Latinos
acquire the skills to prepare healthy versions of traditional meals, they will be motivated to
make positive dietary behavior changes. Change is less of a threat to their culture; it offers
the opportunity of cultural continuity, which is very important to individuals with such a
strong cultural identity (an identity which is under assault). As a result, their family
members will also start to model healthier eating habits. Familial exposure to healthier
eating habits facilitates their acceptance and emulation. Thus, instructing people on how to
design their own “action plan” for dietary changes may be an effective and empowering
way for them to create goals and adhere to them (Seligman et al., 2007).
METHODS
I am a bicultural and bilingual community member of San Benito County who
designed the research materials and conducted all of the data collection starting in
November 2012 through February 2013. I spent approximately 45 hours in the field and
29
recruited approximately 115 participants for the data collection. This needs assessment was
designed as a qualitative research study of the food preferences, experiences and needs of
current CFBSBC Latino clients. Methods for data collection consisted of interviews, focus
groups and surveys. A reason for these multiple methods was to compensate for bias that
could be introduced by low numbers of participants. According to Yancey et al., (2006)
there are barriers to recruitment in research on minority populations since there are
perceptions of mistrust of scientific investigators, of government, and of academic
institutions.
Project Instruments
The research methods for this assessment were drawn from the approaches
described by H. Russell Bernard in his book, Research Methods in Anthropology:
Qualitative and Quantitative Approaches (2011). I utilized the text as a guide to design
questions for the survey, interviews and focus group queries. The interview questions were
more specific while the focus group questions were broader. For the latter, I created a
series of strategic questions beginning with general ones followed by those that are most
descriptive. The strategy behind this was to get participants to open and up and feel more
comfortable to share personal information as the questions progressed. Other
anthropological methods, such as recruitment, participant observation, and research design
came from LeCompte and Schensul’s Designing and Conducting Ethnographic Research
(2010).
Population Sample
30

This study drew its sample of male and female Latino food bank clients who are
over the age of eighteen and reside in San Benito County. I personally handed out surveys
to every Latino client if they identified themselves as “Latino” or “Hispanic.” The sample
included individuals who trace ancestry to Mexico, Central, and South America and one
person from Portugal who identified herself as Latina/Hispanic. Four interviews and three
focus groups were conducted with three specific populations: (1) Latino adults under the
age of 55, (2) Latino parents of elementary age children and (3) Latino seniors over the
age of 55. The countywide survey was completed first and took place the first three weeks
of December. Data I received from the surveys helped to direct the interviews and focus
groups, which were conducted in the months of January and February 2013.
Participant Recruitment
Although the original objective for this needs assessment was to conduct three to
four focus groups (n=3-4 participants each), recruitment challenges led to interviewing
smaller groups of participants at a time (n=2 participants per focus group, n=4 individual
interviews). In contrast to the focus groups and interviews which collected data in group
settings and via dialogue with the researcher respectively, surveys were a more feasible
way of collecting information since participants had fewer reservations about sharing
personal information being that it was more anonymous. Although a randomized selection
would have been optimal, most of the Latino food bank clients were standoffish and
unwilling to be interviewed. However, the apprehension to give out personal information
to “officials” is to be expected when approaching a low-income population, especially if
they are undocumented.
31
For the reasons mentioned, I found it necessary to utilize my personal connections
and “natural helpers” within the community to recruit participants, and for those people to
tell their friends and neighbors about the study (snowball technique). It was proven that
this method worked since many food bank clients knew who I was before I could even ask
them to participate in the survey and even mentioned details such as knowing that the
surveys were printed on green paper.
Since women within the Latino population are typically the caretakers of the family
and responsible for purchasing and preparing the foods consumed in the household, I
focused my efforts on recruiting more women than men for the interviews (Macario et al.,
1998). As mentioned earlier, I utilized a contact I have with a community organizer from
the Hollister Youth Alliance who is regarded as highly trusted by a large group of Latino
women in Hollister called Las Comadres (The Co-mothers). Through her, I was able to
recruit women to conduct the focus groups.
Las Comadres meetings are held twice a month in the Rancho Apartment’s
community center where most of its residents are of Latino descent. These meetings offer
women the opportunity to build community and social networks and enable them to get out
of their apartments, congregate and discuss everything from what is going on in their lives
to sharing recipes. When I attended the meetings, and conducted the focus groups, I
provided pan dulce (Mexican sweet bread) and cookies. These meetings enabled me to
build rapport and relationships with the comadres. To establish my position, I explained
that I was not affiliated with the food bank and was conducting the research for a college
requirement. I also shared my Latino background with them and my ambitions to support
32
and represent our “raza” (race) by growing produce at my community farm that Latinos
use frequently to prepare traditional meals and the importance of this research project. My
transparancy proved to be effective since they agreed to participate in my study (with an
exception of one person) and shared fruitful information that I could provide to the
CFBSBC to better serve its Latino clients.
Strengths and Limitations
Limitations to this study include small sample size, no randomization in recruiting
participants, and limited generalizability. Despite the small number of participants (n=8)
involved in the focus groups and interviews, they are representative of the Latino
community in San Benito County and as such, the data collected reflects the needs and
preferences of the target population.
A noteworthy strength of this needs assessment was recruiting community
members to act as “natural helpers” in this project (Eng & Parker, 2002). Natural helpers
were an important part of spreading the word about the intended research and will be
instrumental in disseminating the nutritional information provided in the printed materials
and hands-on educational programs the CFBSBC plans on providing. For example, a
Latina who receives the nutrition education materials and/or attends the various nutritional
education classes may share tips on healthy alternatives to traditional meals and portion
control the next time she is visiting a friend or family member.
DATA COLLECTION
Participant Observation
33

The methods I utilized in my research were ethnographic in nature. I conducted
participant observation by volunteering at the food bank for the month of December. Since
the food bank is closed on Sundays and Mondays, a typical week for me started on
Tuesday when I would go to the agency store in San Juan Bautista from 9am to 2pm.
Wednesday was spent distributing food at the Prospect and Villa apartment complexes
from 12:30pm to 1:30pm followed by a distribution at the senior citizen community center.
On Thursday I rode along with a delivery person for the home distributions from 12:30pm
to 3:30pm, and then distributed food at Dunne Park and near a bridge to a homeless
encampment. On Friday I helped distribute food at the food bank warehouse from 9am to
3pm and every other Friday I left the warehouse so I could help distribute food at
Sunnyslope Christian Church at 11am. I distributed food from the food bank’s warehouse
on Saturday from 9am to 12pm and also made deliveries to the Southside labor camp
every other week at 8am followed by a distribution at the Rancho apartments.
My participation in the distributions proved to be invaluable since it allowed me to
note the types of foods the CFBSBC dispenses, listen to clients’ candid remarks regarding
the foods they receive and observe strategies they employ to get “the good food.” For
instance, although the food bank warehouse opens at 9am on Friday and Saturday
mornings for distributions, clients would begin to line up at the metal garage/type door as
early as 7:30 am. I realized this the first time I went to the food bank extra early to make
copies of the surveys and to set up a table where I would lay out several clipboards and
pens. When I asked an elderly gentleman who was at the front of the line why he was there
so early and standing in the cold, he responded, “The good food goes first.” Since the
34

warehouse is now set up where clients can pick and choose which foods they would like to
take home (versus the pre-built bags that go out for distributions), the more desirable and
popular foods are selected first. Besides observing what occurs during distributions, I was
able to create a rapport and form relationships with not only the food bank clients but also
the employees and volunteers, which enabled me to gain their trust and gather
supplementary data for the surveys, interviews and focus groups.
Surveys
Based on the ideation phase of this research project and information the CFBSBC
could utilize for applying for grants and implementing customized inventories and
educational programs, I drafted a survey in English and Spanish (see appendix B). Some
participants agreed to fill out the survey on location (approximately 80%) and others
(approximately 20%) preferred to take it home and return it at a later date. Those who took
the surveys home explained that they either did not have time to fill it out, did not have
their reading glasses with them, had an appointment to get to, or needed a friend/family
member to fill it out because they were illiterate. Approximately 30 clients took the
surveys home and roughly 24 of them were returned. Of the 101 surveys that were filled
out, 44 were not filled out completely. The questions that were left unanswered were
mainly concerning the number of children and adults living in the home, country of origin
and if they knew the causes of obesity. The 24 surveys that were answered incorrectly
were regarding food preferences where many made check marks under the food staple
categories versus naming four foods under each category.
35

During my survey distributions, I learned a lot about Latino food bank clients in
San Benito County since many saw me as a potential source of answers and/or someone
with whom to share their concerns and to complain about the quality of the food. A
conversation that left an impression on me was with a homeless Latino man who I will
refer to as Mario, who lives under one of the bridges in Hollister. During a warehouse
distribution, I saw Mario waiting in line with other food bank clients. I recognized him
from a story that the food bank receptionist told me a week prior. She is fairly new to the
organization and explained that when she first met Mario, he walked into the office to
provide some needed information the CFBSBC had requested of him. She said that he was
very tall, hairy, with weathered skin and was wearing clothing all made of leather. She was
so afraid and intimidated by his appearance that she sprung out of her seat and ran to the
accountant’s office. The accountant explained to her that he was harmless and not to worry
so the receptionist agreed to attend to him.
Mario stood out from the rest waiting in the warehouse distribution line. He was a
muscular man in his 40s and wearing a leather outfit. When I approached him and gave
him my speech about the survey and the benefits his feedback could bring to him and other
Latino clients, he happily gave up his place in line and took the time to fill it out. After he
completed the survey he suggested that the food bank provide more canned foods with flip
tops. When I asked why, he explained that the Hollister Police Department keeps a very
close eye on the homeless population that lives under the bridges and monitors them
frequently. They are not allowed to brandish any types of knives, not even butter knives,
which is why he stated that they would appreciate cans that are easy to open with their
36

bare hands. When I asked if there was anything else he would like me to report to the food
bank director, he cupped his mouth with his gloved hand and whispered to me that the
homeless women do not have access to sanitary products and would appreciate if the food
bank could periodically provide them. Immediately following our conversation, I went to
the director’s office and explained this population’s needs, which she took note of. Mario
was instrumental in drawing attention to the needs of the homeless population and the
forms of state surveillance (in the form of monitoring by the police) they routinely deal
with and how this impacts even their ability to nourish themselves.
Focus Groups
Two focus groups were conducted in the community center at the Rancho
Apartments in Hollister (see Appendix C), which lasted an average of an hour each. There
were no other adults present except for the participant’s children or grandchildren. The
first focus group consisted of two women, born in Mexico who are mothers and wives.
Margarita was 34 with two young children and has lived in the U.S. for 13 years. Ruby
was 67 with an adult daughter and has lived in the U.S. for 23 years. The second focus
group also consisted of two women who are wives and mothers. Lupe was 52 with three
children in their teens and has lived in the U.S. for 9 years and Maria was 26 years old
with a young daughter and has lived here since she was 20 years of age.
Focus group 2 was originally supposed to comprise of three women; however, one
decided to leave at the last minute claiming she had to suddenly care for her grandchildren.
When she initially walked into the community center, she was smiling and greeted the
other Comadres warmly. Once I was introduced to her and I explained the survey and
37

focus group questions, she became very quiet and serious and said and at this point stated
she had other commitments. Her reaction led me to believe that she felt uneasy about the
situation and perhaps did not feel comfortable sharing personal information with me, a
stranger.
It was also difficult to get a participant named “Maria” to engage at the beginning
of the focus group. She had issues with giving her real name and even asked if the audio
recording would be played on the radio. I explained several times that her identity would
remain anonymous and read the entire consent form to her aloud. Yet, when I began the
focus group she kept asking if she had to give her real name. Two participants from the
previous focus group were also present for the first part of this focus group; however,
Maria still felt uneasy at the beginning about sharing personal information. However, as
the interview went on, she loosened up a little and as the questions continued, she was
eager to share information, especially in regards to her opinions of fast foods and the lack
of freshness of foods here in comparison to those in Mexico.
I wondered what motivated these women to participate given that they had their
reservations. Although they did not state it outright, I assume that not all of them were
documented immigrants. I would attribute them agreeing to participate in my study based
on the fact that I established from the outset that the CFBSBC is not a government agency
and does not require that clients have legal immigration statuses to receive services.
Interviews
38
I conducted four semi-structured conversation style interviews with four food bank
clients (see appendix D). Due to recruitment issues, I walked up to random food bank
clients who were picking up their food at the CFBSBC warehouse and was able to recruit
three females and one male to participate; all four were born in Mexico. The focus group
and interview instruments were very similar and yielded similar information. However, the
focus groups proved to be more effective since they built on the dynamic of a conversation
and participants were willing to share more and discussed things others present brought up.
In contrast, those who were interviewed gave short answers and although I utilized the
technique of probing, I was still not able to obtain the quantity of information I did with
the focus groups. These interviews were done in open public areas but far enough to where
others in the warehouse could not hear.
KEY FINDINGS
Clients commented about the foods that were being distributed on different days as
well as their concerns and opinions. Some clients complained about the quality of food and
the frequency of receiving certain produce like the lettuce. As one Latina client stated to
me, “Why do they give us so much lettuce? We’re not rabbits.” Some clients who were
concerned about their health care benefits being negatively affected if they received food
from the food bank. An elderly food bank client who was picking up food at the Ranch
apartment complex asked the delivery person in Spanish, “Will getting this food affect my
Medicare benefits?” He and I immediately responded that the CFBSBC was not linked to
any federal health programs and receiving food would in no away affect her healthcare
benefits. Instances like this reaffirmed the existence of misconceptions about the food
39

bank, which may also hinder eligible low-income families from enrolling in food bank
services. Moreover, they also suggest that there are many other misconceptions that may
be affecting this population.
Although I do not qualify to receive food bank services, I was still able to act as a
client and acquire a bag of food. I requested an “emergency bag,” which community
members can receive as long as they provide a driver’s license. As it was explained to me,
anyone can receive two emergency bags in a one-year span without having to provide
proof of income, a social security number or any other documents.
As mentioned earlier, unlike the pre-built bags sent out on deliveries, the food bank
warehouse now allows its clients to choose which foods they would like to take home. I
chose canned foods such as tuna, salmon and chicken broth, bags of spinach and salad
mix, several bags of frozen sausage patties, a French bread and a cake. A day or two after I
received my food I began to understand what the food bank clients were asserting. For
example, the only produce provided were different varieties of lettuce and salad mixes,
which were either wilted and/or had already expired, the canned foods did not have flip
tops and were consumed in one day, and the large birthday cake was hardly eaten because
of its size and the high sugar content. The experience of receiving a bag of food and
attempting to prepare meals with it helped me to better understand the CFBSBC’s clients’
comments that the variety of foods available are limited, there were many items my family
does not usually consume and most of the produce was either expired or went bad after
two days.
Data Analysis
40

The interviews and focus groups were recorded using an audio recorder and were
initially transcribed verbatim in their respective languages (e.g. English or Spanish) with
those that were conducted in Spanish interpreted into English. Since I am bilingual and
worked as a professional translator in a hospital for years, I did most of the translating
myself. However, I identified unfamiliar words and concepts, which required me to utilize
a secondary female translator who was born in Mexico, more knowledgeable with food
and cooking terminology and was able to review and edit the initial translation.
An independent translation group of two women of Mexican descent also reviewed
draft translations to ensure that the words and idioms selected were translated correctly
and to confirm that vocabulary and phrasing choices were consistently applied throughout
the data. The translation problems and issues that did arise were resolved through
discussion and compromise. For instance, I found that Spanish words for some food items
differed in different regions of Mexico (i.e., beans, breads, cheese, chicken skin, popcorn,
edible roots, cooking pots/pans and the term chopped).
In order to protect the participants’ confidentiality, their names and any identifying
information were deleted from the transcripts. Once edited, I analyzed the data to identify
recurring themes and to determine thematic categories. The completed surveys (n=101, see
appendix E) were numbered, coded and analyzed using the Statistical Package for the
Social Sciences (SPSS).
Results of Quantitative Analysis
41

Most of the surveys were completed at the food bank warehouse (53.5%) followed
by distribution sites (41.5%) and Las Comadres gatherings (5%). Sixty four percent of the
surveys were completed in Spanish and 36% were in English with a majority of
participants being female (74.3%). Sixty one percent of the Latino clients claimed their
country of origin is Mexico and more than half of the participants are married (51.5%).
Figure 4: Food Bank Clients’ Countries of Origin.
Similar to findings from a study by Gans et al, in 1999, some of the most frequently
mentioned dietary staples were chicken (41.6%), beans (54.5%) and rice (20.8%). Other
commonly mentioned staples are listed in Figure 5.
42

Figure 5: Most Commonly Mentioned Food Staples.
Eighty five percent of food bank clients claimed that they are aware that diabetes is
prevalent among Latinos and 80% stated they know the causes of obesity. However, when
asked if they could give two examples of obesity prevention, 27% could not list examples.
Those who did answer mentioned eating healthy (36.6%) while 28% stated that both
exercise and eating healthy prevent obesity. Thus, there was a discrepancy among 13% of
survey respondents who claimed that they know how to prevent obesity but could not
explain how to prevent it.
The majority of Latino food bank clients showed an interest in services (Chi-square
= 52.762, P = 0.001). Sixty seven percent stated that they are interested in nutrition
43
counseling, 58.4% are interested in attending cooking classes and 62.4% would like to
receive healthy recipes. Survey participants were also able to indicate multiple service
preferences.
In regards to the number of meals the Latino clients prepare at home on an average
day, 82% responded that they fix two to three meals and a similar percentage (80.2%) are
able to use all the foods they receive from the CFBSBC. The latter statistic is surprisingly
high since seven out eight interviewees and numerous clients I spoke to during
distributions stated that they and others they know are not able to use a lot of the food and
give it away to neighbors, friends and family. Thus, what I observed is different than what
I originally expected: a majority of food bank clients do consume all the foods that are
distributed to them (Chi-square = 452.762, P = 0.001).
For the survey question I included to better understand the under enrollment of
Latino clients, a majority (62.4%) stated that they know that immigration does not affect
eligibility to receive food bank services. However, while I was helping with distributions,
twenty-four clients stated that they or others they know do not understand that immigration
status does not affect their ability to enroll at the food bank. While conducting focus
groups and interviews, eight out of eight participants mentioned that they know people
who do not enroll due to paranoia and fears of giving personal information about their
families (i.e. immigration status, social security numbers and getting paid “under the
table”). And once again, what I observed was different from what I expected: I expected
clients to state that they did not know that immigration status does not affect eligibility at
the food bank but they actually do know (Chi-square = 4093.783, P = 0.001).
44

The preceding results were not able to support my hypotheses that low-income
Latino families with children are not enrolling in services, that clients do not consume all
the foods provided by the CFBSBC and that clients are not aware that immigration status
does not affect their ability to receive food bank services. Nonetheless, I will include
suggestions for the CFBSBC in this report that will aid them in providing foods that Latino
clients will be sure to consume, recommendations on how to conduct outreach to increase
the enrollment among families with children and those who are undocumented immigrants.
Discussion
One of my original hypotheses was that there is an under enrollment of low-income
Latino families with children at the food bank. Although 60% of clients who filled out the
survey claimed to have children, during the ideation phase of my project, the director of
the CFBSBC stated that the numbers of this population are much higher in San Benito
County. However, she was unable to locate or provide a statistic. I contacted the directors
of the Health and Human Services Department and the Women, Infants and Children office
(WIC) in San Benito County, all of which stated that they do not have such a statistic.
Therefore, I was not able to prove that low-income Latino families with young children are
not utilizing food bank services. This lack of data is also alarming since the population
cannot be assisted if there has been no previous research done on it.
Based on my time speaking to people in the field and conversations with
interviewees, they were more likely to speak candidly in person about the quality of foods
the food bank provides, the food options available to them, and admitted that they do not
consume everything given to them. Most stated that they either give the food to friends,
45

family or neighbors. Since the feedback I received face-to-face differed significantly from
what was written on the surveys, my assumptions are that they might have had
reservations being honest on a formal document like a survey. Moreover, in answering that
they were not able to use all the food, they might have been fearful that such a comment
might threaten their access to services.
My final hypothesis was that most food bank clients do not know that immigration
status does not affect one’s ability to receive food bank services; however, a majority of
people who completed the survey (n=63) stated that they did know that immigration status
does not affect one’s ability to receive these services. This data revealed a disconnect
between those who filled out the surveys and participated in the interviews from non-
clients they have spoken to about it. It may be that those who went to the food bank and
filled out the surveys did have information about immigration status and its affect on
receiving assistance. Those who fear deportation were unlikely to be present at the food
bank and, therefore, would not have completed a survey. The more personal interviews, on
the other hand, provided people an opportunity to discuss this dilemma with a sympathetic
listener and they told stories of others they knew who might have been frightened to use
food bank services due to their illegal immigration statuses. This solidifies my reasoning
for suggesting that the CFBSBC perform outreach to the community to dispel the myths
that immigration status affects food bank eligibility.
The preceding quantitative results were not able to support my hypotheses that
low-income Latino families with children are not enrolling in services, that clients do not
consume all the foods provided by the CFBSBC and that clients are not aware that
46
immigration status does not affect their ability to receive food bank services. Nonetheless,
I have included suggestions for the CFBSBC in this report that will aid them in providing
foods that Latino clients will be sure to consume recommendations on how to conduct
outreach to increase the enrollment among families with children and those who are
undocumented immigrants.
Focus Group and Interview Themes
The first and most common theme among Latino food bank clients was employing
economic strategies in order to have sufficient funds to purchase food. This includes
closely monitoring food prices and sales, and traveling to multiple locations for the best
deals. For instance, one respondent stated, “Safeway yes, we go there sometimes. Right
now the chicken is 29 cents [per pound].” Another food bank client asserted, “A can of
tuna is like $2, but in Salinas I get those cans for less than a dollar. Everything is cheaper.
Sometimes here [Hollister], a pound of tomatoes is $1.19 and over there [Salinas],
sometimes it’s up to 3 pounds for $1.” The city of Salinas is approximately 27 miles from
Hollister; however, Comadres from focus group 1 discussed splitting the cost of gas to
travel to Salinas the next time they need to purchase groceries.
The second theme that was prominent among interviewees was that of traditional
foods and nostalgia. When we discussed eating routines here versus in their country of
origin (Mexico), the participants’ faces lit up and there was a lot of laughter. Reminiscing
about their lives in Mexico made them pep up physically and verbally. During the focus
groups, participants were very happy, laughing, speaking more and talking over each other.
They recalled how fresh the food was and some stated that their diets have changed to
47
accommodate their children’s requests and because of the high prices of certain food
staples. This theme reflected dietary acculturation and the topic of American fast foods and
the amount of oil and fats they contain came up frequently. There were a lot of criticisms
about the meat that is sold in stores and restaurants in the U.S. and the interviewees
wondered about the origins of food and how long meat proteins have been refrigerated or
frozen. They boasted about the ability to purchase fresh meat from markets in Mexico and
that the animal was either slaughtered that morning or the day prior. They also mentioned
that their children enjoy eating pizza and hamburgers with french fries and would prefer
such food and snacks like potato chips and Goldfish crackers over traditional home cooked
Latino dishes. The Comadres did not seem too concerned with their children’s food
preferences and laughed it off with the attitude that “kids will be kids.”
Lastly, the theme of “living by the clock” surfaced from interviews and focus
groups. Participants discussed how structured their daily schedules are in the U.S. in
comparison to Mexico. As one woman stated, “Here you have a routine and by nine you’re
asleep.” Most stated that they used to eat three times a day, but in the U.S. “the hours are
different” and they eat only twice a day. Another woman mentioned, “Here you live by a
clock.” These metaphors reminded me of American notions of time such as “time is
money,” or “working 9 to 5.” It also helped me realize how difficult it must be for these
immigrants to adjust to American times and the labor market when they are coming from a
place where people live in subsistence economies and have a different relationship to
nature.
48

Food Preferences and Resisting Acculturation
It is critical to recognize that immigrants from other countries have differing beliefs
and positions regarding their health and dietary practices. When these individuals or
families migrate to the U.S., fear of losing their cultural traditions and values may impact
their willingness to acculturate. Some immigrant families resist acculturation in an effort to
preserve their traditional ways of life as much as possible, which includes rejecting
American approaches to healthy eating. As one CBFSBC client stated:
“Well thank God, we’ve been able to eat well and accustomed to eating
food with fats, meats, and that’s what we’re accustomed to and it’s
difficult to change what we eat. Our grandparents, parents—we come from
generations that eat like that... Yes, I understand the difference between
eating healthy and not, but we don’t do it.”
Other participants mentioned this belief as well and viewed eating proteins with high fat
contents as a luxury and symbol of their family’s wealth and prosperity.
Under Enrollment
A misconception exists among the immigrant community in San Benito County
that food banks are affiliated with the government. This has become a major barrier for
undocumented Latino immigrants in accessing emergency food from the CFBSBC. Latino
immigrants are confusing the services that the food banks provides with state or federal
programs such as Supplemental Nutrition Assistance Program (SNAP) Women, Infants
and Children (WIC) and the Medicare/Medi-cal program, which needs to be addressed
through outreach.
49

RECOMMENDATIONS FOR THE CFBSBC
Utilizing the results from this needs assessment will aid the CFBSBC in increasing
the number of Latino clients it serves, customizing its inventory to better serve its Latino
clients and developing strategies to increase the knowledge, self-efficacy and family
support for efforts such as cooking and nutrition classes and educating them on how to
modify traditional recipes to make them more healthy. However, any nutrition
interventions and dietary programs the food bank decides to provide should also include
culturally appropriate approaches.
The Latino population encompasses numerous subgroups whose eating patterns
vary considerably, such as those from Mexico, Puerto Rico and Caribbean, South and
Central America. However, since a majority of Latinos living in San Benito County were
born in Mexico (61.4%) or are of Mexican descent, the suggested educational programs
and materials will focus primarily on Mexican Americans.
The research conducted in this project reveals that the Latino food bank clients are
interested in educational tools that could aid them in improving the quality of their health
and family’s diets. Input from members of the target population can help inform decisions
for program implementations and feedback can also guide revisions of the final products to
ensure cultural-acceptability and appeal. Furthermore, it is crucial to involve the Latino
food bank clients in every step of the program and material development process in the
form of pilot tests.
50

Nutrition Counseling
It would be advisable for the CFBSBC to hire a bilingual nutrition specialist to aid
in developing and guiding the nutritional counseling program. The program should include
nutrition education, balanced meal plans and exercise plans for body weight control. There
should also be a focus on the importance of family meals and eating as a unit. According to
Weinstein (2005), when families share a meal together, family bonds become stronger,
family members eat more nutritional meals and they are less likely to be overweight.
For the purposes of individualized nutrition counseling, it would be preferable to
determine specific information regarding consumption practices at the individual level
rather than assuming that the commonalities discussed in this report apply to all Latino
food bank clients. Additionally, the counselor (who must also be bilingual) should engage
clients in an interactive conversation to encourage them to specify examples of how to
apply the educational information to their own distinct likings and cultural practices. This
type of collaboration will not only empower the food bank clients but also educate the
counselor about the Latino culture.
Because many Latino food bank clients claim to be diabetic, nutrition counseling
targeted towards them should also be implemented. Several stated that they think they
know which foods are appropriate to consume; however, as a food bank client stated, “I
get a lot of sugar when I eat chile relleno because—I think because of the cheese—the oil,
is what I think.” She is not certain as to what foods breakdown into sugar; therefore, it is
crucial that food bank clients with dietary restrictions be educated and assisted.
51

Healthy Recipes
In order for Latino clients to learn healthy alternatives to traditional meals, the food
bank should provide recipes that reformulate traditional dishes and introduce low fat
cooking methods such as grilling, stewing, roasting and baking. As the example shows in
figure 6, recipe cards could be created with color photos of the finished dishes
accompanying them.
Figure 6: Vegetable Enchilada Recipe. Courtesy of cdph.ca.gov.
Ideally, the cards would be two-sided with an English version on one side and Spanish on
the other. The California Department of Public Health launched a public health campaign
called “Champions for Change,” which provides numerous healthy Latino recipes that the
CFBSBC could utilize for inspiration (cdph.ca.gov).
52
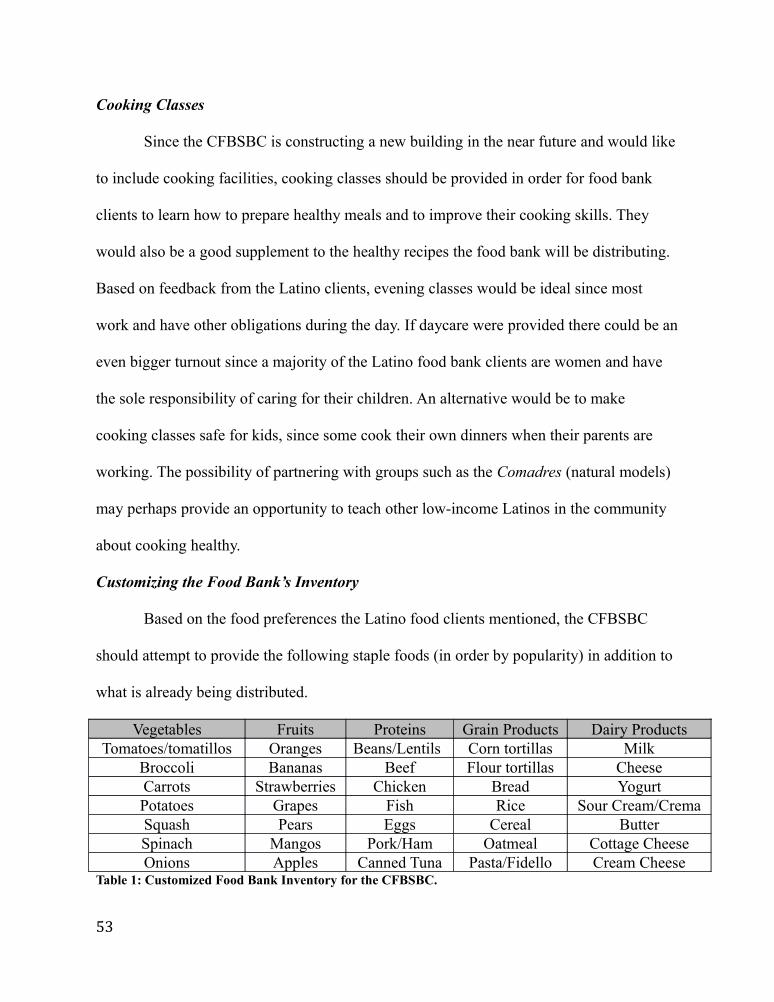
Cooking Classes
Since the CFBSBC is constructing a new building in the near future and would like
to include cooking facilities, cooking classes should be provided in order for food bank
clients to learn how to prepare healthy meals and to improve their cooking skills. They
would also be a good supplement to the healthy recipes the food bank will be distributing.
Based on feedback from the Latino clients, evening classes would be ideal since most
work and have other obligations during the day. If daycare were provided there could be an
even bigger turnout since a majority of the Latino food bank clients are women and have
the sole responsibility of caring for their children. An alternative would be to make
cooking classes safe for kids, since some cook their own dinners when their parents are
working. The possibility of partnering with groups such as the Comadres (natural models)
may perhaps provide an opportunity to teach other low-income Latinos in the community
about cooking healthy.
Customizing the Food Bank’s Inventory
Based on the food preferences the Latino food clients mentioned, the CFBSBC
should attempt to provide the following staple foods (in order by popularity) in addition to
what is already being distributed.
Vegetables Fruits Proteins Grain Products Dairy ProductsTomatoes/tomatillos Oranges Beans/Lentils Corn tortillas Milk
Broccoli Bananas Beef Flour tortillas CheeseCarrots Strawberries Chicken Bread YogurtPotatoes Grapes Fish Rice Sour Cream/CremaSquash Pears Eggs Cereal ButterSpinach Mangos Pork/Ham Oatmeal Cottage CheeseOnions Apples Canned Tuna Pasta/Fidello Cream Cheese
Table 1: Customized Food Bank Inventory for the CFBSBC.
53
Conducting Outreach to Increase Enrollment
To address the issue of under enrollment of low-income Latino families, it would
be beneficial for the CFBSBC to perform outreach in the form of flyers in English and
Spanish. Since all interviewees expressed that word of mouth is the best way to
disseminate information in the Latino community, a flyer and “natural helpers” will be the
best way to circulate information and get people talking about enrollment at the CFBSBC.
Distributions can be made in low-income housing neighborhoods and apartment
complexes, posted at local stores, community bulletin boards, medical clinics, churches
and the health and human services department. A simple “Did you Know?” flyer with a list
of facts that could dispel myths that are circulating in the community and encourage
families to enroll would be advisable.
Other suggestions gathered from the focus groups and interviews for a flyer are:
• Providing a 1-800 bilingual help line.
• Including an Internet address for a bilingual online directory.
• Stressing that receiving emergency food is confidential and not affiliated with the
government.
IMPLICATIONS FOR APPLIED ANTHROPOLOGY
The theoretically based steps and methods mentioned for the development and
execution of appropriate food provisions and nutritional education can be applied to other
projects aimed at developing and implementing appropriate educational materials and
54

programs for minority groups. This study also reveals that qualitative research can reveal
underlying themes and cultural intricacies that collecting quantitative data alone may not
expose. Nonetheless, both forms of anthropological research are valuable and essential in
describing and aiding a culturally diverse population.
Before beginning a project such as this needs assessment, researchers must become
familiar with the target population’s nutrition and health knowledge, beliefs and values.
Cultural competency will prepare the researchers for constructive personal interactions
with participants and increase the probability of developing educational materials and
programs that are relevant to the intended audience. A mixed methods approach would also
yield more information since such populations may be unwilling to divulge personal
information to “outsiders.” Thus, adequate length of fieldwork is incredibly important to
build rapport and trust with potential participants. Given the warranted suspicions among
the population under study, this project would have benefitted from more fieldwork as it
most likely would have resulted in greater participation.
CONCLUSIONS
• The social cognitive theory and natural helper model were effective conceptual
frameworks from which to strategize how to develop and implement effective
nutrition education programs for the CFBSBC.
• There is a deficit of knowledge of low-income Latinos in San Benito County;
therefore, social service organizations like the Health and Human Services
Department and Women Infants and Children (WIC) can utilize the data from this
study to better understand the nutritional needs of this population.
55

• Results from this needs assessment will be utilized by the CFBSBC to design and
apply a dietary education program based on cooking and nutrition classes for its
Latino food bank clients.
• Based on my research, the director of the CFBSBC can justify obtaining funds to
finance cooking facilities that will be incorporated in the new food bank building,
which is to be constructed in the next two years.
• The director of the CFBSBC has made it clear that there is funding available to
implement the suggested services and will be utilizing the data from this needs
assessment to apply for a Community Development Block Grant (CDBG) as well
as funding from the Packard Foundation and the Hewlett Foundation.
• The director of the CFBSBC would like to use this study to educate the board of
directors and city council members of San Benito County about the amount of
poverty and health disparities that exist among Latinos in the county. On a broader
scale, the director would like to inform and educate financial donors and
legislatures in the hopes of affecting policy change.
WORKS CITED
Allen, M.L., Elliott, M.N., Morales, L.S., Diamant, A.L., Hambarsoomian, K., and M.A Schuster 2007 “Adolescent Participation in Preventive Health Behaviors, Physical
56

Activity, and Nutrition: Differences Across Immigrant Generations for Asians and Latinos Compared with Whites.” American Journal of Public Health, 97(2), 337-343.
Antecol, H. and K. Bedard2006 “Unhealthy Assimilation: Why Do Immigrants Converge to American Health Status Levels?” Demography 43:337-360.
Auld, Garry W. and C.D Fulton 1995 “Value of Theoretically Based Cooking Classes for Increasing use of Commodity Foods.” Journal of the American Dietetic Association. 95(1):85-7.
Bandura, A. 2004 “Health Promotion by Social Cognitive Means.” Health Education &
Behavior. 31(2), 143-164.
Baranowski T., Perry C.L. and G.S. Parcel 1997 How Individuals, Environments, and Health Behaviors Interact. CA: Jossey- Blass.
Baranowski T., Cullen K.W., Nicklas T., Thompson D. and J. Baranowski. 2003 “Are Current Health Behavior Change Models Helpful in Guiding Prevention
of Weight Gain Efforts?” Children's Nutrition Research Center, Department of Pediatrics, Baylor College of Medicine. Web, accessed December 19, 2012. < http://www.ncbi.nlm.nih.gov/pubmed/14569036>
Benavides-Vaello, S. 2005 Cultural Influences on the Dietary Practices of Mexican Americans: A
Review of the Literature. Hispanic Health Care International 3(1):27-35. [diet;
acculturation; North America; Mexican Americans]
Bernard, H. Russell2011 Research Methods in Anthropology: Qualitative and Quantitative Approaches. New York: Altamira Press.
Burton B., Foster W., Hirsch J., and T. Vanltallie 1985 “Health Implications of Obesity: NIH Consensus Development Conference.” International Journal of Obesity Related Metabolic Disorders. 9:155-169.
The California Center for Public Health Advocacy (CCPHA) and the UCLA Center for 2011 Health Policy Research. “A Patchwork of Progress: Changes in Overweight
and Obesity Among California 5th, 7th, and 9th Graders, 2005-2010.” Web,
57

accessed March 14, 2013. < http://www.publichealthadvocacy.org/research_ patchworkprogress.html>
California Department of Public Health 2005 “Death Records.” Table 5-8, Thirteen Leading Causes of Death by Race/Ethnic Group and Sex, California. Centers for Disease Control and Prevention (2011). “Health, United States, 2011.” Web, accessed October 11, 2012. http://www.cdc.gov/nchs/data/hus11.pdf#001.
Cason K. L., Nieto-Montenegro, S. and A. Chavez-Martinez2006 “Food Choices, Food Sufficiency Practices and Nutrition Education Needs of Hispanic Migrant Workers in Pennsylvania.” Top Clin Nutr. 2006; 21(2): 145- 158.
Centers for Disease Control and Prevention2009 “Health of Hispanic or Latino Population.” Web, accessed June 8, 2012.
<http://www.cdc.gov/nchs/fastats/hispanic_health.htm>
Champions for Change: Network for a Healthy California2007 “Healthy Latino Recipes Made with Love.” Web, accessed January 13, 2013. <http://www.cachampionsforchange.cdph.ca.gov/en/docs/Healthy-Latino- Recipes.pdf>
Cruz, Theresa H., Stephen W. Marshall, J. Michael Bowling, and Andres Villaveces2008 “The Validity of a Proxy Acculturation Scale among U.S. Hispanics.”
Hispanic Journal of Behavioral Sciences 30(4):425–446.
Davidson, E. Jane2005 Evaluation Methodology: The Nuts and Bolts of Sound Evaluation. Thousand
Oaks: Sage.
Eng, E. and E. Parker2002 “Natural Helper Models to Enhance a Community’s Health and Competence.” In: R.J. DiClemente, R.A. Crosby, M.C. Kegler (Eds.), Emerging Theories in Health Promotion Practice and Research: Strategies for Improving Public Health. San Francisco: Jossey-Bass; 2002:127-156.
Farmer, Paul1993 AIDS and Accusation: Haiti and the Geography of Blame. Berkeley: University of California Press.
First 5 San Benito 2012 Children and Families Commission. “Strategic Plan 2012-2014” Web, accessed Dec. 3, 2012. <http://www.first5sanbenito.org/F5SB_Strategic
58

Plan.pdf>
Frisbie, Parker W., Youngtae Cho, and Robert A. Hummer2001 “Immigration and the Health of Asian and Pacific Islander Adults in the
United States.” American Journal of Epidemiology 153:372-380.
Gans K.M., Lovell H.J., Fortunet R., McMahon C., Carton-Lopez S. and T.M. Lasater 1999 “Implications of Qualitative Research for Nutrition Education Geared to Selected Hispanic Audiences.” Journal of Nutrition Education. 31: 331-8.
Glanz, K., Rimer, B.K. and F.M. Lewis 2002. “Health, Behavior and Health Education”. Theory, Research and Practice.
San Fransisco: Wiley & Sons.
Haldeman L.A., Perez-Escamilla R. and A.M Ferris2000 “Development of a Color-coded Bilingual Food Label for Low-literacy
Latino Caretakers. Journal of Nutrition Education. 2000;32:152-60.
Hartman, T.J, McCarthy P.R., Park RJ, Schuster, E. and L.H. Kushi1994 “Focus Group Responses of Potential Participants in a Nutrition Education Program for Individuals with Limited Literacy Skills.” Journal of the American Dietetic Association. 1994;94: 744-8.
Horton, Sarah and Judith C. Barker 2009 “’Stains’ on their Self-Discipline: Public Health, Hygiene, and the Disciplining of Undocumented Immigrant Parents in the Nation’s Internal Borderlands.” American Ethnologist, Vol. 36, No. 4, pp. 784-798, ISSN 0094- 0496.
Latino Coalition for a Healthy California (LCHC)2005 “Latino Health in California.” Web, accessed December 10, 2012.
<http://www.lchc.org/documents/LatinoHealthinCA.pdf>
LeCompte, Margaret D. and Jean J. Schensul 2010 Designing and Conducting Ethnographic Research: An Introduction. AltaMira Publishing.
Lorenz, Edward N.1963 “Deterministic Nonperiodic Flow.” Journal of the Atmospheric Sciences 20 (2): 130-141.
Macario E., Emmons K.M., Sorenson G, Hunt M.K. and R.E. Rudd 1998 “Factors Influencing Nutrition Education for Patients with Low Literacy Skills.” Journal of the American Dietetic Association. 1998; 98: 559-64.
59

Mazur, R., Marquis, G. and H.H. Jensen2003 “Diet and Food Insufficiency Among Hispanic Youths: Acculturation and Socioeconomic factors in the Third National Health and Nutrition Examination Survey.” American Journal of Clinical Nutrition, 78, 1120-1127.
Messner, Ellen1984 “Anthropological Perspectives on Diet.” Annual Reviews Anthropology
13:205-49. Web, accessed May 11, 2013. <http://www.jstor.org.libaccess. sjlibrary.org/stable/2155668>
The National Latino Research Center2011 “Reducing Hunger and Food Insecurity in California’s Rural and Farmworker Communities.” The National Latino Research Center. Web, accessed December 22, 2012. <http://www.csusm.edu/nlrc/events.html>
Nord, M., Andrews, M., and S. Carlson2008 “Household Food Security in the United States, 2007. (Economic Research Report No. 66). Washington, DC: U.S. Department of Agriculture.
Nord, M., and A. Coleman-Jensen 2009 Food Security in the United States, 2009. Web, accessed Oct. 11, 2012 from U.S. Census Bureau <http://www.ers.usda.gov/ Briefing/FoodSecurity/>
Palmeri D., Auld G.W., Taylor T., Kendall P. and J. Anderson 1998 “Multiple Perspectives on Nutrition Education Needs of Low-income Hispanics.” Journal of Community Health. 23:301- 17.
Parra-Medina D., Wilcox S., Thompson-Robinson M., Sargent R. and J.C. Will 2004 “A replicable Process for Redesigning Ethnically Eelevant Educational Materials.” Journal of Women's Health.13: 579-88.
Pelto, G. H. 1981. “Methodological Issues in Nutritional Anthropology: Report of a
Workshop.” Food and Nutrition Bulletin, 3(4): 21-28.
Ramirez A.G, Chalela P., Gallion K. and L.F. Velez 2007 “Energy Balance Feasibility Study for Latinas in Texas: A Qualitative Assessment.” Prev Chronic Dis. 2007:4(4). Web, accessed Nov. 3, 2012. <http://www.cdc.gov/ped/issues/2007/oct/07_0052.htm>
Romero-Gwynn, Eunice and Douglas Gwynn1997 “Food and Dietary Adaptation among Hispanics in the United States” Handbook of Hispanic Cultures in the United States: Anthropology. Web,
60

accessed May 10, 2013. <http://www.latinoteca.com/latcontent/repository/ free-content/Anthropology/Food%20and%20Dietary%20Adaptation>
Roney, S.B 2006 “Psychological Correlates of Low-income Hispanic/Latino Immigrant Caregivers.” Greensboro, NC: The University of North Carolina at Greensboro.
Salinas, Sara MiaN.d. “Understanding Food Insecurity Among Food Bank Consumers In San Benito
County.” Unpublished, Department of Anthropology, San José State University.
San Benito County Official County Government Website 2011 “San Benito County Housing.” Web, accessed October 10, 2012.
<http://cosb.us/wp-content/uploads/SanBenitoCountyHousingElement Draft_2010-03Ch2.Pdf>
Seligman H.K., Wallace A.S. and D.A. DeWalt 2007 “Facilitating Behavior Change With Low-literacy Patient Education Materials.” American Journal of Health Behavior. 31: pp. 61-78.
Singh, Gopal K. and Mohammad Siahpush2002 “Ethnic-Immigrant Differentials in Health Behaviors, Morbidity, and Cause-
Specific Mortality in the United States: An Analysis of Two National Data Bases.” Human Biology 74:83-109.
Torres, Lucas2009 “Latino Definitions of Success: A Cultural Model of Intercultural
Competence.” Hispanic Journal of Behavioral Sciences. 31(4): 576-593.
The United States Census Bureau2008 “National Population Projections: Summary Tables.” Web, accessed
November 25, 2012. <http://www.census.gov/population/projections/data/ national/2008/summarytables.html>
The United States Census Bureau 2010 “Income, Poverty and Health Insurance in the United States: 2010.” Web, accessed November 26, 2012. <http://www.census.gov/prod/2011pubs/p60- 239.pdf>
The United States Census Bureau 2011 “Hispanic Origin Main.” Web, Accessed November 11, 2013. <http://www.
census.gov/population/hispanic/>
61

The United States Department of Agriculture2012 “Definitions of Food Insecurity.” Web, accessed June 8, 2012. < http://www.
ers.usda.gov/topics/food-nutrition-assistance/food-security-in-the-us/definitions -of-food-security.aspx#.UYiOFKUmxdg>
University of California Los Angeles Center for Health Policy Research2007 “California Health Interview Survey Adult Ask CHIS Internet Data System,
Health Status by Race.” Web, Accessed November 11, 2012. <http://www.lchc. org /research/documents/Network-FV-LC-LatinoHealthStatistics2009.pdf>
Weinstein, Miriam 2005 The Surprising Power of Family Meals. Hanover, NH: Steerforth Press.
Williams. G., Popay J. and P. Bissell 1995 “Public Health Risks in the Material World; In Gabe. J (1995) Medicine,
Health and Risk. London. Blackwell
Yancey, Antronette K., Ortega, Alexander N. and Shiriki K. Kumanyika2006 “Effective Recruitment and Retention of Minority Research Participants.”
Annual Review Public Health 27:1-28.
Appendix A: Consent Forms
Consent Form (for Adult Participants)
62

Agreement to Participate in Research
Responsible Investigator: Sara Salinas-Welch, Primary Investigator, San Jose State UniversityTitle of Study: Sabores Latinos: A Needs Assessment of Food Preferences of Latino Food Bank Clients
1. You have been asked to participate in a research study investigating the food preferences and cooking practices of Latino clients who currently utilize the Community Food Bank of San Benito County’s services. 2. You will be asked to complete a written survey and allow audiotaping of your interview, which will be done individually or as part of a group for up to 2 hours. 3. The only foreseeable risk is that an individual may feel some psychological discomfort in sharing his/her food preferences and experiences during audiotaping. Please be assured that you are under no obligation to participate in this study.4. Direct benefits to you include the ability of anonymously voicing your dietary experiences, needs and concerns to the Community Food Bank of San Benito County. 5. Although the results of this study may be published, no information that could identify you will be included. 6. There is no compensation for participating in this study.7. Questions about this research may be addressed to Sara Salinas-Welch, at (831) 673- 0012, [email protected]. Complaints about the research may be presented to Mary Anne Hughes, Executive Director at the Community Food Bank of San Benito County, at 831- 637-0340. Questions about a research subjects’ rights, or research-related injury may be presented to Pamela Stacks, Ph.D., Associate Vice President, Graduate Studies and Research, at (408) 924-2427. 8. No service of any kind, to which you are otherwise entitled, will be lost or jeopardized if you choose not to participate in the study. 9. Your consent is being given voluntarily. You may refuse to participate in the entire study or in any part of the study. You have the right to not answer questions you do not wish to answer. If you decide to participate in the study, you are free to withdraw at any time without any negative effect on your relations with the Community Food Bank of San Benito County.10. At the time that you sign this consent form, you will receive a copy of it for your records, signed and dated by the investigator.
The signature of a subject on this document indicates agreement to participate in the study.
The signature of a researcher on this document indicates agreement to include the above named subject in the research and attestation that the subject has been fully informed of his or her rights.
___________________________________ _______________ Participant’s Signature Date
___________________________________ _______________ Investigator’s Signature Date
Forma de Consentimiento (para los Participantes Adultos)Acuerdo para Participar en la Investigación
63

Investigador Responsable: Sara Salinas-Welch, Investigador Principal, Universidad Estatal de San JoséTítulo de Estudio: Sabor Latino: Un Evaluación de las Necesidades de preferencias alimenticias y prácticas de cocina de los clientes Latinos del banco de alimentos.
1. Se le ha pedido a los clientes Latinos que actualmente reciben servicios del Banco de Alimentos del Condado de San Benito participar en un estudio sobre sus preferencias de alimentos y prácticas de cocina 2. Se les pedirá su permiso para completar una encuesta escrito y grabar esta entrevista, que se hará individualmente o como parte de un grupo y que tardara aproximadamente 2 horas.3. Existe el riesgo de que durante la grabación alguna persona sienta cierto malestar emocional o psicológico al momento de compartir sus experiencias y preferencias de comidas. Tenga la seguridad de que usted no tiene ninguna obligación de participar en este estudio. 4. Beneficios directos incluyen la oportunidad de expresar anónimamente sus experiencias alimenticias, necesidades y preocupaciones al Banco de Alimentos del Condado de San Benito. 5. Aunque los resultados de este estudio podrán ser publicados, no se incluirá ninguna información que pudiera identificarle. 6. No hay compensación por su participación.7. Preguntas sobre este estudio pueden ser dirigidas a Sara Salinas-Welch. Ella puede ser contactada al (831) 673-0012 ó [email protected]. Quejas sobre el estudio pueden ser presentadas a Mary Anne Hughes Directora Ejecutiva de el Banco de Alimentos del Condado de San Benito al 831-637-0340. Preguntas acerca de los derechos del participante, o lesión relacionada con esta investigación se pueden presentar a Pamela Stacks, Ph.D., Vice Presidenta Asociada, Estudios de Posgrado e Investigación, al (408) 924-2427. 8. Ningún tipo de servicio, al que actualmente tiene derecho de recibir en el Banco de Alimentos del Condado de San Benito se perderá o pondrá en riesgo si decide “no participar” en el estudio. 9. Su consentimiento a sido dado voluntariamente. Usted puede negarse a participar en el estudio en su totalidad, o en cualquier parte de este. Usted tiene el derecho de no responder preguntas que no quiera contestar. Si decide participar en el estudio, tiene la libertad de terminar su participación en cualquier momento que lo decida sin que su relación con el Banco de Alimentos del Condado de San Benito se dañe. 10. En el momento que usted firme esta forma de consentimiento, recibirá una copia firmada con fecha por parte del investigador para sus archivos personales.
La firma del participante en este documento indica que él o ella dio su consentimiento para participar en el estudio.
La firma del investigador en este documento indica el acuerdo de incluir al participante en el estudio y certifica que los participantes han sido informada sobre todos sus derechos.
___________________________________ _______________ Firma del Participante Fecha ___________________________________ _______________ Firma del Investigador Fecha
Appendix B: Survey Instruments
64
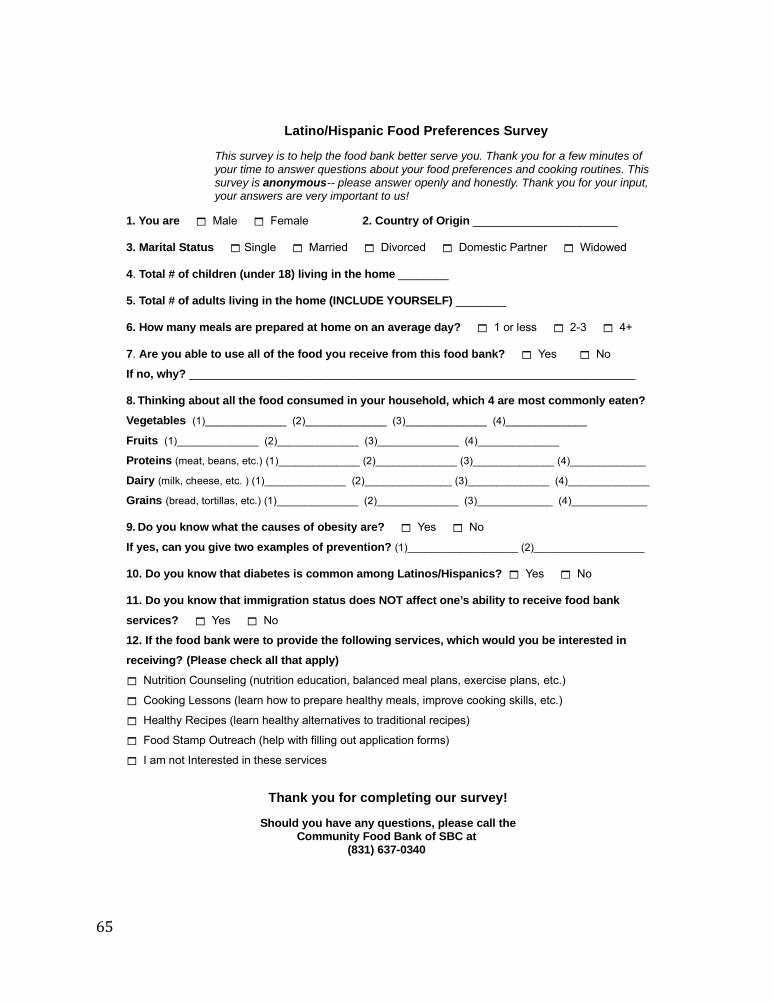
Latino/Hispanic Food Preferences Survey
This survey is to help the food bank better serve you. Thank you for a few minutes of your time to answer questions about your food preferences and cooking routines. This survey is anonymous-- please answer openly and honestly. Thank you for your input, your answers are very important to us!
1. You are Male Female 2. Country of Origin _______________________
3. Marital Status Single Married Divorced Domestic Partner Widowed
4. Total # of children (under 18) living in the home ________
5. Total # of adults living in the home (INCLUDE YOURSELF) ________
6. How many meals are prepared at home on an average day? 1 or less 2-3 4+
7. Are you able to use all of the food you receive from this food bank? Yes No
If no, why? _______________________________________________________________________
8. Thinking about all the food consumed in your household, which 4 are most commonly eaten?
Vegetables (1)______________ (2)______________ (3)______________ (4)______________
Fruits (1)______________ (2)______________ (3)______________ (4)______________
Proteins (meat, beans, etc.) (1)______________ (2)______________ (3)______________ (4)_____________
Dairy (milk, cheese, etc. ) (1)______________ (2)_______________ (3)______________ (4)______________
Grains (bread, tortillas, etc.) (1)______________ (2)______________ (3)_____________ (4)_____________
9. Do you know what the causes of obesity are? Yes No
If yes, can you give two examples of prevention? (1)___________________ (2)___________________
10. Do you know that diabetes is common among Latinos/Hispanics? Yes No
11. Do you know that immigration status does NOT affect one’s ability to receive food bank
services? Yes No
12. If the food bank were to provide the following services, which would you be interested in
receiving? (Please check all that apply)
Nutrition Counseling (nutrition education, balanced meal plans, exercise plans, etc.)
Cooking Lessons (learn how to prepare healthy meals, improve cooking skills, etc.)
Healthy Recipes (learn healthy alternatives to traditional recipes)
Food Stamp Outreach (help with filling out application forms)
I am not Interested in these services
Thank you for completing our survey!
Should you have any questions, please call the Community Food Bank of SBC at
(831) 637-0340
65

Encuesta de Preferencias de Comida Latina/Hispana
Esta encuesta es para ayudar al banco de comida en atenderle mejor. Gracias por darnos unos minutos de su tiempo para responder preguntas sobre su preferencias de alimentos y rutinas de cocción. Esta encuesta es anónima--responda abierta y honestamente. Sus respuestas son muy importantes para nosotros y NO afectará su elegibilidad pare recibir servicios del banco de comida.
1. Eres un Hombre Mujer 2. País de Origen _______________________
3. Estado Civil Soltero/a Casado/a Divorciado/a Pareja Domestica Viudo/a
4. Número total de niños (menores de 18 años) que viven en su casa ________
5. ¿Incluyéndolo a usted, cuántos adultos viven en su casa? ________
6. ¿Cuántas comidas preparan en casa en un día promedio? 1 or menos 2-3 4+
7. ¿Eres capaz de utilizar toda la comida que recibe de este banco de alimentos?
Sí No Si no, ¿por qué?____________________________________________________
8. Lista comidas más comúnmente consumidos en su hogar.
Verduras (1)______________ (2)______________ (3)______________ (4)______________
Frutas (1)______________ (2)______________ (3)______________ (4)______________
Proteínas(carne, frijoles, etc.) (1)______________ (2)______________ (3)______________ (4)____________
Productos lácteos(leche, queso, etc.) (1)___________ (2)____________ (3)____________ (4)___________
Productos de grano(pan, tortillas, etc.) (1)____________ (2)____________ (3)___________ (4)__________
9. ¿Sabes cuáles son las causas de la obesidad? Sí No
Si sí, ¿puede dar dos ejemplos de cómo prevenirla? (1)_________________ (2)__________________
10. ¿Sabe usted que la diabetes es común entre los latinos/hispanos? Sí No
11. ¿Sabes que estatus migratorios NO se afecta para calificar servicios del banco de comida?
Sí No
12. ¿Si el banco de alimentos pudiera ofrecer los siguientes servicios, que le interesaría recibir?
(Marque todos los que apliquen)
Consejos de Nutrición (educación de nutrición, planes de comida balanceada, planes de ejercicio)
Clases de Cocina (aprender a preparar comidas saludables, mejorar habilidades de cocción, etc.)
Recetas Saludables (aprender alternativas saludables a las recetas tradicionales)
Ayuda con Estampillas de Alimento (ayuda para llenar aplicaciones)
No estoy interesado en estos servicios
¡Gracias por completar nuestra encuesta!
Si tiene preguntas,por favor llame al Banco de Comida al
(831) 637-0340
66

Appendix C: Focus Group Instruments
Focus Group Questions for Food Bank Clients
1. Please introduce yourselves. Give your name, age, country of birth, years in the United States, marital status, and number of children you have.
2. Who in your family is in charge of meal planning, grocery shopping, preparing meals, etc.?
3. What are some of the most common dishes prepared in your home?
4. Do you have a pattern/routine for eating? Probe for set meal times such as breakfast, lunch, and dinner. Or do you practice more random eating?
5. Why do you eat what you eat? Probe to find out if they consider it healthy, someone cooks it for them, it’s available locally or they simply like it.
6. What types of snacks do you buy?
7. Are you health conscious? Which food habits do you consider healthy or unhealthy?
8. Do you ever eat out? If yes, where do you go? How often do you eat out?
9. What types of nutritional information would be most helpful to you?
The following two questions are for people not born in the U.S.
10. What foods do you eat in this country that you did not eat in your country of origin? Do you eat these foods often?
11. To what extent have your native food habits been retained or “lost?” Are your native foods available to you here? If yes, where do you get them and are they expensive/inexpensive?
Conclusion
12. Does anyone have other responses or comments about the information discussed today?
13. Is there anything you would like to add to this discussion that has not already been mentioned?
67

Preguntas Grupo de Enfoque para los Clientes del Banco de Alimentos
1. Por favor preséntese al grupo. De su nombre, edad, país donde nació, tiempo que lleva viviendo en los Estados Unidos, su estado civil y número de niños que tiene.
2. ¿Quién en su familia está a cargo de la comida, planificación, compras, preparación, etc.?
3. ¿Cuáles son algunos de los platillos más comunes en su hogar?
4. ¿Tiene una rutina para comer o come a distintos horarios cada día? Sonda para tiempos de menú como desayuno, almuerzo y cena.
5. ¿Por qué come lo que come? Sonda para averiguar si ellos se consideran saludable, alguien cocina para ellos, se encuentran disponibles localmente o simplemente les gusta.
6. ¿Qué tipos de bocadillos compra?
7. ¿Entiende lo que significa tener buena salud? ¿Cuales hábitos alimenticios considera sanos o insalubres?
8. ¿Suele comer afuera de casa? ¿Si responde sí, a donde va a comer? ¿Con qué frecuencia come fuera de casa?
9. ¿Qué tipo de información nutricional sería útil para usted?
Las dos preguntas siguientes son para personas que no nacieron en los Estados Unidos
10. ¿Cuáles alimentos come en este país que no acostumbraba comer en su país de origen? ¿Que tan a menudo come estos alimentos?
11. ¿Que tanto ha cambiado o mantenido su forma de comer desde que llego a Estados Unidos? ¿Encuentra con facilidad los alimentos que acostumbraba a comer ? Si responde que si, ¿En dónde los consigue, son caros o baratos?
Conclusión
12. ¿Alguien tiene otras respuestas o comentarios sobre lo que hablamos hoy?
13. ¿Hay algo que les gustaría añadir a esta platica que no se ha dicho ya?
68
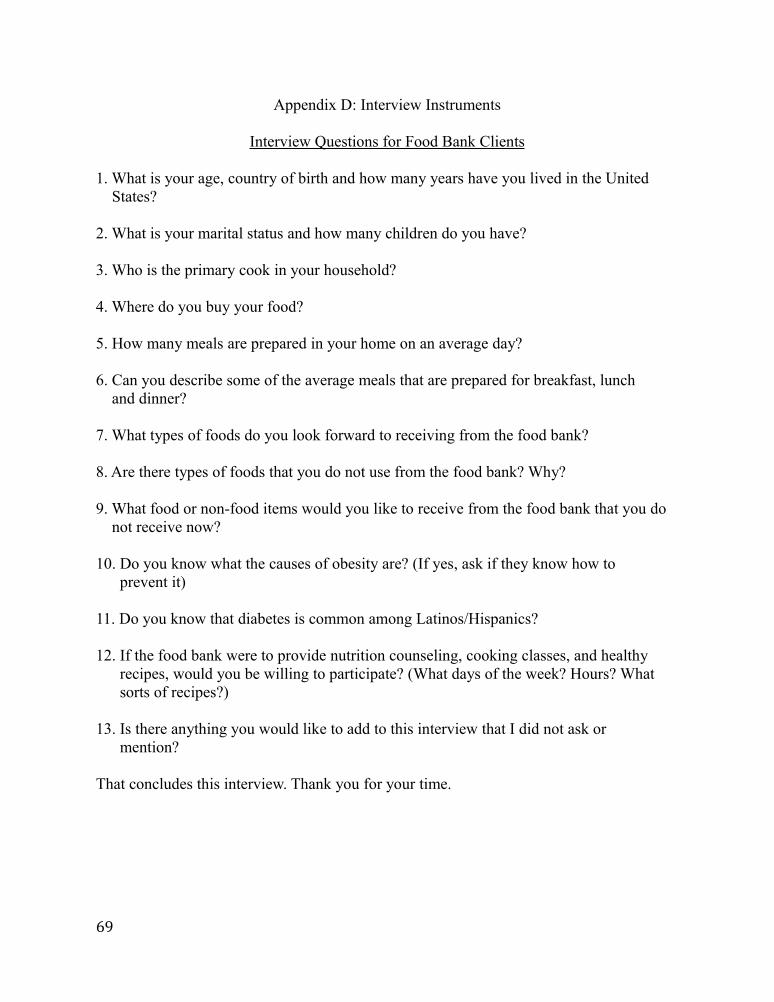
Appendix D: Interview Instruments
Interview Questions for Food Bank Clients
1. What is your age, country of birth and how many years have you lived in the United States?
2. What is your marital status and how many children do you have?
3. Who is the primary cook in your household?
4. Where do you buy your food?
5. How many meals are prepared in your home on an average day?
6. Can you describe some of the average meals that are prepared for breakfast, lunch and dinner?
7. What types of foods do you look forward to receiving from the food bank?
8. Are there types of foods that you do not use from the food bank? Why?
9. What food or non-food items would you like to receive from the food bank that you do not receive now?
10. Do you know what the causes of obesity are? (If yes, ask if they know how to prevent it)
11. Do you know that diabetes is common among Latinos/Hispanics?
12. If the food bank were to provide nutrition counseling, cooking classes, and healthy recipes, would you be willing to participate? (What days of the week? Hours? What sorts of recipes?)
13. Is there anything you would like to add to this interview that I did not ask or mention?
That concludes this interview. Thank you for your time.
69

Preguntas para la Entrevista con los Clientes del Banco de Alimentos
1. ¿Cuántos años tiene? ¿En que país nació? ¿Cuánto tiempo lleva viviendo en los Estados Unidos?
2. ¿Cuál es su estado civil y cuántos hijos/as tiene?
3. ¿Quién es el encargado/a de cocinar en su hogar?
4. ¿Donde compra su comida?
5. ¿Aproximadamente, cuántas comidas se preparan al día en su casa ?
6. ¿Puede describir algunas de las comidas que prepara para el desayuno, el almuerzo y la cena?
7. ¿Qué tipos de alimentos espera recibir en el banco de alimentos?
8. ¿Recibe alimentos en el banco de alimentos que no usa? ¿Por qué?
9. ¿Que alimentos o artículos no comestibles le gustaría recibir en el banco de alimentos que ahora recibe?
10. ¿Sabes cuáles son las causas de la obesidad? (Si sí, ¿Puede dar dos ejemplos de cómo prevenirla?)
11. ¿Sabe usted que la diabetes es común entre los latinos/hispanos?
12. ¿Si el banco de alimentos pudiera ofrecer consejos de nutrición, clases de cocina y recetas saludables, estaría interesado en recibirlos? (¿Qué días de la semana prefiere? ¿ Qué Horas? ¿Qué tipos de recetas)?
13. ¿Hay algo que le gustaría incluir a esta entrevista que no pedí o he mencionado?
Esto concluye esta entrevista. Gracias por su tiempo.
70

Appendix E: Survey Statistical Data Tables
Survey Location %
Food Bank Warehouse 53.5%
Mobile Distribution 38.5%
Las Comadres Meetings 5.0%
Homeless/Under Bridges 3.0%
Survey Language %
English 35.6%
Spanish 64.4%
Gender %
Male 24.7%
Female 74.3%
No Response 1.0%
Country of Origin %
U.S.A 24.8%
Mexico 61.4%
El Salvador 1.0%
Portugal 1.0%
Nicaragua 1.0%
No Response 10.8%
Marital Status %
Single 16.8%
Married 51.5%
Divorced 13.9%
Domestic Partner 8.9%
Widowed 6.9%
No Response 2.0%
# of Children in Home %
No Children 40.6%
1 Child 16.8%
2 Children 13.9%
3 Children 11.9%
4 Children 14.9%
5 Children 1.0%
6 Children 1.0%
# of Adults in Home %
No Response 2.0%
1 Adult 15.8%
2 Adults 42.6%
3 Adults 16.8%
4 Adults 9.9%
5 Adults 8.9%
6 Adults 3.0%
7 Adults 1.0%
71

Vegetables %
“Vegetables” 46.5%
Tomatoes/Tomatillos 37.6%
Broccoli 36.6%
Lettuce 33.7%
Carrots 32.7%
Potatoes 21.8%
Squash 19.8%
Spinach 12.9%
Onions 11.9%
Corn 10.9%
Cauliflower 7.9%
Celery 6.9%
Chiles 5.9%
Green Beans 5.9%
Peas 5.0%
Lemons 4.0%
Cucumbers 3.0%
Bell Peppers 3.0%
Cabbage 3.0%
Avocados 3.0%
Garlic 2.0%
Jicama 2.0%
Yuca 1.0%
Fruits %
Oranges 49.5%
Bananas 41.6%
Strawberries 18.8%
“Fruits” 15.8%
Grapes 14.9%
Pears 14.9%
Mangos 9.9%
Apples 8.9%
Melons 8.9%
Watermelon 8.9%
Peaches 6.9%
Pineapple 4.0%
Kiwi 3.0%
Raspberries 2.0%
Papaya 2.0%
Nectarines 2.0%
Blueberries 1.0%
Apricots 1.0%
Fruit Cocktail 1.0%
72

Proteins %
“Beans” 54.5%
Beef 45.5%
Chicken 41.6%
Fish 19.8%
Eggs 17.8%
Lentils 16.8%
Pork/Ham 11.9%
Garbanzo Beans
5.0%
Pinto Beans 5.0%
Tuna 4.0%
Tofu 3.0%
Black Beans 2.0%
Peanut Butter 2.0%
Turkey 2.0%
Lima Beans 1.0%
Grains %
Corn Tortillas 60.4%
Flour Tortillas 56.4%
“Bread” 41.6%
Rice 20.8%
Wheat Bread 20.8%
Cereal 7.9%
Oatmeal 5.9%
Pasta 5.0%
Wheat Tortillas 3.0%
Torta/Bolillo/Telera
3.0%
White Bread 3.0%
Pan Dulce/Cookies
3.0%
Fajita Bread 1.0%
Flat Bread 1.0%
Sourdough Bread
1.0%
73

# of Meals Prepared per
Day%
No Response 2.0%
0-1 Meals 5.9%
2-3 Meals 82.2%
4+ Meals 9.9%
Dairy Products
%
Milk 57.4%
“Cheese” 57.4%
Yogurt 25.7%
Sour Cream/Crema
11.9%
Butter 6.9%
Cottage Cheese 4.0%
Cream Cheese 2.0%
Lactose-free Milk
1.0%
Mayonnaise 1.0%
Pudding 1.0%
Reasons Unable to use
all Foods%
No Response/Able to Use
86.1%
Food Expired/Spoiled
9.9%
Food Expired/Too many
Sweets
1.0%
Do not eat Canned Food
2.0%
Allergies to Certain Foods
1.0%
Able to use all Foods
Received
%
No Response 4.0%
Yes 80.2%
No 15.8%
74

Knowledge of Causes of Obesity %
No Response 8.9%
Yes 80.2%
No 10.9%
Examples of Obesity Prevention %
No Response 29.7%
Exercise 2.0%
Eating Healthy 36.6%
Exercise & Eating Healthy
27.7%
Eating Less/Low Fat Diet
4.0%
Knowledge of Diabetes Prevalent
Among Latinos%
No Response 5.0%
Yes 85.1%
No 9.9%
Knowledge that Immigration Status
does Not Affect Eligibility
%
No Response 5.9%
Yes 62.4%
No 31.7%
Interested in Nutrition Counseling %
Yes 67.3%
No 32.7%
Interested in Cooking Classes %
Yes 58.4%
No 41.6%
Interested in Healthy Recipes %
Yes 62.4%
No 37.6%
Interested in Food Stamp Outreach %
Yes 38.6%
No 61.4%
Not Interested in Any Services
13.9%
75

Appendix F: Survey Statistical Data
Total Number of Surveys: 101
Survey Location
Food Bank Warehouse: 54/ 53.5%Mobile Distribution: 39/ 38.6%Homeless: 3/ 3.0%Las Comadres/Rancho Apartments: 5/ 5.0%
Language of Survey
English: 36/ 35.6%Spanish: 65/ 64.4%
Gender
Male: 25/ 24.8%Female: 75/ 74.3%No Response: 1/ 1.0%
Country of Origin
USA: 25/ 24.8%Mexico: 62/ 61.4%El Salvador: 1/ 1.0%Portugal: 1/ 1.0%Philippines: 1/1.0%Nicaragua: 1/1.0%No Response Given: 10/ 9.9%
Marital Status
Single: 17/ 16.8%Married: 52/ 51.5%Divorced: 14/13.9%Domestic Partner: 9/ 8.9%Widowed: 7/ 6.9%No Response Given: 2/ 2.0%
Number of Children in the Home
No Children: 41/ 40.6%
76

1 Child: 17/ 16.8%2 Children: 14/ 13.9%3 Children: 12/ 11.9%4 Children: 15/ 14.9%5 Children: 1/ 1.0%6 Children: 1/ 1.0%
Adults Living in the Home
No Response Given: 2/ 2.0%1 Adult: 16/ 15.8%2 Adults: 43/ 42.6%3 Adults: 17/ 16.8%4 Adults: 10/ 9.9%5 Adults: 9/ 8.9%6 Adults: 3/ 3.0%7 Adults: 1/ 1.0%
Number of Meals Prepared on an Average Day
No Response Given: 2/ 2.0%0-1 Meal: 6/ 5.9%2-3 Meals: 83/ 82.2%4+ Meals: 10/ 9.9%
Able to use All Foods Received
No Response Given: 4/ 4.0%Yes: 81/ 80.2%No: 16/ 15.8%
Reasons Unable to use All Foods
No Response Given/Able to Use Food: 87/ 86.1%Food is Expired/Spoiled: 10/ 9.9%Food is Expired & Too Many Sweets: 1/ 1.0%Do not Eat Canned Foods: 2/ 2.0%Allergies to Certain Foods: 1/ 1.0%
Knowledge of Causes of Obesity
No Response Given: 9/ 8.9%Yes: 81/ 80.2%
77

No: 11/ 10.9%
Examples of Obesity Prevention
No Response Given: 30/ 29.7%Exercise: 2/ 2.0%Eating Healthy: 37/ 36.6%Exercise & Eating Healthy: 28/ 27.7%Eating Less/Low Fat Diet: 4/ 4.0%
Knowledge of Diabetes Prevalent Among Latinos
No Response Given: 5/ 5.0%Yes: 86/ 85.1%No: 10/ 9.9%
Knowledge that Immigration Status Does NOT Affect Eligibility
No Response Given: 6/ 5.9%Yes: 63/ 62.4%No: 32/ 31.7%
Interested in Receiving Nutrition Counseling
Yes: 68/ 67.3%No: 33/ 32.7%
Interested in Cooking Classes
Yes: 59/ 58.4%No: 42/ 41.6%
Interested in Receiving Healthy Recipes
Yes: 63/ 62.4%No: 38/ 37.6%
Interested in Receiving Help with Food Stamp Applications
Yes: 39/ 38.6%No: 62/ 61.4%
78

Not Interested in Any Services
14/ 13.9%
Vegetables
Tomatoes/Tomatillos: 38/ 37.6%Onions: 12/ 11.9%Squash: 20/ 19.8%Lettuce: 34/ 33.7%Carrots: 33/ 32.7%Yuca: 1/ 1.0%Spinach: 13/ 12.9%Broccoli: 37/ 36.6%Celery: 7/ 6.9%Cucumbers: 3/ 3.0%Lemons: 4/ 4.0%Potatoes: 22/ 21.8%Bok Choy: 1/ 1.0%Asparagus: 1/ 1.0%Chayote: 1/ 1.0%Garlic: 2/ 2.0%Bell Peppers: 3/ 3.0%Corn: 11/ 10.9%Peas: 5/ 5.0%Chiles: 6/ 5.9%Cabbage: 3/ 3.0%Cauliflower: 8/ 7.9%Avocados: 3/ 3.0%Cactus: 1/ 1.0%Jicama: 2/ 2.0%Green Beans: 6/ 5.9%Vegetables (No Names Given): 47/ 46.5%
Fruits
Bananas: 42/ 41.6%Grapes: 15/ 14.9%Blueberries: 1/ 1.0%Strawberries: 19/ 18.8%Nectarines: 2/ 2.0%Apples: 9/ 8.9%Oranges: 50/ 49.5%Apricots: 1/ 1.0%
79

Peaches: 7/ 6.9%Papaya: 2/ 2.0%Pears: 15/ 14.9%Melons (Cantaloupe/Honey Dew): 9/ 8.9%Pineapple: 4/ 4.0%Watermelon: 9/ 8.9%Mangos: 10/ 9.9%Kiwi: 3/ 3.0%Fruit Cocktail: 1/ 1.0%Raspberries: 2/ 2.0%Fruits (No Names Given): 16/ 15.8%
Proteins
Turkey: 2/ 2.0%Chicken: 42/ 41.6%Pork/Ham: 12/ 11.9%Beef: 46/ 45.5%Tuna: 4/ 4.0%Tofu: 3/ 3.0%Fish: 20/ 19.8%Pinto Beans: 5/ 5.0%Lima Beans: 1/ 1.0%Garbanzo Beans: 5/ 5.0%Black Beans: 2/ 2.0%Lentils: 17/ 16.8%Peanut Butter: 2/ 2.0%Beans: 55/ 54.5%Eggs: 18/ 17.8%
Dairy Products
Milk: 58/ 57.4%Lactose-free Milk: 1/ 1.0%Sour Cream/”Crema”: 12/ 11.9%Cream Cheese: 2/ 2.0%Cottage Cheese: 4/ 4.0%Cheese: 58/ 57.4%Butter: 7/ 6.9%Mayonnaise: 1/ 1.0%Pudding: 1/ 1.0%Yogurt: 26/ 25.7%
80

Grains
Wheat Bread: 21/ 20.8%White Bread: 3/ 3.0%Sourdough Bread: 1/ 1.0%Bread: 42/ 41.6%Corn Tortillas: 61/ 60.4%Flour Tortillas: 57/ 56.4%Wheat Tortillas: 3/ 3.0%Torta/ Bolillo/ Telera: 3/ 3.0%Pasta: 5/ 5.0%Cereal: 8/ 7.9%Oatmeal: 6/ 5.9%Flat Bread: 1/ 1.0%Pan Dulce/ Cookies: 3/ 3.0%Fajita Bread: 1/ 1.0%Rice: 21/ 20.8%
81