sabmiller interim report 2009 - anheuser-busch inbev€¦ · · 2018-04-042 chief executive’s...
TRANSCRIPT
Interim ReportSABMiller plc Interim Report 2009

Graham Mackay, Chief Executive of SABMiller, said:
“In some of the toughest economic conditions seen for decades, we have continued to take share in a number of markets. The weakness of our major operating currencies against the US dollar has affectedreported results, but we have continued to generate a strong underlyingperformance. The actions we have taken to position our business globally,to invest in brands and to develop our operational capabilities will continueto underpin our long-term growth.”
Contents01 Operational highlights
02 Chief Executive’s review
11 Directors’ responsibility for financial reporting
11 Independent review report
12 Consolidated income statement
13 Consolidated statement of comprehensive income
14 Consolidated balance sheet
15 Consolidated cash flow statement
16 Consolidated statement of changes in equity
17 Notes to the financial information
28 Financial definitions
29 Administration
SABMiller plc Interim Report 2009 1
SABMiller plc, one of the world’s leading brewers with operations and distribution agreements across sixcontinents, reports its interim (unaudited) results for the six months to 30 September 2009.
Sept Sept March2009 2008 2009
US$m US$m % change US$m
Group revenuea 13,355 14,222 (6) 25,302
Revenueb (excludes associates’ and joint ventures’ revenue) 8,846 11,166 (21) 18,703
EBITAc 2,187 2,225 (2) 4,129
Adjusted profit before taxd 1,920 1,860 3 3,405
Profit before taxe 1,498 2,020 (26) 2,958
Adjusted earningsf 1,236 1,128 10 2,065
Adjusted earnings per share– US cents 80.0 75.2 6 137.5– UK pence 49.9 38.9 28 79.7– SA cents 648.9 585.8 10 1,218.6
Basic earnings per share (US cents) 63.0 94.8 (34) 125.2
Interim dividend per share (US cents) 17.0 16.0 6
a Group revenue includes the attributable share of associates’ and joint ventures’ revenue of US$4,509 million (i.e. including MillerCoors’ revenue) (2008: US$3,056 million).
b Revenue excludes the attributable share of associates’ and joint ventures’ revenue. 2009 is not comparable with 2008 as MillerCoors’ revenue is not included in 2009, although Miller Brewing Company’s revenue is included in 2008.
c Note 2 provides a reconciliation of operating profit to EBITA which is defined as operating profit before exceptional items and amortisation of intangible assets (excluding software) but includes the group’s share of associates’ and joint ventures’ operating profit, on a similar basis. EBITA is used throughout the interim report.
d Adjusted profit before tax comprises EBITA less adjusted net finance costs of US$253 million (2008: US$358 million) and share of associates’ and joint ventures’net finance costs of US$14 million (2008: US$7 million).
e Profit before tax includes exceptional charges of US$239 million (2008: exceptional credits of US$371 million).f A reconciliation of adjusted earnings to the statutory measure of profit attributable to equity shareholders is provided in note 5.
Segmental EBITA performance
Organic,Sept constant2009 Reported currency
EBITA growth growthUS$m % %
Latin America 566 19 33Europe 590 (19) 5North America 379 7 7Africa 246 3 15Asia 90 24 29South Africa: Beverages 333 0 4South Africa: Hotels and Gaming 53 (12) (16)Corporate (70) – –
Group 2,187 (2) 11
Operational highlights■ Lager volumes decrease 1% on an organic basis with growth in Africa and Asia offset by weaker volumes
in other markets
■ Reported group revenue down 6% and reported EBITA down 2% impacted by weakness of our majoroperating currencies against the US dollar compared with the same period last year
■ Firm pricing and cost efficiency drives organic, constant currency group revenue growth of 3%, EBITAgrowth of 11% and margin growth of 110 basis points (bps)
■ EBITA on an organic, constant currency basis increases across all regions despite mixed volume performance:– Pricing benefits and cost efficiencies in Latin America drive excellent EBITA1 growth of 33%– Solid pricing in Europe supports a 5% increase in EBITA1 despite volume decline– North America EBITA1 grows 7% as cost synergies are realised– Africa EBITA1 up 15%, driven by volume growth and pricing– Asia EBITA1 up 29% as CR Snow volumes in China grow at more than double the market rate– South Africa Beverages EBITA1 up 4% despite weaker consumer spending and increased marketing spend
■ Free cash flow2 improves by US$1,124 million compared with the prior year period1 EBITA growth is shown on an organic, constant currency basis.2 As defined in the financial definitions section. See also note 9b.
Strong underlying operational performance

2 Chief Executive’s review SABMiller plc Interim Report 2009
Business reviewOur underlying performance has been strong although difficult tradingconditions persisted across most markets. Lager volumes were down1% on an organic basis, but our market execution and the strength ofour brands enabled us to continue to gain share across many of ourkey markets. Group revenue increased by 3% organically in constantcurrency, supported by price increases taken predominantly in thesecond half of the prior year.
Despite the slight decline in volumes, EBITA performance was strong,growing 11% on an organic, constant currency basis with the group’sEBITA margin improving 110 bps to 16.8%. The benefits of fallingcommodity prices are not yet fully reflected in our costs, due to thelong-term nature of our raw material supply contracts and the relativestrength of the US dollar in which many of these contracts are priced.Greater efficiencies in our marketing spend, combined with costreductions and restructuring in certain markets, continued to benefitour cost base. On a reported basis, EBITA of US$2,187 milliondeclined 2% reflecting significantly weaker operating currenciesagainst the US dollar compared to the same period in the prior year.
Although reported EBITA was lower, adjusted earnings grew 10% dueto lower finance charges and reduced profit attributable to minorityinterests following the purchase of the 28.1% minority interest in ourPolish subsidiary, Kompania Piwowarska SA, in May 2009 in exchangefor the issue of 60 million ordinary shares. The group’s effective taxrate for the period was 29.4%, compared with 31.0% in the sameperiod in the prior year.
Free cash flow of US$998 million showed an improvement ofUS$1,124 million compared to the same period last year. Capitalexpenditure was US$517 million lower than in the prior year periodfollowing the completion of several major investments. Improvedworking capital management delivered cash inflow of US$300 million,US$638 million better than in the prior year period. Normalised EBITDAmargin, including both dividends and revenue from MillerCoors,improved 30 bps during the period.
The group’s gearing ratio at 30 September 2009 reduced to 47.0%from 54.0% (restated) at the previous year end. An interim dividend of17 US cents per share, up 1 US cent from the prior year, will be paidto shareholders on 11 December 2009.
■ In Latin America, despite local currency devaluation, EBITA grew19% (33% on an organic, constant currency basis) reflectingstrong pricing, principally in the second half of the prior year, and cost reduction. Lager volumes fell 1% as economic pressures,combined with political and social unrest in some countries,impacted beer markets across the region. We continued to focuson expanding the appeal, availability and affordability of the beercategory. In Colombia, lager volumes were 2% below the prior yearperiod which benefited from increased sales in September 2008ahead of a 1 October price increase. Our share of the alcoholmarket continued to increase aided by strong performance of ourpremium brands. Against prior year comparative growth of 10%,Peru’s lager volumes declined 2%, but market share increased in a market that declined 7%.
■ In Europe, lager volumes declined 6% on an organic basis, withdepressed consumer spending leading to a contraction in beerconsumption across the region. With key exchange rates muchweaker than last year, EBITA declined 19% but grew 5% on anorganic, constant currency basis. Strong pricing drove organic,constant currency revenue per hectolitre growth of 6% and furthercost efficiencies more than offset higher depreciation and a 2%increase in variable production costs. We gained market share inPoland, Romania and the UK, with strong momentum behind keybrands. In the Czech Republic, volume share declined marginally,consistent with our value-oriented strategy, and in Russia bothvolumes and market share fell, reflecting down-trading in themarket and our focus on the premium segment.
■ North America delivered reported EBITA growth of 7% despitelager volumes 5% below those reported last year. On a pro forma1
basis, MillerCoors’ US domestic volume sales to retailers (STRs)were down 1% for the half year driven by a slight decline inpremium light volumes and continued softness in above-premiumand premium brands. Domestic sales to wholesalers (STWs) were down 1% on a pro forma basis. Strong revenue and costmanagement, and continued synergy delivery drove a 22%increase in MillerCoors EBITA on a pro forma basis.
■ Africa lager volumes grew 3% on an organic basis with Uganda,Zambia and Mozambique all reporting good growth. However, soft economic conditions contributed to reduced volumes inTanzania, and Botswana continued to be impacted by the 30%social levy on alcoholic beverages imposed in November 2008.Soft drinks volumes grew 5% on an organic basis reflecting robustperformance across the region. EBITA grew 3%, held back bylocal currency weakness, but rose 15% on an organic, constantcurrency basis assisted by firm pricing. We continue to implementour full beverage portfolio strategy, acquiring a water business in Ethiopia and a non-alcoholic beverage business in Zambia. New local premium lager beers were introduced in five markets.Capacity expansion projects in Uganda and Ghana have recentlybeen completed, as has a new brewery in Southern Sudan. New plants in Tanzania, Mozambique and Angola will becommissioned shortly.
■ Asia lager volumes grew 9% on an organic basis and organic,constant currency EBITA grew 29%, while reported EBITA was up 24%. This reflected a strong performance from CR Snow, our associate in China, which increased lager volumes by 15% in a market which grew by 6%. Significant share gains were achievedin the key provinces of Anhui and Zhejiang, driven by the successof the Snow brand. In Australia, our joint venture enjoyed stronggrowth in a flat market, driven by Peroni Nastro Azzurro, MillerGenuine Draft and Bluetongue. India experienced a difficult firsthalf, with volumes declining 21%, largely as a result of regulatoryissues in the key states of Andhra Pradesh and Uttar Pradesh.
1 MillerCoors’ pro forma figures are based on results for Miller’s and Coors’ US and Puerto Rico operations reported under International FinancialReporting Standards (IFRS) and US GAAP respectively for the six monthsended 30 September 2008. Adjustments have been made to reflect bothcompanies’ comparative data on a similar basis including amortisation ofdefinite-life intangible assets, depreciation reflecting revisions to property,plant and equipment values and the exclusion of exceptional items.
Chief Executive’s review
SABMiller plc Interim Report 2009 Chief Executive’s review 3
■ Lager volumes in South Africa declined by 3%, impacted bygenerally weak consumer spending. As expected, our year-on-yearmarket share fell. EBITA was flat due to adverse exchange rates;however, on a constant currency basis, grew 4%. Group revenueincreased by 6% on a constant currency basis, benefiting from theprice increases implemented in the prior year, more than offsettinghigher input costs. Fixed cost savings helped fund a substantialincrease in sales and marketing investment in the beer business,with the core of the lager brand portfolio strengthened by newadvertising campaigns and sponsorship of the ConfederationsFootball Cup and the Lions rugby tour. Soft drinks volumes weredown 2%, in line with the market. On 1 July, we announcedpreliminary details of a proposed broad-based black economicempowerment transaction in South Africa. This will benefitemployees, soft drinks and liquor retailers and the wider SouthAfrican community by enabling them to participate in the equity of The South African Breweries Limited.
■ The group has begun a major business capability programme that will simplify processes, reduce costs and allow localmanagement teams to enhance focus on their markets. Finance,human resources and procurement activities will be streamlined by deploying global information systems, establishing a globalprocurement operation and selectively outsourcing certainactivities. Sales, distribution and supply chain managementprocesses will also be enhanced and moved onto common,regional systems platforms. The programme is expected to takefour years to complete with spend weighted to the start of theprogramme. Exceptional costs of approximately US$370 millionwill be recognised in the current year’s income statement(US$187 million in the first half) with costs lowering progressivelyby approximately 40% year on year in each of the financial years2011 to 2013. In addition to non-financial benefits, we expect costand efficiency savings rising to approximately US$300 million perannum by the 2014 financial year and working capital inflows ofapproximately US$350 million which will largely be realised in thefinancial years 2010 to 2012.
OutlookOverall, we expect the current trading conditions to continue in thesecond half, as unemployment, retail spending and other consumerindicators lag the reported stabilisation of GDP in many of our markets.
Our operational performance continues to be driven by the uniquestrength of our local brand portfolios which have enabled marketshare gains in spite of the significant price increases taken in the prioryear. Price rises will moderate in the coming months compared withlast year. The margin trend delivered in the first half will be affectedover the remainder of the year as the price increases and costefficiencies achieved in the prior year are cycled. Input costs continueto be affected by existing contractual obligations but will begin toease towards the end of this year.
We expect second half reported results to benefit from favourablecurrency movements, provided our major operating currencies remainat or near current exchange rates to the US dollar. The group’sfinancial position remains strong and we are well positioned to takeadvantage of future improvements in the market environment.
Operational reviewLatin America
Sept SeptFinancial summary 2009 2008 %
Group revenue (including share of associates) (US$m) 2,746 2,848 (4)
EBITA* (US$m) 566 474 19EBITA margin (%) 20.6 16.6Sales volumes (hl 000)– Lager 18,053 18,260 (1)– Soft drinks 7,812 9,467 (17)– Soft drinks (organic) 7,812 7,647 2
*In 2009 before net exceptional charges of US$51 million being businesscapability programme costs (2008: US$nil).
Latin America delivered very strong EBITA growth in the first half of the year despite a 1% decline in lager volumes. Volumes wereimpacted by tough operating conditions in all markets, however, we continued to see share gains in Colombia and Peru, whileEcuador had a particularly strong first half with lager volume growth of 7%. Soft drinks volumes were 17% lower on a reported basis due to the disposal of the water business in Colombia and the soft drinks business in Bolivia in the prior year. On an organic basis,soft drinks grew 2% with good performance across the CentralAmerica markets.
EBITA grew 19%, despite year on year currency weakness, andmargin increased 400 bps. EBITA increased 33% on an organic,constant currency basis underpinned by pricing benefits, togetherwith fixed cost savings and reduced marketing spend compared torelatively high expenditure in the same period last year, which morethan offset higher commodity costs.
In Colombia, strong pricing in the prior year drove revenue growth of 6% on an organic, constant currency basis despite a 2% decline in lager volumes. This decline is a result principally of the benefit inSeptember of the prior year of increased sales activity ahead of a price increase on 1 October 2008. During October 2009, thisreduction in volume has been largely recovered. Economic indicatorscontinue to be soft with retail sales figures for the quarter to Julyshowing a 3.7% contraction. Our share of the alcohol marketincreased steadily over the period and was up 330 bps against theprior year at the end of September reflecting continued strengtheningof the appeal of the beer category to consumers, improvingconsumption frequency and greater beer affordability. Despite theeconomic environment, premium lager volumes grew by 20% in thefirst six months of the year boosted by robust growth of Redd’s, abrand focused on the female consumer, and Club Colombia, the localpremium brand. In the mainstream segment, Poker continued itsmomentum, while Aguila and Aguila Light increased market share in recent months.
Our Peru operations reported a lager volume decline of 2%, followinghigh growth in the prior year of 10%. In a market that declined by 7%due to pressure on disposable income and social conflict in parts ofthe country during May and July, our market share grew 420 bps. Our flagship brand, Cristal, continued to show positive momentum,while strong sales of Cusqueña drove 17% growth in the premiumsegment which more than offset a decline in the economy segmentresulting in a favourable mix change. Brand activation continues to focus on developing consumption occasions while significantinvestment in direct store delivery initiatives will aid our marketexecution further.

4 Chief Executive’s review SABMiller plc Interim Report 2009
Ecuador delivered robust sales growth with a 7% increase in lagervolumes. This performance was supported by growth in consumerdisposable income, following an increase in the minimum wage,combined with improved in-market execution and brand activation at the point of purchase. Expanded route to market penetration grewoutlet reach by 6% during the period, increasing our customer baseby 6,600 new customers. The performance of our premium brand,Club, continues to be strong with growth of over 50%, following theintroduction of a new 550ml pack in 2009. Our principal mainstreambrand, Pilsener, continued to capitalise on its strong brand equity and increased consumption frequency.
Lager volumes in Panama grew by 2% although market share fell. A decline in our mainstream brand, Atlas, was partly offset by stronggrowth in our Balboa brand and the doubling of volume in our premiumbrands. The soft drinks category delivered strong growth in the periodsupported by the successful relaunch of Malta Vigor in a new pack.
In Honduras, total volumes for the first half ended level with the prioryear. In spite of difficult trading conditions, beer share of alcoholincreased substantially during the period. Lager volumes declined by 16% as a result of curfews and dry laws implemented during thepolitical turmoil, offset by increased sparkling soft drinks sales asconsumers stocked up for home and family consumption. Ouroperation continued trading throughout the disruption in the country.
In El Salvador, domestic sparkling soft drinks volumes increased by 7% and we maintained market share during the period. Lagervolumes were level with the prior year, with a 7% decline in domesticvolumes offset by increased export volumes. Pricing gains andimproved lager mix benefited revenue.
Europe
Sept SeptFinancial summary 2009 2008 %
Group revenue(including share of associates) (US$m) 3,211 4,010 (20)
EBITA* (US$m) 590 725 (19)EBITA margin (%) 18.4 18.1Sales volumes (hl 000)– Lager 27,125 28,285 (4)– Lager (organic) 26,534 28,285 (6)
*In 2009 before net exceptional charges of US$123 million being US$41 millionof integration and restructuring costs and US$82 million of business capabilityprogramme costs (2008: US$10 million being the unwind of fair value adjustmentson inventory following the acquisition of Grolsch).
In Europe, reported lager volumes declined 4% while lager volumeswere down 6% on an organic basis versus the prior year. The beermarket continued to contract across the region as economicconditions depressed consumer spending. We gained market sharein Poland, Romania and the UK with strong momentum behind keybrands. In the Czech Republic, where we continued to pursue avalue-focused strategy, our volume share declined marginally. In Russia,our mainly premium portfolio has lost volume share as a result ofdown-trading.
Due to the devaluation of major central and eastern Europeancurrencies compared to the prior year, reported group revenuedeclined 20% and EBITA declined 19%. On an organic, constantcurrency basis, EBITA increased 5% and margin grew 90 bps duelargely to organic, constant currency revenue per hectolitre growth of 6%, reflecting strong pricing, and cost efficiencies. Marketingexpenditure was lower than the prior year which included sponsorshipat a local level of the Euro 2008 football championships and theOlympics. Fixed costs and depreciation increased due to expandedreach in Russia and Romania.
In Poland, lager volumes were down 4% in a market which declined9%. Market share rose 280 bps driven by strong sales execution, up-weighted distributor and trade promotional programmes andbrand activities centred on Tyskie as sponsor of the International Year of Beer. Our key mainstream brands performed ahead of themarket. Tyskie, which has enjoyed compounded annual growth of 7% over the past three years, declined 6%. Zubr captured significantmarket share with volumes level with the prior year. The premiumportfolio fared slightly better than the market. In the economysegment, the Wojak brand more than doubled its volume versus theprior year as distribution was expanded. Revenue per hectolitre grew6% reflecting price increases taken in the prior year following anexcise increase. In September 2009, we announced the completeclosure of the Kielce brewery.
Our strategy in the Czech Republic remains focused on coreportfolio strength and value leadership. Domestic lager volumesdeclined 3%, whilst the market declined 2% impacted by higherunemployment. The first half of the year was marked by the launch of PET packs for our two economy brands in response to competitiveactivity. The economic slowdown and lower tourism continue toimpact on-premise consumption; however, consumption in the off-premise channel was firmer than in the previous year and wecaptured share in the expanding modern-trade. Our premium brands,Pilsner Urquell, Frisco and the non-alcoholic Birell, all enjoyed volumegrowth during the period. In mainstream, Kozel consolidated itsposition as Czech’s number two brand, behind Gambrinus, andenjoyed another excellent performance with volume growth of 8%,doing well in both the on and off-premise channels. Gambrinus 10continued to decline, but the higher-priced variant Gambrinus 11performed strongly. Domestic revenue per hectolitre growth was 3%, despite negative sales mix. Efficiency in marketing investment,together with ongoing overhead cost savings, drove an improvementin constant currency EBITA.
Following strong comparative growth of 24%, lager volumes inRomania fell 12% in a market that declined 16% impacted severelyby the economic crisis. The latest IMF forecast shows a downwardrevision to GDP and the Romanian economy is now expected tocontract by 8.5% this year. In this context we continued to grow our market share, which increased by 140 bps over the period.Encouragingly, our mainstream brand, Timisoreana, continued itsstrong performance, with volume growth of 1%, notwithstandingcomparative growth of 31% in the prior year, and took significantmarket share. The on-premise channel declined sharply leading to amarked decline in premium volumes with the Ursus brand well downdespite gaining share of the segment. The integration of the Azugabusiness was completed during the period and we closed its brewery,as planned. A new campaign to renovate the Azuga economy brandwas launched in August. Revenue per hectolitre is up 10% followingabove-inflation price increases in the prior year and pricing taken inJuly of this year.
In Russia, a sharp decline in consumer disposable income led to an 8% drop in industry beer production. STRs were down 7%,approximately in line with the market. Our STW volumes were down12% reflecting significant trade destocking. Down-trading is a featureof the market and our super premium and premium portfolio hastherefore been disproportionately affected. Despite this, our premiumvalue share in Moscow grew 140 bps. On the back of our geographicexpansion strategy, we have launched the Tri Bogatyrya economybrand in a new PET format leading to growth of almost 60%. Thisbrand mix partially diluted the strong pricing taken in the prior yearbut we still achieved revenue per hectolitre growth of 6%. In May2009, we opened the new brewery in Ulyanovsk. In the Ukraine theSarmat brand has been relaunched and licensed production ofZolotaya Bochka and Kozel has commenced.
Chief Executive’s review continued

SABMiller plc Interim Report 2009 Chief Executive’s review 5
In Italy, economic conditions are still adverse but consumerconfidence is starting to improve. Birra Peroni volumes declined 9%during the period as we reduced our reliance on promoted volumeand focused on value. On a STR basis we have grown our marketshare in both volume and value. Profitability improved throughefficiencies in both production and marketing.
Domestic lager volumes in the Netherlands declined 8% and marketshare was marginally down. This intensely competitive beer markethas resulted in difficult conditions in the off-premise channel; however,recent trends are positive in the on-premise channel which is nowcycling the smoking ban introduced in July 2008. Restructuringinitiatives taken in the prior year are beginning to show benefits.
In the United Kingdom, lager volumes grew 15% on a like-for-likebasis, underpinned by Peroni Nastro Azzurro growth of 35%. Duringthe period, exports of Miller Genuine Draft to Eire were taken over byour UK business following the termination of the previous licensingarrangement. Our European import business, which serves WesternEuropean markets including Germany, Spain and France, continuedto exhibit strong growth driven by Grolsch and Pilsner Urquell. InHungary, Slovakia and the Canaries, economic conditions remainsevere and the beer markets depressed.
North America
Sept SeptFinancial summary 2009 2008 %
Group revenue(including share of joint ventures) (US$m) 2,870 2,9161 (2)
EBITA* (US$m) 379 3551 7EBITA margin (%) 13.2 12.21
Sales volumes (hl 000)– Lager – excluding contract brewing 24,116 25,2821 (5)– Soft drinks 22 391 (42)MillerCoors’ volumes– Lager – excluding contract brewing 23,370 23,5912 (1)– Sales to retailers (STRs) 23,179 23,4192 (1)– Contract brewing 2,456 2,6032 (6)
*In 2009 before net exceptional charges of US$11 million being the group’sshare of MillerCoors’ integration and restructuring costs of US$7 million and the group’s share of the unwind of the fair value inventory adjustment of US$4 million (2008: net exceptional credit of US$390 million beingUS$437 million profit on the deemed disposal of the Miller business andexceptional costs of US$23 million in relation to the exceptional credit ofintegration and restructuring costs for MillerCoors, together with the group’sshare of MillerCoors’ integration and restructuring costs of US$17 million and the group’s share of the unwind of the fair value inventory adjustment of US$7 million).
1 Volumes, group revenue and EBITA represent 100% of Miller BrewingCompany performance in the first quarter of the half year ended30 September 2008 and the group’s 58% share of MillerCoors’ performance and the retained wholly owned Miller Brewing Companybusiness (principally Miller Brewing International) for the balance of the period.
2 MillerCoors’ pro forma figures are based on results for Miller’s and Coors’ US and Puerto Rico operations reported under International FinancialReporting Standards (IFRS) and US GAAP respectively for the six monthsended 30 September 2008. Adjustments have been made to reflect bothcompanies’ comparative data on a similar basis including amortisation ofdefinite-life intangible assets, depreciation reflecting revisions to property,plant and equipment values and the exclusion of exceptional items.
Strong revenue and cost management together with continuedsynergy delivery from MillerCoors drove EBITA growth of 7% for NorthAmerica for the half year. Lager volumes, excluding contract brewing,declined 5%.
MillerCoorsIn the six months ended 30 September 2009, MillerCoors’ USdomestic volume STRs were down 1% on a pro forma2 basis due to a slight decline in premium light volumes and continued softness in above-premium and premium brands. Domestic STWs fell 1% on a pro forma basis driven by lower retail sales and a reduction incontract brewing volumes. EBITA grew 22% on a pro forma basis.
Pricing remained strong, with domestic net revenue per hectolitre,excluding contract brewing and company-owned distributor sales,growing 3% driven by sustained price increases taken in the secondhalf of the prior year and reduced discount activity.
Premium light brand volumes (Miller Lite, Coors Light and MGD 64)were down in low single digits largely due to a decline in Miller Lite,which was partially offset by MGD 64 growth. Miller Lite STRs were down mid single digits and Coors Light STRs were in line with the prior year period. MGD 64 continued to perform well ahead of expectations.
MillerCoors’ craft and import portfolio grew slightly during the halfyear, led by growth of Blue Moon and Peroni Nastro Azzurro. Thedomestic above-premium portfolio, which includes Miller Chill, Sparksand Killian’s Irish Red, experienced a double digit decline. The belowpremium portfolio was up low single digits, largely due to the strongperformance of Keystone Light and continued growth of Miller HighLife, which more than offset declines in Milwaukee’s Best.
Cost of goods sold increased as benefits from MillerCoors’ costleadership programmes were more than offset by brewing andpackaging materials cost increases under procurement contractslargely arranged prior to the softening in recent commodity prices.
Marketing, general and administrative costs decreased drivenprimarily by lower organisational costs and synergies, partially offsetby IT integration-related expenses.
MillerCoors achieved US$133 million in synergies in the six months to 30 September 2009, largely within marketing and more broadlyfrom the elimination of duplicate and transitional positions. Networkoptimisation savings continue to be realised from shifting productionof Coors and Miller brands within the larger MillerCoors’ brewerynetwork, a process which will continue for the next nine months.MillerCoors continued to integrate business processes and systemsacross the enterprise to improve customer service and capitalise on the scale of the business.
MillerCoors has delivered a total of US$211 million in cost savingssince beginning operations on 1 July 2008, and now expects to achieve US$335 million of cumulative synergies by the end of our current financial year, surpassing its original commitment ofUS$312 million. As previously communicated, MillerCoors will deliverincremental cost savings of US$200 million above its US$500 millionsynergy target, and these are expected to be delivered by the end of2012, broadly in line with current market expectations. These costsavings include efficiencies in production costs, procurement, andmarketing, general and administrative expenses.

6 Chief Executive’s review SABMiller plc Interim Report 2009
Africa
Sept SeptFinancial summary 2009 2008 %
Group revenue(including share of associates) (US$m) 1,263 1,350 (6)
EBITA* (US$m) 246 239 3EBITA margin (%) 19.5 17.7Sales volumes (hl 000)– Lager 6,392 6,203 3– Lager (organic) 6,379 6,203 3– Soft drinks 5,037 4,084 23– Soft drinks (organic) 4,275 4,084 5– Other alcoholic beverages 1,978 2,091 (5)
*In 2009 before net exceptional charges of US$4 million being businesscapability programme costs (2008: US$nil).
Africa’s total volumes grew 8% aided by acquisitions in Ghana,Nigeria and Ethiopia. Lager volumes grew 3% on an organic basisagainst a backdrop of softer economic conditions, with goodperformances in Uganda, Mozambique and Zambia. Soft drinksvolumes grew 5% on an organic basis with solid growth across theregion, while other alcoholic beverages declined by 5% following a period of strong growth in the prior year.
Our strategy of broadening the brand portfolio continued with theintroduction of local premium beer offerings in five markets and theroll-out of more affordable beverages in Tanzania and Mozambique to grow the beer category at the expense of subsistence alcohol. We also completed the acquisition of a water business in Ethiopiaand a non-alcoholic beverage business in Zambia, further expandingour full beverage portfolio.
Further investments were made at the point of consumption incoolers and outlet infrastructure to uplift and enliven on-premisedrinking occasions. The sales force has been expanded and servicelevels have been improved for each class of trade.
The extensive capacity upgrade project is nearing completion and we have recently completed projects in Uganda, Southern Sudan and Ghana. New plants in Tanzania, Mozambique and Angola aredue to be commissioned shortly.
EBITA grew 3%, despite adverse currency movements. On an organic,constant currency basis, EBITA grew 15% and margin improved by190 bps on the same basis, driven by robust pricing and a goodperformance from our associate, Castel.
In Uganda, lager volumes grew 18% driven by a healthy brandportfolio and supported by the introduction of the long neck bottlelast year and the launch of Nile Gold as a premium offering in a 330ml returnable bottle. A 20% increase in brewing capacity wascommissioned in June 2009.
Mozambique delivered strong results with lager volume ahead by7%. Much of this growth came from the market in the north of thecountry, justifying our November commissioning of the greenfieldbrewery in this region. Strong growth from Laurentina Preta, a darklager, and the recently launched Laurentina Premium further droveperformance.
Zambia benefited from a reduction in excise rates at the beginning ofthe year, growing lager volumes 23% despite a depressed economy.Soft drinks volumes were level with the prior year, while traditionalbeer volumes fell by 2% following strong growth in the prior year. We concluded the acquisition of the Maheu business, a traditionalmaize-based non-alcoholic flavoured drink, in September 2009.
In Tanzania, the economy was impacted more than other Africanmarkets by reduced agricultural exports and lower foreign directinvestment, and also suffered from extreme drought conditions in the northern and central regions. Lager volumes declined by 6% butmarket share improved marginally reflecting continued improvementsin sales execution and outlet penetration. During the period, wesuccessfully relaunched Ndovu Lager in a 375ml green returnablebottle with enhanced packaging.
The Botswana government implemented a 30% social levy on allalcoholic products in November 2008. The levy, compounded by an economy impacted by reduced diamond exports, resulted in salesfor the half year declining dramatically, with lager volumes 47% belowthe prior year and traditional beer sales down 14%. Soft drinksvolumes grew by 7% during the period.
In Angola, total volumes declined 1% for the half year due to acombination of port congestion, an economic slowdown following a decline in the oil price and reduced global demand for diamondsand limited availability of foreign currency. Our planned commissioningof a new beer and a new soft drinks plant in north Luanda later thisyear will alleviate some of the adverse impacts of port congestion byreducing the need to import finished product and the costs associatedwith demurrage and port handling.
Castel continued its strong performance with organic lager volumegrowth of 12% aided by the commissioning of two new breweries in Angola at the beginning of the calendar year, and good lagergrowth from Cameroon. Soft drinks volumes grew 9% with goodperformances in Tunisia and Algeria.
Asia
Sept SeptFinancial summary 2009 2008 %
Group revenue (including share of associates and joint ventures) (US$m) 1,021 905 13
EBITA* (US$m) 90 72 24EBITA margin (%) 8.8 8.0Sales volumes (hl 000)– Lager 29,229 25,981 12– Lager (organic) 28,343 25,981 9
*In 2009 before net exceptional charges of US$1 million being businesscapability programme costs (2008: US$nil).
Asia lager volumes grew 9% on an organic basis through goodperformances from China, Australia and Vietnam, while India’svolumes contracted predominantly due to regulatory issues. EBITA increased 24% and organic, constant currency EBITA grew29% reflecting a strong performance from our associate in China, CR Snow. Organic, constant currency EBITA margin grew 100 bps to 9.0%.
China’s beer industry experienced solid market growth ofapproximately 6%, and CR Snow enjoyed volume growth of 15%,well ahead of the market. CR Snow’s national brand, Snow, continuedto exploit its national brand positioning which, together with consistentretail pricing and improved sales execution, drove further marketshare gains.
In the northeast, CR Snow continues to lead the market with furthervolume gains in the Liaoning and Jilin provinces. Strong growth wasreported in the central region, despite the effects of bad weather andflooding in the second quarter. Within the central region, significantshare gains were achieved in the key provinces of Anhui and Zhejiangdriven by the success of the Snow brand, and profitability wasenhanced by improved cost efficiencies and synergies from previousacquisitions. The Sichuan area in the west remains a key strongholdfor the business, returning to growth following the earthquake in theprior year.
Chief Executive’s review continued

SABMiller plc Interim Report 2009 Chief Executive’s review 7
India experienced a tough first half year with volumes declining 21%largely as a result of regulatory issues in the important states ofAndhra Pradesh and Uttar Pradesh. Volumes were further reduced by excise increases in Karnataka and Rajasthan implemented duringthe period.
Vietnam, a wholly owned subsidiary from March 2009, continues to build from its greenfield start, recently launching Miller High Life to support the local Zorok brand. While still loss making, the businessis gaining good growth momentum in the market place.
Our joint venture in Australia enjoyed strong growth in a stagnantmarket, underpinned by growth of Peroni Nastro Azzurro, MillerGenuine Draft and Bluetongue. The business is currently constructinga greenfield brewery in New South Wales, to be commissioned next year.
South Africa: Beverages
Sept SeptFinancial summary 2009 2008 %
Group revenue(including share of associates) (US$m) 2,051 2,007 2
EBITA* (US$m) 333 332 –EBITA margin (%) 16.3 16.5Sales volumes (hl 000)– Lager 11,973 12,307 (3)– Soft drinks 7,248 7,396 (2)– Other alcoholic beverages 594 572 4
*In 2009 before net exceptional charges of US$21 million being businesscapability programme costs (2008: US$nil).
The South African economy weakened during the period with realgross domestic product declining by 3% during the second quarter of 2009. Headline inflation fell considerably from 13% to 6% comparedto the same period a year ago, but retail sales remained underpressure, falling by 5% year on year in September.
Lager volumes declined by 3%, impacted by reduced consumerspending. As expected, our year on year beer market share hasdeclined. Mainstream volumes, down 2%, performed relatively bettersupported by strong growth in Castle Lager and Hansa Pilsener.Carling Black Label continued to be impacted by its prevalence in the challenging Western Cape liquor market. Within local premium,Castle Lite returned to growth. Soft drinks volumes were down 2%, in line with the market. During the period, we grew our share of thesparkling soft drinks segment through effective market execution,particularly in the top-end grocer channel.
Group revenue increased by 2% (6% on a constant currency basis),continuing to benefit from the price increases implemented in theprior year in both the beer and soft drinks businesses.
Input costs remained under pressure as medium-term contractualarrangements with key brewing raw material suppliers limited thebusiness’ ability to benefit from the downturn in brewing commodityprices. Higher packaging materials and sugar prices also contributedto increased input costs in the first six months. In addition, our dollar-based input costs were higher than the prior year due to adverseforeign exchange rates. Distribution costs declined in line withrelatively lower crude oil prices, aided by distribution efficiencies.
Sales and marketing investment increased substantially, focused on our key brands. Investment in customer facing route to marketcapability intensified, with investment in direct distribution andimproved service levels to customers. These additional market facinginvestments were partly financed through an intensified productivityand cost reduction programme.
Efforts to enhance and grow the core of the lager brand portfolio saw new marketing campaigns for Carling Black Label, Castle Lagerand Hansa Pilsener, reinforcing key characteristics of the brands.Castle Lager also benefited from the recent sponsorship of theConfederations Football Cup championship and the Lions rugby tour of South Africa. Castle Lite saw growth returning towards theend of the period supported by its ‘Extra cold’ media campaign and sub-zero fridge placement in targeted outlets. At the same time, we pursued further growth in Peroni Nastro Azzurro and establishedour premium lager portfolio additions, Grolsch and Dreher, as longer-term contributors.
EBITA was level with the prior year at reported exchange rates, butgrew 4% on an organic, constant currency basis. Margins reducedslightly as price increases were not sufficient to offset the decline involumes, continued pressure from significantly higher input costs and additional market facing investments.
On 1 July, we announced preliminary details of a proposed broad-based black economic empowerment transaction in South Africa.The transaction is intended to benefit employees, soft drinks andliquor retailers and the wider South African community through theformation of The SAB Foundation, by enabling them to participate in the equity of The South African Breweries Limited. The full terms of the transaction will be announced in early December 2009.
Distell continued its robust performance with both domestic andinternational volumes exhibiting good growth to deliver increasedrevenue and improved profitability.
South Africa: Hotels and Gaming
Sept SeptFinancial summary 2009 2008 %
Group revenue (share of associates) (US$m) 193 186 3EBITA* (US$m) 53 61 (12)EBITA margin (%) 27.8 32.5Revenue per available room (Revpar) – US$ 63.44 75.56 (16)
*In 2009 before exceptional charges of US$nil (2008: before exceptionalcharges of US$9 million in relation to the fair value mark to market losses on financial instruments).
The group is a 49% shareholder in the Tsogo Sun Group. The half year results were affected by contraction in the South Africaneconomy affecting both the gaming market and the hospitality andtourism industry.
Our share of Tsogo Sun’s reported revenue was US$193 million, anincrease of 3% including the non-organic share of revenue of TsogoSun’s associated company Gold Reef Resorts and the newly acquiredCentury Casinos business. Excluding this incremental revenue,revenue declined 7% against the prior year.
The gaming industry in South Africa contracted from last year’s levelswith the exception of the KwaZulu-Natal region which continued toshow growth. Gauteng, the most significant gaming province, reporteda 5% decline in market size compared to the prior year, with TsogoSun’s Montecasino, the largest gaming unit, reporting flat revenue. On 30 June 2009, Tsogo Sun acquired 100% of the Century Casinosbusiness in Caledon and Newcastle.
The South African hotel industry has been under continued pressurethroughout the first half of the year, particularly in the key corporateand government market segments. A number of major sportingevents in South Africa during the first quarter of the year including the Indian Premier League cricket tournament, the ConfederationsFootball Cup championship and the Lions rugby tour assistedtrading. However, this was not enough to prevent a 16% decline in revpar.
EBITA for the division declined 12% for the period and margins werereduced, impacted by the difficult trading environment.
8 Chief Executive’s review SABMiller plc Interim Report 2009
Financial reviewNew accounting standards and restatementsThe accounting policies followed are the same as those publishedwithin the Annual Report and Accounts for the year ended 31 March2009 as amended for the changes set out in note 1, which have hadno material impact on group results. The consolidated balance sheetsas at 30 September 2008 and as at 31 March 2009 have beenrestated for further adjustments relating to initial accounting forbusiness combinations, further details of which are provided in note12. The Annual Report and Accounts for the year ended 31 March2009 are available on the company’s website: www.sabmiller.com.
Segmental analysisThe group’s operating results on a segmental basis are set out in the segmental analysis of operations. The group has adopted IFRS 8,‘Operating Segments’, with effect from 1 April 2009 and this hasresulted in a change to the segmental information reported, withAfrica and Asia now reported as separate segments. Comparativeinformation has been restated accordingly. Additional historicalinformation for each of the Africa and Asia segments is available on the company’s website.
SABMiller uses group revenue and EBITA (as defined in the financialdefinitions section) to evaluate performance and believes thesemeasures provide stakeholders with additional information on trendsand allow for greater comparability between segments. Segmentalperformance is reported after the specific apportionment ofattributable head office costs.
Disclosure of volumesIn the determination and disclosure of sales volumes, the groupaggregates 100% of the volumes of all consolidated subsidiaries andits equity accounted percentage of all associates’ and joint ventures’volumes. Contract brewing volumes are excluded from volumesalthough revenue from contract brewing is included within grouprevenue. Volumes exclude intra-group sales volumes. This measure of volumes is used in the segmental analyses as it more closely alignswith the consolidated group revenue and EBITA disclosures.
Organic, constant currency comparisonsThe group discloses certain results on an organic, constant currencybasis, to show the effects of acquisitions net of disposals andchanges in exchange rates on the group’s results. See the financialdefinitions section for the definition.
In relation to the MillerCoors joint venture no adjustments have beenmade in the calculation of organic results as the group’s share of thejoint venture is deemed to be comparable with 100% of the Millerbusiness in the comparative period.
Business combinations and acquisitionsOn 10 April 2009 the group assumed control of a 70.56% interest in Bere Azuga in Romania following receipt of clearance from thecompetition authorities and has consolidated Bere Azuga from thisdate. Subsequently, further share purchases were made, together witha mandatory public offer for the remainder of shares in Bere Azuga.As at 30 September 2009, the group had an effective interest of94.85% in Bere Azuga.
In July 2009 the group completed the acquisition of an effective 40%interest in Ambo Mineral Water Share Company in Ethiopia.
In September 2009 the group acquired Maheu, a non-alcoholic maizedrinks business, in Zambia.
On 29 May 2009 SABMiller plc acquired the outstanding 28.1%minority interest in its Polish subsidiary, Kompania Piwowarska SA, in exchange for 60 million ordinary shares of SABMiller plc.
Exceptional itemsItems that are material either by size or incidence are classified asexceptional items. Further details on the treatment of these items can be found in note 3 to the financial information.
Net exceptional charges of US$222 million before finance costs andtax were reported during the period (2008: net exceptional credit ofUS$371 million) including net exceptional charges of US$11 million(2008: US$33 million) related to the group’s share of joint ventures’and associates’ exceptional charges. The net exceptional chargeincluded US$170 million related to business capability programmecosts in Latin America, Europe, Africa, Asia, South Africa Beveragesand Corporate, together with a charge of US$41 million related tointegration and restructuring costs in Europe.
The group’s share of joint ventures’ and associates’ exceptional itemsincludes a charge of US$7 million related to the group’s share ofMillerCoors’ integration and restructuring costs and US$4 millionrelated to the group’s share of the unwinding of fair value adjustmentson inventory in MillerCoors.
In addition, there was an exceptional charge in the period ofUS$17 million (2008: US$nil) within net finance costs related to thebusiness capability programme.
In 2008, the net exceptional credit included a US$437 million profit onthe deemed disposal of 42% of the US and Puerto Rico operations ofMiller, partly offset by a charge of US$23 million related to MillerCoors’integration and restructuring costs and a charge of US$10 millionrelating to the unwinding of fair value adjustments on inventoryrelating to the acquisition of Grolsch. The group’s share of jointventures’ and associates’ exceptional items included a charge ofUS$17 million relating to its share of MillerCoors’ integration andrestructuring costs, US$7 million relating to its share of the unwindingof fair value adjustments on inventory in MillerCoors and a charge ofUS$9 million relating to fair value mark to market losses on financialinstruments in Tsogo Sun.
Finance costsNet finance costs decreased to US$266 million, a 31% decrease onthe prior period’s US$384 million. Finance costs in the current periodinclude a net gain of US$3 million (2008: net loss of US$26 million)from the mark to market adjustments of various derivatives on capitalitems for which hedge accounting cannot be applied. Finance costsin the period also include a US$17 million charge resulting from achange in valuation methodology of financial instruments as part ofthe business capability programme. The mark to market gain and thecharge resulting from the change in valuation have been excludedfrom the determination of adjusted finance costs and adjustedearnings per share. Adjusted net finance costs were US$253 million,down 29% reflecting the reduction in the weighted average interestrate due to the lower global interest rate environment.
Interest cover, as defined in the financial definitions section, hasincreased to 9.1 times from 6.8 times in the comparable prior year period.
Profit before taxAdjusted profit before tax of US$1,920 million increased by 3% overthe comparable period in the prior year, benefiting from lower netfinance costs.
On a statutory basis, profit before tax of US$1,498 million was down26% including the impact of the exceptional and other adjustingfinance items noted above. The principal differences relate toexceptional items with net exceptional charges of US$239 million inthe half year compared to net exceptional credits of US$371 million in the prior period.
Chief Executive’s review continued

SABMiller plc Interim Report 2009 Chief Executive’s review 9
TaxationThe effective tax rate of 29.4% before amortisation of intangibleassets (other than software), exceptional items and the adjustmentsto finance costs noted above, is below that of the prior year (31.0%).The rate has fallen principally as a result of beneficial changes in thecombination of geographic profits, but also through ongoingmanagement of the effective tax rate.
Earnings per shareThe group presents adjusted basic earnings per share to exclude theimpact of amortisation of intangible assets (other than software) andother non-recurring items, which include post-tax exceptional items,in order to present a more meaningful comparison for the periodsshown in the consolidated financial information. Adjusted basicearnings per share of 80.0 US cents were up 6% on the comparableperiod in the prior year, benefiting from lower finance costs andtaxation as discussed above together with lower profit attributable to minority interests, partially offset by an increase in the weightedaverage number of shares in issue. The reduction in profit attributableto minority interests and the increase in shares in issue result from thebuyout of the minority interests in our Polish business. An analysis ofearnings per share is shown in note 5. On a statutory basis, basicearnings per share are 34% lower at 63.0 US cents.
Cash flowNet cash generated from operations before working capital movements(EBITDA) decreased by 21% to US$1,865 million compared to theprior year period. This decrease was primarily due to the reduction inEBITDA from North America following the formation of the MillerCoorsjoint venture, as EBITDA excludes cash flows from associates andjoint ventures. Dividends received from the MillerCoors joint venture(reported within cash flows from investing activities) amounted toUS$427 million (2008: US$81 million). EBITDA together with theMillerCoors’ dividends decreased by 6% on the same period in theprior year, primarily due to expenditure on the business capabilityprogramme and the impact of the strength of the US dollar ontranslated results. Net cash generated from operating activities ofUS$1,499 million was up 27% reflecting a significant improvement in working capital, together with lower tax and net interest paymentspartly offset by the reduction in EBITDA. The working capitalimprovement compared to the same period last year reflects changesin process management practices applied to inventory, receivablesand payables, resulting in net working capital inflows in most majoroperations. Free cash flow improved by US$1,124 million toUS$998 million, as detailed in note 9b.
Capital expenditureThe group has continued to invest in its operations, selectivelymaintaining investment to support future growth, including newbreweries in Russia, Angola, Tanzania, Southern Sudan andMozambique together with recently completed capacity expansionsin Poland, Romania, Ghana and Uganda. Capital expenditure for the six months to 30 September 2009 was US$728 million (2008:US$1,245 million). With effect from 1 July 2008, the capitalexpenditure for the MillerCoors joint venture has been excluded from the consolidated capital expenditure reported.
Capital expenditure including the purchase of intangible assets wasUS$739 million (2008: US$1,279 million).
Borrowings and net debtGross debt at 30 September 2009, comprising borrowings togetherwith the fair value of derivative assets or liabilities held to manageinterest rate and foreign currency risk of borrowings, has increased to US$9,809 million from US$9,131 million at 31 March 2009,primarily as a result of the impact of exchange rates on the retranslationof the group’s Colombian peso and euro denominated debt. Net debt comprising gross debt net of cash and cash equivalents hasincreased to US$9,345 million from US$8,709 million (restated) at31 March 2009. An analysis of net debt is provided in note 9c.
The group’s gearing (presented as a ratio of net debt/equity) hasdecreased to 47.0% from 54.0% (restated) at 31 March 2009. The weighted average interest rate for the gross debt portfolio at 30 September 2009 was 6.0% (31 March 2009: 7.1%).
On 1 July 2009 the US$300 million LIBOR +0.3% Notes issued bySABMiller plc matured and were refinanced from existing facilities. On 17 July 2009 SABMiller plc completed a €1,000 million bondissue which was issued under the US$5,000 million Euro MediumTerm Note Programme. The notes were issued in a single tranche of 5.5 year notes with a coupon of 4.5%. The net proceeds of thebond have been used to repay certain indebtedness.
Subsequent to 30 September 2009 the US$1,000 million 364 dayfacility was voluntarily cancelled in part, reducing the size of the facilityto US$600 million. The facility was subsequently extended fromOctober 2009 to 6 October 2010 in the amount of US$515 million,with a one year term out option.
Total equityTotal equity increased from US$16,117 million (as restated) at31 March 2009 to US$19,880 million at 30 September 2009. Theincrease is principally due to currency translation movements onforeign currency investments, profit for the period and the issue ofshares for the Polish minority buyout, partly offset by fair value moveson hedged items and dividend payments.
Goodwill and intangible assetsGoodwill has increased to US$11,608 million (31 March 2009:US$8,715 million) primarily due to foreign exchange movements and goodwill on acquisitions in the period, including the Polishminority buyout. Intangible assets have increased in the period toUS$4,369 million (31 March 2009: US$3,741 million) as a result of foreign exchange movements partially offset by amortisation. The comparatives for both goodwill and intangible assets have beenrestated to reflect adjustments to provisional fair values of businesscombinations, further details of which are provided in note 12.
CurrenciesThe rand appreciated by 27% against the US dollar during the sixmonths to 30 September 2009 and ended the period at R7.55 to theUS dollar, while the weighted average rand/dollar rate weakened by4% to R8.12 compared with R7.79 in the comparable period. TheColombian peso (COP) strengthened by 33% against the US dollarduring the six months and ended the period at COP1,922 to the USdollar compared with COP2,561 at 31 March 2009. The weightedaverage COP/dollar rate weakened by 14% to COP2,113 comparedwith COP1,827 in the comparable period.

10 Chief Executive’s review SABMiller plc Interim Report 2009
Risks and uncertaintiesThe principal risks and uncertainties for the first six months andremaining six months of the financial year remain as reflected on page10 of the 2009 Annual Report. These are summarised as follows:
The risk that, as the industry consolidates, failure to participate inattractive value-adding transactions may inhibit the group’s ability togrow and exploit scale benefits. There is also a risk that expectedbenefits from participating in consolidation and integrating acquisitionsmay not be captured or may be inadequate, or that the group maynot fully leverage its scale across business operations.
The risk that opportunities for profitable growth may not be realisedshould the group fail to ensure the relevance and attractiveness of its brands, and continuously improve its marketing and relatedsales capability.
The risk that the group’s global growth potential may be jeopardiseddue to a failure to develop and maintain a sufficient cadre of talentedmanagement or to capture shared learnings and leverage expertisethrough effective management practices.
The risk that regulatory authorities when making impositions on beerdo not recognise the positive contribution of the group’s businesses,and effective ways of addressing health and social concerns. Inaffected countries the group’s ability to grow profitably and contributeto local communities could be adversely affected.
The risk that margins could fall because the group fails to ensure an adequate supply of brewing and packaging raw materials atcompetitive prices.
The risk that the group’s plans and responses to changes in globaleconomic conditions may not be adequate.
DividendThe board has declared a cash interim dividend of 17 US cents pershare, an increase of 6%. The dividend will be payable on Friday11 December 2009 to shareholders registered on the London andJohannesburg registers on Friday 4 December 2009. The ex-dividendtrading dates will be Wednesday 2 December 2009 on the LondonStock Exchange (LSE) and Monday 30 November 2009 on the JSE Limited (JSE). As the group reports in US dollars, dividends are declared in US dollars. They are payable in South African rand to shareholders on the Johannesburg register, in US dollars toshareholders on the London register with a registered address in the United States (unless mandated otherwise), and in sterling to all remaining shareholders on the London register. Further detailsrelating to dividends are provided in note 6.
The rate of exchange applicable for US dollar conversion into SouthAfrican rand and sterling was determined on 18 November 2009. The rate of exchange determined for converting to South African randwas US$:ZAR 7.41400 resulting in an equivalent interim dividend of126.038 SA cents per share. The rate of exchange determined forconverting to sterling was GBP:US$1.6799 resulting in an equivalentinterim dividend of 10.1197 UK pence per share.
From the commencement of trading on Thursday 19 November 2009until the close of business on Friday 4 December 2009, no transfersbetween the London and Johannesburg registers will be permitted,and from Monday 30 November 2009 until Friday 4 December 2009,no shares may be dematerialised or rematerialised, both days inclusive.
Chief Executive’s review continued

SABMiller plc Interim Report 2009 Directors’ responsibility for financial reporting / Independent review report 11
This statement, which should be read in conjunction with theindependent review report of the auditors set out below, is made toenable shareholders to distinguish the respective responsibilities ofthe directors and the auditors in relation to the consolidated interimfinancial information, set out on pages 12 to 27, which the directorsconfirm has been prepared on a going concern basis. The directorsconsider that the group has used appropriate accounting policies,consistently applied and supported by reasonable and appropriatejudgements and estimates.
A copy of the interim report of the group is placed on the company’swebsite. The directors are responsible for the maintenance andintegrity of the statutory and audited information on the company’swebsite. Information published on the internet is accessible in manycountries with different legal requirements. Legislation in the UnitedKingdom governing the preparation and dissemination of the financialstatements may differ from legislation in other jurisdictions.
The directors confirm that this condensed set of interim financialinformation has been prepared in accordance with IAS 34 as adoptedby the European Union, and the interim management report hereinincludes a fair review of the information required by DTR 4.2.7 andDTR 4.2.8 of the Disclosure and Transparency Rules of the UnitedKingdom’s Financial Services Authority.
The directors of SABMiller plc are listed in the SABMiller plc AnnualReport for the year ended 31 March 2009. Howard Willard wasappointed to the board with effect from 1 August 2009. A list ofcurrent directors is maintained on the SABMiller plc website:www.sabmiller.com.
On behalf of the board
EAG Mackay MI WymanChief executive Chief financial officer
19 November 2009
IntroductionWe have been engaged by the company to review the condensed set of financial information in the half-yearly financial report for the sixmonths ended 30 September 2009, which comprises the consolidatedincome statement, consolidated statement of comprehensive income,consolidated balance sheet, consolidated cash flow statement,consolidated statement of changes in equity and related notes. Wehave read the other information contained in the half-yearly financialreport and considered whether it contains any apparent misstatementsor material inconsistencies with the information in the condensed setof financial information.
Directors’ responsibilitiesThe half-yearly financial report is the responsibility of, and has been approved by, the directors. The directors are responsible forpreparing the half-yearly financial report in accordance with theDisclosure and Transparency Rules of the United Kingdom’s FinancialServices Authority.
As disclosed in note 1, the annual financial statements of the groupare prepared in accordance with IFRS as adopted by the EuropeanUnion. The condensed set of financial information included in thishalf-yearly financial report has been prepared in accordance withInternational Accounting Standard 34, ‘Interim Financial Reporting’,as adopted by the European Union.
Our responsibilityOur responsibility is to express to the company a conclusion on thecondensed set of financial information in the half-yearly financialreport based on our review. This report, including the conclusion, hasbeen prepared for and only for the company for the purpose of theDisclosure and Transparency Rules of the Financial Services Authorityand for no other purpose. We do not, in producing this report, acceptor assume responsibility for any other purpose or to any other personto whom this report is shown or into whose hands it may come savewhere expressly agreed by our prior consent in writing.
Scope of reviewWe conducted our review in accordance with International Standardon Review Engagements (UK and Ireland) 2410, ‘Review of InterimFinancial Information Performed by the Independent Auditor of theEntity’ issued by the Auditing Practices Board for use in the UnitedKingdom. A review of interim financial information consists of makingenquiries, primarily of persons responsible for financial and accountingmatters, and applying analytical and other review procedures. A review is substantially less in scope than an audit conducted inaccordance with International Standards on Auditing (UK and Ireland)and consequently does not enable us to obtain assurance that wewould become aware of all significant matters that might be identifiedin an audit. Accordingly, we do not express an audit opinion.
ConclusionBased on our review, nothing has come to our attention that causesus to believe that the condensed set of financial information in thehalf-yearly financial report for the six months ended 30 September2009 is not prepared, in all material respects, in accordance withInternational Accounting Standard 34 as adopted by the EuropeanUnion and the Disclosure and Transparency Rules of the UnitedKingdom’s Financial Services Authority.
PricewaterhouseCoopers LLPChartered AccountantsLondon
19 November 2009
Directors’ responsibility for financial reporting
Independent review reportof half-yearly consolidated financial information to SABMiller plc

12 Consolidated income statement SABMiller plc Interim Report 2009
Six months Six months Yearended ended ended
30/9/09 30/9/08 31/3/09Unaudited Unaudited Audited
Notes US$m US$m US$m
Revenue 2 8,846 11,166 18,703Net operating expenses (7,632) (9,011) (15,555)
Operating profit 2 1,214 2,155 3,148
Operating profit before exceptional items 1,425 1,751 3,146Exceptional items 3 (211) 404 2
Net finance costs (266) (384) (706)
Interest payable and similar charges (425) (654) (1,301)Interest receivable and similar income 159 270 595
Share of post-tax results of associates and joint ventures 2 550 249 516
Profit before taxation 1,498 2,020 2,958Taxation 4 (436) (455) (801)
Profit for the financial period 1,062 1,565 2,157
Profit attributable to minority interests 89 142 276Profit attributable to equity shareholders 5 973 1,423 1,881
1,062 1,565 2,157
Basic earnings per share (US cents) 5 63.0 94.8 125.2Diluted earnings per share (US cents) 5 62.6 94.3 124.6
All operations are continuing.
The notes on pages 17 to 27 form an integral part of this condensed interim financial information.
Consolidated income statementfor the six months ended 30 September

SABMiller plc Interim Report 2009 Consolidated statement of comprehensive income 13
Six months Six months Yearended ended ended
30/9/09 30/9/08 31/3/09Unaudited Unaudited Unaudited
US$m US$m US$m
Profit for the period 1,062 1,565 2,157Other comprehensive income:Currency translation differences on foreign currency net investments 2,590 (1,587) (3,385)Actuarial losses on defined benefit plans – (37) (18)Available for sale investments:– Fair value gains/(losses) arising during the period 2 (3) (8)Net investment hedges:– Fair value (losses)/gains arising during the period (367) 112 337Cash flow hedges: (46) 20 28
– Fair value (losses)/gains arising during the period (47) 25 24– Reclassification adjustment for gains/(losses) included in profit or loss 1 (5) 4
Tax on items included in other comprehensive income: (26) 10 125
– Tax on cash flow hedges (26) (4) 31– Tax on actuarial losses on defined benefit plans – 14 94
Share of associates’ and joint ventures’ gains/(losses) included in other comprehensive income 85 (38) (330)
Total comprehensive income for the period, net of tax 3,300 42 (1,094)
– Attributable to equity shareholders 3,222 (89) (1,345)– Attributable to minority interests 78 131 251
The notes on pages 17 to 27 form an integral part of this condensed interim financial information.
Consolidated statement of comprehensive incomefor the six months ended 30 September
14 Consolidated balance sheet SABMiller plc Interim Report 2009
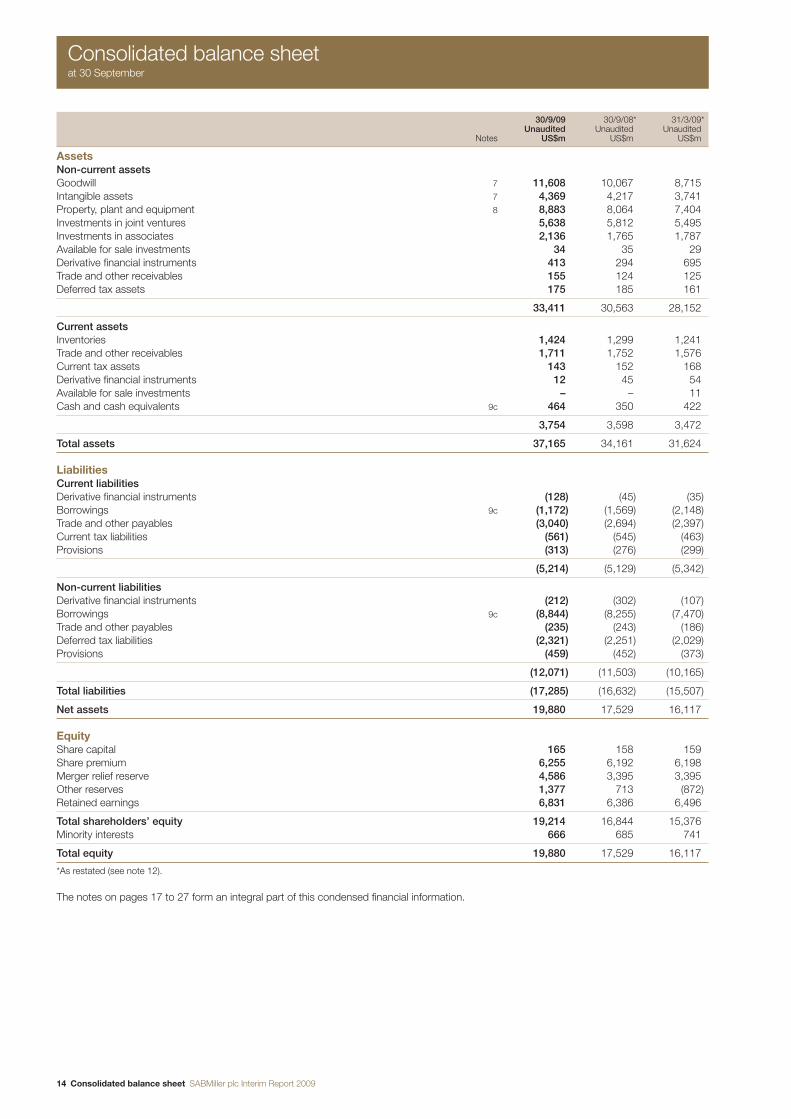
30/9/09 30/9/08* 31/3/09*Unaudited Unaudited Unaudited
Notes US$m US$m US$m
AssetsNon-current assetsGoodwill 7 11,608 10,067 8,715Intangible assets 7 4,369 4,217 3,741Property, plant and equipment 8 8,883 8,064 7,404Investments in joint ventures 5,638 5,812 5,495Investments in associates 2,136 1,765 1,787Available for sale investments 34 35 29Derivative financial instruments 413 294 695Trade and other receivables 155 124 125Deferred tax assets 175 185 161
33,411 30,563 28,152
Current assetsInventories 1,424 1,299 1,241Trade and other receivables 1,711 1,752 1,576Current tax assets 143 152 168Derivative financial instruments 12 45 54Available for sale investments – – 11Cash and cash equivalents 9c 464 350 422
3,754 3,598 3,472
Total assets 37,165 34,161 31,624
LiabilitiesCurrent liabilitiesDerivative financial instruments (128) (45) (35)Borrowings 9c (1,172) (1,569) (2,148)Trade and other payables (3,040) (2,694) (2,397)Current tax liabilities (561) (545) (463)Provisions (313) (276) (299)
(5,214) (5,129) (5,342)
Non-current liabilitiesDerivative financial instruments (212) (302) (107)Borrowings 9c (8,844) (8,255) (7,470)Trade and other payables (235) (243) (186)Deferred tax liabilities (2,321) (2,251) (2,029)Provisions (459) (452) (373)
(12,071) (11,503) (10,165)
Total liabilities (17,285) (16,632) (15,507)
Net assets 19,880 17,529 16,117
EquityShare capital 165 158 159Share premium 6,255 6,192 6,198Merger relief reserve 4,586 3,395 3,395Other reserves 1,377 713 (872)Retained earnings 6,831 6,386 6,496
Total shareholders’ equity 19,214 16,844 15,376Minority interests 666 685 741
Total equity 19,880 17,529 16,117
*As restated (see note 12).
The notes on pages 17 to 27 form an integral part of this condensed financial information.
Consolidated balance sheetat 30 September

SABMiller plc Interim Report 2009 Consolidated cash flow statement 15
Six months Six months Yearended ended ended
30/9/09 30/9/08* 31/3/09*Unaudited Unaudited Unaudited
Notes US$m US$m US$m
Cash flows from operating activitiesCash generated from operations 9a 2,165 2,017 3,671Interest received 170 122 275Interest paid (499) (511) (997)Tax paid (337) (450) (766)
Net cash from operating activities 9b 1,499 1,178 2,183
Cash flows from investing activitiesPurchase of property, plant and equipment (728) (1,245) (2,073)Proceeds from sale of property, plant and equipment 20 22 75Purchase of intangible assets (11) (34) (74)Purchase of available for sale investments – – (14)Proceeds from disposal of available for sale investments 2 1 4Proceeds from disposal of businesses – – 119Acquisition of businesses (net of cash acquired) (30) (184) (252)Overdraft disposed with businesses – 2 2Cash disposed with businesses – – (4)Purchase of shares from minorities (3) (2) (5)Investments in joint ventures (142) (123) (397)Investments in associates (9) (5) (4)Repayment of investments by associates – – 3Dividends received from joint ventures 427 81 454Dividends received from associates 39 119 151Dividends received from other investments 1 1 1
Net cash used in investing activities (434) (1,367) (2,014)
Cash flows from financing activitiesProceeds from the issue of shares 57 16 23Purchase of own shares for share trusts (8) (26) (37)Proceeds from borrowings 3,623 2,466 4,960Repayment of borrowings (3,857) (1,802) (4,096)Net repayment of capital element of finance leases (1) (3) (1)Net cash payments on net investment hedges (109) (24) (12)Dividends paid to shareholders of the parent (654) (640) (877)Dividends paid to minority interests (95) (118) (217)
Net cash used in financing activities (1,044) (131) (257)
Net cash from operating, investing and financing activities 21 (320) (88)Effects of exchange rate changes 56 83 22
Net increase/(decrease) in cash and cash equivalents 77 (237) (66)Cash and cash equivalents at 1 April 9c 122 188 188
Cash and cash equivalents at end of period 9c 199 (49) 122
*As restated (see note 12).
The notes on pages 17 to 27 form an integral part of this condensed financial information.
Consolidated cash flow statementfor the six months ended 30 September

16 Consolidated statement of changes in equity SABMiller plc Interim Report 2009
Share TotalCalled up premium Other Retained shareholders’ Minority Total
share capital account reserves earnings equity interests equityUS$m US$m US$m US$m US$m US$m US$m
At 1 April 2008 (audited) 158 6,176 5,610 5,601 17,545 699 18,244Total comprehensive income – – (1,499) 1,410 (89) 131 42
Profit for the period – – – 1,423 1,423 142 1,565Other comprehensive income – – (1,499) (13) (1,512) (11) (1,523)
Other movements – – 4 2 6 – 6Contributed to joint ventures – – (7) – (7) (2) (9)Dividends paid – – – (640) (640) (143) (783)Issue of SABMiller plc ordinary shares – 16 – – 16 – 16Payment for purchase of own shares
for share trusts – – – (26) (26) – (26)Credit entry relating to share-based payments – – – 39 39 – 39
At 30 September 2008* (unaudited) 158 6,192 4,108 6,386 16,844 685 17,529
At 1 April 2008 (audited) 158 6,176 5,610 5,601 17,545 699 18,244Total comprehensive income – – (3,080) 1,735 (1,345) 251 (1,094)
Profit for the period – – – 1,881 1,881 276 2,157Other comprehensive income – – (3,080) (146) (3,226) (25) (3,251)
Other movements – – – (5) (5) – (5)Contributed to joint ventures – – (7) – (7) (2) (9)Dividends paid – – – (877) (877) (221) (1,098)Issue of SABMiller plc ordinary shares 1 22 – – 23 – 23Payment for purchase of own shares
for share trusts – – – (37) (37) – (37)Arising on business combinations – – – – – 17 17Buyout of minority interests – – – – – (3) (3)Credit entry relating to share-based payments – – – 79 79 – 79
At 31 March 2009* (unaudited) 159 6,198 2,523 6,496 15,376 741 16,117
At 1 April 2009 (unaudited) 159 6,198 2,523 6,496 15,376 741 16,117Total comprehensive income – – 2,249 973 3,222 78 3,300
Profit for the period – – – 973 973 89 1,062Other comprehensive income – – 2,249 – 2,249 (11) 2,238
Other movements – – – (4) (4) – (4)Dividends paid – – – (663) (663) (88) (751)Issue of SABMiller plc ordinary shares 6 57 1,191 – 1,254 – 1,254Payment for purchase of own shares
for share trusts – – – (8) (8) – (8)Arising on business combinations – – – – – 14 14Buyout of minority interests – – – – – (79) (79)Credit entry relating to share-based payments – – – 37 37 – 37
At 30 September 2009 (unaudited) 165 6,255 5,963 6,831 19,214 666 19,880
*As restated (see note 12).
The notes on pages 17 to 27 form an integral part of this condensed financial information.
The US$1,191 million increase in other reserves in the six months ended 30 September 2009 relates to merger relief arising on the issue of SABMiller plc ordinary shares for the buyout of minority interests in the group’s Polish business.
Consolidated statement of changes in equityfor the six months ended 30 September

SABMiller plc Interim Report 2009 Notes to the financial information 17
1. Basis of preparationThe condensed consolidated interim financial information (the ‘financial information’) comprises the unaudited results of SABMiller plc for thesix months ended 30 September 2009 and 30 September 2008, together with the audited results for the year ended 31 March 2009, restatedfor further unaudited adjustments relating to initial accounting for business combinations. Further details of these adjustments are provided innote 12. The financial information in this report is not audited and does not constitute statutory accounts within the meaning of s434 of theCompanies Act 2006. The board of directors approved this financial information on 18 November 2009. The annual financial statements for the year ended 31 March 2009, approved by the board of directors on 1 June 2009, which represent the statutory accounts for that year, have been filed with the Registrar of Companies. The auditors’ report on those accounts was unqualified and did not contain a statementmade under s237(2) or (3) of the Companies Act 1985.
The unaudited financial information in this interim report has been prepared in accordance with the Disclosure and Transparency Rules of theFinancial Services Authority, and with IAS 34 ‘Interim Financial Reporting’ as adopted by the European Union. The interim financial informationshould be read in conjunction with the annual financial statements for the year ended 31 March 2009, which have been prepared inaccordance with IFRS as adopted by the European Union.
Items included in the financial information of each of the group’s entities are measured using the currency of the primary economic environmentin which the entity operates (the functional currency). The consolidated financial information is presented in US dollars which is the group’spresentational currency.
Accounting policiesThe financial statements are prepared under the historical cost convention, except for the revaluation to fair value of certain financial assets andliabilities, share-based payments, and pension assets and liabilities.
The accounting policies adopted are consistent with those of the annual financial statements for the year ended 31 March 2009, which werepublished in June 2009, as described in those financial statements except as set out below.
The following standards are mandatory for the first time in the financial year ending 31 March 2010 and are relevant for the group.
IAS 1 (revised), ‘Presentation of Financial Statements’ requires the presentation of a statement of changes in equity as a primary statement,includes non-mandatory changes to the titles of primary statements and introduces a statement of comprehensive income, but allows thepresentation of a two statement approach with a separate income statement and statement of comprehensive income. The group has chosento maintain existing primary statement titles and to follow the two statement approach.
IFRS 8, ‘Operating Segments’ requires separate reporting of segmental information for operating segments. Operating segments reflect themanagement structure of the group and the way performance is evaluated and resources allocated based on group revenue and EBITA by the group’s chief operating decision maker, defined as the executive directors. The group is focused geographically and as a result of theimplementation of IFRS 8, Africa and Asia are now presented as separate segments. Comparative information has been restated accordingly.Whilst not meeting the definition of reportable segments, the group reports separately as segments Asia, South Africa Hotels and Gaming andCorporate as this provides useful additional information.
The following standards and interpretations have been adopted by the group since 1 April 2009 with no significant impact on its consolidatedresults or financial position:
− Amendment to IAS 23, revised, ‘Borrowing Costs’
− Amendment to IFRS 2, ‘Share-based Payments’ – Vesting Conditions and Cancellations
− Amendment to IFRS 7, ‘Financial Instruments: Disclosures’
− Amendment to IAS 32, ‘Financial Instruments: Presentation’ and IAS 1, ‘Presentation of Financial Statements’ – ‘Puttable FinancialInstruments and Obligations Arising on Liquidation’
− Amendment to IAS 39, ‘Financial Instruments: Recognition and Measurement’ – Reclassification of Financial Assets
− IFRIC 13, ‘Customer Loyalty Programmes’
− Amendment to IFRIC 9, ‘Reassessment of Embedded Derivatives’.
Notes to the financial information

18 Notes to the financial information SABMiller plc Interim Report 2009
2. Segmental information (unaudited)The segmental information presented below includes the reconciliation of GAAP measures presented on the face of the income statement to non-GAAP measures which are used by management to analyse the group’s performance.
Share of Share ofassociates’ associates’
and joint and jointSegment ventures’ Group Segment ventures’ Grouprevenue revenue revenue revenue revenue revenue
Six months ended 30 September: 2009 2009 2009 2008 2008 2008US$m US$m US$m US$m US$m US$m
Latin America 2,741 5 2,746 2,842 6 2,848Europe 3,201 10 3,211 3,992 18 4,010North America 57 2,813 2,870 1,501 1,415 2,916Africa 802 461 1,263 815 535 1,350Asia 226 795 1,021 248 657 905South Africa: 1,819 425 2,244 1,768 425 2,193
– Beverages 1,819 232 2,051 1,768 239 2,007– Hotels and Gaming – 193 193 – 186 186
Group 8,846 4,509 13,355 11,166 3,056 14,222
Year ended 31 March: 2009 2009 2009US$m US$m US$m
Latin America 5,484 11 5,495Europe 6,118 27 6,145North America 1,553 3,674 5,227Africa 1,615 952 2,567Asia 470 1,095 1,565South Africa: 3,463 840 4,303
– Beverages 3,463 492 3,955– Hotels and Gaming – 348 348
Group 18,703 6,599 25,302
Operating profitThe following table provides a reconciliation of operating profit to operating profit before exceptional items.
Operating Operating profit before profit before
Operating Exceptional exceptional Operating Exceptional exceptionalprofit items items profit items items
Six months ended 30 September: 2009 2009 2009 2008 2008 2008US$m US$m US$m US$m US$m US$m
Latin America 458 51 509 411 – 411Europe 452 123 575 695 10 705North America (3) – (3) 642 (414) 228Africa 115 4 119 135 – 135Asia (17) 1 (16) 1 – 1South Africa: Beverages 290 21 311 304 – 304Corporate (81) 11 (70) (33) – (33)
Group 1,214 211 1,425 2,155 (404) 1,751
Year ended 31 March: 2009 2009 2009US$m US$m US$m
Latin America 1,102 (45) 1,057Europe 448 452 900North America 639 (409) 230Africa 354 – 354Asia (2) – (2)South Africa: Beverages 704 – 704Corporate (97) – (97)
Group 3,148 (2) 3,146
Notes to the financial information continued

SABMiller plc Interim Report 2009 Notes to the financial information 19
2. Segmental information (unaudited) continuedEBITA (segment result)This comprises operating profit before exceptional items, amortisation of intangible assets (excluding software) and includes the group’s shareof associates’ and joint ventures’ operating profit on a similar basis. The following table provides a reconciliation of operating profit beforeexceptional items to EBITA.
Amortisation Amortisationof intangible of intangible
Share of assets Share of assetsassociates’ (excluding associates’ (excluding
and joint software) – and joint software) –ventures’ group and ventures’ group and
Operating operating share of Operating operating share ofprofit before profit before associates profit before profit before associatesexceptional exceptional and joint exceptional exceptional and joint
items items ventures EBITA items items ventures EBITASix months ended 30 September: 2009 2009 2009 2009 2008 2008 2008 2008
US$m US$m US$m US$m US$m US$m US$m US$m
Latin America 509 – 57 566 411 – 63 474Europe 575 1 14 590 705 2 18 725North America (3) 360 22 379 228 113 14 355Africa 119 126 1 246 135 104 – 239Asia (16) 103 3 90 1 68 3 72South Africa: 311 75 – 386 304 89 – 393
– Beverages 311 22 – 333 304 28 – 332– Hotels and Gaming – 53 – 53 – 61 – 61
Corporate (70) – – (70) (33) – – (33)
Group 1,425 665 97 2,187 1,751 376 98 2,225
Year ended 31 March: 2009 2009 2009 2009US$m US$m US$m US$m
Latin America 1,057 1 115 1,173Europe 900 4 40 944North America 230 314 37 581Africa 354 208 – 562Asia (2) 75 7 80South Africa: 704 181 1 886
– Beverages 704 60 – 764– Hotels and Gaming – 121 1 122
Corporate (97) – – (97)
Group 3,146 783 200 4,129
The group’s share of associates’ and joint ventures’ operating profit is reconciled to the share of post-tax results of associates and jointventures in the income statement as follows:
Six months Six months Yearended ended ended
30/9/09 30/9/08 31/3/09US$m US$m US$m
Share of associates’ and joint ventures’ operating profit before exceptional items 665 376 783Share of associates’ and joint ventures’ exceptional items (11) (33) (91)Share of associates’ and joint ventures’ net finance cost (14) (7) (25)Share of associates’ and joint ventures’ tax (63) (65) (113)Share of associates’ and joint ventures’ minority interests (27) (22) (38)
550 249 516
Excise duties of US$1,859 million (2008: US$2,271 million) have been incurred during the six months as follows: Latin America US$698 million(2008: US$721 million); Europe US$602 million (2008: US$734 million); North America US$1 million (2008: US$239 million); AfricaUS$129 million (2008: US$139 million); Asia US$89 million (2008: US$102 million) and South Africa US$340 million (2008: US$336 million).
Beer volumes increase during the summer months leading to higher revenues being recognised in the first half of the year in the Europe andNorth America segments. Due to the spread of the business between Northern and Southern hemispheres, the results for the group as awhole are not highly seasonal in nature.
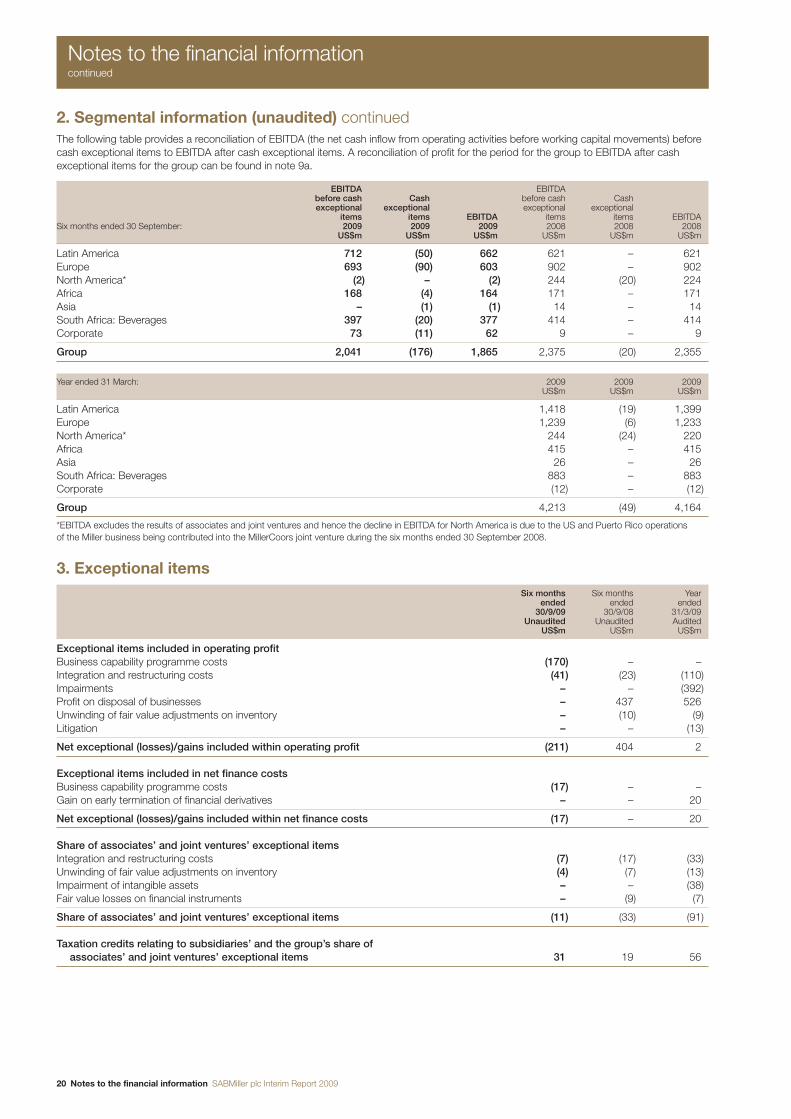
20 Notes to the financial information SABMiller plc Interim Report 2009
2. Segmental information (unaudited) continuedThe following table provides a reconciliation of EBITDA (the net cash inflow from operating activities before working capital movements) beforecash exceptional items to EBITDA after cash exceptional items. A reconciliation of profit for the period for the group to EBITDA after cashexceptional items for the group can be found in note 9a.
EBITDA EBITDAbefore cash Cash before cash Cashexceptional exceptional exceptional exceptional
items items EBITDA items items EBITDASix months ended 30 September: 2009 2009 2009 2008 2008 2008
US$m US$m US$m US$m US$m US$m
Latin America 712 (50) 662 621 – 621Europe 693 (90) 603 902 – 902North America* (2) – (2) 244 (20) 224Africa 168 (4) 164 171 – 171Asia – (1) (1) 14 – 14South Africa: Beverages 397 (20) 377 414 – 414Corporate 73 (11) 62 9 – 9
Group 2,041 (176) 1,865 2,375 (20) 2,355
Year ended 31 March: 2009 2009 2009US$m US$m US$m
Latin America 1,418 (19) 1,399Europe 1,239 (6) 1,233North America* 244 (24) 220Africa 415 – 415Asia 26 – 26South Africa: Beverages 883 – 883Corporate (12) – (12)
Group 4,213 (49) 4,164
*EBITDA excludes the results of associates and joint ventures and hence the decline in EBITDA for North America is due to the US and Puerto Rico operations of the Miller business being contributed into the MillerCoors joint venture during the six months ended 30 September 2008.
3. Exceptional itemsSix months Six months Year
ended ended ended30/9/09 30/9/08 31/3/09
Unaudited Unaudited AuditedUS$m US$m US$m
Exceptional items included in operating profitBusiness capability programme costs (170) – –Integration and restructuring costs (41) (23) (110)Impairments – – (392)Profit on disposal of businesses – 437 526Unwinding of fair value adjustments on inventory – (10) (9)Litigation – – (13)
Net exceptional (losses)/gains included within operating profit (211) 404 2
Exceptional items included in net finance costsBusiness capability programme costs (17) – –Gain on early termination of financial derivatives – – 20
Net exceptional (losses)/gains included within net finance costs (17) – 20
Share of associates’ and joint ventures’ exceptional itemsIntegration and restructuring costs (7) (17) (33)Unwinding of fair value adjustments on inventory (4) (7) (13)Impairment of intangible assets – – (38)Fair value losses on financial instruments – (9) (7)
Share of associates’ and joint ventures’ exceptional items (11) (33) (91)
Taxation credits relating to subsidiaries’ and the group’s share ofassociates’ and joint ventures’ exceptional items 31 19 56
Notes to the financial information continued

SABMiller plc Interim Report 2009 Notes to the financial information 21
3. Exceptional items continuedExceptional items included in operating profitBusiness capability programme costsFollowing the establishment of the business capability programme which will streamline finance, human resources and procurement activitiesthrough the deployment of global systems and, within regions, the introduction of common sales, distribution and supply chain managementsystems, costs of US$170 million have been incurred in the period (2008: US$nil).
Integration and restructuring costsIn Europe, a total of US$41 million has been charged in relation to the integration and restructuring of the Romanian business following theacquisition of Bere Azuga, including the closure of a brewery and in relation to the restructuring of the Polish business, including the closure of the Kielce brewery.
In 2008, a charge of US$23 million was incurred within operating profit during the period for staff retention and for certain integration costs of the US and Puerto Rico operations of the Miller business into the MillerCoors joint venture.
Profit on disposal of businessesIn 2008, a profit of US$437 million arose on the deemed disposal of the US and Puerto Rico operations of the Miller business into theMillerCoors joint venture.
Unwinding of fair value adjustments on inventoryIn 2008, on acquisition the Grolsch inventory was fair valued to market value. The uplift is charged to the income statement as the inventory is sold. US$10 million was charged to operating profit in the six months ended 30 September 2008.
Exceptional items included within net finance costsBusiness capability programme costsAs a result of the business capability programme and resultant changes in treasury systems used and their differing valuation methodologies, a charge of US$17 million has been incurred to reflect differences on the fair valuation of financial instruments (2008: US$nil).
Share of associates’ and joint ventures’ exceptional itemsIntegration and restructuring costsDuring 2009, the group’s share of MillerCoors’ integration and restructuring costs was US$7 million and primarily related to relocation.
In 2008, the group’s share of MillerCoors’ integration and restructuring costs was US$17 million mainly related to retrenchment costs.
Unwinding of fair value adjustments on inventoryIn 2009, the group’s share of MillerCoors’ charge to operating profit in the period relating to the unwind of the fair value adjustment to inventorywas US$4 million (2008: US$7 million).
Fair value losses on financial instrumentsIn 2008, the group’s share of losses relating to fair value mark to market adjustments on financial instruments at Hotels and Gaming amountedto US$9 million.
Taxation creditsTaxation credits of US$31 million (2008: US$19 million) were recorded in relation to exceptional items during the period and includedUS$4 million (2008: US$10 million) in relation to MillerCoors although the tax credit is recognised in Miller Brewing Company (see note 4).
4. TaxationSix months Six months Year
ended ended ended30/9/09 30/9/08 31/3/09
Unaudited Unaudited AuditedUS$m US$m US$m
Current taxation 425 453 670
– Charge for the period (UK corporation tax: US$nil (2008: US$nil)) 441 452 693– Adjustments in respect of prior years (16) 1 (23)
Withholding taxes and other remittance taxes 35 52 67
Total current taxation 460 505 737
Deferred taxation (24) (50) 64
– (Credit)/charge for the period (UK corporation tax: US$nil (2008: US$nil)) (24) (42) 81– Adjustments in respect of prior years – (8) (14)– Rate change – – (3)
Total taxation 436 455 801
Effective tax rate (%) 29.4 31.0 30.2
See the financial definitions section for the definition of the effective tax rate. The calculation is on a basis consistent with that used in prioryears and is also consistent with other group operating metrics.
MillerCoors is not a taxable entity. The tax balances and obligations therefore remain with Miller Brewing Company as a 100% subsidiary of the group. This subsidiary’s tax charge includes tax (including deferred tax) on the group’s share of the taxable profits of MillerCoors.

22 Notes to the financial information SABMiller plc Interim Report 2009
5. Earnings per shareSix months Six months Year
ended ended ended30/9/09 30/9/08 31/3/09
Unaudited Unaudited AuditedUS cents US cents US cents
Basic earnings per share 63.0 94.8 125.2Diluted earnings per share 62.6 94.3 124.6Headline earnings per share 64.6 65.8 119.0Adjusted basic earnings per share 80.0 75.2 137.5Adjusted diluted earnings per share 79.5 74.8 136.8
The weighted average number of shares was:
Six months Six months Yearended ended ended
30/9/09 30/9/08 31/3/09Unaudited Unaudited Audited
Millions Millions Millionsof shares of shares of shares
Ordinary shares 1,627 1,506 1,514Treasury shares (77) – (7)ESOP trust ordinary shares (5) (6) (5)
Basic shares 1,545 1,500 1,502Dilutive ordinary shares from share options 9 8 8
Diluted shares 1,554 1,508 1,510
The calculation of diluted earnings per share excludes 12,672,482 (2008: 13,281,197) share options that were non-dilutive for the periodbecause the exercise price of the option exceeded the fair value of the shares during the period and 6,569,614 (2008: 6,922,745) shareawards that were non-dilutive for the period because the performance conditions attached to the awards have not been met. These shareawards could potentially dilute earnings per share in the future.
Adjusted and headline earningsThe group presents an adjusted earnings per share figure to exclude the impact of amortisation of intangible assets (excluding capitalisedsoftware) and other non-recurring items in order to present a more useful comparison for the periods shown in the consolidated financialinformation. Adjusted earnings per share has been based on adjusted headline earnings for each financial period and on the same number ofweighted average shares in issue as the basic earnings per share calculation. Headline earnings per share has been calculated in accordancewith the South African Circular 8/2007 entitled ‘Headline Earnings’ which forms part of the listing requirements for the JSE Ltd (JSE). Theadjustments made to arrive at headline earnings and adjusted earnings are as follows:
Six months Six months Yearended ended ended
30/9/09 30/9/08 31/3/09Unaudited Unaudited Audited
US$m US$m US$m
Profit for the financial period attributable to equity holders of the parent 973 1,423 1,881Headline adjustmentsImpairment of goodwill – – 364Impairment of intangible assets – – 14Impairment of property, plant and equipment – – 16Loss on disposal of property, plant and equipment 28 – 10Profit on disposal of businesses – (437) (526)Tax effects of the above items (6) – (4)Minority interests’ share of the above items 3 – (1)Share of joint ventures’ and associates’ headline adjustments, net of tax and minority interests – 2 34
Headline earnings 998 988 1,788Other adjustmentsBusiness capability programme costs 187 – –Integration and restructuring costs 9 23 108Net (gain)/loss on fair value movements on capital items* (3) 26 27Gain on early termination of financial derivatives – – (20)Unwind of fair value adjustments on inventory – 10 9Litigation – – 13Amortisation of intangible assets (excluding capitalised software) 73 86 164Tax effects of the above items (59) (48) (110)Minority interests’ share of the above items (3) (2) (4)Share of joint ventures’ and associates’ other adjustments, net of tax and minority interests 34 45 90
Adjusted earnings 1,236 1,128 2,065
*This does not include all fair value movements but includes those in relation to capital items for which hedge accounting cannot be applied.
Notes to the financial information continued

SABMiller plc Interim Report 2009 Notes to the financial information 23
6. DividendsDividends paid were as follows:
Six months Six months Yearended ended ended
30/9/09 30/9/08 31/3/09Unaudited Unaudited Audited
US cents US cents US cents
Prior year final dividend paid per ordinary share 42.0 42.0 42.0Current year interim dividend paid per ordinary share – – 16.0
The interim dividend declared of 17.0 US cents per ordinary share is payable on 11 December 2009 to ordinary shareholders on the register as at 4 December 2009 and will absorb an estimated US$267 million of shareholders’ funds.
7. Goodwill and intangible assetsIntangible
Goodwill assetsUnaudited Unaudited
US$m US$m
Net book amount at 1 April 2009* 8,715 3,741Exchange adjustments 1,740 696Arising on increase in share of subsidiary undertakings 1,122 –Acquisitions through business combinations 31 8Additions – separately acquired – 10Amortisation – (92)Transfers from other assets – 6
Net book amount at 30 September 2009 11,608 4,369
*As restated (see note 12).
8. Property, plant and equipmentSix months Six months Year
ended ended ended30/9/09 30/9/08* 31/3/09*
Unaudited Unaudited UnauditedUS$m US$m US$m
Net book amount at beginning of period 7,404 9,113 9,113Exchange adjustments 1,257 (718) (1,885)Additions 701 1,122 2,074Acquisitions through business combinations 25 120 160Disposals (50) (22) (101)Contributed to joint ventures – (1,043) (1,043)Impairment – – (16)Depreciation (431) (459) (829)Other movements (23) (49) (69)
Net book amount at end of period 8,883 8,064 7,404
*As restated (see note 12).

24 Notes to the financial information SABMiller plc Interim Report 2009
9a. Reconciliation of profit for the period to net cash generated from operations Six months Six months Year
ended ended ended30/9/09 30/9/08 31/3/09
Unaudited Unaudited AuditedUS$m US$m US$m
Profit for the period 1,062 1,565 2,157Taxation 436 455 801Share of post-tax results of associates and joint ventures (550) (249) (516)Interest receivable and similar income (159) (270) (595)Interest payable and similar charges 425 654 1,301
Operating profit 1,214 2,155 3,148Depreciation:– Property, plant and equipment 318 345 626– Containers 113 114 203Container breakages, shrinkage and write-offs 17 12 13Loss on sale of property, plant and equipment 28 – 10Impairment of goodwill – – 364Impairment of intangible assets – – 14Impairment of property, plant and equipment – – 16Amortisation of intangible assets 92 108 204Unrealised net loss from fair value hedges 12 20 14Profit on disposal of businesses – (437) (526)Dividends received from other investments (1) (1) (1)Charge with respect to share options 37 39 79Other non-cash movements 35 – –
Net cash generated from operations before working capital movements (EBITDA) 1,865 2,355 4,164Net inflow/(outflow) in working capital 300 (338) (493)
Net cash generated from operations 2,165 2,017 3,671
Cash generated from operations before working capital movements includes cash flows relating to exceptional items of US$168 million in respect of business capability programme costs, and US$8 million in respect of integration and restructuring costs (2008: US$20 million in respect of integration and restructuring costs relating to MillerCoors).
9b. Reconciliation of net cash from operating activities to free cash flowSix months Six months Year
ended ended ended30/9/09 30/9/08 31/3/09
Unaudited Unaudited UnauditedUS$m US$m US$m
Net cash from operating activities 1,499 1,178 2,183Purchase of property, plant and equipment (728) (1,245) (2,073)Proceeds from sale of property, plant and equipment 20 22 75Purchase of intangible assets (11) (34) (74)Purchase of shares from minorities (3) (2) (5)Investments in joint ventures (142) (123) (397)Investments in associates (9) (5) (4)Repayment of investments by associates – – 3Dividends received from joint ventures 427 81 454Dividends received from associates 39 119 151Dividends received from other investments 1 1 1Dividends paid to minority interests (95) (118) (217)
Free cash flow 998 (126) 97
Notes to the financial information continued

SABMiller plc Interim Report 2009 Notes to the financial information 25
9c. Analysis of net debtNet debt is analysed as follows:
As at As at As at30/9/09 30/9/08 31/3/09*
Unaudited Unaudited UnauditedUS$m US$m US$m
Borrowings (9,738) (9,414) (9,308)Borrowings-related derivative financial instruments 207 83 487Overdrafts (265) (399) (300)Finance leases (13) (11) (10)
Gross debt (9,809) (9,741) (9,131)Cash and cash equivalents (excluding overdrafts) 464 350 422
Net debt (9,345) (9,391) (8,709)
Cash and cash equivalents on the balance sheet are reconciled to cash and cash equivalents on the cash flow as follows:
As at As at As at30/9/09 30/9/08 31/3/09*
Unaudited Unaudited UnauditedUS$m US$m US$m
Cash and cash equivalents (balance sheet) 464 350 422Overdrafts (265) (399) (300)
Cash and cash equivalents (cash flow) 199 (49) 122
The movement in net debt is analysed as follows:
Cashand cash
equivalents Derivative(excluding financial Finance Total grossoverdrafts) Overdrafts Borrowings instruments leases borrowings Net debt
US$m US$m US$m US$m US$m US$m US$m
At 1 April 2009* 422 (300) (9,308) 487 (10) (9,131) (8,709)Exchange adjustments 68 (12) (792) (8) (1) (813) (745)Cash flow (44) 47 234 – 1 282 238Acquisitions 18 – (9) – (1) (10) 8Other movements – – 137 (272) (2) (137) (137)
At 30 September 2009 464 (265) (9,738) 207 (13) (9,809) (9,345)
*As restated (see note 12).
The group has sufficient headroom to enable it to conform to covenants on its existing borrowings. The group has sufficient undrawn financingfacilities to service its operating activities and ongoing capital investment. The group has the following undrawn committed borrowing facilitiesavailable at 30 September 2009 in respect of which all conditions precedent have been met at that date:
As at As at As at30/9/09 30/9/08 31/3/09
Unaudited Unaudited AuditedUS$m US$m US$m
Amounts falling due:Within one year 973 1,056 716Between one and two years 398 11 72Between two and five years 1,769 736 1,272In five years or more 57 12 33
3,197 1,815 2,093
Subsequent to 30 September 2009, the US$1,000 million 364 day facility with the undrawn amount shown as falling due within one year in thetable above, was voluntarily cancelled in part, reducing the size of the facility to US$600 million. The facility was subsequently extended fromOctober 2009 to 6 October 2010 in the amount of US$515 million, with a one year term out option.
10. Commitments, contingencies and guaranteesExcept as stated below there have been no material changes to commitments, contingencies or guarantees as disclosed in the annual financialstatements for the year ended 31 March 2009.
CommitmentsContracts placed for future capital expenditure for property, plant and equipment not provided in the financial statements amount toUS$292 million at 30 September 2009.
As part of the business capability programme the group has entered into contracts for the provision of IT, communications and consultancyservices and in relation to which the group had commitments of US$210 million at 30 September 2009.

26 Notes to the financial information SABMiller plc Interim Report 2009
11. Business combinationsAcquisitionsThe following business combinations took effect during the period:
In April 2009 control was assumed over Bere Azuga in Romania and the group had a 94.85% interest as at 30 September 2009.
In July 2009 the group acquired an effective 40% interest in Ambo Mineral Water Share Company in Ethiopia.
In September 2009 the group acquired Maheu, a non-alcoholic maize drinks business in Zambia.
The following table represents the assets and liabilities acquired in respect of all business combinations entered into during the six monthsended 30 September 2009:
Carrying values Provisionalpre-acquisition fair value
US$m US$m
Intangible assets 4 8Property, plant and equipment 34 25Inventories 4 3Trade and other receivables 2 1Cash and cash equivalents 18 18Borrowings (10) (10)Trade and other payables (4) (5)
48 40Minority interests (14)
Net assets acquired 26Provisional goodwill 31
Consideration 57
Goodwill represents, amongst other things, tangible and intangible assets yet to be recognised separately from goodwill, potential synergiesand the value of the assembled workforce.
From the date of acquisition to 30 September 2009 the following amounts have been included in the group’s income statement for the period:
US$m
Income statementRevenue 2Operating loss (5)Loss before tax (2)
If the date of the acquisitions made in the six months ended 30 September 2009 had been 1 April 2009, then the group’s revenue, operatingprofit and profit before tax for the six months ended 30 September 2009 would have been as follows:
US$m
Income statementRevenue 8,855Operating profit 1,211Profit before tax 1,491
12. Balance sheet restatementsInitial accountingThe initial accounting under IFRS 3, ‘Business Combinations’, for the Grolsch, Sarmat and Vladpivo acquisitions had not been completed as at 30 September 2008. During the six months ended 31 March 2009, adjustments to provisional fair values in respect of these acquisitions,together with adjustments to provisional fair values in relation to the formation of the MillerCoors joint venture, were made. As a result comparativeinformation for the six months ended 30 September 2008 has been presented in this interim financial information as if the adjustments toprovisional fair values had been made from the respective transaction dates. The impact on the prior period income statement has beenreviewed and no material adjustments to the income statement are required as a result of the adjustments to provisional fair values. Thefollowing table reconciles the impact on the balance sheet reported as at 30 September 2008 to the comparative balance sheet presented in this interim financial information.
The initial accounting under IFRS 3, ‘Business Combinations’, for the Pabod and Voltic acquisitions had not been completed as at 31 March2009. During the six months ended 30 September 2009, adjustments to provisional fair values in respect of these acquisitions were made. As a result comparative information for the year ended 31 March 2009 has been presented in this interim financial information as if the adjustmentsto provisional fair values had been made from the respective transaction dates. The impact on the prior period income statement has beenreviewed and no material adjustments to the income statement are required as a result of the adjustments to provisional fair values. Thefollowing table reconciles the impact on the balance sheet reported as at 31 March 2009 to the comparative balance sheet presented in this interim financial information.
Notes to the financial information continued

SABMiller plc Interim Report 2009 Notes to the financial information 27
12. Balance sheet restatements continuedBalance sheet
Adjustments Adjustmentsto provisional At 30/9/08 to provisional At 31/3/09
At 30/9/08 fair values As restated At 31/3/09 fair values As restatedUnaudited Unaudited Unaudited Audited Unaudited Unaudited
US$m US$m US$m US$m US$m US$m
AssetsNon-current assetsGoodwill 10,030 37 10,067 8,734 (19) 8,715Intangible assets 4,197 20 4,217 3,729 12 3,741Property, plant and equipment 8,077 (13) 8,064 7,404 – 7,404Investments in joint ventures 5,133 679 5,812 5,495 – 5,495Other non-current assets 2,572 (169) 2,403 2,797 – 2,797
30,009 554 30,563 28,159 (7) 28,152
Current assetsInventories 1,300 (1) 1,299 1,242 (1) 1,241Trade and other receivables 1,759 (7) 1,752 1,576 – 1,576Other current assets 547 – 547 642 13 655
3,606 (8) 3,598 3,460 12 3,472
Total assets 33,615 546 34,161 31,619 5 31,624
LiabilitiesCurrent liabilitiesTrade and other payables (2,686) (8) (2,694) (2,396) (1) (2,397)Other current liabilities (2,431) (4) (2,435) (2,945) – (2,945)
(5,117) (12) (5,129) (5,341) (1) (5,342)
Non-current liabilitiesTrade and other payables (239) (4) (243) (186) – (186)Provisions (444) (8) (452) (373) – (373)Deferred tax liabilities (1,731) (520) (2,251) (2,029) – (2,029)Other non-current liabilities (8,557) – (8,557) (7,577) – (7,577)
(10,971) (532) (11,503) (10,165) – (10,165)
Total liabilities (16,088) (544) (16,632) (15,506) (1) (15,507)
Net assets 17,527 2 17,529 16,113 4 16,117
Total equity 17,527 2 17,529 16,113 4 16,117
13. Related party transactionsThere have been no material changes to the nature or relative quantum of related party transactions as described in the 2009 Annual Report.
The only changes to key management during the period were the appointments to the board of Dambisa Moyo on 1 June 2009 and of HowardWillard on 1 August 2009. Consequently, as at 30 September 2009 there were 25 key management (31 March 2009: 23).
14. Post balance sheet eventsSubsequent to 30 September 2009, the US$1,000 million 364 day facility was voluntarily cancelled in part, reducing the size of the facility toUS$600 million. The facility was subsequently extended from October 2009 to 6 October 2010 in the amount of US$515 million, with a oneyear term out option.
On 12 October 2009, SABSA Holdings Pty Ltd, a wholly owned subsidiary of the group, subscribed for US$65 million preference shares inTsogo Sun Gaming (Pty) Ltd, a wholly owned subsidiary of the group’s associate, Tsogo Sun Holdings Ltd (TSH), as the group’s share of thefunding for the 30% increase in the TSH group’s effective interest in Tsogo Sun KwaZulu-Natal (Pty) Ltd, the licensee and operator of theSuncoast Casino in Durban.

28 Financial definitions SABMiller plc Interim Report 2009
Adjusted earningsAdjusted earnings are calculated by adjusting headline earnings (as defined below) for the amortisation of intangible assets (excludingsoftware), integration and restructuring costs, the fair value movementsin relation to capital items for which hedge accounting cannot beapplied and other items which have been treated as exceptional butnot included above or as headline earnings adjustments together with the share of joint ventures’ and associates’ adjustments forsimilar items. The tax and minority interests in respect of these itemsare also adjusted.
Adjusted net finance costsThis comprises net finance costs excluding fair value movements in relation to capital items for which hedge accounting cannot beapplied and any exceptional finance charges or income.
Adjusted profit before taxThis comprises EBITA less adjusted net finance costs and less thegroup’s share of associates’ and joint ventures’ net finance costs on a similar basis.
Constant currencyConstant currency results have been determined by translating the local currency denominated results for the six months ended30 September at the exchange rates for the comparable period in the prior year.
EBITAThis comprises operating profit before exceptional items, amortisationof intangible assets (excluding software) and includes the group’s shareof associates’ and joint ventures’ operating profit on a similar basis.
EBITA margin (%)This is calculated by expressing EBITA as a percentage of group revenue.
EBITDAThis comprises the net cash generated from operations beforeworking capital movements.
EBITDA margin (%)This is calculated by expressing EBITDA excluding cash flows related to exceptional items incurred during the period as apercentage of revenue.
Effective tax rate (%)The effective tax rate is calculated by expressing tax before tax on exceptional items and on amortisation of intangible assets(excluding software), including the group’s share of associates’ and joint ventures’ tax on the same basis, as a percentage ofadjusted profit before tax.
Free cash flowThis comprises net cash from operating activities less cash paid forthe purchase of property, plant and equipment, intangible assets andshares from minorities, net investments in associates and jointventures and dividends paid to minority interests plus cash receivedfrom the sale of property, plant and equipment and intangible assetsand dividends received.
Group revenueThis comprises revenue together with the group’s share of revenuefrom associates and joint ventures.
Headline earningsHeadline earnings are calculated by adjusting profit for the financialperiod attributable to equity holders of the parent for items inaccordance with the South African Circular 8/2007 entitled ‘HeadlineEarnings’. Such items include impairments of non-current assets andprofits or losses on disposals of non-current assets and their relatedtax and minority interests. This also includes the group’s share ofassociates’ and joint ventures’ adjustments on the same basis.
Interest coverThis is the ratio of EBITDA plus dividends received from joint venturesto adjusted net finance costs.
Net debtThis comprises gross debt (including borrowings, borrowings-relatedderivative financial instruments, overdrafts and finance leases) net ofcash and cash equivalents (excluding overdrafts).
Organic informationOrganic results and volumes exclude the first 12 months’ results andvolumes relating to acquisitions and the last 12 months’ results andvolumes relating to disposals.
Sales volumesIn the determination and disclosure of sales volumes, the groupaggregates 100% of the volumes of all consolidated subsidiaries andits equity accounted percentage of all associates’ and joint ventures’volumes. Contract brewing volumes are excluded from volumesalthough revenue from contract brewing is included within grouprevenue. Volumes exclude intra-group sales volumes. This measure of volumes is used in the segmental analyses as it more closely aligns with the consolidated group revenue and EBITA disclosures.
Forward-looking statementsThis report does not constitute an offer to sell or issue or the solicitation of an offer to buy or acquire ordinary shares in the capital of SABMiller plc (the ‘company’)or any other securities of the company in any jurisdiction or an inducement to enter into investment activity.
This report includes ‘forward-looking statements’ with respect to certain of SABMiller plc’s plans, current goals and expectations relating to its future financialcondition, performance and results. These statements contain the words ‘anticipate’, ‘believe’, ‘intend’, ‘estimate’, ‘expect’ and words of similar meaning. Allstatements other than statements of historical facts included in this report, including, without limitation, those regarding the company’s financial position, businessstrategy, plans and objectives of management for future operations (including development plans and objectives relating to the company’s products and services)are forward-looking statements. Such forward-looking statements involve known and unknown risks, uncertainties and other important factors that could cause the actual results, performance or achievements of the company to be materially different from future results, performance or achievements expressed or implied by such forward-looking statements. Such forward-looking statements are based on numerous assumptions regarding the company’s present and future businessstrategies and the environment in which the company will operate in the future. These forward-looking statements speak only as at the date of this report. Thecompany expressly disclaims any obligation or undertaking to disseminate any updates or revisions to any forward-looking statements contained herein to reflectany change in the company’s expectations with regard thereto or any change in events, conditions or circumstances on which any such statement is based. The past business and financial performance of SABMiller plc is not to be relied on as an indication of its future performance.
Financial definitions

SABMiller plc Interim Report 2009 Administration 29
SABMiller plcIncorporated in England and Wales (Registration No. 3528416)
General Counsel and Group Company SecretaryJohn Davidson
Registered officeSABMiller HouseChurch Street WestWokingSurrey, EnglandGU21 6HSFacsimile +44 1483 264103Telephone +44 1483 264000
Head officeOne Stanhope GateLondon, EnglandW1K 1AFFacsimile +44 20 7659 0111Telephone +44 20 7659 0100
Internet addresshttp://www.sabmiller.com
Investor relationsTelephone +44 20 7659 0100Email: [email protected]
Sustainable developmentTelephone +44 1483 264139Email: [email protected]
Independent auditorsPricewaterhouseCoopers LLP1 Embankment PlaceLondon, EnglandWC2N 6RHFacsimile +44 20 7822 4652Telephone +44 20 7583 5000
Registrar (United Kingdom)Capita RegistrarsThe Registry34 Beckenham RoadBeckenhamKent, EnglandBR3 4TUFacsimile +44 20 8658 2342Telephone +44 20 8639 3399 (outside UK)Telephone 0871 664 0300 (from UK)(calls cost 10p per minute plus network extras, lines are open8.30am-5.30pm Mon-Fri)Email: [email protected]
Registrar (South Africa)Computershare Investor Services (Pty) Limited70 Marshall Street, JohannesburgPO Box 61051Marshalltown 2107South AfricaFacsimile +27 11 370 5487Telephone +27 11 370 5000
United States ADR DepositaryThe Bank of New York MellonShareholder ServicesPO Box 358516Pittsburgh PA 15252-8516United States of AmericaTelephone +1 888 269 2377Telephone +1 888 BNY ADRS (toll free within the USA)Telephone +1 201 680 6825 (outside USA)Email: [email protected]
This paper is made from 100% recycled pulp. It has been certifiedaccording to the rules of the Forest Stewardship Council (FSC) and itis produced at a mill that is certified to the ISO 14001 environmentalmanagement standards. The mill uses pulps that are elementalchlorine free (ECF). The inks used are all vegetable oil based.
Printed at Pureprint, ISO 14001, FSC certified and CarbonNeutral®
Designed by Likemind www.likemind.com
Cert no. SGS-COC-O620
Administration

www.sabmiller.com