sabmiller plc jse sab issuer code sosab isin … · sabmiller plc . incorporated in england and...
TRANSCRIPT
SABMiller plc Incorporated in England and Wales (Registration No. 3528416) JSE SAB ISSUER CODE SOSAB ISIN GB0004835483 Interim Announcement Release date: 12 November 2015 SABMiller delivers good underlying performance SABMiller plc reports its interim (unaudited) results for the six months to 30 September 2015. Highlights - Good underlying performance with group net producer revenue (NPR) growth of 4%, beverage volumes up 1% and group NPR per hectolitre (hl) up 4% - Growth accelerated in the second quarter, with group NPR growth of 6% and beverage volume growth of 2% - Group lager volumes for the half were in line with the prior year with subsidiary lager volume growth of 3% (second quarter growth of 5%) offset by the performance of our associates - Premium lager brands NPR growth of 7%(1), driven by strong performance in many of our key markets, supported by global lager brands NPR growth of 14%(2) with growth across all regions - Good performance across both Latin America and Africa resulted in soft drinks volumes up 4% - Our cost programme is on track to deliver more than US$430 million of annualised savings by the year end(2) - EBITA growth of 5% and EBITA margin(3) expansion of 20 basis points (bps). EBITA margin was adversely impacted by competitive pressure in Poland and the transactional impacts of currency depreciation - Adjusted constant currency EPS grew by 5% and by 7% excluding the impact of Tsogo Sun(4) - Reported group NPR, EBITA and adjusted EPS declined by 12%, 11% and 11%, respectively, primarily as a result of the depreciation of key operating currencies against the US dollar - Free cash flow of US$1,423 million despite adverse currency movements, with improved cash conversion - Interim dividend per share of 28.25 US cents, up 9% on prior year(5) - On 11 November 2015, the boards of SABMiller and Anheuser-Busch InBev (AB InBev) announced that they had reached agreement on the terms of a recommended acquisition of SABMiller by AB InBev, expected to complete in the second half of 2016 6 months 6 months Organic, 12 months to Sept to Sept constant to March 2015 2014 currency 2015 US$m US$m % change % change US$m Revenue(6) 9,990 11,366 (12) 5 22,130 Group net producer revenue(6) 12,686 14,002 (9) 4 26,288 EBITA(7) 2,920 3,277 (11) 5 6,367 Adjusted EPS (US cents) 110.2 123.6 (11) 5(8) 239.1 Profit before tax(9) 2,327 2,827 (18) 4,830 Basic EPS (US cents) 102.0 123.2 (17) 205.7 Interim dividend per share (US cents) 28.25 26.0 9 113.0 Free cash flow 1,423 1,485 (4) 3,233 Except where indicated, all growth rates in the Highlights are over the prior year comparative period and are expressed on an organic basis for volumes and on an organic, constant currency basis for group NPR, group NPR per hl, EBITA and EBITA margin movements. (1) On a subsidiary basis, excluding home market for global brands. Global brands include Miller Lite in both periods. (2) Refer to the Cost and efficiency programme section. (3) Expressed as a percentage of group NPR. (4) Excluding the prior year net earnings impact of the group's disposed investment in Tsogo Sun Holdings Limited. (5) In line with SABMiller's stated policy for the interim dividend to be 25% of the prior year's full year dividend. The interim dividend is in accordance with the terms of SABMiller and AB InBev's joint Rule 2.7 announcement on 11 November.
(6) Revenue excludes the group's share of associates' and joint ventures' revenue. Group net producer revenue (NPR) comprises group revenue, including the group's share of associates' and joint ventures' revenue, less excise and similar taxes, including the group's share of associates' and joint ventures' excise and similar taxes. (7) Note 2 provides a reconciliation of operating profit to EBITA which is defined as operating profit before exceptional items and amortisation of intangible assets (excluding computer software) and includes the group's share of associates' and joint ventures' operating profit, on a similar basis. EBITA is used throughout this interim announcement. (8) Constant currency percentage change, not adjusted for the impact of acquisitions and disposals. Adjusting for Tsogo Sun, 7% increase. (9) Profit before tax includes net exceptional charges of US$8 million (2014: credits of US$285 million). Exceptional items are explained in note 3. SABMiller plc CHIEF EXECUTIVE'S REVIEW Alan Clark, Chief Executive of SABMiller, said: "We had a good first half, stripping out the effects of adverse exchange rates, with strong growth in Africa and Latin America and better mix across all of our regions. On an organic, constant currency basis, group earnings and margins improved as a result of growing volumes and NPR per hectolitre, and continued cost savings. "In our African and Latin American markets, our affordability strategies are helping us to grow beer's share of total alcohol. At the other end of the price ladder, our volume growth in premium lagers included particularly strong growth of our global premium brands. Our reported results were again negatively impacted by the depreciation of major operating currencies against the US dollar." Net Organic, acquisitions constant Reported and Currency Organic Reported currency Reported Sept 2014 disposals translation growth Sept 2015 growth growth Group net producer revenue US$m US$m US$m US$m US$m % % Latin America 2,874 - (532) 222 2,564 8 (11) Africa 3,592 - (628) 336 3,300 9 (8) Asia Pacific 2,154 - (177) 88 2,065 4 (4) Europe 2,713 8 (483) (11) 2,227 - (18) North America 2,553 - - (23) 2,530 (1) (1) Retained operations 13,886 8 (1,820) 612 12,686 4 (9) South Africa: Hotels and Gaming 116 (116) - - - Total 14,002 (108) (1,820) 612 12,686 4 (9) Net acquisitions Reported and Organic Reported Organic Reported Sept 2014 disposals growth Sept 2015 growth growth Group volumes hl 000 hl 000 hl 000 hl 000 % % Lager 133,874 46 (434) 133,486 - - Soft drinks 35,533 1 1,540 37,074 4 4 Other alcoholic beverages 3,875 (1) 11 3,885 - - Total 173,282 46 1,117 174,445 1 1 Net Organic, acquisitions Reported constant Reported and Currency Organic Sept currency Reported Sept 2014 disposals translation growth 2015 growth growth EBITA US$m US$m US$m US$m US$m % % Latin America 1,036 - (216) 52 872 5 (16) Africa 818 - (149) 89 758 11 (7) Asia Pacific 450 - (59) 32 423 7 (6) Europe 502 2 (91) (9) 404 (2) (20) North America 515 - - (1) 514 - -
Corporate (77) - 18 8 (51) Retained operations 3,244 2 (497) 171 2,920 5 (10) South Africa: Hotels and Gaming 33 (33) - - - Total 3,277 (31) (497) 171 2,920 5 (11) EBITA margin (1)(%) 23.4 23.0 (1)Expressed as a percentage of group NPR. Continued depreciation of key operating currencies against the US dollar has had an adverse impact on our results on both a translational and transactional basis. The adverse translational foreign exchange impact on EBITA in the period was US$497 million, with a further adverse transactional impact on margins. Business review Regional highlights(1) (1) Except where indicated all growth rates in the Regional highlights are over the prior year comparative period and are expressed on an organic basis for volumes and on an organic, constant currency basis for group NPR, group NPR per hl, EBITA and EBITA margin movements. Latin America - Group NPR grew 8% driven by beverage volume growth of 6% together with selective price increases and favourable mix. - Lager volumes grew 5% with premium segment growth of 6%. Soft drinks volumes increased by 7%. - Growth accelerated in the second quarter, with group NPR growth of 9% and beverage volume growth of 7%, supported by lager volume growth of 6%. - Regional EBITA grew 5% although margin declined 80 bps, reflecting the transactional impacts of currency depreciation, the 18 day strike in Panama, and increased investment in our brands. Africa - Group NPR grew 9% reflecting beverage volume growth of 5%, positive category mix and selective restrained pricing. - Lager volumes grew by 6% and soft drinks volumes increased by 5%. - Growth accelerated in the second quarter with group NPR growth of 11%, beverage volume growth of 6%, and lager volume growth of 8%. - In South Africa, group NPR grew 7% (beverage volumes up 3%), supported by the fourth consecutive quarter of lager volume growth despite a weak economic environment and electricity shortages, supported by successful innovation and premium lager brand volume growth of 13%. - In the rest of Africa, our subsidiary businesses delivered lager volume growth of 16% and group NPR growth of 14% due to our continued focus on more affordable beers, mainstream price moderation, and improved sales execution, complemented by steady progress in premiumisation. - Beverage volume growth of our associate Castel was impacted by challenging macro-economic conditions in some of its key markets, particularly Angola. - Regional EBITA grew 11% despite transactional foreign exchange pressures, with margin expansion of 30 bps driven by strong cost management, efficiency gains in manufacturing and distribution, and positive leverage. Asia Pacific - Group NPR grew 4% as a result of group NPR per hl growth of 7%, underpinned by premiumisation which more than offset the beverage volume decline of 3%. - In Australia, group NPR grew 2% driven by group NPR per hl growth of 4% supported by positive brand mix reflecting continued momentum in the premium and contemporary segments, with our premium lager brands growing by 10%. Lager volumes were down 2%, although we gained share from our key competitor in a declining market, which was adversely impacted by the timing of Easter trading. Australia's volume trend improved in the second quarter, with lager volumes in line with the prior year while maintaining positive price realisation. - In China, group NPR grew 5% as an increase in one-way packaging volumes and the continuing premiumisation of the portfolio offset a 3% volume decline due to the tough macro-economic and
consumer spending environment. Our associate CR Snow has outperformed the market over the financial year to date. - Regional EBITA grew 7% with margin expansion of 60 bps reflecting positive mix and cost control. Europe - Group NPR was in line with the prior year with group NPR per hl growth in the majority of our markets. - Beverage volumes declined by 3%. - Lager volumes declined by 5% reflecting sustained competitive pricing pressure in Poland and underlying weakness in the key markets of our associate, Anadolu Efes. - Excluding Poland and Anadolu Efes, Europe showed encouraging performance with group NPR growth of 4% and beverage volume growth of 3% in a challenging operating environment. - Regional EBITA declined by 2% and EBITA margin contracted by 20 bps. Cost optimisation initiatives across the rest of the region mitigated an EBITA decline in Poland and the impact of the supply chain disruptions in the Czech Republic and Slovakia following a major IT deployment. - In June we acquired the UK modern craft brewer, Meantime Brewing Company Ltd, which continues to grow in both the on and the off-premise. North America - Group NPR was down 1% with group NPR per hl growth offsetting lower volumes. - MillerCoors continues to evolve its portfolio mix towards the above premium market segments and strengthened its performance in the premium light segment with Miller Lite gaining segment share for the last four consecutive quarters. - Regional EBITA was in line with the prior year, with EBITA margin up 10 bps reflecting continued cost savings and lower fuel and packaging material expenses. - An exceptional charge of US$23 million has been recognised, being the group's share of MillerCoors' restructuring costs relating to the closure of the brewery in Eden, North Carolina, which will be fully effective September 2016. Group financial highlights - EBITA growth of 5% and EBITA margin expansion of 20 bps. EBITA margin was adversely impacted by competitive pressure in Poland and the transactional impacts of currency depreciation, which was mitigated by a reduction in performance-related share incentive charges. - Adjusted EBITDA(1) of US$2,960 million was down US$340 million on the prior year due to an adverse translational currency impact of US$517 million. - Weighted average interest rate for the gross debt portfolio was 3.4%, down from 3.5%. - The effective tax rate for the half year was 26.5%, up from 26.0% in the prior year period. - The group's gearing ratio declining by 320 bps to 46.2% and net debt increasing marginally by US$75 million to US$10,540 million as at 30 September 2015. - Net debt to adjusted EBITDA ratio of 1.7x (1.6x for the year ended 31 March 2015). - Capex of US$582 million, focused on investment in production capacity and capability, most notably in our higher growth markets of Africa and Latin America. Outlook We expect that growth will continue to be principally driven by our developing markets and through our focus on premiumisation across all markets. We anticipate that we will continue to be impacted by the depreciation of key operating currencies against the US dollar in the current financial year, which has materially impacted our reported results. Raw material input costs are anticipated to increase by low single digits in constant currency terms with some markets continuing to be impacted by foreign exchange movements on imported raw materials. We expect to deliver more than US$430 million of annualised savings by 31 March 2016, against our original target of US$500 million per annum by 31 March 2018. Further savings of at least US$550 million are expected by 2020, bringing the aggregate annual run rate for the programme to at least US$1,050 million(2). (1) Adjusted EBITDA comprises operating profit before exceptional items, depreciation and amortisation (i.e. subsidiary EBITDA) together with the group's share of operating profit from the MillerCoors joint venture on a similar basis. EBITDA including the group's share of all associates and joint ventures on a similar basis is US$3,576 million (refer to note 2).
(2) Refer to the Cost and efficiency programme section. Enquiries: SABMiller plc Tel: +44 20 7659 0100 John Davidson General Counsel and Corporate Affairs Director Tel: +44 20 7659 0127 Gary Leibowitz Director, Investor Engagement Tel: +44 20 7659 0119 Christina Mills Director, Group Communications and Reputation Tel: +44 20 7659 0105 Richard Farnsworth Group Media Relations Tel: +44 77 3477 6317 A live audio webcast of a presentation by Chief Executive, Alan Clark, and Chief Financial Officer, Domenic De Lorenzo, to the investment community will begin at 9.30am (GMT) on 12 November 2015. To register for the webcast, download the slide presentation, view management video interviews and download photography and b-roll, visit our online Results Centre at www.sabmiller.com/resultscentre. To monitor Twitter bulletins throughout the day follow www.twitter.com/sabmiller or #sabmillerresults. Copies of the press release and detailed Interim Announcement are available from the Company Secretary at the Registered Office or from our website at www.sabmiller.com. Operational review Latin America Organic, Net constant acquisitions currency Reported Reported and Currency Organic Reported growth growth Financial summary Sept 2014 disposals translation growth Sept 2015 % % Group NPR (US$m) 2,874 - (532) 222 2,564 8 (11) EBITA (US$m) 1,036 - (216) 52 872 5 (16) EBITA margin (%) 36.0 34.0 Sales volumes (hl 000) Lager 20,818 - 1,049 21,867 5 5 Soft drinks 9,765 - 729 10,494 7 7 Total beverages 30,583 - 1,778 32,361 6 6 In Latin America, group NPR grew 8% on a constant currency basis (down 11% on a reported basis) driven by beverage volume growth of 6% together with selective price increases and favourable brand mix. Lager volumes grew 5% with premium segment growth of 6%. Lager volume growth has accelerated, based on our strategy to target a broader range of consumption occasions by expanding our brand and pack portfolios, including recent launches of low alcohol offerings. Our affordability initiatives in Central America in particular have outperformed expectations. Soft drinks volumes increased by 7% driven by the continuing growth of sparkling soft drinks and water in Central America, together with the success of our non-alcoholic malt brands in Colombia and Peru, reflecting the success of new bulk packs. Our strong top line growth has helped to offset some of the adverse impact of weaker currencies on our input costs and the increased investment behind our brands. The first half of the year was also adversely impacted by an excise-driven price increase as well as an 18 day strike in Panama. Notwithstanding these effects our EBITA grew by 5% on an organic, constant currency basis (down 16% on a reported basis). Reported EBITA margin declined by 200 bps and constant currency EBITA margin declined by 80 bps reflecting these headwinds, in particular the adverse transactional foreign exchange impact. In Colombia, group NPR grew by 10% on a constant currency basis with beverage volumes up 9%. Strong lager volume growth of 9% was underpinned by price restraint and the continued momentum of our above mainstream brands, Aguila Light and the recently launched alcohol-free Aguila Cero, together with our mainstream brand Poker. Volume growth also reflected a softer comparative in the first quarter given the trading restrictions in the prior year. The premium portfolio volumes grew by over 20%, with Miller Lite and our
local premium brand, Club Colombia, leading this strong performance. Soft drinks volume growth of 7% was driven by our non-alcoholic malt brand Pony Malta and the 1 litre PET bulk pack, introduced in the prior year. Marketing investment increased due to the sponsorship of the national football league. Currency headwinds and the impact of cycling non-core asset disposals in the prior year were only partially offset by continuing fixed cost efficiencies, with a consequent negative impact on margin. In Peru, group NPR grew by 8% on a constant currency basis, based on beverage volume growth of 4%, selective price increases and positive mix. Consumers continued to trade up from mainstream brands with strong growth in our above mainstream brand, Pilsen Callao, notwithstanding the price increase, and our local premium brand, Cusqueña. We increased our share of the beer market by 120 bps, supported by our continued expansion of direct store distribution. We also achieved rapid growth, albeit off a low base, in our global brands as we continue to expand our reach. Soft drinks volumes were up 15% with growth in our sparkling soft drink brand, Guarana, San Mateo water, and our non-alcoholic malt brand, Maltin Power. Financial performance also benefited from continuing fixed cost productivity and the sale of non-core assets. In Ecuador, group NPR grew by 3% cycling a strong comparative period. Group NPR growth was driven by positive brand mix as consumers continued to trade up to Pilsener Light. Beverage volume growth of 1% was constrained by a difficult trading environment and the macro-economic downturn. Fixed cost savings, marketing spend optimisation and distribution efficiencies translated into strong EBITA growth and margin expansion. In Panama, group NPR declined by 15% with a beverage volume decline of 13%. Lager volumes declined by 19% due to a combination of an excise-driven price increase in April, when excise was increased on beer but reduced on spirits, and an 18 day strike in July which adversely impacted both lager and soft drinks production and distribution. In Honduras, group NPR grew by 9% on a constant currency basis, with lager volume growth of 17% reflecting a price reduction to drive affordability. This initiative was implemented across all price segments and significantly reinvigorated the category, driving double digit growth of our mainstream brand, Salva Vida, and our local premium brand, Barena. This success was achieved despite continuing security concerns which have a negative impact on our distribution and on-premise consumers. Our soft drinks portfolio saw strong growth with volumes up 7%, mainly driven by sparkling soft drinks, combined with selective pricing. In El Salvador, group NPR grew by 11% for the half year, with beverage volumes increasing by 9%. Lager volume growth of 10% was driven by our route to market expansion and a continuing focus on our bulk pack affordability strategy. Our flagship mainstream brand, Pilsener, and above mainstream brand, Golden Light, both grew by 10% while our Miller range saw high double digit growth. Soft drinks volumes grew by 10% supported by increased direct distribution. Africa Organic, Net constant acquisitions currency Reported Reported and Currency Organic Reported growth growth Financial summary Sept 2014 disposals translation growth Sept 2015 % % Group NPR (including share of associates) (US$m) 3,592 - (628) 336 3,300 9 (8) EBITA (US$m) 818 - (149) 89 758 11 (7) EBITA margin (%) 22.8 23.0 Sales volumes (hl 000) Lager 22,693 12 1,319 24,024 6 6 Soft drinks 15,986 1 747 16,734 5 5 Other alcoholic beverages 3,827 (1) 16 3,842 - - Total beverages 42,506 12 2,082 44,600 5 5 Group NPR in Africa grew 9% on an organic, constant currency basis (down 8% on a reported basis) underpinned by beverage volume growth of 5% on an organic basis, positive category mix and selective
pricing. Lager volumes grew by 6% and soft drinks volumes increased by 5%. Growth accelerated in the second quarter with group NPR growth of 11% and beverage volume growth of 6% on an organic basis, with lager volume growth of 8% benefiting from the price moderation across most markets. We are seeing significant success in the execution of our strategies through our continued focus on more affordable beers, mainstream price moderation, steady progress in premiumisation, all complemented by improved sales execution. Strong growth in our affordable segment was driven by our cassava-based beer, Impala, in Mozambique and our sorghum-based beer, Eagle, in other countries, while our mainstream segment recorded significant gains driven by Castle Lager with double digit growth. In the premium segment, Castle Lite continued to perform well, particularly in South Africa and Zambia. Soft drinks volumes grew by 5% cycling a strong comparative period. Other alcoholic beverages were in line with the prior year, with growth in wines and spirits volumes offset by a decline in traditional beer volumes. Traditional beer volumes performed well across the majority of markets although a decline in Delta, our associate in Zimbabwe, led to an overall negative performance. We continue to grow our footprint in Nigeria and Ghana with increased capacity, and we expect new maltings plants in South Africa and Zambia to be commissioned by the end of the financial year. EBITA grew by 11% on an organic, constant currency basis but declined by 7% on a reported basis. Raw material input costs pressures as a result of currency depreciation have been partly offset by our continued drive for local sourcing and efficiency gains in both manufacturing and distribution with route to market initiatives being rolled out in some markets. EBITA margin improved by 20 bps on a reported basis, reflecting our focus on cost management. In South Africa, group NPR growth of 7% on an organic, constant currency basis reflected positive category mix, premiumisation and selective price increases on key lager brands and packs. Lager volumes grew 3%, with share gains across both the beer and total alcohol markets, supported by the growth of bulk packs. This is the fourth consecutive quarter of lager volume growth despite a weak economic environment and electricity shortages. While our mainstream brand segment was in line with the prior year, our premium lager brands continued to grow strongly with volumes increasing by 13%, led by Castle Lite and successful innovations. Soft drinks volume growth of 2%, cycling a strong comparative period, was achieved through a focus on affordability, streamlined in-trade execution and expansion by direct servicing of our outlets. Our associate, Distell, delivered strong volume growth of 13% benefiting from strong developing markets performance and a diverse portfolio that targets a broad range of consumption occasions. In Tanzania, group NPR growth of 5% on a constant currency basis was delivered through a 5% increase in beverage volumes following a strong recovery in lager volumes in the second quarter, with double digit growth as we cycled an excise-related price increase in the prior year, together with strong growth in traditional beer. Expanded market penetration, and a revised sales model with improved service and better coverage, supported beer market share gains. Group NPR in Mozambique grew by 20% on a constant currency basis underpinned by robust beverage volume growth of 19%, with lager volume growth of 25% despite cycling a strong comparative period, driven by holding key price points and increased outlet reach. Volume growth was achieved through strong growth of our more affordable, cassava-based Impala brand and our mainstream brand 2M, benefiting from strong brand equity, aided by the can pack renovation undertaken at the end of the prior financial year. In Nigeria, strong momentum was maintained with group NPR growth of 30% on a constant currency basis underpinned by a double digit beverage volume increase as additional brewing capacity was commissioned, with utilisation running ahead of schedule. Increased market penetration was driven through improved availability and expansion into new regions. Our mainstream lager brand, Hero, continued to increase volumes by double digits. The malt beverage category also remained strong, with double digit volume growth. Despite severe economic headwinds, Zambia grew strongly, with group NPR up 9% on a constant currency basis reflecting beverage volume growth of 5% supported by positive category mix. Lager volumes increased 21% benefiting from price reductions at the beginning of the financial year in anticipation of an excise decrease which was subsequently announced in September and is expected to be effective in January 2016. Soft drinks volumes declined by 11% following pricing taken earlier in the year, while traditional beer volumes
grew 5% as a result of enhanced route to market execution and additional capacity. In Uganda, group NPR grew by 20% on a constant currency basis underpinned by beverage volume growth of 22% as a result of the continued growth of our more affordable, sorghum-based Eagle brand, and benefiting from the utilisation of additional capacity at the Mbarara brewery. In Botswana, group NPR increased by 4% on a constant currency basis, while beverage volumes declined by 1% as lager volume growth of 14% was offset by a decline in traditional beer volumes. Continued economic weakness in Zimbabwe led to our associate's group NPR declining 6% and beverage volumes declining by 11%. Our associate Castel delivered double digit group NPR growth on a constant currency basis, although beverage volume growth was constrained by challenging macro-economic conditions in some of its key markets, particularly Angola. Asia Pacific Organic, Net constant acquisitions currency Reported Reported and Currency Organic Reported growth growth Financial summary Sept 2014 disposals translation growth Sept 2015 % % Group NPR (including share of associates) (US$m) 2,154 - (177) 88 2,065 4 (4) EBITA(1)(US$m) 450 - (59) 32 423 7 (6) EBITA margin (%) 20.9 20.5 Sales volumes (hl 000) Lager 43,391 - (1,107) 42,284 (3) (3) Other beverages 48 - (5) 43 (11) (11) Total beverages 43,439 - (1,112) 42,327 (3) (3) (1)In 2015 before exceptional credits of US$29 million (2014: charges of US$64 million), being integration and restructuring costs. In Asia Pacific, group NPR grew by 4% on a constant currency basis with a beverage volume decline of 3% offset by group NPR per hl growth of 7% on the same basis, supported by continued premiumisation in Australia and China. Reported group NPR declined by 4% and reported EBITA declined by 6%, with EBITA margin declining by 40 bps reflecting the depreciation of currencies against the US dollar. On a constant currency basis, EBITA grew by 7% driven by Australia and China, with a 60 bps improvement in EBITA margin. In Australia, group NPR grew by 2% on a constant currency basis with group NPR per hl growth of 4% offsetting a beverage volume decline of 3%. Lager volumes declined by 2% in the half year, although we gained share from our key competitor in a declining market, which was adversely impacted by the timing of Easter trading and continuing negative consumer sentiment. The volume trend improved in the second quarter, with lager volumes in line with the prior year while also maintaining positive price realisation. Group NPR per hl growth was supported by positive brand mix driven by our focus on category expansion and portfolio innovation. Continued momentum in the premium and contemporary segments was led by sustained double digit growth from Great Northern, Peroni, and our craft brands, in particular the Yak brand family. Our mainstream brands, Victoria Bitter and Carlton Draught, declined. Effective cost control resulted in EBITA growth and margin expansion on an organic, constant currency basis. The integration programme was completed at the end of the last financial year and we continue to leverage the scale of the group in order to reduce costs and provide a platform for future growth. In China, group NPR grew by 5% on a constant currency basis, as group NPR per hl growth of 8% offset a 3% beverage volume decline. The volume decline reflects a disappointing summer peak season in most core
provinces due to the tough macro-economic and consumer spending environment. Our associate CR Snow has outperformed the market over the financial year to date. Constant currency group NPR per hl growth was driven by an increase in one-way packaging volumes and the continuing premiumisation of the portfolio. CR Snow's premium portfolio continues to grow by double digits assisted by national consumer campaigns which leverage the equity of Snow Draft and Snow Brave the World through clear and consistent positioning and pricing. Snow Brave the World has grown to over 20% of CR Snow's total volume since its launch in 2008, and over 25% of its NPR. EBITA grew reflecting continuing cost control in the face of the industry downturn. In India, group NPR on a constant currency basis grew by 6% underpinned by NPR per hl growth of 7% with volumes down by 1%. NPR per hl growth was driven by price increases in several key states as well strong growth in our premium portfolio. On a constant currency basis, EBITA was significantly higher than the prior year and EBITA margin improved driven by pricing and cost management. Europe Organic, Net constant acquisitions currency Reported Reported and Currency Organic Reported growth growth Financial summary Sept 2014 disposals translation growth Sept 2015 % % Group NPR (including share of associates) (US$m) 2,713 8 (483) (11) 2,227 - (18) EBITA (US$m) 502 2 (91) (9) 404 (2) (20) EBITA margin (%) 18.5 18.1 Sales volumes (hl 000) Lager 25,863 34 (1,171) 24,726 (5) (4) Soft drinks 9,761 - 63 9,824 1 1 Total beverages 35,624 34 (1,108) 34,550 (3) (3) In Europe, group NPR was in line with the prior year on an organic, constant currency basis (but was down 18% on a reported basis). Group NPR per hl growth of 3% on the same basis reflected improvements in the majority of our markets, while beverage volumes declined by 3% and lager volumes declined by 5%, both on an organic basis driven by sustained competitive pricing pressure in Poland and underlying weakness in the key markets of our associate, Anadolu Efes. Following a first quarter that was adversely impacted by the timing of Easter and a major IT deployment in the Czech Republic and Slovakia, trends improved in the second quarter, with lager volumes down just 1% on an organic basis. Excluding Poland and Anadolu Efes, Europe showed encouraging momentum with group NPR growth of 4% on an organic, constant currency basis and beverage volume growth of 3% on an organic basis in what remains a challenging operating environment. Reported EBITA declined by 20%, with EBITA margin down 40 bps. On an organic, constant currency basis, EBITA was down 2% and EBITA margin declined by 20 bps. Notwithstanding the significant decline in trading performance in Poland and supply chain disruptions in the Czech Republic and Slovakia, cost optimisation initiatives across the rest of the region mitigated the EBITA decline. In the Czech Republic and Slovakia, group NPR increased by 2% on a constant currency basis largely as a result of group NPR per hl growth of 3% on the same basis, due to positive brand mix reflecting growth across our premium portfolio. Beverage volumes were down 1%, rebounding strongly to grow by 6% in the second quarter, assisted by hot weather conditions over the peak summer months that helped offset the challenging first quarter. Our premium segment volumes grew by 6%, boosted by the continued growth of Kozel 11, Pilsner Urquell, and Birell, our non-alcoholic lager which penetrates soft drinks occasions, while our core mainstream brand Gambrinus 10 continued to decline. EBITA margin contracted as the strong topline growth was offset by adverse channel mix and additional operating costs associated with the major IT deployment. In Poland, group NPR declined by 14% on a constant currency basis, with volumes down 12% reflecting the adverse price positioning of competitor brands relative to our own. During the second quarter a number of
sales, brand portfolio, and operational initiatives were launched to restore the competitiveness of the business, and sequential improvements in market share were achieved in August and September. As a result of the competitive pricing environment and lower volumes, EBITA margin decreased significantly. In the United Kingdom, group NPR was in line with the prior year on an organic, constant currency basis with group NPR per hl growth of 2% on the same basis offsetting a volume decline. Continued growth of Peroni Nastro Azzurro through increased rate of sale and distribution in key outlets was offset by a volume decline in the Polish brand portfolio as well as a decrease in Miller Genuine Draft as a result of our profitable revenue growth management strategy. In June, we acquired the modern craft brewer Meantime Brewing Company Ltd which continues to grow in both the on and the off-premise. The remainder of our European subsidiaries increased group NPR by 6% with strong EBITA performance, both on a constant currency basis, in all markets particularly Romania and Italy where we benefited from cycling poor weather in the prior year. In Romania, group NPR grew by 5% as a result of our enhanced revenue management capabilities with strong growth of our local premium brand Ursus, and our global brands Peroni Nastro Azzurro and Pilsner Urquell. In Italy, group NPR increased 6% with growth in both our premium and mainstream lager segments, supported by firmer pricing. Our associate Anadolu Efes continues to be affected by the beer market decline in Russia, geopolitical uncertainty in Ukraine, and the economic slowdown in Turkey, which have adversely impacted both the soft drinks and beer businesses. North America Organic, Net constant acquisitions currency Reported Reported and Currency Organic Reported growth growth Financial summary Sept 2014 disposals translation growth Sept 2015 % % Group NPR (including share of joint ventures) (US$m) 2,553 - - (23) 2,530 (1) (1) EBITA(1)(US$m) 515 - - (1) 514 - - EBITA margin (%) 20.2 20.3 Sales volumes (hl 000) Lager – excluding contract brewing 21,109 - (524) 20,585 (2) (2) Soft drinks 21 - 1 22 3 3 Total beverages 21,130 - (523) 20,607 (2) (2) MillerCoors' volumes Lager – excluding contract brewing 20,425 - (624) 19,801 (3) (3) Sales to retailers (STRs) 20,306 n/a n/a 19,728 n/a (3) (1) In 2015: before exceptional restructuring costs of US$23 million. The North America segment includes our 58% share of MillerCoors and 100% of Miller Brewing International and our North American holding companies. Total North America reported EBITA was level with the prior year, with growth in MillerCoors offset by increased investment in the international operations in Brazil and Canada as we expand our businesses in these markets. MillerCoors MillerCoors' group NPR declined by 2% compared with the prior half year. Growth in group NPR per hl of 1%, driven by net pricing and positive sales mix, was offset by lower volumes, as domestic sales to wholesalers (STWs) were down by 3.0%. Domestic sales to retailers (STRs) were down 2.8%. EBITA growth of 2% was assisted by cost saving initiatives, which more than offset lower volumes and cost inflation. Despite strong performance within the segment, premium light STRs declined by low single digits in the half
year, with similar declines in both Miller Lite and Coors Light. However, Miller Lite grew marginally in the second quarter and has gained segment share for the last four consecutive quarters, reflecting the renewed strength of the brand. Coors Light also demonstrated a strong performance within the segment, introducing a new packaging design and a new marketing campaign, emphasising the brand's 'Born in the Rockies' positioning. Above premium STRs were in line with the prior half year primarily due to the double digit decline in Miller Fortune, as the brand has been deprioritised. This was offset by double digit growth in the Redd's franchise, now in its third year of growth despite cycling the successful launch of the Redd's Wicked series, mid single digit growth in the Leinenkugel's portfolio, driven by its Grapefruit and Harvest Patch shandy variants, and a low single digit increase in the Blue Moon franchise. The MillerCoors' STR decline was largely due to the below premium portfolio, down mid single digits, including a double digit decline in Milwaukee's Best, a high single digit decline in Keystone, and a mid single digit decline in Miller High Life. Continued cost savings and lower fuel and packaging material expenses resulted in a low single digit decline in cost of goods sold per hl. Both marketing investment and general and administrative costs increased marginally compared with the prior half year. In September 2015, MillerCoors announced plans to close the brewery in Eden, North Carolina with an effective closure date of September 2016. Certain charges associated with the closure were incurred in the half year and further charges will be recognised over the next four quarters. These are being treated as exceptional. Financial review New accounting standards The accounting policies followed are the same as those published within the Annual Report and Accounts for the year ended 31 March 2015 except for the new interpretations and amendments adopted by the group since 1 April 2015 as detailed in note 1 to the condensed consolidated financial information. The Annual Report and Accounts for the year ended 31 March 2015 are available on the company's website: www.sabmiller.com. Segmental analysis The group's operating results on a segmental basis are set out in the segmental analysis of operations. SABMiller uses group NPR and EBITA (as defined in the financial definitions section) to evaluate performance and believes these measures provide stakeholders with additional information on trends and allow for greater comparability between segments. Segmental performance is reported after the specific apportionment of attributable head office costs. Disclosure of volumes In the determination and disclosure of sales volumes, the group aggregates 100% of the volumes of all consolidated subsidiaries and its equity accounted percentage of all associates' and joint ventures' volumes. Contract brewing volumes are excluded from volumes, although revenue from contract brewing is included within group revenue and group NPR. Volumes exclude intra-group sales volumes. This measure of volumes is used in the segmental analyses as it closely aligns with the consolidated group NPR and EBITA disclosures. Organic, constant currency comparisons The group discloses certain results on an organic, constant currency basis, to show the effects on the group's results of acquisitions net of disposals and changes in exchange rates. See the financial definitions section for the definition. Acquisitions In June 2015, the group acquired 100% of Meantime Brewing Company Ltd, a UK modern craft brewer. Exceptional items Items that are material either by size or nature are classified as exceptional items. Further details on the treatment of these items can be found in note 3 to the financial information.
A net exceptional charge of US$8 million before finance costs and tax was reported for the period (2014: net credit of US$285 million). The net exceptional charge included: - US$14 million (2014: US$39 million) charge related to cost and efficiency programme costs in Corporate; - US$29 million credit (2014: US$64 million charge) related to integration and restructuring in Asia Pacific following the Foster's and Pacific Beverages acquisitions; and - US$23 million (2014: US$nil million) charge being the group's share of MillerCoors' restructuring costs, including accelerated depreciation and severance costs, relating to the closure of the Eden brewery. In addition to the items noted above, the net exceptional credit in 2014 included a US$388 million gain, after associated costs, on the disposal of the group's investment in Tsogo Sun. Finance costs Net finance costs, and adjusted finance costs, were US$238 million, a 28% decrease on the prior period's US$331 million, mainly as a result of debt repayments in the prior year. Interest cover, as defined in the financial definitions section, has increased to 12.4 times from 9.9 times in the prior period. Profit before tax Adjusted profit before tax of US$2,627 million decreased by 11% over the comparable period in the prior year, primarily as a result of the translational effect of currency depreciation, notwithstanding the pricing and premiumisation initiatives driving group NPR growth, together with cost savings, operational efficiencies and lower finance costs. Profit before tax was US$2,327 million, down by 18%, including the impact of the exceptional items noted above. The principal differences between reported and adjusted profit before tax relate to exceptional items, the amortisation of intangible assets (excluding computer software) and the group's share of associates' and joint ventures' tax and non-controlling interests. Net exceptional charges were US$8 million (2014: net credits of US$285 million) as detailed above, amortisation amounted to US$179 million in the half year (2014: US$226 million); and the group's share of associates' and joint ventures' tax and non-controlling interests was US$113 million (2014: US$167 million). Taxation The effective rate of tax for the half year before amortisation of intangible assets (excluding computer software) and exceptional items was 26.5% compared with a rate of 26.0% in the prior year period. The higher rate is primarily due to tax reforms in Latin America, the relative level of tax audit settlements and the deferred tax impact of legislative changes. Earnings per share The group presents adjusted basic earnings per share, which excludes the impact of amortisation of intangible assets (excluding computer software) and post-tax exceptional items, in order to present an additional measure of performance for the periods shown in the consolidated interim financial information. Adjusted basic earnings per share of 110.2 US cents were down 11% on the comparable period in the prior year, primarily as a result of the translational impact of the depreciation of key operating currencies against the US dollar. On a constant currency basis, adjusted earnings per share were up 5% as a result of increased EBITA and lower finance costs. An analysis of earnings per share is shown in note 5. On a statutory basis, basic earnings per share were 17% lower at 102.0 US cents (2014: 123.2 US cents) primarily due to the translational effects of foreign currency depreciation against the US dollar, together with the year on year change in the value of exceptional items, as explained above. Cash flow and capital expenditure The group uses an adjusted EBITDA measure which provides a useful indication of the cash generated to service the group's debt. Adjusted EBITDA comprises operating profit before exceptional items, depreciation and amortisation (i.e. subsidiary EBITDA) together with the group's share of operating profit from the MillerCoors joint venture on a similar basis. Given the significance of the MillerCoors business and the access to its cash generation, the inclusion of MillerCoors' EBITDA provides a useful measure of the group's overall
cash generation. Adjusted EBITDA of US$2,960 million decreased by 10% compared with the same period in the prior year (2014: US$3,300 million). Net cash generated from operations before working capital movements of US$2,436 million decreased by 11% compared with the prior year period (2014: US$2,733 million), in line with the decline in reported EBITA, mainly as a result of adverse currency movements against the US dollar. Net cash generated from operating activities of US$1,399 million decreased by US$146 million on the same period in the prior year, primarily reflecting the decline in EBITA partly offset by lower net interest payments following the repayment of debt in the prior year, together with working capital improvements. Capital expenditure on property, plant and equipment for the six months of US$518 million decreased compared with the same period in the prior year (2014: US$643 million), with continued investment in production capacity and capability, principally in Latin America and Africa. Capital expenditure including the purchase of intangible assets was US$582 million (2014: US$696 million), including spend on the group's digital capability, networks and communications. Free cash flow decreased by 4% to US$1,423 million, reflecting the translational effects of foreign currency depreciation against the US dollar, in part offset by lower net interest paid, improvements in working capital flows, and higher dividends received. Free cash flow is detailed in note 10b, and defined in the financial definitions section. Borrowings and net debt Gross debt at 30 September 2015, comprising borrowings together with the fair value of financing derivative financial assets and liabilities, decreased to US$11,169 million from US$11,430 million at 31 March 2015, primarily as a result of the repayment of maturing commercial paper borrowings from available cash. Net debt, comprising gross debt net of cash and cash equivalents, increased marginally to US$10,540 million from US$10,465 million at 31 March 2015, following the payment in August 2015 of the final dividend for the year ended 31 March 2015, materially offset by strong operating cash flow. An analysis of net debt is provided in note 10c. The group's gearing (presented as a ratio of net debt/equity) has increased to 46.2% from 43.0% at 31 March 2015. The weighted average interest rate for the gross debt portfolio at 30 September 2015 was 3.4% (31 March 2015: 3.5%). The group's credit rating from Moody's Investors Service was lifted from Baa1 with a positive outlook to A3 with a stable outlook in June 2015. In October 2015, the rating was placed on review with direction uncertain by Moody's Investors Service following the joint announcement that AB InBev and SABMiller had reached an agreement in principle on AB InBev's intention to make an offer to acquire SABMiller. Total equity Total equity decreased from US$24,355 million at 31 March 2015 to US$22,812 million at 30 September 2015, primarily as a result of currency translation movements on foreign currency investments and the payment of the final dividend for the year ended 31 March 2015, partially offset by the profit for the period. Goodwill and intangible assets Goodwill decreased to US$13,721 million (31 March 2015: US$14,746 million) as a result of foreign currency movements in the period, partly offset by goodwill arising on the Meantime acquisition. Intangible assets decreased in the period to US$6,366 million (31 March 2015: US$6,878 million) primarily due to foreign exchange rate movements and amortisation, partly offset by intangibles recognised in relation to the acquisition of Meantime Brewing Company Ltd. Currencies The exchange rates to the US dollar used in preparing the consolidated interim financial information are detailed in the table below, with other major currencies in which the group operates weakening against the US dollar during the period.
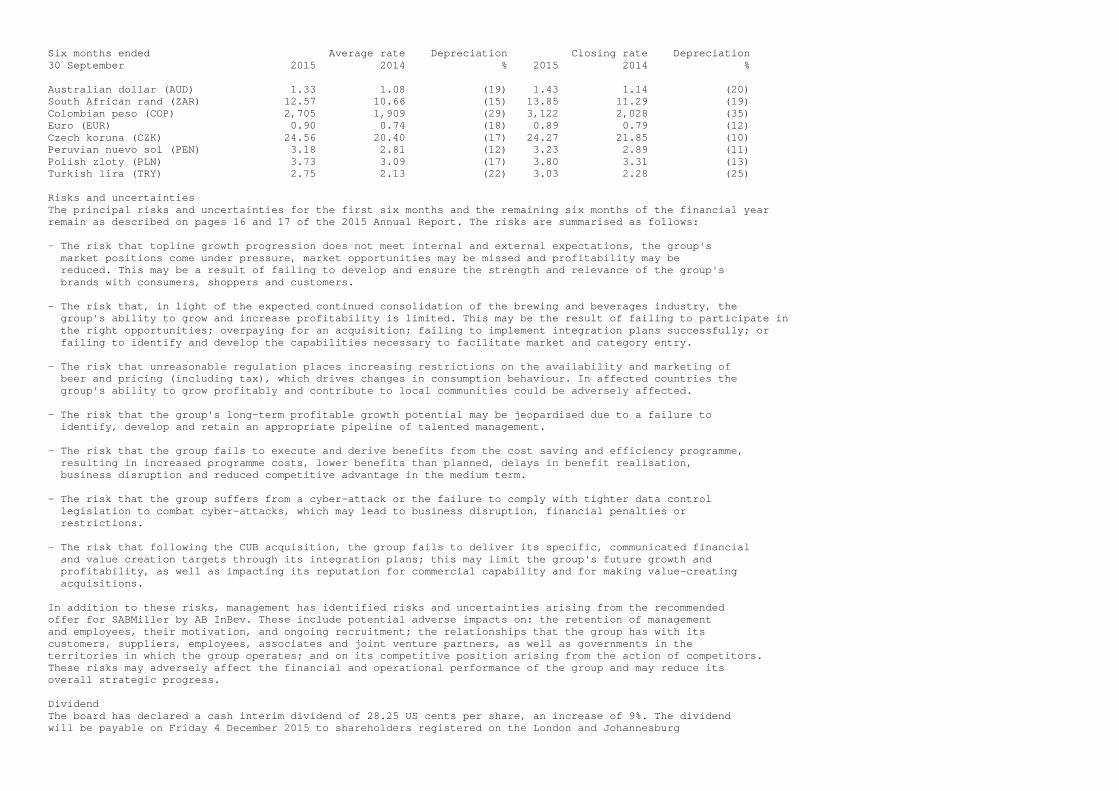
Six months ended Average rate Depreciation Closing rate Depreciation 30 September 2015 2014 % 2015 2014 % Australian dollar (AUD) 1.33 1.08 (19) 1.43 1.14 (20) South African rand (ZAR) 12.57 10.66 (15) 13.85 11.29 (19) Colombian peso (COP) 2,705 1,909 (29) 3,122 2,028 (35) Euro (EUR) 0.90 0.74 (18) 0.89 0.79 (12) Czech koruna (CZK) 24.56 20.40 (17) 24.27 21.85 (10) Peruvian nuevo sol (PEN) 3.18 2.81 (12) 3.23 2.89 (11) Polish zloty (PLN) 3.73 3.09 (17) 3.80 3.31 (13) Turkish lira (TRY) 2.75 2.13 (22) 3.03 2.28 (25) Risks and uncertainties The principal risks and uncertainties for the first six months and the remaining six months of the financial year remain as described on pages 16 and 17 of the 2015 Annual Report. The risks are summarised as follows: - The risk that topline growth progression does not meet internal and external expectations, the group's market positions come under pressure, market opportunities may be missed and profitability may be reduced. This may be a result of failing to develop and ensure the strength and relevance of the group's brands with consumers, shoppers and customers. - The risk that, in light of the expected continued consolidation of the brewing and beverages industry, the group's ability to grow and increase profitability is limited. This may be the result of failing to participate in the right opportunities; overpaying for an acquisition; failing to implement integration plans successfully; or failing to identify and develop the capabilities necessary to facilitate market and category entry. - The risk that unreasonable regulation places increasing restrictions on the availability and marketing of beer and pricing (including tax), which drives changes in consumption behaviour. In affected countries the group's ability to grow profitably and contribute to local communities could be adversely affected. - The risk that the group's long-term profitable growth potential may be jeopardised due to a failure to identify, develop and retain an appropriate pipeline of talented management. - The risk that the group fails to execute and derive benefits from the cost saving and efficiency programme, resulting in increased programme costs, lower benefits than planned, delays in benefit realisation, business disruption and reduced competitive advantage in the medium term. - The risk that the group suffers from a cyber-attack or the failure to comply with tighter data control legislation to combat cyber-attacks, which may lead to business disruption, financial penalties or restrictions. - The risk that following the CUB acquisition, the group fails to deliver its specific, communicated financial and value creation targets through its integration plans; this may limit the group's future growth and profitability, as well as impacting its reputation for commercial capability and for making value-creating acquisitions. In addition to these risks, management has identified risks and uncertainties arising from the recommended offer for SABMiller by AB InBev. These include potential adverse impacts on: the retention of management and employees, their motivation, and ongoing recruitment; the relationships that the group has with its customers, suppliers, employees, associates and joint venture partners, as well as governments in the territories in which the group operates; and on its competitive position arising from the action of competitors. These risks may adversely affect the financial and operational performance of the group and may reduce its overall strategic progress. Dividend The board has declared a cash interim dividend of 28.25 US cents per share, an increase of 9%. The dividend will be payable on Friday 4 December 2015 to shareholders registered on the London and Johannesburg
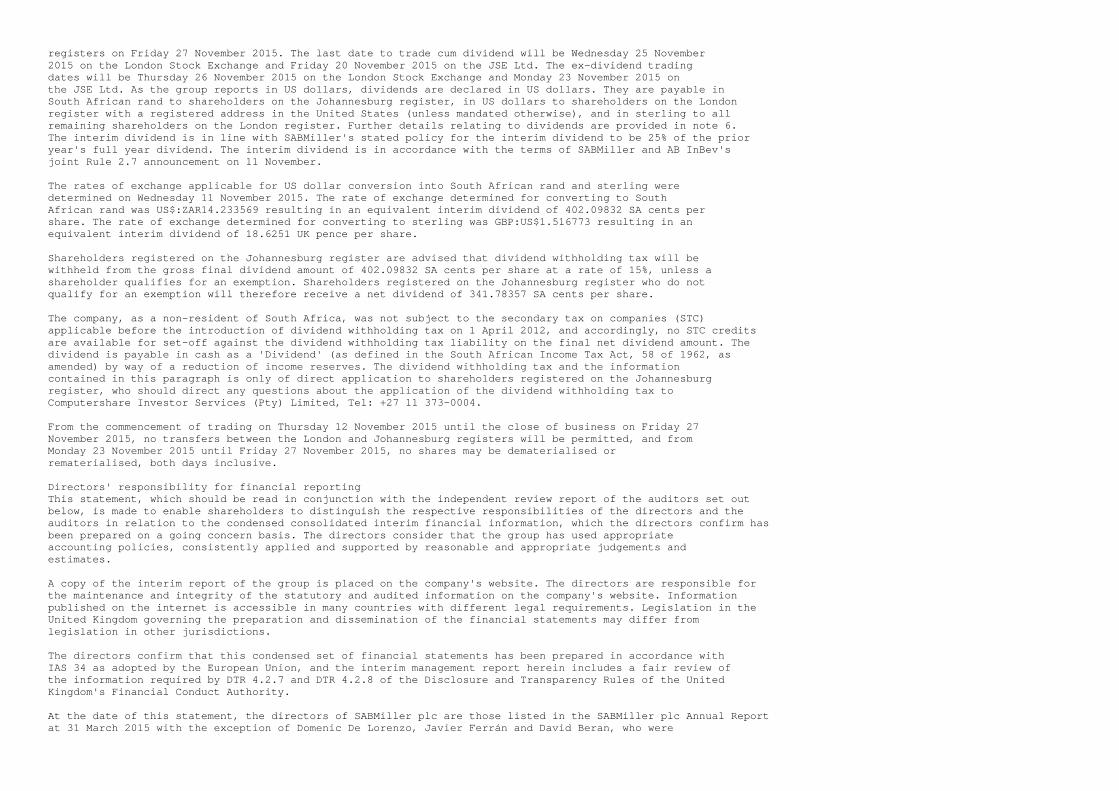
registers on Friday 27 November 2015. The last date to trade cum dividend will be Wednesday 25 November 2015 on the London Stock Exchange and Friday 20 November 2015 on the JSE Ltd. The ex-dividend trading dates will be Thursday 26 November 2015 on the London Stock Exchange and Monday 23 November 2015 on the JSE Ltd. As the group reports in US dollars, dividends are declared in US dollars. They are payable in South African rand to shareholders on the Johannesburg register, in US dollars to shareholders on the London register with a registered address in the United States (unless mandated otherwise), and in sterling to all remaining shareholders on the London register. Further details relating to dividends are provided in note 6. The interim dividend is in line with SABMiller's stated policy for the interim dividend to be 25% of the prior year's full year dividend. The interim dividend is in accordance with the terms of SABMiller and AB InBev's joint Rule 2.7 announcement on 11 November. The rates of exchange applicable for US dollar conversion into South African rand and sterling were determined on Wednesday 11 November 2015. The rate of exchange determined for converting to South African rand was US$:ZAR14.233569 resulting in an equivalent interim dividend of 402.09832 SA cents per share. The rate of exchange determined for converting to sterling was GBP:US$1.516773 resulting in an equivalent interim dividend of 18.6251 UK pence per share. Shareholders registered on the Johannesburg register are advised that dividend withholding tax will be withheld from the gross final dividend amount of 402.09832 SA cents per share at a rate of 15%, unless a shareholder qualifies for an exemption. Shareholders registered on the Johannesburg register who do not qualify for an exemption will therefore receive a net dividend of 341.78357 SA cents per share. The company, as a non-resident of South Africa, was not subject to the secondary tax on companies (STC) applicable before the introduction of dividend withholding tax on 1 April 2012, and accordingly, no STC credits are available for set-off against the dividend withholding tax liability on the final net dividend amount. The dividend is payable in cash as a 'Dividend' (as defined in the South African Income Tax Act, 58 of 1962, as amended) by way of a reduction of income reserves. The dividend withholding tax and the information contained in this paragraph is only of direct application to shareholders registered on the Johannesburg register, who should direct any questions about the application of the dividend withholding tax to Computershare Investor Services (Pty) Limited, Tel: +27 11 373-0004. From the commencement of trading on Thursday 12 November 2015 until the close of business on Friday 27 November 2015, no transfers between the London and Johannesburg registers will be permitted, and from Monday 23 November 2015 until Friday 27 November 2015, no shares may be dematerialised or rematerialised, both days inclusive. Directors' responsibility for financial reporting This statement, which should be read in conjunction with the independent review report of the auditors set out below, is made to enable shareholders to distinguish the respective responsibilities of the directors and the auditors in relation to the condensed consolidated interim financial information, which the directors confirm has been prepared on a going concern basis. The directors consider that the group has used appropriate accounting policies, consistently applied and supported by reasonable and appropriate judgements and estimates. A copy of the interim report of the group is placed on the company's website. The directors are responsible for the maintenance and integrity of the statutory and audited information on the company's website. Information published on the internet is accessible in many countries with different legal requirements. Legislation in the United Kingdom governing the preparation and dissemination of the financial statements may differ from legislation in other jurisdictions. The directors confirm that this condensed set of financial statements has been prepared in accordance with IAS 34 as adopted by the European Union, and the interim management report herein includes a fair review of the information required by DTR 4.2.7 and DTR 4.2.8 of the Disclosure and Transparency Rules of the United Kingdom's Financial Conduct Authority. At the date of this statement, the directors of SABMiller plc are those listed in the SABMiller plc Annual Report at 31 March 2015 with the exception of Domenic De Lorenzo, Javier Ferrán and David Beran, who were
appointed to the board and John Manser, John Manzoni and Howard Willard, who retired from the board, all on 23 July 2015. On this same day, Jan du Plessis succeeded John Manser as Chairman and Domenic De Lorenzo was appointed as Chief Financial Officer. A list of current directors is maintained on the SABMiller plc website: www.sabmiller.com. On behalf of the board Alan Clark Domenic De Lorenzo Chief executive Chief financial officer 11 November 2015 INDEPENDENT REVIEW REPORT TO SABMILLER PLC Report on the condensed consolidated interim financial information Our conclusion We have reviewed the condensed consolidated interim financial information, defined below, in the interim announcement of SABMiller plc for the six months ended 30 September 2015. Based on our review, nothing has come to our attention that causes us to believe that the condensed consolidated interim financial information is not prepared, in all material respects, in accordance with International Accounting Standard 34 as adopted by the European Union and the Disclosure and Transparency Rules of the United Kingdom's Financial Conduct Authority. This conclusion is to be read in the context of what we say in the remainder of this report. What we have reviewed The condensed consolidated interim financial information, which is prepared by SABMiller plc, comprises: - the consolidated balance sheet as at 30 September 2015; - the consolidated income statement and consolidated statement of comprehensive income for the period then ended; - the consolidated cash flow statement for the period then ended; - the consolidated statement of changes in equity for the period then ended; and - the explanatory notes to the condensed consolidated interim financial information. As disclosed in note 1, the financial reporting framework that has been applied in the preparation of the full annual financial statements of the group is applicable law and International Financial Reporting Standards (IFRSs) as adopted by the European Union. The condensed consolidated interim financial information included in the interim announcement has been prepared in accordance with International Accounting Standard 34, 'Interim Financial Reporting', as adopted by the European Union and the Disclosure and Transparency Rules of the United Kingdom's Financial Conduct Authority. What a review of condensed consolidated financial information involves We conducted our review in accordance with International Standard on Review Engagements (UK and Ireland) 2410, 'Review of Interim Financial Information Performed by the Independent Auditor of the Entity' issued by the Auditing Practices Board for use in the United Kingdom. A review of interim financial information consists of making enquiries, primarily of persons responsible for financial and accounting matters, and applying analytical and other review procedures. A review is substantially less in scope than an audit conducted in accordance with International Standards on Auditing (UK and Ireland) and, consequently, does not enable us to obtain assurance that we would become aware of all significant matters that might be identified in an audit. Accordingly, we do not express an audit opinion.
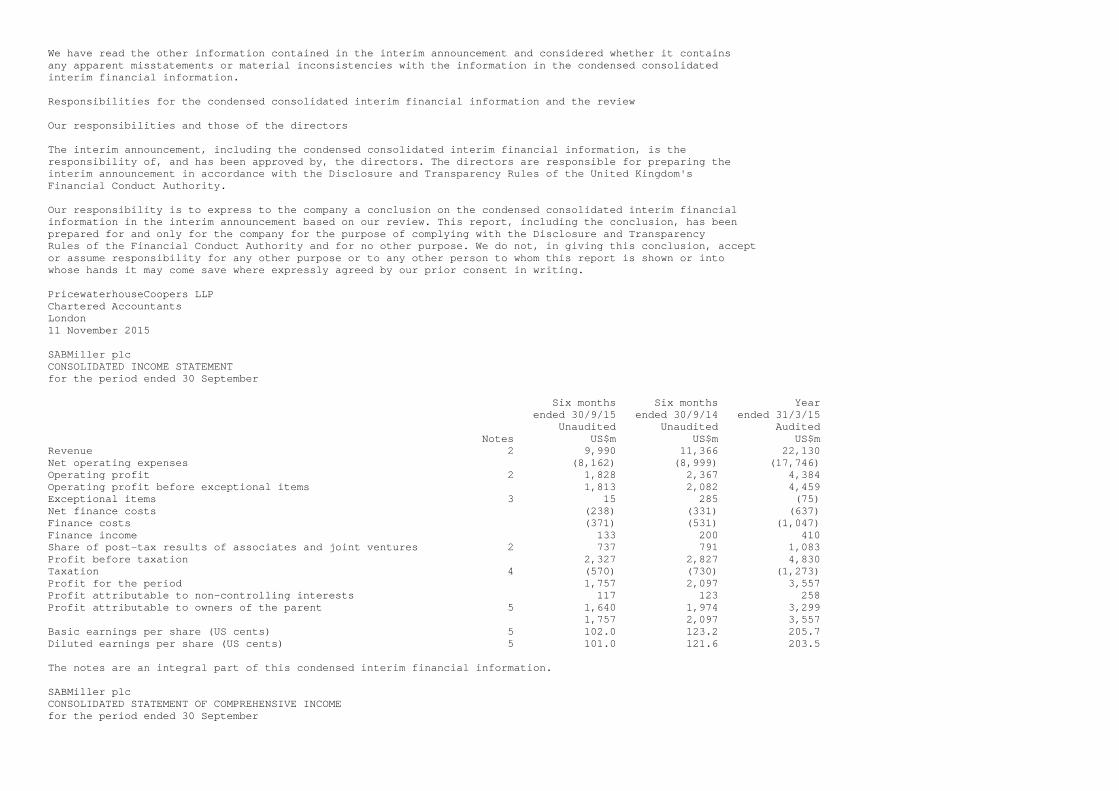
We have read the other information contained in the interim announcement and considered whether it contains any apparent misstatements or material inconsistencies with the information in the condensed consolidated interim financial information. Responsibilities for the condensed consolidated interim financial information and the review Our responsibilities and those of the directors The interim announcement, including the condensed consolidated interim financial information, is the responsibility of, and has been approved by, the directors. The directors are responsible for preparing the interim announcement in accordance with the Disclosure and Transparency Rules of the United Kingdom's Financial Conduct Authority. Our responsibility is to express to the company a conclusion on the condensed consolidated interim financial information in the interim announcement based on our review. This report, including the conclusion, has been prepared for and only for the company for the purpose of complying with the Disclosure and Transparency Rules of the Financial Conduct Authority and for no other purpose. We do not, in giving this conclusion, accept or assume responsibility for any other purpose or to any other person to whom this report is shown or into whose hands it may come save where expressly agreed by our prior consent in writing. PricewaterhouseCoopers LLP Chartered Accountants London 11 November 2015 SABMiller plc CONSOLIDATED INCOME STATEMENT for the period ended 30 September Six months Six months Year ended 30/9/15 ended 30/9/14 ended 31/3/15 Unaudited Unaudited Audited Notes US$m US$m US$m Revenue 2 9,990 11,366 22,130 Net operating expenses (8,162) (8,999) (17,746) Operating profit 2 1,828 2,367 4,384 Operating profit before exceptional items 1,813 2,082 4,459 Exceptional items 3 15 285 (75) Net finance costs (238) (331) (637) Finance costs (371) (531) (1,047) Finance income 133 200 410 Share of post-tax results of associates and joint ventures 2 737 791 1,083 Profit before taxation 2,327 2,827 4,830 Taxation 4 (570) (730) (1,273) Profit for the period 1,757 2,097 3,557 Profit attributable to non-controlling interests 117 123 258 Profit attributable to owners of the parent 5 1,640 1,974 3,299 1,757 2,097 3,557 Basic earnings per share (US cents) 5 102.0 123.2 205.7 Diluted earnings per share (US cents) 5 101.0 121.6 203.5 The notes are an integral part of this condensed interim financial information. SABMiller plc CONSOLIDATED STATEMENT OF COMPREHENSIVE INCOME for the period ended 30 September
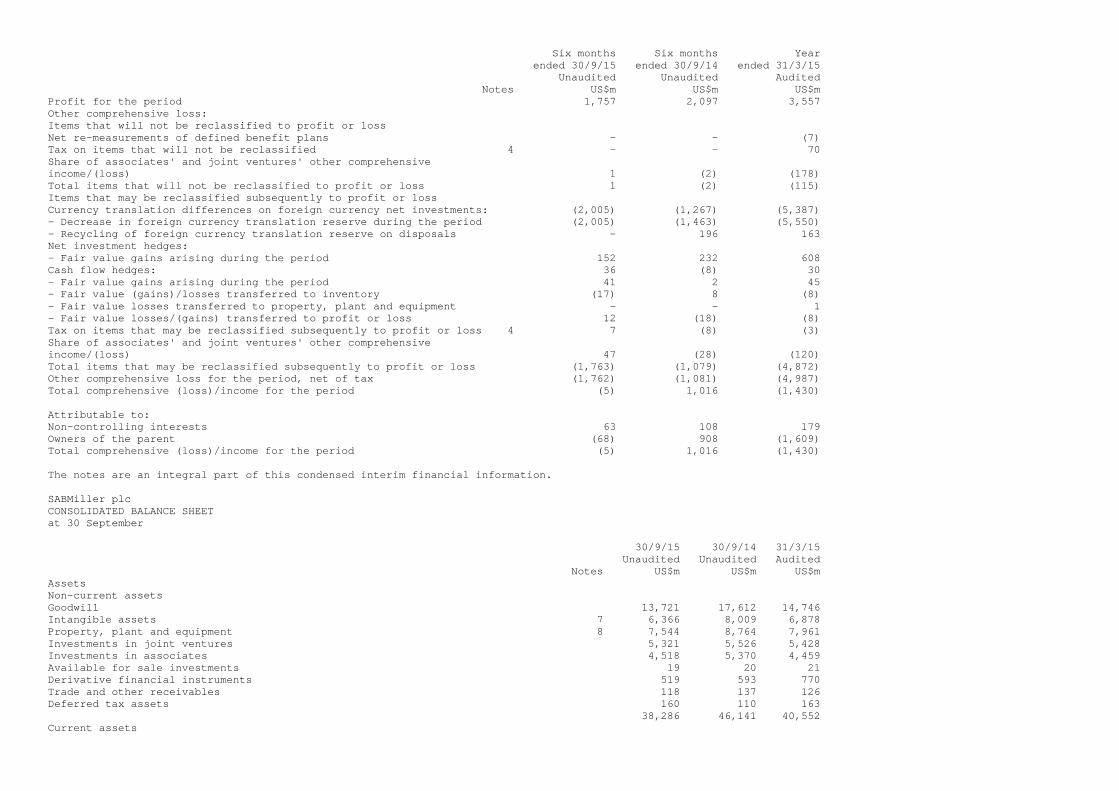
Six months Six months Year ended 30/9/15 ended 30/9/14 ended 31/3/15 Unaudited Unaudited Audited Notes US$m US$m US$m Profit for the period 1,757 2,097 3,557 Other comprehensive loss: Items that will not be reclassified to profit or loss Net re-measurements of defined benefit plans - - (7) Tax on items that will not be reclassified 4 - - 70 Share of associates' and joint ventures' other comprehensive income/(loss) 1 (2) (178) Total items that will not be reclassified to profit or loss 1 (2) (115) Items that may be reclassified subsequently to profit or loss Currency translation differences on foreign currency net investments: (2,005) (1,267) (5,387) - Decrease in foreign currency translation reserve during the period (2,005) (1,463) (5,550) - Recycling of foreign currency translation reserve on disposals - 196 163 Net investment hedges: - Fair value gains arising during the period 152 232 608 Cash flow hedges: 36 (8) 30 - Fair value gains arising during the period 41 2 45 - Fair value (gains)/losses transferred to inventory (17) 8 (8) - Fair value losses transferred to property, plant and equipment - - 1 - Fair value losses/(gains) transferred to profit or loss 12 (18) (8) Tax on items that may be reclassified subsequently to profit or loss 4 7 (8) (3) Share of associates' and joint ventures' other comprehensive income/(loss) 47 (28) (120) Total items that may be reclassified subsequently to profit or loss (1,763) (1,079) (4,872) Other comprehensive loss for the period, net of tax (1,762) (1,081) (4,987) Total comprehensive (loss)/income for the period (5) 1,016 (1,430) Attributable to: Non-controlling interests 63 108 179 Owners of the parent (68) 908 (1,609) Total comprehensive (loss)/income for the period (5) 1,016 (1,430) The notes are an integral part of this condensed interim financial information. SABMiller plc CONSOLIDATED BALANCE SHEET at 30 September 30/9/15 30/9/14 31/3/15 Unaudited Unaudited Audited Notes US$m US$m US$m Assets Non-current assets Goodwill 13,721 17,612 14,746 Intangible assets 7 6,366 8,009 6,878 Property, plant and equipment 8 7,544 8,764 7,961 Investments in joint ventures 5,321 5,526 5,428 Investments in associates 4,518 5,370 4,459 Available for sale investments 19 20 21 Derivative financial instruments 519 593 770 Trade and other receivables 118 137 126 Deferred tax assets 160 110 163 38,286 46,141 40,552 Current assets
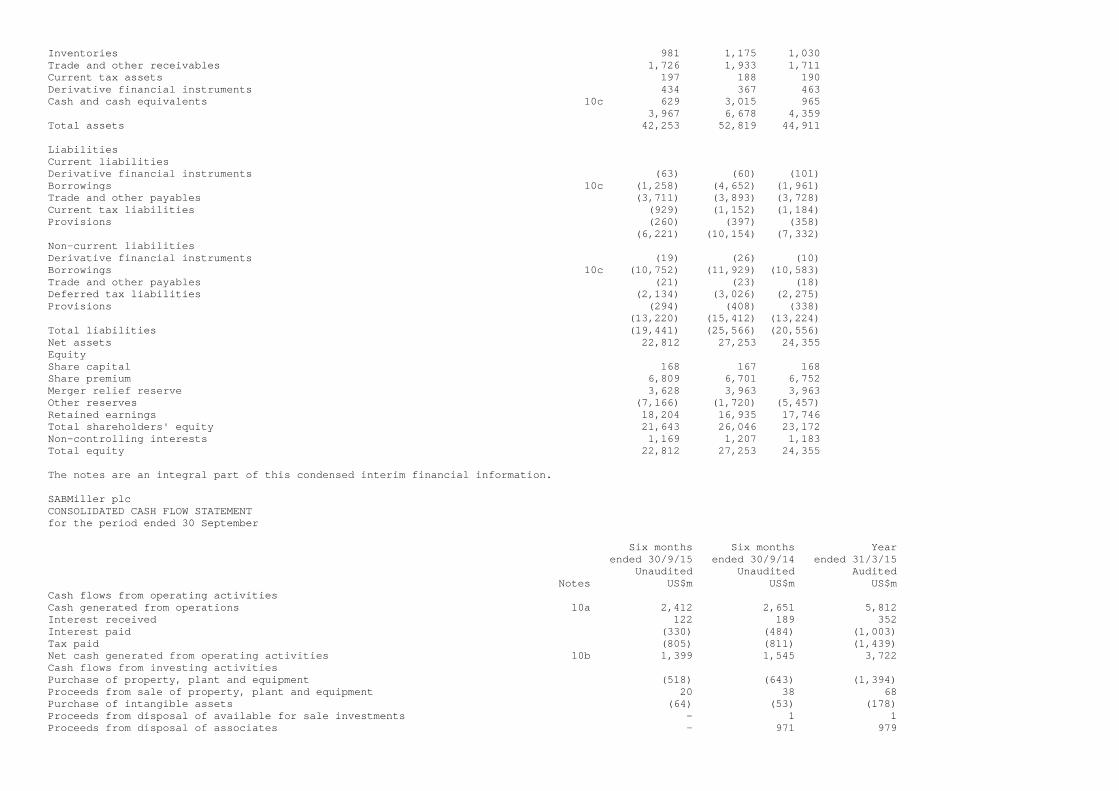
Inventories 981 1,175 1,030 Trade and other receivables 1,726 1,933 1,711 Current tax assets 197 188 190 Derivative financial instruments 434 367 463 Cash and cash equivalents 10c 629 3,015 965 3,967 6,678 4,359 Total assets 42,253 52,819 44,911 Liabilities Current liabilities Derivative financial instruments (63) (60) (101) Borrowings 10c (1,258) (4,652) (1,961) Trade and other payables (3,711) (3,893) (3,728) Current tax liabilities (929) (1,152) (1,184) Provisions (260) (397) (358) (6,221) (10,154) (7,332) Non-current liabilities Derivative financial instruments (19) (26) (10) Borrowings 10c (10,752) (11,929) (10,583) Trade and other payables (21) (23) (18) Deferred tax liabilities (2,134) (3,026) (2,275) Provisions (294) (408) (338) (13,220) (15,412) (13,224) Total liabilities (19,441) (25,566) (20,556) Net assets 22,812 27,253 24,355 Equity Share capital 168 167 168 Share premium 6,809 6,701 6,752 Merger relief reserve 3,628 3,963 3,963 Other reserves (7,166) (1,720) (5,457) Retained earnings 18,204 16,935 17,746 Total shareholders' equity 21,643 26,046 23,172 Non-controlling interests 1,169 1,207 1,183 Total equity 22,812 27,253 24,355 The notes are an integral part of this condensed interim financial information. SABMiller plc CONSOLIDATED CASH FLOW STATEMENT for the period ended 30 September Six months Six months Year ended 30/9/15 ended 30/9/14 ended 31/3/15 Unaudited Unaudited Audited Notes US$m US$m US$m Cash flows from operating activities Cash generated from operations 10a 2,412 2,651 5,812 Interest received 122 189 352 Interest paid (330) (484) (1,003) Tax paid (805) (811) (1,439) Net cash generated from operating activities 10b 1,399 1,545 3,722 Cash flows from investing activities Purchase of property, plant and equipment (518) (643) (1,394) Proceeds from sale of property, plant and equipment 20 38 68 Purchase of intangible assets (64) (53) (178) Proceeds from disposal of available for sale investments - 1 1 Proceeds from disposal of associates - 971 979
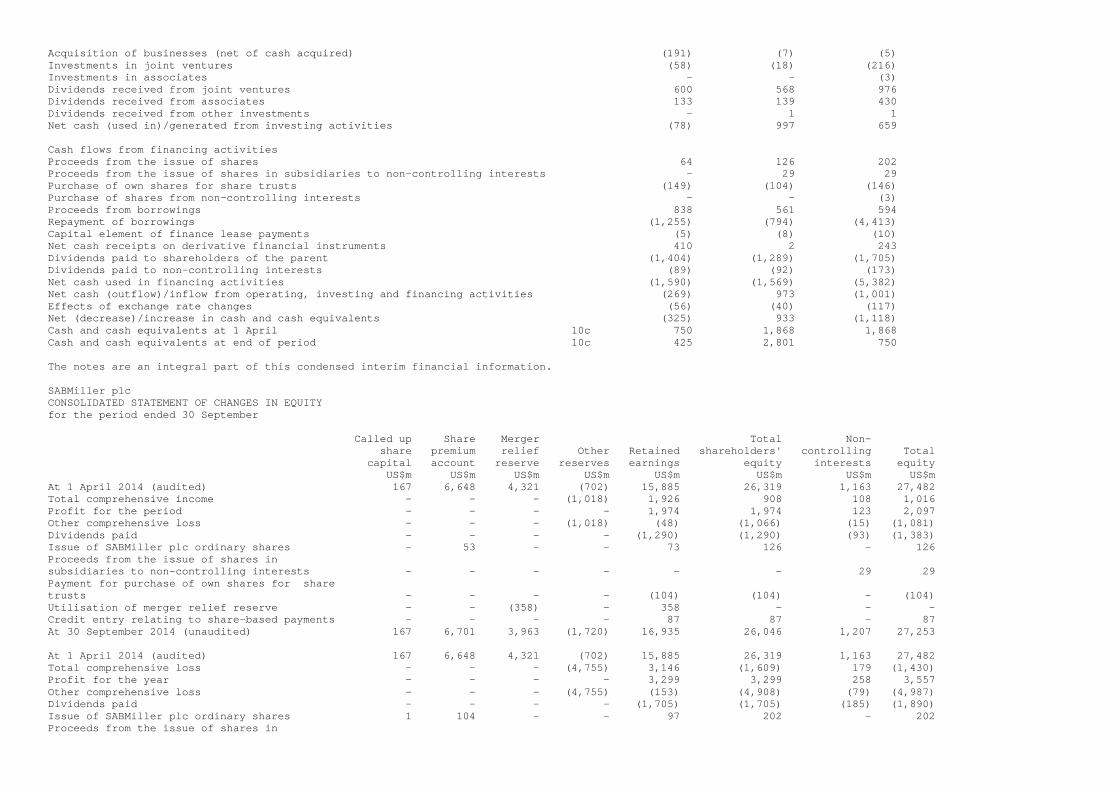
Acquisition of businesses (net of cash acquired) (191) (7) (5) Investments in joint ventures (58) (18) (216) Investments in associates - - (3) Dividends received from joint ventures 600 568 976 Dividends received from associates 133 139 430 Dividends received from other investments - 1 1 Net cash (used in)/generated from investing activities (78) 997 659 Cash flows from financing activities Proceeds from the issue of shares 64 126 202 Proceeds from the issue of shares in subsidiaries to non-controlling interests - 29 29 Purchase of own shares for share trusts (149) (104) (146) Purchase of shares from non-controlling interests - - (3) Proceeds from borrowings 838 561 594 Repayment of borrowings (1,255) (794) (4,413) Capital element of finance lease payments (5) (8) (10) Net cash receipts on derivative financial instruments 410 2 243 Dividends paid to shareholders of the parent (1,404) (1,289) (1,705) Dividends paid to non-controlling interests (89) (92) (173) Net cash used in financing activities (1,590) (1,569) (5,382) Net cash (outflow)/inflow from operating, investing and financing activities (269) 973 (1,001) Effects of exchange rate changes (56) (40) (117) Net (decrease)/increase in cash and cash equivalents (325) 933 (1,118) Cash and cash equivalents at 1 April 10c 750 1,868 1,868 Cash and cash equivalents at end of period 10c 425 2,801 750 The notes are an integral part of this condensed interim financial information. SABMiller plc CONSOLIDATED STATEMENT OF CHANGES IN EQUITY for the period ended 30 September Called up Share Merger Total Non- share premium relief Other Retained shareholders' controlling Total capital account reserve reserves earnings equity interests equity US$m US$m US$m US$m US$m US$m US$m US$m At 1 April 2014 (audited) 167 6,648 4,321 (702) 15,885 26,319 1,163 27,482 Total comprehensive income - - - (1,018) 1,926 908 108 1,016 Profit for the period - - - - 1,974 1,974 123 2,097 Other comprehensive loss - - - (1,018) (48) (1,066) (15) (1,081) Dividends paid - - - - (1,290) (1,290) (93) (1,383) Issue of SABMiller plc ordinary shares - 53 - - 73 126 - 126 Proceeds from the issue of shares in subsidiaries to non-controlling interests - - - - - - 29 29 Payment for purchase of own shares for share trusts - - - - (104) (104) - (104) Utilisation of merger relief reserve - - (358) - 358 - - - Credit entry relating to share-based payments - - - - 87 87 - 87 At 30 September 2014 (unaudited) 167 6,701 3,963 (1,720) 16,935 26,046 1,207 27,253 At 1 April 2014 (audited) 167 6,648 4,321 (702) 15,885 26,319 1,163 27,482 Total comprehensive loss - - - (4,755) 3,146 (1,609) 179 (1,430) Profit for the year - - - - 3,299 3,299 258 3,557 Other comprehensive loss - - - (4,755) (153) (4,908) (79) (4,987) Dividends paid - - - - (1,705) (1,705) (185) (1,890) Issue of SABMiller plc ordinary shares 1 104 - - 97 202 - 202 Proceeds from the issue of shares in
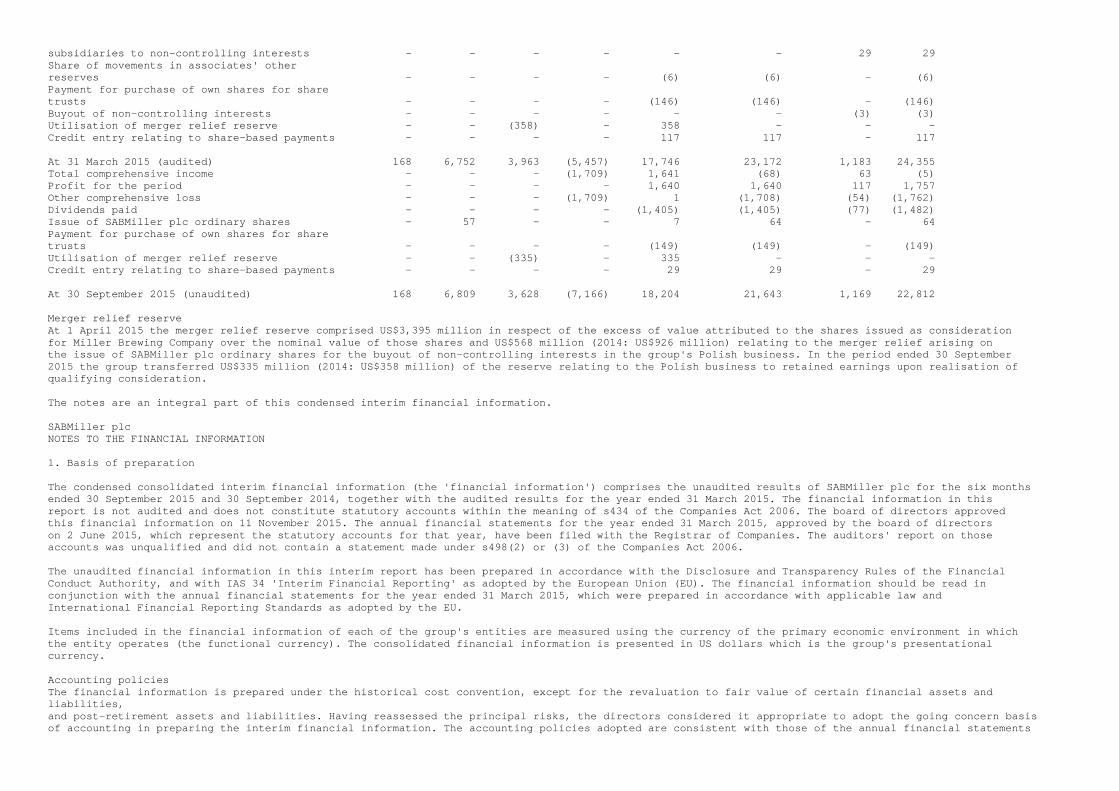
subsidiaries to non-controlling interests - - - - - - 29 29 Share of movements in associates' other reserves - - - - (6) (6) - (6) Payment for purchase of own shares for share trusts - - - - (146) (146) - (146) Buyout of non-controlling interests - - - - - - (3) (3) Utilisation of merger relief reserve - - (358) - 358 - - - Credit entry relating to share-based payments - - - - 117 117 - 117 At 31 March 2015 (audited) 168 6,752 3,963 (5,457) 17,746 23,172 1,183 24,355 Total comprehensive income - - - (1,709) 1,641 (68) 63 (5) Profit for the period - - - - 1,640 1,640 117 1,757 Other comprehensive loss - - - (1,709) 1 (1,708) (54) (1,762) Dividends paid - - - - (1,405) (1,405) (77) (1,482) Issue of SABMiller plc ordinary shares - 57 - - 7 64 - 64 Payment for purchase of own shares for share trusts - - - - (149) (149) - (149) Utilisation of merger relief reserve - - (335) - 335 - - - Credit entry relating to share-based payments - - - - 29 29 - 29 At 30 September 2015 (unaudited) 168 6,809 3,628 (7,166) 18,204 21,643 1,169 22,812 Merger relief reserve At 1 April 2015 the merger relief reserve comprised US$3,395 million in respect of the excess of value attributed to the shares issued as consideration for Miller Brewing Company over the nominal value of those shares and US$568 million (2014: US$926 million) relating to the merger relief arising on the issue of SABMiller plc ordinary shares for the buyout of non-controlling interests in the group's Polish business. In the period ended 30 September 2015 the group transferred US$335 million (2014: US$358 million) of the reserve relating to the Polish business to retained earnings upon realisation of qualifying consideration. The notes are an integral part of this condensed interim financial information. SABMiller plc NOTES TO THE FINANCIAL INFORMATION 1. Basis of preparation The condensed consolidated interim financial information (the 'financial information') comprises the unaudited results of SABMiller plc for the six months ended 30 September 2015 and 30 September 2014, together with the audited results for the year ended 31 March 2015. The financial information in this report is not audited and does not constitute statutory accounts within the meaning of s434 of the Companies Act 2006. The board of directors approved this financial information on 11 November 2015. The annual financial statements for the year ended 31 March 2015, approved by the board of directors on 2 June 2015, which represent the statutory accounts for that year, have been filed with the Registrar of Companies. The auditors' report on those accounts was unqualified and did not contain a statement made under s498(2) or (3) of the Companies Act 2006. The unaudited financial information in this interim report has been prepared in accordance with the Disclosure and Transparency Rules of the Financial Conduct Authority, and with IAS 34 'Interim Financial Reporting' as adopted by the European Union (EU). The financial information should be read in conjunction with the annual financial statements for the year ended 31 March 2015, which were prepared in accordance with applicable law and International Financial Reporting Standards as adopted by the EU. Items included in the financial information of each of the group's entities are measured using the currency of the primary economic environment in which the entity operates (the functional currency). The consolidated financial information is presented in US dollars which is the group's presentational currency. Accounting policies The financial information is prepared under the historical cost convention, except for the revaluation to fair value of certain financial assets and liabilities, and post-retirement assets and liabilities. Having reassessed the principal risks, the directors considered it appropriate to adopt the going concern basis of accounting in preparing the interim financial information. The accounting policies adopted are consistent with those of the annual financial statements
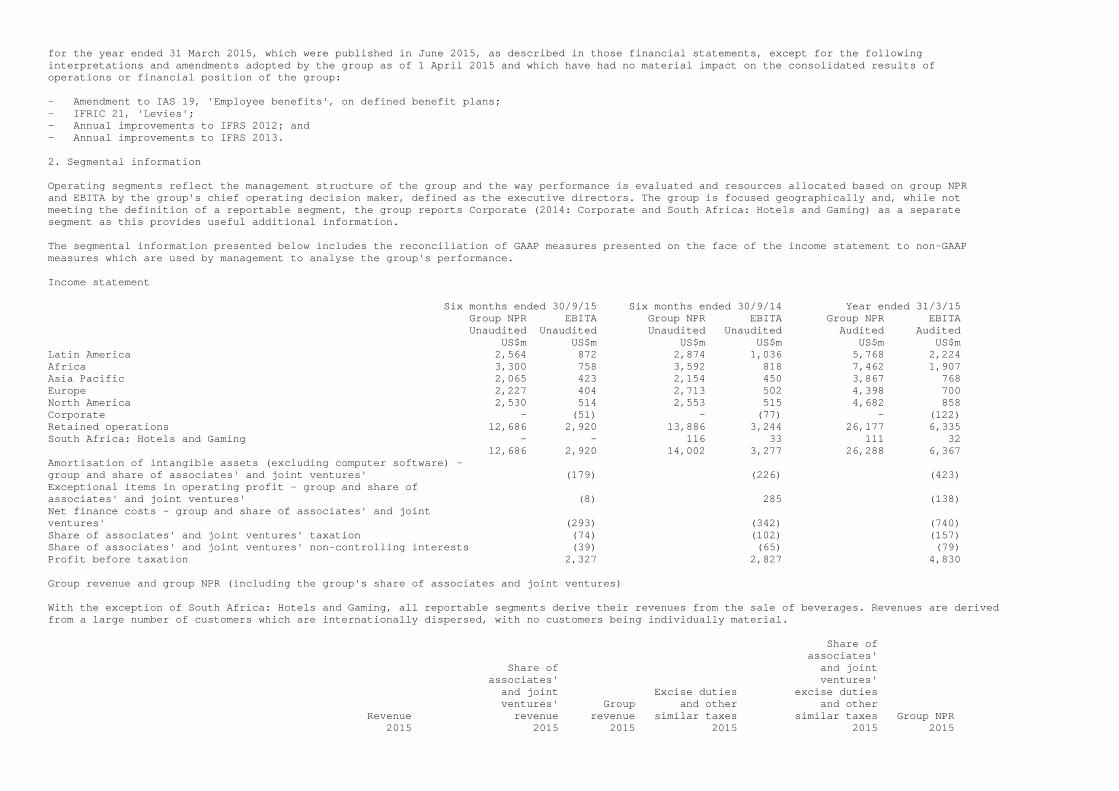
for the year ended 31 March 2015, which were published in June 2015, as described in those financial statements, except for the following interpretations and amendments adopted by the group as of 1 April 2015 and which have had no material impact on the consolidated results of operations or financial position of the group: - Amendment to IAS 19, 'Employee benefits', on defined benefit plans; - IFRIC 21, 'Levies'; - Annual improvements to IFRS 2012; and - Annual improvements to IFRS 2013. 2. Segmental information Operating segments reflect the management structure of the group and the way performance is evaluated and resources allocated based on group NPR and EBITA by the group's chief operating decision maker, defined as the executive directors. The group is focused geographically and, while not meeting the definition of a reportable segment, the group reports Corporate (2014: Corporate and South Africa: Hotels and Gaming) as a separate segment as this provides useful additional information. The segmental information presented below includes the reconciliation of GAAP measures presented on the face of the income statement to non-GAAP measures which are used by management to analyse the group's performance. Income statement Six months ended 30/9/15 Six months ended 30/9/14 Year ended 31/3/15 Group NPR EBITA Group NPR EBITA Group NPR EBITA Unaudited Unaudited Unaudited Unaudited Audited Audited US$m US$m US$m US$m US$m US$m Latin America 2,564 872 2,874 1,036 5,768 2,224 Africa 3,300 758 3,592 818 7,462 1,907 Asia Pacific 2,065 423 2,154 450 3,867 768 Europe 2,227 404 2,713 502 4,398 700 North America 2,530 514 2,553 515 4,682 858 Corporate - (51) - (77) - (122) Retained operations 12,686 2,920 13,886 3,244 26,177 6,335 South Africa: Hotels and Gaming - - 116 33 111 32 12,686 2,920 14,002 3,277 26,288 6,367 Amortisation of intangible assets (excluding computer software) – group and share of associates' and joint ventures' (179) (226) (423) Exceptional items in operating profit – group and share of associates' and joint ventures' (8) 285 (138) Net finance costs – group and share of associates' and joint ventures' (293) (342) (740) Share of associates' and joint ventures' taxation (74) (102) (157) Share of associates' and joint ventures' non-controlling interests (39) (65) (79) Profit before taxation 2,327 2,827 4,830 Group revenue and group NPR (including the group's share of associates and joint ventures) With the exception of South Africa: Hotels and Gaming, all reportable segments derive their revenues from the sale of beverages. Revenues are derived from a large number of customers which are internationally dispersed, with no customers being individually material. Share of associates' Share of and joint associates' ventures' and joint Excise duties excise duties ventures' Group and other and other Revenue revenue revenue similar taxes similar taxes Group NPR 2015 2015 2015 2015 2015 2015
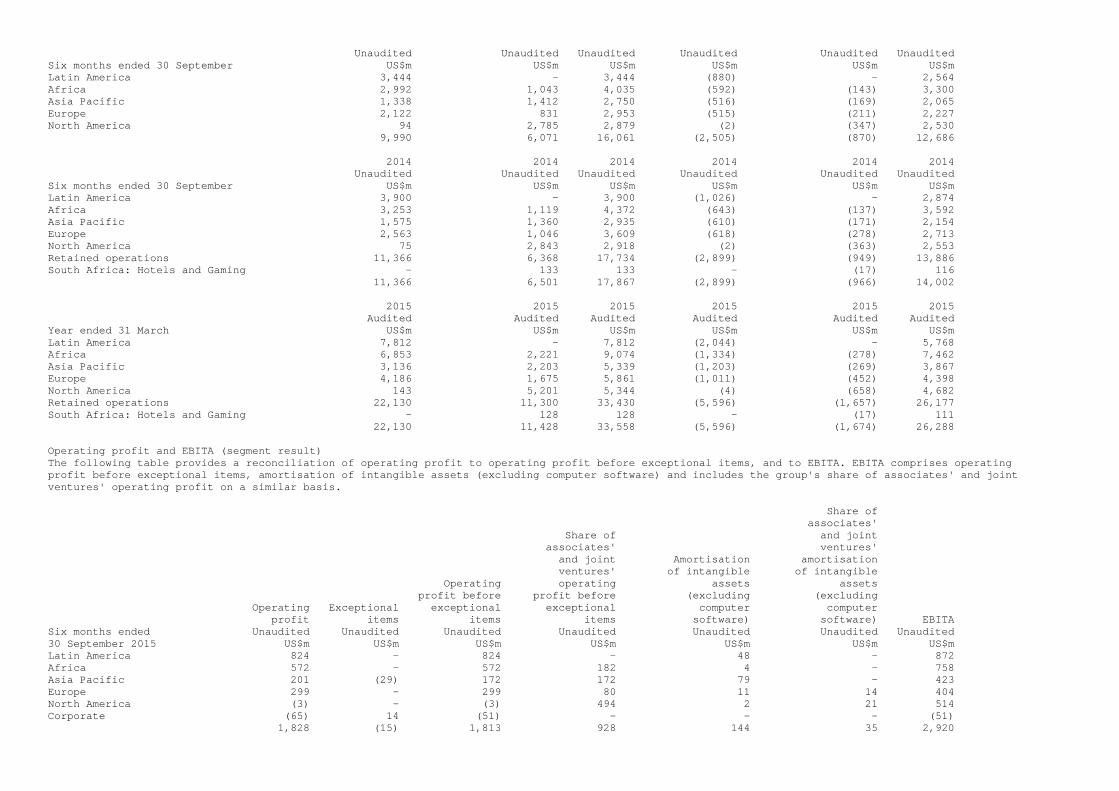
Unaudited Unaudited Unaudited Unaudited Unaudited Unaudited Six months ended 30 September US$m US$m US$m US$m US$m US$m Latin America 3,444 - 3,444 (880) - 2,564 Africa 2,992 1,043 4,035 (592) (143) 3,300 Asia Pacific 1,338 1,412 2,750 (516) (169) 2,065 Europe 2,122 831 2,953 (515) (211) 2,227 North America 94 2,785 2,879 (2) (347) 2,530 9,990 6,071 16,061 (2,505) (870) 12,686 2014 2014 2014 2014 2014 2014 Unaudited Unaudited Unaudited Unaudited Unaudited Unaudited Six months ended 30 September US$m US$m US$m US$m US$m US$m Latin America 3,900 - 3,900 (1,026) - 2,874 Africa 3,253 1,119 4,372 (643) (137) 3,592 Asia Pacific 1,575 1,360 2,935 (610) (171) 2,154 Europe 2,563 1,046 3,609 (618) (278) 2,713 North America 75 2,843 2,918 (2) (363) 2,553 Retained operations 11,366 6,368 17,734 (2,899) (949) 13,886 South Africa: Hotels and Gaming - 133 133 - (17) 116 11,366 6,501 17,867 (2,899) (966) 14,002 2015 2015 2015 2015 2015 2015 Audited Audited Audited Audited Audited Audited Year ended 31 March US$m US$m US$m US$m US$m US$m Latin America 7,812 - 7,812 (2,044) - 5,768 Africa 6,853 2,221 9,074 (1,334) (278) 7,462 Asia Pacific 3,136 2,203 5,339 (1,203) (269) 3,867 Europe 4,186 1,675 5,861 (1,011) (452) 4,398 North America 143 5,201 5,344 (4) (658) 4,682 Retained operations 22,130 11,300 33,430 (5,596) (1,657) 26,177 South Africa: Hotels and Gaming - 128 128 - (17) 111 22,130 11,428 33,558 (5,596) (1,674) 26,288 Operating profit and EBITA (segment result) The following table provides a reconciliation of operating profit to operating profit before exceptional items, and to EBITA. EBITA comprises operating profit before exceptional items, amortisation of intangible assets (excluding computer software) and includes the group's share of associates' and joint ventures' operating profit on a similar basis. Share of associates' Share of and joint associates' ventures' and joint Amortisation amortisation ventures' of intangible of intangible Operating operating assets assets profit before profit before (excluding (excluding Operating Exceptional exceptional exceptional computer computer profit items items items software) software) EBITA Six months ended Unaudited Unaudited Unaudited Unaudited Unaudited Unaudited Unaudited 30 September 2015 US$m US$m US$m US$m US$m US$m US$m Latin America 824 - 824 - 48 - 872 Africa 572 - 572 182 4 - 758 Asia Pacific 201 (29) 172 172 79 - 423 Europe 299 - 299 80 11 14 404 North America (3) - (3) 494 2 21 514 Corporate (65) 14 (51) - - - (51) 1,828 (15) 1,813 928 144 35 2,920
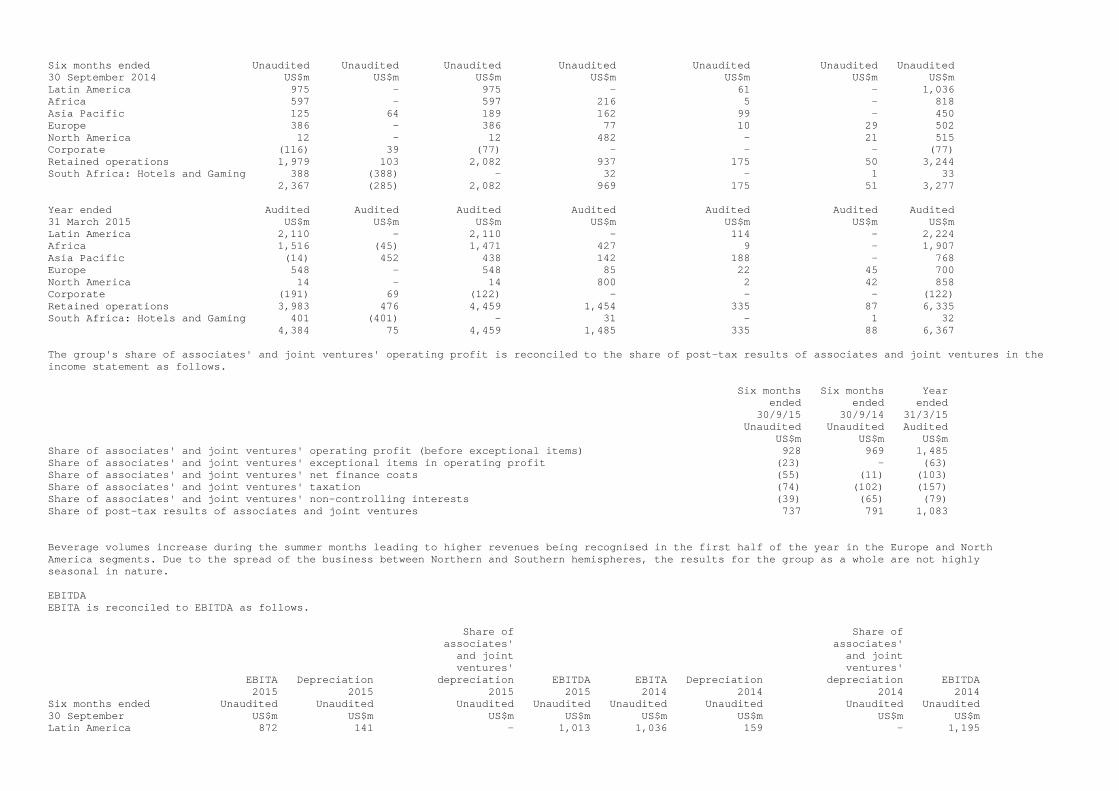
Six months ended Unaudited Unaudited Unaudited Unaudited Unaudited Unaudited Unaudited 30 September 2014 US$m US$m US$m US$m US$m US$m US$m Latin America 975 - 975 - 61 - 1,036 Africa 597 - 597 216 5 - 818 Asia Pacific 125 64 189 162 99 - 450 Europe 386 - 386 77 10 29 502 North America 12 - 12 482 - 21 515 Corporate (116) 39 (77) - - - (77) Retained operations 1,979 103 2,082 937 175 50 3,244 South Africa: Hotels and Gaming 388 (388) - 32 - 1 33 2,367 (285) 2,082 969 175 51 3,277 Year ended Audited Audited Audited Audited Audited Audited Audited 31 March 2015 US$m US$m US$m US$m US$m US$m US$m Latin America 2,110 - 2,110 - 114 - 2,224 Africa 1,516 (45) 1,471 427 9 - 1,907 Asia Pacific (14) 452 438 142 188 - 768 Europe 548 - 548 85 22 45 700 North America 14 - 14 800 2 42 858 Corporate (191) 69 (122) - - - (122) Retained operations 3,983 476 4,459 1,454 335 87 6,335 South Africa: Hotels and Gaming 401 (401) - 31 - 1 32 4,384 75 4,459 1,485 335 88 6,367 The group's share of associates' and joint ventures' operating profit is reconciled to the share of post-tax results of associates and joint ventures in the income statement as follows. Six months Six months Year ended ended ended 30/9/15 30/9/14 31/3/15 Unaudited Unaudited Audited US$m US$m US$m Share of associates' and joint ventures' operating profit (before exceptional items) 928 969 1,485 Share of associates' and joint ventures' exceptional items in operating profit (23) - (63) Share of associates' and joint ventures' net finance costs (55) (11) (103) Share of associates' and joint ventures' taxation (74) (102) (157) Share of associates' and joint ventures' non-controlling interests (39) (65) (79) Share of post-tax results of associates and joint ventures 737 791 1,083 Beverage volumes increase during the summer months leading to higher revenues being recognised in the first half of the year in the Europe and North America segments. Due to the spread of the business between Northern and Southern hemispheres, the results for the group as a whole are not highly seasonal in nature. EBITDA EBITA is reconciled to EBITDA as follows. Share of Share of associates' associates' and joint and joint ventures' ventures' EBITA Depreciation depreciation EBITDA EBITA Depreciation depreciation EBITDA 2015 2015 2015 2015 2014 2014 2014 2014 Six months ended Unaudited Unaudited Unaudited Unaudited Unaudited Unaudited Unaudited Unaudited 30 September US$m US$m US$m US$m US$m US$m US$m US$m Latin America 872 141 - 1,013 1,036 159 - 1,195
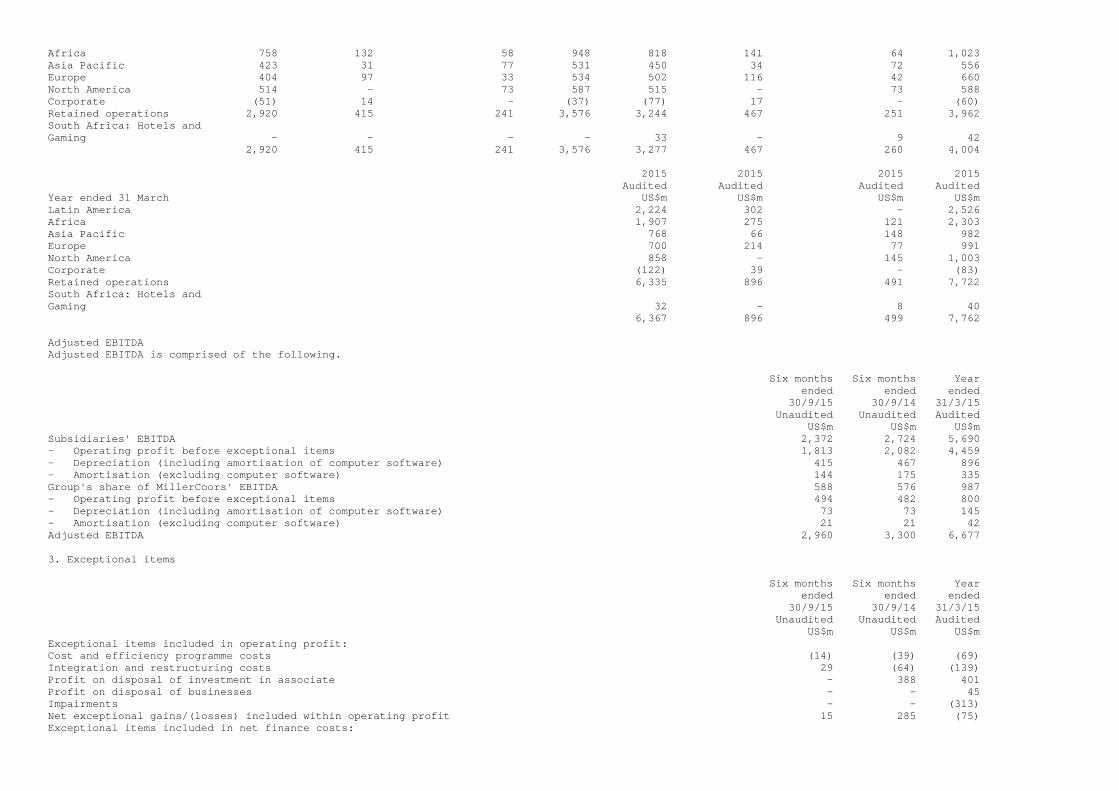
Africa 758 132 58 948 818 141 64 1,023 Asia Pacific 423 31 77 531 450 34 72 556 Europe 404 97 33 534 502 116 42 660 North America 514 - 73 587 515 - 73 588 Corporate (51) 14 - (37) (77) 17 - (60) Retained operations 2,920 415 241 3,576 3,244 467 251 3,962 South Africa: Hotels and Gaming - - - - 33 - 9 42 2,920 415 241 3,576 3,277 467 260 4,004 2015 2015 2015 2015 Audited Audited Audited Audited Year ended 31 March US$m US$m US$m US$m Latin America 2,224 302 - 2,526 Africa 1,907 275 121 2,303 Asia Pacific 768 66 148 982 Europe 700 214 77 991 North America 858 - 145 1,003 Corporate (122) 39 - (83) Retained operations 6,335 896 491 7,722 South Africa: Hotels and Gaming 32 - 8 40 6,367 896 499 7,762 Adjusted EBITDA Adjusted EBITDA is comprised of the following. Six months Six months Year ended ended ended 30/9/15 30/9/14 31/3/15 Unaudited Unaudited Audited US$m US$m US$m Subsidiaries' EBITDA 2,372 2,724 5,690 - Operating profit before exceptional items 1,813 2,082 4,459 - Depreciation (including amortisation of computer software) 415 467 896 - Amortisation (excluding computer software) 144 175 335 Group's share of MillerCoors' EBITDA 588 576 987 - Operating profit before exceptional items 494 482 800 - Depreciation (including amortisation of computer software) 73 73 145 - Amortisation (excluding computer software) 21 21 42 Adjusted EBITDA 2,960 3,300 6,677 3. Exceptional items Six months Six months Year ended ended ended 30/9/15 30/9/14 31/3/15 Unaudited Unaudited Audited US$m US$m US$m Exceptional items included in operating profit: Cost and efficiency programme costs (14) (39) (69) Integration and restructuring costs 29 (64) (139) Profit on disposal of investment in associate - 388 401 Profit on disposal of businesses - - 45 Impairments - - (313) Net exceptional gains/(losses) included within operating profit 15 285 (75) Exceptional items included in net finance costs:
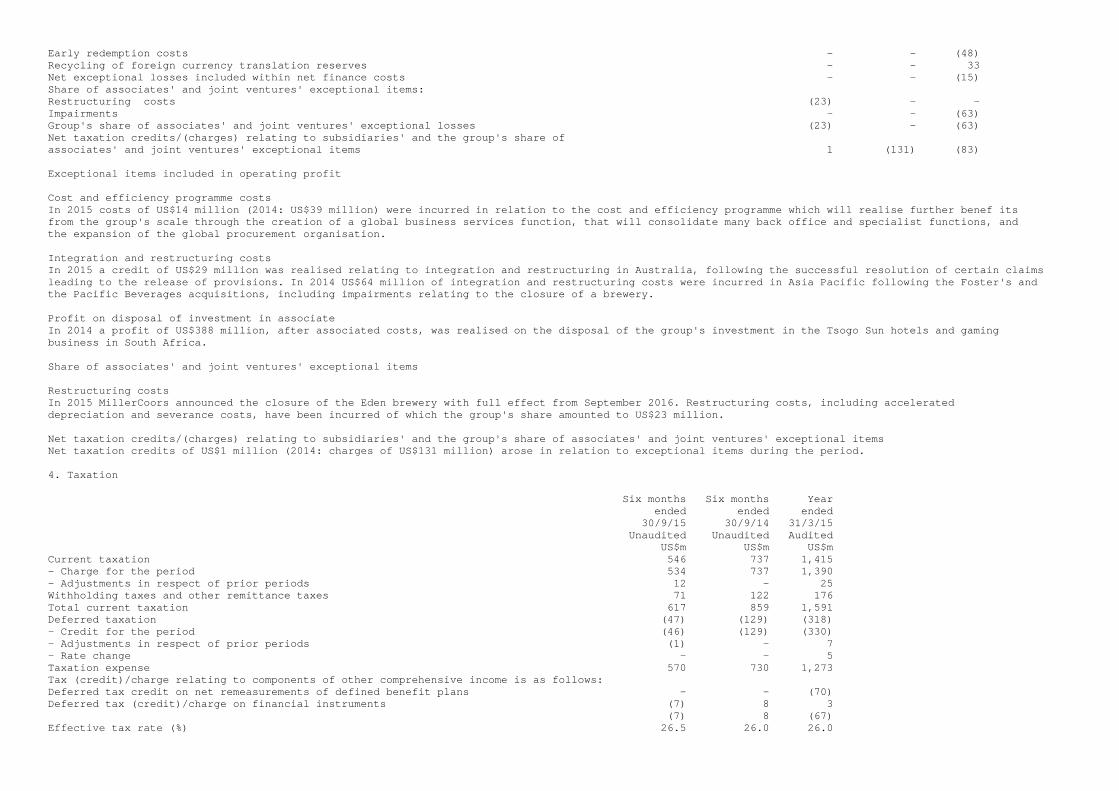
Early redemption costs - - (48) Recycling of foreign currency translation reserves - - 33 Net exceptional losses included within net finance costs - - (15) Share of associates' and joint ventures' exceptional items: Restructuring costs (23) - - Impairments - - (63) Group's share of associates' and joint ventures' exceptional losses (23) - (63) Net taxation credits/(charges) relating to subsidiaries' and the group's share of associates' and joint ventures' exceptional items 1 (131) (83) Exceptional items included in operating profit Cost and efficiency programme costs In 2015 costs of US$14 million (2014: US$39 million) were incurred in relation to the cost and efficiency programme which will realise further benef its from the group's scale through the creation of a global business services function, that will consolidate many back office and specialist functions, and the expansion of the global procurement organisation. Integration and restructuring costs In 2015 a credit of US$29 million was realised relating to integration and restructuring in Australia, following the successful resolution of certain claims leading to the release of provisions. In 2014 US$64 million of integration and restructuring costs were incurred in Asia Pacific following the Foster's and the Pacific Beverages acquisitions, including impairments relating to the closure of a brewery. Profit on disposal of investment in associate In 2014 a profit of US$388 million, after associated costs, was realised on the disposal of the group's investment in the Tsogo Sun hotels and gaming business in South Africa. Share of associates' and joint ventures' exceptional items Restructuring costs In 2015 MillerCoors announced the closure of the Eden brewery with full effect from September 2016. Restructuring costs, including accelerated depreciation and severance costs, have been incurred of which the group's share amounted to US$23 million. Net taxation credits/(charges) relating to subsidiaries' and the group's share of associates' and joint ventures' exceptional items Net taxation credits of US$1 million (2014: charges of US$131 million) arose in relation to exceptional items during the period. 4. Taxation Six months Six months Year ended ended ended 30/9/15 30/9/14 31/3/15 Unaudited Unaudited Audited US$m US$m US$m Current taxation 546 737 1,415 - Charge for the period 534 737 1,390 - Adjustments in respect of prior periods 12 - 25 Withholding taxes and other remittance taxes 71 122 176 Total current taxation 617 859 1,591 Deferred taxation (47) (129) (318) - Credit for the period (46) (129) (330) - Adjustments in respect of prior periods (1) - 7 - Rate change - - 5 Taxation expense 570 730 1,273 Tax (credit)/charge relating to components of other comprehensive income is as follows: Deferred tax credit on net remeasurements of defined benefit plans - - (70) Deferred tax (credit)/charge on financial instruments (7) 8 3 (7) 8 (67) Effective tax rate (%) 26.5 26.0 26.0
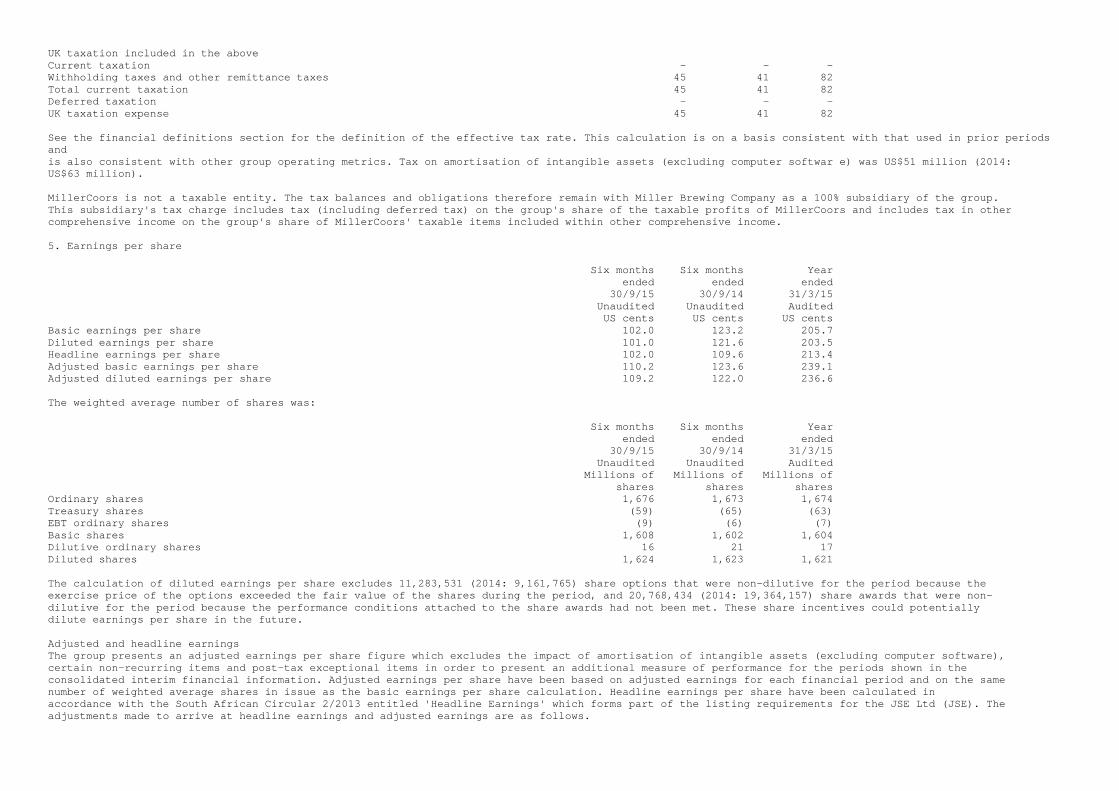
UK taxation included in the above Current taxation - - - Withholding taxes and other remittance taxes 45 41 82 Total current taxation 45 41 82 Deferred taxation - - - UK taxation expense 45 41 82 See the financial definitions section for the definition of the effective tax rate. This calculation is on a basis consistent with that used in prior periods and is also consistent with other group operating metrics. Tax on amortisation of intangible assets (excluding computer softwar e) was US$51 million (2014: US$63 million). MillerCoors is not a taxable entity. The tax balances and obligations therefore remain with Miller Brewing Company as a 100% subsidiary of the group. This subsidiary's tax charge includes tax (including deferred tax) on the group's share of the taxable profits of MillerCoors and includes tax in other comprehensive income on the group's share of MillerCoors' taxable items included within other comprehensive income. 5. Earnings per share Six months Six months Year ended ended ended 30/9/15 30/9/14 31/3/15 Unaudited Unaudited Audited US cents US cents US cents Basic earnings per share 102.0 123.2 205.7 Diluted earnings per share 101.0 121.6 203.5 Headline earnings per share 102.0 109.6 213.4 Adjusted basic earnings per share 110.2 123.6 239.1 Adjusted diluted earnings per share 109.2 122.0 236.6 The weighted average number of shares was: Six months Six months Year ended ended ended 30/9/15 30/9/14 31/3/15 Unaudited Unaudited Audited Millions of Millions of Millions of shares shares shares Ordinary shares 1,676 1,673 1,674 Treasury shares (59) (65) (63) EBT ordinary shares (9) (6) (7) Basic shares 1,608 1,602 1,604 Dilutive ordinary shares 16 21 17 Diluted shares 1,624 1,623 1,621 The calculation of diluted earnings per share excludes 11,283,531 (2014: 9,161,765) share options that were non-dilutive for the period because the exercise price of the options exceeded the fair value of the shares during the period, and 20,768,434 (2014: 19,364,157) share awards that were non- dilutive for the period because the performance conditions attached to the share awards had not been met. These share incentives could potentially dilute earnings per share in the future. Adjusted and headline earnings The group presents an adjusted earnings per share figure which excludes the impact of amortisation of intangible assets (excluding computer software), certain non-recurring items and post-tax exceptional items in order to present an additional measure of performance for the periods shown in the consolidated interim financial information. Adjusted earnings per share have been based on adjusted earnings for each financial period and on the same number of weighted average shares in issue as the basic earnings per share calculation. Headline earnings per share have been calculated in accordance with the South African Circular 2/2013 entitled 'Headline Earnings' which forms part of the listing requirements for the JSE Ltd (JSE). The adjustments made to arrive at headline earnings and adjusted earnings are as follows.
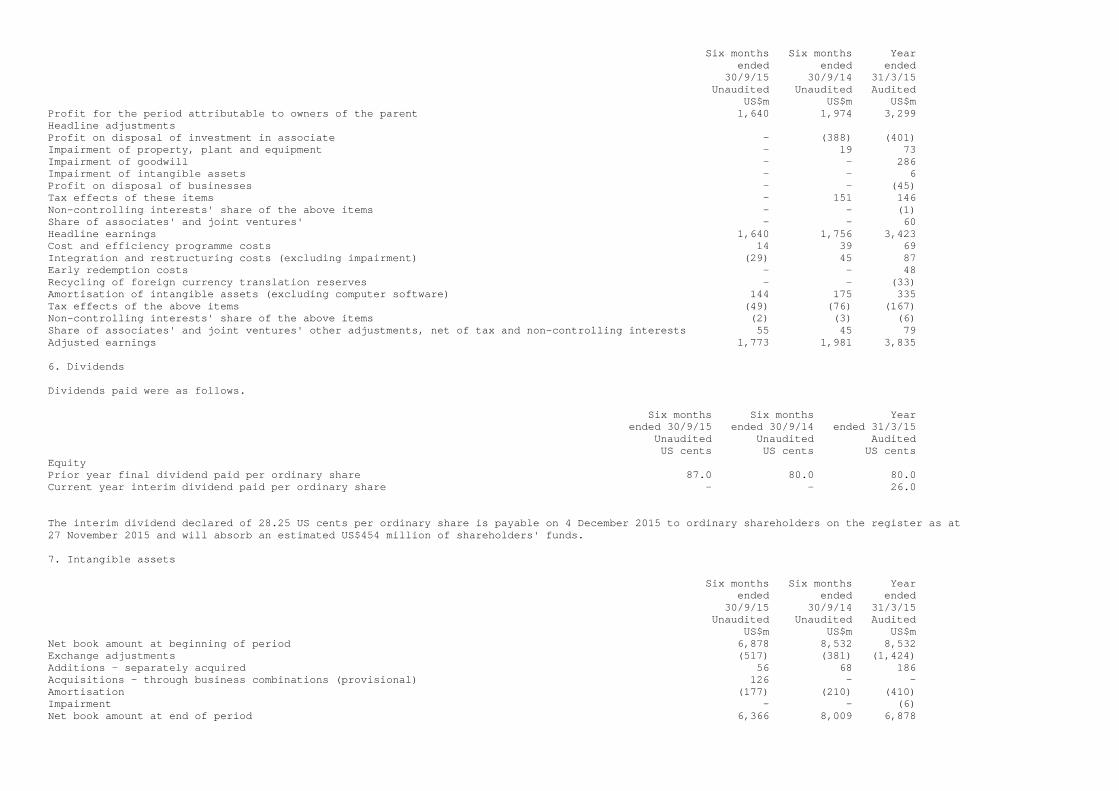
Six months Six months Year ended ended ended 30/9/15 30/9/14 31/3/15 Unaudited Unaudited Audited US$m US$m US$m Profit for the period attributable to owners of the parent 1,640 1,974 3,299 Headline adjustments Profit on disposal of investment in associate - (388) (401) Impairment of property, plant and equipment - 19 73 Impairment of goodwill - - 286 Impairment of intangible assets - - 6 Profit on disposal of businesses - - (45) Tax effects of these items - 151 146 Non-controlling interests' share of the above items - - (1) Share of associates' and joint ventures' - - 60 Headline earnings 1,640 1,756 3,423 Cost and efficiency programme costs 14 39 69 Integration and restructuring costs (excluding impairment) (29) 45 87 Early redemption costs - - 48 Recycling of foreign currency translation reserves - - (33) Amortisation of intangible assets (excluding computer software) 144 175 335 Tax effects of the above items (49) (76) (167) Non-controlling interests' share of the above items (2) (3) (6) Share of associates' and joint ventures' other adjustments, net of tax and non-controlling interests 55 45 79 Adjusted earnings 1,773 1,981 3,835 6. Dividends Dividends paid were as follows. Six months Six months Year ended 30/9/15 ended 30/9/14 ended 31/3/15 Unaudited Unaudited Audited US cents US cents US cents Equity Prior year final dividend paid per ordinary share 87.0 80.0 80.0 Current year interim dividend paid per ordinary share - - 26.0 The interim dividend declared of 28.25 US cents per ordinary share is payable on 4 December 2015 to ordinary shareholders on the register as at 27 November 2015 and will absorb an estimated US$454 million of shareholders' funds. 7. Intangible assets Six months Six months Year ended ended ended 30/9/15 30/9/14 31/3/15 Unaudited Unaudited Audited US$m US$m US$m Net book amount at beginning of period 6,878 8,532 8,532 Exchange adjustments (517) (381) (1,424) Additions - separately acquired 56 68 186 Acquisitions - through business combinations (provisional) 126 - - Amortisation (177) (210) (410) Impairment - - (6) Net book amount at end of period 6,366 8,009 6,878
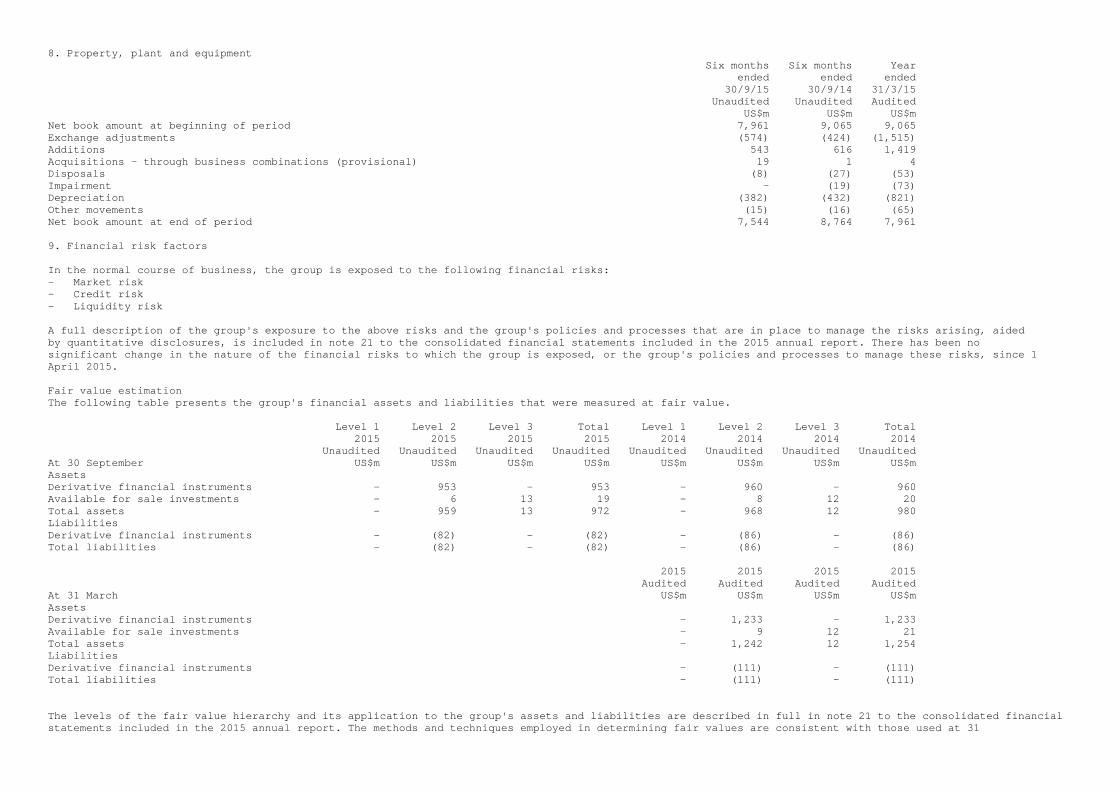
8. Property, plant and equipment Six months Six months Year ended ended ended 30/9/15 30/9/14 31/3/15 Unaudited Unaudited Audited US$m US$m US$m Net book amount at beginning of period 7,961 9,065 9,065 Exchange adjustments (574) (424) (1,515) Additions 543 616 1,419 Acquisitions - through business combinations (provisional) 19 1 4 Disposals (8) (27) (53) Impairment - (19) (73) Depreciation (382) (432) (821) Other movements (15) (16) (65) Net book amount at end of period 7,544 8,764 7,961 9. Financial risk factors In the normal course of business, the group is exposed to the following financial risks: - Market risk - Credit risk - Liquidity risk A full description of the group's exposure to the above risks and the group's policies and processes that are in place to manage the risks arising, aided by quantitative disclosures, is included in note 21 to the consolidated financial statements included in the 2015 annual report. There has been no significant change in the nature of the financial risks to which the group is exposed, or the group's policies and processes to manage these risks, since 1 April 2015. Fair value estimation The following table presents the group's financial assets and liabilities that were measured at fair value. Level 1 Level 2 Level 3 Total Level 1 Level 2 Level 3 Total 2015 2015 2015 2015 2014 2014 2014 2014 Unaudited Unaudited Unaudited Unaudited Unaudited Unaudited Unaudited Unaudited At 30 September US$m US$m US$m US$m US$m US$m US$m US$m Assets Derivative financial instruments - 953 - 953 - 960 - 960 Available for sale investments - 6 13 19 - 8 12 20 Total assets - 959 13 972 - 968 12 980 Liabilities Derivative financial instruments - (82) - (82) - (86) - (86) Total liabilities - (82) - (82) - (86) - (86) 2015 2015 2015 2015 Audited Audited Audited Audited At 31 March US$m US$m US$m US$m Assets Derivative financial instruments - 1,233 - 1,233 Available for sale investments - 9 12 21 Total assets - 1,242 12 1,254 Liabilities Derivative financial instruments - (111) - (111) Total liabilities - (111) - (111) The levels of the fair value hierarchy and its application to the group's assets and liabilities are described in full in note 21 to the consolidated financial statements included in the 2015 annual report. The methods and techniques employed in determining fair values are consistent with those used at 31
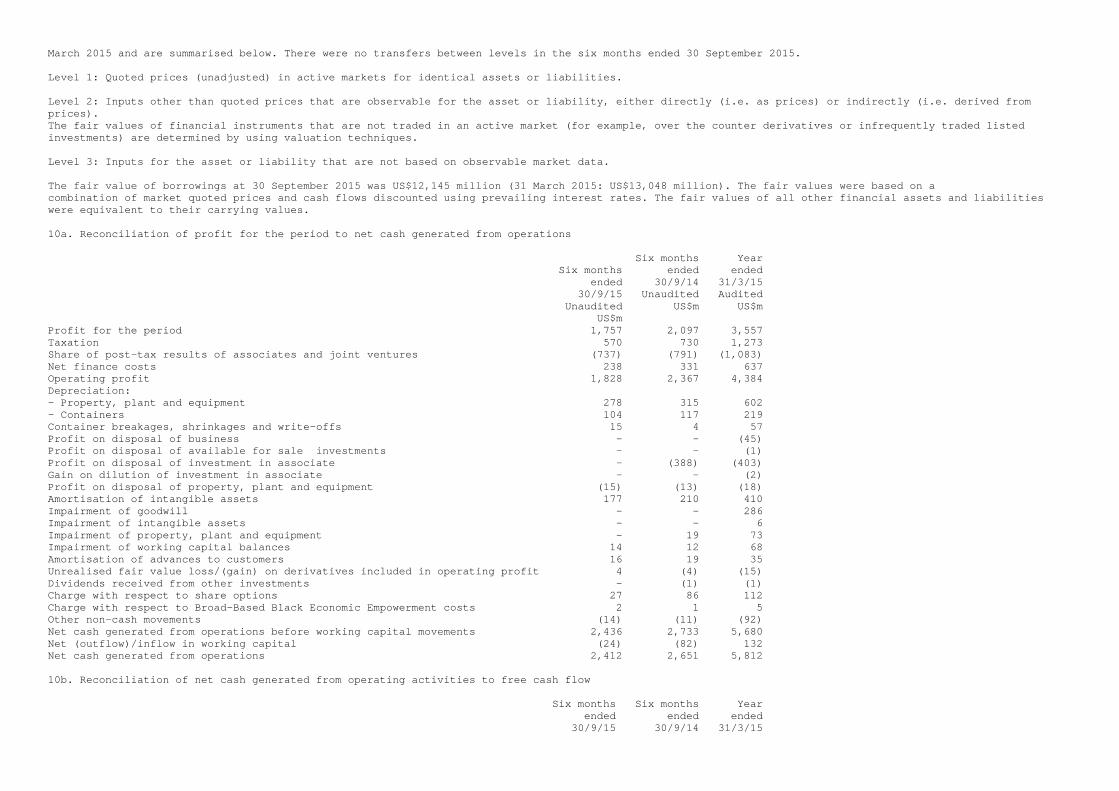
March 2015 and are summarised below. There were no transfers between levels in the six months ended 30 September 2015. Level 1: Quoted prices (unadjusted) in active markets for identical assets or liabilities. Level 2: Inputs other than quoted prices that are observable for the asset or liability, either directly (i.e. as prices) or indirectly (i.e. derived from prices). The fair values of financial instruments that are not traded in an active market (for example, over the counter derivatives or infrequently traded listed investments) are determined by using valuation techniques. Level 3: Inputs for the asset or liability that are not based on observable market data. The fair value of borrowings at 30 September 2015 was US$12,145 million (31 March 2015: US$13,048 million). The fair values were based on a combination of market quoted prices and cash flows discounted using prevailing interest rates. The fair values of all other financial assets and liabilities were equivalent to their carrying values. 10a. Reconciliation of profit for the period to net cash generated from operations Six months Year Six months ended ended ended 30/9/14 31/3/15 30/9/15 Unaudited Audited Unaudited US$m US$m US$m Profit for the period 1,757 2,097 3,557 Taxation 570 730 1,273 Share of post-tax results of associates and joint ventures (737) (791) (1,083) Net finance costs 238 331 637 Operating profit 1,828 2,367 4,384 Depreciation: - Property, plant and equipment 278 315 602 - Containers 104 117 219 Container breakages, shrinkages and write-offs 15 4 57 Profit on disposal of business - - (45) Profit on disposal of available for sale investments - - (1) Profit on disposal of investment in associate - (388) (403) Gain on dilution of investment in associate - - (2) Profit on disposal of property, plant and equipment (15) (13) (18) Amortisation of intangible assets 177 210 410 Impairment of goodwill - - 286 Impairment of intangible assets - - 6 Impairment of property, plant and equipment - 19 73 Impairment of working capital balances 14 12 68 Amortisation of advances to customers 16 19 35 Unrealised fair value loss/(gain) on derivatives included in operating profit 4 (4) (15) Dividends received from other investments - (1) (1) Charge with respect to share options 27 86 112 Charge with respect to Broad-Based Black Economic Empowerment costs 2 1 5 Other non-cash movements (14) (11) (92) Net cash generated from operations before working capital movements 2,436 2,733 5,680 Net (outflow)/inflow in working capital (24) (82) 132 Net cash generated from operations 2,412 2,651 5,812 10b. Reconciliation of net cash generated from operating activities to free cash flow Six months Six months Year ended ended ended 30/9/15 30/9/14 31/3/15
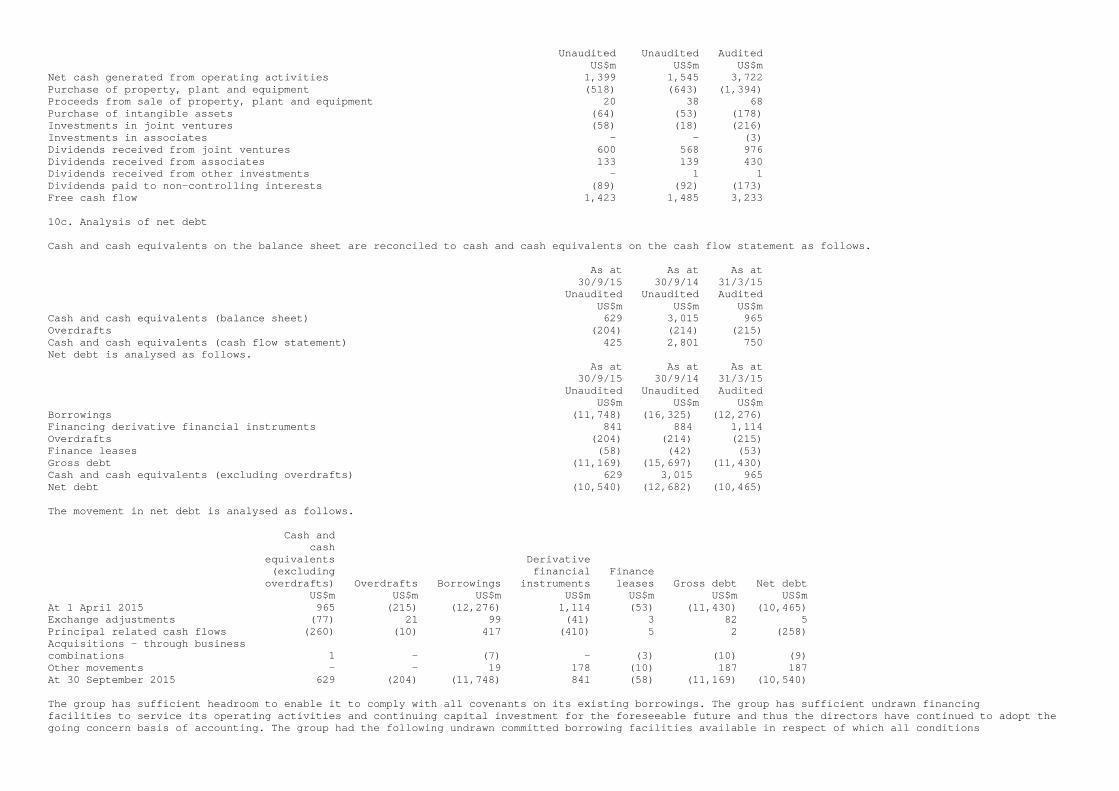
Unaudited Unaudited Audited US$m US$m US$m Net cash generated from operating activities 1,399 1,545 3,722 Purchase of property, plant and equipment (518) (643) (1,394) Proceeds from sale of property, plant and equipment 20 38 68 Purchase of intangible assets (64) (53) (178) Investments in joint ventures (58) (18) (216) Investments in associates - - (3) Dividends received from joint ventures 600 568 976 Dividends received from associates 133 139 430 Dividends received from other investments - 1 1 Dividends paid to non-controlling interests (89) (92) (173) Free cash flow 1,423 1,485 3,233 10c. Analysis of net debt Cash and cash equivalents on the balance sheet are reconciled to cash and cash equivalents on the cash flow statement as follows. As at As at As at 30/9/15 30/9/14 31/3/15 Unaudited Unaudited Audited US$m US$m US$m Cash and cash equivalents (balance sheet) 629 3,015 965 Overdrafts (204) (214) (215) Cash and cash equivalents (cash flow statement) 425 2,801 750 Net debt is analysed as follows. As at As at As at 30/9/15 30/9/14 31/3/15 Unaudited Unaudited Audited US$m US$m US$m Borrowings (11,748) (16,325) (12,276) Financing derivative financial instruments 841 884 1,114 Overdrafts (204) (214) (215) Finance leases (58) (42) (53) Gross debt (11,169) (15,697) (11,430) Cash and cash equivalents (excluding overdrafts) 629 3,015 965 Net debt (10,540) (12,682) (10,465) The movement in net debt is analysed as follows. Cash and cash equivalents Derivative (excluding financial Finance overdrafts) Overdrafts Borrowings instruments leases Gross debt Net debt US$m US$m US$m US$m US$m US$m US$m At 1 April 2015 965 (215) (12,276) 1,114 (53) (11,430) (10,465) Exchange adjustments (77) 21 99 (41) 3 82 5 Principal related cash flows (260) (10) 417 (410) 5 2 (258) Acquisitions – through business combinations 1 - (7) - (3) (10) (9) Other movements - - 19 178 (10) 187 187 At 30 September 2015 629 (204) (11,748) 841 (58) (11,169) (10,540) The group has sufficient headroom to enable it to comply with all covenants on its existing borrowings. The group has sufficient undrawn financing facilities to service its operating activities and continuing capital investment for the foreseeable future and thus the directors have continued to adopt the going concern basis of accounting. The group had the following undrawn committed borrowing facilities available in respect of which all conditions
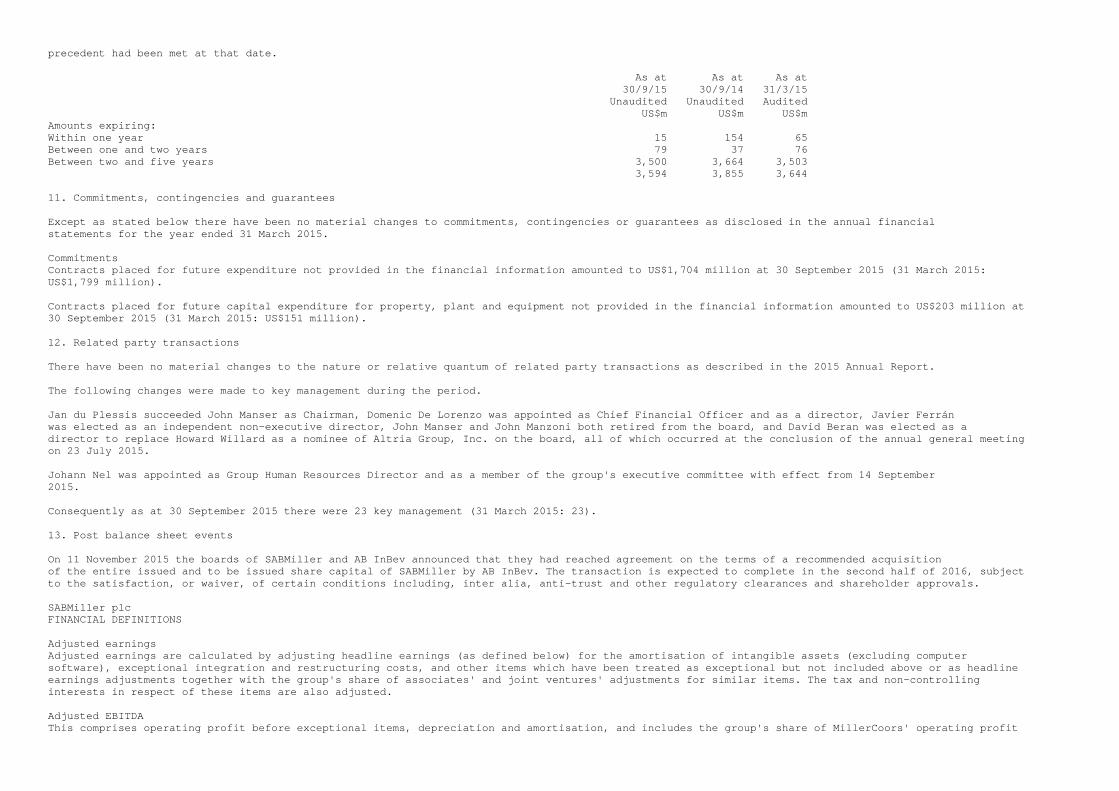
precedent had been met at that date. As at As at As at 30/9/15 30/9/14 31/3/15 Unaudited Unaudited Audited US$m US$m US$m Amounts expiring: Within one year 15 154 65 Between one and two years 79 37 76 Between two and five years 3,500 3,664 3,503 3,594 3,855 3,644 11. Commitments, contingencies and guarantees Except as stated below there have been no material changes to commitments, contingencies or guarantees as disclosed in the annual financial statements for the year ended 31 March 2015. Commitments Contracts placed for future expenditure not provided in the financial information amounted to US$1,704 million at 30 September 2015 (31 March 2015: US$1,799 million). Contracts placed for future capital expenditure for property, plant and equipment not provided in the financial information amounted to US$203 million at 30 September 2015 (31 March 2015: US$151 million). 12. Related party transactions There have been no material changes to the nature or relative quantum of related party transactions as described in the 2015 Annual Report. The following changes were made to key management during the period. Jan du Plessis succeeded John Manser as Chairman, Domenic De Lorenzo was appointed as Chief Financial Officer and as a director, Javier Ferrán was elected as an independent non-executive director, John Manser and John Manzoni both retired from the board, and David Beran was elected as a director to replace Howard Willard as a nominee of Altria Group, Inc. on the board, all of which occurred at the conclusion of the annual general meeting on 23 July 2015. Johann Nel was appointed as Group Human Resources Director and as a member of the group's executive committee with effect from 14 September 2015. Consequently as at 30 September 2015 there were 23 key management (31 March 2015: 23). 13. Post balance sheet events On 11 November 2015 the boards of SABMiller and AB InBev announced that they had reached agreement on the terms of a recommended acquisition of the entire issued and to be issued share capital of SABMiller by AB InBev. The transaction is expected to complete in the second half of 2016, subject to the satisfaction, or waiver, of certain conditions including, inter alia, anti-trust and other regulatory clearances and shareholder approvals. SABMiller plc FINANCIAL DEFINITIONS Adjusted earnings Adjusted earnings are calculated by adjusting headline earnings (as defined below) for the amortisation of intangible assets (excluding computer software), exceptional integration and restructuring costs, and other items which have been treated as exceptional but not included above or as headline earnings adjustments together with the group's share of associates' and joint ventures' adjustments for similar items. The tax and non-controlling interests in respect of these items are also adjusted. Adjusted EBITDA This comprises operating profit before exceptional items, depreciation and amortisation, and includes the group's share of MillerCoors' operating profit
on a similar basis. Adjusted net finance costs This comprises net finance costs excluding any exceptional finance charges or income. Adjusted profit before tax This comprises EBITA less adjusted net finance costs and less the group's share of associates' and joint ventures' net finance costs on a similar basis. Constant currency Constant currency results have been determined by translating the local currency denominated results for the six months ended 30 September at the exchange rates for the comparable period in the prior year. EBITA This comprises operating profit before exceptional items, and amortisation of intangible assets (excluding computer software) and includes the group's share of associates' and joint ventures' operating profit on a similar basis. EBITA margin (%) This is calculated by expressing EBITA as a percentage of group net producer revenue. EBITDA This comprises EBITA (as defined above) plus depreciation and amortisation of computer software, including the group's share of associates' and joint ventures' depreciation and amortisation of computer software. EBITDA margin (%) This is calculated by expressing EBITDA as a percentage of group net producer revenue. Effective tax rate (%) The effective tax rate is calculated by expressing tax before tax on exceptional items and on amortisation of intangible assets (excluding computer software), including the group's share of associates' and joint ventures' tax on a similar basis, as a percentage of adjusted profit before tax. Free cash flow This comprises net cash generated from operating activities less cash paid for the purchase of property, plant and equipment, and intangible assets, net investments in existing associates and joint ventures (in both cases only where there is no change in the group's effective ownership percentage) and dividends paid to non-controlling interests plus cash received from the sale of property, plant and equipment and intangible assets and dividends received. Group revenue This comprises revenue together with the group's share of revenue from associates and joint ventures. Group net producer revenue (NPR) This comprises group revenue less excise duties and other similar taxes, together with the group's share of excise duties and other similar taxes from associates and joint ventures. Headline earnings Headline earnings are calculated by adjusting profit for the financial period attributable to owners of the parent for items in accordance with the South African Circular 2/2013 entitled 'Headline Earnings'. Such items include impairments of non-current assets and profits or losses on disposals of non- current assets and their related tax and non-controlling interests. This also includes the group's share of associates' and joint ventures' adjustments on a similar basis. Interest cover This is the ratio of adjusted EBITDA to adjusted net finance costs. Net debt This comprises gross debt (including borrowings, financing derivative financial instruments, overdrafts and finance leases) net of cash and cash equivalents (excluding overdrafts). Organic information
Organic results and volumes exclude the first 12 months' results and volumes relating to acquisitions and the last 12 months' results and volumes relating to disposals. Sales volumes In the determination and disclosure of sales volumes, the group aggregates 100% of the volumes of all consolidated subsidiaries and its equity accounted percentage of all associates' and joint ventures' volumes. Contract brewing volumes are excluded from volumes although revenue from contract brewing is included within group revenue. Volumes exclude intra-group sales volumes. This measure of volumes is used for lager volumes, soft drinks volumes, other alcoholic beverage volumes and beverage volumes and is used in the segmental analyses as it more closely aligns with the consolidated group net producer revenue and EBITA disclosures. SABMiller plc COST AND EFFICIENCY PROGRAMME Cost and efficiency programme The following was announced on 9 October 2015: "SABMiller announces that it has increased its target annual run rate cost savings from its cost and efficiency programme, announced in May 2014, from US$500 million by 31 March 2018 to at least US$1,050 million by 31 March 2020. "The cost and efficiency programme, which covers SABMiller's integrated supply chain comprising procurement, manufacturing and distribution, delivered US$221 million of annualised savings in its first year to 31 March 2015, and is expected to deliver in excess of US$430 million of annualised savings in its second year to 31 March 2016. The original target issued in 2014 was US$500 million annualised savings by 2018. "The increase in annual run rate cost savings announced today, of at least US$550 million, will further build on the initial success of the 2014 programme and bring the aggregate annual run rate cost savings for this programme to at least US$1,050 million by 2020. This is across a total addressable cost base of approximately US$10 billion. "The additional savings will come from SABMiller's integrated supply chain, with approximately 70% of the additional savings announced today coming from procurement and 30% from manufacturing and distribution. The savings will mainly be realised by: - increasing the spend centrally managed by SABMiller's specialist procurement team to at least 90%, from 46% in the year ended 31 March 2014 and 69% for the year ended 31 March 2015; - completing the roll out of procurement operating models to increase efficiency through greater transparency, cost management, compliance and delivery of savings; and - driving further efficiencies in manufacturing and distribution based on best in class benchmarks and standardised processes. "SABMiller expects to incur incremental non-recurring costs of US$26 million in total by 2020 and no dis-benefits are expected to arise from the programme." Bases of belief and sources of information from the 9 October 2015 announcement: The cost and efficiency programme announced and launched in 2014 delivered cost savings of US$221 million by 31 March 2015 as disclosed in SABMiller's Annual Report and Accounts by reference to a total addressable cost base for the year ended 31 March 2014 of approximately US$10 billion. Total addressable cost base refers to all third party spend and labour force and infrastructure costs in manufacturing and distribution. The labour force costs in manufacturing include the group's share of relevant MillerCoors costs. The total addressable cost base excludes capital expenditure and depreciation. The incremental cost savings estimates shown above are based on savings compared to the group's cost base for the year to 31 March 2015 which was not materially different from that for the year to 31 March 2014. The estimated cost savings have been prepared based on internal information on costs by function, type and country and detailed analysis of the future operating model. The delivery of historical cost reduction programmes has also been taken into account in preparing these estimates. The estimates
have been prepared by functional and country teams, including senior executives in the organisation. These programmes have been developed over the past 6-12 months and have included input from external consultants. In circumstances where data has been limited for commercial or other reasons, estimates and assumptions have been developed to support the analysis. In arriving at the Quantified Financial Benefits Statement, the directors of SABMiller have assumed that: - there will be no change in the ownership or control of SABMiller; - there will be no material change to macroeconomic, political or legal conditions in the markets or regions in which in the SABMiller group operates which will materially impact on the implementation of or costs to achieve the proposed cost savings; and - there will be no material change in exchange rates or commodity prices. SABMiller plc FORWARD-LOOKING STATEMENTS This announcement does not constitute an offer to sell or issue or the solicitation of an offer to buy or acquire ordinary shares in the capital of SABMiller plc (the "company") or any other securities of the company or of any of its subsidiaries or associates in any jurisdiction or an inducement to enter into investment activity. This announcement is intended to provide information to shareholders. It should not be relied upon by any other party or for any other purpose. This announcement includes 'forward-looking statements' with respect to certain of SABMiller plc's plans, current goals and expectations relating to its future financial condition, performance and results. These statements contain the words "anticipate", "believe", "intend", "estimate", "expect" and words of similar meaning. All statements other than statements of historical facts included in this document, including, without limitation, those regarding the company's financial position, business strategy, plans and objectives of management for future operations (including development plans and objectives relating to the company's products and services) are forward-looking statements. Such forward-looking statements involve known and unknown risks, uncertainties and other important factors that could cause the actual results, performance or achievements of the company to be m aterially different from future results, performance or achievements expressed or implied by such forward-looking statements. Such forward-looking statements are based on numerous assumptions regarding the company's present and future business strategies and the environment in which the compa ny will operate in the future. These forward-looking statements speak only as at the date of this announcement. Factors which may cause differences between actual results and those expected or implied by the forward-looking statements include, but are not limited to: material adverse changes in the economic and business conditions in the markets in which SABMiller operates; increased competition and consolidation in the global brewing and beverages industry; changes in consumer preferences; changes to the regulatory environment; failure to deliver the integration and cost-saving objectives in relation to the CUB acquisition; failure to derive the expected benefits from the global efficiency programmes; and fluctuations in foreign curre ncy exchange rates and interest rates. The company expressly disclaims any obligation or undertaking to disseminate any updates or revisions to any forward-looking statements contained herein to reflect any change in the company's expectations with regard thereto or any change in events, conditions or circumstances on which any such statement is based. The past business and financial performance of SABMiller plc is not to be relied on as an indication of its future performance. SABMiller plc ADMINISTRATION SABMiller plc Incorporated in England and Wales (Registration No. 3528416) Group Company Secretary Stephen Shapiro Registered office SABMiller House Church Street West Woking Surrey, England GU21 6HS Telephone +44 1483 264000 Head office
One Stanhope Gate London, England W1K 1AF Telephone +44 20 7659 0100 Internet address www.sabmiller.com Investor relations Telephone +44 20 7659 0100 Email: [email protected] Sustainable development Telephone +44 1483 264134 Email: [email protected] Independent auditors PricewaterhouseCoopers LLP Chartered Accountants and Statutory Auditors 1 Embankment Place London, England WC2N 6RH Telephone +44 20 7583 5000 Registrar (United Kingdom) Equiniti Aspect House Spencer Road Lancing West Sussex, England BN99 6DA Telephone 0371 384 2395 Overseas telephone +44 121 415 7047 (outside UK) www.equiniti.com www.shareview.co.uk Registrar (South Africa) Computershare Investor Services (Proprietary) Limited 70 Marshall Street, Johannesburg PO Box 61051 Marshalltown 2107 South Africa Telephone +27 11 370 5000 United States ADR Depositary JP Morgan Depositary Bank 4 New York Plaza, floor 12 New York, NY 10004 Telephone +1 866 576 2377 Email: [email protected] Sponsor: J.P. Morgan Equities South Africa (Pty) Ltd