s n a p s h o t - · pdf fileeducation & health services 4.7 3.9 leisure & hospitality...
TRANSCRIPT

September 2017
S N A P S H O TA MONTHLY UPDATE OF THE FIFTH DISTRICT ECONOMY

September 2017 FEDERAL RESERVE BANK OF RICHMOND
TABLE OF CONTENTS
Data updated as of August 30, 2017
TABLE OF CONTENTS
S N A P S H O T A MONTHLY UPDATE OF THE FIFTH DISTRICT ECONOMY
South Carolina 1South Carolina 2South Carolina 4South Carolina 5
Virginia 1Virginia 2Virginia 4Virginia 5
West Virginia 1West Virginia 2West Virginia 4West Virginia 5
Sources 1Sources 2
Fifth District SummaryLabor Conditions Business ConditionsHousehold ConditionsReal Estate Conditions
District of ColumbiaSummary Labor ConditionsHousehold Conditions Real Estate Conditions
Maryland Summary Labor ConditionsHousehold Conditions Real Estate Conditions
North CarolinaSummary Labor ConditionsHousehold Conditions Real Estate Conditions
District 1District 2 District 3 District 4 District 4
D.C. 1D.C. 2D.C. 4D.C. 5
Maryland 1Maryland 2Maryland 4Maryland 5
North Carolina 1North Carolina 2North Carolina 4North Carolina 5
South CarolinaSummary Labor ConditionsHousehold Conditions Real Estate Conditions
Virginia Summary Labor ConditionsHousehold Conditions Real Estate Conditions
West Virginia Summary Labor ConditionsHousehold Conditions Real Estate Conditions
Sources & NotesData SourcesNotes
Contact InformationMichael Stanley Joseph Mengedoth(804) 697-8437 (804) [email protected] [email protected]

September 2017 FEDERAL RESERVE BANK OF RICHMOND
FIFTH DISTRICTSeptember Summary A Closer Look at… Total Wages and Salaries
FIFTH DISTRICT 1
S N A P S H O T A MONTHLY UPDATE OF THE FIFTH DISTRICT ECONOMY
Reports on the Fifth District economy were mostly positive in recent months. Payrollemployment rose throughout the District, business conditions remained favorable, andhousing market reports were somewhat upbeat.
Labor Markets: Employers in the Fifth District added 30,700 jobs (0.2 percent), on net, in July.The most jobs were added in North Carolina and Virginia; however, the largest percentagegain came from D.C. where payroll employment grew 0.6 percent. In the Fifth District onwhole, the education and health services and the professional and business servicesindustries added the most jobs in July. Four industries contracted in the month: information,financial services, “other” services, and government. On a year-over-year basis, payrollemployment rose 1.6 percent in July, which slightly outpaced the national rate of 1.5 percent.Job growth was reported in every industry except information and was led by theprofessional and business services industry, which expanded 3.6 percent. The unemploymentrate in the Fifth District was unchanged in July at 4.1 percent. Unemployment rates improvedin Maryland and North Carolina but edged higher in D.C., Virginia, and West Virginia; SouthCarolina’s jobless rate was unchanged in July.
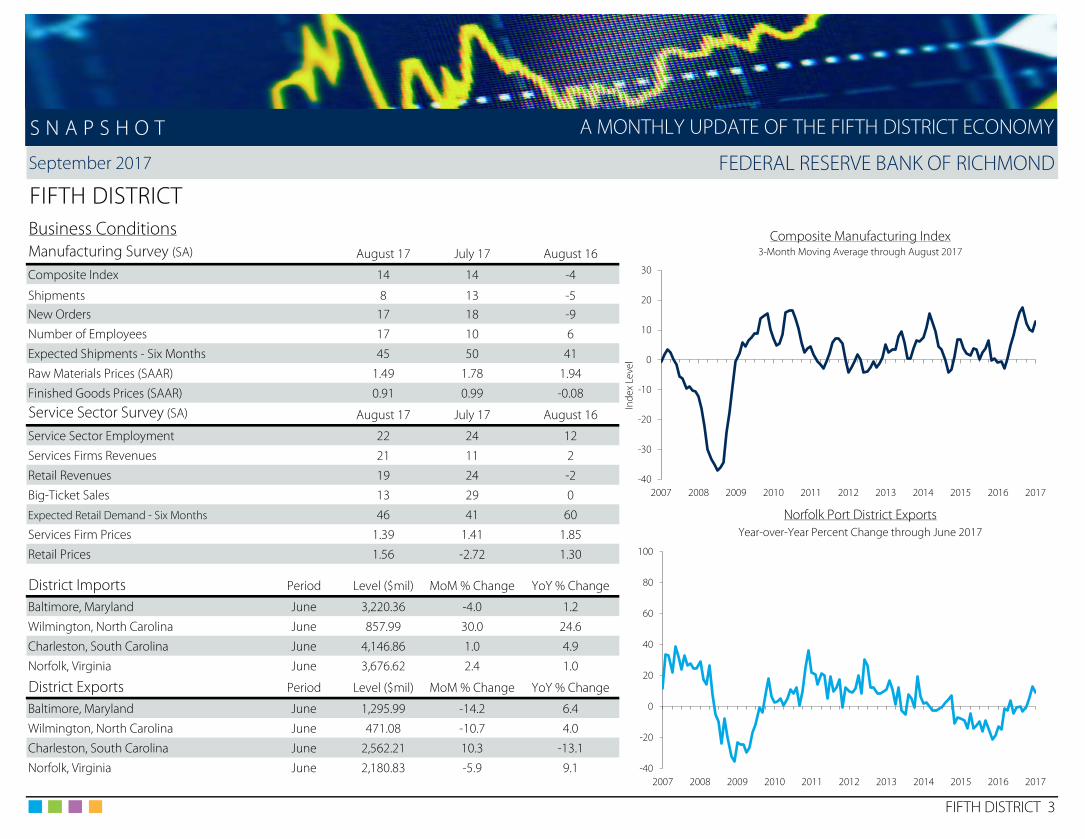
Business Conditions: According to our monthly survey, the composite diffusion index ofmanufacturing activity was unchanged at a value of 14 in August. The underlying componentindexes, however, exhibited some changes. The indexes for shipments and new orders edgedslightly lower while the index for employment rose from 10 to 17 in the month. According tothe service sector survey, the index for revenues strengthened from 12 in July to 22 in August.The index for employment in the service sector remained elevated at a reading of 22. Thesurvey measure of product demand over the next six months rose from 32 to 40 in August.Lastly, the survey measures of prices indicated a slight deceleration of price growth formanufacturers’ inputs and finished goods; non-retail services reported steady price growthwhile retail firms reported an acceleration in price growth.
Housing Markets: Fifth District jurisdictions issued a combined 14,160 new residential permitsin July, which was a 0.1 percent decrease from the prior month but a 12.6 percent increasefrom July 2016. Housing starts totaled 169,400 in July, which was an increase of 19.4 percentfrom the prior month but a decrease of 10.8 percent from last July. According to CoreLogicInformation Solutions, District home values appreciated 0.4 percent in June and 3.8 percentsince June 2016. -6
-4
-2
0
2
4
6
8
2003 2005 2007 2009 2011 2013 2015 2017
United States
Fifth District
Total Wage & Salary Growth in the Fifth DistrictYear-over-year percent change, through Q1:2017
Total Wages and Salaries by IndustryYoY% Change
Q1:2017Average Annual %
Change Since Q1:2012
Total 4.8 3.5
Natural Resources 1.7 -3.2
Construction 6.8 5.2
Manufacturing 3.7 2.6
Trade, Transportation & Utilities 3.3 3.3
Information 6.4 4.3
Financial Activities 6.4 5.5
Professional & Business Services 5.5 4.0
Education & Health Services 4.7 3.9
Leisure & Hospitality 4.0 5.2
Other 4.7 3.9
Government 4.4 2.2

September 2017 FEDERAL RESERVE BANK OF RICHMOND
FIFTH DISTRICTLabor Market Conditions Fifth District Payroll Employment Performance
Period Level (000s) MoM % Change YoY % Change Year-over-Year Percent Change in July 2017
United States - Total July 146,615.0 0.14 1.49
Fifth District - Total July 14,788.0 0.21 1.55Logging, Mining, and Construction July 739.8 0.04 1.90
Manufacturing July 1,095.9 0.39 0.81
Trade, Transportation, and Utilities July 2,517.8 0.03 0.49
Information July 225.9 -0.40 -5.68
Financial Activities July 741.3 -0.19 0.90
Professional and Business Services July 2,349.3 0.47 3.57
Education and Health Services July 2,143.1 0.78 2.96
Leisure and Hospitality July 1,579.5 0.44 2.21
Other Services July 672.4 -0.21 1.22
Government July 2,723.0 -0.21 0.48
Fifth District Unemployment RateJuly 17 June 17 July 16 Through July 2017
United States 4.3 4.4 4.9
Fifth District 4.1 4.1 4.6
Period Level (000s) MoM % Change YoY % Change
United States July 160,494 0.22 0.75
Fifth District July 15,960 0.01 1.42
Period Level MoM % Change YoY % Change
United States July 1,020,042 -0.74 -5.03
Fifth District July 63,451 -0.12 -5.58
FIFTH DISTRICT 2
Payroll Employment (SA)
Unemployment Rate (SA)
Civilian Labor Force (SA)
Initial Unemployment Claims (NSA)
S N A P S H O T
1.6
1.9
0.8
0.5
-5.7
0.9
3.6
3.0
2.2
1.2
0.5
-7 -6 -5 -4 -3 -2 -1 0 1 2 3 4 5
Fifth District - Total
Logging, Mining, and Construction
Manufacturing
Trade, Transportation, and Utilities
Information
Financial Activities
Professional and Business Services
Education and Health Services
Leisure and Hospitality
Other Services
Government
0
1
2
3
4
5
6
7
8
9
10
11
2007 2008 2009 2010 2011 2012 2013 2014 2015 2016 2017
United States
Fifth District
A MONTHLY UPDATE OF THE FIFTH DISTRICT ECONOMY
September 2017 FEDERAL RESERVE BANK OF RICHMOND
FIFTH DISTRICTBusiness Conditions Composite Manufacturing IndexManufacturing Survey (SA) August 17 July 17 August 16 3-Month Moving Average through August 2017
Composite Index 14 14 -4
Shipments 8 13 -5New Orders 17 18 -9
Number of Employees 17 10 6
Expected Shipments - Six Months 45 50 41
Raw Materials Prices (SAAR) 1.49 1.78 1.94
Finished Goods Prices (SAAR) 0.91 0.99 -0.08
Service Sector Survey (SA) August 17 July 17 August 16
Service Sector Employment 22 24 12
Services Firms Revenues 21 11 2
Retail Revenues 19 24 -2
Big-Ticket Sales 13 29 0
Expected Retail Demand - Six Months 46 41 60 Norfolk Port District ExportsServices Firm Prices 1.39 1.41 1.85 Year-over-Year Percent Change through June 2017
Retail Prices 1.56 -2.72 1.30
District Imports Period Level ($mil) MoM % Change YoY % Change
Baltimore, Maryland June 3,220.36 -4.0 1.2
Wilmington, North Carolina June 857.99 30.0 24.6
Charleston, South Carolina June 4,146.86 1.0 4.9
Norfolk, Virginia June 3,676.62 2.4 1.0
District Exports Period Level ($mil) MoM % Change YoY % Change
Baltimore, Maryland June 1,295.99 -14.2 6.4
Wilmington, North Carolina June 471.08 -10.7 4.0
Charleston, South Carolina June 2,562.21 10.3 -13.1
Norfolk, Virginia June 2,180.83 -5.9 9.1
FIFTH DISTRICT 3
S N A P S H O T
-40
-20
0
20
40
60
80
100
2007 2008 2009 2010 2011 2012 2013 2014 2015 2016 2017
-40
-30
-20
-10
0
10
20
30
2007 2008 2009 2010 2011 2012 2013 2014 2015 2016 2017
Inde
x Le
vel
A MONTHLY UPDATE OF THE FIFTH DISTRICT ECONOMY

September 2017 FEDERAL RESERVE BANK OF RICHMOND
FIFTH DISTRICTHousehold Conditions Fifth District Real Personal IncomeReal Personal Income (SA) Period Level ($mil) QoQ % Change YoY % Change Year-over-Year Percent Change through Q1:17
United States Q1:17 14,566,707 0.42 1.72
Fifth District Q1:17 1,411,126 0.55 2.36
Non-Business Bankruptcies Period Level QoQ % Change YoY % Change
United States Q2:17 203,976 4.33 0.81
Fifth District Q2:17 16,650 0.08 -0.93
Real Estate Conditions
Permits: New Private Housing Units (NSA) Period Level MoM % Change YoY % Change
United States July 101,005 -21.01 6.18 Fifth District New Housing UnitsFifth District July 14,160 -0.07 12.63 Year-over-Year Percent Change through July 2017
Total Private Housing Starts (SAAR) Period Level (000s) MoM % Change YoY % Change
United States July 1,155 -4.78 -5.56
Fifth District July 149.4 19.43 -10.83
House Price Index (2000=100) Period Level MoM % Change YoY % Change
United States June 192 1.11 6.73
Fifth District June 193 0.42 3.79
FIFTH DISTRICT 4
S N A P S H O T A MONTHLY UPDATE OF THE FIFTH DISTRICT ECONOMY
-6
-4
-2
0
2
4
6
2007 2008 2009 2010 2011 2012 2013 2014 2015 2016 2017
United StatesFifth District
-60
-40
-20
0
20
40
60
80
2007 2008 2009 2010 2011 2012 2013 2014 2015 2016 2017

September 2017 FEDERAL RESERVE BANK OF RICHMOND
DISTRICT OF COLUMBIASeptember Summary A Closer Look at… Total Wages and Salaries
DISTRICT OF COLUMBIA 1
S N A P S H O T
A MONTHLY UPDATE OF THE FIFTH DISTRICT ECONOMYS N A P S H O T
Recent economic reports on the District of Columbia were mostly upbeat. Total payrollemployment grew substantially; however, the household unemployment rate rose modestly.Meanwhile, housing market indicators were generally positive.
Labor Markets: Payroll employment in D.C. grew substantially (0.6 percent) in July as firmsadded 4,700 jobs. The job growth was driven by the professional and business services andleisure and hospitality industries, which added 1,900 jobs each. Jobs were also added in thefinancial services (500 jobs), government (500 jobs), and education and health services (500jobs) industries. Since July 2016, total employment in D.C. expanded 2.4 percent, whichoutpaced the national growth rate of 1.5 percent. Three industries accounted for the majorityof jobs added since last July; the leisure and hospitality industry added 8,300 jobs, followed bythe education and health services (5,900 jobs) and professional and business services (4,800jobs) industries. The only other sectors to add jobs on a year-over-year basis were the logging,mining, and construction industry and the government sector, which added 300 jobs and800 jobs, respectively.
Household Conditions: The unemployment rate in the District of Columbia rose 0.3percentage point in July to 6.4 percent as the number of unemployed increased 3.8 percentin the month. In the Washington, D.C. MSA, the unemployment rate ticked up 0.1 percentagepoint in July, to 3.7 percent. In the second quarter of 2017, the share of mortgages in theDistrict of Columbia with payments 90 or more days past due fell 0.2 percentage point to 1.1percent. Delinquency rates for fixed and adjustable rate conventional loans also declined inthe second quarter to 0.7 percent and 2.0 percent, respectively. In the first quarter of 2017,real personal income in D.C. rose 0.5 percent and increased 2.4 percent since the first quarterof 2016.
Housing Markets: D.C. issued 455 new residential permits in July, up from 389 permits in Juneand up from the 67 permits issued in July 2016. In the greater Washington, D.C. MSA, 2,314permits were issued in the month, a decrease of 4.9 percent from June but an increase of 48.6percent since last July. Meanwhile, housing starts in D.C. totaled 4,800 in July, up 39.9 percentfrom June and up significantly from the 900 housing starts in July 2016. According toCoreLogic Information Solutions, home values in D.C. were little changed in June butappreciated 4.0 percent on a year-over-year basis. In the Washington, D.C. metro area, houseprices rose 1.1 percent in June and 4.9 percent on a year-over-year basis.
A MONTHLY UPDATE OF THE FIFTH DISTRICT ECONOMY
-6
-4
-2
0
2
4
6
8
10
2003 2005 2007 2009 2011 2013 2015 2017
United States
District of Columbia
Total Wage & Salary Growth in the District of ColumbiaYear-over-year percent change, through Q1:2017
Total Wages and Salaries by IndustryYoY% Change
Q1:2017Average Annual %
Change Since Q1:2012
Total 2.7 3.4
Construction 0.5 3.4
Manufacturing 1.4 3.6
Trade, Transportation & Utilities 0.7 4.2
Information 3.5 3.2
Financial Activities -2.6 5.2
Professional & Business Services 0.9 3.4
Education & Health Services 6.0 5.7
Leisure & Hospitality 5.5 6.7
Other 2.1 4.0
Government 3.8 1.9

September 2017 FEDERAL RESERVE BANK OF RICHMOND
DISTRICT OF COLUMBIALabor Market Conditions District of Columbia Payroll Employment PerformancePayroll Employment (SA) Period Level (000s) MoM % Change YoY % Change Year-over-Year Percent Change in July 2017
United States - Total July 146,615.0 0.14 1.49
Fifth District - Total July 14,788.0 0.21 1.55
District of Columbia - Total July 797.1 0.59 2.40Logging, Mining, and Construction July 14.6 -0.68 2.10
Manufacturing (NSA) July 1.2 0.00 0.00
Trade, Transportation, and Utilities July 32.6 -0.61 -0.91
Information July 16.6 -1.19 -1.78
Financial Activities July 29.8 1.71 -1.32
Professional and Business Services July 170.0 1.13 2.91
Education and Health Services July 138.8 0.36 4.44
Leisure and Hospitality July 82.8 2.35 11.14
Other Services July 72.0 -0.14 -0.55
Government July 238.7 0.21 0.34 District of Columbia Total Employment Performance
Washington, D.C. MSA July 3,321.5 0.27 2.57 Year-over-Year Percent Change in July 2017
DISTRICT OF COLUMBIA 2
S N A P S H O T
2.4
2.1
0.0
-0.9
-1.8
-1.3
2.9
4.4
11.1
-0.6
0.3
-5 0 5 10 15
District of Columbia - Total
Logging, Mining, and Construction
Manufacturing (NSA)
Trade, Transportation, and Utilities
Information
Financial Activities
Professional and Business Services
Education and Health Services
Leisure and Hospitality
Other Services
Government
A MONTHLY UPDATE OF THE FIFTH DISTRICT ECONOMY
2.6
2.4
1.6
1.5
0.0 0.5 1.0 1.5 2.0 2.5 3.0
Washington, D.C. MSA
District of Columbia
Fifth District
United States

September 2017 FEDERAL RESERVE BANK OF RICHMOND
DISTRICT OF COLUMBIALabor Market Conditions District of Columbia Unemployment RateUnemployment Rate (SA) July 17 June 17 July 16 Through July 2017
United States 4.3 4.4 4.9
Fifth District 4.1 4.1 4.6
District of Columbia 6.4 6.1 6.0Washington, D.C. MSA 3.7 3.6 3.8
Civilian Labor Force (SA) Period Level (000s) MoM % Change YoY % Change
United States July 160,494 0.22 0.75
Fifth District July 15,960 0.01 1.42
District of Columbia July 403 0.00 2.88
Washington, D.C. MSA July 3,404 0.24 2.89
Initial Unemployment Claims (NSA) Period Level MoM % Change YoY % Change
United States July 1,020,042 -0.74 -5.03
Fifth District July 63,451 -0.12 -5.58 District of Columbia Labor ForceDistrict of Columbia July 1,684 -8.97 1.94 Year-over-Year Percent Change through July 2017
DISTRICT OF COLUMBIA 3
S N A P S H O T A MONTHLY UPDATE OF THE FIFTH DISTRICT ECONOMY
3
4
5
6
7
8
9
10
11
12
2007 2008 2009 2010 2011 2012 2013 2014 2015 2016 2017
United States
District of Columbia
-2
-1
0
1
2
3
4
5
6
7
2007 2008 2009 2010 2011 2012 2013 2014 2015 2016 2017
United States
District of Columbia

September 2017 FEDERAL RESERVE BANK OF RICHMOND
DISTRICT OF COLUMBIAHousehold Conditions District of Columbia Real Personal IncomeReal Personal Income (SA) Period Level ($mil) QoQ % Change YoY % Change Year-over-Year Percent Change through Q1:17
United States Q1:17 14,566,707 0.42 1.72
Fifth District Q1:17 1,411,126 0.55 2.36
District of Columbia Q1:17 46,994 0.49 2.37
Median Family Income Period Level (000s) QoQ % Change YoY % Change
Washington, D.C. MSA 2017 107.6 --- 1.80
Non-Business Bankruptcies Period Level QoQ % Change YoY % Change
United States Q2:17 203,976 4.33 0.81
Fifth District Q2:17 16,650 0.08 -0.93
District of Columbia Q2:17 189 9.88 8.00
Mortgage Delinquencies (% 90+ Days Delinquent) Q2:17 Q1:17 Q2:16
United States District of Columbia Mortgage DelinquenciesAll Mortgages 1.20 1.37 1.47 Percent 90+ Days Delinquent through Q2:17
Conventional - Fixed Rate 0.92 1.11 1.10
Conventional - Adjustable Rate 2.12 2.39 2.68
District of Columbia
All Mortgages 1.10 1.26 1.21
Conventional - Fixed Rate 0.74 0.91 0.83
Conventional - Adjustable Rate 1.99 2.14 2.33
DISTRICT OF COLUMBIA 4
S N A P S H O T A MONTHLY UPDATE OF THE FIFTH DISTRICT ECONOMY
-6
-4
-2
0
2
4
6
8
10
2007 2008 2009 2010 2011 2012 2013 2014 2015 2016 2017
United States
District of Columbia
0
1
2
3
4
5
6
2007 2008 2009 2010 2011 2012 2013 2014 2015 2016 2017
United States
District of Columbia

September 2017 FEDERAL RESERVE BANK OF RICHMOND
DISTRICT OF COLUMBIAReal Estate Conditions Washington, D.C. MSA New Housing UnitsPermits: New Private Housing Units (NSA) Period Level MoM % Change YoY % Change Year-over-Year Percent Change through July 2017
United States July 101,005 -21.01 6.18
Fifth District July 14,160 -0.07 12.63
District of Columbia July 455 16.97 579.10Washington, D.C. MSA July 2,314 -4.85 48.62
Total Private Housing Starts (SAAR) Period Level (000s) MoM % Change YoY % Change
United States July 1,155 -4.78 -5.56
Fifth District July 149 19.43 -10.83
District of Columbia July 4.8 39.94 439.33
District of Columbia Housing StartsThousands of Units (SAAR) July 2017
DISTRICT OF COLUMBIA 5
S N A P S H O T A MONTHLY UPDATE OF THE FIFTH DISTRICT ECONOMY
-100
-50
0
50
100
150
200
250
2007 2008 2009 2010 2011 2012 2013 2014 2015 2016 2017
0
2
4
6
8
10
12
14
2007 2008 2009 2010 2011 2012 2013 2014 2015 2016 2017

September 2017 FEDERAL RESERVE BANK OF RICHMOND
DISTRICT OF COLUMBIAReal Estate Conditions District of Columbia House Price Index (CoreLogic)House Price Index (2000=100) Period Level MoM % Change YoY % Change Year-over-Year Percent Change through June 2017
United States June 192 1.11 6.73
Fifth District June 193 0.42 3.79
District of Columbia June 310 0.04 4.00Washington, D.C. MSA June 233 1.09 4.92
Median Home Sales Price - NAR (NSA) Period Level ($000s) QoQ % Change YoY % Change
Washington, D.C. MSA Q2:17 429 11.79 5.36
Median Home Sales Price - NAHB Period Level ($000s) QoQ % Change YoY % Change
Washington, D.C. MSA Q2:17 354 -1.67 -8.05
Housing Opportunity Index (%) Q2:17 Q1:17 Q2:16
Washington, D.C. MSA 70.5 69.2 66.2
Washington, D.C. MSA Office Vacancy RateCommercial Vacancy Rates (%) Q2:17 Q1:17 Q2:16 Through Q2:17
Office Vacancies
Washington, D.C. MSA 15.6 15.2 15.7
Industrial Vacancies
Washington, D.C. MSA 10.6 11.1 11.4
Retail Vacancies
Washington, D.C. MSA 5.6 5.4 5.4
DISTRICT OF COLUMBIA 6
S N A P S H O T A MONTHLY UPDATE OF THE FIFTH DISTRICT ECONOMY
8
9
10
11
12
13
14
15
16
17
2007 2008 2009 2010 2011 2012 2013 2014 2015 2016 2017
-20
-15
-10
-5
0
5
10
15
2007 2008 2009 2010 2011 2012 2013 2014 2015 2016 2017
United States
District of Columbia
September 2017 FEDERAL RESERVE BANK OF RICHMOND
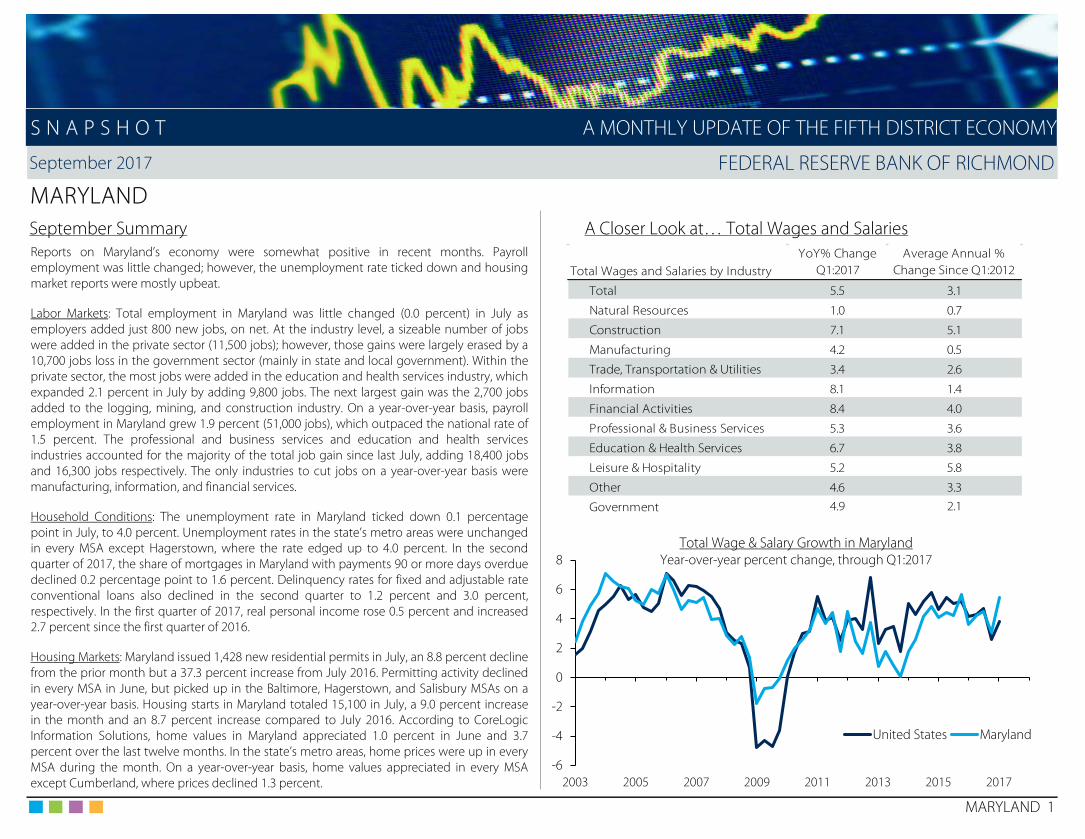
MARYLANDSeptember Summary A Closer Look at… Total Wages and Salaries
MARYLAND 1
S N A P S H O T A MONTHLY UPDATE OF THE FIFTH DISTRICT ECONOMY
Reports on Maryland’s economy were somewhat positive in recent months. Payrollemployment was little changed; however, the unemployment rate ticked down and housingmarket reports were mostly upbeat.
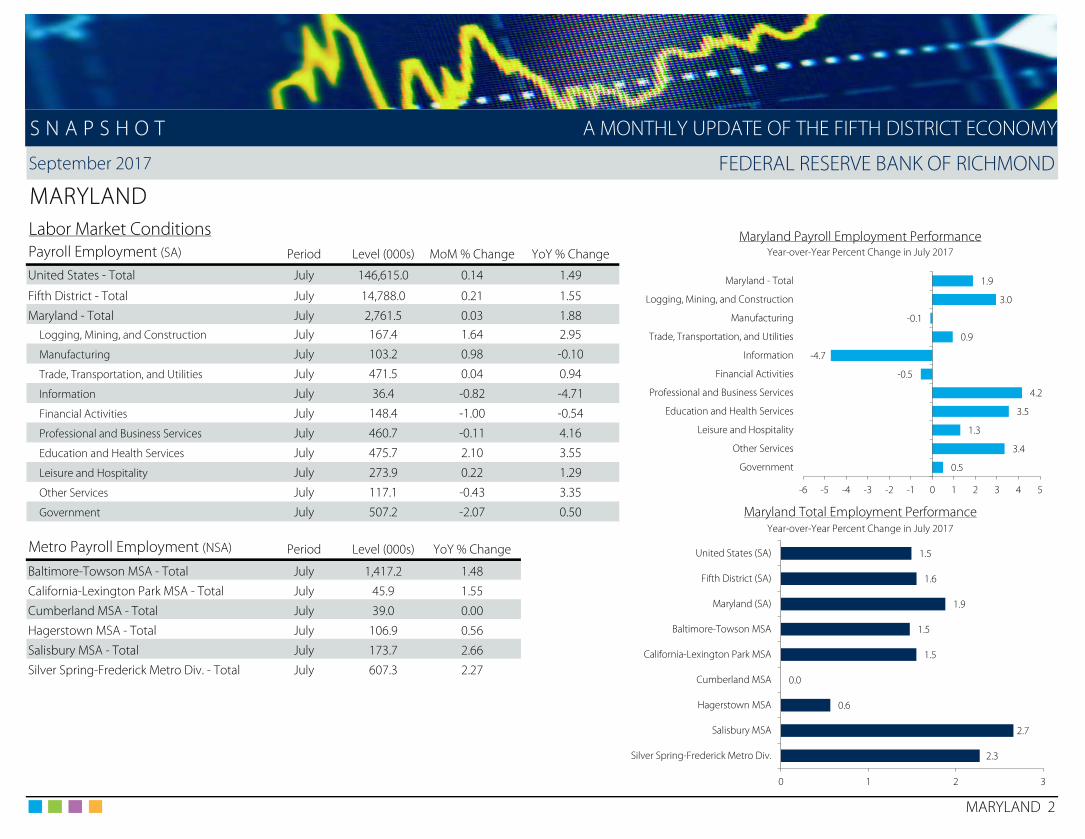
Labor Markets: Total employment in Maryland was little changed (0.0 percent) in July asemployers added just 800 new jobs, on net. At the industry level, a sizeable number of jobswere added in the private sector (11,500 jobs); however, those gains were largely erased by a10,700 jobs loss in the government sector (mainly in state and local government). Within theprivate sector, the most jobs were added in the education and health services industry, whichexpanded 2.1 percent in July by adding 9,800 jobs. The next largest gain was the 2,700 jobsadded to the logging, mining, and construction industry. On a year-over-year basis, payrollemployment in Maryland grew 1.9 percent (51,000 jobs), which outpaced the national rate of1.5 percent. The professional and business services and education and health servicesindustries accounted for the majority of the total job gain since last July, adding 18,400 jobsand 16,300 jobs respectively. The only industries to cut jobs on a year-over-year basis weremanufacturing, information, and financial services.
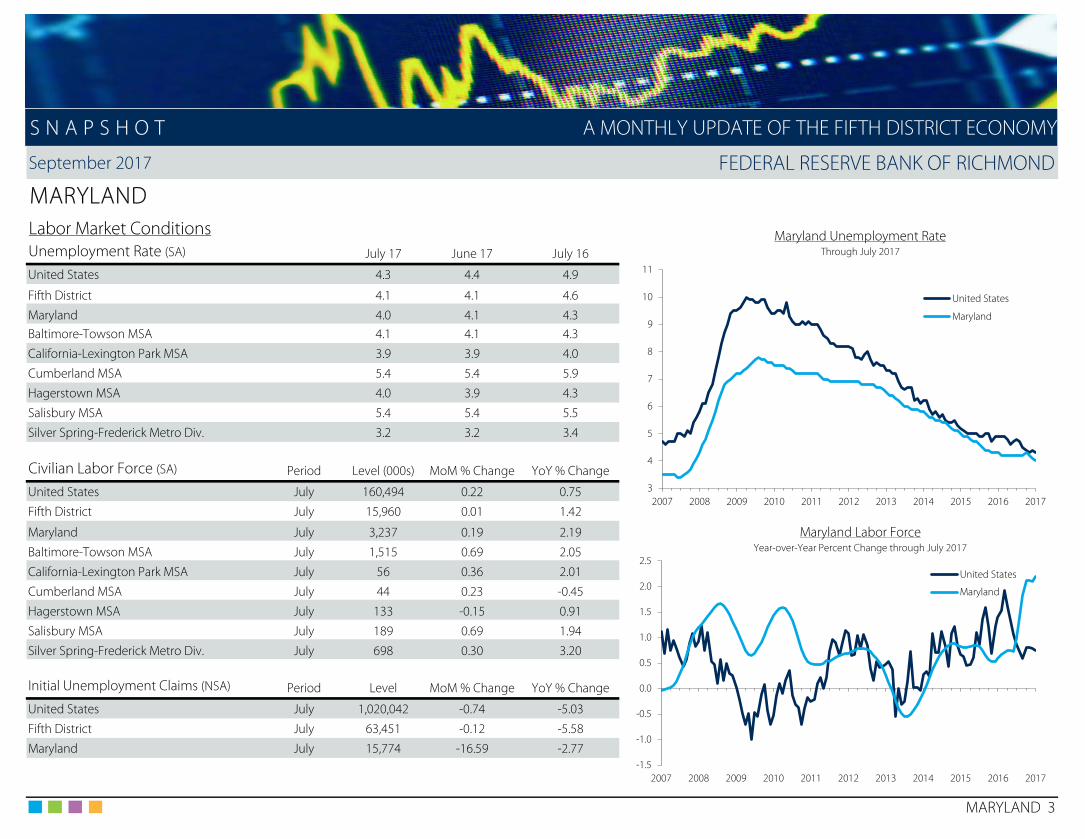
Household Conditions: The unemployment rate in Maryland ticked down 0.1 percentagepoint in July, to 4.0 percent. Unemployment rates in the state’s metro areas were unchangedin every MSA except Hagerstown, where the rate edged up to 4.0 percent. In the secondquarter of 2017, the share of mortgages in Maryland with payments 90 or more days overduedeclined 0.2 percentage point to 1.6 percent. Delinquency rates for fixed and adjustable rateconventional loans also declined in the second quarter to 1.2 percent and 3.0 percent,respectively. In the first quarter of 2017, real personal income rose 0.5 percent and increased2.7 percent since the first quarter of 2016.
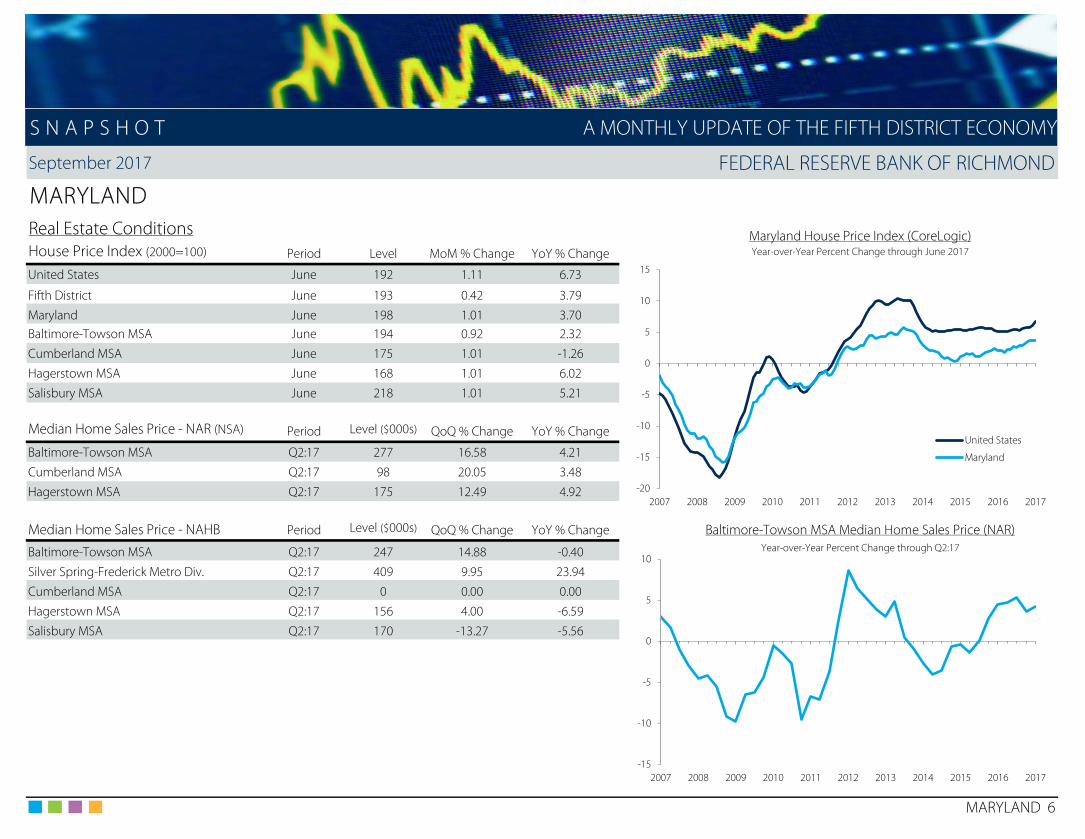
Housing Markets: Maryland issued 1,428 new residential permits in July, an 8.8 percent declinefrom the prior month but a 37.3 percent increase from July 2016. Permitting activity declinedin every MSA in June, but picked up in the Baltimore, Hagerstown, and Salisbury MSAs on ayear-over-year basis. Housing starts in Maryland totaled 15,100 in July, a 9.0 percent increasein the month and an 8.7 percent increase compared to July 2016. According to CoreLogicInformation Solutions, home values in Maryland appreciated 1.0 percent in June and 3.7percent over the last twelve months. In the state’s metro areas, home prices were up in everyMSA during the month. On a year-over-year basis, home values appreciated in every MSAexcept Cumberland, where prices declined 1.3 percent.
-6
-4
-2
0
2
4
6
8
2003 2005 2007 2009 2011 2013 2015 2017
United States Maryland
Total Wage & Salary Growth in MarylandYear-over-year percent change, through Q1:2017
Total Wages and Salaries by IndustryYoY% Change
Q1:2017Average Annual %
Change Since Q1:2012
Total 5.5 3.1
Natural Resources 1.0 0.7
Construction 7.1 5.1
Manufacturing 4.2 0.5
Trade, Transportation & Utilities 3.4 2.6
Information 8.1 1.4
Financial Activities 8.4 4.0
Professional & Business Services 5.3 3.6
Education & Health Services 6.7 3.8
Leisure & Hospitality 5.2 5.8
Other 4.6 3.3
Government 4.9 2.1
September 2017 FEDERAL RESERVE BANK OF RICHMOND
MARYLANDLabor Market Conditions Maryland Payroll Employment PerformancePayroll Employment (SA) Period Level (000s) MoM % Change YoY % Change Year-over-Year Percent Change in July 2017
United States - Total July 146,615.0 0.14 1.49
Fifth District - Total July 14,788.0 0.21 1.55
Maryland - Total July 2,761.5 0.03 1.88Logging, Mining, and Construction July 167.4 1.64 2.95
Manufacturing July 103.2 0.98 -0.10
Trade, Transportation, and Utilities July 471.5 0.04 0.94
Information July 36.4 -0.82 -4.71
Financial Activities July 148.4 -1.00 -0.54
Professional and Business Services July 460.7 -0.11 4.16
Education and Health Services July 475.7 2.10 3.55
Leisure and Hospitality July 273.9 0.22 1.29
Other Services July 117.1 -0.43 3.35
Government July 507.2 -2.07 0.50 Maryland Total Employment PerformanceYear-over-Year Percent Change in July 2017
Metro Payroll Employment (NSA) Period Level (000s) YoY % Change
Baltimore-Towson MSA - Total July 1,417.2 1.48
California-Lexington Park MSA - Total July 45.9 1.55
Cumberland MSA - Total July 39.0 0.00
Hagerstown MSA - Total July 106.9 0.56
Salisbury MSA - Total July 173.7 2.66
Silver Spring-Frederick Metro Div. - Total July 607.3 2.27
MARYLAND 2
S N A P S H O T
1.9
3.0
-0.1
0.9
-4.7
-0.5
4.2
3.5
1.3
3.4
0.5
-6 -5 -4 -3 -2 -1 0 1 2 3 4 5
Maryland - Total
Logging, Mining, and Construction
Manufacturing
Trade, Transportation, and Utilities
Information
Financial Activities
Professional and Business Services
Education and Health Services
Leisure and Hospitality
Other Services
Government
A MONTHLY UPDATE OF THE FIFTH DISTRICT ECONOMY
2.3
2.7
0.6
0.0
1.5
1.5
1.9
1.6
1.5
0 1 2 3
Silver Spring-Frederick Metro Div.
Salisbury MSA
Hagerstown MSA
Cumberland MSA
California-Lexington Park MSA
Baltimore-Towson MSA
Maryland (SA)
Fifth District (SA)
United States (SA)
September 2017 FEDERAL RESERVE BANK OF RICHMOND
MARYLANDLabor Market Conditions Maryland Unemployment RateUnemployment Rate (SA) July 17 June 17 July 16 Through July 2017
United States 4.3 4.4 4.9
Fifth District 4.1 4.1 4.6
Maryland 4.0 4.1 4.3Baltimore-Towson MSA 4.1 4.1 4.3
California-Lexington Park MSA 3.9 3.9 4.0
Cumberland MSA 5.4 5.4 5.9
Hagerstown MSA 4.0 3.9 4.3
Salisbury MSA 5.4 5.4 5.5
Silver Spring-Frederick Metro Div. 3.2 3.2 3.4
Civilian Labor Force (SA) Period Level (000s) MoM % Change YoY % Change
United States July 160,494 0.22 0.75
Fifth District July 15,960 0.01 1.42
Maryland July 3,237 0.19 2.19 Maryland Labor ForceBaltimore-Towson MSA July 1,515 0.69 2.05 Year-over-Year Percent Change through July 2017
California-Lexington Park MSA July 56 0.36 2.01
Cumberland MSA July 44 0.23 -0.45
Hagerstown MSA July 133 -0.15 0.91
Salisbury MSA July 189 0.69 1.94
Silver Spring-Frederick Metro Div. July 698 0.30 3.20
Initial Unemployment Claims (NSA) Period Level MoM % Change YoY % Change
United States July 1,020,042 -0.74 -5.03
Fifth District July 63,451 -0.12 -5.58
Maryland July 15,774 -16.59 -2.77
MARYLAND 3
S N A P S H O T A MONTHLY UPDATE OF THE FIFTH DISTRICT ECONOMY
3
4
5
6
7
8
9
10
11
2007 2008 2009 2010 2011 2012 2013 2014 2015 2016 2017
United States
Maryland
-1.5
-1.0
-0.5
0.0
0.5
1.0
1.5
2.0
2.5
2007 2008 2009 2010 2011 2012 2013 2014 2015 2016 2017
United States
Maryland

September 2017 FEDERAL RESERVE BANK OF RICHMOND
MARYLANDHousehold Conditions Maryland Real Personal IncomeReal Personal Income (SA) Period Level ($mil) QoQ % Change YoY % Change Year-over-Year Percent Change through Q1:17
United States Q1:17 14,566,707 0.42 1.72
Fifth District Q1:17 1,411,126 0.55 2.36
Maryland Q1:17 319,339 0.53 2.74
Median Family Income Period Level (000s) QoQ % Change YoY % Change
Baltimore-Towson MSA 2017 91.1 --- 5.07
Silver Spring-Frederick Metro Div. 2017 114.2 --- 1.06
Cumberland MSA 2017 0.0 --- 0.00
Hagerstown MSA 2017 67.6 --- -3.29
Salisbury MSA 2017 68.8 --- 10.97
Non-Business Bankruptcies Period Level QoQ % Change YoY % Change
United States Q2:17 203,976 4.33 0.81
Fifth District Q2:17 16,650 0.08 -0.93 Maryland Mortgage DelinquenciesMaryland Q2:17 4,472 -1.76 -1.58 Percent 90+ Days Delinquent through Q2:17
Mortgage Delinquencies (% 90+ Days Delinquent) Q2:17 Q1:17 Q2:16
United States All Mortgages 1.20 1.37 1.47
Conventional - Fixed Rate 0.92 1.11 1.10
Conventional - Adjustable Rate 2.12 2.39 2.68
Maryland
All Mortgages 1.56 1.80 1.91
Conventional - Fixed Rate 1.20 1.47 1.41
Conventional - Adjustable Rate 3.03 3.38 3.69
MARYLAND 4
S N A P S H O T A MONTHLY UPDATE OF THE FIFTH DISTRICT ECONOMY
-6
-4
-2
0
2
4
6
2007 2008 2009 2010 2011 2012 2013 2014 2015 2016 2017
United States
Maryland
0
1
2
3
4
5
6
2007 2008 2009 2010 2011 2012 2013 2014 2015 2016 2017
United States
Maryland

September 2017 FEDERAL RESERVE BANK OF RICHMOND
MARYLANDReal Estate Conditions Maryland New Housing UnitsPermits: New Private Housing Units (NSA) Period Level MoM % Change YoY % Change Year-over-Year Percent Change through July 2017
United States July 101,005 -21.01 6.18
Fifth District July 14,160 -0.07 12.63
Maryland July 1,428 -8.75 37.31Baltimore-Towson MSA July 430 -27.24 3.37
Cumberland MSA July 6 -66.67 ---
Hagerstown MSA July 100 -10.71 28.21
Salisbury MSA July 254 -29.25 23.90
Total Private Housing Starts (SAAR) Period Level (000s) MoM % Change YoY % Change
United States July 1,155 -4.78 -5.56
Fifth District July 149 19.43 -10.83
Maryland July 15.1 9.04 8.73
Maryland Housing StartsThousands of Units (SAAR) July 2017
MARYLAND 5
S N A P S H O T A MONTHLY UPDATE OF THE FIFTH DISTRICT ECONOMY
-100
-50
0
50
100
150
200
2007 2008 2009 2010 2011 2012 2013 2014 2015 2016 2017
0
5
10
15
20
25
30
35
2007 2008 2009 2010 2011 2012 2013 2014 2015 2016 2017
September 2017 FEDERAL RESERVE BANK OF RICHMOND
MARYLANDReal Estate Conditions Maryland House Price Index (CoreLogic)House Price Index (2000=100) Period Level MoM % Change YoY % Change Year-over-Year Percent Change through June 2017
United States June 192 1.11 6.73
Fifth District June 193 0.42 3.79
Maryland June 198 1.01 3.70Baltimore-Towson MSA June 194 0.92 2.32
Cumberland MSA June 175 1.01 -1.26
Hagerstown MSA June 168 1.01 6.02
Salisbury MSA June 218 1.01 5.21
Median Home Sales Price - NAR (NSA) Period Level ($000s) QoQ % Change YoY % Change
Baltimore-Towson MSA Q2:17 277 16.58 4.21
Cumberland MSA Q2:17 98 20.05 3.48
Hagerstown MSA Q2:17 175 12.49 4.92
Median Home Sales Price - NAHB Period Level ($000s) QoQ % Change YoY % Change Baltimore-Towson MSA Median Home Sales Price (NAR)
Baltimore-Towson MSA Q2:17 247 14.88 -0.40 Year-over-Year Percent Change through Q2:17
Silver Spring-Frederick Metro Div. Q2:17 409 9.95 23.94
Cumberland MSA Q2:17 0 0.00 0.00
Hagerstown MSA Q2:17 156 4.00 -6.59
Salisbury MSA Q2:17 170 -13.27 -5.56
MARYLAND 6
S N A P S H O T A MONTHLY UPDATE OF THE FIFTH DISTRICT ECONOMY
-20
-15
-10
-5
0
5
10
15
2007 2008 2009 2010 2011 2012 2013 2014 2015 2016 2017
United States
Maryland
-15
-10
-5
0
5
10
2007 2008 2009 2010 2011 2012 2013 2014 2015 2016 2017

September 2017 FEDERAL RESERVE BANK OF RICHMOND
MARYLANDReal Estate Conditions Baltimore-Towson MSA Office Vacancy RateHousing Opportunity Index (%) Q2:17 Q1:17 Q2:16 Through Q2:17
Baltimore-Towson MSA 77.6 80.5 74.8
Silver Spring-Frederick Metro Div. 64.6 69.8 77.9
Cumberland MSA 0.0 0.0 97.9Hagerstown MSA 86.7 89.7 85.0
Salisbury MSA 84.8 74.5 80.1
Commercial Vacancy Rates (%) Q2:17 Q1:17 Q2:16
Office Vacancies
Baltimore-Towson MSA 12.3 12.6 12.7
Retail Vacancies
Baltimore-Towson MSA 6.0 5.9 5.8
Industrial Vacancies
Baltimore-Towson MSA 11.5 12.0 13.4
Suburban Maryland (Washington, D.C. MSA) --- --- 11.7 Baltimore-Towson MSA Industrial Vacancy RateThrough Q2:17
MARYLAND 7
S N A P S H O T A MONTHLY UPDATE OF THE FIFTH DISTRICT ECONOMY
11
12
13
14
15
16
17
2007 2008 2009 2010 2011 2012 2013 2014 2015 2016 2017
11
12
13
14
15
16
17
18
2007 2008 2009 2010 2011 2012 2013 2014 2015 2016 2017

September 2017 FEDERAL RESERVE BANK OF RICHMOND
NORTH CAROLINASeptember Summary A Closer Look at… Total Wages and Salaries
NORTH CAROLINA 1
S N A P S H O T A MONTHLY UPDATE OF THE FIFTH DISTRICT ECONOMY
According to recent data, North Carolina’s economy continued to improve. Totalemployment rose and the unemployment rate declined; meanwhile, recent housing marketreports were somewhat positive.
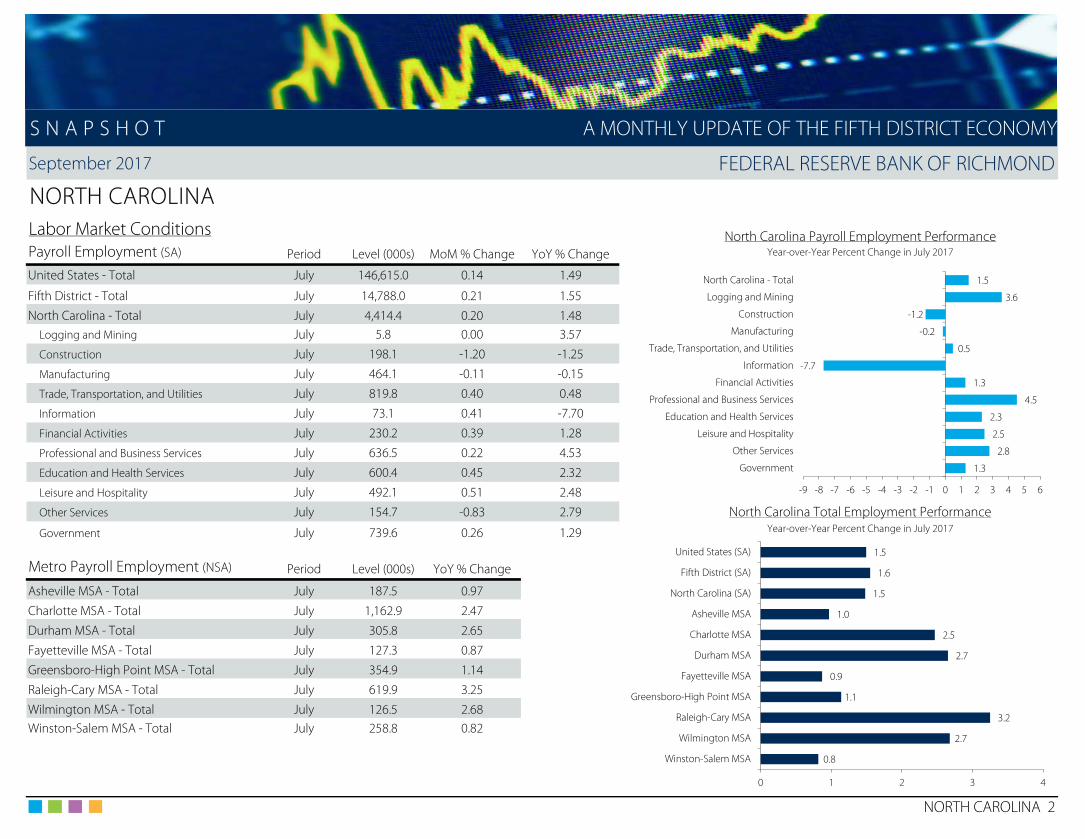
Labor Markets: Payroll employment in North Carolina rose 0.2 percent in July as firms added8,800 net new jobs in the month. The trade, transportation, and utilities industry added themost jobs in July (3,300 jobs), followed by education and health services (2,700 jobs) andleisure and hospitality (2,500 jobs). Only three industries contracted in the month; theconstruction industry cut 2,400 jobs while the “other” services industry cut 1,300 jobs andmanufacturers trimmed 500 jobs from payrolls. On a year-over-year basis, total employmentin North Carolina grew 1.5 percent, which matched the national rate. The professional andbusiness services industry continued to report the largest employment gain, in bothabsolute (27,600 jobs) and percentage terms (4.5 percent). Three industries cut jobs since lastJuly: construction (2,500 jobs), manufacturing (700 jobs), and information (6,100 jobs).
Household Conditions: North Carolina’s unemployment rate fell 0.1 percentage point to 4.1percent in July. Unemployment rates were unchanged or marginally lower in July in everyMSA except Asheville, where the rate ticked up 0.1 percentage point to 3.4 percent. In thesecond quarter of 2017, the share of North Carolina mortgages with payments 90 or moredays past due fell 0.1 percentage point to 1.3 percent. Delinquency rates for fixed andadjustable rate conventional loans also declined in the second quarter to 1.0 percent and 1.9percent, respectively. In the first quarter of 2017, real personal income in North Carolina rose0.6 percent and was 2.4 percent higher than in the first quarter of 2016.
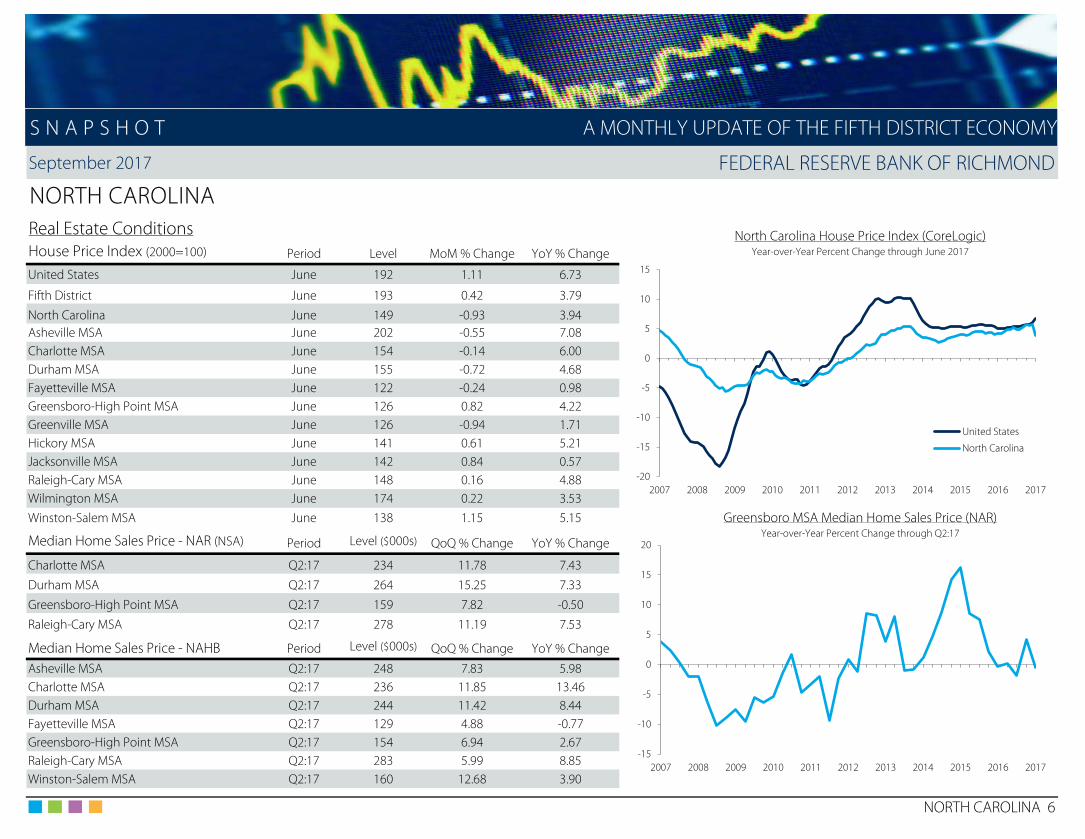
Housing Markets: North Carolina issued 6,242 new residential permits in July, up 15.4 percentfrom the prior month and up 5.4 percent from July 2016. Metro area permitting activityvaried in the month and on a year-over-year basis; however, permitting activity picked upover both periods in the Greensboro, Jacksonville, and Winston-Salem MSAs. North Carolinahousing starts totaled 65,900 in July, up 37.9 percent from June but down 16.6 percent on ayear-over-year basis. According to CoreLogic Information Solutions, North Carolina homevalues depreciated 0.9 percent in June but appreciated 3.9 percent since June 2016. Houseprice growth in the state’s metro areas varied in the month; however, prices rose in everyMSA on a year-over-year basis.
-8
-6
-4
-2
0
2
4
6
8
10
2003 2005 2007 2009 2011 2013 2015 2017
United States
North Carolina
Total Wage & Salary Growth in North CarolinaYear-over-year percent change, through Q1:2017
Total Wages and Salaries by IndustryYoY% Change
Q1:2017Average Annual %
Change Since Q1:2012
Total 5.2 4.5
Natural Resources 1.5 4.0
Construction 8.0 7.1
Manufacturing 3.1 3.1
Trade, Transportation & Utilities 3.7 4.3
Information 7.5 7.1
Financial Activities 8.8 7.7
Professional & Business Services 5.3 5.7
Education & Health Services 3.1 3.9
Leisure & Hospitality 3.6 5.4
Other 8.1 4.9
Government 6.8 2.3
September 2017 FEDERAL RESERVE BANK OF RICHMOND
NORTH CAROLINALabor Market Conditions North Carolina Payroll Employment PerformancePayroll Employment (SA) Period Level (000s) MoM % Change YoY % Change Year-over-Year Percent Change in July 2017
United States - Total July 146,615.0 0.14 1.49
Fifth District - Total July 14,788.0 0.21 1.55
North Carolina - Total July 4,414.4 0.20 1.48Logging and Mining July 5.8 0.00 3.57
Construction July 198.1 -1.20 -1.25
Manufacturing July 464.1 -0.11 -0.15
Trade, Transportation, and Utilities July 819.8 0.40 0.48
Information July 73.1 0.41 -7.70
Financial Activities July 230.2 0.39 1.28
Professional and Business Services July 636.5 0.22 4.53
Education and Health Services July 600.4 0.45 2.32
Leisure and Hospitality July 492.1 0.51 2.48
Other Services July 154.7 -0.83 2.79 North Carolina Total Employment Performance
Government July 739.6 0.26 1.29 Year-over-Year Percent Change in July 2017
Metro Payroll Employment (NSA) Period Level (000s) YoY % Change
Asheville MSA - Total July 187.5 0.97
Charlotte MSA - Total July 1,162.9 2.47
Durham MSA - Total July 305.8 2.65
Fayetteville MSA - Total July 127.3 0.87
Greensboro-High Point MSA - Total July 354.9 1.14
Raleigh-Cary MSA - Total July 619.9 3.25
Wilmington MSA - Total July 126.5 2.68Winston-Salem MSA - Total July 258.8 0.82
NORTH CAROLINA 2
S N A P S H O T
1.5
3.6
-1.2
-0.2
0.5
-7.7
1.3
4.5
2.3
2.5
2.8
1.3
-9 -8 -7 -6 -5 -4 -3 -2 -1 0 1 2 3 4 5 6
North Carolina - Total
Logging and Mining
Construction
Manufacturing
Trade, Transportation, and Utilities
Information
Financial Activities
Professional and Business Services
Education and Health Services
Leisure and Hospitality
Other Services
Government
A MONTHLY UPDATE OF THE FIFTH DISTRICT ECONOMY
0.8
2.7
3.2
1.1
0.9
2.7
2.5
1.0
1.5
1.6
1.5
0 1 2 3 4
Winston-Salem MSA
Wilmington MSA
Raleigh-Cary MSA
Greensboro-High Point MSA
Fayetteville MSA
Durham MSA
Charlotte MSA
Asheville MSA
North Carolina (SA)
Fifth District (SA)
United States (SA)

September 2017 FEDERAL RESERVE BANK OF RICHMOND
NORTH CAROLINALabor Market Conditions North Carolina Unemployment RateUnemployment Rate (SA) July 17 June 17 July 16 Through July 2017
United States 4.3 4.4 4.9
Fifth District 4.1 4.1 4.6
North Carolina 4.1 4.2 4.9Asheville MSA 3.4 3.3 4.0Charlotte MSA 3.8 3.9 4.6Durham MSA 3.6 3.7 4.3Fayetteville MSA 5.1 5.2 6.1Greensboro-High Point MSA 4.3 4.3 5.0Raleigh-Cary MSA 3.6 3.6 4.2Wilmington MSA 3.9 3.9 4.6Winston-Salem MSA 3.9 4.0 4.7
Civilian Labor Force (SA) Period Level (000s) MoM % Change YoY % Change
United States July 160,494 0.22 0.75
Fifth District July 15,960 0.01 1.42 North Carolina Labor ForceNorth Carolina July 4,901 -0.16 0.77 Year-over-Year Percent Change through July 2017
Asheville MSA July 226 -0.22 0.53Charlotte MSA July 1,308 0.22 1.94Durham MSA July 295 0.51 2.19Fayetteville MSA July 147 0.62 -0.20Greensboro-High Point MSA July 367 -0.08 0.38Raleigh-Cary MSA July 698 0.65 2.69Wilmington MSA July 146 0.69 1.46Winston-Salem MSA July 322 0.28 0.16
Initial Unemployment Claims (NSA) Period Level MoM % Change YoY % Change
United States July 1,020,042 -0.74 -5.03
Fifth District July 63,451 -0.12 -5.58
North Carolina July 12,536 -9.70 -19.40
NORTH CAROLINA 3
S N A P S H O T A MONTHLY UPDATE OF THE FIFTH DISTRICT ECONOMY
3
4
5
6
7
8
9
10
11
12
2007 2008 2009 2010 2011 2012 2013 2014 2015 2016 2017
United States
North Carolina
-2
-1
0
1
2
3
2007 2008 2009 2010 2011 2012 2013 2014 2015 2016 2017
United States
North Carolina

September 2017 FEDERAL RESERVE BANK OF RICHMOND
NORTH CAROLINAHousehold Conditions North Carolina Real Personal IncomeReal Personal Income (SA) Period Level ($mil) QoQ % Change YoY % Change Year-over-Year Percent Change through Q1:17
United States Q1:17 14,566,707 0.42 1.72
Fifth District Q1:17 1,411,126 0.55 2.36
North Carolina Q1:17 390,224 0.56 2.40
Median Family Income Period Level (000s) QoQ % Change YoY % Change
Asheville MSA 2017 61.3 --- 5.87
Charlotte MSA 2017 70.7 --- 5.52
Durham MSA 2017 73.3 --- -2.14
Fayetteville MSA 2017 52.3 --- 0.19
Greensboro-High Point MSA 2017 57.2 --- 0.00
Raleigh-Cary MSA 2017 80.2 --- 4.70
Winston-Salem MSA 2017 56.9 --- -2.74
Non-Business Bankruptcies Period Level QoQ % Change YoY % Change North Carolina Mortgage Delinquencies
United States Q2:17 203,976 4.33 0.81 Percent 90+ Days Delinquent through Q2:17
Fifth District Q2:17 16,650 0.08 -0.93
North Carolina Q2:17 3,662 2.46 -3.53
Mortgage Delinquencies (% 90+ Days Delinquent) Q2:17 Q1:17 Q2:16
United StatesAll Mortgages 1.20 1.37 1.47
Conventional - Fixed Rate 0.92 1.11 1.10
Conventional - Adjustable Rate 2.12 2.39 2.68
North Carolina - All Mortgages
All Mortgages 1.26 1.40 1.45
Conventional - Fixed Rate 0.95 1.10 1.05
Conventional - Adjustable Rate 1.90 2.03 2.32
NORTH CAROLINA 4
S N A P S H O T A MONTHLY UPDATE OF THE FIFTH DISTRICT ECONOMY
-6
-4
-2
0
2
4
6
8
2007 2008 2009 2010 2011 2012 2013 2014 2015 2016 2017
United States
North Carolina
0
1
2
3
4
5
6
2007 2008 2009 2010 2011 2012 2013 2014 2015 2016 2017
United States
North Carolina

September 2017 FEDERAL RESERVE BANK OF RICHMOND
NORTH CAROLINAReal Estate Conditions North Carolina New Housing UnitsPermits: New Private Housing Units (NSA) Period Level MoM % Change YoY % Change Year-over-Year Percent Change through July 2017
United States July 101,005 -21.01 6.18
Fifth District July 14,160 -0.07 12.63
North Carolina July 6,242 15.38 5.40Asheville MSA July 259 -15.36 57.93
Charlotte MSA July 2,054 37.12 -12.48
Durham MSA July 371 -11.46 5.70
Fayetteville MSA July 63 -25.88 28.57
Greensboro-High Point MSA July 357 6.25 128.85
Greenville MSA July 37 -13.95 -75.66
Hickory MSA July 0 25.00 ---
Jacksonville MSA July 88 18.92 15.79
Raleigh-Cary MSA July 1,140 -11.70 -31.57
Wilmington MSA July 118 -32.95 51.28
Winston-Salem MSA July 398 75.33 379.52 North Carolina Housing StartsThousands of Units (SAAR) July 2017
Total Private Housing Starts (SAAR) Period Level (000s) MoM % Change YoY % Change
United States July 1,155 -4.78 -5.56
Fifth District July 149 19.43 -10.83
North Carolina July 65.9 37.90 -16.55
NORTH CAROLINA 5
S N A P S H O T A MONTHLY UPDATE OF THE FIFTH DISTRICT ECONOMY
-80
-60
-40
-20
0
20
40
60
80
100
120
2007 2008 2009 2010 2011 2012 2013 2014 2015 2016 2017
0
20
40
60
80
100
120
140
2007 2008 2009 2010 2011 2012 2013 2014 2015 2016 2017
September 2017 FEDERAL RESERVE BANK OF RICHMOND
NORTH CAROLINAReal Estate Conditions North Carolina House Price Index (CoreLogic)House Price Index (2000=100) Period Level MoM % Change YoY % Change Year-over-Year Percent Change through June 2017
United States June 192 1.11 6.73
Fifth District June 193 0.42 3.79
North Carolina June 149 -0.93 3.94Asheville MSA June 202 -0.55 7.08Charlotte MSA June 154 -0.14 6.00Durham MSA June 155 -0.72 4.68Fayetteville MSA June 122 -0.24 0.98Greensboro-High Point MSA June 126 0.82 4.22Greenville MSA June 126 -0.94 1.71Hickory MSA June 141 0.61 5.21Jacksonville MSA June 142 0.84 0.57Raleigh-Cary MSA June 148 0.16 4.88Wilmington MSA June 174 0.22 3.53Winston-Salem MSA June 138 1.15 5.15 Greensboro MSA Median Home Sales Price (NAR)
Median Home Sales Price - NAR (NSA) Period Level ($000s) QoQ % Change YoY % ChangeYear-over-Year Percent Change through Q2:17
Charlotte MSA Q2:17 234 11.78 7.43
Durham MSA Q2:17 264 15.25 7.33
Greensboro-High Point MSA Q2:17 159 7.82 -0.50
Raleigh-Cary MSA Q2:17 278 11.19 7.53
Median Home Sales Price - NAHB Period Level ($000s) QoQ % Change YoY % Change
Asheville MSA Q2:17 248 7.83 5.98Charlotte MSA Q2:17 236 11.85 13.46Durham MSA Q2:17 244 11.42 8.44Fayetteville MSA Q2:17 129 4.88 -0.77Greensboro-High Point MSA Q2:17 154 6.94 2.67Raleigh-Cary MSA Q2:17 283 5.99 8.85Winston-Salem MSA Q2:17 160 12.68 3.90
NORTH CAROLINA 6
S N A P S H O T A MONTHLY UPDATE OF THE FIFTH DISTRICT ECONOMY
-20
-15
-10
-5
0
5
10
15
2007 2008 2009 2010 2011 2012 2013 2014 2015 2016 2017
United States
North Carolina
-15
-10
-5
0
5
10
15
20
2007 2008 2009 2010 2011 2012 2013 2014 2015 2016 2017
September 2017 FEDERAL RESERVE BANK OF RICHMOND
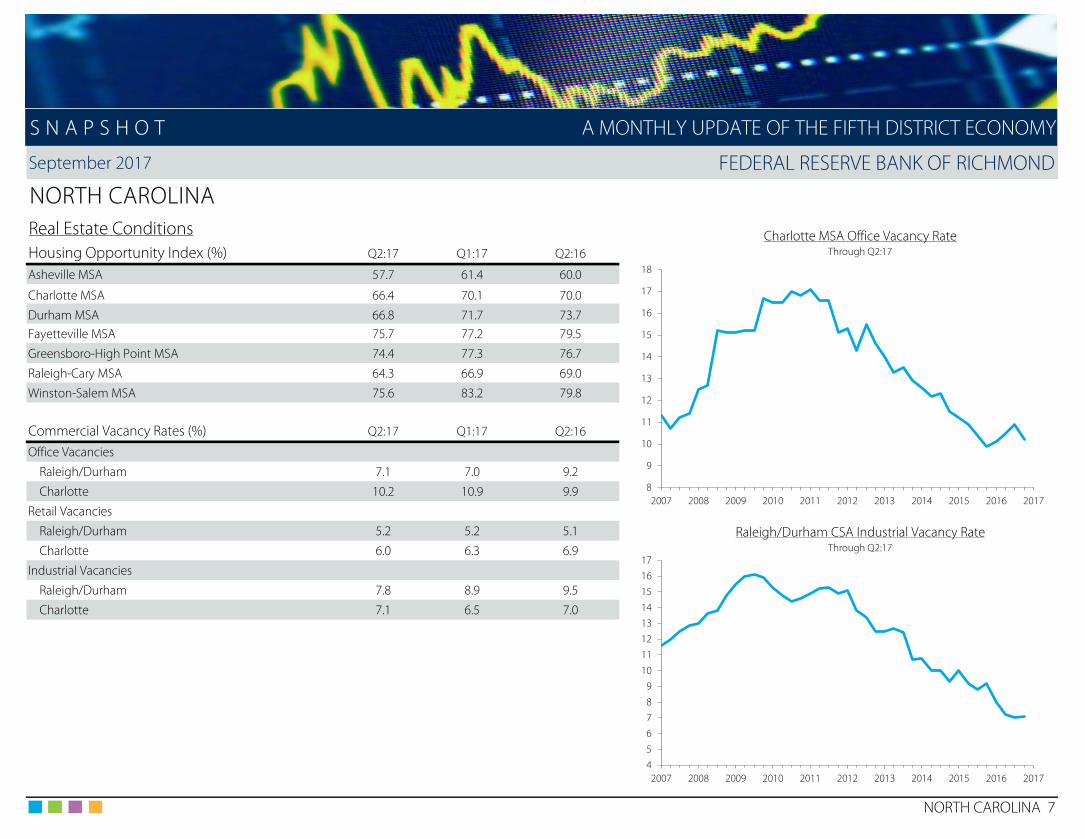
NORTH CAROLINAReal Estate Conditions Charlotte MSA Office Vacancy RateHousing Opportunity Index (%) Q2:17 Q1:17 Q2:16 Through Q2:17
Asheville MSA 57.7 61.4 60.0
Charlotte MSA 66.4 70.1 70.0
Durham MSA 66.8 71.7 73.7Fayetteville MSA 75.7 77.2 79.5
Greensboro-High Point MSA 74.4 77.3 76.7
Raleigh-Cary MSA 64.3 66.9 69.0
Winston-Salem MSA 75.6 83.2 79.8
Commercial Vacancy Rates (%) Q2:17 Q1:17 Q2:16
Office Vacancies
Raleigh/Durham 7.1 7.0 9.2
Charlotte 10.2 10.9 9.9
Retail Vacancies
Raleigh/Durham 5.2 5.2 5.1 Raleigh/Durham CSA Industrial Vacancy RateCharlotte 6.0 6.3 6.9 Through Q2:17
Industrial Vacancies
Raleigh/Durham 7.8 8.9 9.5
Charlotte 7.1 6.5 7.0
NORTH CAROLINA 7
S N A P S H O T A MONTHLY UPDATE OF THE FIFTH DISTRICT ECONOMY
8
9
10
11
12
13
14
15
16
17
18
2007 2008 2009 2010 2011 2012 2013 2014 2015 2016 2017
456789
1011121314151617
2007 2008 2009 2010 2011 2012 2013 2014 2015 2016 2017

September 2017 FEDERAL RESERVE BANK OF RICHMOND
SOUTH CAROLINASeptember Summary A Closer Look at… Total Wages and Salaries
SOUTH CAROLINA 1
S N A P S H O T A MONTHLY UPDATE OF THE FIFTH DISTRICT ECONOMY
Economic conditions in South Carolina generally improved in recent months. Totalemployment rose and household conditions remained stable while housing marketindicators were generally upbeat.
Labor Markets: Employers in South Carolina added 7,700 net new jobs in July, whichtranslated to a 0.4 percent increase. The professional and business services industry and thegovernment sector added the most jobs, 2,800 jobs and 2,200 jobs, respectively. Smaller jobgains were reported in most of the remaining industries. In fact, the only industries to cutjobs in July were logging and mining and trade, transportation, and utilities. The job loss inthe trade, transportation, and utilities industry was a sizeable one; the 3,100 jobs that werecut was the largest monthly decline in the industry since February 2009. On a year-over-yearbasis, total payroll employment grew 1.5 percent in South Carolina as every industry exceptinformation and “other” services expanded. The manufacturing industry added the most jobssince last July (9,300 jobs), followed by the education and health services and professionaland business services industries, which added 5,700 jobs and 5,600 jobs, respectively.
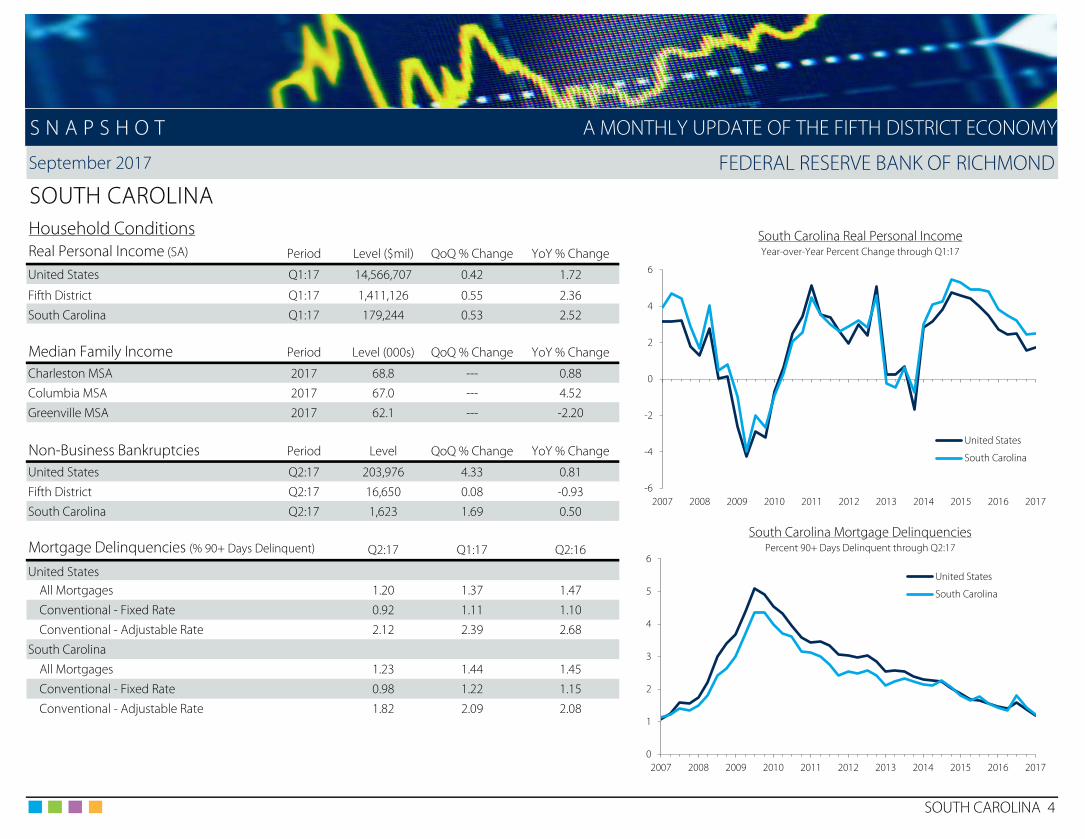
Household Conditions: The unemployment rate in South Carolina was unchanged at 3.9percent in June. Meanwhile, metro area unemployment rates rose in July in every MSA andranged from 3.3 percent in Charleston to 5.1 percent in Myrtle Beach. In the second quarterof 2017, the share of South Carolina mortgages with payments 90 or more days overdue fell0.2 percentage point to 1.2 percent. Delinquency rates for fixed and adjustable rateconventional loans also declined in the second quarter to 1.0 percent and 1.8 percent,respectively. In the first quarter of 2017, real personal income rose 0.5 percent and increased2.5 percent since the first quarter of 2016.
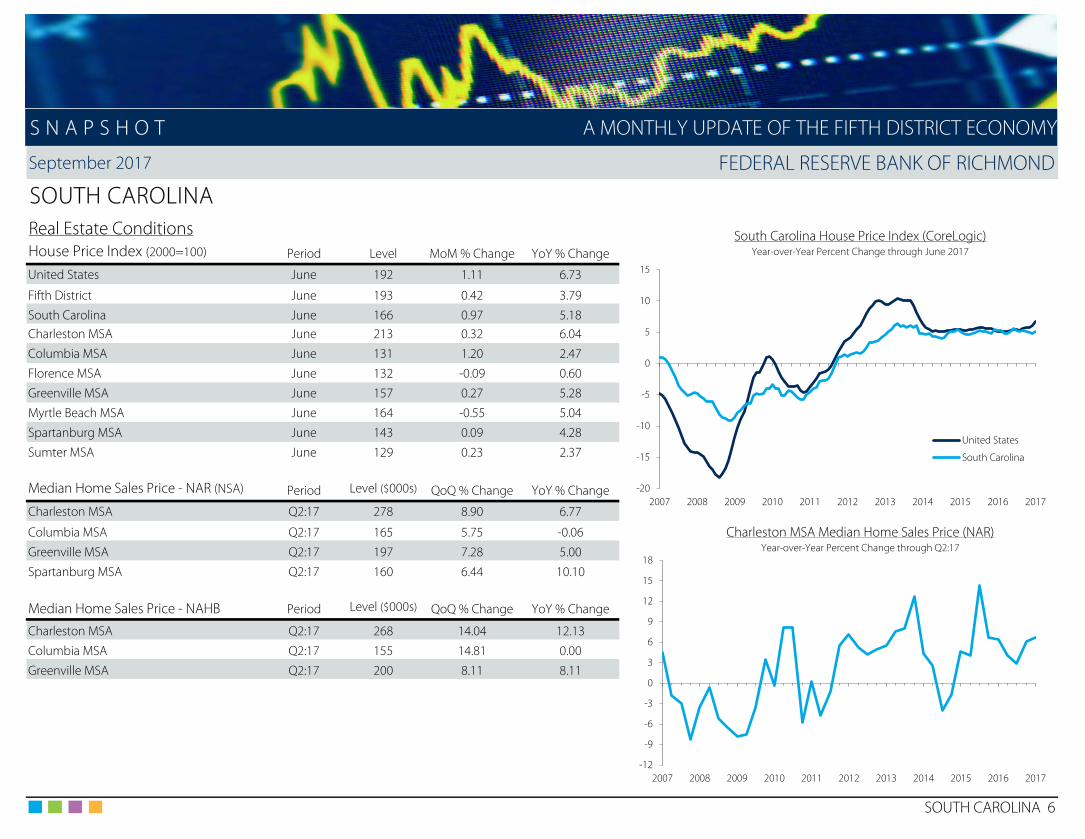
Housing Markets: South Carolina issued 3,162 new residential permits in July, up 1.7 percentfrom the prior month and up 11.7 percent from July 2016. At the metro level, however,permitting activity slowed in every MSA except Greenville in July and varied on a year-over-year basis. Housing starts in South Carolina totaled 33,400 in July, up 21.5 percent in themonth but down 11.6 percent from last July. Home values in the state, according toCoreLogic Information Solutions, appreciated 1.0 percent in June and appreciated 5.2percent on a year-over-year basis. House prices rose in every metro area except Florence andMyrtle Beach in the month and in every MSA on a year-over-year basis.
-6
-4
-2
0
2
4
6
8
2003 2005 2007 2009 2011 2013 2015 2017
United States
South Carolina
Total Wage & Salary Growth in South CarolinaYear-over-year percent change, through Q1:2017
Total Wages and Salaries by IndustryYoY% Change
Q1:2017Average Annual %
Change Since Q1:2012
Total 5.1 4.5
Natural Resources 2.7 4.5
Construction 10.6 7.9
Manufacturing 4.1 4.3
Trade, Transportation & Utilities 4.6 4.5
Information 2.4 4.4
Financial Activities 8.7 5.4
Professional & Business Services 6.4 5.0
Education & Health Services 7.0 4.9
Leisure & Hospitality 1.5 5.2
Other 4.7 4.6
Government 3.4 3.0

September 2017 FEDERAL RESERVE BANK OF RICHMOND
SOUTH CAROLINALabor Market Conditions South Carolina Payroll Employment PerformancePayroll Employment (SA) Period Level (000s) MoM % Change YoY % Change Year-over-Year Percent Change in July 2017
United States - Total July 146,615.0 0.14 1.49
Fifth District - Total July 14,788.0 0.21 1.55
South Carolina - Total July 2,092.0 0.37 1.45Logging and Mining (NSA) July 4.3 -2.27 2.38Construction July 98.2 0.20 3.37Manufacturing July 248.1 0.77 3.89Trade, Transportation, and Utilities July 398.7 -0.77 1.01Information July 26.2 0.38 -2.60Financial Activities July 101.3 0.30 1.10Professional and Business Services July 275.3 1.03 2.08Education and Health Services July 248.2 0.53 2.35Leisure and Hospitality July 250.1 0.68 0.77Other Services July 73.4 0.41 -1.61 South Carolina Total Employment PerformanceGovernment July 368.2 0.60 0.22 Year-over-Year Percent Change in July 2017
Metro Payroll Employment (NSA) Period Level (000s) YoY % Change
Charleston MSA - Total July 353.8 1.49
Columbia MSA - Total July 397.6 1.40
Florence MSA - Total July 88.6 2.78
Greenville-Anderson MSA - Total July 409.5 0.66
Hilton Head Island MSA - Total July 80.3 2.03
Myrtle Beach MSA - Total July 174.2 2.23
Spartanburg MSA - Total July 148.2 2.00
Sumter MSA - Total July 39.1 0.51
SOUTH CAROLINA 2
S N A P S H O T
1.4
2.4
3.4
3.9
1.0
-2.6
1.1
2.1
2.4
0.8
-1.60.2
-3 -2 -1 0 1 2 3 4 5
South Carolina - Total
Logging and Mining (NSA)
Construction
Manufacturing
Trade, Transportation, and Utilities
Information
Financial Activities
Professional and Business Services
Education and Health Services
Leisure and Hospitality
Other Services
Government
A MONTHLY UPDATE OF THE FIFTH DISTRICT ECONOMY
0.5
2.0
2.2
2.0
0.7
2.8
1.4
1.5
1.4
1.6
1.5
0.0 0.5 1.0 1.5 2.0 2.5 3.0
Sumter MSA
Spartanburg MSA
Myrtle Beach MSA
Hilton Head Island MSA
Greenville-Anderson MSA
Florence MSA
Columbia MSA
Charleston MSA
South Carolina (SA)
Fifth District (SA)
United States (SA)

September 2017 FEDERAL RESERVE BANK OF RICHMOND
SOUTH CAROLINALabor Market Conditions South Carolina Unemployment RateUnemployment Rate (SA) July 17 June 17 July 16 Through July 2017
United States 4.3 4.4 4.9
Fifth District 4.1 4.1 4.6
South Carolina 3.9 3.9 4.8Charleston MSA 3.3 3.2 4.0Columbia MSA 3.7 3.6 4.4Florence MSA 4.5 4.2 5.3Greenville-Anderson MSA 3.8 3.4 4.3Hilton Head Island MSA 3.7 3.6 4.4Myrtle Beach MSA 5.1 4.8 5.9Spartanburg MSA 4.3 3.6 4.6Sumter MSA 5.0 4.8 5.6
Civilian Labor Force (SA) Period Level (000s) MoM % Change YoY % Change
United States July 160,494 0.22 0.75
Fifth District July 15,960 0.01 1.42 South Carolina Labor ForceSouth Carolina July 2,320 -0.10 0.99 Year-over-Year Percent Change through July 2017
Charleston MSA July 378 0.13 1.42Columbia MSA July 407 0.42 0.77Florence MSA July 97 0.52 1.68Greenville-Anderson MSA July 423 0.09 0.50Hilton Head Island MSA July 86 0.59 1.54Myrtle Beach MSA July 193 0.16 2.06Spartanburg MSA July 157 0.51 2.01Sumter MSA July 44 0.45 0.00
Initial Unemployment Claims (NSA) Period Level MoM % Change YoY % Change
United States July 1,020,042 -0.74 -5.03
Fifth District July 63,451 -0.12 -5.58
South Carolina July 15,702 37.87 10.31
SOUTH CAROLINA 3
S N A P S H O T A MONTHLY UPDATE OF THE FIFTH DISTRICT ECONOMY
3
4
5
6
7
8
9
10
11
12
13
2007 2008 2009 2010 2011 2012 2013 2014 2015 2016 2017
United States
South Carolina
-2
-1
0
1
2
3
4
2007 2008 2009 2010 2011 2012 2013 2014 2015 2016 2017
United States
South Carolina
September 2017 FEDERAL RESERVE BANK OF RICHMOND
SOUTH CAROLINAHousehold Conditions South Carolina Real Personal IncomeReal Personal Income (SA) Period Level ($mil) QoQ % Change YoY % Change Year-over-Year Percent Change through Q1:17
United States Q1:17 14,566,707 0.42 1.72
Fifth District Q1:17 1,411,126 0.55 2.36
South Carolina Q1:17 179,244 0.53 2.52
Median Family Income Period Level (000s) QoQ % Change YoY % Change
Charleston MSA 2017 68.8 --- 0.88
Columbia MSA 2017 67.0 --- 4.52
Greenville MSA 2017 62.1 --- -2.20
Non-Business Bankruptcies Period Level QoQ % Change YoY % Change
United States Q2:17 203,976 4.33 0.81
Fifth District Q2:17 16,650 0.08 -0.93
South Carolina Q2:17 1,623 1.69 0.50
South Carolina Mortgage DelinquenciesMortgage Delinquencies (% 90+ Days Delinquent) Q2:17 Q1:17 Q2:16 Percent 90+ Days Delinquent through Q2:17
United States All Mortgages 1.20 1.37 1.47
Conventional - Fixed Rate 0.92 1.11 1.10
Conventional - Adjustable Rate 2.12 2.39 2.68
South Carolina
All Mortgages 1.23 1.44 1.45
Conventional - Fixed Rate 0.98 1.22 1.15
Conventional - Adjustable Rate 1.82 2.09 2.08
SOUTH CAROLINA 4
S N A P S H O T A MONTHLY UPDATE OF THE FIFTH DISTRICT ECONOMY
-6
-4
-2
0
2
4
6
2007 2008 2009 2010 2011 2012 2013 2014 2015 2016 2017
United States
South Carolina
0
1
2
3
4
5
6
2007 2008 2009 2010 2011 2012 2013 2014 2015 2016 2017
United States
South Carolina

September 2017 FEDERAL RESERVE BANK OF RICHMOND
SOUTH CAROLINAReal Estate Conditions South Carolina New Housing UnitsPermits: New Private Housing Units (NSA) Period Level MoM % Change YoY % Change Year-over-Year Percent Change through July 2017
United States July 101,005 -21.01 6.18
Fifth District July 14,160 -0.07 12.63
South Carolina July 3,162 1.67 11.73Charleston MSA July 519 -11.88 -3.17
Columbia MSA July 407 -38.80 -2.86
Florence MSA July 32 -23.81 45.45
Greenville MSA July 719 67.21 -13.69
Myrtle Beach MSA July 547 -19.32 38.83
Spartanburg MSA July 200 -6.54 11.73
Sumter MSA July 23 -11.54 21.05
Total Private Housing Starts (SAAR) Period Level (000s) MoM % Change YoY % Change
United States July 1,155 -4.78 -5.56 South Carolina Housing StartsFifth District July 149 19.43 -10.83 Thousands of Units (SAAR) July 2017
South Carolina July 33.4 21.53 -11.56
SOUTH CAROLINA 5
S N A P S H O T A MONTHLY UPDATE OF THE FIFTH DISTRICT ECONOMY
-80
-60
-40
-20
0
20
40
60
80
100
2007 2008 2009 2010 2011 2012 2013 2014 2015 2016 2017
0
5
10
15
20
25
30
35
40
45
2007 2008 2009 2010 2011 2012 2013 2014 2015 2016 2017
September 2017 FEDERAL RESERVE BANK OF RICHMOND
SOUTH CAROLINAReal Estate Conditions South Carolina House Price Index (CoreLogic)House Price Index (2000=100) Period Level MoM % Change YoY % Change Year-over-Year Percent Change through June 2017
United States June 192 1.11 6.73
Fifth District June 193 0.42 3.79
South Carolina June 166 0.97 5.18Charleston MSA June 213 0.32 6.04
Columbia MSA June 131 1.20 2.47
Florence MSA June 132 -0.09 0.60
Greenville MSA June 157 0.27 5.28
Myrtle Beach MSA June 164 -0.55 5.04
Spartanburg MSA June 143 0.09 4.28
Sumter MSA June 129 0.23 2.37
Median Home Sales Price - NAR (NSA) Period Level ($000s) QoQ % Change YoY % Change
Charleston MSA Q2:17 278 8.90 6.77
Columbia MSA Q2:17 165 5.75 -0.06 Charleston MSA Median Home Sales Price (NAR)Greenville MSA Q2:17 197 7.28 5.00 Year-over-Year Percent Change through Q2:17
Spartanburg MSA Q2:17 160 6.44 10.10
Median Home Sales Price - NAHB Period Level ($000s) QoQ % Change YoY % Change
Charleston MSA Q2:17 268 14.04 12.13
Columbia MSA Q2:17 155 14.81 0.00
Greenville MSA Q2:17 200 8.11 8.11
SOUTH CAROLINA 6
S N A P S H O T A MONTHLY UPDATE OF THE FIFTH DISTRICT ECONOMY
-20
-15
-10
-5
0
5
10
15
2007 2008 2009 2010 2011 2012 2013 2014 2015 2016 2017
United States
South Carolina
-12
-9
-6
-3
0
3
6
9
12
15
18
2007 2008 2009 2010 2011 2012 2013 2014 2015 2016 2017

September 2017 FEDERAL RESERVE BANK OF RICHMOND
SOUTH CAROLINAReal Estate Conditions Charleston MSA Office Vacancy RateHousing Opportunity Index (%) Q2:17 Q1:17 Q2:16 Through Q1:17
Charleston MSA 57.6 65.2 68.4
Columbia MSA 84.4 86.1 79.4
Greenville MSA 72.3 74.6 79.7
Commercial Vacancy Rates (%) Q2:17 Q1:17 Q2:16
Office Vacancies
Charleston --- --- 9.5
Industrial Vacancies
Charleston --- --- 9.5
Charleston MSA Industrial Vacancy RateThrough Q1:17
SOUTH CAROLINA 7
S N A P S H O T A MONTHLY UPDATE OF THE FIFTH DISTRICT ECONOMY
6
8
10
12
14
16
18
2007 2008 2009 2010 2011 2012 2013 2014 2015 2016 2017
6
8
10
12
14
16
18
20
22
24
2007 2008 2009 2010 2011 2012 2013 2014 2015 2016 2017
September 2017 FEDERAL RESERVE BANK OF RICHMOND
VIRGINIASeptember Summary A Closer Look at… Total Wages and Salaries
VIRGINIA 1
S N A P S H O T A MONTHLY UPDATE OF THE FIFTH DISTRICT ECONOMY
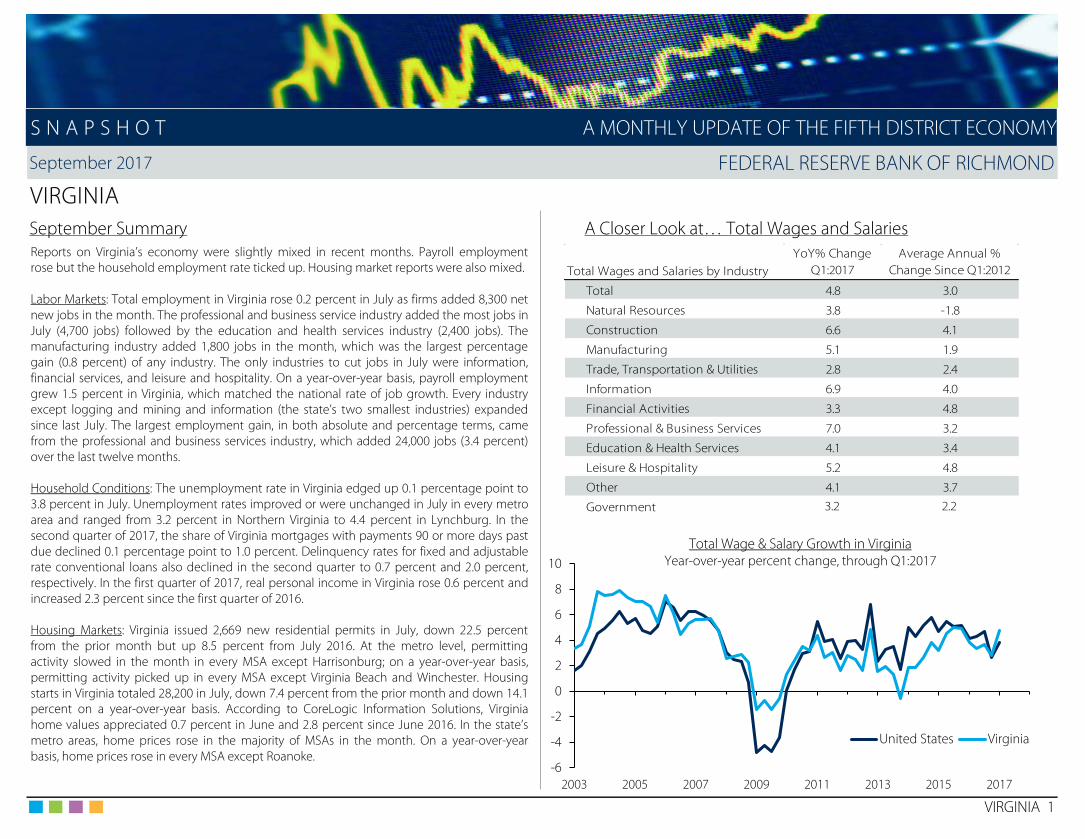
Reports on Virginia’s economy were slightly mixed in recent months. Payroll employmentrose but the household employment rate ticked up. Housing market reports were also mixed.
Labor Markets: Total employment in Virginia rose 0.2 percent in July as firms added 8,300 netnew jobs in the month. The professional and business service industry added the most jobs inJuly (4,700 jobs) followed by the education and health services industry (2,400 jobs). Themanufacturing industry added 1,800 jobs in the month, which was the largest percentagegain (0.8 percent) of any industry. The only industries to cut jobs in July were information,financial services, and leisure and hospitality. On a year-over-year basis, payroll employmentgrew 1.5 percent in Virginia, which matched the national rate of job growth. Every industryexcept logging and mining and information (the state’s two smallest industries) expandedsince last July. The largest employment gain, in both absolute and percentage terms, camefrom the professional and business services industry, which added 24,000 jobs (3.4 percent)over the last twelve months.
Household Conditions: The unemployment rate in Virginia edged up 0.1 percentage point to3.8 percent in July. Unemployment rates improved or were unchanged in July in every metroarea and ranged from 3.2 percent in Northern Virginia to 4.4 percent in Lynchburg. In thesecond quarter of 2017, the share of Virginia mortgages with payments 90 or more days pastdue declined 0.1 percentage point to 1.0 percent. Delinquency rates for fixed and adjustablerate conventional loans also declined in the second quarter to 0.7 percent and 2.0 percent,respectively. In the first quarter of 2017, real personal income in Virginia rose 0.6 percent andincreased 2.3 percent since the first quarter of 2016.
Housing Markets: Virginia issued 2,669 new residential permits in July, down 22.5 percentfrom the prior month but up 8.5 percent from July 2016. At the metro level, permittingactivity slowed in the month in every MSA except Harrisonburg; on a year-over-year basis,permitting activity picked up in every MSA except Virginia Beach and Winchester. Housingstarts in Virginia totaled 28,200 in July, down 7.4 percent from the prior month and down 14.1percent on a year-over-year basis. According to CoreLogic Information Solutions, Virginiahome values appreciated 0.7 percent in June and 2.8 percent since June 2016. In the state’smetro areas, home prices rose in the majority of MSAs in the month. On a year-over-yearbasis, home prices rose in every MSA except Roanoke.
-6
-4
-2
0
2
4
6
8
10
2003 2005 2007 2009 2011 2013 2015 2017
United States Virginia
Total Wage & Salary Growth in VirginiaYear-over-year percent change, through Q1:2017
Total Wages and Salaries by IndustryYoY% Change
Q1:2017Average Annual %
Change Since Q1:2012
Total 4.8 3.0
Natural Resources 3.8 -1.8
Construction 6.6 4.1
Manufacturing 5.1 1.9
Trade, Transportation & Utilities 2.8 2.4
Information 6.9 4.0
Financial Activities 3.3 4.8
Professional & Business Services 7.0 3.2
Education & Health Services 4.1 3.4
Leisure & Hospitality 5.2 4.8
Other 4.1 3.7
Government 3.2 2.2

September 2017 FEDERAL RESERVE BANK OF RICHMOND
VIRGINIALabor Market Conditions Virginia Payroll Employment PerformancePayroll Employment (SA) Period Level (000s) MoM % Change YoY % Change Year-over-Year Percent Change in July 2017
United States - Total July 146,615.0 0.14 1.49
Fifth District - Total July 14,788.0 0.21 1.55
Virginia - Total July 3,975.9 0.21 1.54Logging and Mining July 7.7 0.00 -2.53Construction July 191.1 0.58 2.36Manufacturing July 233.9 0.78 0.60Trade, Transportation, and Utilities July 664.7 0.00 0.44Information July 63.9 -1.39 -6.99Financial Activities July 203.8 -0.88 1.80Professional and Business Services July 740.3 0.64 3.35Education and Health Services July 546.7 0.44 3.09Leisure and Hospitality July 407.4 -0.02 2.57Other Services July 200.6 0.00 0.50 Virginia Total Employment PerformanceGovernment July 715.8 0.15 0.20 Year-over-Year Percent Change in July 2017
Metro Payroll Employment (NSA) Period Level (000s) YoY % Change
Blacksburg MSA - Total July 76.1 2.56
Charlottesville MSA - Total July 114.6 2.60
Lynchburg MSA - Total July 103.9 0.78
Northern Virginia - Total July 1,472.4 1.95
Richmond MSA - Total July 680.9 2.58
Roanoke MSA - Total July 163.2 1.49
Virginia Beach-Norfolk MSA - Total July 775.3 -0.36
Winchester MSA - Total July 63.0 2.27
VIRGINIA 2
S N A P S H O T
1.5
-2.5
2.4
0.6
0.4
-7.0
1.8
3.4
3.1
2.6
0.5
0.2
-8 -7 -6 -5 -4 -3 -2 -1 0 1 2 3 4
Virginia - Total
Logging and Mining
Construction
Manufacturing
Trade, Transportation, and Utilities
Information
Financial Activities
Professional and Business Services
Education and Health Services
Leisure and Hospitality
Other Services
Government
A MONTHLY UPDATE OF THE FIFTH DISTRICT ECONOMY
2.3
-0.4
1.5
2.6
2.0
0.8
2.6
2.6
1.5
1.6
1.5
-1.0 -0.5 0.0 0.5 1.0 1.5 2.0 2.5 3.0
Winchester MSA
Virginia Beach-Norfolk MSA
Roanoke MSA
Richmond MSA
Northern Virginia
Lynchburg MSA
Charlottesville MSA
Blacksburg MSA
Virginia (SA)
Fifth District (SA)
United States (SA)

September 2017 FEDERAL RESERVE BANK OF RICHMOND
VIRGINIALabor Market Conditions Virginia Unemployment RateUnemployment Rate (SA) July 17 June 17 July 16 Through July 2017
United States 4.3 4.4 4.9
Fifth District 4.1 4.1 4.6
Virginia 3.8 3.7 4.1Blacksburg MSA 3.9 4.1 4.4Charlottesville MSA 3.3 3.3 3.5Lynchburg MSA 4.4 4.4 4.6Northern Virginia (NSA) 3.2 3.2 3.4Richmond MSA 3.8 3.8 4.1Roanoke MSA 3.8 3.8 3.9Virginia Beach-Norfolk MSA 4.2 4.2 4.6Winchester MSA 3.4 3.4 3.7
Civilian Labor Force (SA) Period Level (000s) MoM % Change YoY % Change
United States July 160,494 0.22 0.75
Fifth District July 15,960 0.01 1.42 Virginia Labor ForceVirginia July 4,320 0.14 2.05 Year-over-Year Percent Change through July 2017
Blacksburg MSA July 93 0.33 2.32Charlottesville MSA July 119 0.00 3.21Lynchburg MSA July 123 0.65 1.90Northern Virginia (NSA) July 1,631 0.88 3.46Richmond MSA July 687 0.78 3.63Roanoke MSA July 161 0.37 2.42Virginia Beach-Norfolk MSA July 842 -0.02 0.80Winchester MSA July 71 0.43 2.16
Initial Unemployment Claims (NSA) Period Level MoM % Change YoY % Change
United States July 1,020,042 -0.74 -5.03
Fifth District July 63,451 -0.12 -5.58
Virginia July 13,304 -0.44 -3.61
VIRGINIA 3
S N A P S H O T A MONTHLY UPDATE OF THE FIFTH DISTRICT ECONOMY
2
3
4
5
6
7
8
9
10
11
2007 2008 2009 2010 2011 2012 2013 2014 2015 2016 2017
United States
Virginia
-2
-1
0
1
2
3
2007 2008 2009 2010 2011 2012 2013 2014 2015 2016 2017
United States
Virginia

September 2017 FEDERAL RESERVE BANK OF RICHMOND
VIRGINIAHousehold Conditions Virginia Real Personal IncomeReal Personal Income (SA) Period Level ($mil) QoQ % Change YoY % Change Year-over-Year Percent Change through Q1:17
United States Q1:17 14,566,707 0.42 1.72
Fifth District Q1:17 1,411,126 0.55 2.36
Virginia Q1:17 413,798 0.62 2.33
Median Family Income Period Level (000s) QoQ % Change YoY % Change
Richmond MSA 2017 78.7 --- 8.70
Roanoke MSA 2017 66.9 --- ---
Virginia Beach-Norfolk MSA 2017 73.0 --- 3.55
Non-Business Bankruptcies Period Level QoQ % Change YoY % Change
United States Q2:17 203,976 4.33 0.81
Fifth District Q2:17 16,650 0.08 -0.93
Virginia Q2:17 5,838 -0.55 0.60
Virginia Mortgage DelinquenciesMortgage Delinquencies (% 90+ Days Delinquent) Q2:17 Q1:17 Q2:16 Percent 90+ Days Delinquent through Q2:17
United States All Mortgages 1.20 1.37 1.47
Conventional - Fixed Rate 0.92 1.11 1.10
Conventional - Adjustable Rate 2.12 2.39 2.68
Virginia
All Mortgages 1.03 1.13 1.26
Conventional - Fixed Rate 0.74 0.85 0.88
Conventional - Adjustable Rate 1.96 2.09 2.43
VIRGINIA 4
S N A P S H O T A MONTHLY UPDATE OF THE FIFTH DISTRICT ECONOMY
-6
-4
-2
0
2
4
6
2007 2008 2009 2010 2011 2012 2013 2014 2015 2016 2017
United States
Virginia
0
1
2
3
4
5
6
2007 2008 2009 2010 2011 2012 2013 2014 2015 2016 2017
United States
Virginia

September 2017 FEDERAL RESERVE BANK OF RICHMOND
VIRGINIAReal Estate Conditions Virginia New Housing UnitsPermits: New Private Housing Units (NSA) Period Level MoM % Change YoY % Change Year-over-Year Percent Change through July 2017
United States July 101,005 -21.01 6.18
Fifth District July 14,160 -0.07 12.63
Virginia July 2,669 -22.53 8.54Charlottesville MSA July 75 -18.48 20.97
Harrisonburg MSA July 56 47.37 69.70
Lynchburg MSA July 44 -46.99 62.96
Richmond MSA July 428 -35.05 14.13
Virginia Beach-Norfolk MSA July 383 -13.35 -42.06
Winchester MSA July 42 -60.00 -72.90
Total Private Housing Starts (SAAR) Period Level (000s) MoM % Change YoY % Change
United States July 1,155 -4.78 -5.56 Virginia Housing StartsFifth District July 149 19.43 -10.83 Thousands of Units (SAAR) July 2017
Virginia July 28.2 -7.40 -14.07
VIRGINIA 5
S N A P S H O T A MONTHLY UPDATE OF THE FIFTH DISTRICT ECONOMY
-80
-60
-40
-20
0
20
40
60
80
100
2007 2008 2009 2010 2011 2012 2013 2014 2015 2016 2017
0
5
10
15
20
25
30
35
40
45
50
2007 2008 2009 2010 2011 2012 2013 2014 2015 2016 2017

September 2017 FEDERAL RESERVE BANK OF RICHMOND
VIRGINIAReal Estate Conditions Virginia House Price Index (CoreLogic)House Price Index (2000=100) Period Level MoM % Change YoY % Change Year-over-Year Percent Change through June 2017
United States June 192 1.11 6.73
Fifth District June 193 0.42 3.79
Virginia June 212 0.70 2.76Blacksburg MSA June 167 0.80 6.39
Charlottesville MSA June 192 2.50 5.48
Danville MSA June 234 -0.83 0.73
Harrisonburg MSA June 223 -0.78 5.45
Lynchburg MSA June 164 0.47 3.37
Richmond MSA June 179 1.17 5.58
Roanoke MSA June 150 -0.69 -0.17
Virginia Beach-Norfolk MSA June 194 1.17 1.95
Winchester MSA June 211 1.57 3.45
Median Home Sales Price - NAR (NSA) Period Level ($000s) QoQ % Change YoY % Change Virginia Beach-Norfolk MSA Median Home Sales Price (NAR)
Richmond MSA Q2:17 254 8.27 5.66 Year-over-Year Percent Change through Q2:17
Virginia Beach-Norfolk MSA Q2:17 240 16.17 7.58
Median Home Sales Price - NAHB Period Level ($000s) QoQ % Change YoY % Change
Richmond MSA Q2:17 234 5.88 4.00
Virginia Beach-Norfolk MSA Q2:17 215 13.16 0.00
VIRGINIA 6
S N A P S H O T A MONTHLY UPDATE OF THE FIFTH DISTRICT ECONOMY
-20
-15
-10
-5
0
5
10
15
2007 2008 2009 2010 2011 2012 2013 2014 2015 2016 2017
United States
Virginia
-15
-10
-5
0
5
10
2008 2009 2010 2011 2012 2013 2014 2015 2016 2017

September 2017 FEDERAL RESERVE BANK OF RICHMOND
VIRGINIAReal Estate Conditions Richmond MSA Office Vacancy RateHousing Opportunity Index (%) Q2:17 Q1:17 Q2:16 Through Q2:17
Richmond MSA 76.6 76.6 74.8
Roanoke MSA 80.8 90.4 87.0
Virginia Beach-Norfolk MSA 76.8 80.3 76.9
Commercial Vacancy Rates (%) Q2:17 Q1:17 Q2:16
Office Vacancies
Norfolk 11.3 12.3 13.0
Richmond 9.9 10.3 12.5
Industrial Vacancies
Northern Virginia --- --- 12.0
Richmond --- 9.3 10.2
Richmond MSA Industrial Vacancy RateThrough Q1:17
VIRGINIA 7
S N A P S H O T A MONTHLY UPDATE OF THE FIFTH DISTRICT ECONOMY
8
10
12
14
16
18
20
2007 2008 2009 2010 2011 2012 2013 2014 2015 2016 2017
8
9
10
11
12
13
14
15
16
17
18
2007 2008 2009 2010 2011 2012 2013 2014 2015 2016 2017

September 2017 FEDERAL RESERVE BANK OF RICHMOND
WEST VIRGINIASeptember Summary A Closer Look at… Total Wages and Salaries
WEST VIRGINIA 1
S N A P S H O T A MONTHLY UPDATE OF THE FIFTH DISTRICT ECONOMY
Economic reports on West Virginia were somewhat mixed in recent months. The householdunemployment rate rose despite a modest increase in payroll employment. Meanwhile,housing market reports were slightly downbeat.
Labor Markets: Employers in West Virginia added 400 net new jobs (0.1 percent) in July. Themost jobs were added by the trade, transportation, and utilities and professional andbusiness services industries, which each added 600 jobs. Smaller job gains were reported inthe manufacturing, information, financial services, leisure and hospitality, and “other” servicesindustries. Conversely, the largest job cuts occurred in the construction industry (900 jobs)and the government sector (600 jobs) with smaller losses coming from the logging andmining industry and the government sector. On a year-over-year basis, total employment inWest Virginia rose 0.2 percent. The education and health services industry added the mostjobs (3,800 jobs) while the logging and mining industry reported the largest percentagegrowth (11.8 percent). On the downside, year-over-year employment declines were reportedin the manufacturing, government, leisure and hospitality, and trade, transportation, andutilities industries.
Household Conditions: The unemployment rate in West Virginia edged up 0.1 percentagepoint to 4.7 percent in July. Unemployment rates also rose in every MSA in July with ratesranging from 3.8 percent in Morgantown to 5.8 percent in Beckley. In the second quarter of2017, the share of mortgages in West Virginia with payments 90 or more days past due fell0.2 percentage point to 1.4 percent. Delinquency rates for fixed and adjustable rateconventional loans also declined in the second quarter to 1.2 percent and 2.3 percent,respectively. In the first quarter of 2017, real personal income in West Virginia rose 0.2percent but decreased 0.1 percent since the first quarter of 2016.
Housing Markets: West Virginia issued 204 new residential permits in July, down slightly from251 permits in June and down from the 254 permits issued in July 2016. Among the state’smetro areas, permitting activity slowed in every MSA except Charleston in the month, butpicked up in every MSA except Morgantown on a year-over-year basis. Housing starts in WestVirginia totaled 2,200 in July, a 3.2 percent decline from the prior month and a 36.6 percentdecrease from July 2016. According to CoreLogic Information Solutions, home values in WestVirginia appreciated 1.5 percent in June and 0.9 percent on a year-over-year basis. At themetro-level, house prices rose in Charleston and Morgantown in the month but declined inevery MSA except Parkersburg on a year-over-year basis.
-6
-4
-2
0
2
4
6
8
10
2003 2005 2007 2009 2011 2013 2015 2017
United States
West Virginia
Total Wage & Salary Growth in West VirginiaYear-over-year percent change, through Q1:2017
Total Wages and Salaries by IndustryYoY% Change
Q1:2017Average Annual %
Change Since Q1:2012
Total 0.7 0.4
Natural Resources 0.4 -10.0
Construction -8.0 -3.7
Manufacturing -1.1 0.5
Trade, Transportation & Utilities 0.2 0.9
Information 0.5 1.1
Financial Activities 7.1 2.5
Professional & Business Services 4.4 2.1
Education & Health Services 1.2 3.2
Leisure & Hospitality -1.3 1.3
Other 3.2 1.2
Government 1.3 1.1

September 2017 FEDERAL RESERVE BANK OF RICHMOND
WEST VIRGINIALabor Market Conditions West Virginia Payroll Employment PerformancePayroll Employment (SA) Period Level (000s) MoM % Change YoY % Change Year-over-Year Percent Change in July 2017
United States - Total July 146,615.0 0.14 1.49
Fifth District - Total July 14,788.0 0.21 1.55
West Virginia - Total July 747.1 0.05 0.21Logging and Mining July 21.8 -0.91 11.79Construction July 30.8 -2.84 4.05Manufacturing July 45.4 0.22 -2.37Trade, Transportation, and Utilities July 130.5 0.46 -2.03Information (NSA) July 9.7 1.04 1.04Financial Activities July 27.8 0.72 0.72Professional and Business Services July 66.5 0.91 0.91Education and Health Services July 133.3 -0.07 2.93Leisure and Hospitality July 73.2 0.41 -2.14Other Services July 54.6 0.37 1.30 West Virginia Total Employment PerformanceGovernment July 153.5 -0.39 -1.22 Year-over-Year Percent Change in July 2017
Metro Payroll Employment (NSA) Period Level (000s) YoY % Change
Beckley MSA - Total July 44.5 -2.41
Charleston MSA - Total July 119.0 0.34
Huntington MSA - Total July 136.3 0.74
Morgantown MSA - Total July 69.8 2.80
Parkersburg MSA - Total July 40.1 -0.74
WEST VIRGINIA 2
S N A P S H O T
0.2
11.8
4.1
-2.4
-2.0
1.0
0.7
0.9
2.9
-2.1
1.3
-1.2
-4 -2 0 2 4 6 8 10 12 14
West Virginia - Total
Logging and Mining
Construction
Manufacturing
Trade, Transportation, and Utilities
Information (NSA)
Financial Activities
Professional and Business Services
Education and Health Services
Leisure and Hospitality
Other Services
Government
A MONTHLY UPDATE OF THE FIFTH DISTRICT ECONOMY
-0.7
2.8
0.7
0.3
-2.4
0.2
1.6
1.5
-3.0 -2.5 -2.0 -1.5 -1.0 -0.5 0.0 0.5 1.0 1.5 2.0 2.5 3.0 3.5
Parkersburg MSA
Morgantown MSA
Huntington MSA
Charleston MSA
Beckley MSA
West Virginia (SA)
Fifth District (SA)
United States (SA)

September 2017 FEDERAL RESERVE BANK OF RICHMOND
WEST VIRGINIALabor Market Conditions West Virginia Unemployment RateUnemployment Rate (SA) July 17 June 17 July 16 Through July 2017
United States 4.3 4.4 4.9
Fifth District 4.1 4.1 4.6
West Virginia 4.7 4.6 6.0Beckley MSA 5.8 5.4 7.1
Charleston MSA 5.1 4.7 5.8
Huntington MSA 5.7 5.6 6.1
Morgantown MSA 3.8 3.6 4.5
Parkersburg MSA 5.3 5.0 5.8
Civilian Labor Force (SA) Period Level (000s) MoM % Change YoY % Change
United States July 160,494 0.22 0.75
Fifth District July 15,960 0.01 1.42
West Virginia July 779 -0.11 -0.49
Beckley MSA July 44 -0.45 -4.11 West Virginia Labor ForceCharleston MSA July 97 -0.21 -0.62 Year-over-Year Percent Change through July 2017
Huntington MSA July 147 -0.07 0.41
Morgantown MSA July 67 0.30 1.52
Parkersburg MSA July 39 -0.26 -1.28
Initial Unemployment Claims (NSA) Period Level MoM % Change YoY % Change
United States July 1,020,042 -0.74 -5.03Fifth District July 63,451 -0.12 -5.58
West Virginia July 4,451 7.80 -22.38
WEST VIRGINIA 3
S N A P S H O T A MONTHLY UPDATE OF THE FIFTH DISTRICT ECONOMY
2
3
4
5
6
7
8
9
10
11
2007 2008 2009 2010 2011 2012 2013 2014 2015 2016 2017
United States
West Virginia
-2
-1
0
1
2
3
2007 2008 2009 2010 2011 2012 2013 2014 2015 2016 2017
United States
West Virginia

September 2017 FEDERAL RESERVE BANK OF RICHMOND
WEST VIRGINIAHousehold Conditions West Virginia Real Personal IncomeReal Personal Income (SA) Period Level ($mil) QoQ % Change YoY % Change Year-over-Year Percent Change through Q1:17
United States Q1:17 14,566,707 0.42 1.72
Fifth District Q1:17 1,411,126 0.55 2.36
West Virginia Q1:17 61,527 0.21 -0.11
Non-Business Bankruptcies Period Level QoQ % Change YoY % Change
United States Q2:17 203,976 4.33 0.81
Fifth District Q2:17 16,650 0.08 -0.93
West Virginia Q2:17 866 -0.80 -0.80
Mortgage Delinquencies (% 90+ Days Delinquent) Q2:17 Q1:17 Q2:16
United States All Mortgages 1.20 1.37 1.47
Conventional - Fixed Rate 0.92 1.11 1.10
Conventional - Adjustable Rate 2.12 2.39 2.68 West Virginia Mortgage DelinquenciesWest Virginia Percent 90+ Days Delinquent through Q2:17
All Mortgages 1.43 1.56 1.52
Conventional - Fixed Rate 1.19 1.40 1.22
Conventional - Adjustable Rate 2.34 2.54 2.96
WEST VIRGINIA 4
S N A P S H O T A MONTHLY UPDATE OF THE FIFTH DISTRICT ECONOMY
-6
-4
-2
0
2
4
6
2007 2008 2009 2010 2011 2012 2013 2014 2015 2016 2017
United States
West Virginia
0
1
2
3
4
5
6
2007 2008 2009 2010 2011 2012 2013 2014 2015 2016 2017
United States
West Virginia

September 2017 FEDERAL RESERVE BANK OF RICHMOND
WEST VIRGINIAReal Estate Conditions West Virginia New Housing UnitsPermits: New Private Housing Units (NSA) Period Level MoM % Change YoY % Change Year-over-Year Percent Change through July 2017
United States July 101,005 -21.01 6.18
Fifth District July 14,160 -0.07 12.63
West Virginia July 204 -18.73 -19.69Charleston MSA July 18 27.78 27.78
Huntington MSA July 13 -40.91 44.44
Morgantown MSA July 1 -50.00 0.00
Parkersburg MSA July 11 37.50 22.22
Total Private Housing Starts (SAAR) Period Level (000s) MoM % Change YoY % Change
United States July 1,155 -4.78 -5.56
Fifth District July 149 19.43 -10.83
West Virginia July 2.2 -3.15 -36.58
House Price Index (2000=100) Period Level MoM % Change YoY % Change West Virginia House Price Index (CoreLogic)
United States June 192 1.11 6.73 Year-over-Year Percent Change through June 2017
Fifth District June 193 0.42 3.79
West Virginia June 152 1.51 0.94
Charleston MSA June 168 1.51 -0.79
Huntington MSA June 147 -2.11 -7.30
Morgantown MSA June 145 1.52 -0.97
Parkersburg MSA June 133 -0.05 0.84
Median Home Sales Price - NAR (NSA) Period Level ($000s) QoQ % Change YoY % Change
Charleston MSA Q2:17 138 7.63 -2.54
WEST VIRGINIA 5
S N A P S H O T A MONTHLY UPDATE OF THE FIFTH DISTRICT ECONOMY
-150
-100
-50
0
50
100
150
200
2007 2008 2009 2010 2011 2012 2013 2014 2015 2016 2017
-20
-15
-10
-5
0
5
10
15
2007 2008 2009 2010 2011 2012 2013 2014 2015 2016 2017
United States
West Virginia

September 2017 FEDERAL RESERVE BANK OF RICHMOND
SOURCES
Payroll Employment / Unemployment Median Family Income Commercial Vacancy RatesBureau of Labor Statistics National Association of Home Builders/Wells Fargo CB Richard Ellis
Haver Analytics Haver Analytics Haver Analyticshttp://www.bls.gov http://www.nahb.org http://www.cbre.com
Civilian Labor Force Bankruptcy Filings Median Home Sales Price - NARBureau of Labor Statistics Administrative Office of the U.S. Courts National Association of RealtorsHaver Analytics Haver Analytics Haver Analytics http://www.bls.gov http://www.uscourts.gov/library.html http://www.realtor.org
Unemployment Insurance Claims Mortgage Delinquencies Median Home Sales Price - NAHBU.S. Department of Labor Mortgage Bankers Association of America National Association of Home Builders/Wells Fargo
Haver Analytics Haver Analytics Haver Analyticshttp://www.dol.gov http://www.mortgagebankers.org http://www.nahb.org
District Imports / Exports Permits: New Private Housing Units Housing Opportunity IndexU.S. Census Bureau U.S. Census Bureau National Association of Home Builders/Wells Fargo
Haver Analytics Haver Analytics Haver Analytics
http://www.census.gov http://www.census.gov http://www.nahb.org
Personal Income Private Housing Starts House Price IndexBureau of Economic Analysis Bank of Tokyo-Mitsubishi CoreLogic Information Solutions
Haver Analytics Haver Analytics Federal Reserve Bank of Richmond
http://www.bea.gov http://www.bk.mufg.jp/english/index.html
SOURCES 1
S N A P S H O T A MONTHLY UPDATE OF THE FIFTH DISTRICT ECONOMY
September 2017 FEDERAL RESERVE BANK OF RICHMOND
NOTES
1 Manufacturing & Service Sector Surveys 6 House Price Index
7 Median Home Sales Price - NAR2 Manufacturing Composite Index Single family homes.
8 Median Home Sales Price - NAHBTotal Home Sales.
3 Mortgage Delinquency Rate9 Total Wages and Salaries
Bureau of Economic Analysis
https://www.bea.gov/regional/index.htm
Haver Analytics
4 New Private Housing Units & Housing Starts
5 Housing Opportunity Index
SA - Seasonally Adjusted NSA - Not Seasonally Adjusted SAAR - Seasonally Adjusted Annual Rate
SOURCES 2
Repeat sales index, measuring the average price changes in repeat sales on the same single family properties.
Each index equals the percentage of responding firms reporting increase minus the percentage reporting decrease. All firms surveyed are located within the Fifth Federal Reserve District.
The weighted average of the shipments (33 percent), new orders (40 percent) and employment (27 percent) indexes.
Data on District of Columbia building permits and housing starts are often volatile, leading to disproportionately large percentage changes.
Share of homes sold considered to be affordable to a family earning the area's median income.
The number of mortgages 90 days past due as a percentage of the total number of mortgages at the end of the period. The delinquency rate does not include loans in the process of foreclosure. "All Mortgages" includes conventional, FHA, and VA mortgages.
S N A P S H O T A MONTHLY UPDATE OF THE FIFTH DISTRICT ECONOMY