s. honus, d. juchelková issn 1330-3651 (print), issn 1848 ... · pdf fileključne...
TRANSCRIPT
S. Honus, D. Juchelková Matematički modeli izgaranja, konvekcije i prijenosa topline u eksperimentalnom toplinskom uređaju i verifikacija
ISSN 1330-3651 (Print), ISSN 1848-6339 (Online) UDC/UDK [669.162.263.014.72:536.2]:519.87
MATHEMATICAL MODELS OF COMBUSTION, CONVECTION AND HEAT TRANSFER IN EXPERIMENTAL THERMIC DEVICE AND VERIFICATION Stanislav Honus, Dagmar Juchelková
Original scientific paper The presented paper deals with the analysis of turbulent burning and with transport of energy and momentum. The article specificity lies in the fact that these processes are analysed in the horizontal furnace in which the screw reactor is placed. This reactor processes organic raw materials continually and thermally. Volume input of the raw materials is about 60 kg per hour. Solution of this issue comes from the measured energy responses of this device and from the principles of mathematic 3-D modelling. The main aim is to introduce a methodology of the combined modelling of the turbulence, burning and radiation for the monitored case and to verify it on the basis of experimentally obtained data. Keywords: combustion, energy conversion, furnace, heat transfer, pyrolysis, reactor Matematički modeli izgaranja, konvekcije i prijenosa topline u eksperimentalnom toplinkom uređaju i verifikacija
Izvorni znanstveni članak Rad se bavi analizom turbulentnog izgaranja te prijenosom energije i količinom gibanja. Rad je specifičan po činjenici da se ti procesi analiziraju u horizontalnoj visokoj peći u koju je postavljen vijčani reaktor. Taj reaktor prerađuje organske sirovine kontinuirano i termalno. Količina unosa sirovina je oko 60 kg na sat. Rješenje ovog pitanja nalazi se u izmjerenim količinama energije tog uređaja i u principima matematičkog 3-D modeliranja. Osnovni je cilj predstaviti metodologiju kombiniranog modeliranja turbulencije, izgaranja i radijacije u istraživanom slučaju i verificirati ga na osnovi eksperimentalno dobivenih podataka. Ključne riječi: izgaranje, piroliza, pretvorba energije, prijenos topline, reaktor, visoka peć 1 Introduction
CFD (Computational Fluid Dynamics) is a numeric method that falls within a competence of the fluid mechanics. This method enables to simulate physical processes by utilization of various computational algorithms. It leads to discretization and solution of a system of transmission differential and integral equations which mostly utilize a finite volume method [1, 2]. Reliability of the obtained outputs is usually confirmed by a line of measurements on real devices [3].
In our case the CFD software is utilized for the modelling of processes in the furnace of the experimental system. This system serves for thermic processing of organic raw materials by a form of pyrolysis. The modelling utilizes parameters which deal with combustion of heating gas, with convection of created burnt gases and with heat transmission to the reactor walls. The reactor has been situated in the furnace. The pyrolysis process is a complex of thermochemical degradation reactions that proceed under temperatures range from about 100 °C to 1000 °C and without air access. The principle lies in heating of the input material above the limit of thermal stability of the present organic substances. The consequence is that high-molecular chains are lysed to stabile low-molecular products and a solid residue. This fact is generally valid for all organic materials whether they are of natural (biomass) or of synthetic (plastics, rubbers) origin. The pyrolysis process course itself is dependant on a kind and characteristics of the input material, on a content of water in the input material, on the pyrolysis temperature and reaction time [4, 5, 6].
2 Experimental System Description The experimental system is equipped by a horizontal
furnace with maximal thermal input of 200 kW. Furnace walls are 162 mm thick in total and they are created by a layer of insulation made of aluminosilicate fibers. The insulation layer is 158 mm thick. The rest of the wall is created by metal sheets (internal one and external one) which are 2 mm thick. A horizontal screw reactor is placed in the furnace (heat resisting steel AVESTA 253 MA) with the wall 8 mm thick and of the total length of 4000 mm. The reactor is divided into the upper and lower part. The organic raw material is brought to the upper part from the hopper by the screw conveyer (biomass, rubber, polyethylene or coal).
This material is consequently advanced in the reactor by means of the two screws of 2 × 210 mm diameters and at the same time it is pyrolysed. At the end of the upper part of the reactor, there is a hole for material downflow to the lower part in which the material is lead back in the opposite direction by the screw of 110 mm diameter. At the end of the lower part, there is a conveyer situated. It carries the rest of the material off into the ash box. The solved situation geometry is illustrated in Fig. 1. (Hatched arrows in the figure show material flow direction in the upper and lower reactor part.)
During the pyrolysis process the created gas is drawn off the reactor to the cyclone and consequently to the aerial and hydraulic cooler. During cooling of the gas, some hydrocarbons are condensated to pyrolysis fluid. After these treatments the gas can be accumulated in a gas collector or directly utilized.
Heat input for the pyrolysis (so for the reactor heating) and coverage of thermal losses is ensured by five sections of the burners (S1 up to S5) that are situated in the lower part of the furnace. Every burner section is
Tehnički vjesnik 21, 1(2014), 115-122 115

Mathematical models of combustion, convection and heat transfer in experimental thermic device and verification S. Honus, D. Juchelková
equipped by two low-pressure burners. The burners are of the jet type and they suction only a part of the stoichiometric volume of combustion air. The rest of the volume is brought to the combustion space by the furnace draught. So, the gas and air are partly pre-mixed already in front of the input to the combustion space. From the physical point of view, the following situation is formed during the combustion: From a reason of the insufficient quantity of primary combustion air (we consider surplus primary air n = 0,9) in the mixture, only a part of the natural gas will be burnt in the kinetic regime.
The rest of gas that was not burnt in the queue of kinetic combustion is mixed with the created burnt gases. Thus, the secondary mixture is created. The air necessary for combustion of the rest of gas is sucked by a flue exhauster from the surrounding. The secondary air is diffused to the rest of gas and after the ignition the second queue of the combustion of diffused character is created. From that reason, it is necessary to select mathematic models that describe both, the kinetic and diffused combustion (see further).
Figure 1 Thermic system furnace and reactor geometry
3 Mathematic models of individual physical and chemical
processes in system
As it has been already described above, in unit's furnace the heating gas is burnt and consequently the reactor is bypassed by created burnt gases. Modelling of these processes brings along certain complications because it is necessary to solve a system of equations describing (i) non-isoheat flux of compressible fluid of turbulent character, (ii) chemical reactions, diffusion and kinetics of combustion, (iii) transmission of heat by radiation and related phenomena. 3.1 Flow
Fluid state in a certain moment is given by speed components u, v, w, static pressure p, density ρ and temperature T. Viscous compressible fluid flow in laminar and also turbulent regime is generally described by the basic laws of conservation - law of conservation of matter, of momentum and of energy that are completed by other so called constitutional formulas which define thermodynamic characteristics of the fluid [7, 8]. Law of the Conservation of Matter
It is described by the continuity equation. It says that the amount of mass flowing into the certain volume must be equal to the time rate of change of the mass inside this volume [9, 10]. This definition can be described mathematically by the following averaged Eq. (1) in which we utilized Einstein Summation Notation.
( ) 0~ =∂∂
+∂∂
jj
uxt
ρρ , (1)
where t presents time, ρ density and u velocity ( u~ mass conditional averaging that was introduced by Favre [11] because of the simplification). Momentum Transfer - Navier-Stokes Equation The Law of Conservation of Momentum is described by Navier-Stokes Equations for fluid motion that formulates balance of forces of inertia, of gravity, of compression and viscous forces at real fluid flow. When we utilize Einstein Summation, the Navier-Stokes averaged Equations are described in the following way:
( ) ( ) ( )jiij
jiji
ji uu
xxpuu
xu
t´´~~~ ρτρρ −
∂∂
+∂∂
−=∂∂
+∂∂ , (2)
where p is pressure and τij viscous stress tensor. Heat Transfer Equation - Conservation of Energy Conservation of Energy comes from the First Thermodynamic Law which says that energy or matter can neither be created nor destroyed. It is valid that the sum of the heat flux into the fluid element and of work done by forces on the element equals to the total increment of energy inside the fluid element. The heat flux and work are always divided into a voluminous and surface component:
116 Technical Gazette 21, 1(2014), 115-122

S. Honus, D. Juchelková Matematički modeli izgaranja, konvekcije i prijenosa topline u eksperimentalnom toplinskom uređaju i verifikacija
( ) ( )
( )jjj
j
j
iij
jj
jjj
j
uhxx
qxu
xpu
xpu
tpuh
xh
t
´´´
~~~~
ρτ
ρρ
∂∂
−∂
∂−
∂∂
+∂∂
+
∂∂
+∂∂
=∂∂
+∂∂
, (3)
where q is heat flux and h enthalpy. 3.2 Turbulence For turbulence was selected the model RANS k-ω because it is suitable for situations of the flow with low Reynolds number, respectively for transition ranges of flow with little developed turbulence [12]. It corresponds to the solved situation (it was defined by calculation of the Reynolds number in advance). The model comes from the Boussinesq's turbulent viscosity hypothesis. This hypothesis expects that components of the Reynolds stress might be interchanged by Newton Law what will be the reason of distinctive simplification. It is valid that:
yuuu tji ∂∂
=− ηρ ´´ , (4)
where ηt represents turbulent viscosity.
The k-ω model describes the turbulent viscosity tη according to [7] by the following formula:
ωρη k
t = . (5)
In the equation (5), the ω represents so called vorticity (s-1) what is a level of fluid rotation in the given place and k is turbulent kinetic energy. The turbulent characteristics k and ω that are parts of the equation are defined from the following formulas: ( ) ( )
( ) ωρβηση
τρρ
kxk
x
xu
xku
tk
jt
j
j
iij
j
j
**
~~
−
∂∂
+∂∂
+
∂∂
=∂
∂+
∂∂
, (6)
( ) ( )
( ) 2
~~
ωρβωσηη
τωγωρωρ
kxx
xu
kxu
t
jt
j
j
iij
j
j
−
∂∂
+∂∂
+
∂∂
=∂
∂+
∂∂
, (7)
where β, β*, γ, σ and σ* are empiric constants. More detailed information on the k-ω model might be found e.g. in the publication [13, 14, 15]. 3.3 Burning In the sections above it was mentioned that burning in the burners for heating gas runs in the transition range (it deals with the kinetic and diffusion burning) because in
front of the input to the burning area only a part of stoichiometric burning volume is premixed with the gas and the rest is brought separately by the influence of furnace chimney effect.
The transport equation for the individual components (CH4, N2, O2, H2O, CO, CO2, NOX) in the flow of heating gas, air and created burnt gases is in the CFX (software used for the solution) according to the defined in the following way:
( ) ( )
ij
ii
jj
iji Sxxx
ut
+
∂∂
Γ∂∂
=∂
∂+
∂∂ ωωρρω , (8)
where ωi is a mass fraction of the component i in the mixture (kg·kg−1), Γi is a coefficient of diffusion transfer of the given component and Si represents a source member that is expressed by a speed of production of the given component within the volume unit (kg·m−3·s−1). It deals with the equation of weight balance in which i-component flow is expressed as a sum of the convection and diffusion flow. There are a few components. This means that a system of equations is solved for every component. Speed of components production Si conforms to two mechanisms that have been already described above - chemical kinetics and diffusion of the components. The Finite Rate Chemistry model was selected for the kinetic regime and the Eddy Dissipation model was selected for diffusion regime. It deals with the models that are often used for simulations of burning and that generally show good results. Finite Rate Chemistry Model This model describes reaction speed on the basis of Arrhenius equation [16]:
13
1smkg ,exp −−
=
⋅⋅
−−= ∏
R
i
iniiii c
RTEAMR ν (9)
where A represents an empirical coefficient, E represents activation energy (J·kmol−1), νi represents molar stoichiometric coefficient, Mi represents a molar weight of i-component, ci represents a molar concentration of the given reagent and ni represents a speed exponent of the given reagent. Eddy Dissipation Model The model postulates that the reaction speed corresponds to the time needed for reactants mixing on the molecular level. The calculation comes from the turbulent kinetic energy k and dissipation ε (it means that it is possible to apply it for the turbulent burning only). Production speed Ri of i-component within the Eddy Dissipation model corresponds to the following relations according to Magnussen [17]. At the same time, the lower value of the results is always considered:
,smkg ,min 13R, −− ⋅⋅
=
iI
ii ´
ck
ARν
ε (10)
Tehnički vjesnik 21, 1(2014), 115-122 117

Mathematical models of combustion, convection and heat transfer in experimental thermic device and verification S. Honus, D. Juchelková
,smkg , 13P, −− ⋅⋅
=
∑∑
IiIP
IiPi W''
Wck
ABRν
ε (11)
where symbols A and B represent empirical coefficients [1], ε/k represent a specific speed of kinetic energy dissipation (s−1), ci,R and ci,P represent molar concentrations of the reactant and product and ν'iI and ν'iII represent stoichiometric coefficients of the reactant and product. For further information, see [18]. 3.4 Thermal radiation During mathematic modelling of gases radiation (in our case it deals with burnt gases) we focus on the monitoring of the basic phenomenon what is a change of radiation intensity I during a change of trajectory s in a certain elementary volume of the solved gaseous space. It deals with the fact that the radiation intensity weakens longitudinally with the course of the beams by absorption and diffusion in the environment and at the same time increases by the influence of gas radiation and diffusion coming from somewhere else.
In the CFX there are in total four models of heat transmission by radiation: Rosseland, P1, Discrete Transfer and Monte Carlo.
Usage of the individual mathematical models is limited especially by optical depth of the medium in which the radiation has been simulated. In the publication [24], the optical depth is mathematically defined as a product of the absorption coefficient Ka and beam average length L (therefore we do not consider the diffusion KaL). On the basis of relations stated in [19 ÷ 25], we designated by calculation that the optical depth is 0,069 for our case. From this determination, it is obvious that the suitable models are Discrete Transfer and Monte Carlo only. The model describing distribution of radiation temperature P1 should be used for optical depths above 1 only and the Rosseland model is limited by the optical depths higher than 3.
For our modelling the model of Discrete Transfer is to be used. It shows very good results for tasks dealing with burning. The method was proposed by Lockwood, see [26]. This model comes from simulation of trajectories of representative beams that are radiated, absorbed and reflected by walls surface. The calculation of the change of radiation intensity is done:
,πd
d 4TKIKsI
aaσ
+−= (12)
where σ is Stefan–Boltzmann constant.
The most important advantage of the Discrete Transfer model is its generality because it is possible to use it for any optical depths even the ones under 1. Model accuracy might be set by means of beams number for which the equation is solved. Understandably, the more beams we use for calculations, the more computational time we need. During this simulation we consider radiation of grey gas (because it is not dependant on the wave length). Generally, it can be said that this
model is of better quality than the models of P1 and Rosseland, especially as regards small optical depths. 3.5 Spectral Model
The equation (12) contains a coefficient of absorption. This coefficient must be specified. In our case we consider a spectral model Multigray for its specification that deals with burnt gases characteristics. It considers burnt gases as a mixture of grey gases. Radiation characteristics are dependent on the local concentrations of the individual components and on the temperature. The Multigray model comes from dependencies of gases emissivity on the temperature and on the product of partial pressure and length of the beam that were published for the first time by Hottel and Sarofim [20]. Based on these functional dependencies, the total emissivity εsp of the gases mixture (of the burnt gases) through the distance l is defined by means of the individual grey gases of various absorption coefficients in the following way:
( )[ ]plKa i
n
iisp −−=∑
=
exp11
ε , (13)
where ai is a weight factor of emissivity for i-component of gray gases [1], Ki represents absorption coefficient of i-component (m−1) of gray gases, p represents partial pressure of all components contained in the burnt gases (Pa) and l is an average length of the beam (m). Necessary dependencies of the individual parameters contained in the Eq. (13) are described in details in [27, 28]. 4 Modelled situation description and input data obtained
by experiments
The model is designed for the situation when the furnace was in operation during thermic processing of rubber under the volume input power of 60 kg per hour at process temperature of 600 °C.
In this case only three burners sections were in operation (S1, S2, S3) which disposed of the thermal output power of 31,1 kW for S1, 34,0 kW for S2 and 31,8 kW for S3. These output powers correspond to the following mass flow rates of methane + air mixture which amount to 0,0051, 0,0056 and 0,0052 kg·s−1 in the same order. Methane concentration is 6,1 % and oxygen concentration is 21,7 %. (Primary surplus of air is 0,9.)
On the basis of the measured concentration of oxygen that amounts to 7,7 % in the created burnt gases it was designated further that the heating gas was burnt under the given situation with total air surplus of 1,56. The following mass flow rates of the secondary air to S1, S2 and S3 sections correspond to the values of 0,0035, 0,0038 and 0,0036 kg·s−1. Oxygen and nitrogen abundance under consideration is 23,1 % and 76,9 %.
Input temperature of the secondary air and heating gas + air mixture is 21 °C and the turbulence is defined by intensity of 10 % and by characteristic size of the area. Burnt gases under-pressure at the outlet from the furnace is −20 Pa.
118 Technical Gazette 21, 1(2014), 115-122
S. Honus, D. Juchelková Matematički modeli izgaranja, konvekcije i prijenosa topline u eksperimentalnom toplinskom uređaju i verifikacija
We considered speed components at reactor wall equal to zero. The emissivity was set to the value of 0,98 and the diffusion coefficient to 1. We considered the walls ideally smooth.
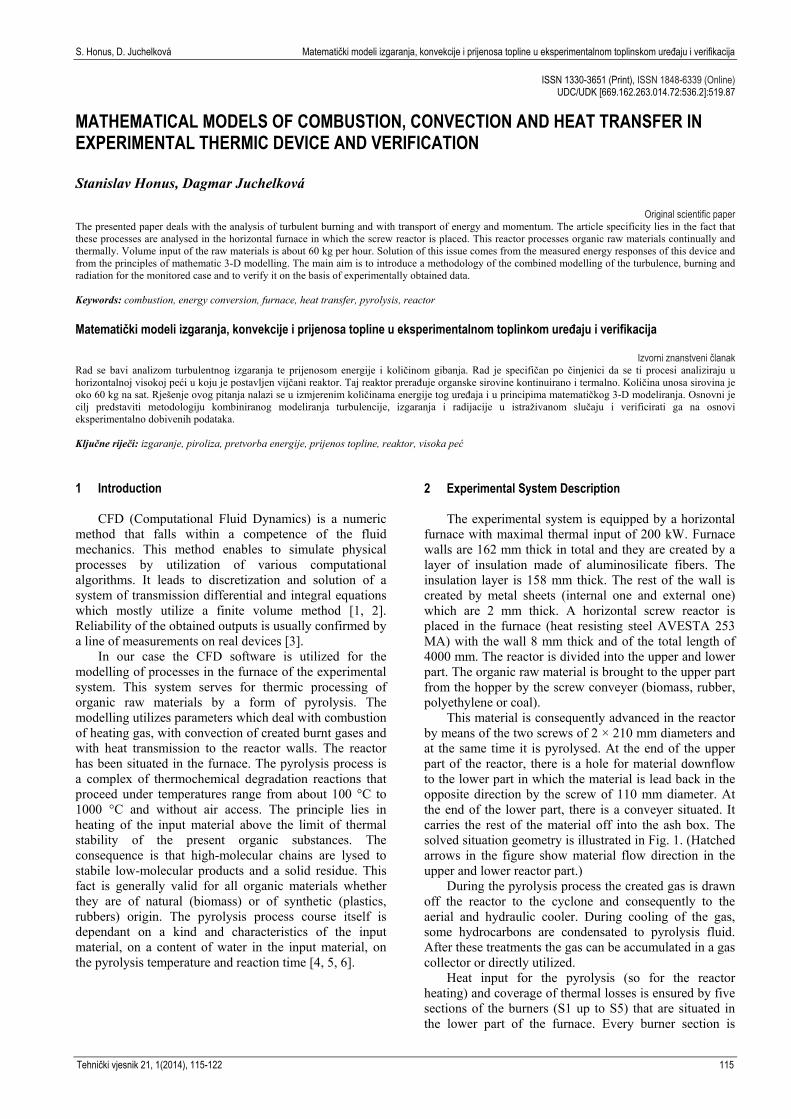
Temperatures of the reactor wall were measured at ten locations. Temperature values were recorded in intervals of a minute. Average temperatures of the wall are shown in Fig. 2.
Figure 2 Average temperatures of reactor wall
On the basis of these obtained values the wall
temperature was defined in the CFX as a polynomial function of the reactor length:
938350450105102 2538 ,L,LLT ++×+×−= −− , K, (14) where L represents the distance from the beginning of the axis parallel with the reactor. (In this case the axis beginning x (that is L) is considered at the reactor end from the reason of the frame of reference within the CFX, see Fig. 3).
Figure 3 Frame of reference in CFX
We set the following basic characteristics of the furnace wall: Thermal conductivity of 0,147 W·m−1·K−1, density of 130 kg·m−3 and specific thermal capacity of 1,140 J·kg−1·K−1. External surface temperature of the furnace walls corresponds to the average measured temperature of 81 °C. On the basis of the average temperature of the burnt gases of 196 °C and on the basis of volume flow rate of 0,044 m3
N·s−1, it was designated that the stack loss of the system is 10,5 kW. From the measured surface temperatures of the system and from the wall characteristics, it was derived that the heat leakage through the walls is 21,7 kW. This finding will serve further for the verification of the mathematic model. 5 Results and Verification
The subject matter of this experiment is especially evaluation and verification of the model from the point of view of heat fluxes by convection and radiation to reactor walls. Analysis of the flow in the furnace by means of a resultant vector field at the selected furnace localities and
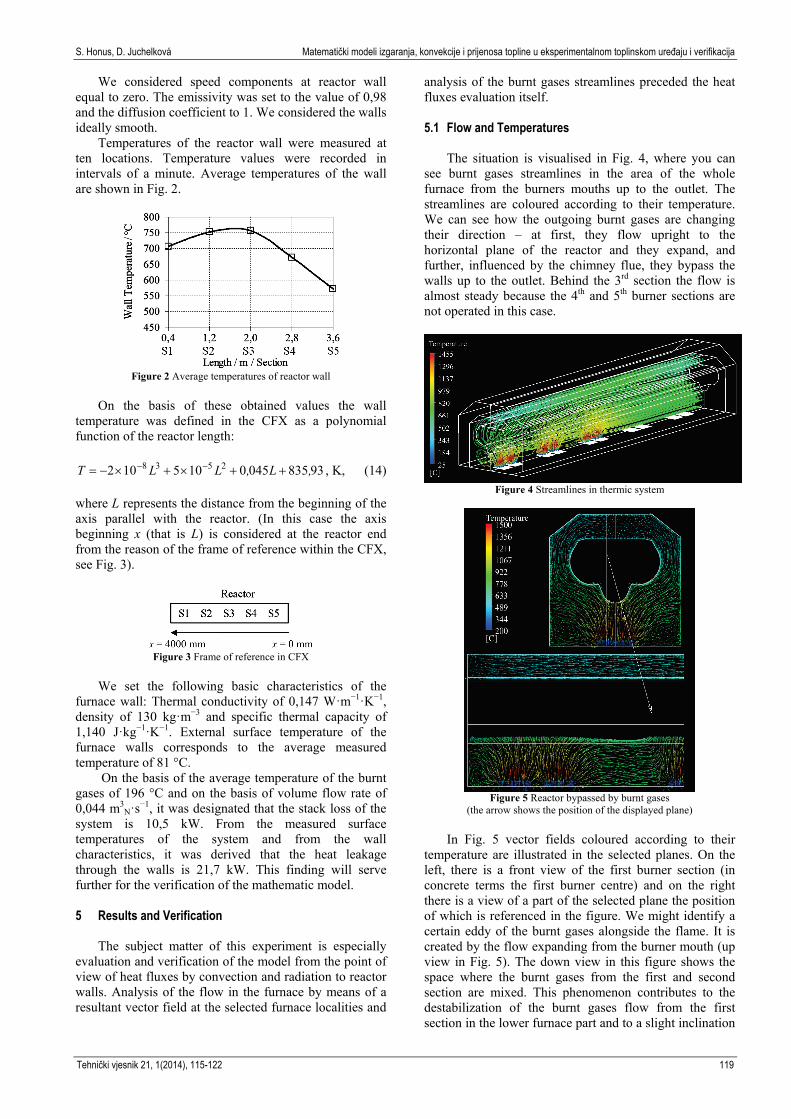
analysis of the burnt gases streamlines preceded the heat fluxes evaluation itself. 5.1 Flow and Temperatures
The situation is visualised in Fig. 4, where you can see burnt gases streamlines in the area of the whole furnace from the burners mouths up to the outlet. The streamlines are coloured according to their temperature. We can see how the outgoing burnt gases are changing their direction – at first, they flow upright to the horizontal plane of the reactor and they expand, and further, influenced by the chimney flue, they bypass the walls up to the outlet. Behind the 3rd section the flow is almost steady because the 4th and 5th burner sections are not operated in this case.
Figure 4 Streamlines in thermic system
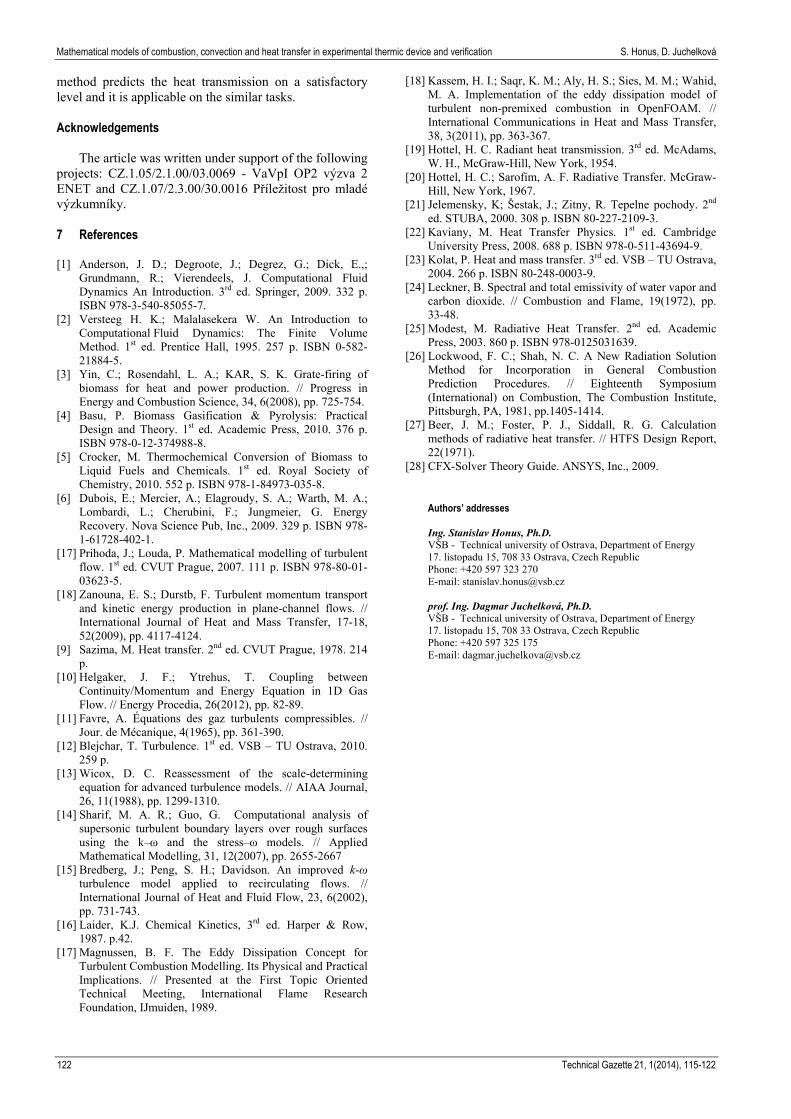
Figure 5 Reactor bypassed by burnt gases
(the arrow shows the position of the displayed plane) In Fig. 5 vector fields coloured according to their
temperature are illustrated in the selected planes. On the left, there is a front view of the first burner section (in concrete terms the first burner centre) and on the right there is a view of a part of the selected plane the position of which is referenced in the figure. We might identify a certain eddy of the burnt gases alongside the flame. It is created by the flow expanding from the burner mouth (up view in Fig. 5). The down view in this figure shows the space where the burnt gases from the first and second section are mixed. This phenomenon contributes to the destabilization of the burnt gases flow from the first section in the lower furnace part and to a slight inclination
Tehnički vjesnik 21, 1(2014), 115-122 119

Mathematical models of combustion, convection and heat transfer in experimental thermic device and verification S. Honus, D. Juchelková
of flame in the second section. Mixing is also a cause of the increased speed of the burnt gases alongside the furnace length.
The presented visualizations show that during the flow there is no development of undesirable burnt gases circulations that would have unfavourable influence on the combustion process run (that is on the wrong run of burners). We can claim that the present conception of the furnace is suitable and that it was verified by this mathematic model from a point of view of its aerodynamics and of the burners operation. Further, we can see how the reactor is "lashed" especially in its secondary part (that is in the lower part behind the secondary screw). The consequences of that are illustrated in Fig. 6 from the point of view of the heat fluxes. The flame temperatures are satisfactory in the closeness of reactor's wall. This fact confirmed that the setting of the total surplus of air (of about 1,6) from the point of view of the walls' thermal stress was correct. However, in the case of burners' continual operation under this output power, we must comply with the following prerequisite. That is that the reactor must be completely filled up by the input material because it also serves for cooling it down. As we can notice, the temperatures in the upper part of the furnace are lower than in the inferior part because the burnt gases are partly cooled down in the direction from the burners’ mouth up to the upper furnace walls. Maximal temperature in the area is 1470 °C. 5.2 Heat transfer and Verification
Fig. 6 illustrates a field of heat flux density to the
reactor walls. It deals with a total specific heat flux that is a sum of the radiation and convection. The negative value is understood as the received heat. We can recognise that the heat fluxes to the walls have the highest density in the lower reactor part at the locations directly above the burners especially in the first section. It is caused by the fact that the reactor has lower temperature in these areas. The reactor is minimally thermally stressed in its upper part what is caused by cooling down of the burnt gases. According to the mathematical model, the average value of the specific heat flux reaches 16,3 kW·m−2 and the total heat flux to reactor's walls is 79,9 kW (from that value, the radiation component is 68,0 kW and the convective component is 11,9 kW).
Figure 6 Visualization of heat fluxes to reactor walls
Based on the total burners' output power (97 kW), on
the thermal losses through walls (21,7 kW) and on the losses in burnt gases (10,5 kW), we might deduce that the
total heat flux to reactor's walls in the real system amounts to 64,8 kW. See Fig. 7.
The heat flux predicted by the mathematic model deviates from the measured data by 18,9 %. The main reasons why the simulation overestimates the heat fluxes might be the following: - The experimental measurements themselves are
always encumbered with a certain mistake. Therefore, we cannot consider that we obtain completely correct values by the measurement of the researched quantities.
- The temperature of the lower furnace wall (fluid) was defined by the only value.
- The thermal field of reactor's wall was determined from insufficient number of the set input data within the edge conditions (the surface temperatures are measured at 10 reactor's locations only) and also the emissivity of walls was set inaccurately.
- Mathematic modelling of the flow in the transition regime when the turbulence has not been completely developed is considered to be a problematic issue generally. So we cannot expect that the k-ω model is able to predict the flow precisely.
- The unsteady state is not considered.
Figure 7 Results comparison dealing with total heat flux to
reactor's walls Because of the fact that many phenomena affect the real device that cannot be taken into account within the model and in addition, because we cannot obtain absolutely precise results from the measurements, and regardless of the mentioned deviation, we can claim that, for the solved situation, the selected methodology of the mathematical modelling was verified as a suitable one.
Figure 8 Lines for Heat Fluxes Evaluation for Models
5.3 Analysis of heat fluxes from the point of view of
selected locations at reactor walls
Profiles of heat fluxes alongside reactor length are illustrated also in the graph in Fig. 9. Three locations at reactor walls in a form of segments were selected to
120 Technical Gazette 21, 1(2014), 115-122

S. Honus, D. Juchelková Matematički modeli izgaranja, konvekcije i prijenosa topline u eksperimentalnom toplinskom uređaju i verifikacija
which these fluxes are related (in lower, central and upper positions). Their position including corresponding designation is illustrated in Fig. 8.
Heat fluxes might be evaluated from two aspects - a) from the point of view of dependence on reactor's length and b) with regard to a vertical distance from the burners’ mouths.
a) As regards the first aspect mentioned, the mathematical model shows that the heat flux to the walls of reactor's lower part (line no. 1) at its beginning equals to about 70 kW·m−2 and then, regardless of some fluctuations at certain localities, it gradually decreases all the way to the distance of about 2,5 m from the beginning of the frame of reference where it amounts to 24 kW·m−2. Further, the heat flux is of the slightly increasing character all the way to reactor's outlet.
The mentioned fluctuations of the heat fluxes are understandable because they occur above the heating gas burners where the burnt gases are of higher temperatures. High values of the heat fluxes in the area of the first section are caused by low temperature of the material that enters the reactor here and "cools its walls down". The material temperature gradually increases what causes decreasing of the heat fluxes because the difference in temperature between the burnt gases and the wall decreases too. In the distance of about 2,5 m from the beginning of the frame of reference, the material has already reached the required process temperature.
From this distance there are no fluctuations of the heat fluxes because the 4th and 5th burner section are not in operation. In the middle and upper part of the reactor (what is related to lines no. 2 and 3), the heat fluxes are of
the decreasing character up to a half of the reactor length. At the same time, there are no fluctuations because the thermal field is not influenced by flames so much and it is more "steady" in the higher parts of the furnace.
b) The heat fluxes to the lower reactor part (line no. 1) are more intensive than to the middle part (line no. 2) and to the upper part (line no. 3). It is caused by the fact that the burnt gases temperature gradually decreases in the direction from burners’ mouth to the upper wall of the furnace (see e.g. Fig. 5).
The average values of the heat fluxes related to the individual lines (in the order from 1 up to 3) are 35,4, 12,9 and 3,6 kW·m−2. Heat fluxes density around reactor's diameter significantly differs then.
We might for example deduce that the heat flux to the lower reactor part assumes the value mostly 10 times higher than to the upper part. In the area from 1,1 to 2,3 m of the reactor length, the received heat is even zero and there is a transition of the heat from the wall to the burnt gases (on average it is 0,8 kW·m−2). These huge differences are caused by both, by higher radiation and by higher convection in the lower part of the furnace because in this area the flame of high temperatures radiates energy (radiation) and the burnt gases are quicker (convection).
In Fig. 10 the individual components of the heat flux to the lower reactor part were compared in order to have the full picture. As we can see, the radiation is dominant. The average density of the radiation flux and of the convective flux amounts to 29,4 kW·m−2 and 6,0 kW·m−2 in the same order. So the radiation within this "locality" takes a share of 83 % in the total heat transmission.
Figure 9 Heat flux density course to various parts of reactor walls
Figure 10 Density course of radiation and convection heat flux to the lowest reactor part (Line no. 1)
6 Conclusion
The paper introduces the furnace model for the experimental pyrolysis system. The model comes from the measured energy responses of the system when the rubber of mass input of 60 kg per hour was processed at
the process temperature of 600 °C. The results of the model were verified on the basis of furnace thermal balance and the found deviation was 18,9 %.
Because of the fact that the issue was solved comprehensively, we might consider the deviation acceptable. We might claim that in our case the selected
Tehnički vjesnik 21, 1(2014), 115-122 121
Mathematical models of combustion, convection and heat transfer in experimental thermic device and verification S. Honus, D. Juchelková
method predicts the heat transmission on a satisfactory level and it is applicable on the similar tasks. Acknowledgements
The article was written under support of the following
projects: CZ.1.05/2.1.00/03.0069 - VaVpI OP2 výzva 2 ENET and CZ.1.07/2.3.00/30.0016 Příležitost pro mladé výzkumníky. 7 References [1] Anderson, J. D.; Degroote, J.; Degrez, G.; Dick, E.,;
Grundmann, R.; Vierendeels, J. Computational Fluid Dynamics An Introduction. 3rd ed. Springer, 2009. 332 p. ISBN 978-3-540-85055-7.
[2] Versteeg H. K.; Malalasekera W. An Introduction to Computational Fluid Dynamics: The Finite Volume Method. 1st ed. Prentice Hall, 1995. 257 p. ISBN 0-582-21884-5.
[3] Yin, C.; Rosendahl, L. A.; KAR, S. K. Grate-firing of biomass for heat and power production. // Progress in Energy and Combustion Science, 34, 6(2008), pp. 725-754.
[4] Basu, P. Biomass Gasification & Pyrolysis: Practical Design and Theory. 1st ed. Academic Press, 2010. 376 p. ISBN 978-0-12-374988-8.
[5] Crocker, M. Thermochemical Conversion of Biomass to Liquid Fuels and Chemicals. 1st ed. Royal Society of Chemistry, 2010. 552 p. ISBN 978-1-84973-035-8.
[6] Dubois, E.; Mercier, A.; Elagroudy, S. A.; Warth, M. A.; Lombardi, L.; Cherubini, F.; Jungmeier, G. Energy Recovery. Nova Science Pub, Inc., 2009. 329 p. ISBN 978-1-61728-402-1.
[17] Prihoda, J.; Louda, P. Mathematical modelling of turbulent flow. 1st ed. CVUT Prague, 2007. 111 p. ISBN 978-80-01-03623-5.
[18] Zanouna, E. S.; Durstb, F. Turbulent momentum transport and kinetic energy production in plane-channel flows. // International Journal of Heat and Mass Transfer, 17-18, 52(2009), pp. 4117-4124.
[9] Sazima, M. Heat transfer. 2nd ed. CVUT Prague, 1978. 214 p.
[10] Helgaker, J. F.; Ytrehus, T. Coupling between Continuity/Momentum and Energy Equation in 1D Gas Flow. // Energy Procedia, 26(2012), pp. 82-89.
[11] Favre, A. Équations des gaz turbulents compressibles. // Jour. de Mécanique, 4(1965), pp. 361-390.
[12] Blejchar, T. Turbulence. 1st ed. VSB – TU Ostrava, 2010. 259 p.
[13] Wicox, D. C. Reassessment of the scale-determining equation for advanced turbulence models. // AIAA Journal, 26, 11(1988), pp. 1299-1310.
[14] Sharif, M. A. R.; Guo, G. Computational analysis of supersonic turbulent boundary layers over rough surfaces using the k–ω and the stress–ω models. // Applied Mathematical Modelling, 31, 12(2007), pp. 2655-2667
[15] Bredberg, J.; Peng, S. H.; Davidson. An improved k-ω turbulence model applied to recirculating flows. // International Journal of Heat and Fluid Flow, 23, 6(2002), pp. 731-743.
[16] Laider, K.J. Chemical Kinetics, 3rd ed. Harper & Row, 1987. p.42.
[17] Magnussen, B. F. The Eddy Dissipation Concept for Turbulent Combustion Modelling. Its Physical and Practical Implications. // Presented at the First Topic Oriented Technical Meeting, International Flame Research Foundation, IJmuiden, 1989.
[18] Kassem, H. I.; Saqr, K. M.; Aly, H. S.; Sies, M. M.; Wahid, M. A. Implementation of the eddy dissipation model of turbulent non-premixed combustion in OpenFOAM. // International Communications in Heat and Mass Transfer, 38, 3(2011), pp. 363-367.
[19] Hottel, H. C. Radiant heat transmission. 3rd ed. McAdams, W. H., McGraw-Hill, New York, 1954.
[20] Hottel, H. C.; Sarofim, A. F. Radiative Transfer. McGraw-Hill, New York, 1967.
[21] Jelemensky, K; Šestak, J.; Zitny, R. Tepelne pochody. 2nd ed. STUBA, 2000. 308 p. ISBN 80-227-2109-3.
[22] Kaviany, M. Heat Transfer Physics. 1st ed. Cambridge University Press, 2008. 688 p. ISBN 978-0-511-43694-9.
[23] Kolat, P. Heat and mass transfer. 3rd ed. VSB – TU Ostrava, 2004. 266 p. ISBN 80-248-0003-9.
[24] Leckner, B. Spectral and total emissivity of water vapor and carbon dioxide. // Combustion and Flame, 19(1972), pp. 33-48.
[25] Modest, M. Radiative Heat Transfer. 2nd ed. Academic Press, 2003. 860 p. ISBN 978-0125031639.
[26] Lockwood, F. C.; Shah, N. C. A New Radiation Solution Method for Incorporation in General Combustion Prediction Procedures. // Eighteenth Symposium (International) on Combustion, The Combustion Institute, Pittsburgh, PA, 1981, pp.1405-1414.
[27] Beer, J. M.; Foster, P. J., Siddall, R. G. Calculation methods of radiative heat transfer. // HTFS Design Report, 22(1971).
[28] CFX-Solver Theory Guide. ANSYS, Inc., 2009.
Authors’ addresses Ing. Stanislav Honus, Ph.D. VŠB - Technical university of Ostrava, Department of Energy 17. listopadu 15, 708 33 Ostrava, Czech Republic Phone: +420 597 323 270 E-mail: [email protected] prof. Ing. Dagmar Juchelková, Ph.D. VŠB - Technical university of Ostrava, Department of Energy 17. listopadu 15, 708 33 Ostrava, Czech Republic Phone: +420 597 325 175 E-mail: [email protected]
122 Technical Gazette 21, 1(2014), 115-122