ryder system, inc. 3q earnings presentation
TRANSCRIPT

Third Quarter 2015 Earnings Conference Call
October 22, 2015

© 2015 Ryder System, Inc. All Rights Reserved.
Safe Harbor and Non-GAAP Financial Measures
2
Certain statements and information included in this presentation are "forward-looking statements" under the Federal Private Securities Litigation Reform Act of 1995, including our expectations regarding earnings performance, revenue growth in our business segments, fleet growth, performance in our product lines, expansion of on-demand maintenance, demand and pricing trends in commercial rental and used vehicle sales, return on capital spread and anticipated resumption of our share repurchase program. Accordingly, these forward-looking statements should be evaluated with consideration given to the many risks and uncertainties inherent in our business that could cause actual results and events to differ materially from those in the forward-looking statements. Important factors that could cause such differences include, among others, lower than expected lease sales, decreases in commercial rental demand or poor acceptance of rental pricing, our ability to return out of service vehicles to the fleet in the fourth quarter, availability of rental vehicles to meet demand and availability of labor to maintain our fleet at normalized levels, fluctuations in market demand for used vehicles impacting current pricing and our anticipated proportion of retail versus wholesale sales, lack of customer demand for on-demand maintenance, higher than expected maintenance costs from new engine technology or due to lower than expected benefits from maintenance initiatives and a newer fleet, setbacks in the economic recovery, decreases in freight demand or volumes, poor operational execution particularly with start-ups and new product launches, our ability to obtain adequate profit margins for our services, our inability to maintain current pricing levels due to soft economic conditions, slower than expected economic recovery in the U.K., business interruptions or expenditures due to severe weather or natural occurrences, competition from other service providers and new entrants, customer retention levels, loss of key customers, driver and technician shortages resulting in higher procurement costs and turnover rates, unexpected bad debt reserves or write-offs, changes in customers’ business environments that will limit their ability to commit to long-term vehicle leases, a decrease in credit ratings, increased debt costs, adequacy of accounting estimates, reserves and accruals particularly with respect to pension, taxes, depreciation, insurance and revenue, sudden or unusual changes in fuel prices, unanticipated currency exchange rate fluctuations, our ability to manage our cost structure, and the risks described in our filings with the Securities and Exchange Commission. The risks included here are not exhaustive. New risks emerge from time to time and it is not possible for management to predict all such risk factors or to assess the impact of such risks on our business. Accordingly, we undertake no obligation to publicly update or revise any forward-looking statements, whether as a result of new information, future events, or otherwise.
This presentation includes certain non-GAAP financial measures as defined under SEC rules, including operating revenue, operating revenue growth excluding foreign exchange, comparable earnings and earnings per share, comparable earnings per share forecast, comparable earnings before income tax, comparable tax rate, adjusted return on capital (and return on capital spread), total cash generated, free cash flow, and the ratios based on these financial measures. Refer to Appendix – Non-GAAP Financial Measures for more information about the non-GAAP financial measures contained in this presentation. Additional information as required by Regulation G regarding non-GAAP financial measures can be found in our most recent Form 10-K, Form 10-Q and our Form 8-K filed as of the date of this presentation with the SEC, which are available at http://investors.ryder.com.
Beginning in 2015, in addition to excluding Fleet Management Solutions (FMS) fuel services revenue and subcontracted transportation from the calculation of operating revenue, we also exclude Supply Chain Solutions (SCS) and Dedicated Transportation Solutions (DTS) fuel costs billed to our customers.

© 2015 Ryder System, Inc. All Rights Reserved.
Contents
3
► Third Quarter 2015 Results Overview► Asset Management Update► Earnings Forecast► Q & A

© 2015 Ryder System, Inc. All Rights Reserved.
3rd Quarter Results Overview
4
► Comparable earnings per share from continuing operations were $1.74 vs. $1.63 in 3Q14
► Earnings per diluted share from continuing operations were $1.70 in 3Q15 vs. $1.58 in 3Q14– 3Q15 and 3Q14 included non-operating pension costs of $0.05 and $0.03,
respectively
► Operating revenue increased 6% (up 8% excluding foreign exchange) and total revenue decreased 1% vs. prior year – Total revenue declined due to lower fuel costs passed through to customers, as
well as foreign exchange

© 2015 Ryder System, Inc. All Rights Reserved.
Key Financial Statistics
5
Third Quarter($ Millions, Except Per Share Amounts)
Note: Amounts throughout presentation may not be additive due to rounding.

© 2015 Ryder System, Inc. All Rights Reserved.
Key Financial Statistics
6
Year-To-Date($ Millions, Except Per Share Amounts)
Note: Amounts throughout presentation may not be additive due to rounding.

© 2015 Ryder System, Inc. All Rights Reserved.
3rd Quarter Results Overview – FMS
7
► Fleet Management Solutions (FMS) operating revenue up 6% (up 8% excluding foreign exchange) and total revenue down 2% vs. prior year– Full service lease revenue up 6% (up 8% excluding foreign exchange)– Contract maintenance revenue up 4%– Commercial rental revenue up 7% (up 9% excluding foreign exchange)– Contract-related maintenance revenue up 5%– Total revenue declined due to lower fuel costs passed through to customers, partially offset
by higher operating revenue
► FMS earnings increased due to higher full service lease results and strong commercial rental performance, partially offset by used vehicle sales results driven by lower volumes and pricing– Favorable lease results benefited from fleet growth and vehicle residual value benefits– Strong rental performance driven by increased demand and pricing in North America
► FMS earnings before tax (EBT) up 5%– FMS EBT percent of operating revenue down 20 basis points to 12.8%

© 2015 Ryder System, Inc. All Rights Reserved.
3rd Quarter Results Overview – DTS
8
► Dedicated Transportation Solutions (DTS) operating revenue up 9% and total revenue unchanged from prior year – Operating revenue increased due to new business as well as higher volumes and pricing– Total revenue unchanged reflecting lower fuel costs passed through to customers
► DTS earnings increased primarily due to new business and higher pricing, partially offset by higher self-insurance costs
► DTS earnings before tax (EBT) up 12%– DTS EBT percent of operating revenue up 20 basis points to 7.2%
© 2015 Ryder System, Inc. All Rights Reserved.
3rd Quarter Results Overview – SCS
9
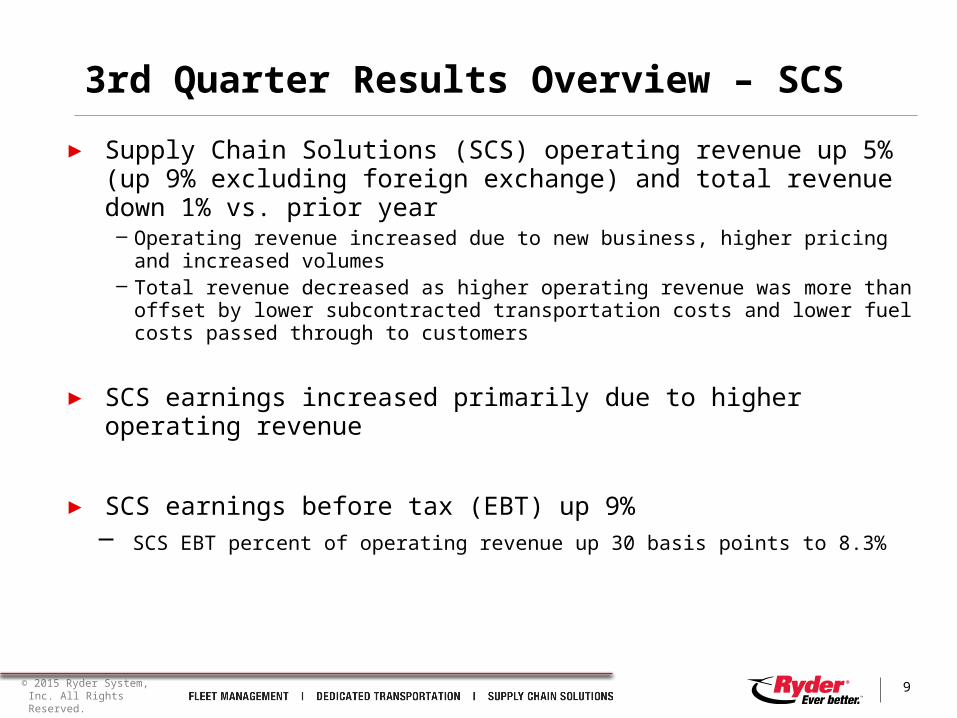
► Supply Chain Solutions (SCS) operating revenue up 5% (up 9% excluding foreign exchange) and total revenue down 1% vs. prior year– Operating revenue increased due to new business, higher pricing and increased
volumes– Total revenue decreased as higher operating revenue was more than offset by lower
subcontracted transportation costs and lower fuel costs passed through to customers
► SCS earnings increased primarily due to higher operating revenue
► SCS earnings before tax (EBT) up 9%– SCS EBT percent of operating revenue up 30 basis points to 8.3%
© 2015 Ryder System, Inc. All Rights Reserved.
Business Segments
10
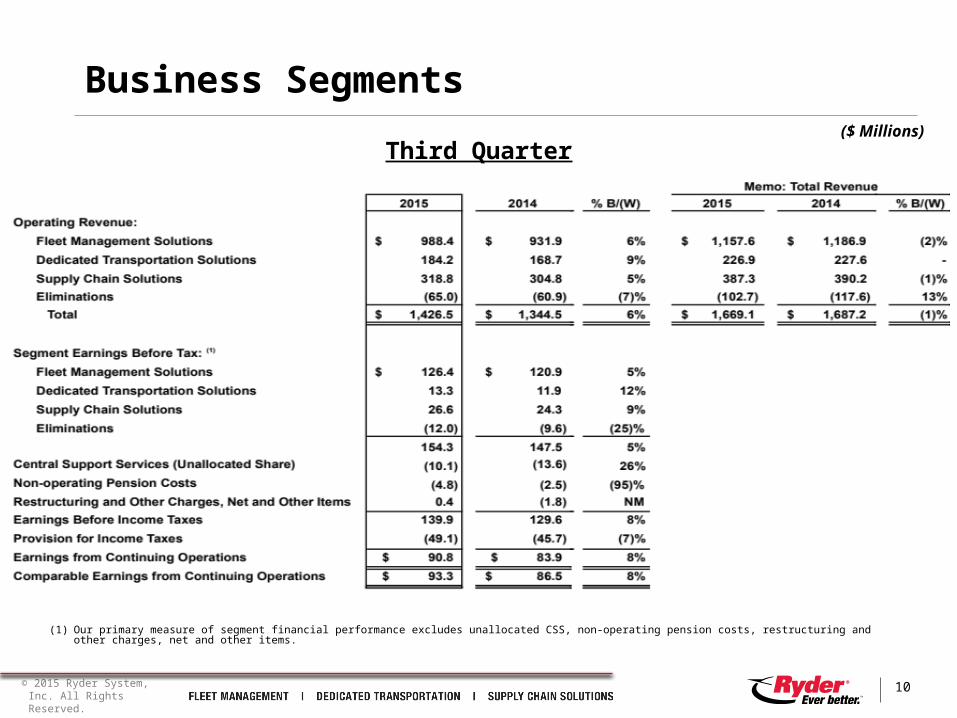
(1) Our primary measure of segment financial performance excludes unallocated CSS, non-operating pension costs, restructuring and other charges, net and other items.
($ Millions)Third Quarter

© 2015 Ryder System, Inc. All Rights Reserved.
Business Segments
11
(1) Our primary measure of segment financial performance excludes unallocated CSS, non-operating pension costs, restructuring and other charges, net and other items.
($ Millions)Year-To-Date
© 2015 Ryder System, Inc. All Rights Reserved.
Capital Expenditures
12
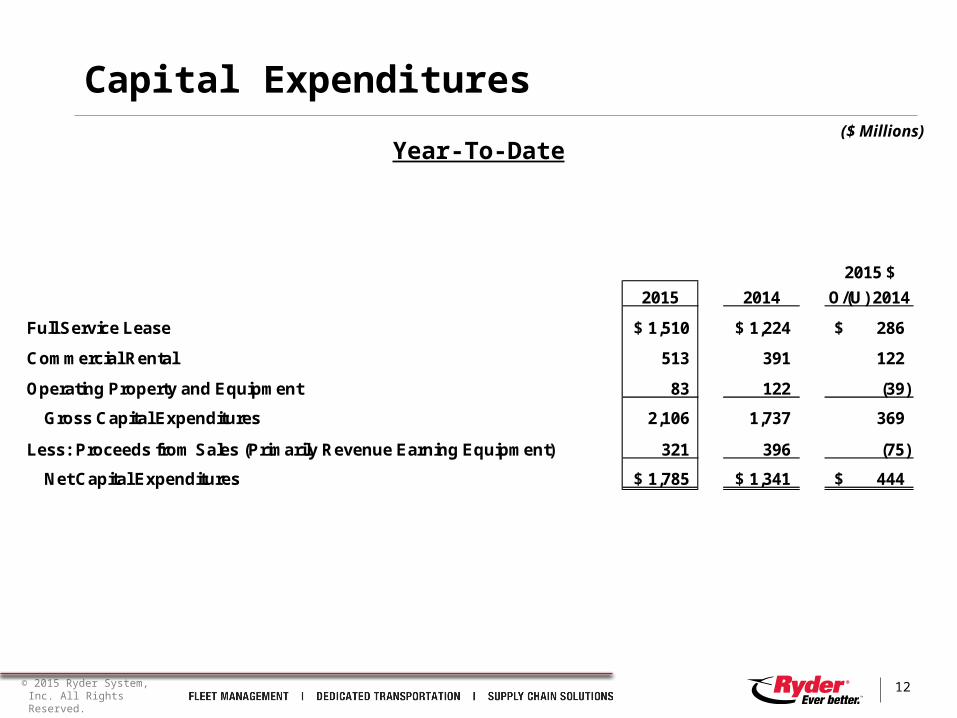
2015 $ 2015 2014 O/(U) 2014
Full Service Lease 1,510$ 1,224$ 286$
Commercial Rental 513 391 122
Operating Property and Equipment 83 122 (39) Gross Capital Expenditures 2,106 1,737 369
Less: Proceeds from Sales (Primarily Revenue Earning Equipment) 321 396 (75) Net Capital Expenditures 1,785$ 1,341$ 444$
Year-To-Date($ Millions)

© 2015 Ryder System, Inc. All Rights Reserved.
Cash Flow from Continuing Operations
13
Year-To-Date($ Millions)
(1) Capital expenditures presented net of changes in accounts payable related to purchases of revenue earning equipment.(2) Free Cash Flow excludes acquisitions and changes in restricted cash.

© 2015 Ryder System, Inc. All Rights Reserved.
Debt to Equity Ratio
14
(1)
(2)
(1) Illustrates impact of accumulated net pension related equity charge on leverage.(2) Represents long term debt to equity target of 225 - 275% while maintaining a solid investment grade rating. (3) Total Equity includes impact of accumulated net pension related equity charge of $577 million as of 9/30/2015, $585 million as of 12/31/2014 and $467 million as of 9/30/2014.
($ Millions)

© 2015 Ryder System, Inc. All Rights Reserved.
Contents
15
► Third Quarter 2015 Results Overview► Asset Management Update► Earnings Forecast► Q & A

© 2015 Ryder System, Inc. All Rights Reserved.
► Units held for sale were 6,100 at quarter end, up from 5,800 units held for sale in the prior year
─ Sequentially from the second quarter, units held for sale increased by 200 units
► The number of used vehicles sold in the third quarter was 4,400, down 12% from the prior year
─ Sequentially from the second quarter, units sold were down 6%
► Proceeds per unit were up 5% for tractors and up 8% for trucks in the third quarter compared with prior year (excluding the impact of exchange rates)
─ Proceeds per unit were down 3% for tractors and down 4% for trucks vs. the second quarter
► Average third quarter total commercial rental fleet was up 7% from the prior year
─ Average commercial rental fleet was up 3% from the second quarter
Global Asset Management Update
16

© 2015 Ryder System, Inc. All Rights Reserved.
Contents
17
► Third Quarter 2015 Results Overview► Asset Management Update► Earnings Forecast► Q & A

© 2015 Ryder System, Inc. All Rights Reserved.
EPS Forecast – Continuing Operations
18
2015 Comparable EPS Forecast(1) $ 1.72 - 1.82 $ 6.17 - 6.29
2014 Comparable EPS(2) $ 1.59 $ 5.58
Fourth Quarter Full Year
($ Earnings Per Share)
(1) 4Q15 Comparable EPS Forecast excludes $0.05 of non-operating pension costs, net. 2015 Comparable EPS Forecast excludes $0.20 of non-operating pension costs, $0.04 of professional fees, a tax law change benefit of $0.03, and a benefit from pension settlement adjustments of $0.01, net, for the full year period.
(2) 2014 Comparable EPS for the fourth quarter excluded $1.16 of pension lump sum settlement charges, $0.13 of pension settlement charges, $0.03 of non-operating pension costs, $0.03 of restructuring and other charges, net, and $0.03 of acquisition-related tax adjustment. 2014 Comparable EPS for the full year excludes $1.16 of pension lump sum settlement charges, $0.14 of pension settlement charges, $0.10 of non-operating pension costs, $0.03 of acquisition-related tax adjustment, $0.01 of acquisition transaction costs, $0.03 of restructuring and other charges, net, partially offset by a tax law change benefit of $0.03.
► Full year Comparable EPS forecast is $6.17 - $6.29
► Current forecast is as follows:

© 2015 Ryder System, Inc. All Rights Reserved.
Q&A
19

© 2015 Ryder System, Inc. All Rights Reserved.
Appendix
20
Full Service Lease Vehicle Count
Business Segment Detail
Central Support Services
Balance Sheet
Adjusted Return on Capital History
Asset Management
Non-GAAP Financial Measures & Reconciliations

© 2015 Ryder System, Inc. All Rights Reserved.
Full Service Lease (FSL) Fleet Count
21
Note: Represents end of period vehicle count.

© 2015 Ryder System, Inc. All Rights Reserved.
Fleet Management Solutions (FMS)
22
Revenue 2015 2014 % B/(W) Full Service Lease 609.3$ 575.8$ 6%Contract Maintenance 48.6 46.9 4%
Contractual Revenue 657.9 622.7 6%Commercial Rental 250.6 234.2 7%Contract-related Maintenance 59.9 56.8 5%Other 20.0 18.1 10%
Operating Revenue 988.4 931.9 6%
Fuel Services Revenue 169.2 255.0 (34)%
Total Revenue 1,157.6$ 1,186.9$ (2)%
Earnings Before TaxSegment Earnings Before Tax (EBT) 126.4$ 120.9$ 5%Segment EBT as % of Total Revenue 10.9% 10.2%
Segment EBT as % of Operating Revenue 12.8% 13.0%
Third Quarter($ Millions)

© 2015 Ryder System, Inc. All Rights Reserved.
Fleet Management Solutions (FMS)
23
Year-To-Date($ Millions)

© 2015 Ryder System, Inc. All Rights Reserved.
Dedicated Transportation Solutions (DTS)
24
($ Millions)Third Quarter

© 2015 Ryder System, Inc. All Rights Reserved.
Dedicated Transportation Solutions (DTS)
25
($ Millions)
Revenue 2015 2014 % B/(W)Operating Revenue 526.9$ 491.9$ 7%Subcontracted Transportation 42.8 56.5 (24)%
Fuel Costs 93.4 129.2 (28)%Total Revenue 663.1$ 677.5$ (2)%
Earnings Before TaxSegment Earnings Before Tax (EBT) 34.7$ 33.5$ 3%Segment EBT as % of Total Revenue 5.2% 4.9%Segment EBT as % of Operating Revenue 6.6% 6.8%
Year-To-Date

© 2015 Ryder System, Inc. All Rights Reserved.
Supply Chain Solutions (SCS)
26
($ Millions)Third Quarter

© 2015 Ryder System, Inc. All Rights Reserved.
Supply Chain Solutions (SCS)
27
($ Millions)
Revenue 2015 2014 % B/(W)Automotive 347.3$ 344.1$ 1%Technology & Healthcare 185.8 168.1 11%
CPG & Retail 323.0 299.0 8%Industrial & Other 78.2 79.3 (1)%
Operating Revenue 934.3 890.4 5%
Subcontracted Transportation 172.0 200.3 (14)%Fuel Costs 49.1 74.5 (34)%
Total Revenue 1,155.3$ 1,165.2$ (1)%
Earnings Before Tax
Segment Earnings Before Tax (EBT) 70.0$ 55.1$ 27%Segment EBT as % of Total Revenue 6.1% 4.7%Segment EBT as % of Operating Revenue 7.5% 6.2%
Year-To-Date

© 2015 Ryder System, Inc. All Rights Reserved.
Central Support Services (CSS)
28
Third Quarter($ Millions)

© 2015 Ryder System, Inc. All Rights Reserved.
Central Support Services (CSS)
29
Year-To-Date($ Millions)

© 2015 Ryder System, Inc. All Rights Reserved.
Balance Sheet
30
($ Millions)

© 2015 Ryder System, Inc. All Rights Reserved.
Adjusted Return on Capital History
AdjustedReturn on Capital (ROC)
Cost of Capital (COC)
Return on Equity
14.6% 15.5%
14.2% 11.2% 4.4% 8.4% 11.9% 14.9% 14.9% 11.3%
17.0%
Adjusted Total
Capital (2)
$3.8 $4.2 $4.8 $4.8 $4.2 $4.0 $4.6 $5.2 $5.6 $6.6 $7.1
ROC O/(U) COC
1.0% 1.2% 0.8% 0.8% (2.2)% (1.3)% 0.2% 0.9% 1.0% 1.1% 1.5%
150 bpSpreadTargeted
(1)
2015Forecast
(1) Includes pension settlement charges of $69M, primarily buyouts, which impacted Return on Equity by 360 basis points.
(2) Adjusted Total Capital represents Adjusted Average Total Capital in billions.
31

© 2015 Ryder System, Inc. All Rights Reserved.
3,138
5,255
4,899
4,033
6,752
3,005
3,348
5,119
2,352
3,727
5,557
1,861
3,101
5,008
2,274
2,896
4,646
2,390 2,180
4,028
2,286
0
1,000
2,000
3,000
4,000
5,000
6,000
7,000
8,000
Redeployments Extensions Early Terminations
N u
m b
e r
o f
U n
i t s
3Q09 YTD 3Q10 YTD 3Q11 YTD 3Q12 YTD 3Q13 YTD 3Q14 YTD 3Q15 YTD
Asset Management Update (US Only)
(a) Current year statistics may exclude some units due to a lag in reporting(b) Excludes early terminations where customer purchases vehicle
(a)(b)
Redeployments – Vehicles coming off-lease or in Rental with useful life remaining are redeployed in the Ryder fleet (SCS, or with another Lease customer). Redeployments exclude units transferred into the Rental product line.
Extensions – Ryder re-prices lease contract and extends maturity date.
Early terminations – Customer elects to terminate lease prior to maturity. Depending on the remaining useful life, the vehicle may be redeployed in the Ryder fleet (Commercial Rental, SCS, other Lease customer) or sold by Ryder.
32

© 2015 Ryder System, Inc. All Rights Reserved.
Non-GAAP Financial Measures
33
► This presentation includes “non-GAAP financial measures” as defined by SEC rules. As required by SEC rules, we provide a reconciliation of each non-GAAP financial measure to the most comparable GAAP measure. Non-GAAP financial measures should be considered in addition to, but not as a substitute for or superior to, other measures of financial performance prepared in accordance with GAAP.
► Specifically, the following non-GAAP financial measures are included in this presentation:
Non-GAAP Financial Measure Comparable GAAP MeasureReconciliation & Additional Information Presented on Slide Titled Page
Operating Revenue Growth ex-Foreign Exchange
Operating Revenue
Total Revenue
Total Revenue
Foreign Exchange Impact on Operating Revenue Growth
Key Financial Statistics
34
5-6
Comparable Earnings / Comparable EPS Earnings / EPS from Continuing Operations Earnings and EPS from Continuing Operations Reconciliation
35
Comparable Earnings Before Income Tax / Comparable Tax Rate
Earnings Before Income Tax / Tax Rate Earnings and Tax Rate from Continuing Operations Reconciliation
36
Comparable EPS Forecast EPS Forecast EPS Forecast – Continuing Operations 18
Adjusted Return on Capital Net Earnings / Total Capital Adjusted Return on Capital Reconciliation 37-38
Total Cash Generated / Free Cash Flow Cash Provided by Operating Activities Cash Flow from Continuing Operations 13
FMS Operating Revenue / DTS Operating Revenue / SCS Operating Revenue
FMS Total Revenue / DTS Total Revenue / SCS Total Revenue
Fleet Management Solutions (FMS) / Dedicated Transportation Solutions (DTS) / Supply Chain Solutions (SCS)
22-27

© 2015 Ryder System, Inc. All Rights Reserved.
34
Foreign Exchange Impact on Operating Revenue Growth
(1) Foreign exchange impact was calculated by dividing the results for the current and prior year periods by the exchange rates in effect on September 30, 2014, which was the last day of the prior year period, rather than the actual exchange rates in effect as of September 30, 2015.

© 2015 Ryder System, Inc. All Rights Reserved.
Earnings and EPS from Continuing Operations Reconciliation
35
3Q15 3Q15 3Q14 3Q14 Earnings EPS Earnings EPS
Reported 90.8$ 1.70$ 84.0$ 1.58$ Non-operating pension costs 2.7 0.05 1.4 0.03 Pension settlement adjustment (0.3) (0.01) 0.8 0.01 Acquisition transaction costs - - 0.4 0.01 Professional feesComparable (1) 93.3$ 1.74$ 86.5$ 1.63$
YTD15 YTD15 YTD14 YTD14 Earnings EPS Earnings EPS
Reported 230.1$ 4.31$ 208.7$ 3.92$ Non-operating pension costs 8.2 0.15 4.0 0.07 Professional fees 2.4 0.04 - - Pension settlement adjustment (0.3) (0.01) 0.8 0.01 Tax law change (1.9) (0.03) (1.8) (0.03) Acquisition transaction costs - - 0.4 0.01 Comparable (1) 238.5$ 4.47$ 212.2$ 3.98$
($ Millions or $ Earnings Per Share)
(1) The company uses Comparable Earnings and Comparable Earnings per Share (EPS) from Continuing Operations, both non-GAAP financial measures, which provide useful information to investors and allow for better year over year comparison of operating performance because they exclude from Earnings and EPS from Continuing Operations non-operating pension costs, which we consider to be costs outside of the operational performance of the business and can significantly change from year to year. Comparable Earnings and Comparable EPS also exclude other significant items that are not representative of our ongoing business operations and allow for better year over year comparison.

© 2015 Ryder System, Inc. All Rights Reserved.
EBT and Tax Rate from Continuing Operations Reconciliation
36
($ Millions or $ Earnings Per Share)
(1) The company uses Comparable Earnings Before Income Tax (EBT) and Comparable Tax Rate from Continuing Operations, both non-GAAP financial measures, which provide useful information to investors and allow for better year over year comparison of operating performance because they exclude from EBT and Tax Rate from Continuing Operations non-operating pension costs, which we consider to be costs outside of the operational performance of the business and can significantly change from year to year. Comparable EBT and Comparable Tax Rate also exclude other significant items that are not representative of our ongoing business operations and allow for better year over year comparison.

© 2015 Ryder System, Inc. All Rights Reserved.
Appendix: Non-GAAP Financial Measures
37
($ Millions)
(1) Earnings calculated based on a 12-month rolling period.(2) Interest expense includes interest for on and off-balance sheet vehicle obligations. (3) Income taxes were calculated by excluding taxes related to comparable earnings items and interest expense. (4) The average is calculated based on the average GAAP balances. (5) Represents comparable earnings items for those periods.
Adjusted Return on Capital Reconciliation

© 2015 Ryder System, Inc. All Rights Reserved.
Appendix: Non-GAAP Financial Measures
38
($ Millions)
(1) Earnings calculated based on a 12-month rolling period.(2) Interest expense includes interest for on and off-balance sheet vehicle obligations.(3) Income taxes were calculated by excluding taxes related to comparable earnings items and interest expense.(4) The average is calculated based on the average GAAP balances.(5) Represents comparable earnings items for those periods.
Adjusted Return on Capital Reconciliation

© 2015 Ryder System, Inc. All Rights Reserved.