3q 2018 earnings conference call
TRANSCRIPT

1 | October 31, 2018 | © 2018 Curtiss-Wright
3Q 2018 Earnings Conference Call
October 31, 2018
NYSE: CW
2 | October 31, 2018 | © 2018 Curtiss-Wright
Safe Harbor Statement
Please note that the information provided in this presentation is accurate as of the date of the original
presentation. The presentation will remain posted on this website from one to twelve months following the initial
presentation, but content will not be updated to reflect new information that may become available after the
original presentation posting. The presentation contains forward-looking statements including, among other
things, management's estimates of future performance, revenue and earnings, our management's growth
objectives, our management’s ability to integrate our acquisition, and our management's ability to produce
consistent operating improvements. These forward-looking statements are based on expectations as of the time
the statements were made only, and are subject to a number of risks and uncertainties which could cause us to
fail to achieve our then-current financial projections and other expectations.
This presentation also includes certain non-GAAP financial measures with reconciliations to GAAP financial
measures being made available in the earnings release that is posted to our website and furnished with the SEC.
We undertake no duty to update this information. More information about potential factors that could affect our
business and financial results is included in our filings with the Securities and Exchange Commission, including
our Annual Reports on Form 10-K and Quarterly Reports on Form 10-Q, including, among other sections, under
the captions, "Risk Factors" and "Management's Discussion and Analysis of Financial Condition and Results of
Operations," which is on file with the SEC and available at the SEC's website at www.sec.gov.
3 | October 31, 2018 | © 2018 Curtiss-Wright
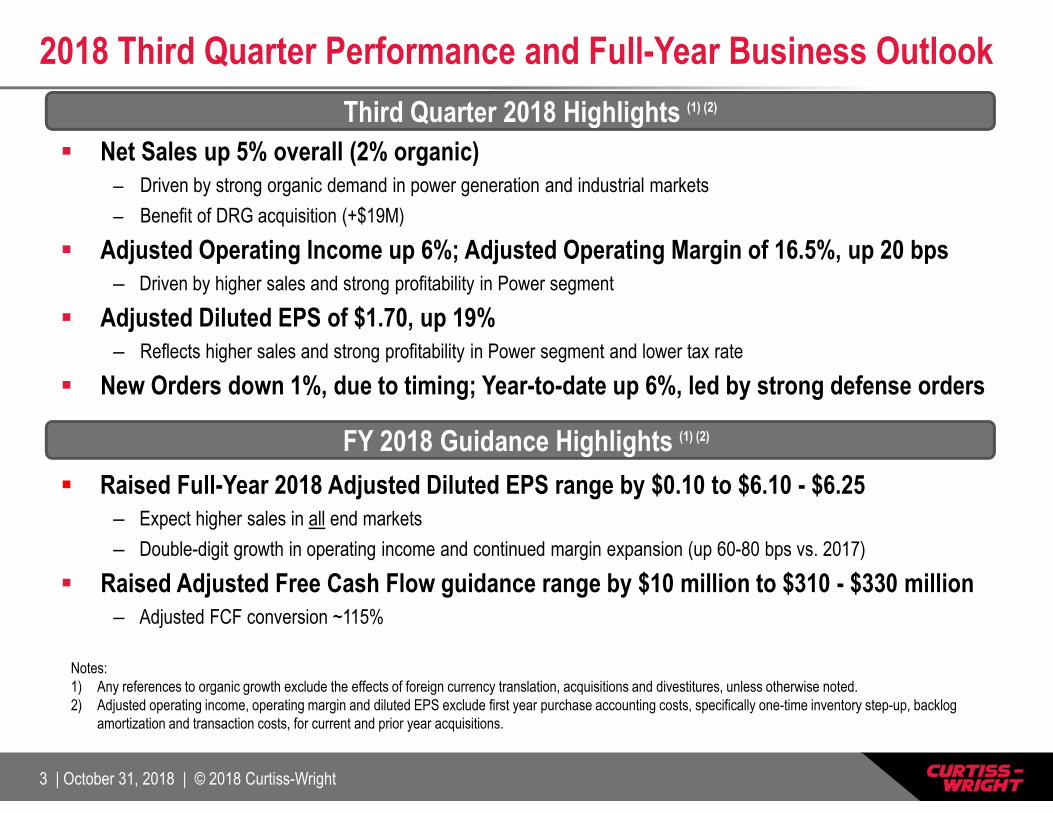
2018 Third Quarter Performance and Full-Year Business Outlook
Net Sales up 5% overall (2% organic)– Driven by strong organic demand in power generation and industrial markets
– Benefit of DRG acquisition (+$19M)
Adjusted Operating Income up 6%; Adjusted Operating Margin of 16.5%, up 20 bps– Driven by higher sales and strong profitability in Power segment
Adjusted Diluted EPS of $1.70, up 19%– Reflects higher sales and strong profitability in Power segment and lower tax rate
New Orders down 1%, due to timing; Year-to-date up 6%, led by strong defense orders
Third Quarter 2018 Highlights (1) (2)
FY 2018 Guidance Highlights (1) (2)
Raised Full-Year 2018 Adjusted Diluted EPS range by $0.10 to $6.10 - $6.25– Expect higher sales in all end markets
– Double-digit growth in operating income and continued margin expansion (up 60-80 bps vs. 2017)
Raised Adjusted Free Cash Flow guidance range by $10 million to $310 - $330 million– Adjusted FCF conversion ~115%
Notes: 1) Any references to organic growth exclude the effects of foreign currency translation, acquisitions and divestitures, unless otherwise noted. 2) Adjusted operating income, operating margin and diluted EPS exclude first year purchase accounting costs, specifically one-time inventory step-up, backlog
amortization and transaction costs, for current and prior year acquisitions.
4 | October 31, 2018 | © 2018 Curtiss-Wright
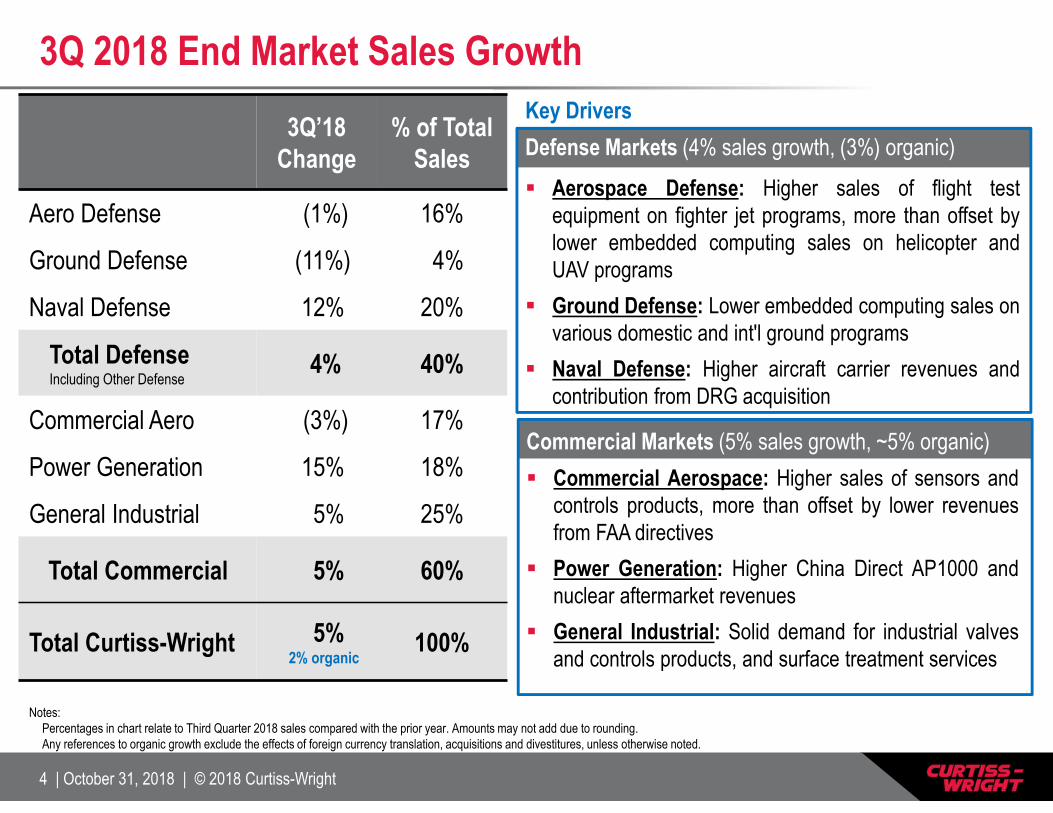
Key Drivers
Defense Markets (4% sales growth, (3%) organic)
Aerospace Defense: Higher sales of flight testequipment on fighter jet programs, more than offset bylower embedded computing sales on helicopter andUAV programs
Ground Defense: Lower embedded computing sales onvarious domestic and int'l ground programs
Naval Defense: Higher aircraft carrier revenues andcontribution from DRG acquisition
3Q 2018 End Market Sales Growth
Notes: Percentages in chart relate to Third Quarter 2018 sales compared with the prior year. Amounts may not add due to rounding.Any references to organic growth exclude the effects of foreign currency translation, acquisitions and divestitures, unless otherwise noted.
3Q’18Change
% of Total Sales
Aero Defense (1%) 16%
Ground Defense (11%) 4%
Naval Defense 12% 20%
Total DefenseIncluding Other Defense
4% 40%
Commercial Aero (3%) 17%
Power Generation 15% 18%
General Industrial 5% 25%
Total Commercial 5% 60%
Total Curtiss-Wright 5%2% organic
100%
Commercial Markets (5% sales growth, ~5% organic)
Commercial Aerospace: Higher sales of sensors andcontrols products, more than offset by lower revenuesfrom FAA directives
Power Generation: Higher China Direct AP1000 andnuclear aftermarket revenues
General Industrial: Solid demand for industrial valvesand controls products, and surface treatment services

5 | October 31, 2018 | © 2018 Curtiss-Wright
3Q 2018 Adjusted Operating Income / Margin Drivers
($ in millions)
3Q’18Adjusted(1)
3Q’17Adjusted(1)
Change vs. 2017
Adjusted(1) Key Drivers
Commercial / Industrial
Margin
$44.8
15.2%
$46.7
15.9%
(4%)
(70 bps)
Unfavorable mix Lower sales and unfavorable absorption in
sensors and controls business Benefit of Op margin improvement initiatives,
including savings from prior restructuring actions
Defense
Margin
33.6
24.3%
33.6
23.7%
0%
60 bps
Unfavorable absorption Favorable FX
Power
Margin
29.5
18.2%
17.8
13.5%
66%
470 bps
China Direct AP1000: Higher sales and improved profitability
Total Segments
Adjusted Operating Income$107.9 $98.1 10%
Corp & Other ($9.6) ($5.6) (70%) Higher pension costs
Total CW Adjusted Op Income
Margin
$98.3
16.5%
$92.4
16.3%
6%
20 bps
1) Adjusted operating income and operating margin exclude first year purchase accounting costs, specifically one-time inventory step-up, backlog amortization and transaction costs.
Note: Amounts may not add down due to rounding.
6 | October 31, 2018 | © 2018 Curtiss-Wright
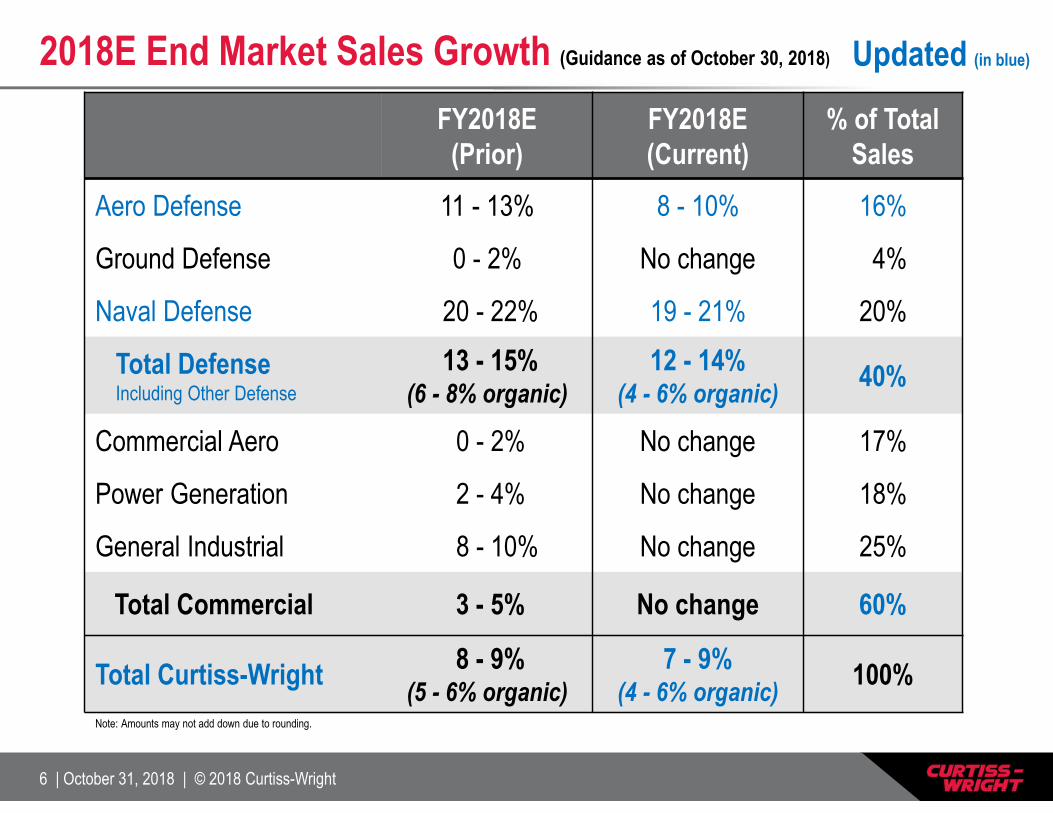
2018E End Market Sales Growth (Guidance as of October 30, 2018)
FY2018E(Prior)
FY2018E(Current)
% of Total Sales
Aero Defense 11 - 13% 8 - 10% 16%
Ground Defense 0 - 2% No change 4%
Naval Defense 20 - 22% 19 - 21% 20%
Total DefenseIncluding Other Defense
13 - 15%(6 - 8% organic)
12 - 14%(4 - 6% organic)
40%
Commercial Aero 0 - 2% No change 17%
Power Generation 2 - 4% No change 18%
General Industrial 8 - 10% No change 25%
Total Commercial 3 - 5% No change 60%
Total Curtiss-Wright8 - 9%
(5 - 6% organic)7 - 9%
(4 - 6% organic)100%
Note: Amounts may not add down due to rounding.
Updated (in blue)
7 | October 31, 2018 | © 2018 Curtiss-Wright
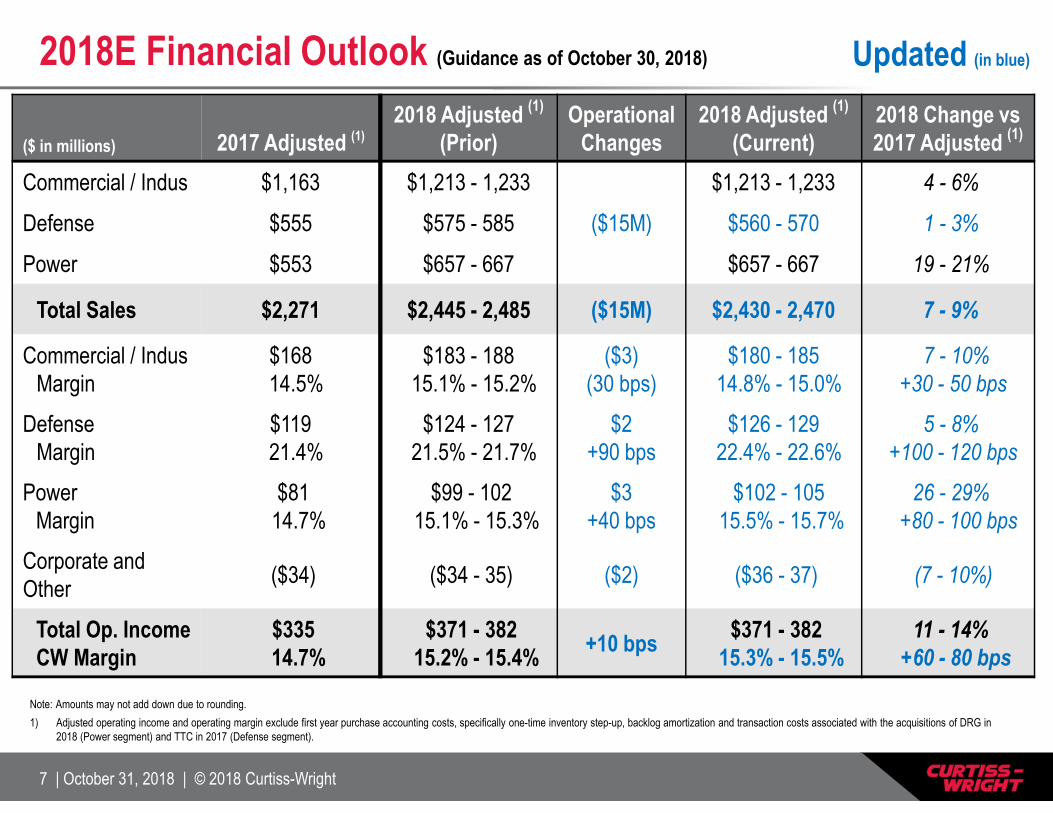
($ in millions) 2017 Adjusted (1)
2018 Adjusted (1)
(Prior)Operational
Changes2018 Adjusted (1)
(Current)2018 Change vs 2017 Adjusted (1)
Commercial / Indus $1,163 $1,213 - 1,233 $1,213 - 1,233 4 - 6%
Defense $555 $575 - 585 ($15M) $560 - 570 1 - 3%
Power $553 $657 - 667 $657 - 667 19 - 21%
Total Sales $2,271 $2,445 - 2,485 ($15M) $2,430 - 2,470 7 - 9%
Commercial / IndusMargin
$16814.5%
$183 - 18815.1% - 15.2%
($3)(30 bps)
$180 - 18514.8% - 15.0%
7 - 10%+30 - 50 bps
DefenseMargin
$11921.4%
$124 - 12721.5% - 21.7%
$2+90 bps
$126 - 12922.4% - 22.6%
5 - 8%+100 - 120 bps
PowerMargin
$81 14.7%
$99 - 102 15.1% - 15.3%
$3+40 bps
$102 - 105 15.5% - 15.7%
26 - 29%+80 - 100 bps
Corporate and Other
($34) ($34 - 35) ($2) ($36 - 37) (7 - 10%)
Total Op. IncomeCW Margin
$33514.7%
$371 - 38215.2% - 15.4%
+10 bps$371 - 382
15.3% - 15.5%11 - 14%
+60 - 80 bps
2018E Financial Outlook (Guidance as of October 30, 2018)
Note: Amounts may not add down due to rounding.
1) Adjusted operating income and operating margin exclude first year purchase accounting costs, specifically one-time inventory step-up, backlog amortization and transaction costs associated with the acquisitions of DRG in 2018 (Power segment) and TTC in 2017 (Defense segment).
Updated (in blue)
8 | October 31, 2018 | © 2018 Curtiss-Wright
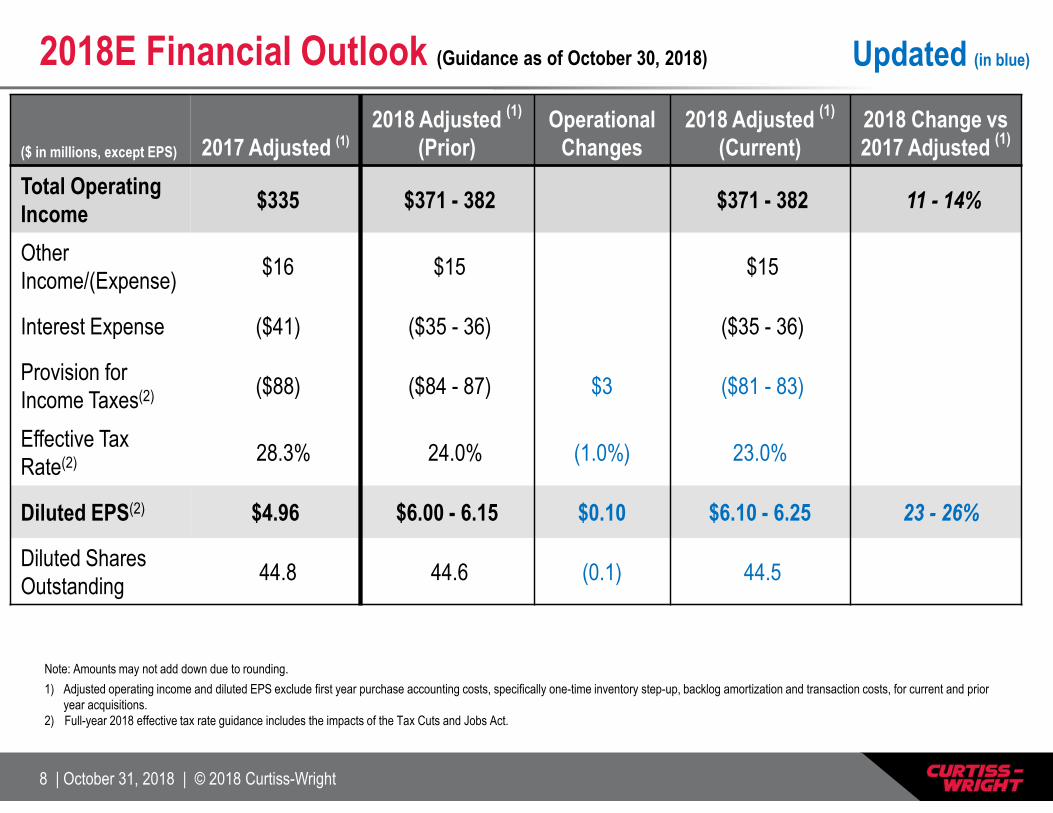
2018E Financial Outlook (Guidance as of October 30, 2018)
Note: Amounts may not add down due to rounding.
1) Adjusted operating income and diluted EPS exclude first year purchase accounting costs, specifically one-time inventory step-up, backlog amortization and transaction costs, for current and prior year acquisitions.
2) Full-year 2018 effective tax rate guidance includes the impacts of the Tax Cuts and Jobs Act.
Updated (in blue)
($ in millions, except EPS) 2017 Adjusted (1)
2018 Adjusted (1)
(Prior)Operational
Changes2018 Adjusted (1)
(Current)2018 Change vs 2017 Adjusted (1)
Total Operating Income
$335 $371 - 382 $371 - 382 11 - 14%
Other Income/(Expense)
$16 $15 $15
Interest Expense ($41) ($35 - 36) ($35 - 36)
Provision for Income Taxes(2) ($88) ($84 - 87) $3 ($81 - 83)
Effective Tax Rate(2) 28.3% 24.0% (1.0%) 23.0%
Diluted EPS(2) $4.96 $6.00 - 6.15 $0.10 $6.10 - 6.25 23 - 26%
Diluted Shares Outstanding
44.8 44.6 (0.1) 44.5
9 | October 31, 2018 | © 2018 Curtiss-Wright
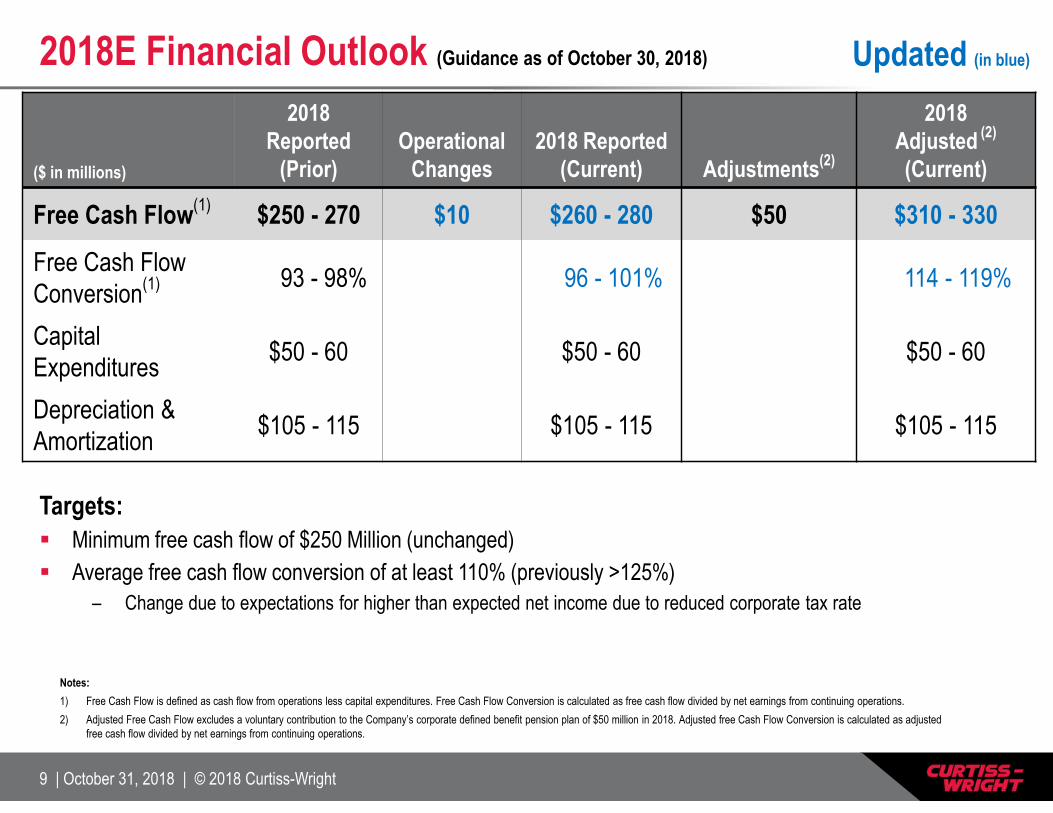
2018E Financial Outlook (Guidance as of October 30, 2018) Updated (in blue)
($ in millions)
2018 Reported
(Prior)Operational
Changes2018 Reported
(Current) Adjustments(2)
2018 Adjusted (2)
(Current)
Free Cash Flow(1)
$250 - 270 $10 $260 - 280 $50 $310 - 330
Free Cash Flow Conversion
(1) 93 - 98% 96 - 101% 114 - 119%
Capital Expenditures
$50 - 60 $50 - 60 $50 - 60
Depreciation & Amortization
$105 - 115 $105 - 115 $105 - 115
Notes:
1) Free Cash Flow is defined as cash flow from operations less capital expenditures. Free Cash Flow Conversion is calculated as free cash flow divided by net earnings from continuing operations.
2) Adjusted Free Cash Flow excludes a voluntary contribution to the Company’s corporate defined benefit pension plan of $50 million in 2018. Adjusted free Cash Flow Conversion is calculated as adjusted free cash flow divided by net earnings from continuing operations.
Targets:
Minimum free cash flow of $250 Million (unchanged)
Average free cash flow conversion of at least 110% (previously >125%)
– Change due to expectations for higher than expected net income due to reduced corporate tax rate
10 | October 31, 2018 | © 2018 Curtiss-Wright
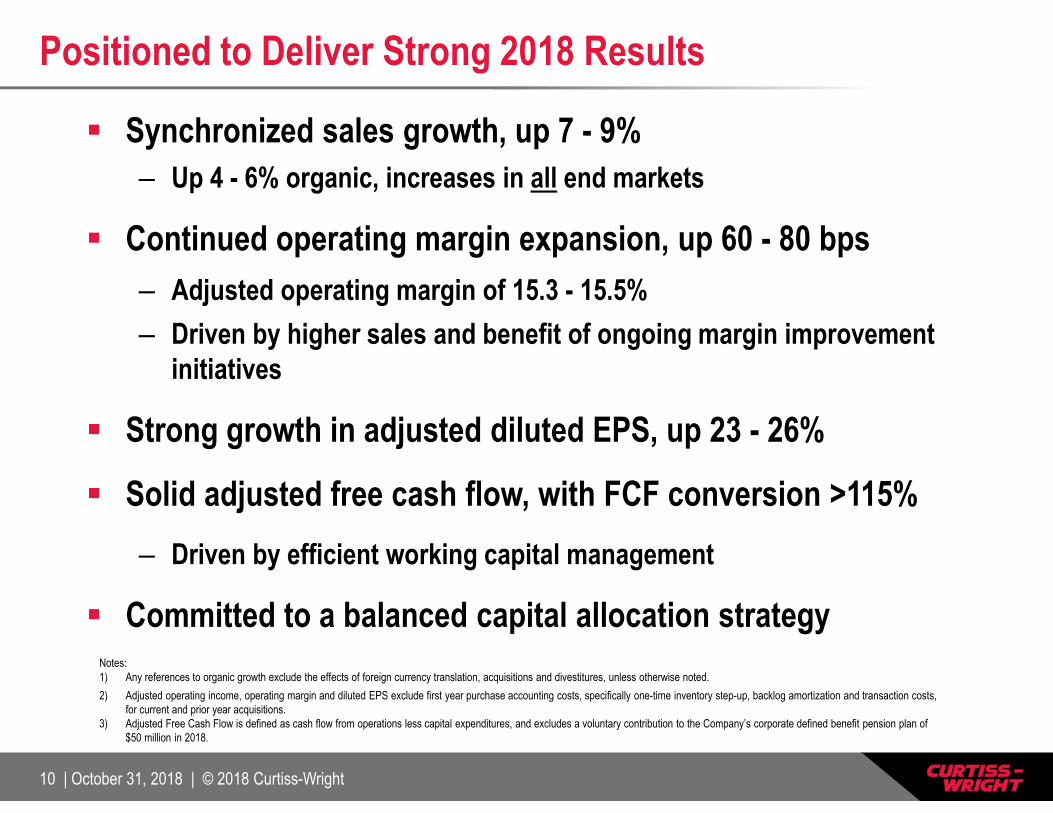
Positioned to Deliver Strong 2018 Results
Synchronized sales growth, up 7 - 9%
– Up 4 - 6% organic, increases in all end markets
Continued operating margin expansion, up 60 - 80 bps
– Adjusted operating margin of 15.3 - 15.5%
– Driven by higher sales and benefit of ongoing margin improvement initiatives
Strong growth in adjusted diluted EPS, up 23 - 26%
Solid adjusted free cash flow, with FCF conversion >115%
– Driven by efficient working capital management
Committed to a balanced capital allocation strategyNotes: 1) Any references to organic growth exclude the effects of foreign currency translation, acquisitions and divestitures, unless otherwise noted.
2) Adjusted operating income, operating margin and diluted EPS exclude first year purchase accounting costs, specifically one-time inventory step-up, backlog amortization and transaction costs, for current and prior year acquisitions.
3) Adjusted Free Cash Flow is defined as cash flow from operations less capital expenditures, and excludes a voluntary contribution to the Company’s corporate defined benefit pension plan of $50 million in 2018. Any
11 | October 31, 2018 | © 2018 Curtiss-Wright
Appendix
Non-GAAP Financial Results
The company reports its financial performance in accordance with accounting principles generally accepted in the United States of America ("GAAP").This press release refers to "Adjusted" amounts, which are Non-GAAP financial measures described below.
We utilize a number of different financial measures in analyzing and assessing the overall performance of our business, and in making operatingdecisions, forecasting and planning for future periods. We consider the use of the non-GAAP measures to be helpful in assessing the performance ofthe ongoing operation of our business. We believe that disclosing non-GAAP financial measures provides useful supplemental data that, while not asubstitute for financial measures prepared in accordance with GAAP, allows for greater transparency in the review of our financial and operationalperformance.
Beginning with the second quarter of 2018, coinciding with the initial reporting of the DRG acquisition, the Company elected to present its financials andguidance on an Adjusted, non-GAAP basis for operating income, operating margin, net earnings and diluted earnings per share to exclude first yearpurchase accounting costs associated with its acquisitions, specifically one-time inventory step-up, backlog amortization and transaction costs forcurrent and prior year acquisitions.
Management believes that this approach will provide improved transparency to the investment community in order to measure Curtiss-Wright’s coreoperating and financial performance, provide quarter-over-quarter comparisons excluding one-time items and show better comparisons amongcompany peers.
Reconciliations of non-GAAP to GAAP amounts are furnished with this presentation. All per share amounts are reported on a diluted basis.
The following definitions are provided:
Adjusted Operating Income, Operating Margin, Net Income and Diluted EPSThese Adjusted financials are defined as Reported Operating Income, Operating Margin, Net Income and Diluted EPS under GAAP excluding theimpact of first year purchase accounting costs associated with acquisitions for current and prior year periods, specifically one-time inventory step-up,backlog amortization and transaction costs.
12 | October 31, 2018 | © 2018 Curtiss-Wright
($ Millions)
Naval
Aerospace Industrial Vehicles
Ground Industrial Controls
Other Industrial Valves
Surface Tech Services
Total CW End Markets
$2,430 - 2,470 UP 7 - 9%
Non-Nuclear
60%
Surface Tech Services
Commercial Markets
40%
Defense Markets
Commercial Aerospace
Aircraft Equipment
Power Generation
Aftermarket Nuclear
New Build / AP1000
General Industrial
20%
16%
4%
<1%
17%
70%
30%
20%
18%
61%
28%
11%
25%
33%
26%
21%
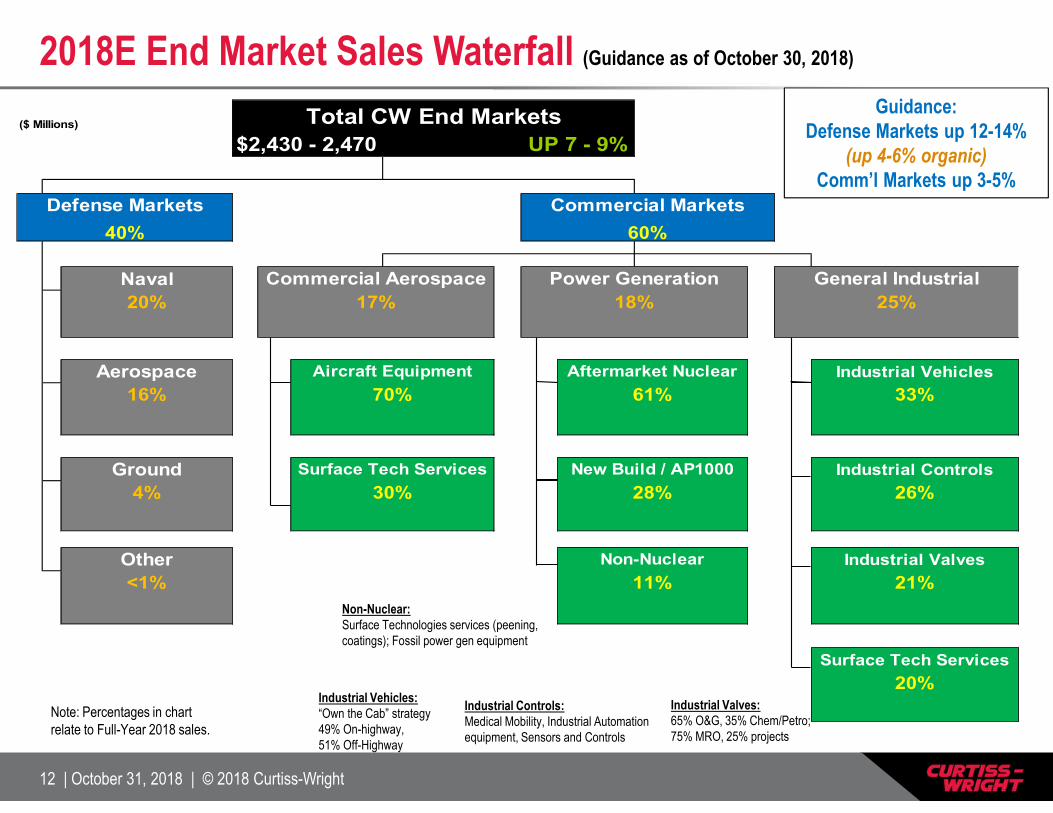
2018E End Market Sales Waterfall (Guidance as of October 30, 2018)
Guidance:Defense Markets up 12-14%
(up 4-6% organic)Comm’l Markets up 3-5%
Industrial Controls:Medical Mobility, Industrial Automation equipment, Sensors and Controls
Industrial Vehicles:“Own the Cab” strategy49% On-highway,51% Off-Highway
Industrial Valves:65% O&G, 35% Chem/Petro; 75% MRO, 25% projects
Non-Nuclear:Surface Technologies services (peening, coatings); Fossil power gen equipment
Note: Percentages in chart relate to Full-Year 2018 sales.
13 | October 31, 2018 | © 2018 Curtiss-Wright
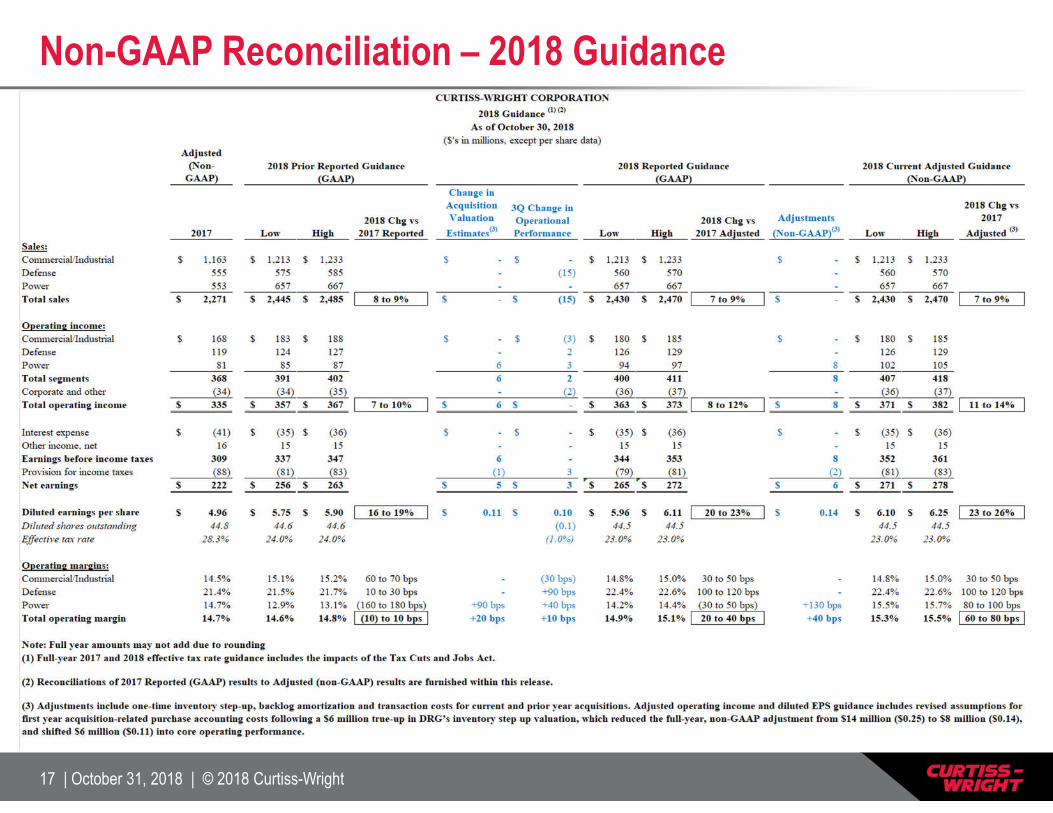
($ in millions)
2017 Adjusted (Non-GAAP) (1)
2018 PriorReported(GAAP)
Change in Acquisition Valuation Estimates
OperationalChanges
2018 Updated Reported(GAAP) Adjustments(1)
2018 Current Adjusted
(Non-GAAP) (1)
2018 Change vs 2017
Adjusted(1)
Commercial / Ind $1,163 $1,213 - 1,233 $1,213 - 1,233 $1,213 - 1,233 4 - 6%
Defense $555 $575 - 585 ($15) $560 - 570 $560 - 570 1 - 3%
Power $553 $657 - 667 $657 - 667 $657 - 667 19 - 21%
Total Sales $2,271 $2,445 - 2,485 ($15) $2,430 - 2,470 $2,430 - 2,470 7 - 9%
Commercial / IndMargin
$16814.5%
$183 - 18815.1% - 15.2%
($3)(30 bps)
$180 - 18514.8% - 15.0%
$180 - 18514.8% - 15.0%
7 - 10%+30 - 50 bps
DefenseMargin
$11921.4%
$124 - 12721.5% - 21.7%
$2+90 bps
$126 - 12922.4% - 22.6%
$126 - 12922.4% - 22.6%
5 - 8%+100 - 120 bps
PowerMargin
$81 14.7%
$85 - 87 12.9% - 13.1%
$6+90 bps
$3+40 bps
$94 - 97 14.2% - 14.4%
$8+130 bps
$102 - 105 15.5% - 15.7%
26 - 29%+80 - 100 bps
Corporate and Other ($34) ($34 - 35) ($2) ($36 - 37) ($36 - 37) (7 - 10%)
Total Op. IncomeCW Margin
$33514.7%
$357 - 36714.6% - 14.8%
$6+20 bps
+10 bps$363 - 373
14.9% - 15.1%$8
+40 bps$371 - 382
15.3% - 15.5%11 - 14%
+60 - 80 bps
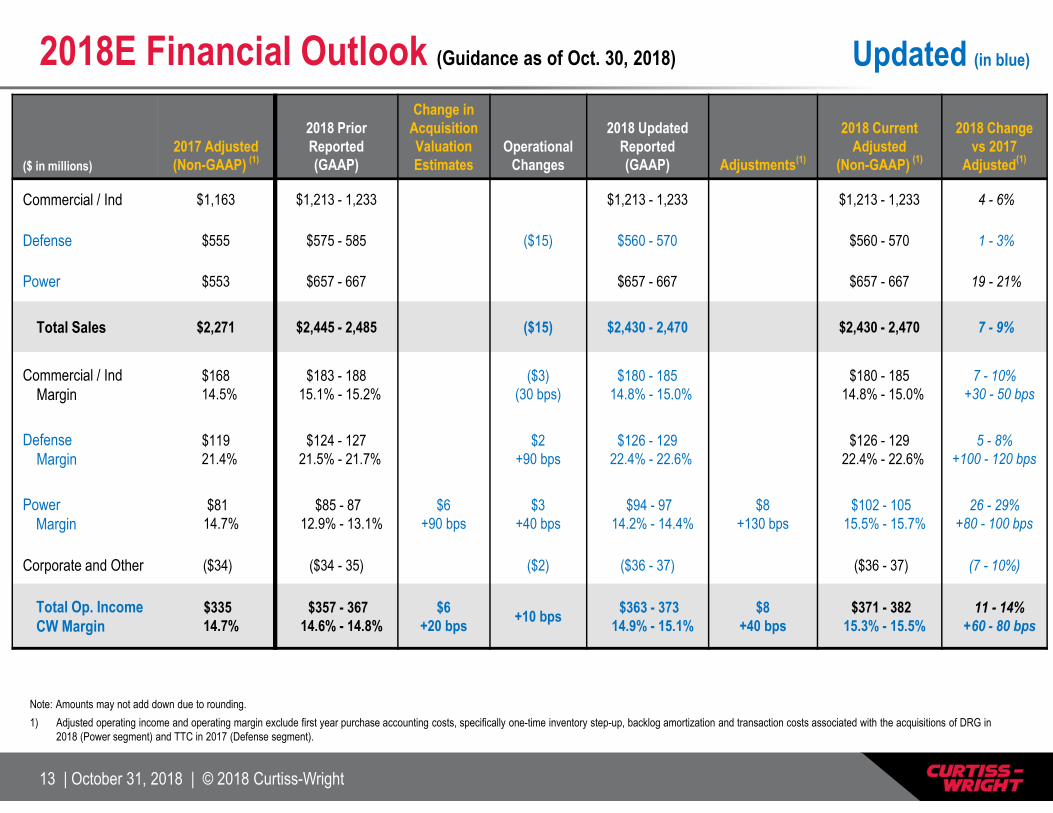
2018E Financial Outlook (Guidance as of Oct. 30, 2018)
Note: Amounts may not add down due to rounding.
1) Adjusted operating income and operating margin exclude first year purchase accounting costs, specifically one-time inventory step-up, backlog amortization and transaction costs associated with the acquisitions of DRG in 2018 (Power segment) and TTC in 2017 (Defense segment).
Updated (in blue)
14 | October 31, 2018 | © 2018 Curtiss-Wright
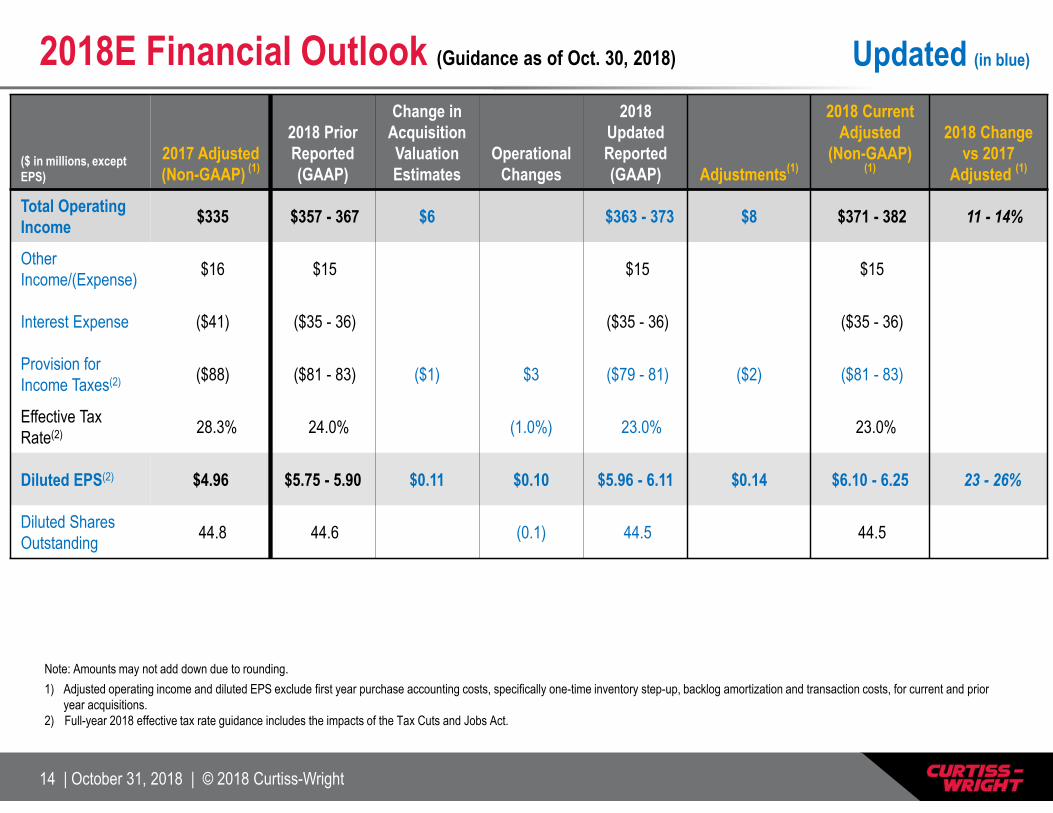
2018E Financial Outlook (Guidance as of Oct. 30, 2018)
Note: Amounts may not add down due to rounding.
1) Adjusted operating income and diluted EPS exclude first year purchase accounting costs, specifically one-time inventory step-up, backlog amortization and transaction costs, for current and prior year acquisitions.
2) Full-year 2018 effective tax rate guidance includes the impacts of the Tax Cuts and Jobs Act.
Updated (in blue)
($ in millions, except EPS)
2017 Adjusted (Non-GAAP)
(1)
2018 PriorReported(GAAP)
Change in Acquisition Valuation Estimates
OperationalChanges
2018 Updated Reported(GAAP) Adjustments
(1)
2018 Current Adjusted
(Non-GAAP)(1)
2018 Change vs 2017
Adjusted (1)
Total Operating Income
$335 $357 - 367 $6 $363 - 373 $8 $371 - 382 11 - 14%
Other Income/(Expense)
$16 $15 $15 $15
Interest Expense ($41) ($35 - 36) ($35 - 36) ($35 - 36)
Provision for Income Taxes(2) ($88) ($81 - 83) ($1) $3 ($79 - 81) ($2) ($81 - 83)
Effective Tax Rate(2) 28.3% 24.0% (1.0%) 23.0% 23.0%
Diluted EPS(2) $4.96 $5.75 - 5.90 $0.11 $0.10 $5.96 - 6.11 $0.14 $6.10 - 6.25 23 - 26%
Diluted Shares Outstanding
44.8 44.6 (0.1) 44.5 44.5
15 | October 31, 2018 | © 2018 Curtiss-Wright
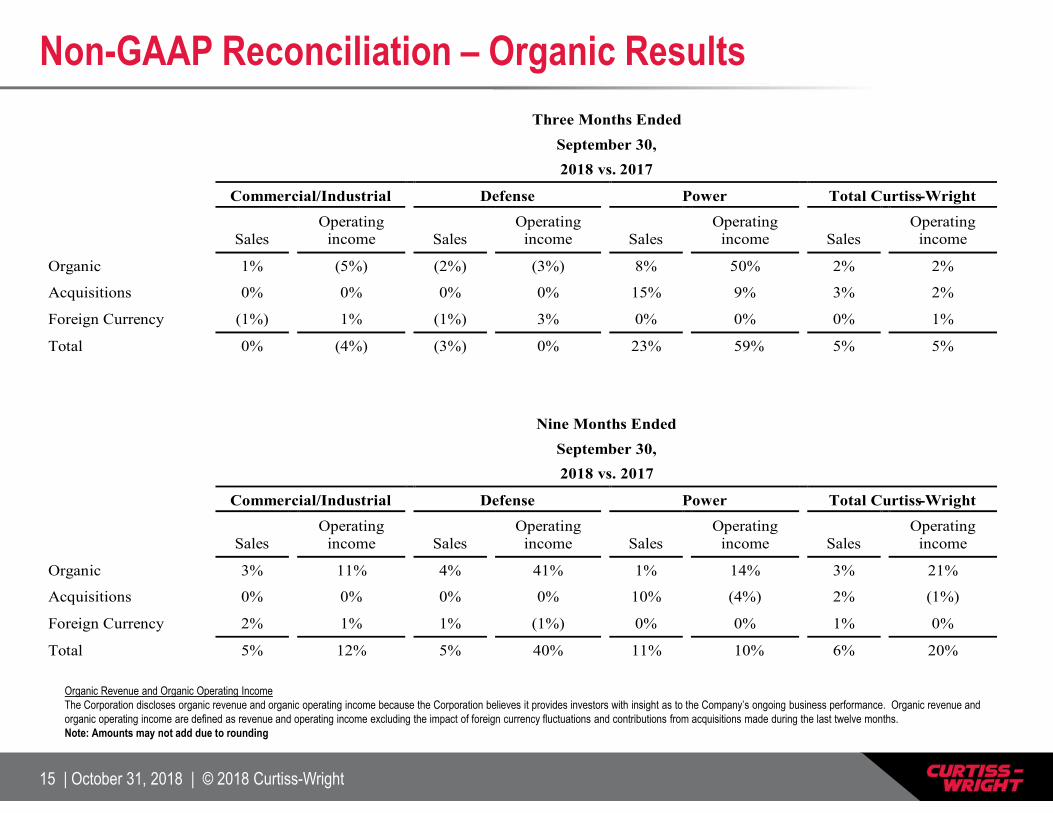
Non-GAAP Reconciliation – Organic Results
Organic Revenue and Organic Operating IncomeThe Corporation discloses organic revenue and organic operating income because the Corporation believes it provides investors with insight as to the Company’s ongoing business performance. Organic revenue and organic operating income are defined as revenue and operating income excluding the impact of foreign currency fluctuations and contributions from acquisitions made during the last twelve months.Note: Amounts may not add due to rounding
Three Months Ended
September 30,
2018 vs. 2017
Commercial/Industrial Defense Power Total Curtiss-Wright
Sales Operating
income Sales Operating
income Sales Operating
income Sales Operating
income
Organic 1% (5%) (2%) (3%) 8% 50% 2% 2%
Acquisitions 0% 0% 0% 0% 15% 9% 3% 2%
Foreign Currency (1%) 1% (1%) 3% 0% 0% 0% 1%
Total 0% (4%) (3%) 0% 23% 59% 5% 5%
Nine Months Ended
September 30,
2018 vs. 2017
Commercial/Industrial Defense Power Total Curtiss-Wright
Sales Operating
income Sales Operating
income Sales Operating
income Sales Operating
income
Organic 3% 11% 4% 41% 1% 14% 3% 21%
Acquisitions 0% 0% 0% 0% 10% (4%) 2% (1%)
Foreign Currency 2% 1% 1% (1%) 0% 0% 1% 0%
Total 5% 12% 5% 40% 11% 10% 6% 20%

16 | October 31, 2018 | © 2018 Curtiss-Wright
Non-GAAP Reconciliations – 3Q 2018 Results
(In millions, except EPS) 3Q-2018 3Q-2017 Change
Sales $ 595.4 $ 567.9 5%
Reported operating income (GAAP) $ 97.0 $ 92.4 5%
Adjustments (1) 1.3 0.0 -
Adjusted operating income (Non-GAAP) $ 98.3 $ 92.4 6%
Adjusted operating margin (Non-GAAP) 16.5% 16.3% 20 bps
Reported net earnings (GAAP) $ 74.5 $ 63.9 16%
Adjustments (1) 1.3 <0.1 -
Tax impact on Adjustments (1) (0.3) (0.0) -
Adjusted net earnings (Non-GAAP) $ 75.5 $ 64.0 18%
Reported diluted EPS (GAAP) $ 1.68 $ 1.43 17%
Adjustments (1) $0.03 $0.00 -
Tax impact on Adjustments (1) ($0.01) ($0.00) -
Adjusted diluted EPS (Non-GAAP) $ 1.70 $ 1.43 19%
(1) Includes one-time Inventory Step-up, Backlog Amortization and Transaction costs for current and prior year acquisitions.
17 | October 31, 2018 | © 2018 Curtiss-Wright
Non-GAAP Reconciliation – 2018 Guidance