rx15 tpp wed_300_1_paduda-white_2hanna
TRANSCRIPT

Third-Party Payer Track
Workers’ Compensation: Examining Policy Issues and What Works
Presenters:
• Joseph Paduda, MS, Principal, Health Strategy Associates
• Jeffrey Austin White, MS, Director, Medical Management Practices and Strategy, Accident Fund Holdings, Inc.
• Johnnie L. Hanna, RPh, MBA, Pharmacy Program Director, Ohio Bureau of Workers’ Compensation (BWC)
Moderator: Michelle C. Landers, JD, Executive Vice President and General Counsel, Kentucky Employers’ Mutual Insurance, and Member, Rx Summit National Advisory Board

Disclosures
• Joseph Paduda, MS – Owner: CompPharma; Consulting fees: Healthcare Solutions, Helios
• Jeffrey Austin White, MS, has disclosed no relevant, real, or apparent personal or professional financial relationships with proprietary entities that produce healthcare goods and services.
• John Hanna, RPh, MBA, has disclosed no relevant, real, or apparent personal or professional financial relationships with proprietary entities that produce healthcare goods and services.
• Michelle C. Landers, JD, has disclosed no relevant, real, or apparent personal or professional financial relationships with proprietary entities that produce healthcare goods and services.

Disclosures
• All planners/managers hereby state that they or their spouse/life partner do not have any financial relationships or relationships to products or devices with any commercial interest related to the content of this activity of any amount during the past 12 months.
• The following planners/managers have the following to disclose:– Kelly Clark – Employment: Publicis Touchpoint Solutions;
Consultant: Grunenthal US– Robert DuPont – Employment: Bensinger, DuPont &
Associates-Prescription Drug Research Center– Carla Saunders – Speaker’s bureau: Abbott Nutrition

Learning Objectives
1. Identify negative consequences of physicians dispensing opioids in their offices.
2. Advocate solutions to the problem of physicians dispensing opioids in their offices.
3. Describe the Ohio BWC pharmacy program.
4. Evaluate the outcomes of the BWC pharmacy program during its five years of operation.

Opioids and Workers Compensation:
The Background Story
Joseph Paduda
President
CompPharma, LLC

Disclosures
• Joseph Paduda has financial relationships with proprietary entities that produce health care products and services. These financial relationships are: consulting for IROKO Pharmaceuticals, Millennium Health, Inc., and MedRisk, Inc.

Defining the Problem
pg. 7

Opioids are
the most
significant
problem
facing work
comp today.

Workers’ comp is musculoskeletal
• Almost no cancer
• Significant evidence of chronic pain– Etiology is uncertain at best
• Opioid “appropriate” claims– Very few, but occasionally very severe catastrophic
injuries
– Acute pain• Initial injury treatment – albeit highly unusual
• Post-surgery

Work Comp Pharmacy is Pain Management
• 85% of drugs are for pain
• 31% of drug spend is for opioids
• Top opioids – mostly Long Acting– Oxycodone – 43%
– Duragesic patch – 17%
– Morphine ER – 13%
– Oxymorphone ER – 10%
Data from Helios 2014 Drug Trend Report

Routine use of opioids
for the treatment of
chronic nonmalignant
pain conditions
is not recommended.”
“
-ACOEM

Diagnostic Category
Pcnt of S-II
Opioid
Claims
Pcnt of
S-II
Opioid
Scrips
Pcnt of
S-II
Opioid
Pymnts
Medical Back w/o Spinal Cord Involvement 35.7% 47.1% 50.2%
Spine Disorders w/ Spinal Cord or Root
Invmnt. 11.3% 15.1% 16.1%
Cranial & Peripheral Nerve Dis 5.0% 6.8% 6.5%
Degen, Infect & Metabol Joint Dis 9.3% 6.1% 5.4%
Other Injuries, Poisonings & Toxic Effects 5.5% 5.9% 6.8%
Ruptured Tendon, Tendonitis, Myositis &
Bursitis 6.0% 3.6% 2.7%
Sprain of Shoulder, Arm, Knee or Lower Leg 6.8% 3.2% 2.8%
Wound, FX of Shoulder, Arm, Knee or Lower
Leg 6.3% 2.7% 1.6%
Other Mental Disturb 1.2% 1.7% 1.5%
Other Diagnoses of Musculoskeletal Sys 1.5% 1.4% 1.1%
Analysis of Prescribing Patterns – Sch. II Opioids- source CWCI, 3/2011 Research Paper

$0
$5,000
$10,000
$15,000
$20,000
$25,000
No MEs $6,733 $3,207 $3,526
Level 1 $6,499 $2,938 $3,561
Level 2 $10,550 $4,411 $6,139
Level 3 $14,950 $6,356 $8,594
Level 4 $20,389 $9,488 $10,901
Total Benefits Medical Indemnity
Average Benefit/Cost Outcomes- source CWCI, 3/2011 Research Paper

Some promising trends
• 2.1% decrease in percentage of claimants using opioids
• 9.6% decrease in MEDs
• 5% decrease in utilization of opioids
source Helios 2014 Drug Trend Report


Where are we headed?

Physician Dispensing of Opioids:More Pills, Longer Treatment,
Questionable Motives
Third-Party Payer TrackApril 8th from 3:00 – 4:15pmWestin Peachtree Plaza Hotel
Presentation by Jeffrey Austin WhiteAccident Fund Holdings, Inc.

The views expressed in this presentation are my own and do not necessarily represent the position of Accident Fund Holdings Inc., or any subsidiaries. I have no other financial relationships to disclose other than my employment below.
Disclosure and Disclaimer
Medical Center of Excellence headquarters in the Corporate Claims Department at Accident Fund Holdings, Inc. in Lansing, MI.
Jeffrey Austin White, director of Medical Management Practices and Strategy
Accident Fund Holdings, Inc. (Lansing, Mich.) and its subsidiaries are one of the largest specialty writers of workers’ compensation insurance licensed in 50 states. Accident Fund Holdings conducts business through its four brands: Accident Fund, United Heartland, CompWest and Third CoastUnderwriters.
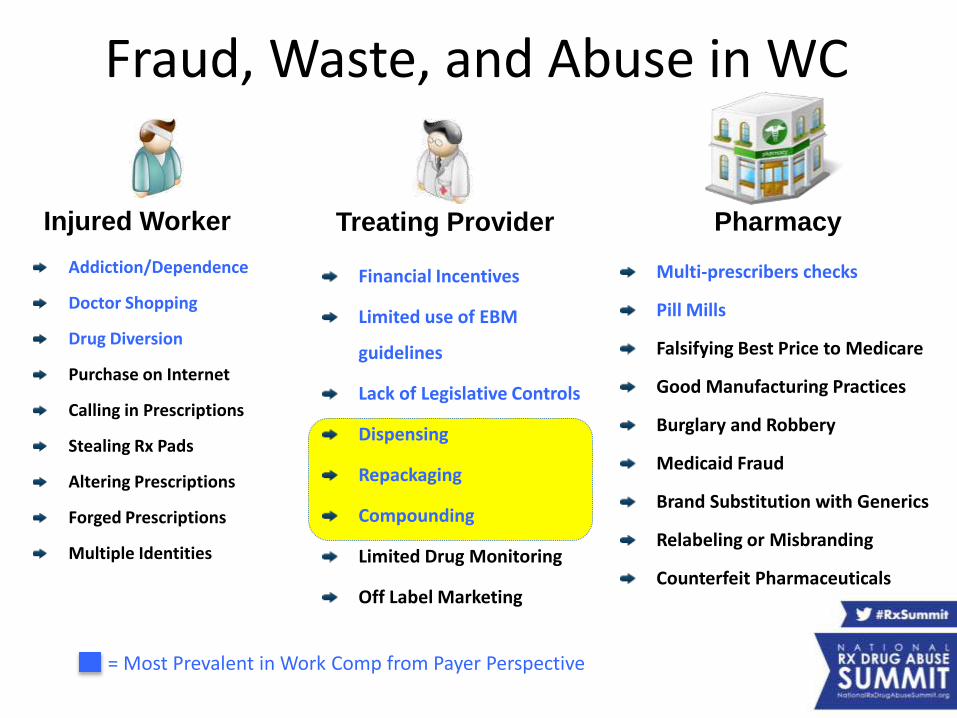
Financial Incentives
Limited use of EBM
guidelines
Lack of Legislative Controls
Dispensing
Repackaging
Compounding
Limited Drug Monitoring
Off Label Marketing
Fraud, Waste, and Abuse in WC
Multi-prescribers checks
Pill Mills
Falsifying Best Price to Medicare
Good Manufacturing Practices
Burglary and Robbery
Medicaid Fraud
Brand Substitution with Generics
Relabeling or Misbranding
Counterfeit Pharmaceuticals
Addiction/Dependence
Doctor Shopping
Drug Diversion
Purchase on Internet
Calling in Prescriptions
Stealing Rx Pads
Altering Prescriptions
Forged Prescriptions
Multiple Identities
Injured Worker Treating Provider Pharmacy
= Most Prevalent in Work Comp from Payer Perspective
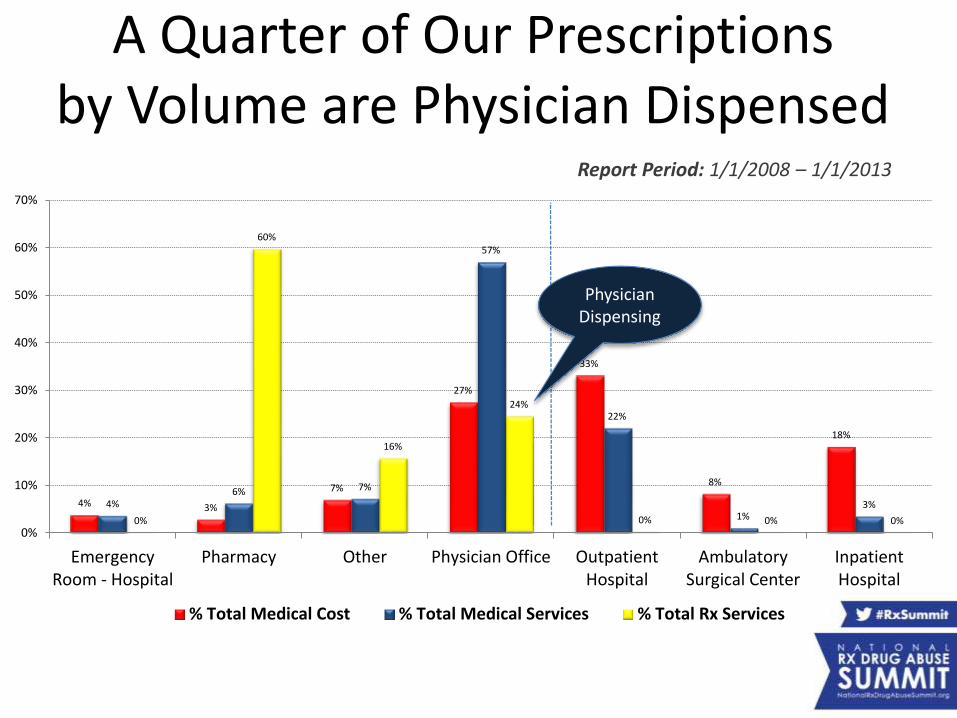
4% 3%
7%
27%
33%
8%
18%
4%6% 7%
57%
22%
1%3%
0%
60%
16%
24%
0% 0% 0%0%
10%
20%
30%
40%
50%
60%
70%
EmergencyRoom - Hospital
Pharmacy Other Physician Office OutpatientHospital
AmbulatorySurgical Center
InpatientHospital
% Total Medical Cost % Total Medical Services % Total Rx Services
A Quarter of Our Prescriptions by Volume are Physician Dispensed
Report Period: 1/1/2008 – 1/1/2013
Physician Dispensing

Group Health vs. Work Comp Coverage
Work Comp company responsible for any and all medication payments deemed necessary or appropriate by physician for the life of the claim. Fees set by physician or pharmacy with reimbursement limited in some states.
Health Insurance Company establishes a yearly contractwith patient on what will be paid and when. Benefits, exclusions and reimbursement rates are agreed upon within contract prior to execution.

Health Insurance Contract Language
• As written directly in my benefit summary.• Insurance company requires pre-authorization of
drug before payment.– Over-the-counter drugs may be requested to be tried
before approval of other drugs.– Carrier will only pay for drugs obtained from an in
network pharmacy.– Carrier will not pay for drugs obtained from out-of-
network mail order or internet provider.– Drug must be FDA approved and re-imbursement
based on meeting formulary requirements.

Physician Dispensing Process
Insurance
Company
Injured
WorkerTreating
ProviderPhysician
Office
Management Company(middleman)
Re-packaged Meds
(70-80% of receivables)
Management company (middleman) handles invoicing the insurance company directly and helps physician establish and maintain an office pharmacy by providing software to facilitate billing and locating of distributors in return for a percentage of receivables.
Re-packager1
Re-packager2
Re-packager3
Original Manufacturer

Real-life Example from Our Database
ManufacturerOriginal NDC
Re-Packager
$1.67/30 pills (sold in bulk)
Re-PackagerNew NDC
Physician
$12.16/30 pills
Physician ManagementCompany$106.00/30 pills
(Sells Receivables)
Management Co. Payer
$138.00/30 pills
Profit
$10.49
$93.84
$32.00
$136.33 = Total Markup

What is the upside?
• Hmmm ….
• Huge profits for the provider, re-packager, or management company.
• Convenience factor for patient?
• Patient compliance with drug?
• Immediacy of treatment?
• Validation of receipt by patient?

What is the downside?• Increased number of physician office visits.
• Increased drug expense. (60%-300% > pharmacy)
• Increased number of scripts. (3 x pharmacy)
• Patient safety concerns– Drug on drug interaction
– Drug formulary
– Drug dosage alerts (MED monitors)
• Risk of doctor shopping by patient– Multiple Prescriber alerts or PDMP checks
• Poor Claim Outcomes– Medical cost, indemnity cost, lost time days

Claim Outcomes:Physician vs. Pharmacy Dispensed
Metric JHU Study1 CWCI Study2 Direction
Medical Cost 39% 17%
Indemnity Cost 27% 13%
Lost Time Days 34% 9%
Total Claim Cost 31% NA
# of Prescriptions 299% NA
Metric JHU Study1 CWCI Study2 Direction
Medical Cost 78% NA
Indemnity Cost 57% NA
Lost Time Days 85% NA
Total Claim Cost 64% NA
# of Prescriptions
320% NA
Claim Outcomes for Physician Dispensed Non Narcotic Drugs
Claim Outcomes for Physician Dispensed Narcotic Drugs

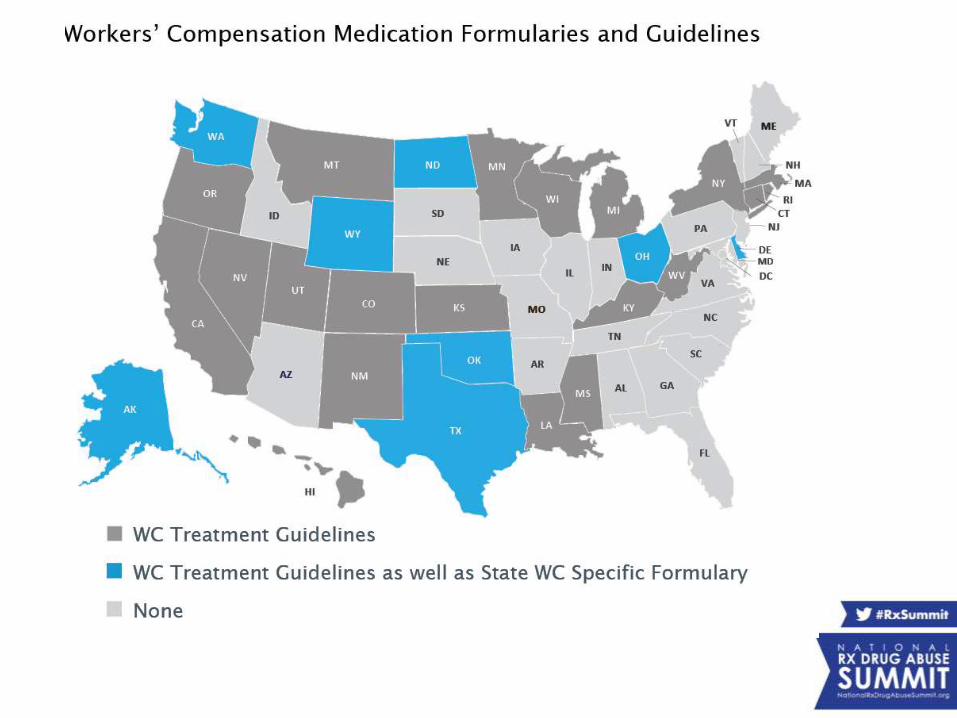
Types of State Legislative Reforms
1. Limit re-imbursement and dispensing fees.
– Tied to National Drug Code (NDC)
– Based on Average Wholesale Price (AWP)
2. Limit type, duration and quantity of drugs.
– Drug formulary
– DEA Schedule (Potential for Abuse)
– Therapeutic Class (i.e. Opiate Agonist)
3. Ban physician dispensing of all drugs.

Impact of Physician Dispensing Reforms
State Reform Type
Physician Dispensed Prescriptions(Pre vs. Post-reform)
Ave Price Paid per Pill (Pre vs. Post-reform)
Ave Price Paid per Pill Compared to Pharmacy (Post-reform)
South Carolina 1 14 point decrease 33-52% decrease 27-42% higher
Maryland1 1 1 point decrease 10-13% increase 153% higher
Connecticut2 1 3 point decrease 20-67% decrease 30-74% higher
Tennesse2 1 4 point decrease 21-49% decrease 12-28% higher
California2,4 1 11 point decrease 37% decrease No Change
Illinois2 1 9 point decrease 18-57% decrease 14-58% higher
Georgia2 1 7 point decrease 22-36% decrease 20-40% higher
Florida3 2 No Change NA NA
Pennsylvania 2 Coming Soon NA NA
North Carolina 2 Coming Soon NA NA
1 Active debate regarding re-imbursement at 130% of AWP + $12 dispensing. Coupled with large increase in AWP in 2011.2 No language limiting dispensing fee.3 Physicians dispensed more non opioid drugs. Since dispensing of Schedule II was banned.4 In 2007 California fee schedule equalized pharmacy and physician-dispensed charges.
As of February 1, 2015 18 states have made regulatory changes to address physician dispensing issues in Workers Compensation. The states below have had pre and post-reform studies completed by WCRI.

Preventative Measures
• Leverage Pharmacy Benefit Manager
• Promote Claims Outcome Research
• Publish Research Findings
• Work with State Legislature
• Work with Federal Government
• Increase Public Awareness of Risks
• Improve Communication with Providers
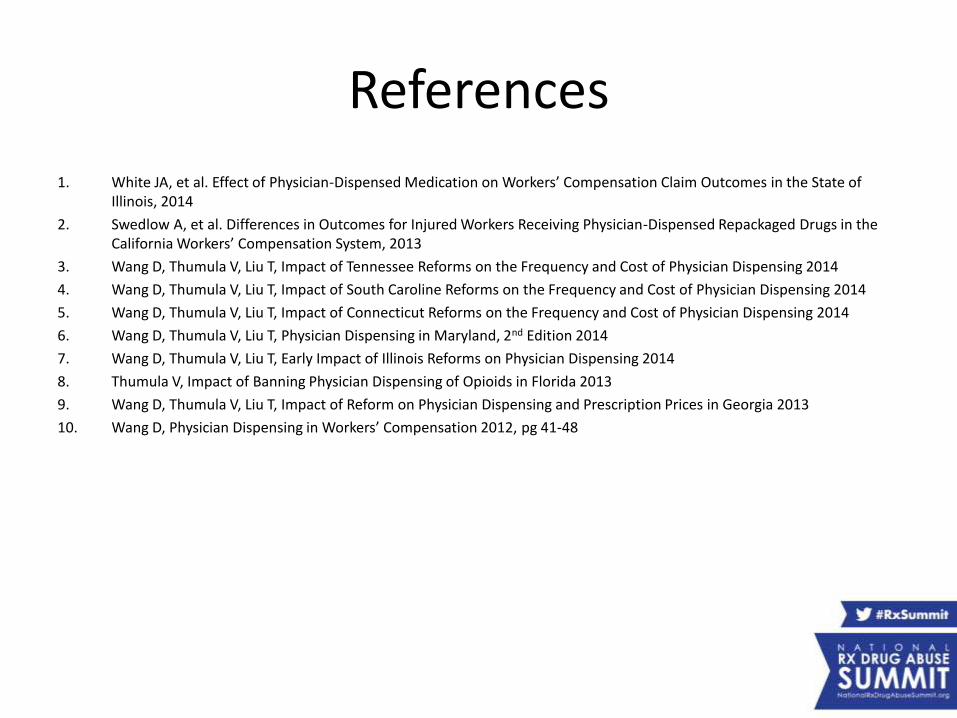
References
1. White JA, et al. Effect of Physician-Dispensed Medication on Workers’ Compensation Claim Outcomes in the State of Illinois, 2014
2. Swedlow A, et al. Differences in Outcomes for Injured Workers Receiving Physician-Dispensed Repackaged Drugs in the California Workers’ Compensation System, 2013
3. Wang D, Thumula V, Liu T, Impact of Tennessee Reforms on the Frequency and Cost of Physician Dispensing 2014
4. Wang D, Thumula V, Liu T, Impact of South Caroline Reforms on the Frequency and Cost of Physician Dispensing 2014
5. Wang D, Thumula V, Liu T, Impact of Connecticut Reforms on the Frequency and Cost of Physician Dispensing 2014
6. Wang D, Thumula V, Liu T, Physician Dispensing in Maryland, 2nd Edition 2014
7. Wang D, Thumula V, Liu T, Early Impact of Illinois Reforms on Physician Dispensing 2014
8. Thumula V, Impact of Banning Physician Dispensing of Opioids in Florida 2013
9. Wang D, Thumula V, Liu T, Impact of Reform on Physician Dispensing and Prescription Prices in Georgia 2013
10. Wang D, Physician Dispensing in Workers’ Compensation 2012, pg 41-48

Third-Party Payer Track: Workers’ Compensation:
Examining Policy Issues and What Works
The Ohio BWC Pharmacy Program
John Hanna, R.Ph, MBA
Pharmacy Program Director
Ohio Bureau of Workers’ Compensation

Disclosures
o John Hanna, R.Ph, MBA has disclosed no
relevant, real, or apparent personal or
professional financial relationships with
proprietary entities that produce
healthcare goods and services.

Discussion Overview
o The BWC Pharmacy Program
o Operational overview
o Evolution of the BWC formulary 2011 to 2014
o Formulary impact on drug utilization
o Opiate utilization by injured workers
4/2/2015 BWC Pharmacy Program Overview

Ohio’s Workers’ Compensation Program
o The nation’s largest state fund workers’
comp insurer with 859,000 open claims
o FY2014:
• Covered 97,500 new claims;
• Paid $1.7 billion in total benefits;
• Medical expenditures of $662 million;
• Pharmacy benefits of $109 million

Total benefit payments:
$1.7 billion
Medical benefit payments:
$662 million - 39% of total
Hospitals$218 M33%
Pharmacies$109.5 M
16%
Medical - feeschedule
$311 M 47%
All other medical$26.5 M 4%
FY 2014 Ohio BWC
State-Fund Benefit Expenditures

The BWC Pharmacy Toolkit
Drug utilization
reviews
Formulary
Relatedness edits
Prior authorizations

The BWC Formulary
(OAC 4123-6-21.3)
Implemented Sept. 1, 2011)
o What is a drug formulary?
o Why was it implemented?
o What makes BWC’s unique?
o How was it designed?
o Who manages it?

Formulary Changes 2011 to 2014
o Limited coverage of muscle relaxants
o Stopped coverage of various opiate
products
o Implemented tiered coverage for all SR
opiates
o Established a class generic for anti-ulcer
agents

Formulary Changes 2011 to 2014
o Set a maximum daily dose for anti-
anxiety agents and butalbital containing
agents
o Deleted coverage of various sleep
agents
o Limited coverage of anti-psychotics
o Restricted coverage of testosterone
products
4/2/2015 BWC Pharmacy Program Overview 41

Formulary Impact: Drug
Utilization 2014 vs. 2010
4/2/2015 BWC Pharmacy Program Overview
Opiates: Injured workers receiving opiates decreased by 22.5%.o Opiate prescriptions decreased by 27.8%.
o Opiate prescriptions per injured worker decreased by 6.8%.
o Opiate doses decreased by 26.2%.
o Opiate doses per injured worker decreased by 4.8%.
o Compared with 2010, in 2014, BWC covered 14.2 million fewer opiate doses.

Formulary Impact: Drug
Utilization 2014 vs 2010
4/2/2015 BWC Pharmacy Program Overview
o Injured workers receiving muscle relaxants decreased by
50%.
o Muscle relaxant prescriptions decreased by 73%.
Anti-ulcer agents
o Injured workers receiving anti-ulcer drugs decreased by
75%.
o Anti-Ulcer prescriptions decreased by 78%.
Anti-Anxiety agents
o Injured workers receiving anti-anxiety drugs decreased
by 20%.
o Anti-Anxiety prescriptions decreased by 21%.

Formulary Impact: Drug Costs
2014 vs. 2011
4/2/2015 BWC Pharmacy Program Overview
2014 total drug costs decreased by $26.9 million (-20%).o Opiate costs decreased by $ 18.2 million (-36%).
o Muscle relaxant costs decreased by $2.5 million(-73%).
o Anti-ulcer drug costs decreased by $5.3 million (-91%).
o Anti-anxiety drug costs decreased by $191,000 (-22%).
Note: Pharmacy costs peaked in 2011 at $136M.

Opioid Dependent Workers
2011 vs. 2014o BWC considers 60mg MED/Day for 60 days as
the monitoring threshold for opioid dependence.
o In fourth quarter 2011:
• 8,029 injured workers met this criteria;• 12% of injured workers receiving any medication
• 17% of injured workers receiving opioids
o In fourth quarter 2014:
• 5,469 injured workers met it;• 11% of all injured workers receiving medications.
• 16% of injured workers receiving opiates

Injured Workers Receiving
Medications 2001 to 2014
4/2/2015 BWC Pharmacy Program Overview
56,889
63,60265,881
68,82566,611
63,93760,923
55,11551,712
49,95747,680
43,140
39,427
34,458
98,352 97,33795,539
97,286
91,376
87,178
82,331
75,109
69,85867,406
65,338
60,821
56,398
50,211
20,000
30,000
40,000
50,000
60,000
70,000
80,000
90,000
100,000
110,000
2001 2002 2003 2004 2005 2006 2007 2008 2009 2010 2011 2012 2013 2014 2015
All injured workers receiving prescriptions
Injured workers receiving opioids
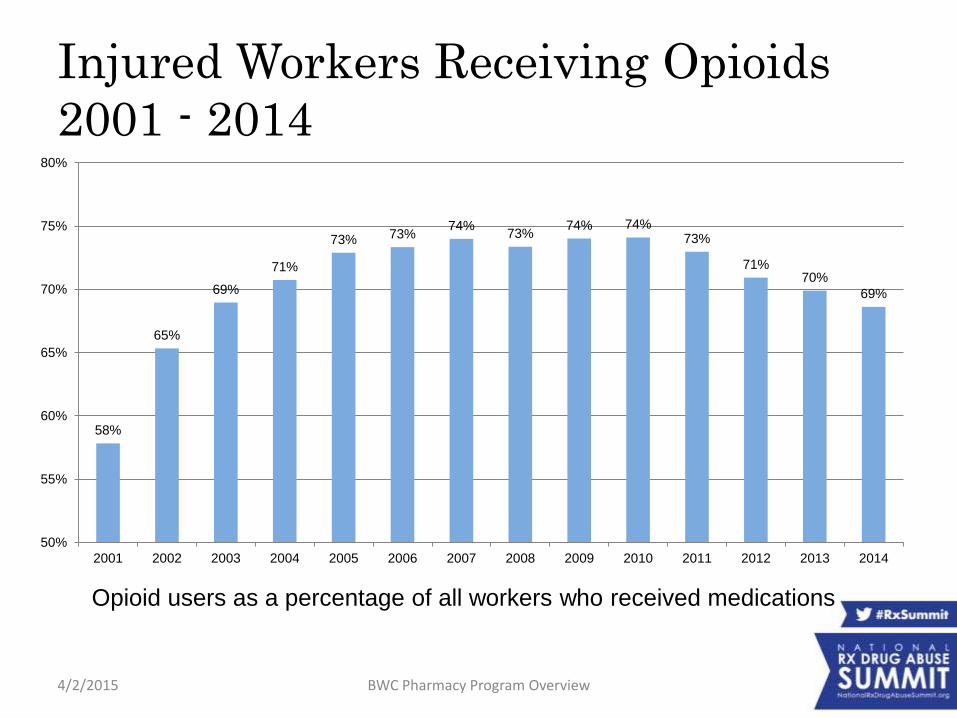
Injured Workers Receiving Opioids
2001 - 2014
4/2/2015 BWC Pharmacy Program Overview
58%
65%
69%
71%
73% 73%74%
73%74% 74%
73%
71%70%
69%
50%
55%
60%
65%
70%
75%
80%
2001 2002 2003 2004 2005 2006 2007 2008 2009 2010 2011 2012 2013 2014
Opioid users as a percentage of all workers who received medications

Opioid Utilization 2001 - 2014
4/2/2015 BWC Pharmacy Program Overview
565543
580611
644665
683
778
815 825 813 801782 785
250
350
450
550
650
750
850
950
2001 2002 2003 2004 2005 2006 2007 2008 2009 2010 2011 2012 2013 2014
Opioid doses per injured worker receiving opioids
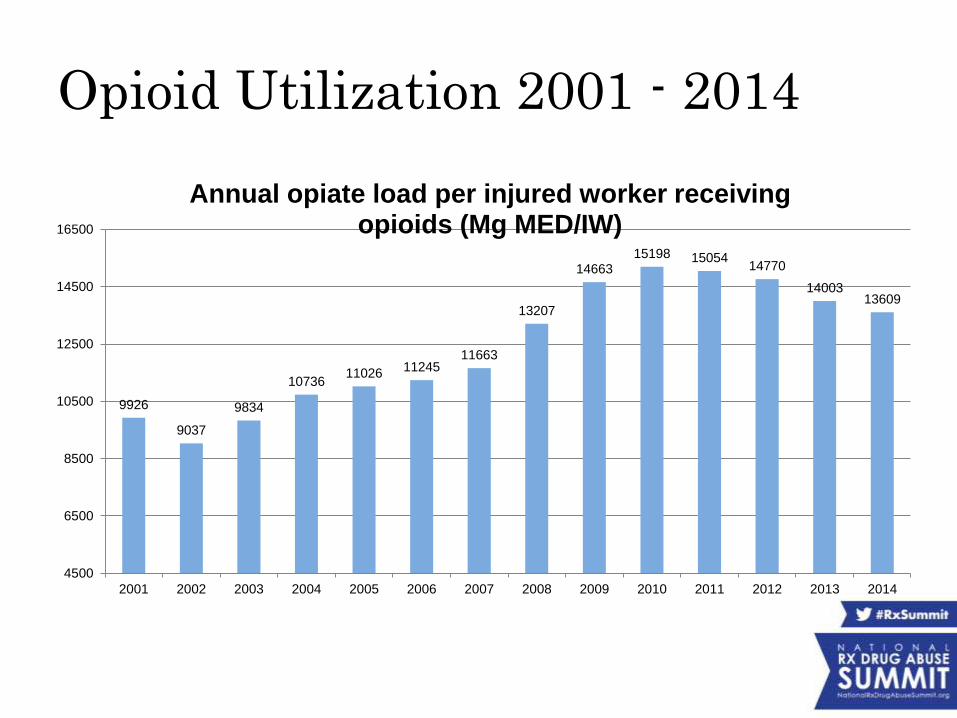
Opioid Utilization 2001 - 2014
9926
9037
9834
1073611026
1124511663
13207
1466315198 15054
14770
1400313609
4500
6500
8500
10500
12500
14500
16500
2001 2002 2003 2004 2005 2006 2007 2008 2009 2010 2011 2012 2013 2014
Annual opiate load per injured worker receiving opioids (Mg MED/IW)

Opioid Use By Age of Injured
Worker 2011 -2014
4/2/2015 BWC Pharmacy Program Overview 50
14
2523
5803
22259
5161
1629 886
2741
16289
4752
163
0
5000
10000
15000
20000
25000
10 - 19 20 - 34 35 - 44 45 - 64 65 - 84 85 - 95
2010 IW's per Age Band 2014 IW's per Age Band
Age ranges
2011
16 – 95
2014
17 - 95

Percentage of Opioid Use By Injured
Worker Age 2011 - 2014
0.04%
7%
16%
62%
14%
0.5%
0.04% 4%
11%
66%
19%
1%
0.00%
10.00%
20.00%
30.00%
40.00%
50.00%
60.00%
70.00%
10 - 19 20 - 34 35 - 44 45 - 64 65 - 84 85 - 95
2010 Age Band Pct of Total 2014 Age Band Pct of Total
4/2/2015 BWC Pharmacy Program Overview 51

2011 vs 2014 Opioid Dependence (Injured Workers Above 60mg MED/Day)
1340
3187
2797
601
46 58
1136
2456
1598
243
20 160
500
1000
1500
2000
2500
3000
3500
60 - 79 mg MED 80 - 159 mg MED 160 - 399 mg MED 400 - 799 mg MED 800 - 999 mg MED > 1000 mg MED
2011 Opiate Dependent IWs 2014 Opiate Dependent IWs

BWC Opioids 2010 - 2014
4/2/2015 BWC Pharmacy Program Overview 53
Year
Total
prescribers
Total
patients
Total
prescriptions
Total drug
quantity
Average quantity per
Rx
Average MED
per Rx
January 2010 - June 2010 8,543 37,516 218,197 18,277,457 84 68
July 2010 - December 2010 8,720 36,776 216,005 18,180,934 84 70
January 2011 - June 2011 8,132 35,112 204,746 17,228,114 84 73
July 2011 - December 2011 7,980 33,488 194,240 16,192,431 83 71
January 2012 - June 2012 7,563 31,694 179,583 15,272,207 85 71
July 2012 - December 2012 7,303 29,571 166,599 14,334,947 86 71
January 2013 - June 2013 6,991 28,572 156,887 13,518,868 86 69
July 2013 - December 2013 6,880 26,836 150,790 12,878,079 85 66
January 2014 - June 2014 6,592 25,749 141,951 12,186,292 86 64
July 2014 - December 2014 6,102 23,517 128,652 11,161,943 87 62

Total Ohio Opioids 2010 - 2014
4/2/2015 BWC Pharmacy Program Overview 54
Year
Total
prescribers
Total
patients
All Ohio
Average
quantity per Rx
All Ohio
Average
MED per Rx
BWC Average
quantity per Rx
BWC Average
MED per Rx
January 2010 - June 2010 50,256 1,865,244 63 56 84 68
July 2010 - December 2010 53,500 1,908,139 64 55 84 70
January 2011 - June 2011 58,148 1,889,141 64 51 84 73
July 2011 - December 2011 80,778 1,954,246 64 52 83 71
January 2012 - June 2012 80,983 1,978,083 65 52 85 71
July 2012 - December 2012 89,671 2,088,386 66 52 86 71
January 2013 - June 2013 92,862 1,923,155 66 51 86 69
July 2013 - December 2013 89,852 1,918,102 65 51 85 66
January 2014 - June 2014 82,769 1,882,892 64 51 86 64
Source: Oho Board of
Pharmacy 2014 Annual OARRS
Report
http://pharmacy.ohio.gov/Documents/Pubs/Special/OARRS/Ohio%20Auto
mated%20Rx%20Reporting%20System%20(OARRS)%20-
%20Biennial%20Report%20(2013-2014).pdf

4/2/2015 BWC Pharmacy Program Overview 55
High dose opiate prescribers - 4th quarter 2010
Prescriber
Patients
with total
Mg
MED/day
> 399
Patients
with total
Mg
MED/day
400 - 799
Patients
with total
Mg
MED/day
800 - 999
Patients
with total
Mg
MED/day
> 999
Dr. A 36 15 4 17
Dr. B 24 14 4 6
Dr. C 17 14 2 1
Dr. D* 13 11 2
Dr. E* 12 6 1 5
Dr. F 12 10 2
Dr. J* 11 5 5 1
Dr. H 9 9
Dr. I 8 7 1
Dr. J* 8 8
High dose opiate prescribers - 4th quarter 2014
Prescriber
Patients
with total
Mg
MED/day
> 399
Patients
with total
Mg
MED/day
400 - 799
Patients
with total
Mg
MED/day
800 - 999
Patients
with total
Mg
MED/day
> 999
Dr. B 13 8 4 1
Dr. K** 11 9 1 1
Dr. L 11 11
Dr. M 7 6 1
Dr. N 6 4 1 1
Dr. O 6 6
Dr. P 6 5 1
Dr. Q 6 5 1
Dr. A** 5 1 3 1
Dr. W 5 5
Top 10 Highest Opiate Prescribers 2010 vs. 2014

Acute to Chronic Opioid Use In New
Claims Date of Injury (DOI) 2011 vs.
2013
IWs with DOIs in 2011 Totals
Percent of 2011
total IWs with DOIs in 2013 Totals
Percent of 2013
total
2011 vs.
2013
Percent
change
IWs that received RX prior
to July 2012 8,448
IWs that received RX Prior
to 7-2014 6,001 -29%
IWs with "acute" opiate
script (RX with 28 days) 4,754 56%
IWs with acute opiate script
( RX with 28 days) 3,452 58% -27%
IWs with ongoing opiate
script (RX after 84 days) 4,483 53%
IWs with ongoing opiate
script (RX after 84 days) 2,755 46% -39%
IWs with acute and
ongoing opiate Rx after
July 2012 1,531 18%
IWs with acute and ongoing
opiate Rx after July 2014 863 14% -44%
4/2/2015 BWC Pharmacy Program Overview 56

Opiates and the Injured Worker
• Five Ohioans die every day due to unintentional drug
poisoning.
• Between 2006 to 2012, on average, one injured worker
died every week due to drug overdose.
• Ove half of the injured worker drug overdose deaths in
2012 also involved a benzodiazepine
• An injured worker was over three times more likely to die
from drugs than the general
population.http://www.healthy.ohio.gov/~/media/HealthyOhio/ASSETS/Files/injury%20prev
ention/2012%20overdose%20data/1finalCB_2012_Bullets%20for%20reporters%20on%20drug%2
0related%20poisoning.ashx

4/2/2015 BWC Pharmacy Program Overview
o Implement an automated process to identify high risk medication regimens and trigger direct clinical staff contact with the prescriber.
o Establish an opioid prescribing rule based on best clinical practices for both prescribing as well as discontinuing these drugs.
o Initiate a retail pharmacy based medication therapy management program to coordinate medications in high risk claims.
Going Forward


Third-Party Payer Track
Workers’ Compensation: Examining Policy Issues and What Works
Presenters:
• Joseph Paduda, MS, Principal, Health Strategy Associates
• Jeffrey Austin White, MS, Director, Medical Management Practices and Strategy, Accident Fund Holdings, Inc.
• Johnnie L. Hanna, RPh, MBA, Pharmacy Program Director, Ohio Bureau of Workers’ Compensation (BWC)
Moderator: Michelle C. Landers, JD, Executive Vice President and General Counsel, Kentucky Employers’ Mutual Insurance, and Member, Rx Summit National Advisory Board