rv-7 n675cp lean versus rich fuel mixture aircraft performance
TRANSCRIPT

RV-7 N675CP
Lean versus Rich Fuel Mixture Aircraft Performance
A Senior Project
presented to
the Faculty of the Aerospace Engineering Department
California Polytechnic State University, San Luis Obispo
In Partial Fulfillment
of the Requirements for the Degree
Bachelor of Science in Aerospace Engineering
by
© Spring June 2010
Edward Spenser Burgos1 and William Beaman Howe
1
California Polytechnic State University Aerospace Engineering Department, San Luis Obispo, CA, 93407
1 Undergraduate Student, Aerospace Engineering Department, 1 Grand Avenue

2
The purpose of this experiment was to compare the effects of flying with lean mixture versus
rich mixture on aircraft performance. This was done by taking data in the RV-7 N675CP
aircraft, RV-7A base aircraft that was built by students at California Polytechnic State
University of San Luis Obispo. The RV-7 N675CP contains a Lycoming O-360-A 180 HP
engine and fully automated flight data acquisition system. Test flight data indicates the
aircraft consumes less fuel, has greater engine exhaust gas temperature (EGT), and possibly
increases airspeed with a lean fuel mixture.
Nomenclature
he concept of leaning an engine has been around for quite some time. It was famously used when
Charles Lindbergh leaned his engine while he was crossing the Atlantic Ocean. Leaning is a way of
reducing throttling losses. Most of the time full power is not used during flight. To fly at reduced power
the throttle needs to be closed. This means more work needs to be done forcing the air through the smaller
area, which in turn reduces the efficiency. By leaning the mixture a lower power can be achieved without
having to close the throttle as much. By allowing the throttle to be more open the efficiency is increased.
Lean burning is only done when at cruise. For take- off, more power is necessary so the engine is set to a
much richer mixture.
While running lean can save on fuel economy over time it also increases the wear and tear of the
engine. With less fuel being consumed less oil is getting pumped through the engine. Over time this can
increase the damage done. Running rich on the other hand increases the amount of oil getting to the
engine which will reduce the damage done.
With there being both pros and cons to running rich versus lean it is necessary to see how the
different settings affect the aircrafts flight performance. Preliminary research shows temperatures
resulting from a lean burn should be higher than that of the rich burn. This should result in the lean burn
having a higher TAS. However more power should be developed while burning rich.
T
BHP = brake horse power
C = brake specific fuel consumption
CD = coefficient of drag
CL = coefficient of lift
E = endurance
EGT = exhaust gas temperature
HP = horse power
hr = hour
l = liter
P = power
RPM = rotations per minute
S = planform area of the wing
TIT = turbine inlet temperature
V = speed
W = weight
ρ = density of air
ηp = propeller efficiency
Subscrips i = indicated
f = final
s = standard
t = test
w = corrected for weight

3
I. Leaning an Engine
As the ratio of fuel to air increases the exhaust gas temperature (EGT) and the turbine inlet
temperature (TIT) increases. Eventually the temperature will peak and then start decrease the more the
mixture is enriched. As it can be seen in Fig. 1, Lean of peak is when the fuel mixture is less than that
which gives the highest peak EGT or TIT. To operate at this point the engine is leaned until the EGT
peaks and then starts to decline. Operating at lean of peak gives the better fuel economy as less fuel is
used in the mixture. This can be seen in Fig. 1where specific fuel consumption is plotted versus the fuel
mixture. It can be seen that the least fuel consumption occurs lean of peak. After that point the fuel
consumption only increases as the mixture is enriched. However power is lost when operating lean of
peak. If 75% power is achieved at peak and then the engine is leaned to 50° F lean of peak, the actual
power output is approximately 69%1.
Figure 1: Engine Trends against different fuel mixtures.

4
In order to compensate for the lost power the throttle can be opened. If the engine used in this
process is a normally aspirating engine, like Lycoming O-360 used in this project, there can be problems.
It has been documented that leaning the engine past peak EGT at 75% power can cause detonation1. This
is a very small possibility though.
Figure 2 below is for a Lycoming O-320 engine2. It shows how flying a lean versus full rich
compares in fuel economy. It can be seen across the board that leaned to minimum fuel consumptions is
over a gallon per hour less than full rich. It also shows how RPM and the manifold pressure affect the fuel
flow. As the RPM increases the fuel consumption also increases. This is also the same with the manifold
pressure.
Figure 2: Part Throttle Fuel Consumption.
II. Experimental Test Procedures
The test flight for the project was flown on May 20, 2010, ranging from 9:30 to 11 AM. Specific
procedures and safety analysis for the flight test can be seen in the Flight Test Plan (Appendix A) for
reference. Figure 3 shows the 3-D GPS flight path of the actual flight test. GPS coordinates of the flight
were plotted on Google Map 3-D for the outputted pictures.

5
As mentioned on the Flight Test Plan, the airport used was San Luis Obispo County Region
Airport and the level flight RPM runs were flown at 3,000 ft and 4,000 ft altitude along the coasts of the
Morro Bay State Park and Montana de Oro State Park. Only three full runs for both lean and rich fuel
mixtures were flown at the 3,000 ft altitude test: 2,100, 2,300, and 2,400 RPM. An extra 2,200 RPM run
for lean only was flown as well. For the 4,000 ft altitude test, only 2 full runs were flown for both lean
and rich fuel mixtures: 2,300 and 2,400 RPM. Extra 2,000 and 2,100 RPM runs for lean only were flown
as well.
Figure 3: Google Map 3-D flight path of the actual test flight.
III. Analysis
To analyze the flight data collected from the test flight from the data acquisition system, the data
was first filtered through a three parameter check to make sure the data used was from the appropriate
steady level flight run. The parameters used were altitude, RPM, and G measurements from the data
collected during the test flight. All three parameters were plotted against time to aid in the data
classification, see Fig. 4 for the used plots.
The data was first classified into the corresponding altitude test by the altitude measurements.
Next, the data was reduced to the corresponding RPM run by examining the RPM measurements. Visual
approximations, from the plots, were first used to first identify a range of data points that resemble the
corresponding RPM test run. Then a 35 RPM threshold from the average RPM in the range was implied
to further filter the data range. Finally, the G parameter was used as the final filter. To most closely match
steady level flight, only data within the new range that had a G measurement of 1 was used as the test data
for analysis. With a G of 1, the sensor calculated that no significant disturbances were felt on the aircraft
at the given time making it an ideal filter.
The final data ranges can be seen of the plots with their corresponding color coded RPM run. For
a perspective view as to how to the data can be used to understand the state at with the aircraft was
present and confirm the data range lies in a steady level flight, one can look at the trends in the data.
Major spikes in all three plots indicate the aircraft is in a turn, minor spikes in the RPM plot indicate the
pilot setting the engine RPM level to the desired value, and minor spikes in the G plot indicate small pitch
adjustments made by the pilot to keep the aircraft as level as possible or small wind disturbances. Steady
level flight is determined with approximate flat lined RPM and G lines with the given data range.

6
Figure 4: Filter data plots. Figures A,D plot altitude, B,C plot RPM setting, and C,F plot G level.

7
IV. Results and Discussion
a) Fuel Flow Analysis
For viewing the fuel flow difference of lean and rich fuel mixtures within the flight test, the fuel
flow data collected by the data acquisition system was plotted against time; see Fig. 5 for 3,000 ft altitude
results and Fig. 6 for 4,000 ft results. When plotted, two trends are immediately spotted. Flow fuel
increases as the RPM setting is increased and fuel flow is less when the fuel mixture is lean. With a
higher RPM setting, more fuel is consumed by the engine as fuel consumption is a directly proportional to
RPM level. The engine pistons and cylinders rotate faster as the RPM setting is increased, causing more
fuel to be feed in the engine to maintain adequate piston rotation as the number of fuel combustion cycles
increase.
The increase of fuel flow in rich fuel mixtures over lean fuel mixtures is because of the added fuel
percentage in the fuel to air ratio for rich mixtures. The fuel burned in the aircraft engines is a
combination of pure jet fuel with air. Rich and lean fuel mixtures are derived from the engine’s EGT. By
definition, rich fuel mixtures have more pure jet fuel present in the fuel mixture than lean. Fuel mixtures
are defined as rich when the exhaust temperature is less than the peak EGT and the fuel to air mixture is
greater than the fuel mixture of the peak EGT. Fuel mixtures are defined as lean when the exhaust
temperature is less than the peak EGT and the fuel to air mixture is less than the fuel mixture of the peak
EGT.
Figure 5: Fuel flow summary at 3,000 ft test for both lean and rich runs.

8
Figure 6: Fuel flow summary at 4,000 ft test for both lean and rich runs.
b) Engine Temperature Analysis
For viewing the engine temperature difference of lean and rich fuel mixtures within the flight test,
the engine temperature data collected by the data acquisition system was plotted against time; see Fig. 7
for 3,000 ft altitude results and Fig. 8 for 4,000 ft results. Within the figure T2 is defined as the engine
inlet temperature, T3 is defined as the engine’s EGT, and T4 is defined as the engine exit temperature. For
analysis purposes, primary emphasis will be spent on T3 as all three temperatures are directly proportional
to each other. Also T3 was chosen since the engine’s EGT is used to determine rich or lean fuel mixture.
From the figures below it can be seen that as the RPM increases for lean flow the EGT rises as
well. This is because as the RPM increases more fuel is injected into the system in order to increase the
number of cycles. Therefore with the rise in combustion rate the overall temperature increases as well.
When the flow is switched from lean to rich there can be seen a steep drop in temperature. The
temperature drop is due to a lack of oxygen. As the mixture is enriched the ratio of fuel to oxygen
increases. By enriching the mixture to the point that is shown below the engine is essentially being
flooded. There isn’t enough oxygen to combust all the fuel, which leads to a lower EGT. As the RPM
increases more fuel is injected into the system thus flooding the system more and reducing the EGT. This
effect of the rich mixture can be seen in the figures below.

9
Figure 7: Engine temperatures summary at 3,000 ft test for both lean and rich runs.
Figure 8: Engine temperatures summary at 4,000 ft test for both lean and rich runs.

10
c) True Airspeed Analysis
For viewing the true airspeed difference (TAS) of lean and rich fuel mixtures within the flight
test, the TAS data collected by the data acquisition system was plotted against time, see Fig. 9 for 3,000 ft
altitude results and Fig. 10 for 4,000 ft results. When viewing the plots, a trend of increasing TAS as
RPM increases is discovered. As RPM increases, more power is created by the engine. More power
increases the engine’s energy outputted which results in a net increase in aircraft speed.
Figure 9: True airspeed summary at 3,000 ft test for both lean and rich runs.

11
Figure 10: True airspeed summary at 4,000 ft test for both lean and rich runs.
d) Lean versus Rich Fuel Mixture Performance Comparison
When comparing the average lean fuel mixture data to the rich fuel mixture data, the resulting
performance differences follow theory. The aircraft consumes less fuel, has greater engine exhaust gas
temperature (EGT), and possibly increases airspeed with a lean fuel mixture. In both the 3,000 ft and
4,000 ft altitude tests, all RPM runs showed a reduced fuel consumption when the aircraft was flown on
lean. The reduced fuel consumption was primary driven by the fact that more fuel is need for rich than
lean because as the RPM level increased, the difference in fuel flow increased as well. A calculated 8.53,
11.21, and 12.52 liter per gallon fuel flow difference resulted from the 2,100, 2,300, and 2,400 RPM runs
respectively at 3,000 ft. A calculated 14.48 and19.12 liter per gallon fuel flow difference resulted from the
2,300 and 2,400 RPM runs respectively at 4,000 ft as well.
For altitude tests and all RPM runs, the engine’s EGT followed the theoretical trend of increased
EGT for lean fuel mixtures. As less pure jet fuel is present in the fuel to air mixture, great temperature
combustion is present inside the engine. The resulting hotter combustion results in greater exhaust gas
temperature. As the RPM of the engine increases, so does the number of combustion cycles within the
time frame. More combustion leads to greater exhaust temperatures and results in higher EGT. The
experimental data follows the trend as EGT increases as both RPM increases and when lean fuel is
present. A calculated 72 �C, 78 �C, and 83 �C EGT difference resulted from the 2,100, 2,300, and

12
2,400 RPM runs respectively at 3,000 ft. A calculated 110 �C and 128 �C EGT difference resulted from
the 2,300 and 2,400 RPM runs respectively at 4,000 ft as well.
When comparing the true airspeed, discrepancies were present in the results. Theoretically, EGT
has a direct relationship with aircraft airspeed. As EGT increases, so does the aircraft’s airspeed. This
trend can be seen in only in the 3,000 ft altitude test, but not in all RPM runs. At 3,000 ft, there is a 3mph
and 7 mph difference of TAS in the 2,100 and 2,300 RPM runs, respectively, that favor the lean mixture.
However at the 2,400 RPM run there is a 3 mph difference that favors the rich mixture. In the 4,000 ft
altitude test, there is a 0 mph TAS difference in the 2,300 mph test and a 4 mph difference in the 2,400
RPM test that favors the rich fuel mixture. Possible reason for the discrepancies can be deduced from Fig.
2A and 2D. At mostly all RPM runs, the altitude plots show the aircraft pitched up (altitude gain) or down
(altitude gain) in both lean and rich runs; most cases being opposite heading between lean and rich. If the
aircraft was pitched down, added airspeed will be present TAS and if pitched up, the negated airspeed
would not be present in TAS. If the speed difference were to be great enough to affect TAS, then only the
3,000 ft altitude 2,100 RPM run could be seen as valid comparison for TAS. Both lean and rich show a
very similar rate loss of altitude meaning the aircraft is experiencing similar pitch down heading. Added
benefits to TAS would be accounted for in both lean and rich. At the run, lean fuel mixture has a 3 mph
increase over rich. With a higher EGT, lower fuel flow, and greater TAS for lean fuel mixture than rich,
the run’s experimental data follows theory for all cases. Below, Table 1 shows a full summary of the
performance comparison done.
Table 1: Lean versus Rich Performance Summary
3,000 ft Altitude Test
Alt (ft)
Alt DIFF (ft)
Actual RPM
RPM DIFF
Fuel Flow (l/hr)
Fuel F. DIFF (l/hr)
TAS (mph)
TAS DIFF (mph)
EGT (˚C)
EGT DIFF
(˚C)
Fuel Mix Type
Test RPM
2,829 2,084 27.26 136 704 Lean
2,591 238
2,060 24
35.79 8.53
133 3
632 72
Rich 2,100
2,881 - 2,234 - 32.94 - 143 - 717 - Lean 2,200
2,889 2,308 34.27 153 723 Lean
2,792 97
2,286 22
45.48 11.21
146 7
645 78
Rich 2,300
2,851 2,416 39.65 157 739 Lean
2,855 4
2,413 3
52.17 12.52
160 3
656 83
Rich 2,400
4,000 ft Altitude Test
Alt (ft)
Alt DIFF (ft)
Actual RPM
RPM DIFF
Fuel Flow (l/hr)
Fuel F. DIFF (l/hr)
TAS (mph)
TAS DIFF (mph)
EGT (˚C)
EGT DIFF
(˚C)
Fuel Mix Type
Test RPM
3,798 - 2,024 - 24.15 - 128 - 712 - Lean 2,000
3,622 - 2,137 - 26.49 - 138 - 733 - Lean 2,100
3,990 2,286 29.88 148 751 Lean
3,903 87
2,293 7
44.36 14.48
148 0
641 110
Rich 2,300
3,904 2,393 34.08 154 774 Lean
3,866 38
2,415 12
53.20 19.12
158 4
646 128
Rich 2,400

13
V. Conclusion
From the experimental data collected on the RV-7 N675CP test flight, the aircraft consumes less
fuel, has greater (EGT), and possibly can increase airspeed with a lean fuel mixture. In all test flight runs,
the aircraft flying on lean fuel mixture had less fuel flow with the greatest difference being 12.52 liter per
hour at the 4,000 ft altitude 2,400 RPM run. Likewise, in all test flight runs, the aircraft flying on lean fuel
mixture had higher EGT than rich fuel mixture with the greatest EGT difference at 128 �C at the 4,000 ft
altitude 2,400 RPM run. Unfortunately, with discrepancies in the TAS data and the possibility of the error
being in the test flight nature, no true conclusion can be made. However with the closest valid data range
at the 3,000 ft 2,100 RPM run confirming the theoretical increase of airspeed with lean fuel mixture at a
3mph increase, the possibility of the theoretical trend in shown. With an extra test flight that has the
aircraft fly at a more level constant altitude flight, the probability of confirming or denying the theoretical
trend of a leaned aircraft having greater airspeed than a rich one experimentally can be increased.
VI. Future Work
With the addition of a manifold pressure sensor many more flight characteristics could be
analyzed. Without this sensor the only useful data is limited that which is recorded directly by the
aircraft’s computer. Having a pressure manifold sensor would allow for the BHP to be accurately
determined using a power settings table3. This table can be found in the Flight Test Plan (Appendix A)
under Fig. 2. Using the equation
Piw =σ BHP( ) ηp( )
W t
W s
3
2
the power required corrected for standard day can be calculated from the BHP. The power required can
then be plotted against the Viw to create a plot for the power required for level flight. Performing a linear
regression and then creating a best fit line will allow for a smooth data set. This new set of data for Piw
and Viw can then be used in
CL =2W s
ρ0sViw
2
and
CD =1100Piw
ρ0sViw
3
with the coefficient of lift and drag calculated a drag polar can be created.
The drag polar can be used to perform multiple different analysis on the aircraft. The range for
the aircraft can be found using

14
R =ηp 550
C
CL
CD
ln
W i
W f
It can be seen that maximum range occurs when flying at max CL/CD. The velocity at which the
maximum range occurs is the velocity at which the tangent line to the power required curve passes
through the origin. This can be seen in Fig. 11 below.
Figure 11: Finding Max Range.
The drag polar can also be used to find the endurance of the aircraft using the equation
E = −ηp 550
C
CL
32
CD
ρS
2
1
W f
−1
W i
These studies could be done easily by future students. All that would be necessary would be to
add a manifold pressure sensor to the engine of the RV-7 N675CP.
Appendix
Appendix A RV-7 N675CP Flight Test Plan
Appendix B Flight Test Data (See Attached)
File Name: May 20, 2010 RV7 N675CP Test Flight Data.xls
Appendix C Google Map 3-D Flight Test Path (See Attached)
File Name: May 20, 2010 RV7 N675CP Test Flight Path.kmz

15
References
1The "New" Old Leaning Technique. Tech. Vol. SSP700. Williamsport: Lycoming. Print. Experts
Are Everywhere To Help You.
2Part Throttle Fuel Consumption. Tech. Williamsport: Lycoming. Print. Power Settings.
3Roberts, Sean "Cruise Performance Theory." Light Aircraft Performance For Test Pilots and
Flight Test Engineers. Bedford: United States Air Force, 1982. 11.1-1.47. Print.

i
Appendix A
RV-7 N675CP Flight Test Plan
Lean versus Rich Fuel Mixture Aircraft Performance
Edward Burgos2 and Bill Howe1
California Polytechnic State University Aerospace Engineering Department, San Luis
Obispo, CA, 93407
The primary purpose of this test plan is to acquire flight test data to determine the fuel flow and speed difference of an aircraft when flying on lean or rich fuel mixtures. The aircraft of used in the flight test was the California Polytechnic State University student built RV-7A. This test plan contains aircraft performance/specifications, flight technique/ summary/safety, and flight test card for the test flight.
2 Undergraduate Student, Aerospace Engineering Department, 1 Grand Avenue

ii
TABLE OF CONTENTS
I. INTRODUCTION ..................................................................................................... 1
A. Flight Test Objectives.............................................................................................. 1
II. AIRCRAFT SPECIFICATIONS ............................................................................... 1
A. RV-7A General Description ..................................................................................... 1
B. RV-7A Performance Specifications ........................................................................ 2
III. TEST SCHEDULE & PROCEDURES ..................................................................... 4
A. Projected Flight Path ............................................................................................... 4
B. Projected Flight Schedule ....................................................................................... 5
IV. TEST INSTRUMENTATIONS.................................................................................. 6
V. HAZARDS & SAFETY ............................................................................................ 6
A. Hazard Introduction................................................................................................. 6
B. Test Flight Hazard Analysis .................................................................................... 8
i. Exceeding Engine Temperatures (Oil and EGT) .................................................................. 9
ii. In-Flight Engine Failure ........................................................................................................ 9
iii. In-Flight Fire ........................................................................................................................ 9
iv. Trailing Vortex Wake ......................................................................................................... 10
v. Clear Air Turbulence (CAT) ............................................................................................... 10
vi. Control Surface Malfunction.............................................................................................. 10
vii. Equipment Malfunction ..................................................................................................... 11
viii. Mid-Air Collision............................................................................................................... 11
C. Hazard Summary ....................................................................................................11
REFERENCES ...................................................................................................... 12
APPENDIX ............................................................................................................ 13
A. Blank Flight Test Card............................................................................................13

1
I. INTRODUCTION
In response to the flight clearance to fly the Cal Poly San Luis Obispo RV-7 N675CP aircraft, Cal Poly
professors Dr. Daniel B. Biezad and Dr. Kurt Colvin request a flight test of the aircraft. With an experimental
integrated multi-sensor data acquisition system placed onboard the aircraft, the ability to use the RV-7 N675CP as a
test aircraft for the AERO 409 Flight Test class would be invaluable tool. A flight test of the aircraft for both testing
the data acquisition system and aircraft performance was placed. The aircraft performance parameters to be
monitored and tested are fuel consumption and airspeed to witness any differences when the aircraft is flown on lean
or rich fuel mixtures. In response to the flight test request, the following flight plan was created.
A. Flight Test Objectives
The flight objectives of the test are to obtain fuel flow and aircraft velocity flight data to find out the
differences of both parameters when the aircraft flies on lean and rich fuel mixtures. The aircraft will fly at different
altitudes with different engine RPM settings at both lean and rich fuel mixtures. Data would be collected by the
onboard sensors and computer retrieval system with the aircraft. The data would then be processed and analyzed to
find fuel savings and speed difference for each fuel mixture.
II. AIRCRAFT SPECIFICATIONS
A. RV-7A General Description
The aircraft used for the flight test is the Cal Poly San Luis Obispo student assembled RV-7 N675CP. The
aircraft is a Van’s RV-7A aircraft kit assembled by previous Aero 572 Course Materials for "Aircraft Manufacturing
and Fabrication Lab students under the supervision of Dr. Daniel J. Biezad. The aircraft has a triangular landing gear
configuration without wheel pants and fairings on the main landing gear. The aircraft was equipped with student
integrated onboard sensors and a data collection computer to obtain real time flight data. Figure 1 shows multiple
pictures of the RV-7 N675CP and a close up picture of the cockpit. Table 1 shows basic aircraft description of the
RV-7A2, the model kit used for the RV-7 N675CP.

2
Figure 1. Pictures of RV-7 N675CP and close up of aircraft cockpit.
Table 1. RV-7A General description.
General Description
Wing Span 25 ft
Overall Length 24 1/3 ft
Overall Height 7 5/6 ft
Wing Area 121 ft2
Empty Weight 1077-1130 lbs
Gross Weight 1800 lbs
Wing Loading 14.8 lb/ ft2
Power Loading 12-19 lb/hp
Fuel Capacity 42 US gal
B. RV-7A Performance Specifications
The RV-7A used in this project contains a Lycoming O-360-A 180HP engine. Seen blow in Figure 2 is a
power settings table for the O-360-A courtesy of Van’s Airforce. This table can be used to estimate the HP
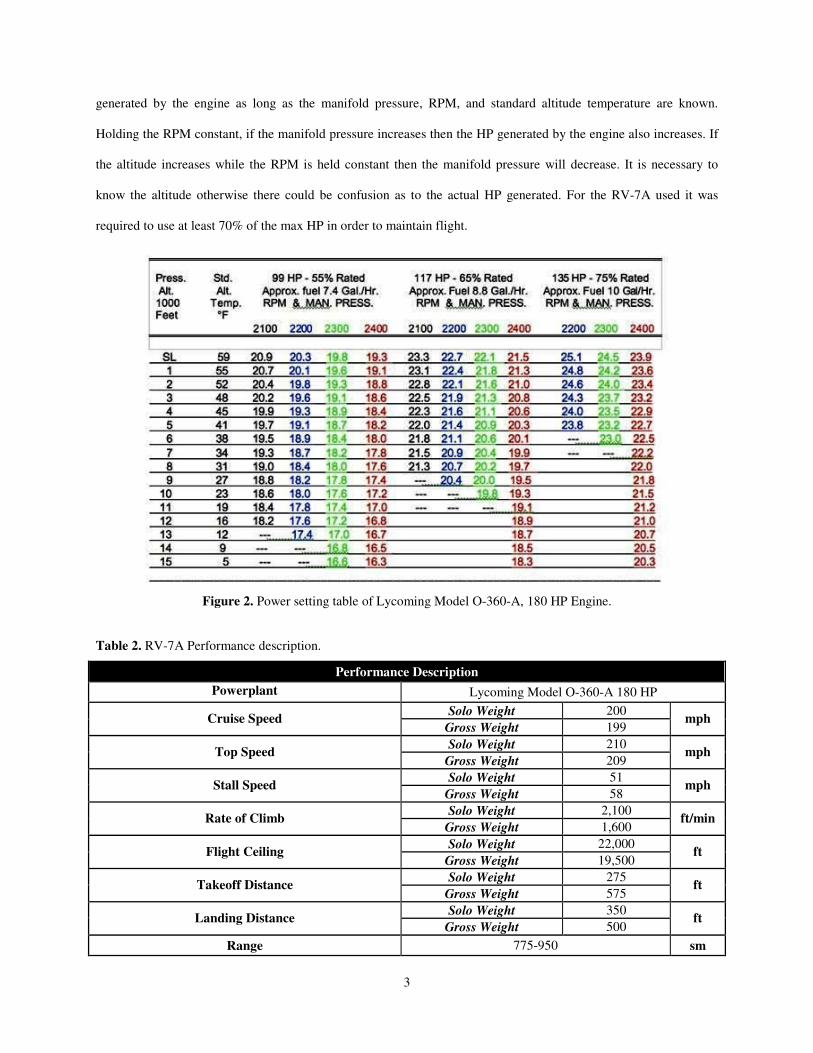
3
generated by the engine as long as the manifold pressure, RPM, and standard altitude temperature are known.
Holding the RPM constant, if the manifold pressure increases then the HP generated by the engine also increases. If
the altitude increases while the RPM is held constant then the manifold pressure will decrease. It is necessary to
know the altitude otherwise there could be confusion as to the actual HP generated. For the RV-7A used it was
required to use at least 70% of the max HP in order to maintain flight.
Figure 2. Power setting table of Lycoming Model O-360-A, 180 HP Engine.
Table 2. RV-7A Performance description.
Performance Description
Powerplant Lycoming Model O-360-A 180 HP
Solo Weight 200 Cruise Speed
Gross Weight 199 mph
Solo Weight 210 Top Speed
Gross Weight 209 mph
Solo Weight 51 Stall Speed
Gross Weight 58 mph
Solo Weight 2,100 Rate of Climb
Gross Weight 1,600 ft/min
Solo Weight 22,000 Flight Ceiling
Gross Weight 19,500 ft
Solo Weight 275 Takeoff Distance
Gross Weight 575 ft
Solo Weight 350 Landing Distance
Gross Weight 500 ft
Range 775-950 sm

4
III. TEST SCHEDULE & PROCEDURES
C. Projected Flight Path
The flight path for the flight test comprises of a four part flight: takeoff, 3,000 ft altitude testing, 4,000 ft
altitude testing, and landing. The flight will begin with a takeoff from San Luis Obispo County Regional Airport.
The aircraft will be flown northwest to the coast of Morro Bay State Park where testing will commence. Straight
level flights at 3,000 ft and 4,000 ft will be done hugging the coast in case of emergency landing.
During the 3,000 and 4,000 ft altitude flights, the aircraft will be flown at 2,000, 2,100, 2,200, 2,300 and
2,400 RPM engine settings for both lean and rich fuel mixtures. Each RPM setting run will be flown in
approximately2 minute straight level flight to collect data on the Flight Test Card, see Appendix A. The lean fuel
mixture flights would be flown first.
At 3,000 ft altitude, a total of 10 runs will be done, 5 lean runs and 5 rich runs. The aircraft will fly lean
from 2,000 RPM to 2,400 RPM. Once the last lean run is done, the rich flights will be flown from 2,400 RPM to
2,000 RPM. After completing the rich flight runs, the aircraft will be flown 4,000 ft. The runs will follow the same
previous schedule. After all flight runs are completed, the aircraft will be flown back to San Luis Obispo County
Regional Airport for landing.
Figure 3. Flight path for test flight.

5
D. Projected Flight Schedule
TAKEOFF
Location Time Procedure
San Luis Obispo County Region Airport
15 minutes Preflight aircraft, begin onboard data acquisition, takeoff, and
fly Northwest to Morro Bay State Park beach coast for testing
ALTITUDE TRIAL: 3,000 ft
Fuel Mixture RPM Time Procedure
2,000
2,100
2,200
2,300
LEAN
2,400
2,400
2,300
2,200
2,100
RICH
2,000
30 minutes
1) Fly aircraft to altitude of 3,000 ft. Set fuel mixture to lean.
2) Start 2,000 RPM test run south of Morro Bay State Park
near Coleman Drive.
3) Fly constant altitude level flight in southern path towards
Montana De Oro State Park, hugging the coast.
4) Maintain level flight (altitude, heading, and RPM as
constant as possible) for approximately 30-50 seconds.
Collect and record data on flight test card.
5) When the run is complete, turn 180 degrees and fly north
toward Morro Bay State Park for2,100 PRM run.
6) Maintain level flight for approximately 30-50 seconds.
Collect and record data on flight test card.
7) When the run is complete, turn 180 degrees and fly south
toward Montana De Oro State Park for 2,200 PRM run.
8) Repeat steps 3-7 until all runs, lean and rich, are complete.
9) When complete fly to 4,000 ft altitude.
ALTITUDE TRIAL: 4,000 ft
Fuel Mixture RPM Time Procedure
2,000
2,100
2,200
2,300
LEAN
2,400
2,400
2,300
2,200
2,100
RICH
2,000
25 minutes
1) Set fuel mixture to lean.
2) Follow the same procedure as the 3,000 ft trial for both
lean and rich fuel mixtures. Once again start south of
Morro Bay State Park near Coleman Drive and fly in
southern path towards Montana De Oro State Park,
hugging the coast. Record data on test flight card when
appropriate.
3) When complete of all runs, make heading towards San
Luis Obispo County Region Airport.
LANDING
Location Time Procedure
San Luis Obispo County Region Airport
10 minutes After testing, fly southeast to airport for landing

6
IV. TEST INSTRUMENTATIONS
The instrumentation used in the flight test was the onboard sensors and data collection computer. All the
sensors were placed by the AERO 572 students during the assembly of the aircraft. The sensors were connected to a
main onboard computer that receives and records all the data to a secure digital memory card in an excel spread
sheet. Some of the major data collected by the sensors are shown in Table 3.
Table 3. Onboard Data Collection Summary
DATA COLLECTION
Altitude Indicated Air
Speed Engine RPM Fuel Flow Angle of Attack Glide Slope
G Meter GPS
Latitude
GPS
Longitude
GPS
Altitude True Air Speed
Vertical Speed
Indicator
Ground Speed Water
Temperature Oil Temperature
Oil
Pressure
Bank
Angle Pitch
Side Slip Yaw Barometer Outside Air
Temperature Main Heading
Turn
Radius
Main Battery
Voltage
Backup Battery
Voltage TC2 TC3 TC4 RFT1
V. HAZARDS & SAFETY
E. Hazard Introduction
For every test flight, an adequate knowledge of the major hazards that could be experienced during the test
flight must be announced and reviewed. Hazard information and preparation is a major and serious part of test flight
pre-flight check as it can inform and help out pilots minimize and possibly avoid dangerous situations within the test
flight.
For the analysis of the hazard, each hazard must first be classified based on the severity and probability of
the hazard. Table 4 shows the classification of the severity of a hazard from negligible to catastrophic. Based on the
resulting severity of the hazard, the hazard is given a category number from I to IV that could be derived from the
table.

7
Table 4. Hazard Severity Categories
DESCRIPTION CATEGORY MISHAP DEFINITION
CATASTROPHIC I Death or system loss
CRITICAL II Severe injury, severe occupational
illness, or major system damage
MARGINAL III Minor injury, minor occupational illness, or minor system damage
NEGLIGIBLE IV Less than minor injury, occupational
illness, or system damage
Like the classification of the severity of a hazard, the hazard’s probability is also determined. Table 5
shows the classification of the probability of the hazard. The hazard can be classified from most probable to least
probable, from level A to level E.
Table 5. Hazard Probably Ranking
LEVEL DESCRIPTION
FREQUENT A Likely to occur frequently
PROBABLE B Will occur several times
in life of an item
OCCASIONAL C Likely to occur sometime
in life of an item
REMOTE D Unlikely but possible to
occur in life of an item
IMPROBABLE E
So unlikely, it can be assumed
occurrence may not be
experienced
With the severity and probability ranking of the hazard known, a Hazard Matrix can be created as a
condensed pictorial chart for test pilots. See Table 6 for the Hazard Matrix. For a high probability of a safe flight,
most if not all hazards that could be experienced in the test flight should lie within the sections highlighted green or
blue in the matrix. Sections highlighted in green and blue indicate hazards that can be flown without a pilot safety
briefing. Sections highlighted in yellow indicate the flight test can proceed but the pilot must be briefed on the
hazards. However, sections highlighted in red indicate that the hazard is too dangerous for flight. Usually hazards
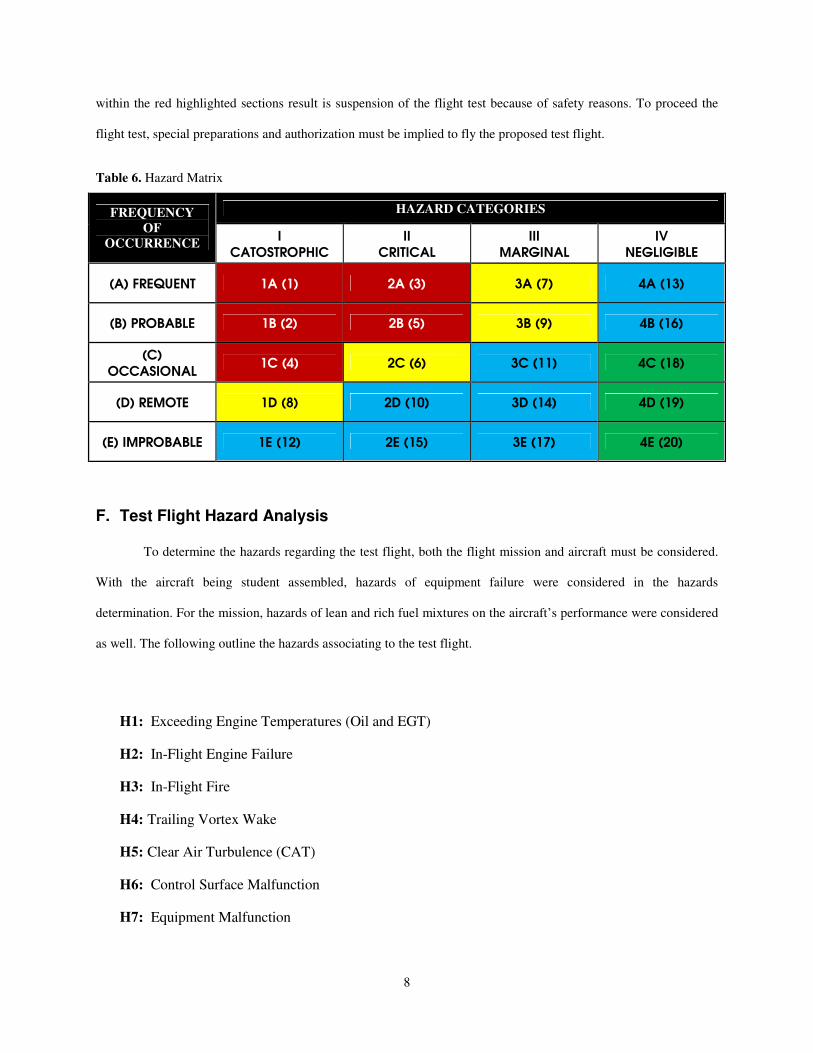
8
within the red highlighted sections result is suspension of the flight test because of safety reasons. To proceed the
flight test, special preparations and authorization must be implied to fly the proposed test flight.
Table 6. Hazard Matrix
HAZARD CATEGORIES FREQUENCY OF
OCCURRENCE I
CATOSTROPHIC
II
CRITICAL
III
MARGINAL
IV
NEGLIGIBLE
(A) FREQUENT 1A (1) 2A (3) 3A (7) 4A (13)
(B) PROBABLE 1B (2) 2B (5) 3B (9) 4B (16)
(C)
OCCASIONAL 1C (4) 2C (6) 3C (11) 4C (18)
(D) REMOTE 1D (8) 2D (10) 3D (14) 4D (19)
(E) IMPROBABLE 1E (12) 2E (15) 3E (17) 4E (20)
F. Test Flight Hazard Analysis
To determine the hazards regarding the test flight, both the flight mission and aircraft must be considered.
With the aircraft being student assembled, hazards of equipment failure were considered in the hazards
determination. For the mission, hazards of lean and rich fuel mixtures on the aircraft’s performance were considered
as well. The following outline the hazards associating to the test flight.
H1: Exceeding Engine Temperatures (Oil and EGT)
H2: In-Flight Engine Failure
H3: In-Flight Fire
H4: Trailing Vortex Wake
H5: Clear Air Turbulence (CAT)
H6: Control Surface Malfunction
H7: Equipment Malfunction

9
H8: Mid-Air Collision
i. Exceeding Engine Temperatures (Oil and EGT)
• Hazard: Engine failure.
• Cause: Engine oil and exhaust gas temperatures exceeding acceptable due to possible improper leaning of
fuel mixture.
• Effect: Possible engine failure due to extreme engine overheating.
• Minimizing Procedures: Proper maintenance of engine on the ground and constant fuel mixture and engine
temperature awareness during flight.
• Emergency Procedures: Land immediately.
• Hazard Category: 3-D
ii. In-Flight Engine Failure
• Hazard: Loss of engine.
• Cause: Mechanical failure.
• Effect: Possible loss of aircraft and crew due to crash.
• Minimizing Procedures: Proper maintenance of engine on the ground (50 hour, 100 hour, and annual
inspections) and minimizing abusive engine usage during flight.
• Emergency Procedures: If controllable, immediate no power, glide, emergency landing or else ejection.
• Hazard Category: 2-E
iii. In-Flight Fire
• Hazard: On-board fire during flight.
• Cause: Mechanical failure, human started, etcetera.
• Effect: Fire in or on the aircraft.
• Minimizing Procedures: No smoking during flight and avoid any unnecessary flammable material near or
in aircraft.

10
• Emergency Procedures: Extinguish fire as soon as possible and immediately land.
• Hazard Category: 2-E
iv. Trailing Vortex Wake
• Hazard: Experiencing a vortex wake from nearby aircraft.
• Cause: Flying relatively close behind a larger aircraft. Approximately 70% of wake turbulence accidents
are on approach for landing, 10% take-off, 12% maneuvering, and 5% cruise1.
• Effect: Possible sudden aircraft roll or loss of altitude rate of climb.
• Minimizing Procedures: Avoid flying near or behind larger aircrafts.
• Emergency Procedures: Remain calm and regain/maintain control of aircraft.
• Hazard Category: 3-D
v. Clear Air Turbulence (CAT)
• Hazard: Aircraft experiences CAT during flight.
• Cause: Mixtures of significantly different speed bodies of air. Typically agents of CAT are jet streams,
wind shear, mountain waves, cloudiness, and etcetera.
• Effect: Possibly sudden loss of altitude or aircraft position and heading. Severe cases can result in
unanticipated violent aircraft movement that can result in pilot injury or sudden temporary loss of aircraft
control that could result in a crash. Typical CAT occurrences result in mild aircraft movement that can be
counteracted by pilot control inputs.
• Minimizing Procedures: Avoid jet streams, avoid extremely cloudy locations, fly cautiously over mountain
ranges, and avoid wind surrounding low pressure regions.
• Emergency Procedures: If injury occurs, land immediately.
• Hazard Category: 3-D
vi. Control Surface Malfunction
• Hazard: Physical or operational loss of control surface(s).
• Cause: In flight mechanical failure.

11
• Effect: Possible complete loss of aircraft controllability, depending on surfaces lost.
• Minimizing Procedures: Proper ground maintenance and pre-flight check of all controls.
• Emergency Procedures: Land immediately, depending on surface(s) lost use throttle to control aircraft.
• Hazard Category: 3-D
vii. Equipment Malfunction
• Hazard: Physical or operational loss of aircraft components.
• Cause: Mechanical failure.
• Effect: Loss of aircraft and possible crew in worst case scenario.
• Minimizing Procedures: Pre-flight check of entire aircraft (inspect structure of the aircraft, freedom of the
control surfaces, fuel quantity and quality, engine components, etcetera) and proper maintenance on the
ground. Any questioning of possible faults on aircraft must be addressed and be taken care off before every
flight.
• Emergency Procedures: Land as soon as possible or eject.
• Hazard Category: 2-C
viii. Mid-Air Collision
• Hazard: Aircraft impacting foreign object, another aircraft or bird, in the air during flight.
• Cause: Aircraft impact with foreign object during flight ranging from the unavoidable to pilot error.
• Effect: Loss of aircraft and possible crew.
• Minimizing Procedures: Avoid objects in the air, check blind spots, everyone in aircraft checks for objects.
• Emergency Procedures: Land immediately or ejection.
• Hazard Category: 1-E
G. Hazard Summary
All but one hazard fall in the green and blue sections with the hazard matrix. Hazard H7, Equipment
Failure, lies on the yellow due to the fact the aircraft was assembled by Cal Poly students. A higher worst case
probability of equipment malfunction is given for this reason, raising the hazard ranking from the typically D
(remote) or E (improbable) to C (occasional). Because the likelihood the equipment failing would be a in the
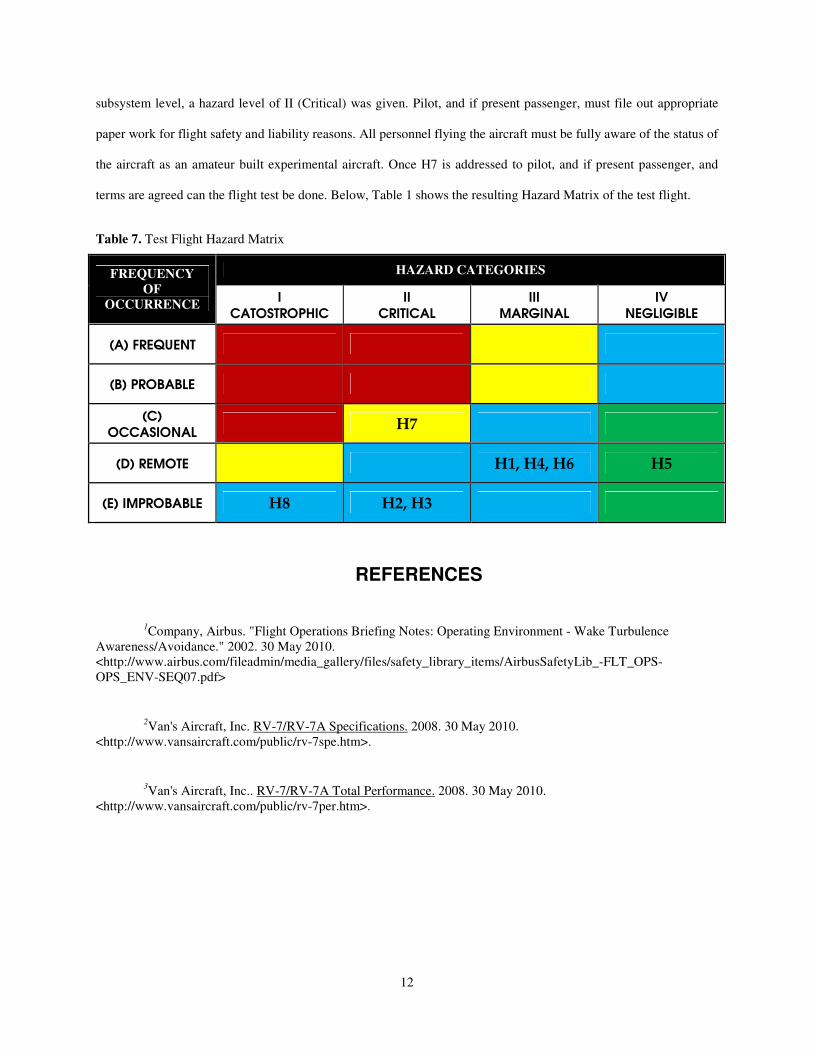
12
subsystem level, a hazard level of II (Critical) was given. Pilot, and if present passenger, must file out appropriate
paper work for flight safety and liability reasons. All personnel flying the aircraft must be fully aware of the status of
the aircraft as an amateur built experimental aircraft. Once H7 is addressed to pilot, and if present passenger, and
terms are agreed can the flight test be done. Below, Table 1 shows the resulting Hazard Matrix of the test flight.
Table 7. Test Flight Hazard Matrix
HAZARD CATEGORIES FREQUENCY OF
OCCURRENCE I
CATOSTROPHIC
II
CRITICAL
III
MARGINAL
IV
NEGLIGIBLE
(A) FREQUENT
(B) PROBABLE
(C)
OCCASIONAL H7
(D) REMOTE H1, H4, H6 H5
(E) IMPROBABLE H8 H2, H3
REFERENCES
1Company, Airbus. "Flight Operations Briefing Notes: Operating Environment - Wake Turbulence
Awareness/Avoidance." 2002. 30 May 2010.
<http://www.airbus.com/fileadmin/media_gallery/files/safety_library_items/AirbusSafetyLib_-FLT_OPS-
OPS_ENV-SEQ07.pdf>
2Van's Aircraft, Inc. RV-7/RV-7A Specifications. 2008. 30 May 2010.
<http://www.vansaircraft.com/public/rv-7spe.htm>.
3Van's Aircraft, Inc.. RV-7/RV-7A Total Performance. 2008. 30 May 2010.
<http://www.vansaircraft.com/public/rv-7per.htm>.

13
APPENDIX
H. Blank Flight Test Card
ALTITUDE TRIAL: 3,000 ft
Engine Temperatures RPM Trial
Mixture TAS MPH Fuel Flow
ALT RPM T2 T3 T4
G’s
LEAN 2,000
RICH
LEAN 2,100
RICH
LEAN 2,200
RICH
LEAN 2,300
RICH
LEAN 2,400
RICH
ALTITUDE TRIAL: 4,000 ft
Engine Temperatures RPM Trial
Mixture TAS MPH Fuel Flow
ALT RPM T2 T3 T4
G’s
LEAN 2,000
RICH
LEAN 2,100
RICH
LEAN 2,200
RICH
LEAN 2,300
RICH
LEAN 2,400
RICH