russell sparks carnegie mellon university department of chemical engineering jorge rossero *,...
TRANSCRIPT

Russell SparksCarnegie Mellon University
Department of Chemical Engineering
Jorge Rossero*, Gregory Jursich#, Alan Zdunek*, Christos G. Takoudis#,*
University of Illinois at ChicagoDepartments of Bioengineering# and Chemical Engineering*
8/1/2013
1
Tunabiliy and Electrical Measurements of Atomic Layer Deposited Yttria Doped Cerium Oxide for Fuel Cell Applications

Applications and Advantages of Solid Oxide Fuel Cells (SOFCs)
Advantages
• SOFCs could become clean replacements for fossil fuel
• SOFCs do not produce NOx, SOx, or hydrocarbon emissions
• Reduced CO2 emissions• Fuel flexibility-SOFCs can
use alternative fuels such as H2
Applications
• Stationary electrical power generation
• Replacement for car batteries
2
N. Perdikaris, K. D. Panopoulos, P. Hofmann, S. Spyrakis and E. Kakaras, International Journal of Hydrogen Energy, 2010, 35, 2446-2456.J. Kupecki, J. Milewski and J. Jewulski, Central European Journal of Chemistry, 2013, 11, 5, 664-671.

SOFC Background• Current SOFCs require operating
temperatures >800 °C• Reducing this to 500-600 °C
would greatly increase SOFC utility
• CeO2 increases O2- ion conductivity at lower temperatures by creating oxygen vacancies in the electrolyte
• Several physical and chemical methods exist to deposit CeO2 and Ceria-based materials (YDC)
3
Schematics of a planar SOFC

Yttrium doped Cerium (YDC)• Ce4+ in the electrolyte tends to reduce to Ce3+ in the anode,
increasing the electric conductivity and causing the cell to short circuit
• Adding Y to Ce film tends to stabilize Ce4+ ions and allow higher O2- conductivity through vacancies in the lattice structure
• Research indicates optimal Y concentration to be 20-34 %
4
Z. Fan, C. Chao, F. Hossein-Babaeiaand, F. B. Prinz, J. Mater. Chem., 2011, 21, 10903.Z. Li, T. Mori, D. Ou, F. Ye, G. J. Auchterlonie, J. Zou and J. Drennan, The Journal of Physical Chemistry, 2012, 116, 5435-5443.

Atomic Layer Deposition (ALD)• Gaseous ligand precursor is
pulsed over Si substrate• Metal ion reacts with –OH on
substrate• Reaction is self-limited by
amount of –OH on substrate surface
• Oxidizing gas is pulsed to react with metal ions
• –OH tails present for next ALD cycle
5
ALD Process Schematic*
*J. Päiväsaari, Inorganic Chemistry Publication Series, Helsinki University of Technology, 2006.
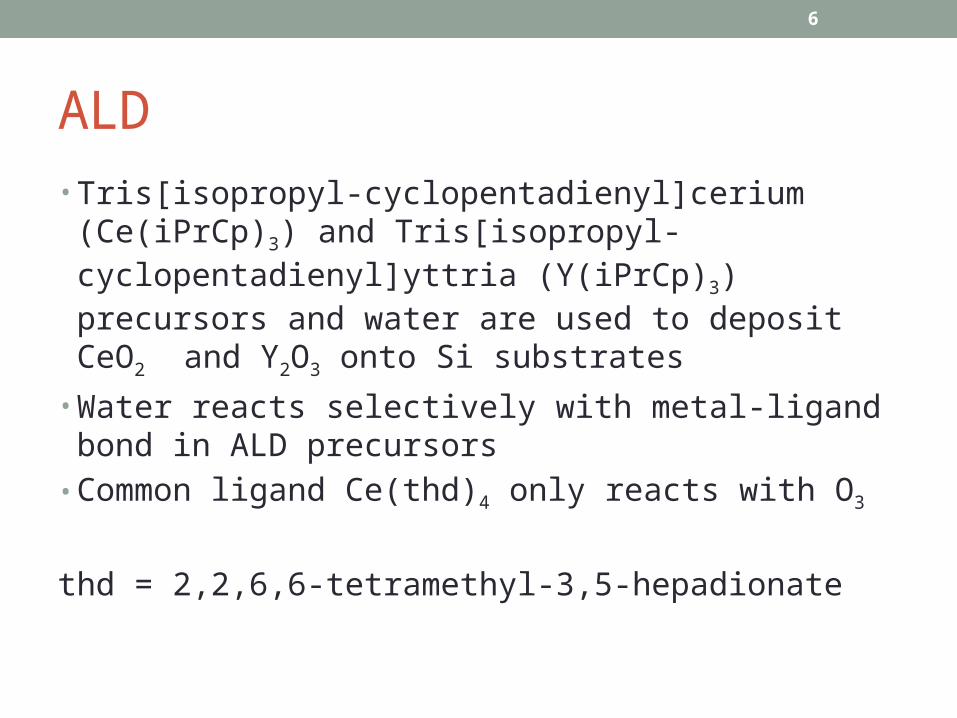
ALD
• Tris[isopropyl-cyclopentadienyl]cerium (Ce(iPrCp)3) and Tris[isopropyl-cyclopentadienyl]yttria (Y(iPrCp)3) precursors and water are used to deposit CeO2 and Y2O3 onto Si substrates
• Water reacts selectively with metal-ligand bond in ALD precursors
• Common ligand Ce(thd)4 only reacts with O3
thd = 2,2,6,6-tetramethyl-3,5-hepadionate
6

Experimental Setup*Ice bath
Hot wall reactor
* P. Majumder, et al., Journal of The Electrochemical Society, vol. 155, pp. G152-G158, 2008.
7

Electrical Resistivity
• Ce+4 has high ionic conductivity, Ce+3 has less ionic conductivity
• Electric resistance inversely proportional to ionic resistance
• Film surface resistivity measured by four-terminal sensing
• Resistivity measured by lab-built sensor
• Sensor consists of 4 Pt electrical leads resting on a nonconductive surface to measure resistance
8

Electrical Resistivity (cont.)• LCR instrument was calibrated to determine best
operating conditions• >2 V and 100-200 Hz settings were found to give most
precise resistance readings • Wide range of YDC, Si, and CeO2 samples tested
• Thickness: 6-28 nm• Weight added on top of sample: 0-50 g • Voltage Range: 0.20 V-5 V• Frequency Range: 10 Hz-100,000 Hz• 2 V DC bias added to overcome effects of frequency• 20, 30 %Y content in YDC films• Annealed and non-annealed YDC films
9

Sheet Resistance of 20% YDC Films with Added Weight
• Extra weight may cause wire leads to rub through film
• Substrate resistance instead of film resistance measured
• Negative readings caused by resistances too high to result in readings
10
Samples were analyzed with 75 Hz and 2V.
0 10 20 30 40 500
1
2
3
4
5
6
7
8
9
11 nm22 nm28 nm
Added Weight (g)
Sh
eet
Res
ista
nce
(M
Ω-S
q)

Effects of Annealing 20 %Y YDC Sample
11
0 50 100 150 200 250 300 350 400 450 5000
2
4
6
8
10
1 V Non-Annealed2 V Non-Annealed3 V Non-Annealed4 V Non-Annealed5 V Non-Annealed
Frequency (Hz)
Sh
eet
Res
ista
nce
(M
Ω-S
q)
0 50 100 150 200 250 300 350 400 450 5000
2
4
6
8
10
1 V Annealed2 V Annealed3 V Annealed4 V Annealed5 V Annealed
Frequency (Hz)
Sh
eet
Res
ista
nce
(M
Ω-S
q)

Sheet Resistance vs. Frequency of YDC Films
12
0 50 100 150 200 250 300 3500
2
4
6
8
10
1V 20% Y YDC2V 20% Y YDC3V 20% Y YDC4V 20% Y YDC5V 20% Y YDC
Frequency (Hz)
Sh
eet
Res
ista
nce
(M
Ω-S
q)
0 50 100 150 200 250 300 3500
2
4
6
8
10
1V 30% Y YDC2V 30% Y YDC3V 30% Y YDC4V 30% Y YDC5V 30% Y YDC
Frequency (Hz)
Sh
eet
Res
ista
nce
(M
Ω-
Sq
)

Effects of 2 V DC Bias for 20% YDC Films
13
0 50 100 150 200 250 300 350 400 4500
2
4
6
8
10
1V Without Bias2V Without Bias3V Without Bias4V Without Bias5V Without Bias
Frequency (Hz)
Sh
eet
Res
ista
nce
(M
Ω-S
q)
0 50 100 150 200 250 300 350 400 4500
2
4
6
8
10
1 V With Bias2V With Bias3V With Bias4V With Bias
Frequency (Hz)
Sh
eet
Res
ista
nce
(M
Ω-
Sq
)

YDC Film Stoichiometric Tunability
0.1 0.2 0.3 0.4 0.5 0.6 0.70
0.1
0.2
0.3
0.4
0.5
0.6
0.7
0.8
f(x) = 1.00382577987051 x + 0.0615862271924662R² = 0.999430745808032
ALD CYCLE RATIO Y/(Y+Ce)
Y-at
om ra
tio Y
/(Y+
Ce)
14

XPS Background• XPS (X-Ray photoelectron spectroscopy) measures
kinetic energy change of spectral emissions• Sensitivity analysis calculates the atomic percent
composition of each component element by comparing peak areas
• XPS can determine Ce4+/ Ce3+ and Ce/Y ratios based on their respective peak sizes
15

XPS Results for 20 % Y YDC film
16
• 23% Ce3+ in this sample.• V0, U0 and V’, U’ indicate
Ce3+, other peaks for Ce4+.
• Peak sizes analyzed using Pfau-Schierbaum method
Binding Energy I.D
880.32 Vo
882.21 V
884.75 V'
888.55 V"
898.2 V"'
899.2 Uo
900.81 U
903.14 U'
907.13 U"

Conclusions• Yttria doped cerium oxide films were successfully
deposited via ALD using Ce(iPrCp)3, Y(iPrCp)3 and water
• XPS analysis shows that by increasing the ALD cycle ratio (Y:Ce) the concentration of Yttrium was linearly increased in the film
• Annealed and non-annealed resistances are close and have same order of magnitude
• Higher Y concentration had little effect on measured resistance
• 3 V and 150 Hz produce most accurate resistance results• DC bias unnecessary
17

Recommendations for Future Experiments
• Produce resistance probe station capable of taking resistance measurements up to 800 °C
• Repeat calibration measurements at high temperature• Goal: Determine precise YDC doping for maximum
electrical resistance
18

Acknowledgments• I would like to gratefully acknowledge the financial support
provided by:• EEC-NSF Grant #1062943• CBET-NSF Grant #1346282
• I would like to gratefully acknowledge the material support provided by:• Advanced Materials Research Lab, University of Illinois at Chicago
for use of laboratory facilities• Air-Liquide USA for providing precursors
19

References• M. Fanciulli and G. Scarel (Eds.): Rare Earth Oxide Thin
Films, Topics Appl. Physics, 106, 15–32 (2007) © Springer-Verlag Berlin Heidelberg 2007.
• M. Coll, J. Gazquez, A. Palau, M. Varela, X. Obradors and T. Puig, Chem. Mater. 2012, 24, 3732−3737.
• W. Kim, M. Kim, W. J. Maeng, J. Gatineau,d, V. Pallem, C. Dussarrat, A. Noori, D. Thompson, S. Chu and H. Kima, Journal of The Electrochemical Society, 158 (8) G169-G172 (2011).
• Z. Fan, C. Chao, F. Hossein-Babaeiaand and F. B. Prinz, J. Mater. Chem., 2011, 21, 10903.
• P. Gao, Z. Wang, W. Fu, Z. Liao, K. Liu, W. Wang,• X. Bai and E. Wang, Micron, 2010, 41, 301-305.
20
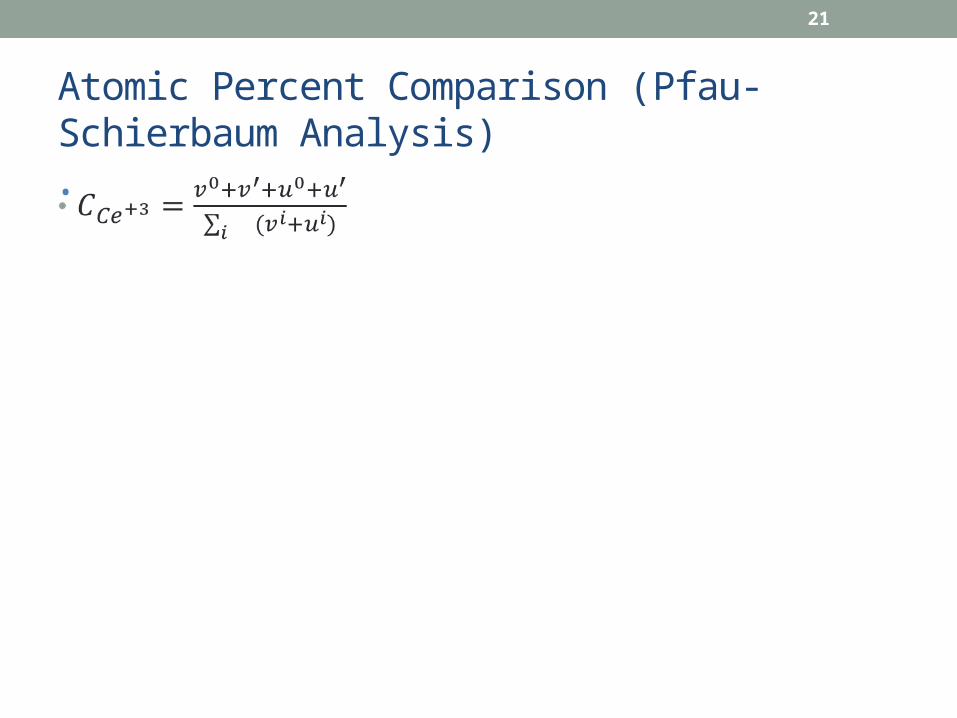
Atomic Percent Comparison (Pfau-Schierbaum Analysis)
21
•

Atomic Percent Comparison•
22