rush university medical center obligated group for … financial report and... · rush university...
TRANSCRIPT

TABLE OF CONTENTS (continued)
Page
This - i -
4832-1469-4177.4 4832-1469-4177.8
Rush University Medical Center Obligated Group Annual Report For Fiscal Year Ended June 30, 2016 Audited

TABLE OF CONTENTS
Page
- i -
CAUTIONARY STATEMENTS REGARDING FORWARD-LOOKING INFORMATION IN THIS ANNUAL REPORT .. 3
PURPOSE OF THE ANNUAL REPORT ................................................................................................................................... 3
OFFICER’S CERTIFICATE ....................................................................................................................................................... 4
OBLIGATED PERSONS ............................................................................................................................................................ 5 Selected Financial Results and Other Information ........................................................................................................ 6 Financial Ratios ............................................................................................................................................................. 7
OVERVIEW OF THE OBLIGATED GROUP ........................................................................................................................... 8 Obligated Group ............................................................................................................................................................ 8 Presentation of Financial Information ......................................................................................................................... 10
RUSH UNIVERSITY MEDICAL CENTER ............................................................................................................................ 11 Mission ........................................................................................................................................................................ 11 Changes in Management ............................................................................................................................................. 11 Service Area and Competition ..................................................................................................................................... 11 Rush University ........................................................................................................................................................... 11 Physician Alignment ................................................................................................................................................... 13
RUSH-COPLEY MEDICAL CENTER .................................................................................................................................... 14 Service Area and Competition ..................................................................................................................................... 15 Physician Alignment ................................................................................................................................................... 15 Awards ........................................................................................................................................................................ 15
RUSH OAK PARK HOSPITAL ............................................................................................................................................... 17 Service Area and Competition ..................................................................................................................................... 17 Physician Alignment ................................................................................................................................................... 17 Awards ........................................................................................................................................................................ 17
SUMMARY OF HISTORICAL UTILIZATION AND FINANCIAL INFORMATION ......................................................... 19 Historical Utilization of Services ................................................................................................................................ 19 Summary of Revenues and Expenses .......................................................................................................................... 19 Operating Results ........................................................................................................................................................ 20 Liquidity ...................................................................................................................................................................... 20 Capitalization ............................................................................................................................................................... 21 Sources of Revenue ..................................................................................................................................................... 21 Debt Service Coverage ................................................................................................................................................ 21 Recent Financial Performance – Fiscal Years Ended June 30, 2016 and 2015 .......................................................... 22 Capital Expenditures ................................................................................................................................................... 25
MISCELLANEOUS .................................................................................................................................................................. 25 Ratings ......................................................................................................................................................................... 25 Community Benefits .................................................................................................................................................... 26 Pension Plans ............................................................................................................................................................... 26 Contingencies .............................................................................................................................................................. 27 Investment Policies ...................................................................................................................................................... 27 Fair Value Measurements ............................................................................................................................................ 28 Endowment Investment and Spending Policies ........................................................................................................... 32 Interest Rate Swap Agreements ................................................................................................................................... 32 Affiliations, Merger, Acquisition and Divestiture ....................................................................................................... 33 Information Technology .............................................................................................................................................. 33 Campus Transformation .............................................................................................................................................. 34 Recent Transactions..................................................................................................................................................... 34 Subsequent Events ....................................................................................................................................................... 34
CONSOLIDATED FINANCIAL STATEMENTS ................................................................................................................... 35
TABLE OF CONTENTS (continued)
Page
- ii -
Consolidated Balance Sheets ....................................................................................................................................... 36 Consolidated Statements of Operations and Changes in Net Assets ........................................................................... 37 Consolidated Statements of Operations and Changes in Net Assets ........................................................................... 38 Consolidated Statements of Cash Flows...................................................................................................................... 39
APPENDICES ........................................................................................................................................................................... 40 Consolidating Balance Sheet Information ................................................................................................................... 41 Consolidating Statement of Operations and Changes in Net Assets Information ....................................................... 42 Consolidating Statement of Operations and Changes in Net Assets Information ....................................................... 43 Financial Results Compared to Budget for the Fiscal Year Ended June 30, 2016 ...................................................... 44 Covenant Compliance Certificate ................................................................................................................................ 45 Board Leadership ........................................................................................................................................................ 47
This document is dated as of October 21, 2016. 3
CAUTIONARY STATEMENTS REGARDING FORWARD-LOOKING INFORMATION IN THIS ANNUAL REPORT
Certain statements included or incorporated by reference in this Annual Report constitute “forward-looking
statements.” Such statements are generally identifiable by the terminology used such as “plan,” “expect,” “estimate,” “budget,” or other similar words.
THE ACHIEVEMENT OF CERTAIN RESULTS OR OTHER EXPECTATIONS CONTAINED IN SUCH FORWARD-LOOKING STATEMENTS INVOLVES KNOWN AND UNKNOWN RISKS, UNCERTAINTIES AND OTHER FACTORS WHICH MAY CAUSE ACTUAL RESULTS, PERFORMANCE OR ACHIEVEMENTS DESCRIBED TO BE MATERIALLY DIFFERENT FROM ANY FUTURE RESULTS, PERFORMANCE OR ACHIEVEMENTS EXPRESSED OR IMPLIED BY SUCH FORWARD-LOOKING STATEMENTS. THE OBLIGATED GROUP DOES NOT PLAN TO ISSUE ANY UPDATES OR REVISIONS TO THOSE FORWARD-LOOKING STATEMENTS IF OR WHEN THE EXPECTATIONS, OR EVENTS, CONDITIONS OR CIRCUMSTANCES ON WHICH SUCH STATEMENTS ARE BASED OCCUR.
PURPOSE OF THE ANNUAL REPORT
The purpose of this Annual Report is to present the Rush University Medical Center Obligated Group’s (the Obligated Group consisting of Rush University Medical Center, Rush Oak Park Hospital, Copley Memorial Hospital, Rush-Copley Medical Center, Rush-Copley Foundation, Copley Ventures and Rush-Copley Medical Group) for fiscal years ended June 30, 2016 and 2015, and management’s discussion and analysis of the Obligated Group’s financial condition and results of operations for the fiscal year ended June 30, 2016. This report also provides insights on the quality of earnings reported, significant balance sheet assumptions used and any changes in assumptions used, risks to the balance sheet and statement of operations, and the impact of anticipated future events. This report includes the consolidated activities and results of Rush University Medical Center and Rush-Copley Medical Center, including all subsidiaries, collectively “Rush” or the “Obligated Group.” Rush University Medical Center also controls and operates Rush Oak Park Hospital. The primary activities and results of the Obligated Group include the hospitals, Rush University education and research activities, Rush University Medical Group (RUMG), RUMC’s faculty practice plans, and other physician practice activity as well as other operating activities.
This document is dated as of October 21, 2016. 4
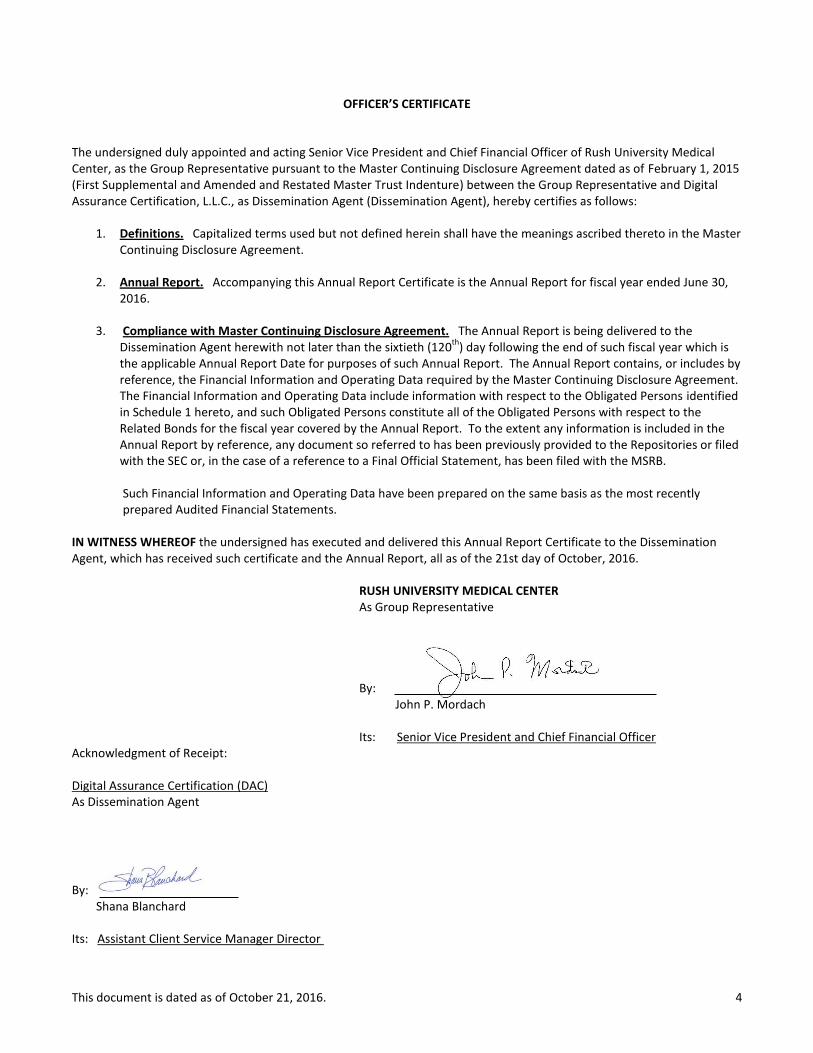
OFFICER’S CERTIFICATE The undersigned duly appointed and acting Senior Vice President and Chief Financial Officer of Rush University Medical Center, as the Group Representative pursuant to the Master Continuing Disclosure Agreement dated as of February 1, 2015 (First Supplemental and Amended and Restated Master Trust Indenture) between the Group Representative and Digital Assurance Certification, L.L.C., as Dissemination Agent (Dissemination Agent), hereby certifies as follows:
1. Definitions. Capitalized terms used but not defined herein shall have the meanings ascribed thereto in the Master Continuing Disclosure Agreement.
2. Annual Report. Accompanying this Annual Report Certificate is the Annual Report for fiscal year ended June 30,
2016.
3. Compliance with Master Continuing Disclosure Agreement. The Annual Report is being delivered to the Dissemination Agent herewith not later than the sixtieth (120
th) day following the end of such fiscal year which is
the applicable Annual Report Date for purposes of such Annual Report. The Annual Report contains, or includes by reference, the Financial Information and Operating Data required by the Master Continuing Disclosure Agreement. The Financial Information and Operating Data include information with respect to the Obligated Persons identified in Schedule 1 hereto, and such Obligated Persons constitute all of the Obligated Persons with respect to the Related Bonds for the fiscal year covered by the Annual Report. To the extent any information is included in the Annual Report by reference, any document so referred to has been previously provided to the Repositories or filed with the SEC or, in the case of a reference to a Final Official Statement, has been filed with the MSRB.
Such Financial Information and Operating Data have been prepared on the same basis as the most recently prepared Audited Financial Statements.
IN WITNESS WHEREOF the undersigned has executed and delivered this Annual Report Certificate to the Dissemination Agent, which has received such certificate and the Annual Report, all as of the 21st day of October, 2016. RUSH UNIVERSITY MEDICAL CENTER
As Group Representative
By:
John P. Mordach
Its: Senior Vice President and Chief Financial Officer Acknowledgment of Receipt: Digital Assurance Certification (DAC) As Dissemination Agent
By: Shana Blanchard Its: Assistant Client Service Manager Director
This document is dated as of October 21, 2016. 5
OBLIGATED PERSONS
1. Rush University Medical Center (the Medical Center)
2. Rush Oak Park Hospital (ROPH)
3. Copley Memorial Hospital, Inc. (Copley or CMH)
4. Rush-Copley Medical Center, Inc. (Rush-Copley or RCMC)
5. Rush-Copley Foundation (Copley Foundation) 6. Copley Ventures, Inc. (Copley Ventures)
7. Rush-Copley Medical Group NFP (the Medical Group)
This document is dated as of October 21, 2016. 6
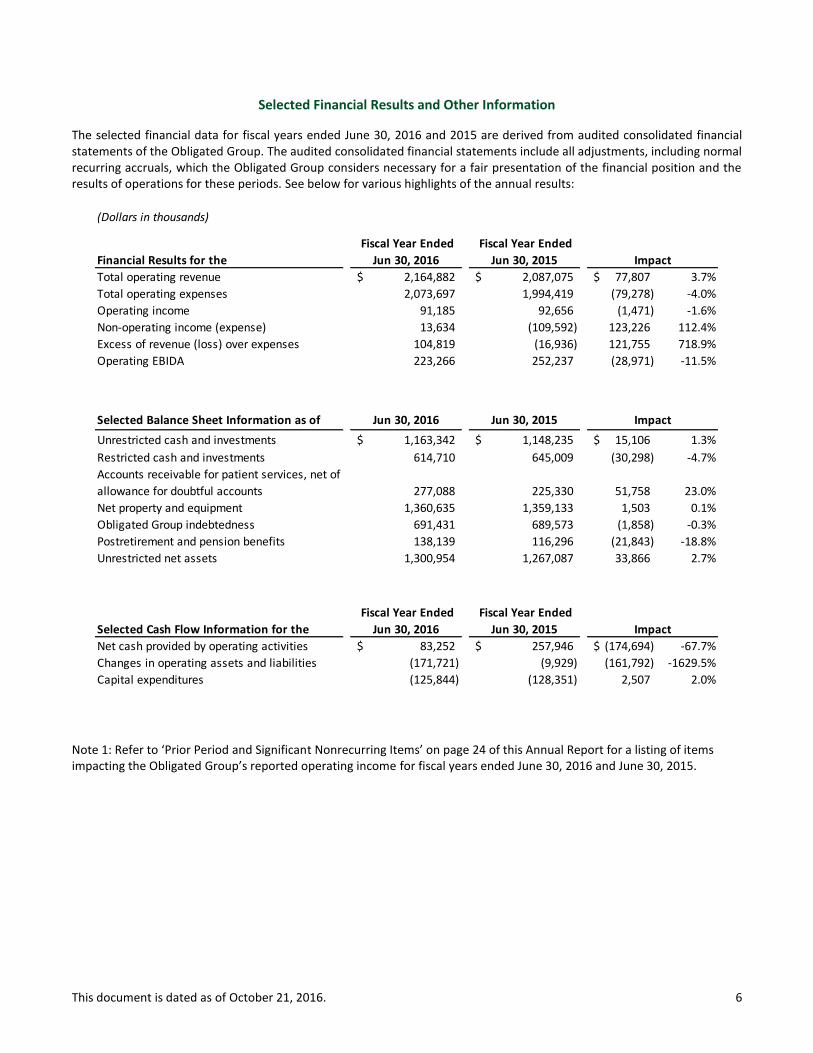
Selected Financial Results and Other Information
The selected financial data for fiscal years ended June 30, 2016 and 2015 are derived from audited consolidated financial statements of the Obligated Group. The audited consolidated financial statements include all adjustments, including normal recurring accruals, which the Obligated Group considers necessary for a fair presentation of the financial position and the results of operations for these periods. See below for various highlights of the annual results:
Note 1: Refer to ‘Prior Period and Significant Nonrecurring Items’ on page 24 of this Annual Report for a listing of items impacting the Obligated Group’s reported operating income for fiscal years ended June 30, 2016 and June 30, 2015.
(Dollars in thousands)
Financial Results for the
Fiscal Year Ended
Jun 30, 2016
Fiscal Year Ended
Jun 30, 2015
Total operating revenue 2,164,882$ 2,087,075$ 77,807$ 3.7%
Total operating expenses 2,073,697 1,994,419 (79,278) -4.0%
Operating income 91,185 92,656 (1,471) -1.6%
Non-operating income (expense) 13,634 (109,592) 123,226 112.4%
Excess of revenue (loss) over expenses 104,819 (16,936) 121,755 718.9%
Operating EBIDA 223,266 252,237 (28,971) -11.5%
Selected Balance Sheet Information as of Jun 30, 2016 Jun 30, 2015
Unrestricted cash and investments 1,163,342$ 1,148,235$ 15,106$ 1.3%
Restricted cash and investments 614,710 645,009 (30,298) -4.7%
Accounts receivable for patient services, net of
allowance for doubtful accounts 277,088 225,330 51,758 23.0%
Net property and equipment 1,360,635 1,359,133 1,503 0.1%
Obligated Group indebtedness 691,431 689,573 (1,858) -0.3%
Postretirement and pension benefits 138,139 116,296 (21,843) -18.8%
Unrestricted net assets 1,300,954 1,267,087 33,866 2.7%
Selected Cash Flow Information for the
Fiscal Year Ended
Jun 30, 2016
Fiscal Year Ended
Jun 30, 2015
Net cash provided by operating activities 83,252$ 257,946$ (174,694)$ -67.7%
Changes in operating assets and liabilities (171,721) (9,929) (161,792) -1629.5%
Capital expenditures (125,844) (128,351) 2,507 2.0%
Impact
Impact
Impact
This document is dated as of October 21, 2016. 7
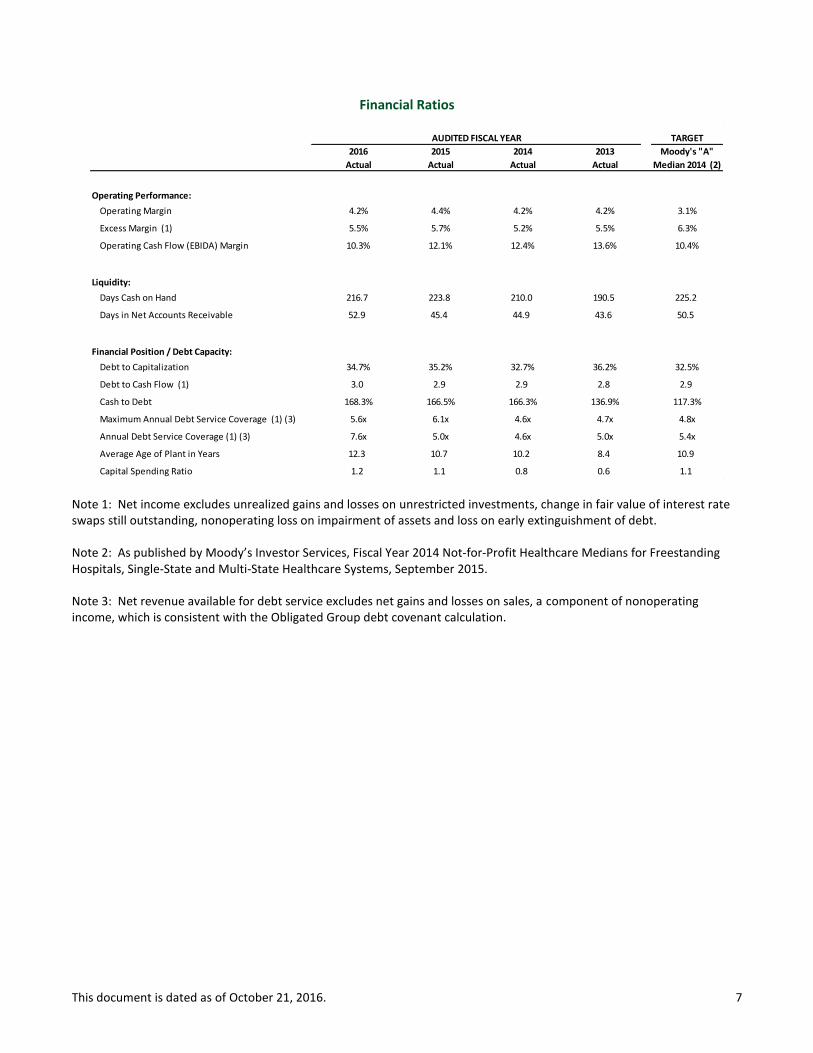
Financial Ratios
Note 1: Net income excludes unrealized gains and losses on unrestricted investments, change in fair value of interest rate swaps still outstanding, nonoperating loss on impairment of assets and loss on early extinguishment of debt.
Note 2: As published by Moody’s Investor Services, Fiscal Year 2014 Not-for-Profit Healthcare Medians for Freestanding Hospitals, Single-State and Multi-State Healthcare Systems, September 2015.
Note 3: Net revenue available for debt service excludes net gains and losses on sales, a component of nonoperating income, which is consistent with the Obligated Group debt covenant calculation.
TARGET
2016 2015 2014 2013 Moody's "A"
Actual Actual Actual Actual Median 2014 (2)
Operating Performance:
Operating Margin 4.2% 4.4% 4.2% 4.2% 3.1%
Excess Margin (1) 5.5% 5.7% 5.2% 5.5% 6.3%
Operating Cash Flow (EBIDA) Margin 10.3% 12.1% 12.4% 13.6% 10.4%
Liquidity:
Days Cash on Hand 216.7 223.8 210.0 190.5 225.2
Days in Net Accounts Receivable 52.9 45.4 44.9 43.6 50.5
Financial Position / Debt Capacity:
Debt to Capitalization 34.7% 35.2% 32.7% 36.2% 32.5%
Debt to Cash Flow (1) 3.0 2.9 2.9 2.8 2.9
Cash to Debt 168.3% 166.5% 166.3% 136.9% 117.3%
Maximum Annual Debt Service Coverage (1) (3) 5.6x 6.1x 4.6x 4.7x 4.8x
Annual Debt Service Coverage (1) (3) 7.6x 5.0x 4.6x 5.0x 5.4x
Average Age of Plant in Years 12.3 10.7 10.2 8.4 10.9
Capital Spending Ratio 1.2 1.1 0.8 0.6 1.1
AUDITED FISCAL YEAR
This document is dated as of October 21, 2016. 8
OVERVIEW OF THE OBLIGATED GROUP
This annual report contains information concerning the Rush University Medical Center Obligated Group, which is part of a multi-hospital system (the “System”) with operations that are linked by the common mission of patient care, education and research.
The largest member of the System is Rush University Medical Center (“RUMC” or the “Medical Center”). RUMC sees unique advantages in having a single management team and governing board that oversees inpatient and outpatient clinical operations, bench and clinical trials research, employed and affiliated physician oversight and university affairs. This integrated structure enhances the ability of RUMC to align these various functions in a patient-centered care model. The System is comprised of RUMC and its various subsidiaries and joint ventures; Rush Health, which is a physician hospital organization that includes each of the affiliated medical centers and hospitals along with many of their respective physicians; three community hospitals, including Rush Oak Park Hospital (“ROPH”), Rush-Copley Medical Center (“RCMC”) and Riverside Medical Center; and numerous physician relationships.
Obligated Group
RUMC and certain of its affiliates are Members of an Obligated Group created under the Master Indenture. The Members of the Obligated Group are:
Rush University Medical Center – RUMC owns and operates an academic medical center located in Chicago, Illinois. Major operations of RUMC include Rush University Hospital (“RUH”), Rush University and Rush University Medical Group (“RUMG”). The hospital operations of RUMC are licensed by the State of Illinois to operate 713 beds, of which 679 are currently staffed and include the Johnson R. Bowman Health Center for the Elderly, a rehabilitation and psychiatric facility, and Rush Children’s Hospital. According to COMPdata, RUMC is the third largest hospital provider in the eight county Chicago metropolitan area as measured by market share. RUMC is an Illinois not for profit corporation, which is exempt from federal income taxes under Section 501(c)(3) of the Internal Revenue Code of 1986, as amended (the “Code”).
Rush Oak Park Hospital – ROPH owns and operates a 296 licensed bed acute care, rehabilitation and skilled nursing hospital, of which 128 beds are currently staffed, located approximately eight miles west of RUMC in Oak Park, Illinois. RUMC is the sole corporate member of ROPH. Effective June 30, 2014, ROPH became a Member of the Obligated Group. ROPH is an Illinois not for profit corporation, which is exempt from federal income taxes under Section 501(c)(3) of the Code.
Rush-Copley Medical Center, Inc. – RCMC serves as the parent holding company for the Copley Members (as defined herein). RCMC supports the other Copley Members by providing administrative, management and related services. RCMC is an Illinois not for profit corporation, which is exempt from federal income taxes under Section 501(c)(3) of the Code.
Copley Memorial Hospital, Inc. (“Copley”) – Copley owns and operates an acute care hospital located approximately 35 miles west of RUMC in Aurora, Illinois. Copley is licensed by the State of Illinois to operate 210 beds, all of which are currently staffed. Copley is an Illinois not for profit corporation, which is exempt from federal income taxes under Section 501(c)(3) of the Code.
Rush-Copley Foundation (“Copley Foundation”) – Copley Foundation solicits contributions to support health care activities in RCMC’s service area, including, but not limited to, those of RCMC. Copley Foundation is an Illinois not for profit corporation, which is exempt from federal income taxes under Section 501(c)(3) of the Code.
Copley Ventures, Inc. (“Copley Ventures”) – Copley Ventures holds title to property for rental purposes. Copley Ventures is an Illinois not for profit corporation, which is exempt from federal income taxes under Section 501(c)(3) of the Code.
Rush-Copley Medical Group NFP (the “Medical Group”) – The Medical Group owns, operates, controls and otherwise coordinates the activities of physician practice health and medical services and provides certain physician billing and administrative services. The Medical Group is an Illinois not for profit taxable corporation.
This document is dated as of October 21, 2016. 9
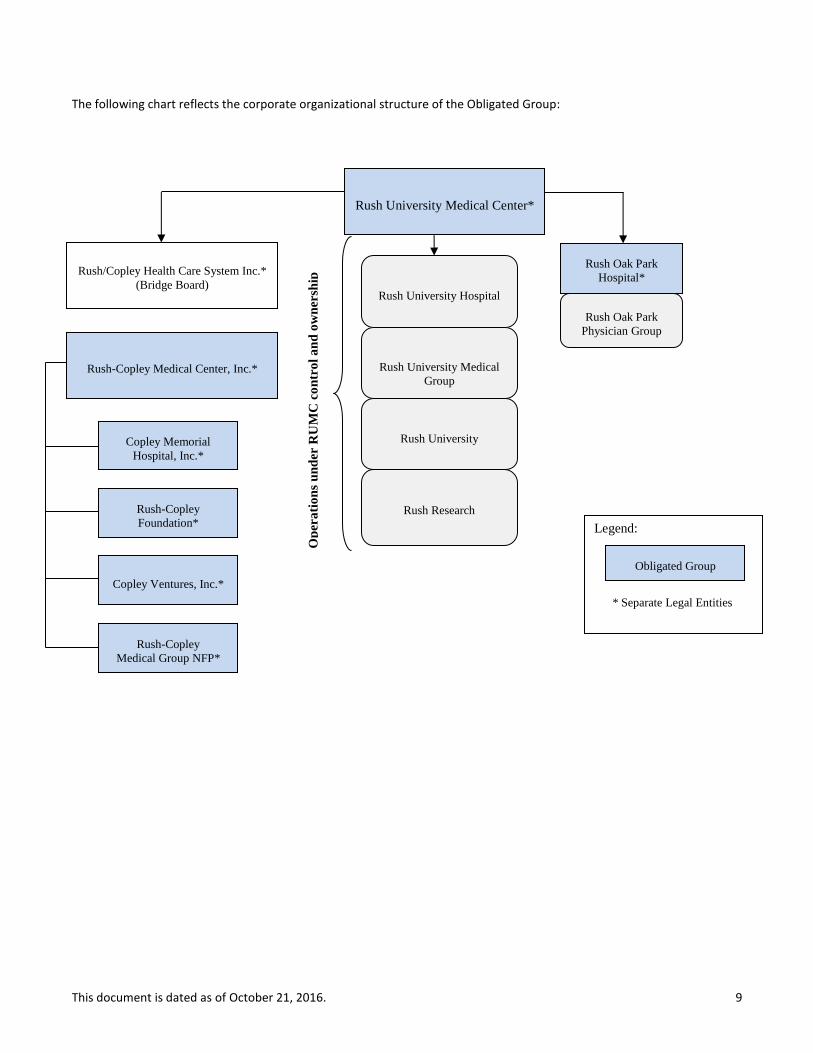
The following chart reflects the corporate organizational structure of the Obligated Group:
Rush Oak Park
Hospital*
Rush Oak Park
Physician Group
Rush/Copley Health Care System Inc.*
(Bridge Board)
Rush-Copley Medical Center, Inc.*
Copley Memorial
Hospital, Inc.*
Rush-Copley
Foundation*
Copley Ventures, Inc.*
Rush-Copley
Medical Group NFP*
Legend:
* Separate Legal Entities
Obligated Group
Rush University Hospital
Rush University Medical
Group
Rush University
Rush Research
Op
era
tio
ns
un
der
RU
MC
co
ntr
ol
an
d o
wn
ersh
ip
Rush University Medical Center*

This document is dated as of October 21, 2016. 10
Presentation of Financial Information
Although RUMC and the other corporations referenced above are currently the only Obligated Group Members under the Master Indenture, RUMC controls, directly or indirectly, a number of other non-member entities whose revenues and expenses and results of operations are included in the Obligated Group financial statements. Such non-member joint ventures and investment entities are accounted for in the Obligated Group audited consolidated financial statements and unaudited interim consolidated financial information using the equity method of accounting or are consolidated depending upon the control exercised by the applicable Obligated Group Member. Further, the information describing the financial condition of the Obligated Group contained in this annual report includes information with respect to these entities which are not Obligated Group Members. For fiscal year ended June 30, 2016, these non-member entities constituted approximately 1.2% of total revenue of the Obligated Group.
This document is dated as of October 21, 2016. 11
RUSH UNIVERSITY MEDICAL CENTER
Mission
The mission of RUMC is to provide the best health care for the individuals and diverse communities it serves through the integration of outstanding patient care, education, research and community partnerships.
Changes in Management
On October 26, 2015, K. Ranga Rama Krishnan, MD was appointed as dean of the Medical College of Rush University. Dr. Krishnan most recently served for seven years as the dean at the Duke-NUS Graduate Medical School in Singapore and previously as the school’s executive vice dean. Prior to and during his tenure in Singapore, Krishnan was professor in the Department of Psychiatry and Behavioral Sciences at Duke University Medical Center in North Carolina. He also served as chairman of psychiatry at Duke from 1998 to 2009. Dr. Krishnan earned his medical degree in 1978 and completed a rotating internship at Government General Hospital and Madras Medical College in Madras, India. Following this, he served as Senior House Officer at Queen Elizabeth Hospital, University of West Indies, Barbados.
Peter Butler retired from his role as president at the end of fiscal year 2016. Mr. Butler will continue to serve as professor and chairperson of the Department of Health Systems Management in the College of Health Sciences.
Michael Dandorph was promoted to president and chief operating officer, effective July 1, 2016. Mr. Dandorph is currently the executive vice president and chief operating officer for Rush.
Effective April 29, 2016, Anne Murphy is no longer serving as Senior Vice President of Legal Affairs and General Counsel. Carl Bergetz, Vice President of Legal Affairs, will be serving as Acting General Counsel.
Service Area and Competition
RUMC considers its service area to be the eight counties surrounding and including the City of Chicago. The eight county market area encompasses Cook, DuPage, Kane, Kankakee, Kendall, McHenry, Lake and Will counties. RUMC competes with four other academic medical centers in the Chicago metropolitan area as well as several large suburban hospitals with specialty and local strength. RUMC was the third largest hospital provider in the 8-county Chicago metropolitan area with a market share of 3.2% during the nine months ended March 31, 2016 and fiscal year ended June 30, 2015. In a highly fragmented market, RUMC focuses on building market share in its strategic programs: Neurosciences, Bone and Joint, Cancer Care, High Risk Infant and Mother, Transplant, and Heart and Vascular. RUMC was the market leader in Neurosciences and Bone & Joint, and third in Cancer Care and Transplant during the nine months ended March 31, 2016.
Rush University
Rush University currently offers more than 30 unique degree or certificate options in medicine, nursing, allied health and biomedical research. Rush University is known for its practitioner-teacher model, translational research, nurturing academic environment and focus on community and global health.
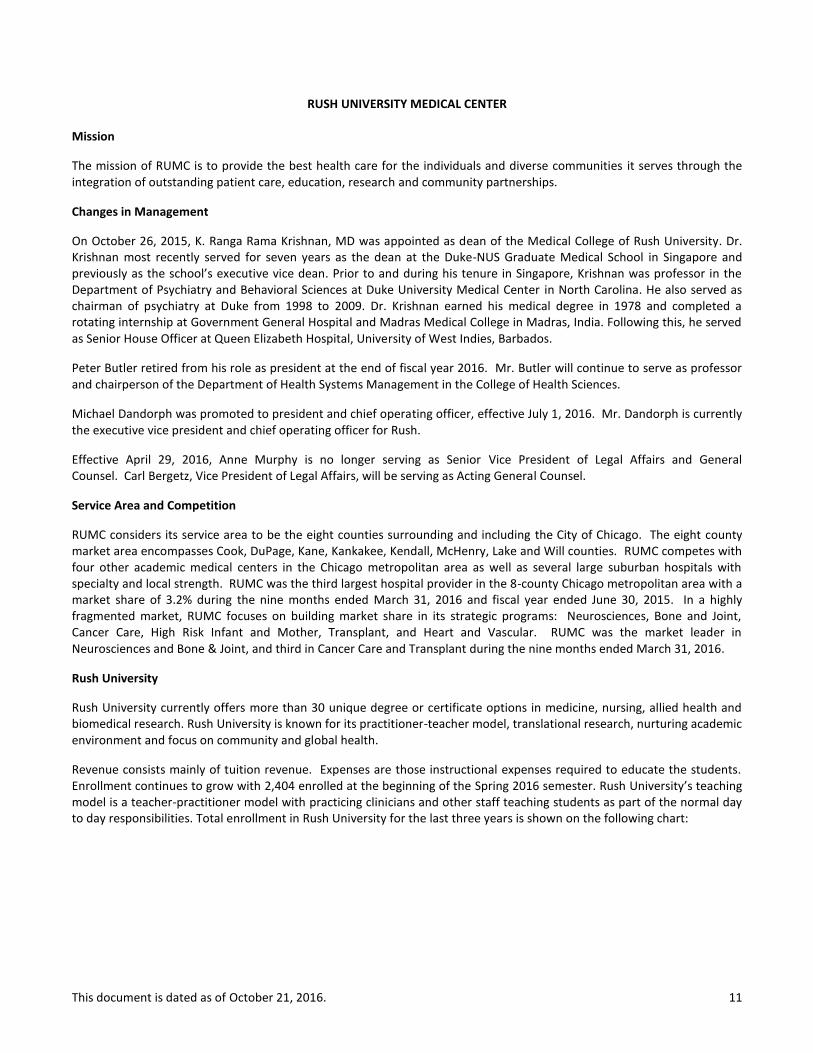
Revenue consists mainly of tuition revenue. Expenses are those instructional expenses required to educate the students. Enrollment continues to grow with 2,404 enrolled at the beginning of the Spring 2016 semester. Rush University’s teaching model is a teacher-practitioner model with practicing clinicians and other staff teaching students as part of the normal day to day responsibilities. Total enrollment in Rush University for the last three years is shown on the following chart:
This document is dated as of October 21, 2016. 12
Enrollment in Rush University
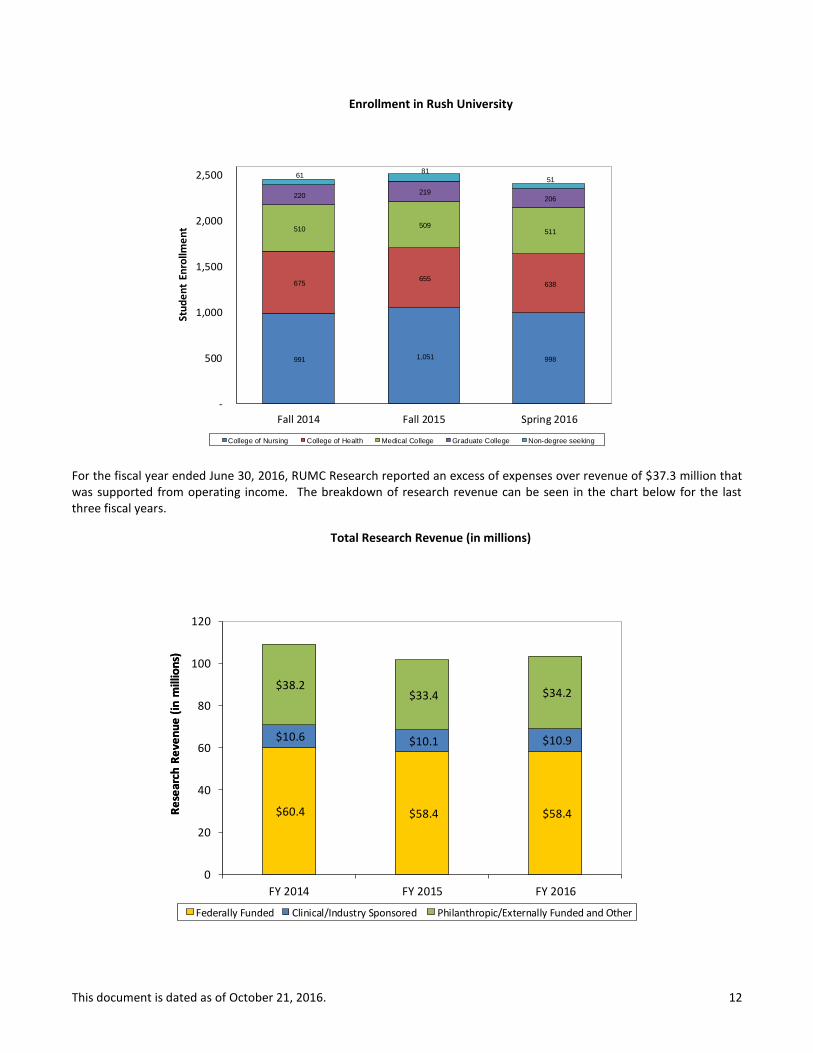
For the fiscal year ended June 30, 2016, RUMC Research reported an excess of expenses over revenue of $37.3 million that was supported from operating income. The breakdown of research revenue can be seen in the chart below for the last three fiscal years.
Total Research Revenue (in millions)
991 1,051 998
675 655
638
510 509
511
220 219
206
61 81
51
-
500
1,000
1,500
2,000
2,500
Fall 2014 Fall 2015 Spring 2016
College of Nursing College of Health Medical College Graduate College Non-degree seeking
Stu
de
nt
Enro
llme
nt
$60.4 $58.4 $58.4
$10.6 $10.1 $10.9
$38.2 $33.4 $34.2
0
20
40
60
80
100
120
FY 2014 FY 2015 FY 2016
Federally Funded Clinical/Industry Sponsored Philanthropic/Externally Funded and Other
Re
sear
ch R
eve
nu
e (
in m
illio
ns)
Re
sear
ch R
eve
nu
e (
in m
illio
ns)
This document is dated as of October 21, 2016. 13
Physician Alignment
RUMC builds relationships with employed and independent physicians through various means. RUMC employs approximately one-half of its medical staff, including those in its highly-ranked neurosurgery practice.
RUMC has also implemented various joint ventures with physicians to provide core services including the following:
Rush Surgicenter – Outpatient surgery operations at RUMC.
Circle Imaging – Outpatient imaging operations at RUMC.
Rush Radiosurgery – Outpatient stereotactic radiosurgery services at RUMC. In addition, RUMC has key strategic relationships with Midwest Orthopedics at Rush (“MOR”), a preeminent independent physician practice that is anchored in a building on the RUMC campus that was opened in 2009 by RUMC and MOR physicians. MOR provides a broad spectrum of orthopedics and sports medicine services, and utilizes the facilities at RUMC, the on-campus Rush Surgicenter, and ROPH. In 2011, RUMC entered into a broad umbrella clinical affiliation agreement, for an initial term of 10 years, with DuPage Medical Group (“DMG”), which is a multi-specialty and primary care group with over 425 physicians based in the western suburbs of Chicago. To date, the parties have implemented an affiliated outpatient cancer treatment program with infusion therapy at a newly-developed DMG building in Lisle, Illinois.
Awards RUMC provides care through a multidisciplinary approach that brings together a team of experts including physicians, scientists, nurses and other specialists to diagnose and treat patients in an integrated manner. This unique combination of teaching, research and patient care has earned RUMC national recognition for a number of its programs. Below is a list of certain awards which RUMC has received over the last two years.
Best Quality:
Ranked second in UHC 2015 Quality Leadership Awards, including orthopedics and neurosurgery, in an annual study of 101 academic medical centers. RUMC was the only medical center in Illinois listed in the top 10.
Chicago Tribune For the fourth consecutive time, RUMC has received Magnet designation, the highest national recognition given for nursing excellence in 2016. RUMC was the first hospital in Illinois treating both children and adults to achieve Magnet status. Named as 2015 recipient of the Access Living “Lead On!” Award for pioneering dedication to making healthcare accessible to all. In the spring 2016 survey, RUMC again received a top grade “A” for patient safety from the Leapfrog Group. RUMC has been named one of the 2016 “Most Wired” hospitals in the nation by Hospitals & Health Networks.
ANCC Magnet Status
Access Living
Accessibility
Leap Frog Patient Safety
H&H Networks Most Wired
UHC Quality
Leadership Awards
This document is dated as of October 21, 2016. 14
The top 100 most social media friendly hospitals for 2015 were named by NurseJournal.org and Rush University Medical Center ranked 6th.
In the 2015 rankings, for the third time, Rush University Medical Center has been ranked among the country's top 100 hospitals – and 15 major teaching hospitals – by Truven Health Analytics. The hospitals included in the list were chosen out of the more than 3,000 hospitals that Truven analyzed.
In July 2016, RUMC received four stars in the CMS Overall Hospital Quality Star Rating.
Best Programs:
Named among the best hospitals in America in nine adult specialties for 2016-2017 by U.S. News & World Report. In the 2017 edition of U.S. News & World Report’s “America’s Best Graduate Schools” survey released in March 2016, eight programs in the Rush University College of Nursing and two programs in the Rush University College of Health Sciences ranked among the top 10 in the country, while the College of Nursing is ranked fifth in the Doctor of Nursing Practice category and 16th in the Master’s category overall in the nation. The College of Nursing is also ranked 11th among 150 schools listed in the graduate nursing programs category in U.S. News & World Report’s 2016 “Best Online Programs” list.
Best People:
Named as a leader in LGBT Healthcare Equality in the 2016 Healthcare Equality Index report. 72 Rush physicians, advanced practice nurses and physician assistants rank among the top 10 percent in the nation for having the highest degree of rapport with their patients based on feedback from the Hospital Consumer Assessment of Healthcare Providers and Systems (HCAHPS) survey or the Press Ganey patient survey.
RUSH-COPLEY MEDICAL CENTER
Nurse Journal.org Social Media
US News Best
Hospitals
US News Best
Graduate Schools
Healthcare Quality Index
Equality
Truven Health
Analytics Quality and
Cost
HCAHPS Highest Patient Rapport
CMS Overall Hospital
Quality Star Rating
This document is dated as of October 21, 2016. 15
Service Area and Competition
CMH was the market leader in its 15-Zip code primary service area with a market share of 38.9% and 39.5% during the nine months ended March 31, 2016 and fiscal year ended June 30, 2015, respectively (primary service area includes the cities of Aurora, Eola, Oswego, Montgomery, Yorkville, Plano, Sandwich, Bristol, Newark, Somonauk and Plainfield). CMH is the market leader in its primary service area in the following strategic programs: Cancer Care, Neurosciences, Heart and Vascular, Women’s Health, and Emergency Services. CMH also ranked sixth in the state of Illinois for deliveries during the nine months ended March 31, 2016. Physician Alignment
RCMC also seeks to build relationships with employed and independent physicians through various means. A significant strategy for RCMC is the growth of its employed medical groups including the Medical Group and Fox Valley Cardiovascular Consultants. Additionally, RCMC has joint ventures with physicians to provide core services including the following:
Yorkville Physical Therapy and Sports Medicine – Outpatient physical therapy.
Riverwest Radiation Therapy Center – Outpatient radiation therapy treatments. Awards
Below is a list of certain awards which RCMC has received over the last two years:
Best Quality:
In the spring 2016 survey, RCMC received a top grade “A” for patient safety from the Leapfrog Group for overall performance in keeping patients safe from preventable medical and medication errors, infections and injuries. The medical center is the only Fox Valley area hospital to have earned “Straight A’s” since the scores were first released in 2012.
Currently ranked in the 97
th percentile for patient satisfaction in Press Ganey’s peer group of hospitals
between 150-299 beds representing 95 facilities and 12,000 physicians nationwide.
Awarded the Gold Seal of Approval by The Joint Commission for Spine Surgery, Hip and Knee Replacement, and Heart Failure.
Received the Silver Beacon Award for Excellence on the Intensive Care Unit by the American Association of Critical-Care Nurses (AACN) in 2015.
Best Programs:
Earned certification of its cardiac rehabilitation program by the American Association of Cardiovascular and Pulmonary Rehabilitation (AACVPR).
Leap Frog Patient Safety
Press Ganey Patient
Satisfaction
Joint Commission Gold Seal of
Approval
AACVPR Certification
AANC Silver Beacon
Award for Excellence

This document is dated as of October 21, 2016. 16
Awarded the Joint Commission's Certificate of Distinction for Inpatient Diabetes Care in 2015.
In 2015, RCMC received the American Heart Association’s Heart-Check mark for Advanced Certification in Heart Failure. In 2016, RCMC has received the Get With The Guidelines® – Heart Failure Silver-Plus Quality Achievement Award.
In 2016, RCMC received the American Heart Association/American Stroke Association’s Get With The Guidelines® Stroke Gold Plus quality achievement award. The hospital also qualified to be recognized as a recipient of the American Heart Association/American Stroke Association’s Target: Stroke Honor Roll.
RCMC’s Wound Care Center was recognized with the Center of Distinction Award for Clinical Excellence in 2015, from Healogics, the nation’s largest provider of advanced wound care services.
RCMC was designated Blue Distinction® Center+ for Maternity Care and for Knee and Hip Replacement Surgeries by Blue Cross and Blue Shield.
Best People:
The Chicago Tribune selected RCMC as one of the 2015 “Chicago’s Top Workplaces.” RCMC ranked in the top ten of the large employer category. In addition, Rush-Copley was recognized as a top workplace for “communication” with the highest survey scores related to employees feeling well informed about important decisions.
Recognized as a Platinum-Level Fit-Friendly Worksite by the American Heart Association. Currently ranked in the 98
th percentile nationwide for employer engagement by IBM/Kenexa for health
care facilities with 100 or more respondents.
Chicago Tribune
Top Workplace
AHA Fit Friendly
IBM Employer
Engagement
Joint Commission
Inpatient Diabetes
American Heart
Association Heart Failure
Healogics Center of
Distinction Award
BCBS Blue
Distinction® Center+
American Stroke
Association Stroke Gold
Plus & Stroke Honor Roll
This document is dated as of October 21, 2016. 17
RUSH OAK PARK HOSPITAL
Service Area and Competition
Local competition is strong and represented by integrated delivery system hospitals and for-profit systems. Three of the strategic programs at RUMC are currently integrated at ROPH: Cancer Care, Heart and Vascular, and Bone and Joint. RUMC is the sole corporate member of ROPH. ROPH was the market leader in its 6-Zip code primary service area with a market share of 23.8% and 22.2% during the nine months ended March 31, 2016 and fiscal year ended June 30, 2015, respectively (primary service area includes the cities of Oak Park, Forest Park, and River Forest). ROPH focuses on building market share in its strategic programs: Neurosciences, Heart and Vascular, Cancer Care, and Bone & Joint. ROPH was first in Neurosciences and Heart and Vascular, and second in Bone & Joint in its primary service area during the nine months ended March 31, 2016.
Physician Alignment
ROPH has various relationships with employed and independent physicians. Rush Oak Park Physician Group (“ROPPG”) is comprised of seven physician groups that include 30 employed physicians with locations in Oak Park, Elmwood Park and North Riverside communities with Family Practice, Pediatrics and Internal Medicine physicians as well as other specialty services
Awards
Below is a list of certain awards which ROPH has received over the last two years:
Best Quality:
In 2016, ROPH achieved Magnet designation, the highest national recognition given for nursing excellence by the American Nurses Credentialing Center.
One of the 2016 “Most Wired” hospitals for the fourth year in a row.
Awarded the Gold Seal of Approval by The Joint Commission.
Recognized as a 2014 Top Performer on Key Quality Measures in heart attack, heart failure, pneumonia, surgical care, and stroke.
Awarded Press Ganey’s 2015 Guardian of Excellence Award for reaching the 95th percentile for clinical quality performance.
H&H Networks Most Wired
Joint Commission Gold Seal of
Approval
Press Ganey
Guardian of Excellence
Award
Joint Commission Top Performer on Key Quality
Measures
ANCC Magnet Status
This document is dated as of October 21, 2016. 18
In July of 2016, ROPH received four stars in the CMS Overall Hospital Quality Star Rating.
Best Programs:
Diabetes program recognized by the American Diabetes Association as meeting the National Standards for Diabetes Self-Management Education.
Recognized by the American College of Surgeons National Surgical Quality Improvement Program (ACS NSQIP) for achieving meritorious outcomes for surgical patient care in 2014.
Best People:
One of 10 hospitals in Illinois to have earned New York University College of Nursing’s Nurses Improving Care for Healthsystem Elders designation. In 2016, for the third consecutive year, ROPH was recognized as a “Leader in LGBT Healthcare Equality” by the Human Rights Campaign Foundation.
ADA Education
HRCF Equality
NYU Improving
Care
ACS NSQIP Top Surgical
Hospital
CMS Overall Hospital
Quality Star Rating
This document is dated as of October 21, 2016. 19
SUMMARY OF HISTORICAL UTILIZATION AND FINANCIAL INFORMATION
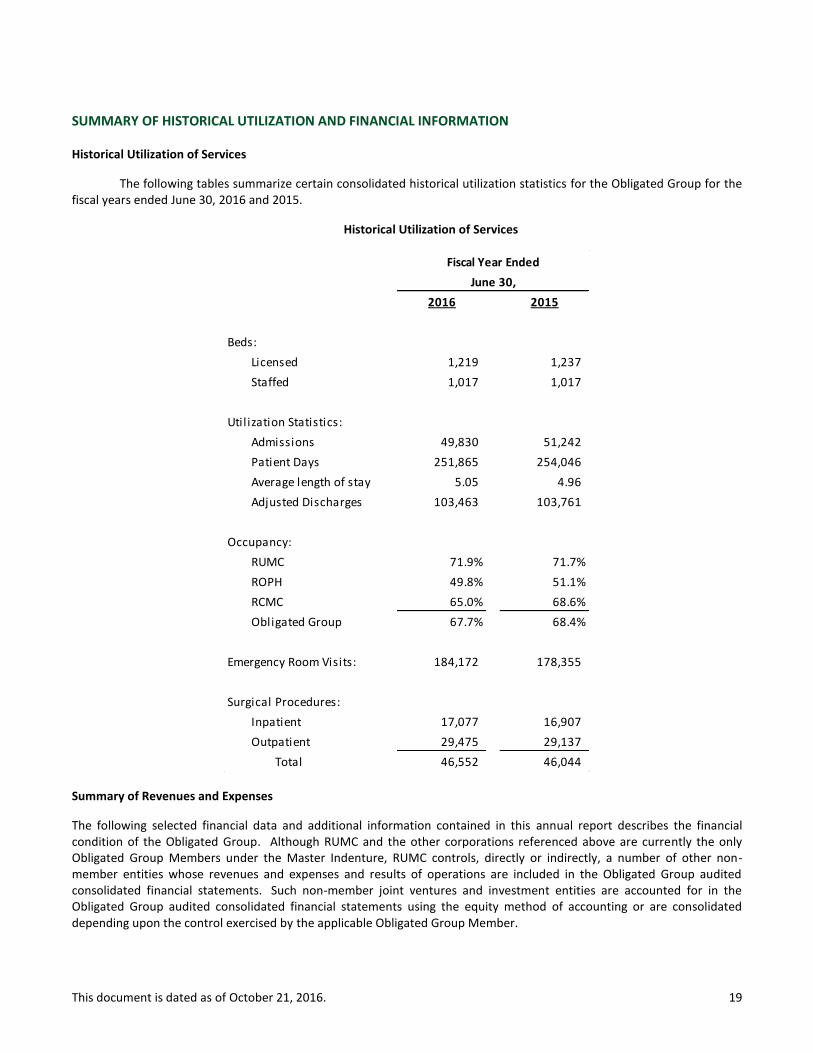
Historical Utilization of Services
The following tables summarize certain consolidated historical utilization statistics for the Obligated Group for the fiscal years ended June 30, 2016 and 2015.
Historical Utilization of Services
Summary of Revenues and Expenses
The following selected financial data and additional information contained in this annual report describes the financial condition of the Obligated Group. Although RUMC and the other corporations referenced above are currently the only Obligated Group Members under the Master Indenture, RUMC controls, directly or indirectly, a number of other non-member entities whose revenues and expenses and results of operations are included in the Obligated Group audited consolidated financial statements. Such non-member joint ventures and investment entities are accounted for in the Obligated Group audited consolidated financial statements using the equity method of accounting or are consolidated depending upon the control exercised by the applicable Obligated Group Member.
2016 2015
Beds:
Licensed 1,219 1,237
Staffed 1,017 1,017
Util ization Statistics:
Admissions 49,830 51,242
Patient Days 251,865 254,046
Average length of stay 5.05 4.96
Adjusted Discharges 103,463 103,761
Occupancy:
RUMC 71.9% 71.7%
ROPH 49.8% 51.1%
RCMC 65.0% 68.6%
Obligated Group 67.7% 68.4%
Emergency Room Visits: 184,172 178,355
Surgical Procedures:
Inpatient 17,077 16,907
Outpatient 29,475 29,137
Total 46,552 46,044
June 30,
Fiscal Year Ended
This document is dated as of October 21, 2016. 20
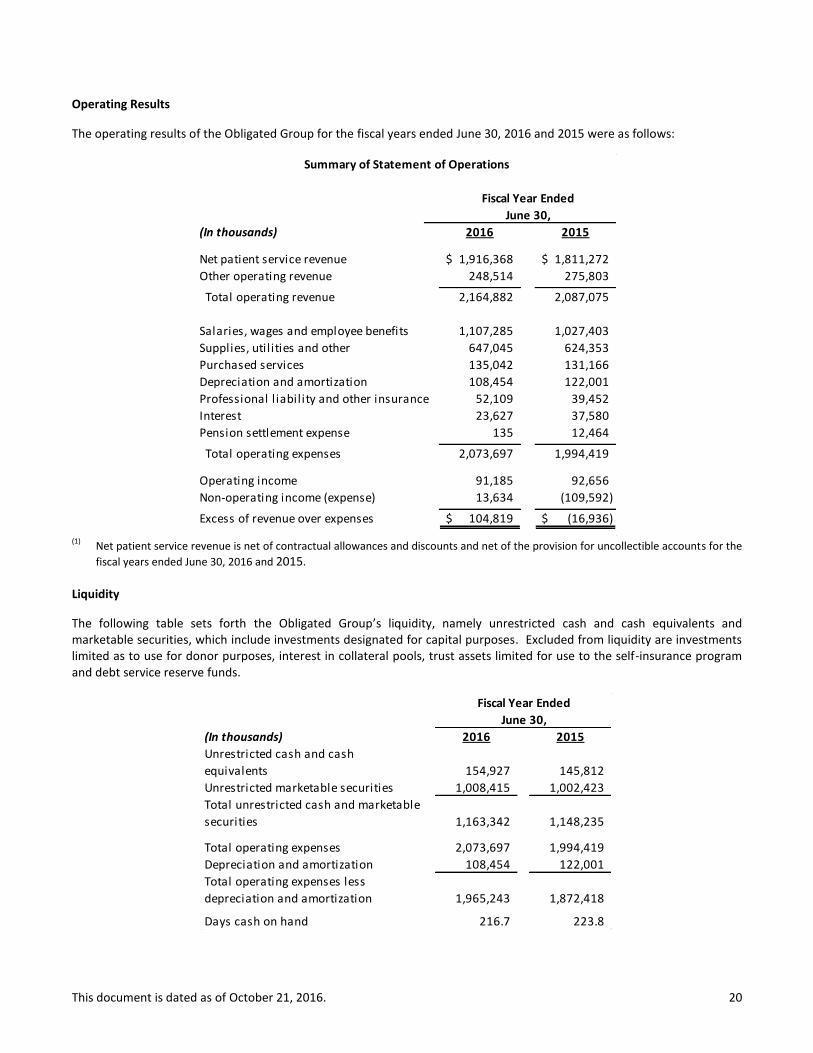
Operating Results
The operating results of the Obligated Group for the fiscal years ended June 30, 2016 and 2015 were as follows:
(1)
Net patient service revenue is net of contractual allowances and discounts and net of the provision for uncollectible accounts for the
fiscal years ended June 30, 2016 and 2015.
Liquidity
The following table sets forth the Obligated Group’s liquidity, namely unrestricted cash and cash equivalents and marketable securities, which include investments designated for capital purposes. Excluded from liquidity are investments limited as to use for donor purposes, interest in collateral pools, trust assets limited for use to the self-insurance program and debt service reserve funds.
(In thousands) 2016 2015
Net patient service revenue 1,916,368$ 1,811,272$
Other operating revenue 248,514 275,803
Total operating revenue 2,164,882 2,087,075
Salaries, wages and employee benefits 1,107,285 1,027,403
Supplies, util ities and other 647,045 624,353
Purchased services 135,042 131,166
Depreciation and amortization 108,454 122,001
Professional l iability and other insurance 52,109 39,452
Interest 23,627 37,580
Pension settlement expense 135 12,464
Total operating expenses 2,073,697 1,994,419
Operating income 91,185 92,656
Non-operating income (expense) 13,634 (109,592)
Excess of revenue over expenses 104,819$ (16,936)$
Summary of Statement of Operations
Fiscal Year Ended
June 30,
(In thousands) 2016 2015
Unrestricted cash and cash
equivalents 154,927 145,812
Unrestricted marketable securities 1,008,415 1,002,423
Total unrestricted cash and marketable
securities 1,163,342 1,148,235
Total operating expenses 2,073,697 1,994,419
Depreciation and amortization 108,454 122,001
Total operating expenses less
depreciation and amortization 1,965,243 1,872,418
Days cash on hand 216.7 223.8
June 30,
Fiscal Year Ended
This document is dated as of October 21, 2016. 21
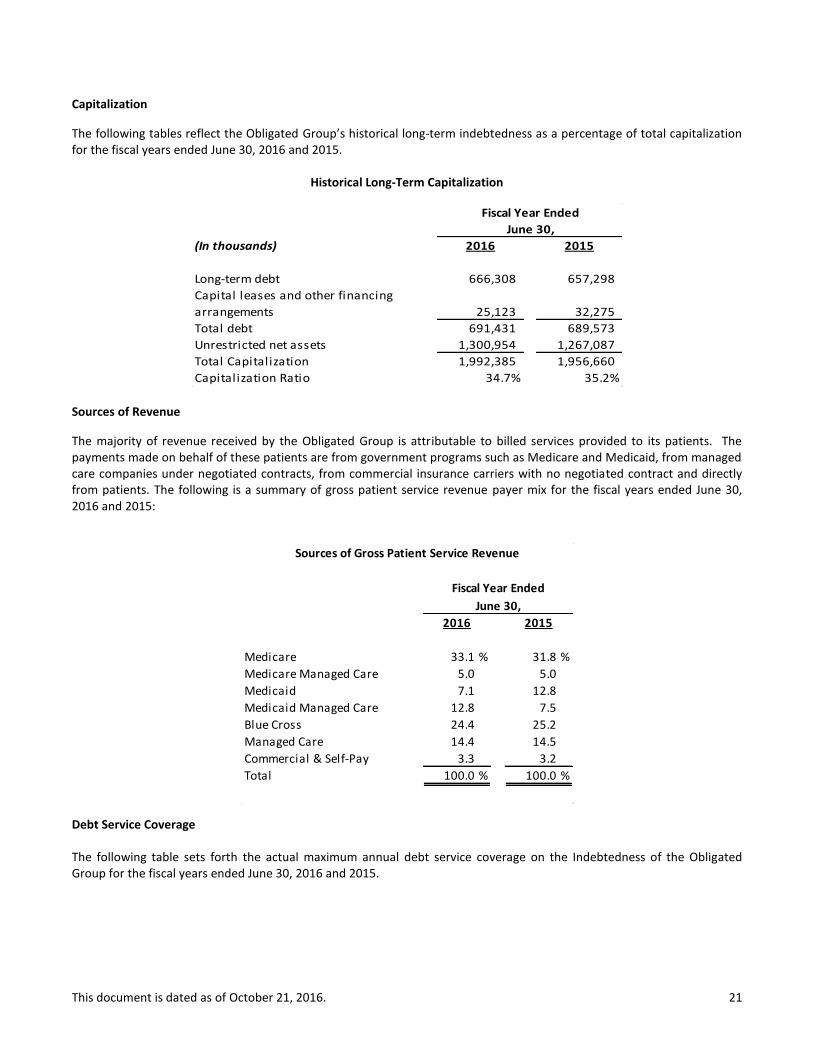
Capitalization
The following tables reflect the Obligated Group’s historical long-term indebtedness as a percentage of total capitalization for the fiscal years ended June 30, 2016 and 2015.
Historical Long-Term Capitalization
Sources of Revenue
The majority of revenue received by the Obligated Group is attributable to billed services provided to its patients. The payments made on behalf of these patients are from government programs such as Medicare and Medicaid, from managed care companies under negotiated contracts, from commercial insurance carriers with no negotiated contract and directly from patients. The following is a summary of gross patient service revenue payer mix for the fiscal years ended June 30, 2016 and 2015:
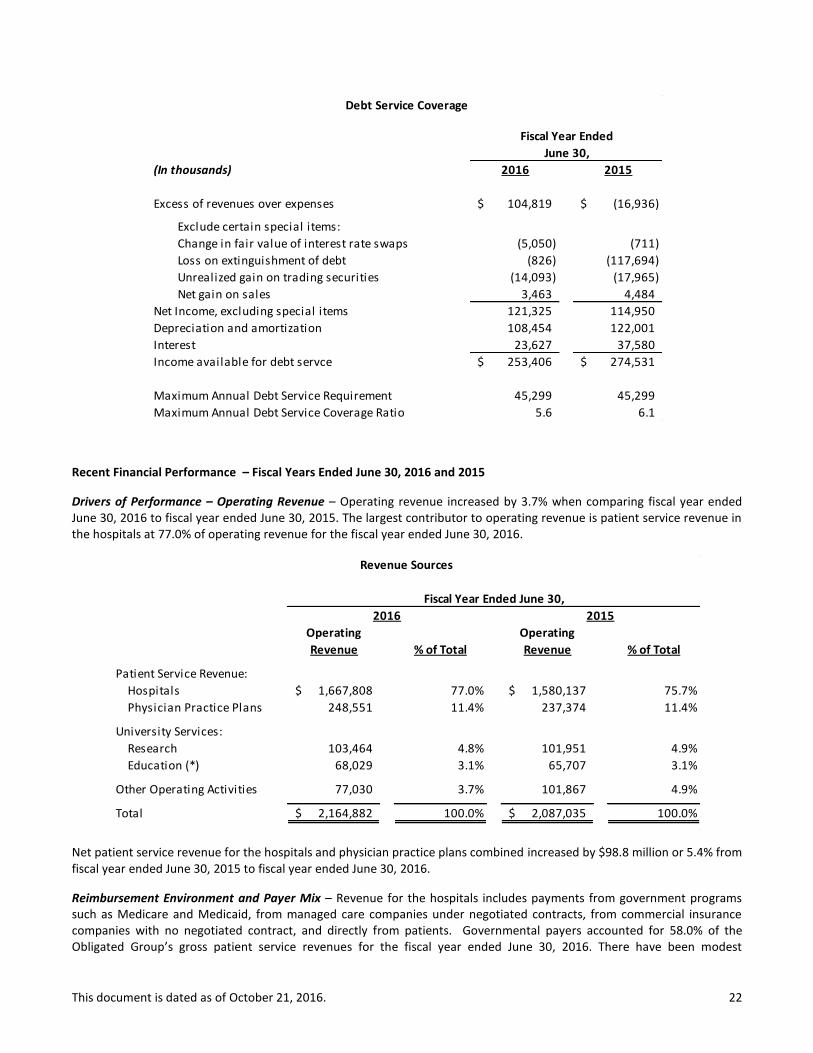
Debt Service Coverage
The following table sets forth the actual maximum annual debt service coverage on the Indebtedness of the Obligated Group for the fiscal years ended June 30, 2016 and 2015.
(In thousands) 2016 2015
Long-term debt 666,308 657,298
Capital leases and other financing
arrangements 25,123 32,275
Total debt 691,431 689,573
Unrestricted net assets 1,300,954 1,267,087
Total Capitalization 1,992,385 1,956,660
Capitalization Ratio 34.7% 35.2%
June 30,
Fiscal Year Ended
2016 2015
Medicare 33.1 % 31.8 %
Medicare Managed Care 5.0 5.0
Medicaid 7.1 12.8
Medicaid Managed Care 12.8 7.5
Blue Cross 24.4 25.2
Managed Care 14.4 14.5
Commercial & Self-Pay 3.3 3.2
Total 100.0 % 100.0 %
Sources of Gross Patient Service Revenue
Fiscal Year Ended
June 30,
This document is dated as of October 21, 2016. 22
Recent Financial Performance – Fiscal Years Ended June 30, 2016 and 2015
Drivers of Performance – Operating Revenue – Operating revenue increased by 3.7% when comparing fiscal year ended June 30, 2016 to fiscal year ended June 30, 2015. The largest contributor to operating revenue is patient service revenue in the hospitals at 77.0% of operating revenue for the fiscal year ended June 30, 2016.
Net patient service revenue for the hospitals and physician practice plans combined increased by $98.8 million or 5.4% from fiscal year ended June 30, 2015 to fiscal year ended June 30, 2016.
Reimbursement Environment and Payer Mix – Revenue for the hospitals includes payments from government programs such as Medicare and Medicaid, from managed care companies under negotiated contracts, from commercial insurance companies with no negotiated contract, and directly from patients. Governmental payers accounted for 58.0% of the Obligated Group’s gross patient service revenues for the fiscal year ended June 30, 2016. There have been modest
(In thousands) 2016 2015
Excess of revenues over expenses 104,819$ (16,936)$
Exclude certain special items:
Change in fair value of interest rate swaps (5,050) (711)
Loss on extinguishment of debt (826) (117,694)
Unrealized gain on trading securities (14,093) (17,965)
Net gain on sales 3,463 4,484
Net Income, excluding special items 121,325 114,950
Depreciation and amortization 108,454 122,001
Interest 23,627 37,580
Income available for debt servce 253,406$ 274,531$
Maximum Annual Debt Service Requirement 45,299 45,299
Maximum Annual Debt Service Coverage Ratio 5.6 6.1
Debt Service Coverage
June 30,
Fiscal Year Ended
Operating Operating
Revenue % of Total Revenue % of Total
Patient Service Revenue:
Hospitals 1,667,808$ 77.0% 1,580,137$ 75.7%
Physician Practice Plans 248,551 11.4% 237,374 11.4%
University Services:
Research 103,464 4.8% 101,951 4.9%
Education (*) 68,029 3.1% 65,707 3.1%
Other Operating Activities 77,030 3.7% 101,867 4.9%
Total 2,164,882$ 100.0% 2,087,035$ 100.0%
Fiscal Year Ended June 30,
2016 2015
Revenue Sources
This document is dated as of October 21, 2016. 23
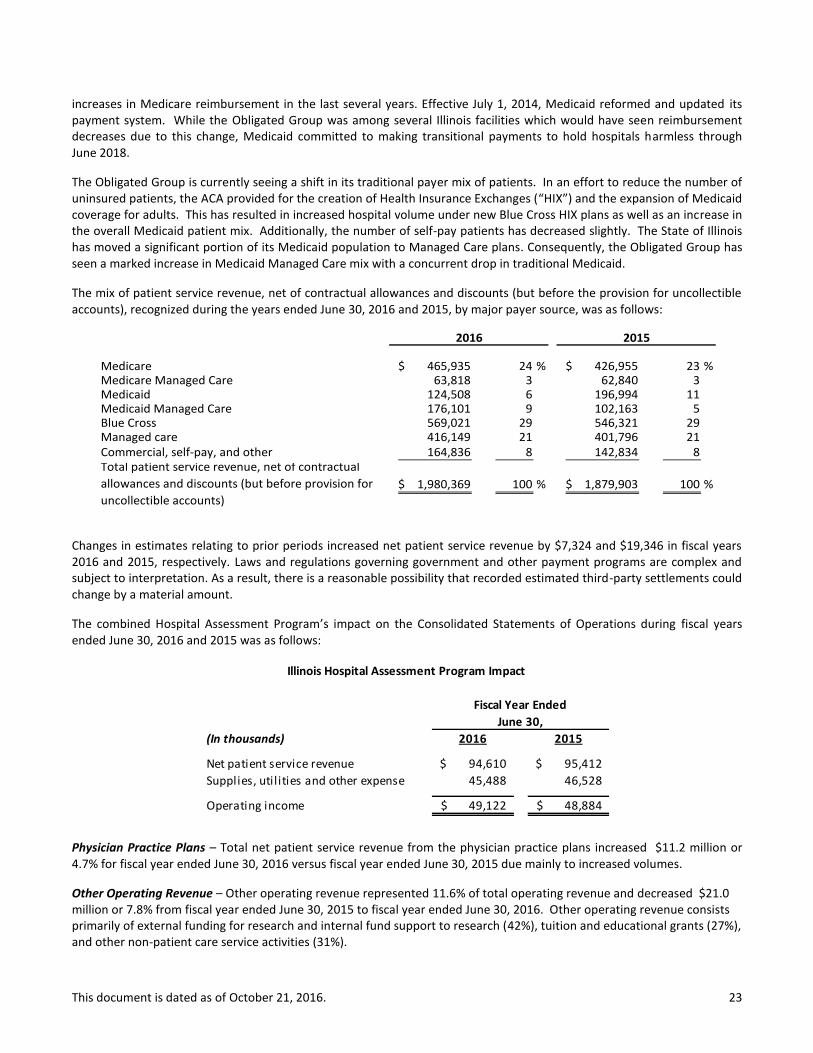
increases in Medicare reimbursement in the last several years. Effective July 1, 2014, Medicaid reformed and updated its payment system. While the Obligated Group was among several Illinois facilities which would have seen reimbursement decreases due to this change, Medicaid committed to making transitional payments to hold hospitals harmless through June 2018.
The Obligated Group is currently seeing a shift in its traditional payer mix of patients. In an effort to reduce the number of uninsured patients, the ACA provided for the creation of Health Insurance Exchanges (“HIX”) and the expansion of Medicaid coverage for adults. This has resulted in increased hospital volume under new Blue Cross HIX plans as well as an increase in the overall Medicaid patient mix. Additionally, the number of self-pay patients has decreased slightly. The State of Illinois has moved a significant portion of its Medicaid population to Managed Care plans. Consequently, the Obligated Group has seen a marked increase in Medicaid Managed Care mix with a concurrent drop in traditional Medicaid.
The mix of patient service revenue, net of contractual allowances and discounts (but before the provision for uncollectible accounts), recognized during the years ended June 30, 2016 and 2015, by major payer source, was as follows:
Medicare 465,935$ 24 % 426,955$ 23 % Medicare Managed Care 63,818 3 62,840 3 Medicaid 124,508 6 196,994 11 Medicaid Managed Care 176,101 9 102,163 5 Blue Cross 569,021 29 546,321 29 Managed care 416,149 21 401,796 21 Commercial, self-pay, and other 164,836 8 142,834 8 Total patient service revenue, net of contractual
allowances and discounts (but before provision for
uncollectible accounts)
1,980,369$ 100 % 1,879,903$ 100 %
2016 2015
Changes in estimates relating to prior periods increased net patient service revenue by $7,324 and $19,346 in fiscal years 2016 and 2015, respectively. Laws and regulations governing government and other payment programs are complex and subject to interpretation. As a result, there is a reasonable possibility that recorded estimated third-party settlements could change by a material amount.
The combined Hospital Assessment Program’s impact on the Consolidated Statements of Operations during fiscal years ended June 30, 2016 and 2015 was as follows:
Physician Practice Plans – Total net patient service revenue from the physician practice plans increased $11.2 million or 4.7% for fiscal year ended June 30, 2016 versus fiscal year ended June 30, 2015 due mainly to increased volumes.
Other Operating Revenue – Other operating revenue represented 11.6% of total operating revenue and decreased $21.0 million or 7.8% from fiscal year ended June 30, 2015 to fiscal year ended June 30, 2016. Other operating revenue consists primarily of external funding for research and internal fund support to research (42%), tuition and educational grants (27%), and other non-patient care service activities (31%).
(In thousands) 2016 2015
Net patient service revenue 94,610$ 95,412$
Supplies, util ities and other expense 45,488 46,528
Operating income 49,122$ 48,884$
Fiscal Year Ended
June 30,
Illinois Hospital Assessment Program Impact

This document is dated as of October 21, 2016. 24
The decrease in other operating revenue is mainly the result of asset monetization revenue recognized during fiscal year ended June 30, 2015. In July 2014, Rush sold its royalties of Ampyra and recognized $34.7 million of revenue within other operating revenue.
Drivers of Performance – Operating Expense – Operating expenses increased by $79.3 million or 4.0% from fiscal year ended June 30, 2015 to fiscal year ended June 30, 2016. Operating costs as a percentage of operating revenue for the fiscal years ended June 30, 2016 and 2015, were as follows:
Salaries, Wages and Employee Benefits – Salaries, wages and employee benefits increased by $79.9 million or 7.8% when comparing fiscal year ended June 30, 2015 to fiscal year ended June 30, 2016.
The table below shows the employed FTEs and employed physicians for the Obligated Group as of June 30, 2016 as compared to June 30, 2015:
Note: Of the 10,969 FTE’s, approximately 8.1% of non-clinical employees are represented by a union. On Tuesday, August 16, 2016, RUMC received the decision from the three member panel of the U.S. Court of Appeals for the District of Columbia unanimously affirming the order of the National Labor Relations Board that the Medical Center engage in collective bargaining with Local 743, Teamsters concerning its representation of Patient Care Technicians. In conjunction with our legal department and our outside labor relations law firm, we are considering whether RUMC would request further review. Depreciation and Amortization – Depreciation and amortization expense decreased $13.5 million or 11.1% for fiscal year ended June 30, 2016 versus fiscal year ended June 30, 2015. In December 2015 RUMC received a settlement of $9 million related to a breach of contract over the design of the Tower, as discussed on pages 27 and 29 of this report. In fiscal year 2013, RUMC recorded $10 million of additional depreciation expense to write-off the impaired asset.
Professional Liability and Other Insurance – Professional liability and other insurance cost the Obligated Group $52.1 million for fiscal year ended June 30, 2016, which is an increase of $12.7 million or 32.1% from fiscal year ended June 30, 2015. The increase is due to RUMC recording additional professional liability expense during fiscal year 2016 in accordance with internal reserving policies.
2016 2015
Salaries, wages and employee benefits 53.1% 49.2%
Supplies, util ities and other (including purchased services) 37.5% 36.8%
Depreciation and amortization 5.2% 5.8%
Professional l iability and other insurance 2.5% 1.9%
Interest 1.1% 1.8%
Operating Costs as a Percentage of Operating Revenue
Fiscal Year Ended
June 30,
Percent
2016 2015 Change
Number of Full-time Equivalents 10,969 10,647 3.0%
Number of Employed Physicians 629 603 4.3%
As of Jun 30,

This document is dated as of October 21, 2016. 25
Interest Expense – Interest expense was $23.6 million for fiscal year ended June 30, 2016, which is a decrease of $14.0 million or 37.1% from fiscal year ended June 30, 2015. The significant decrease is the result of the debt refinancing completed in February 2015.
Significant Nonrecurring Items – During the fiscal years ended June 30, 2016 and 2015 significant nonrecurring items impacted the Obligated Group’s reported operating income as follows:
Non-operating Income/Expense – Total non-operating income increased by $123.2 million from fiscal year ended June 30, 2015 to fiscal year ended June 30, 2016. Non-operating income consists of investment income, unrestricted contributions, loss on extinguishment of debt, and interest rate swaps. The significant increase is due to the $117.7 million loss on extinguishment of debt recognized in fiscal year 2015.
Liquidity and Capital Resources – The Obligated Group’s unrestricted cash and investments at market value increased by $15.1 million or 1.3% from June 30, 2015 to June 30, 2016, 216.7 days cash on hand at June 30, 2016. Included in unrestricted cash and investments was $81.9 million and $72.0 million of Specific Purpose Fund balances as of June 30, 2016 and June 30, 2015, respectively, and $48.1 million and $51.2 million of appreciation on the unrestricted portion of RUMC’s endowment as of June 30, 2016 and June 30, 2015, respectively.
Excluded from unrestricted cash and investments were the following temporarily restricted assets:
Appreciation on the restricted portion of RUMC’s endowment fund of $193.7 million and $208.3 million as of June 30, 2016 and June 30, 2015, respectively. These temporarily restricted funds are used to support specific purposes such as research and education.
The Obligated Group as well as other Illinois hospitals have experienced significant delays in payments by the State of Illinois for amounts due under Medicaid and other state funded programs. Periodically the State catches up with the payments and the delays experienced by the Obligated Group improve, however these delays have increased through the fourth quarter of this fiscal year. Days in accounts receivable ended at 52.9 as of June 30, 2016. Collections of non-Medicaid receivables during the year have been strong to help offset any continuing payment delays on Medicaid receivables.
Capital Expenditures
Since completion of the Tower, spending has normalized to levels consistent with fiscal year 2006 and earlier. Total capital expenditures for the Obligated Group amounted to $124.0 million for fiscal year ended June 30, 2016, a $4.3 million decrease from fiscal year ended June 30, 2015. The Obligated Group’s construction commitments outstanding as of June 30, 2016 were $61.8 million.
MISCELLANEOUS
Ratings
Moody’s, S&P and Fitch have assigned municipal bond ratings of “A1”, “A+” and “A+,” respectively, to the long-term debt of the Obligated Group. As of January 7, 2015, Fitch affirmed the Obligated Group’s A+ rating and revised the outlook to
Fiscal Year Ended Jun-16 Fiscal Year Ended Jun-15
June 30, Operating June 30, Operating
(In millions) 2016 Margin 2015 Margin
Operating income reported $91.2 4.2% $92.7 4.4%
Items impacting operating revenue (12.4) -0.6 (49.8) -2.4
Items impacting operating expenses (13.7) -0.6 30.8 1.5
Total adjustments (26.1) -1.2 (19.1) -0.9
Adjusted operating income $65.1 3.0% $73.6 3.5%
This document is dated as of October 21, 2016. 26
“Positive.” As of January 9, 2015, Moody’s upgraded the Obligated Group’s rating to A1 rating and revised the outlook to “Stable.” As of May 5, 2016, S&P affirmed the Obligated Group’s A+ rating and the “Stable” outlook.
Any explanation of the significance of such ratings may only be obtained from Moody’s, S&P and Fitch. Certain information and materials not included in this Annual Report may have been furnished to Moody’s, S&P and Fitch concerning the Obligated Group. Generally, rating agencies base their ratings on such information and materials and on investigations, studies and assumptions by the rating agencies. Such ratings reflect only the views of such organizations, and an explanation of the significance of such ratings may be obtained only from the rating agencies furnishing the same. There is no assurance that such ratings will remain in effect for any given period of time or that such ratings will not be revised downward or upward or withdrawn entirely by any of such rating agencies if, in the judgment of such rating agency, circumstances warrant. Any such downward revision or withdrawal of such rating may have an adverse effect on the market price or marketability of the Obligated Group’s outstanding bonds.
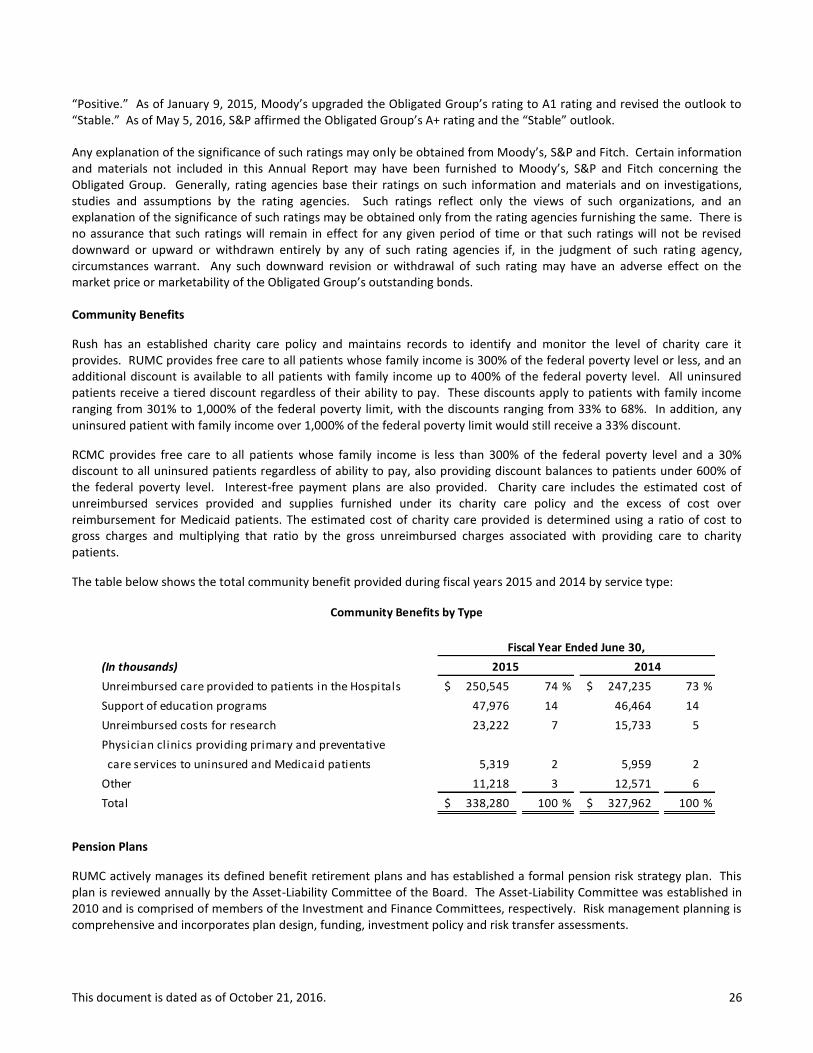
Community Benefits
Rush has an established charity care policy and maintains records to identify and monitor the level of charity care it provides. RUMC provides free care to all patients whose family income is 300% of the federal poverty level or less, and an additional discount is available to all patients with family income up to 400% of the federal poverty level. All uninsured patients receive a tiered discount regardless of their ability to pay. These discounts apply to patients with family income ranging from 301% to 1,000% of the federal poverty limit, with the discounts ranging from 33% to 68%. In addition, any uninsured patient with family income over 1,000% of the federal poverty limit would still receive a 33% discount.
RCMC provides free care to all patients whose family income is less than 300% of the federal poverty level and a 30% discount to all uninsured patients regardless of ability to pay, also providing discount balances to patients under 600% of the federal poverty level. Interest-free payment plans are also provided. Charity care includes the estimated cost of unreimbursed services provided and supplies furnished under its charity care policy and the excess of cost over reimbursement for Medicaid patients. The estimated cost of charity care provided is determined using a ratio of cost to gross charges and multiplying that ratio by the gross unreimbursed charges associated with providing care to charity patients.
The table below shows the total community benefit provided during fiscal years 2015 and 2014 by service type:
Pension Plans
RUMC actively manages its defined benefit retirement plans and has established a formal pension risk strategy plan. This plan is reviewed annually by the Asset-Liability Committee of the Board. The Asset-Liability Committee was established in 2010 and is comprised of members of the Investment and Finance Committees, respectively. Risk management planning is comprehensive and incorporates plan design, funding, investment policy and risk transfer assessments.
(In thousands)
Unreimbursed care provided to patients in the Hospitals 250,545$ 74 % 247,235$ 73 %
Support of education programs 47,976 14 46,464 14
Unreimbursed costs for research 23,222 7 15,733 5
Physician clinics providing primary and preventative
care services to uninsured and Medicaid patients 5,319 2 5,959 2
Other 11,218 3 12,571 6
Total 338,280$ 100 % 327,962$ 100 %
2015 2014
Fiscal Year Ended June 30,
Community Benefits by Type

This document is dated as of October 21, 2016. 27
Funded Status – RUMC regularly measures its plans’ funded status on a PPA Funded Ratio, FAS Funded Ratio and Economic Funded Ratio. These measurements utilize different time periods and discount rates to measure the liability and different smoothing methods for the assets held in the Master Retirement Trust. The FAS Funded Ratio found in the footnotes to the financial statements as of June 30, 2016, reflects a funded ratio of 87%.
Funding – For the past seven consecutive calendar years, RUMC contributed more than the minimum required by Employee Retirement Income Security Act and the Code funding rules. During the fiscal year ended June 30, 2016, RUMC contributed $66.0 million to the plan.
Investment Policy – The portfolio’s investment objective is to achieve a total return that meets or exceeds the plan’s obligations over a full market cycle. This cycle is generally defined as rolling five year periods.
Plan Design – During June 2015, Rush offered a voluntary lump sum cash out to certain eligible terminated vested participants, resulting in a total settlement amount of $46.0 million. In addition, the de-risking initiative triggered a one-time non-cash charge of $12.5 million as a result of the total payments exceeding the plan’s interest cost and service cost components in fiscal year 2015.
Effective January 1, 2015, a new defined benefit plan was established. This new plan (the “Pre-2015 Separations Plan” or the “Pre-2015 Plan”), is a spinoff of the current Retirement Plan. The Retirement Plan’s benefit obligation and assets attributable to participants who terminated employment prior to January 1, 2015 with a vested benefit were transferred to the Pre-2015 Plan as of the effective date. In addition to the pension programs, Rush also provides postretirement health care benefits for certain employees. Further benefits under the postretirement healthcare plans have been curtailed. Contingencies
RUMC has settled its breach of contract claim against architect Perkins+Will, Inc. and its mechanical design subcontractor, Environmental Systems Design, Inc. (ESD), relating to alleged errors and omissions by the defendants in the design of the Tower. A $9 million settlement was recorded as an offset to depreciation expense in December 2015. RUMC also settled its case against ASI, Ohio Farmers’ Insurance, and Illinois National Insurance for construction and design defects in the Tower. Under the settlement agreement, RUMC will receive $8 million from the parties on August 25, 2016. In addition, in the ordinary course of business, Rush receives new lawsuits containing allegations of professional liability and/or general liability. Investment Policies
The Obligated Group’s investment program consists of unrestricted cash and investments, an endowment at RUMC and RCMC and investment trusts maintained for the specific purpose of funding RUMC’s self-insured general and professional liability claims, and RUMC’s defined benefit plan. The Investment Committee of the Board of Trustees at RUMC has the primary purpose of assisting the Board of Trustees in the oversight of RUMC’s asset pools, and specifically, assets in the self-insurance trust, endowment fund, and Master Retirement Trust and investment offerings in the defined contribution plans. The Finance Committee of the Board of Trustees at RUMC has similar responsibilities for unrestricted cash and investments. The Finance Committee of the Board of Directors at RCMC is responsible for determining and implementing all investment policies, selecting and terminating investment managers and reviewing investment performance.
The Obligated Group’s unrestricted cash and investments consisted of the following as of June 30, 2016 and 2015:

This document is dated as of October 21, 2016. 28
The objective of the RUMC self-insurance trust is to fund the self-insurance obligations of RUMC. As of June 30, 2016 the self-insurance trust assets had a market value of $130.3 million versus a market value of $138.0 million as of June 30, 2015. The decrease in the self-insurance trust assets related to the investment income of approximately $1.1 million and $54.6 million payout of claims and related fees during fiscal year ended June 30, 2016. The following table shows the current asset allocation targets and ranges as well as the asset allocation as of June 30, 2016, and for June 30, 2015 for the self-insurance trust:
RUMC uses the total return concept to record returns on investments in its self-insurance trust. RCMC does not maintain a self-insurance trust to fund its self-insurance obligations. As of June 30, 2016, approximately $18.8 million of RCMC’s unrestricted cash and investments is estimated to be required to fund self-insurance obligations.
Fair Value Measurements
As of June 30, 2016 and 2015, Rush held certain assets and liabilities that are required to be measured at fair value on a recurring basis, including marketable securities and short-term investments, certain restricted, trusteed and other investments, derivative instruments, and beneficial interests in trusts. Certain alternative investments measured using either the cost or equity method of accounting are excluded from the fair value disclosure provided herein.
Valuation Principles
Under FASB guidance on fair value measurements, fair value is defined as an exit price, representing the price that would be received to sell an asset or paid to transfer a liability in an orderly transaction between market participants at the measurement date. The valuation techniques used to measure fair value are based upon observable and unobservable inputs. Observable inputs generally reflect market data from independent sources and are supported by market activity, while unobservable inputs are generally unsupported by market activity. The three-level valuation hierarchy, which prioritizes the inputs used in measuring fair value of an asset or liability at the measurement date, includes:
Level 1 inputs — Quoted prices (unadjusted) for identical assets or liabilities in active markets. Securities typically priced using Level 1 inputs include listed equities and exchange-traded mutual funds.
Level 2 inputs — Quoted prices for similar assets or liabilities in active markets, quoted prices for identical or similar assets and liabilities in nonactive markets, and model-driven valuations whose inputs are observable for the asset or liability, either directly or indirectly. Securities typically priced using Level 2 inputs include government bonds (including US treasuries and agencies), corporate and municipal bonds, collateralized obligations, interest rate swaps, commercial paper and currency options.
Asset Summary
(In millions)
2016 2015
Cash and Cash Equivalents 156$ 146$
Fixed Income Securities 488 523
Public Equity 298 260
Multi-Asset 174 168
Other 47 51
Total 1,163$ 1,148$
Total Unrestricted Cash & Investments
Fiscal Year Ended June 30,
Asset Class Jun 30, 2016 Jun 30, 2015
Fixed Income 75% (+/-5%) 67% 74%
Domestic Equity 25% (+/-5%) 27% 26%
Cash/Money Market -- -- 6% --
Percentage Trust Assets as of
Target Allocation and Range
This document is dated as of October 21, 2016. 29
Level 3 inputs — Unobservable inputs for which there is little or no market data available and are based on the reporting entity’s own judgment or estimation of the assumptions that market participants would use in pricing the asset or liability. The fair values for securities typically priced using Level 3 inputs are determined using model-driven techniques, which include option-pricing models, discounted cash flow models, and similar methods. The level 3 classification includes beneficial interests in trusts.
In restating the long-term investments fair value hierarchy table as of June 30, 2015 to comport with the adoption of ASU 2015-07 as discussed in Note 2, $76.3 million in fund investments were reclassified from Level 1 within the fair value hierarchy to being reported under their NAV (or its equivalent) as a practical expedient, $108.2 million in fund investments were reclassified from Level 2 within the fair value hierarchy to being reported under their NAV (or its equivalent) as a practical expedient, and $130.2 million in fund investments and alternative investments were reclassified from Level 3 to being reported under their NAV (or its equivalent) as a practical expedient. The reconciliation for financial instruments classified as Level 3 investments as of June 30, 2015 was restated to reflect the Level 3 reclassifications to NAV (or its equivalent) as a practical expedient.
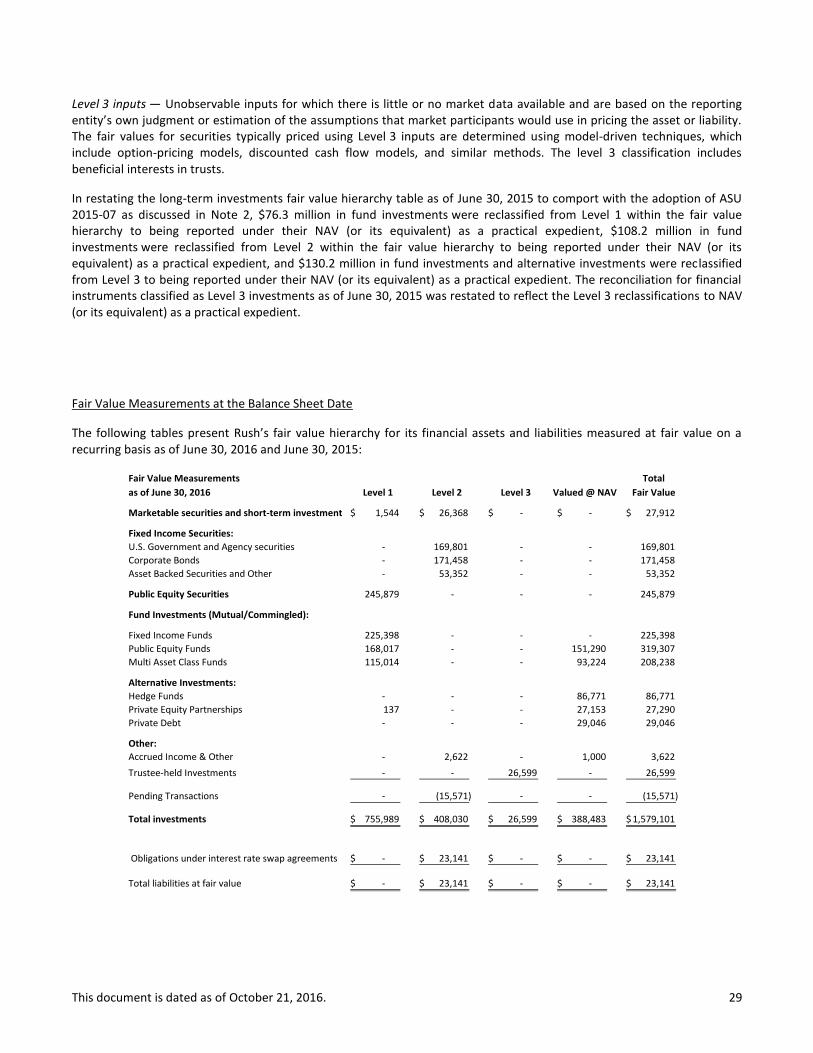
Fair Value Measurements at the Balance Sheet Date
The following tables present Rush’s fair value hierarchy for its financial assets and liabilities measured at fair value on a recurring basis as of June 30, 2016 and June 30, 2015:
Fair Value Measurements Total
as of June 30, 2016 Level 1 Level 2 Level 3 Valued @ NAV Fair Value
Marketable securities and short-term investments 1,544$ 26,368$ - $ - $ 27,912$
Fixed Income Securities:
U.S. Government and Agency securities - 169,801 - - 169,801
Corporate Bonds - 171,458 - - 171,458
Asset Backed Securities and Other - 53,352 - - 53,352
Public Equity Securities 245,879 - - - 245,879
Fund Investments (Mutual/Commingled):
Fixed Income Funds 225,398 - - - 225,398
Public Equity Funds 168,017 - - 151,290 319,307
Multi Asset Class Funds 115,014 - - 93,224 208,238
Alternative Investments:
Hedge Funds - - - 86,771 86,771
Private Equity Partnerships 137 - - 27,153 27,290
Private Debt - - - 29,046 29,046
Other:
Accrued Income & Other - 2,622 - 1,000 3,622
Trustee-held Investments - - 26,599 - 26,599
Pending Transactions - (15,571) - - (15,571)
Total investments 755,989$ 408,030$ 26,599$ 388,483$ 1,579,101$
Obligations under interest rate swap agreements - $ 23,141$ - $ - $ 23,141$
Total liabilities at fair value - $ 23,141$ - $ - $ 23,141$

This document is dated as of October 21, 2016. 30
Fair Value Measurements Total
as of June 30, 2015 Level 1 Level 2 Level 3 Valued @ NAV Fair Value
Marketable securities and short-term investments 2,299$ 31,299$ - $ - $ 33,598$
Fixed Income Securities:
U.S. Government and Agency securities - 186,629 - - 186,629
Corporate Bonds - 155,853 - - 155,853
Asset Backed Securities and Other - 65,351 - - 65,351
Public Equity Securities 233,447 - - - 233,447
Fund Investments (Mutual/Commingled):
Fixed Income Funds 300,848 - - - 300,848
Public Equity Funds 154,771 - - 93,981 248,752
Multi Asset Class Funds 114,515 166 - 97,726 212,407
Alternative Investments:
Hedge Funds - - - 89,726 89,726
Private Equity Partnerships - - - 17,337 17,337
Private Debt - - - 15,729 15,729
Other:
Accrued Income & Other - 2,770 - - 2,770
Trustee-held Investments - - 28,344 - 28,344
Pending Transactions - (219) - - (219)
Total investments 805,880$ 441,848$ 28,344$ 314,500$ 1,590,572$
Obligations under interest rate swap agreements - $ 18,092$ - $ - $ 18,092$
Total liabilities at fair value - $ 18,092$ - $ - $ 18,092$
During fiscal year ended June 30, 2015, there were security transfers of $4.3 million from Levels 1 to Level 2 due to a reclassification of an underlying holding.
Valuation Techniques and Inputs for Level 2 and Level 3 Instruments
The Level 2 and Level 3 instruments listed in the preceding fair value tables use the following valuation techniques and inputs as of the valuation date:
Marketable Securities and Short-term Investments – Marketable securities classified as Level 2 are invested in a short-term collective fund that serves as an investment vehicle for cash reserves. Fair value was determined using the calculated NAV as of the valuation date, based on a constant price. These funds are invested in high-grade and short-term money market instruments with daily liquidity.
Fixed Income Securities – Fixed income securities consists primarily of U.S. Government and agency securities, corporate bonds, and asset backed securities, all of which are classified as Level 2. The fair value of investments in U.S. government and agency securities and corporate bonds was primarily determined using techniques consistent with the market approach, including matrix pricing and significant observable inputs of institutional bids, trade data, broker and dealer quotes, discount rates, issues spreads, and benchmark yield curves. The asset backed securities encompasses collateralized bond obligations, collateralized loan and mortgage obligations any other asset backed securities. The fair value of these securities was determined using techniques consistent with the market and income approach, such as discounted cash flows and matrix pricing.
Fund Investments – Investments in this category classified as Level 2 are held in a commingled fund that invests primarily in global equity and bond mutual funds. The fair value of this commingled fund is based upon the calculated NAV at the valuation date under a market approach. Investments in this category classified as NAV, which are invested in a multistrategy hedge fund, are priced on the last business day of each calendar month. The values of the underlying investments are estimated based on many factors, including operating performance,
This document is dated as of October 21, 2016. 31
balance sheet indicators, growth, and other market and business fundamentals. The underlying investment strategies can include long-short, global macro, fixed-income and currency hedges, and other tactical opportunity-related strategies.
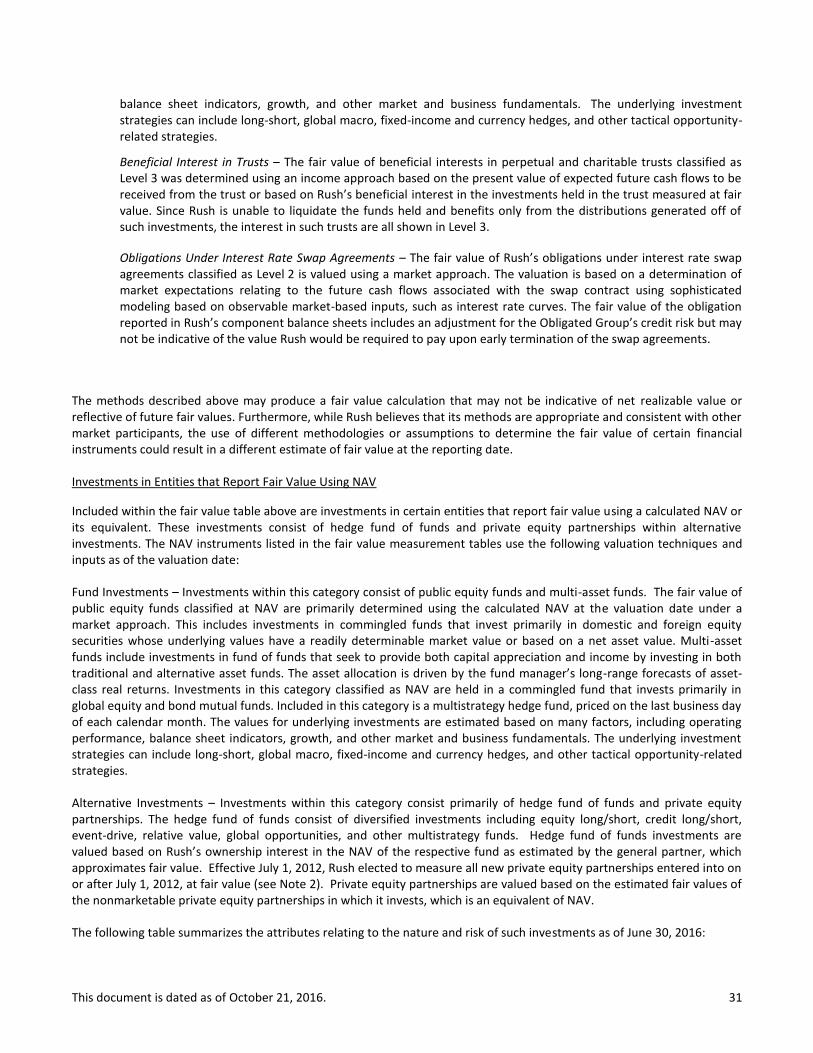
Beneficial Interest in Trusts – The fair value of beneficial interests in perpetual and charitable trusts classified as Level 3 was determined using an income approach based on the present value of expected future cash flows to be received from the trust or based on Rush’s beneficial interest in the investments held in the trust measured at fair value. Since Rush is unable to liquidate the funds held and benefits only from the distributions generated off of such investments, the interest in such trusts are all shown in Level 3.
Obligations Under Interest Rate Swap Agreements – The fair value of Rush’s obligations under interest rate swap agreements classified as Level 2 is valued using a market approach. The valuation is based on a determination of market expectations relating to the future cash flows associated with the swap contract using sophisticated modeling based on observable market-based inputs, such as interest rate curves. The fair value of the obligation reported in Rush’s component balance sheets includes an adjustment for the Obligated Group’s credit risk but may not be indicative of the value Rush would be required to pay upon early termination of the swap agreements.
The methods described above may produce a fair value calculation that may not be indicative of net realizable value or reflective of future fair values. Furthermore, while Rush believes that its methods are appropriate and consistent with other market participants, the use of different methodologies or assumptions to determine the fair value of certain financial instruments could result in a different estimate of fair value at the reporting date.
Investments in Entities that Report Fair Value Using NAV
Included within the fair value table above are investments in certain entities that report fair value using a calculated NAV or its equivalent. These investments consist of hedge fund of funds and private equity partnerships within alternative investments. The NAV instruments listed in the fair value measurement tables use the following valuation techniques and inputs as of the valuation date:
Fund Investments – Investments within this category consist of public equity funds and multi-asset funds. The fair value of public equity funds classified at NAV are primarily determined using the calculated NAV at the valuation date under a market approach. This includes investments in commingled funds that invest primarily in domestic and foreign equity securities whose underlying values have a readily determinable market value or based on a net asset value. Multi-asset funds include investments in fund of funds that seek to provide both capital appreciation and income by investing in both traditional and alternative asset funds. The asset allocation is driven by the fund manager’s long-range forecasts of asset-class real returns. Investments in this category classified as NAV are held in a commingled fund that invests primarily in global equity and bond mutual funds. Included in this category is a multistrategy hedge fund, priced on the last business day of each calendar month. The values for underlying investments are estimated based on many factors, including operating performance, balance sheet indicators, growth, and other market and business fundamentals. The underlying investment strategies can include long-short, global macro, fixed-income and currency hedges, and other tactical opportunity-related strategies.
Alternative Investments – Investments within this category consist primarily of hedge fund of funds and private equity partnerships. The hedge fund of funds consist of diversified investments including equity long/short, credit long/short, event-drive, relative value, global opportunities, and other multistrategy funds. Hedge fund of funds investments are valued based on Rush’s ownership interest in the NAV of the respective fund as estimated by the general partner, which approximates fair value. Effective July 1, 2012, Rush elected to measure all new private equity partnerships entered into on or after July 1, 2012, at fair value (see Note 2). Private equity partnerships are valued based on the estimated fair values of the nonmarketable private equity partnerships in which it invests, which is an equivalent of NAV.
The following table summarizes the attributes relating to the nature and risk of such investments as of June 30, 2016:
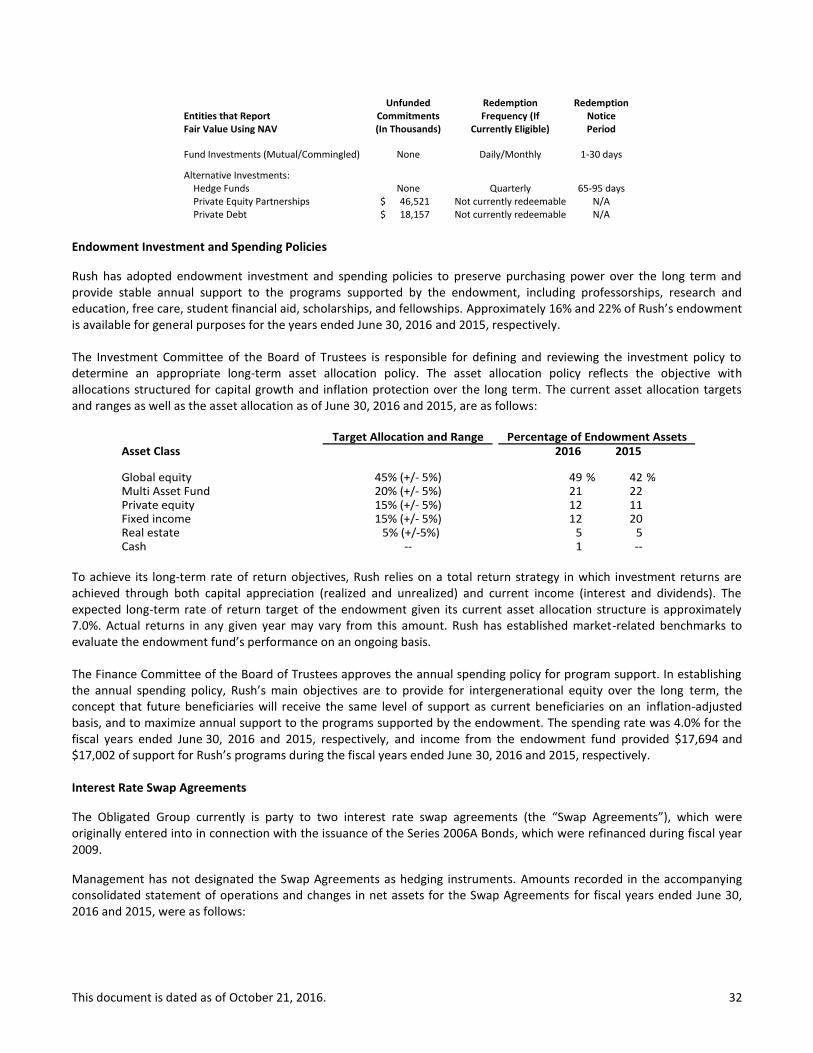
This document is dated as of October 21, 2016. 32
Unfunded Redemption RedemptionEntities that Report Commitments Frequency (If NoticeFair Value Using NAV (In Thousands) Currently Eligible) Period
Fund Investments (Mutual/Commingled) None Daily/Monthly 1-30 days
Alternative Investments: Hedge Funds None Quarterly 65-95 days Private Equity Partnerships 46,521$ Not currently redeemable N/A Private Debt 18,157$ Not currently redeemable N/A
Endowment Investment and Spending Policies
Rush has adopted endowment investment and spending policies to preserve purchasing power over the long term and provide stable annual support to the programs supported by the endowment, including professorships, research and education, free care, student financial aid, scholarships, and fellowships. Approximately 16% and 22% of Rush’s endowment is available for general purposes for the years ended June 30, 2016 and 2015, respectively.
The Investment Committee of the Board of Trustees is responsible for defining and reviewing the investment policy to determine an appropriate long-term asset allocation policy. The asset allocation policy reflects the objective with allocations structured for capital growth and inflation protection over the long term. The current asset allocation targets and ranges as well as the asset allocation as of June 30, 2016 and 2015, are as follows:
Asset Class 2016 2015
Global equity 49 % 42 % Multi Asset Fund 21 22 Private equity 12 11 Fixed income 12 20 Real estate 5 5 Cash 1 ----
Percentage of Endowment AssetsTarget Allocation and Range
45% (+/- 5%)20% (+/- 5%)
5% (+/-5%)
15% (+/- 5%)15% (+/- 5%)
To achieve its long-term rate of return objectives, Rush relies on a total return strategy in which investment returns are achieved through both capital appreciation (realized and unrealized) and current income (interest and dividends). The expected long-term rate of return target of the endowment given its current asset allocation structure is approximately 7.0%. Actual returns in any given year may vary from this amount. Rush has established market-related benchmarks to evaluate the endowment fund’s performance on an ongoing basis.
The Finance Committee of the Board of Trustees approves the annual spending policy for program support. In establishing the annual spending policy, Rush’s main objectives are to provide for intergenerational equity over the long term, the concept that future beneficiaries will receive the same level of support as current beneficiaries on an inflation-adjusted basis, and to maximize annual support to the programs supported by the endowment. The spending rate was 4.0% for the fiscal years ended June 30, 2016 and 2015, respectively, and income from the endowment fund provided $17,694 and $17,002 of support for Rush’s programs during the fiscal years ended June 30, 2016 and 2015, respectively.
Interest Rate Swap Agreements
The Obligated Group currently is party to two interest rate swap agreements (the “Swap Agreements”), which were originally entered into in connection with the issuance of the Series 2006A Bonds, which were refinanced during fiscal year 2009.
Management has not designated the Swap Agreements as hedging instruments. Amounts recorded in the accompanying consolidated statement of operations and changes in net assets for the Swap Agreements for fiscal years ended June 30, 2016 and 2015, were as follows:
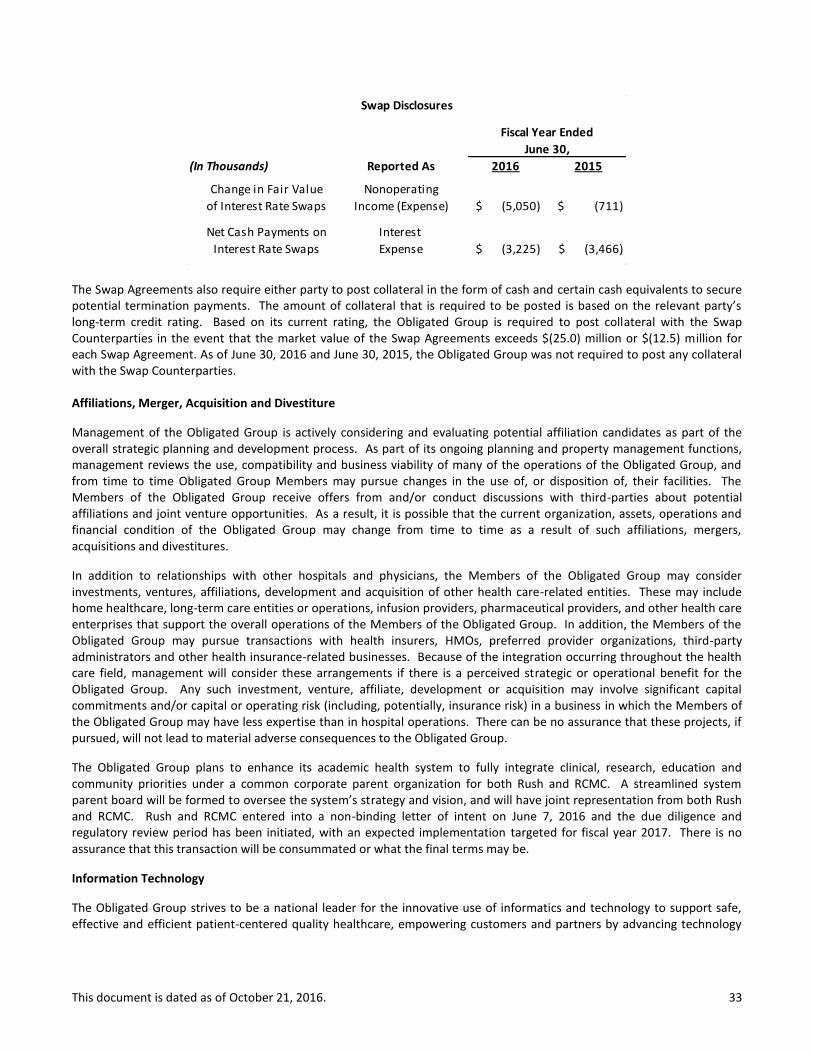
This document is dated as of October 21, 2016. 33
The Swap Agreements also require either party to post collateral in the form of cash and certain cash equivalents to secure potential termination payments. The amount of collateral that is required to be posted is based on the relevant party’s long-term credit rating. Based on its current rating, the Obligated Group is required to post collateral with the Swap Counterparties in the event that the market value of the Swap Agreements exceeds $(25.0) million or $(12.5) million for each Swap Agreement. As of June 30, 2016 and June 30, 2015, the Obligated Group was not required to post any collateral with the Swap Counterparties.
Affiliations, Merger, Acquisition and Divestiture
Management of the Obligated Group is actively considering and evaluating potential affiliation candidates as part of the overall strategic planning and development process. As part of its ongoing planning and property management functions, management reviews the use, compatibility and business viability of many of the operations of the Obligated Group, and from time to time Obligated Group Members may pursue changes in the use of, or disposition of, their facilities. The Members of the Obligated Group receive offers from and/or conduct discussions with third-parties about potential affiliations and joint venture opportunities. As a result, it is possible that the current organization, assets, operations and financial condition of the Obligated Group may change from time to time as a result of such affiliations, mergers, acquisitions and divestitures.
In addition to relationships with other hospitals and physicians, the Members of the Obligated Group may consider investments, ventures, affiliations, development and acquisition of other health care-related entities. These may include home healthcare, long-term care entities or operations, infusion providers, pharmaceutical providers, and other health care enterprises that support the overall operations of the Members of the Obligated Group. In addition, the Members of the Obligated Group may pursue transactions with health insurers, HMOs, preferred provider organizations, third-party administrators and other health insurance-related businesses. Because of the integration occurring throughout the health care field, management will consider these arrangements if there is a perceived strategic or operational benefit for the Obligated Group. Any such investment, venture, affiliate, development or acquisition may involve significant capital commitments and/or capital or operating risk (including, potentially, insurance risk) in a business in which the Members of the Obligated Group may have less expertise than in hospital operations. There can be no assurance that these projects, if pursued, will not lead to material adverse consequences to the Obligated Group.
The Obligated Group plans to enhance its academic health system to fully integrate clinical, research, education and community priorities under a common corporate parent organization for both Rush and RCMC. A streamlined system parent board will be formed to oversee the system’s strategy and vision, and will have joint representation from both Rush and RCMC. Rush and RCMC entered into a non-binding letter of intent on June 7, 2016 and the due diligence and regulatory review period has been initiated, with an expected implementation targeted for fiscal year 2017. There is no assurance that this transaction will be consummated or what the final terms may be.
Information Technology
The Obligated Group strives to be a national leader for the innovative use of informatics and technology to support safe, effective and efficient patient-centered quality healthcare, empowering customers and partners by advancing technology
(In Thousands) Reported As 2016 2015
Change in Fair Value Nonoperating
of Interest Rate Swaps Income (Expense) (5,050)$ (711)$
Net Cash Payments on Interest
Interest Rate Swaps Expense (3,225)$ (3,466)$
Fiscal Year Ended
June 30,
Swap Disclosures
This document is dated as of October 21, 2016. 34
solutions that enable the Obligated Group to achieve its mission, vision and values. During the fiscal year ended June 30, 2016, the Obligated Group has spent $89.3 million on IT expenditures, which represents 4.1% of its operating revenue.
Campus Transformation
RUMC is in the initial stages of a strategic master facility plan, which includes new developments on campus as well as other offsite investments.
In April 2016, RUMC opened a new 10,000 sq. ft. outpatient clinic in Chicago’s River North neighborhood. The practice includes five primary care physicians, two specialists in obstetrics and gynecology, a dermatologist and advanced practice nurses. The staff provides care for a wide range of patients, from those needing routine primary care to those requiring ongoing support to manage chronic diseases such as diabetes, asthma and high blood pressure.
In June 2016, RUMC filed a certificate of need application to build an outpatient health center within a new 15-story mixed used residential development in Chicago’s South Loop neighborhood. Pending approval, the outpatient health center would open in the summer of 2018 and would occupy three floors of the building. RUMC anticipates the center would include primary care, cardiology, dermatology, endocrinology, obstetrics and gynecology, otolaryngology, and rheumatology specialties. In addition, RUMC has filed two additional certificate of need applications in August 2016 to build a three-story medical professional building focused on orthopedic-related services in Oak Brook. Pending approval, the medical building would house three primary tenants: a multi-specialty ambulatory surgical treatment center, offices for Midwest Orthopaedics at Rush and offices for other faculty physicians of RUMC.
Recent Transactions
During December 2015, RUMC settled a breach of contract claim against architect Perkins+Will over the design of the Tower. RUMC received $9 million as a result of the settlement.
RCMC has drawn $14.6 million on a line of credit through during fiscal year 2016, which is being used to fund current construction projects. The maturity date is December 31, 2018.
In June 2016, RUMC refinanced the Series 2008 bonds in order to convert the 3-year letter of credit to a 10-year private loan. No other changes to the original terms and conditions were made. The refinancing resulted in a loss on extinguishment of debt of $0.8 million.
There were no other significant or material transactions outside the ordinary course of business during fiscal year ended June 30, 2016.
Subsequent Events
The Obligated Group has evaluated events occurring subsequent to the balance sheet date through October 21, 2016, the date this annual report was issued. In August 2016, RUMC received a litigation settlement for $8 million related to construction and design defects in the Tower. See page 27 of this annual report for additional details. There were no other material subsequent events during this time period.
This document is dated as of October 21, 2016. 35
CONSOLIDATED FINANCIAL STATEMENTS

This document is dated as of October 21, 2016. 36
RUSH UNIVERSITY MEDICAL CENTER OBLIGATED GROUP Consolidated Balance Sheets
(Dollars in thousands)
Note 1: The June 30, 2016 and 2015 financial statement information was derived from and should be read in conjunction with the Rush University Medical Center Obligated Group 2016 Audited Consolidated Financial Statements. See accompanying notes to consolidated financial statements.
Audited Audited
Jun 30, 2016 Jun 30, 2015
ASSETS
CURRENT ASSETS:
Cash and cash equivalents 154,927$ 145,812$
Accounts receivable for patient services— net of allowance for
doubtful accounts of $56,545 and $51,535 respectively 277,088 225,330
Other accounts receivable 71,779 52,814
Self-insurance trust— current portion 26,838 31,211
Other current assets 51,705 50,227
Total current assets 582,337 505,394
ASSETS LIMITED AS TO USE AND INVESTMENTS:
Investments— less current portion 1,008,415 1,002,423
Limited as to use by donor or time restriction or other 484,440 507,036
Self-insurance trust— less current portion 103,432 106,761
Total assets limited as to use and investments 1,596,287 1,616,221
PROPERTY AND EQUIPMENT— At cost:
Property and equipment 2,691,604 2,665,467
Less accumulated depreciation (1,330,969) (1,306,334)
Net property and equipment 1,360,635 1,359,133
OTHER ASSETS 46,946 46,384
TOTAL ASSETS 3,586,205$ 3,527,131$
LIABILITIES AND NET ASSETS
CURRENT LIABILITIES:
Accounts payable and accrued expenses 331,133$ 319,973$
Estimated third-party settlements payable— net 184,263 170,710
Current portion of accrued liability under self-insurance programs 38,484 44,015
Current portion of long-term debt 11,102 2,507
Total current liabilities 564,982 537,205
LONG-TERM LIABILITIES:
Accrued liability under self-insurance programs— less current portion 197,600 205,882
Postretirement and pension benefits 138,139 116,296
Long-term debt— less current portion 640,612 654,791
Line of credit 14,594 -
Other long-term liabilities 94,852 90,523
Obligations under capital lease and other financing arrangements 22,360 28,415
Total long-term liabilities 1,108,157 1,095,907
Total liabilities 1,673,139 1,633,112
NET ASSETS:
Unrestricted 1,300,954 1,267,087
Temporarily restricted for specific purposes 346,731 364,206
Permanently restricted endowments 265,381 262,726
Total net assets 1,913,066 1,894,019
TOTAL LIABILITIES AND NET ASSETS 3,586,205$ 3,527,131$
Note 1
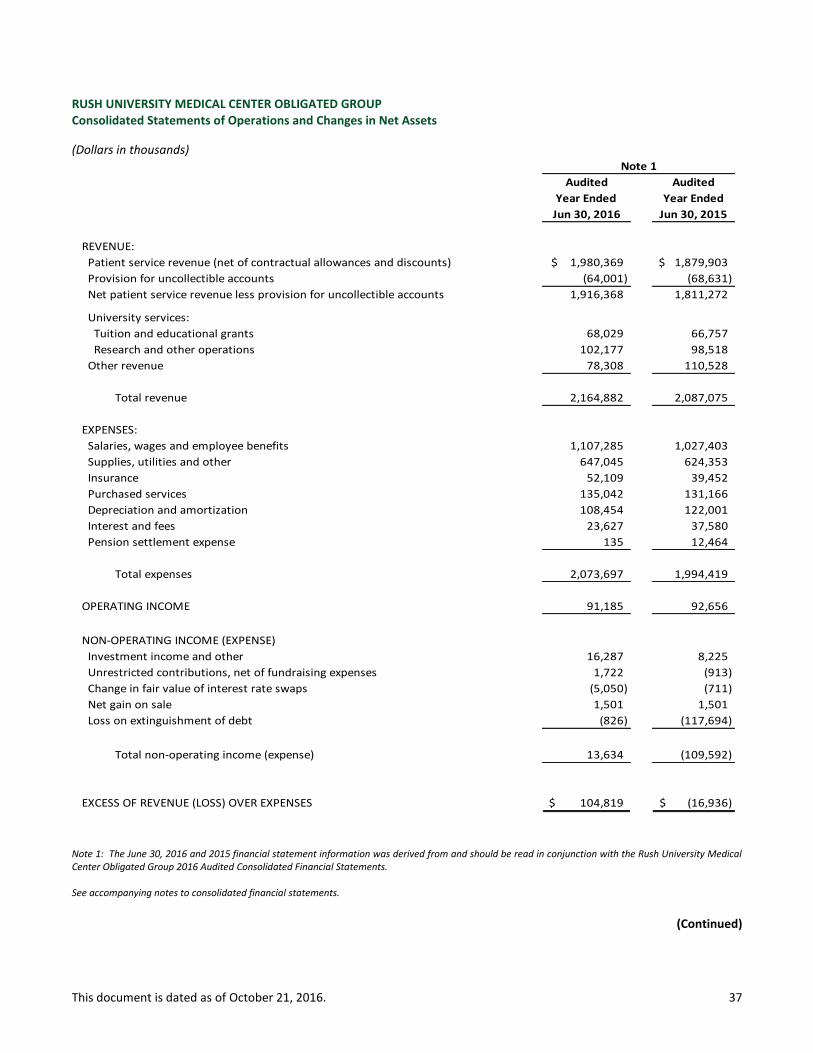
This document is dated as of October 21, 2016. 37
RUSH UNIVERSITY MEDICAL CENTER OBLIGATED GROUP Consolidated Statements of Operations and Changes in Net Assets
(Dollars in thousands)
Note 1: The June 30, 2016 and 2015 financial statement information was derived from and should be read in conjunction with the Rush University Medical Center Obligated Group 2016 Audited Consolidated Financial Statements. See accompanying notes to consolidated financial statements.
(Continued)
Audited Audited
Year Ended Year Ended
Jun 30, 2016 Jun 30, 2015
REVENUE:
Patient service revenue (net of contractual allowances and discounts) 1,980,369$ 1,879,903$
Provision for uncollectible accounts (64,001) (68,631)
Net patient service revenue less provision for uncollectible accounts 1,916,368 1,811,272
University services:
Tuition and educational grants 68,029 66,757
Research and other operations 102,177 98,518
Other revenue 78,308 110,528
Total revenue 2,164,882 2,087,075
EXPENSES:
Salaries, wages and employee benefits 1,107,285 1,027,403
Supplies, utilities and other 647,045 624,353
Insurance 52,109 39,452
Purchased services 135,042 131,166
Depreciation and amortization 108,454 122,001
Interest and fees 23,627 37,580
Pension settlement expense 135 12,464
Total expenses 2,073,697 1,994,419
OPERATING INCOME 91,185 92,656
NON-OPERATING INCOME (EXPENSE)
Investment income and other 16,287 8,225
Unrestricted contributions, net of fundraising expenses 1,722 (913)
Change in fair value of interest rate swaps (5,050) (711)
Net gain on sale 1,501 1,501
Loss on extinguishment of debt (826) (117,694)
Total non-operating income (expense) 13,634 (109,592)
EXCESS OF REVENUE (LOSS) OVER EXPENSES 104,819$ (16,936)$
Note 1

This document is dated as of October 21, 2016. 38
RUSH UNIVERSITY MEDICAL CENTER OBLIGATED GROUP Consolidated Statements of Operations and Changes in Net Assets
(Dollars in thousands)
Note 1: The June 30, 2016 and 2015 financial statement information was derived from and should be read in conjunction with the Rush University Medical Center Obligated Group 2016 Audited Consolidated Financial Statements. See accompanying notes to consolidated financial statements.
(Concluded)
Audited Audited
Year Ended Year Ended
Jun 30, 2016 Jun 30, 2015
UNRESTRICTED NET ASSETS
Excess of revenue (loss) over expenses 104,819$ (16,936)$
Net assets released from restrictions used for the purchase of
property and equipment 8,757 7,604
Postretirement related changes other than net periodic postretirement cost (79,802) (41,466)
Other 93 109
Increase (Decrease) in Unrestricted Net Assets 33,867 (50,689)
RESTRICTED NET ASSETS
TEMPORARILY RESTRICTED NET ASSETS:
Pledges, contributions and grants 32,681 28,114
Net assets released from restrictions (46,949) (43,037)
Investment gains 9,220 31,531
Change in unrealized losses on investments (12,426) (22,058)
Decrease in Temporarily Restricted Net Assets (17,475) (5,450)
PERMANENTLY RESTRICTED NET ASSETS:
Pledges and contributions 4,400 5,724
Investment losses on trustee-held investments (1,745) (269)
Increase in Permanently Restricted Net Assets 2,655 5,455
INCREASE (DECREASE) IN NET ASSETS 19,047 (50,684)
NET ASSETS—Beginning of year 1,894,019 1,944,703
NET ASSETS—End of year 1,913,066$ 1,894,019$
Note 1

This document is dated as of October 21, 2016. 39
RUSH UNIVERSITY MEDICAL CENTER OBLIGATED GROUP Consolidated Statements of Cash Flows
(Dollars in thousands)
Note 1: The June 30, 2016 and 2015 financial statement information was derived from and should be read in conjunction with the Rush University Medical Center Obligated Group 2016 Audited Consolidated Financial Statements.
Audited
Year Ended
Jun 30, 2016 Jun 30, 2015
OPERATING ACTIVITIES:
Increase (Decrease) in net assets 19,047$ (50,684)$
Adjustments to reconcile change in net assets to net cash provided by
operating activities:
Depreciation and amortization 108,454 122,001
Postretirement related changes other than net period postretirement cost 79,802 41,466
Provision for uncollectible accounts 64,001 68,631
Change in fair value of interest rate swaps 5,050 711
Net unrealized and realized gains on investments (9,527) (13,661)
Restricted contributions and investment income received (10,800) (17,051)
Investment losses on trustee held investments 1,745 269
Net gain on sale (3,625) (1,501)
Loss on extinguishment of debt 826 117,694
Changes in operating assets and liabilities:
Accounts receivable for patient services (115,771) (82,603)
Accounts payable and accrued expenses 16,900 15,970
Estimated third-party settlements payable 13,553 15,058
Pension and postretirement costs (57,959) 21,349
Accrued liability under self-insurance programs (13,813) 2,187
Other changes in assets and liabilities (14,631) 18,110
Net cash provided by operating activities 83,252 257,946
INVESTING ACTIVITIES:
Additions to property and equipment (125,844) (128,351)
Proceeds from Sale of Atlas Physical Therapy 2,129 -
Purchase of investments (935,716) (1,123,219)
Sale of investments 957,459 1,000,417
Proceeds from settlement 9,000 -
Net cash used in investing activities (92,972) (251,153)
FINANCING ACTIVITIES:
Proceeds from restricted contributions and investment income 14,189 16,764
Refunding of long-term debt (50,000) (558,355)
Proceeds from issuance of long-term debt 50,000 562,842
Proceeds from line of credit 14,594 -
Payment of bond issuance cost (290) (4,486)
Payment of long-term debt (2,506) (12,924)
Payment of obligations under capital lease and other financing arrangements (7,152) (4,212)
Net cash provided by (used in) financing activities 18,835 (371)
NET INCREASE IN CASH AND CASH EQUIVALENTS 9,115 6,421
CASH AND CASH EQUIVALENTS—Beginning of year 145,811 139,390
CASH AND CASH EQUIVALENTS—End of year 154,926$ 145,811$
Audited
Year Ended
Note 1

This document is dated as of October 21, 2016. 40
APPENDICES
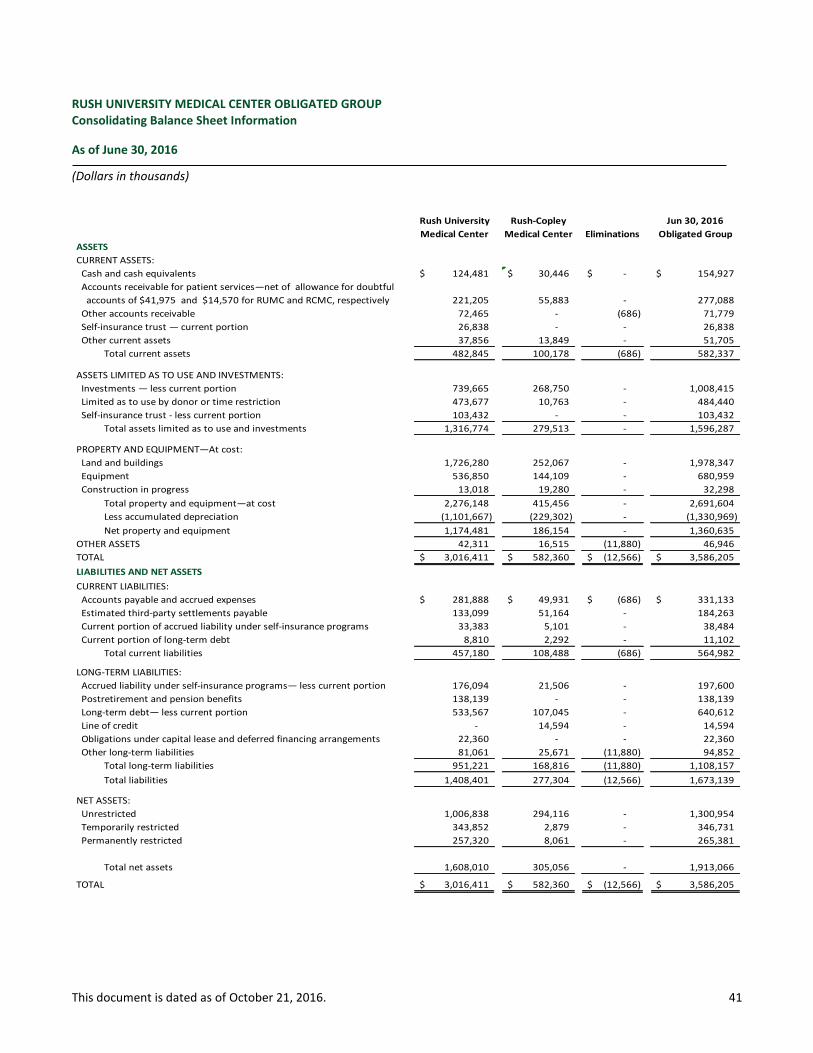
This document is dated as of October 21, 2016. 41
RUSH UNIVERSITY MEDICAL CENTER OBLIGATED GROUP Consolidating Balance Sheet Information
As of June 30, 2016
(Dollars in thousands)
Rush University Rush-Copley Jun 30, 2016
Medical Center Medical Center Eliminations Obligated Group
ASSETS
CURRENT ASSETS:
Cash and cash equivalents 124,481$ 30,446$ -$ 154,927$
Accounts receivable for patient services—net of allowance for doubtful
accounts of $41,975 and $14,570 for RUMC and RCMC, respectively 221,205 55,883 - 277,088
Other accounts receivable 72,465 - (686) 71,779
Self-insurance trust — current portion 26,838 - - 26,838
Other current assets 37,856 13,849 - 51,705
Total current assets 482,845 100,178 (686) 582,337
ASSETS LIMITED AS TO USE AND INVESTMENTS:
Investments — less current portion 739,665 268,750 - 1,008,415
Limited as to use by donor or time restriction 473,677 10,763 - 484,440
Self-insurance trust - less current portion 103,432 - - 103,432
Total assets limited as to use and investments 1,316,774 279,513 - 1,596,287
PROPERTY AND EQUIPMENT—At cost:
Land and buildings 1,726,280 252,067 - 1,978,347
Equipment 536,850 144,109 - 680,959
Construction in progress 13,018 19,280 - 32,298
Total property and equipment—at cost 2,276,148 415,456 - 2,691,604
Less accumulated depreciation (1,101,667) (229,302) - (1,330,969)
Net property and equipment 1,174,481 186,154 - 1,360,635
OTHER ASSETS 42,311 16,515 (11,880) 46,946
TOTAL 3,016,411$ 582,360$ (12,566)$ 3,586,205$
LIABILITIES AND NET ASSETS
CURRENT LIABILITIES:
Accounts payable and accrued expenses 281,888$ 49,931$ (686)$ 331,133$
Estimated third-party settlements payable 133,099 51,164 - 184,263
Current portion of accrued liability under self-insurance programs 33,383 5,101 - 38,484
Current portion of long-term debt 8,810 2,292 - 11,102
Total current liabilities 457,180 108,488 (686) 564,982
LONG-TERM LIABILITIES:
Accrued liability under self-insurance programs— less current portion 176,094 21,506 - 197,600
Postretirement and pension benefits 138,139 - - 138,139
Long-term debt— less current portion 533,567 107,045 - 640,612
Line of credit - 14,594 - 14,594
Obligations under capital lease and deferred financing arrangements 22,360 - - 22,360
Other long-term liabilities 81,061 25,671 (11,880) 94,852
Total long-term liabilities 951,221 168,816 (11,880) 1,108,157
Total liabilities 1,408,401 277,304 (12,566) 1,673,139
NET ASSETS:
Unrestricted 1,006,838 294,116 - 1,300,954
Temporarily restricted 343,852 2,879 - 346,731
Permanently restricted 257,320 8,061 - 265,381
Total net assets 1,608,010 305,056 - 1,913,066
TOTAL 3,016,411$ 582,360$ (12,566)$ 3,586,205$
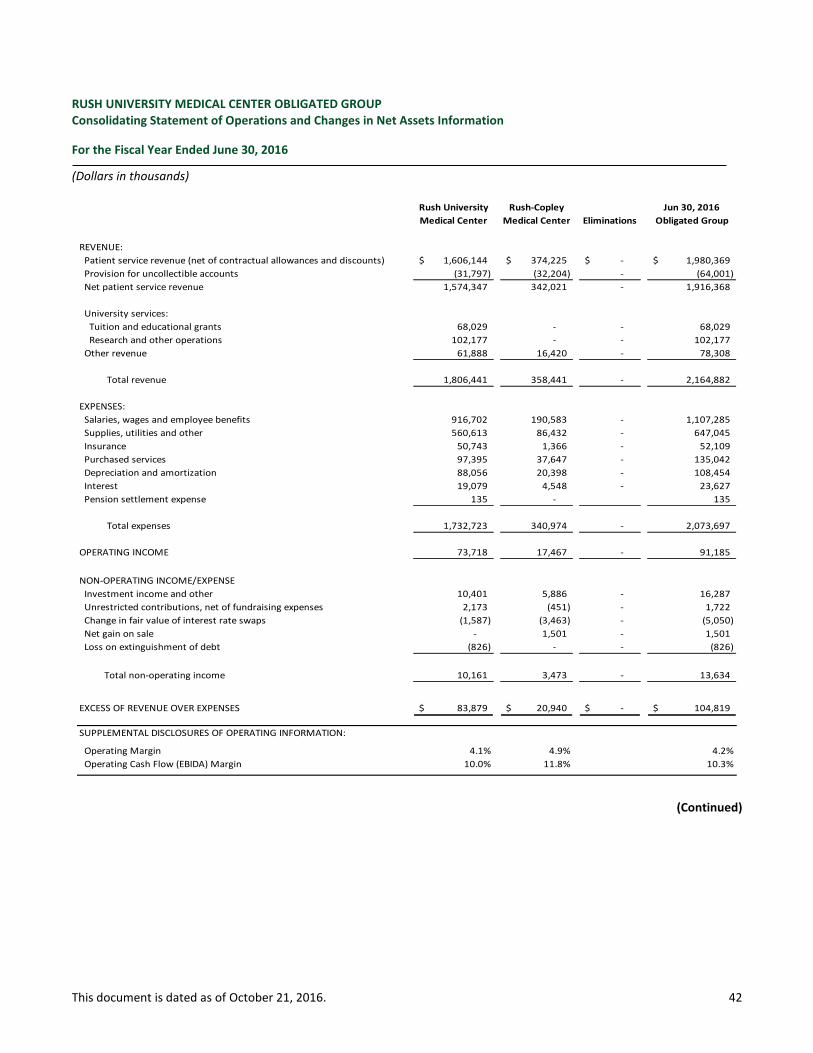
This document is dated as of October 21, 2016. 42
RUSH UNIVERSITY MEDICAL CENTER OBLIGATED GROUP Consolidating Statement of Operations and Changes in Net Assets Information
For the Fiscal Year Ended June 30, 2016
(Dollars in thousands)
(Continued)
Rush University Rush-Copley Jun 30, 2016
Medical Center Medical Center Eliminations Obligated Group
REVENUE:
Patient service revenue (net of contractual allowances and discounts) 1,606,144$ 374,225$ -$ 1,980,369$
Provision for uncollectible accounts (31,797) (32,204) - (64,001)
Net patient service revenue 1,574,347 342,021 - 1,916,368
University services:
Tuition and educational grants 68,029 - - 68,029
Research and other operations 102,177 - - 102,177
Other revenue 61,888 16,420 - 78,308
Total revenue 1,806,441 358,441 - 2,164,882
EXPENSES:
Salaries, wages and employee benefits 916,702 190,583 - 1,107,285
Supplies, utilities and other 560,613 86,432 - 647,045
Insurance 50,743 1,366 - 52,109
Purchased services 97,395 37,647 - 135,042
Depreciation and amortization 88,056 20,398 - 108,454
Interest 19,079 4,548 - 23,627
Pension settlement expense 135 - 135
Total expenses 1,732,723 340,974 - 2,073,697
OPERATING INCOME 73,718 17,467 - 91,185
NON-OPERATING INCOME/EXPENSE
Investment income and other 10,401 5,886 - 16,287
Unrestricted contributions, net of fundraising expenses 2,173 (451) - 1,722
Change in fair value of interest rate swaps (1,587) (3,463) - (5,050)
Net gain on sale - 1,501 - 1,501
Loss on extinguishment of debt (826) - - (826)
Total non-operating income 10,161 3,473 - 13,634
EXCESS OF REVENUE OVER EXPENSES 83,879$ 20,940$ -$ 104,819$
SUPPLEMENTAL DISCLOSURES OF OPERATING INFORMATION:
Operating Margin 4.1% 4.9% 4.2%
Operating Cash Flow (EBIDA) Margin 10.0% 11.8% 10.3%
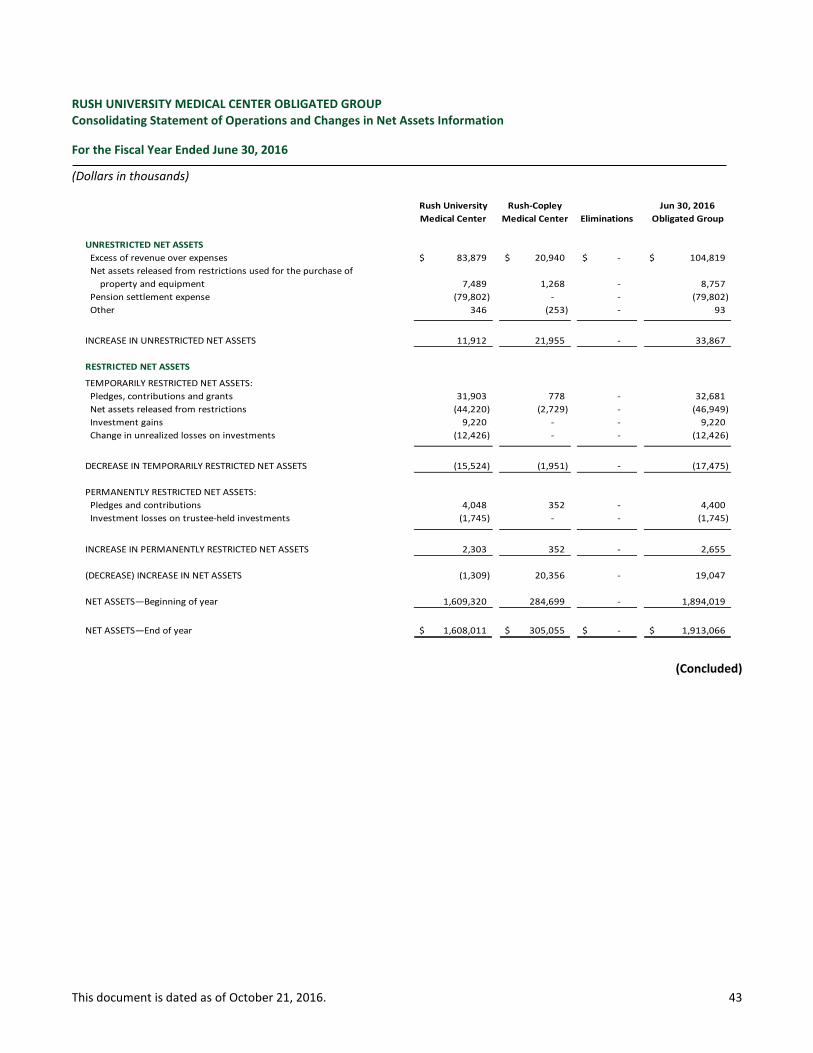
This document is dated as of October 21, 2016. 43
RUSH UNIVERSITY MEDICAL CENTER OBLIGATED GROUP Consolidating Statement of Operations and Changes in Net Assets Information
For the Fiscal Year Ended June 30, 2016
(Dollars in thousands)
(Concluded)
Rush University Rush-Copley Jun 30, 2016
Medical Center Medical Center Eliminations Obligated Group
UNRESTRICTED NET ASSETS
Excess of revenue over expenses 83,879$ 20,940$ -$ 104,819$
Net assets released from restrictions used for the purchase of
property and equipment 7,489 1,268 - 8,757
Pension settlement expense (79,802) - - (79,802)
Other 346 (253) - 93
INCREASE IN UNRESTRICTED NET ASSETS 11,912 21,955 - 33,867
RESTRICTED NET ASSETS
TEMPORARILY RESTRICTED NET ASSETS:
Pledges, contributions and grants 31,903 778 - 32,681
Net assets released from restrictions (44,220) (2,729) - (46,949)
Investment gains 9,220 - - 9,220
Change in unrealized losses on investments (12,426) - - (12,426)
DECREASE IN TEMPORARILY RESTRICTED NET ASSETS (15,524) (1,951) - (17,475)
PERMANENTLY RESTRICTED NET ASSETS:
Pledges and contributions 4,048 352 - 4,400
Investment losses on trustee-held investments (1,745) - - (1,745)
INCREASE IN PERMANENTLY RESTRICTED NET ASSETS 2,303 352 - 2,655
(DECREASE) INCREASE IN NET ASSETS (1,309) 20,356 - 19,047
NET ASSETS—Beginning of year 1,609,320 284,699 - 1,894,019
NET ASSETS—End of year 1,608,011$ 305,055$ -$ 1,913,066$
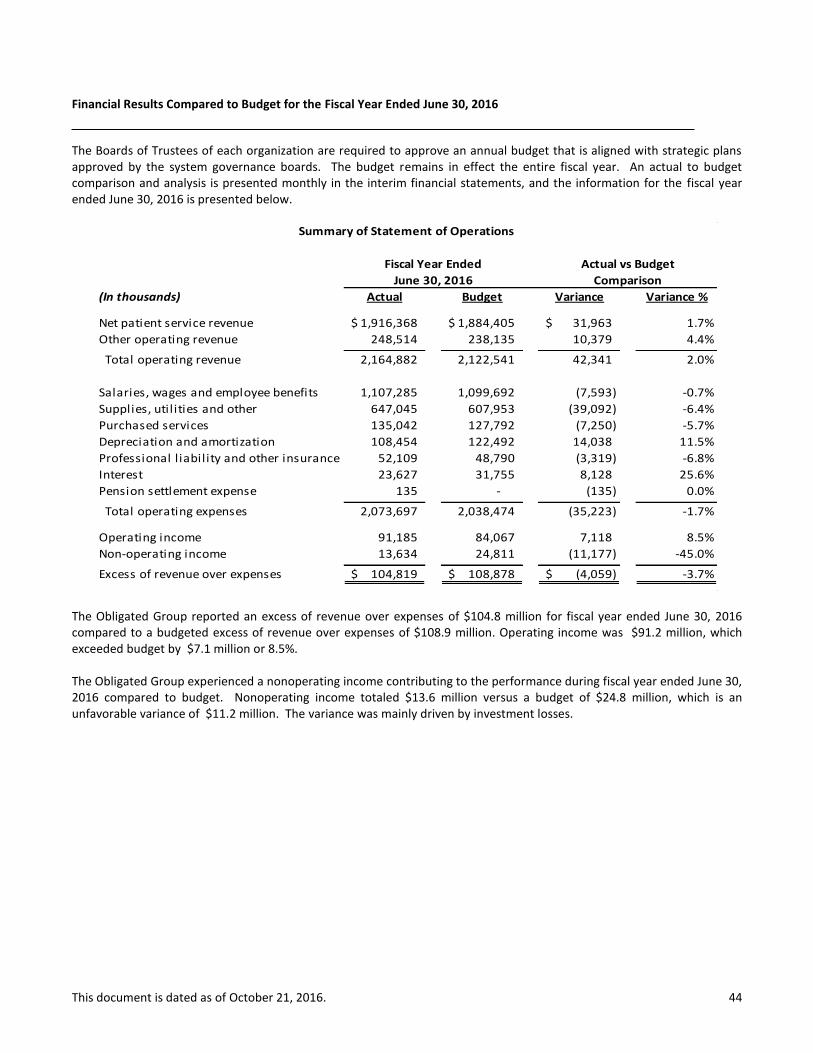
This document is dated as of October 21, 2016. 44
Financial Results Compared to Budget for the Fiscal Year Ended June 30, 2016
The Boards of Trustees of each organization are required to approve an annual budget that is aligned with strategic plans approved by the system governance boards. The budget remains in effect the entire fiscal year. An actual to budget comparison and analysis is presented monthly in the interim financial statements, and the information for the fiscal year ended June 30, 2016 is presented below.
The Obligated Group reported an excess of revenue over expenses of $104.8 million for fiscal year ended June 30, 2016 compared to a budgeted excess of revenue over expenses of $108.9 million. Operating income was $91.2 million, which exceeded budget by $7.1 million or 8.5%. The Obligated Group experienced a nonoperating income contributing to the performance during fiscal year ended June 30, 2016 compared to budget. Nonoperating income totaled $13.6 million versus a budget of $24.8 million, which is an unfavorable variance of $11.2 million. The variance was mainly driven by investment losses.
(In thousands) Actual Budget Variance Variance %
Net patient service revenue 1,916,368$ 1,884,405$ 31,963$ 1.7%
Other operating revenue 248,514 238,135 10,379 4.4%
Total operating revenue 2,164,882 2,122,541 42,341 2.0%
Salaries, wages and employee benefits 1,107,285 1,099,692 (7,593) -0.7%
Supplies, util ities and other 647,045 607,953 (39,092) -6.4%
Purchased services 135,042 127,792 (7,250) -5.7%
Depreciation and amortization 108,454 122,492 14,038 11.5%
Professional l iability and other insurance 52,109 48,790 (3,319) -6.8%
Interest 23,627 31,755 8,128 25.6%
Pension settlement expense 135 - (135) 0.0%
Total operating expenses 2,073,697 2,038,474 (35,223) -1.7%
Operating income 91,185 84,067 7,118 8.5%
Non-operating income 13,634 24,811 (11,177) -45.0%
Excess of revenue over expenses 104,819$ 108,878$ (4,059)$ -3.7%
Actual vs Budget
June 30, 2016 Comparison
Fiscal Year Ended
Summary of Statement of Operations

This document is dated as of October 21, 2016. 45
Covenant Compliance Certificate
The following calculations are pursuant to the financial covenants expressed in the Amended and Restated Master Trust Indenture dated February 1, 2015 for the Rush University Medical Center Obligated Group. (Dollars in Thousands)
[1] Maximum annual and historical debt service coverage ratios are calculated based on revenues available for debt service of the Obligated Group and exclude the change in fair value of interest rate swaps and unrealized gains and losses on unrestricted investments. Revenues available for debt service also excludes net gains and losses on sales, a component of nonoperating income.
I. MAXIMUM ANNUAL DEBT SERVICE COVERAGE RATIO:
Net income, excluding net gains and losses on sales [1] 121,325$
Add: Depreciation expense 108,454
Add: Interest expense 23,627
Revenues available for debt service 253,406$
Maximum annual debt service 45,299$
Revenues available for debt service 253,406$ 5.59
Maximum annual debt service 45,299$
Ratio exceeds 1.20 (please check) X
II. DAYS CASH ON HAND:
Unrestricted cash and cash equivalents 154,927$
Add: Unrestricted marketable securities 1,008,415
Unrestricted cash and marketable securities 1,163,342$
Number of days in period 366
Unrestricted cash and marketable securities x 366 425,783,061$
Total operating expenses 2,073,697$
Less: Depreciation expense (108,454)
Total operating expenses - depreciation expense 1,965,243$
Unrestricted cash and marketable securities x 366 425,783,061$ 216.7
Total operating expenses - depreciation expense 1,965,243$
Days exceed 65 (please check) X
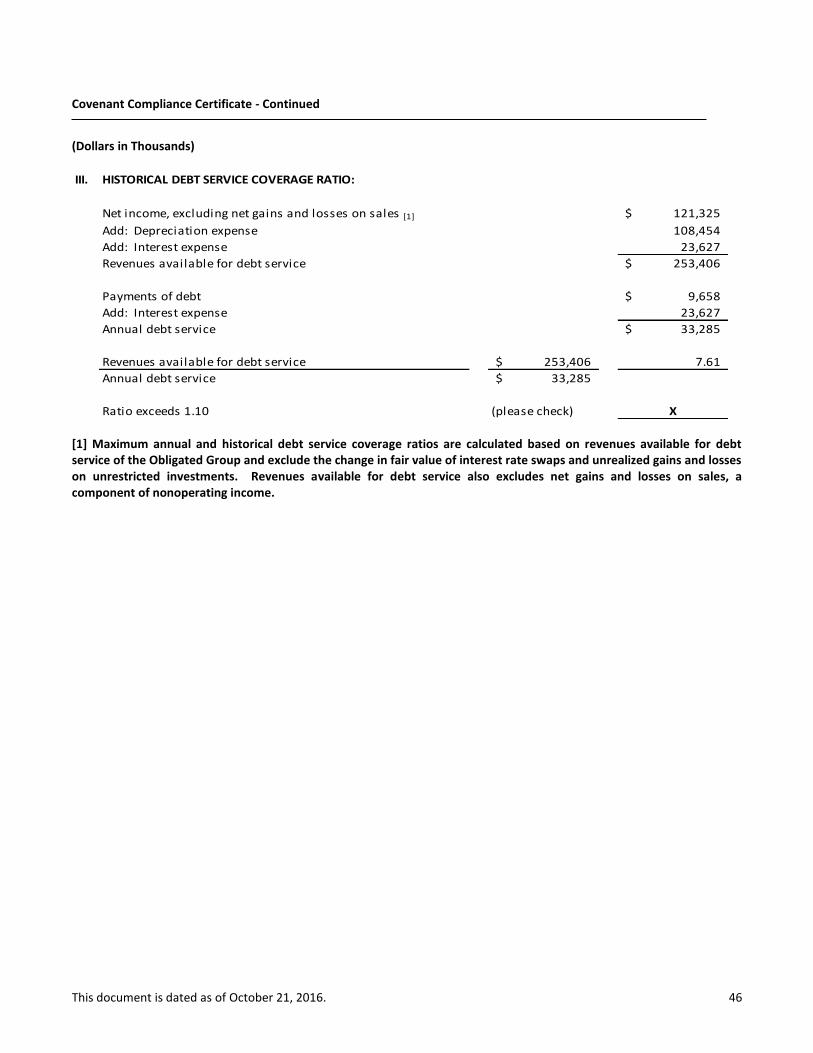
This document is dated as of October 21, 2016. 46
Covenant Compliance Certificate - Continued
(Dollars in Thousands)
[1] Maximum annual and historical debt service coverage ratios are calculated based on revenues available for debt service of the Obligated Group and exclude the change in fair value of interest rate swaps and unrealized gains and losses on unrestricted investments. Revenues available for debt service also excludes net gains and losses on sales, a component of nonoperating income.
III. HISTORICAL DEBT SERVICE COVERAGE RATIO:
Net income, excluding net gains and losses on sales [1] 121,325$
Add: Depreciation expense 108,454
Add: Interest expense 23,627
Revenues available for debt service 253,406$
Payments of debt 9,658$
Add: Interest expense 23,627
Annual debt service 33,285$
Revenues available for debt service 253,406$ 7.61
Annual debt service 33,285$
Ratio exceeds 1.10 (please check) X
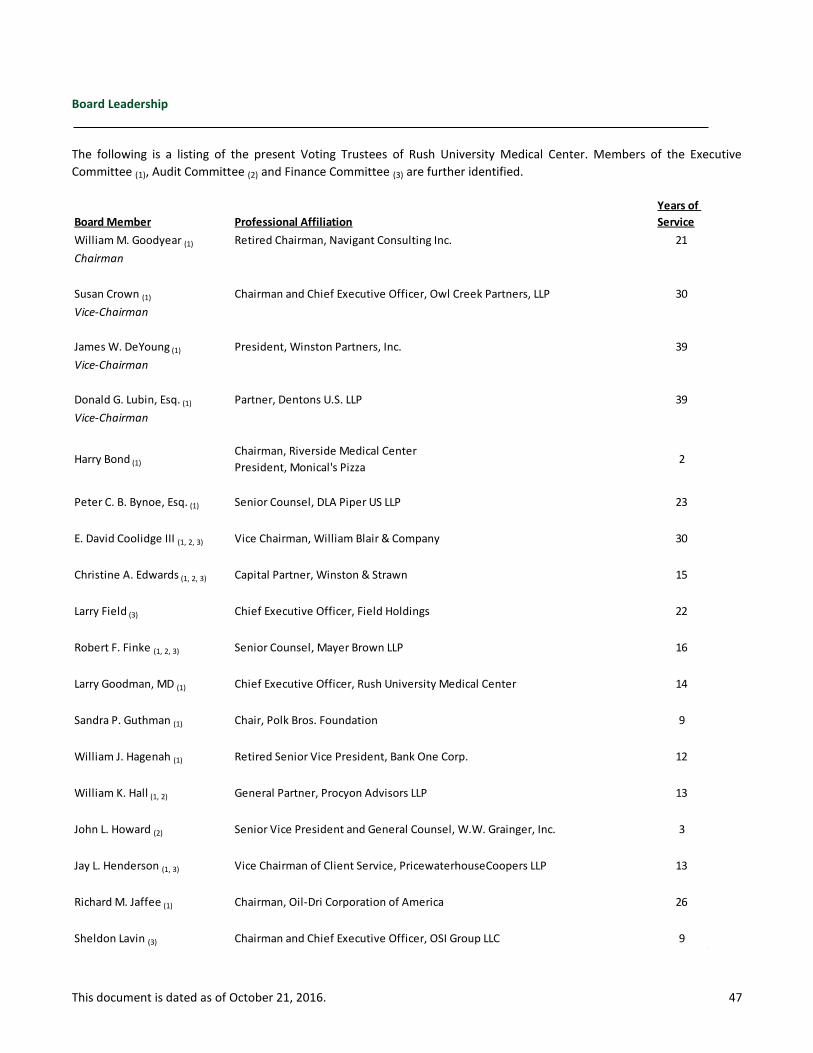
This document is dated as of October 21, 2016. 47
Board Leadership
The following is a listing of the present Voting Trustees of Rush University Medical Center. Members of the Executive
Committee (1), Audit Committee (2) and Finance Committee (3) are further identified.
Board Member Professional Affiliation
Years of
Service
William M. Goodyear (1) Retired Chairman, Navigant Consulting Inc. 21
Chairman
Susan Crown (1) Chairman and Chief Executive Officer, Owl Creek Partners, LLP 30
Vice-Chairman
James W. DeYoung (1) President, Winston Partners, Inc. 39
Vice-Chairman
Donald G. Lubin, Esq. (1) Partner, Dentons U.S. LLP 39
Vice-Chairman
Harry Bond (1)
Chairman, Riverside Medical Center
President, Monical's Pizza2
Peter C. B. Bynoe, Esq. (1) Senior Counsel, DLA Piper US LLP 23
E. David Coolidge III (1, 2, 3) Vice Chairman, William Blair & Company 30
Christine A. Edwards (1, 2, 3) Capital Partner, Winston & Strawn 15
Larry Field (3) Chief Executive Officer, Field Holdings 22
Robert F. Finke (1, 2, 3) Senior Counsel, Mayer Brown LLP 16
Larry Goodman, MD (1) Chief Executive Officer, Rush University Medical Center 14
Sandra P. Guthman (1) Chair, Polk Bros. Foundation 9
William J. Hagenah (1) Retired Senior Vice President, Bank One Corp. 12
William K. Hall (1, 2) General Partner, Procyon Advisors LLP 13
John L. Howard (2) Senior Vice President and General Counsel, W.W. Grainger, Inc. 3
Jay L. Henderson (1, 3) Vice Chairman of Client Service, PricewaterhouseCoopers LLP 13
Richard M. Jaffee (1) Chairman, Oil-Dri Corporation of America 26
Sheldon Lavin (3) Chairman and Chief Executive Officer, OSI Group LLC 9
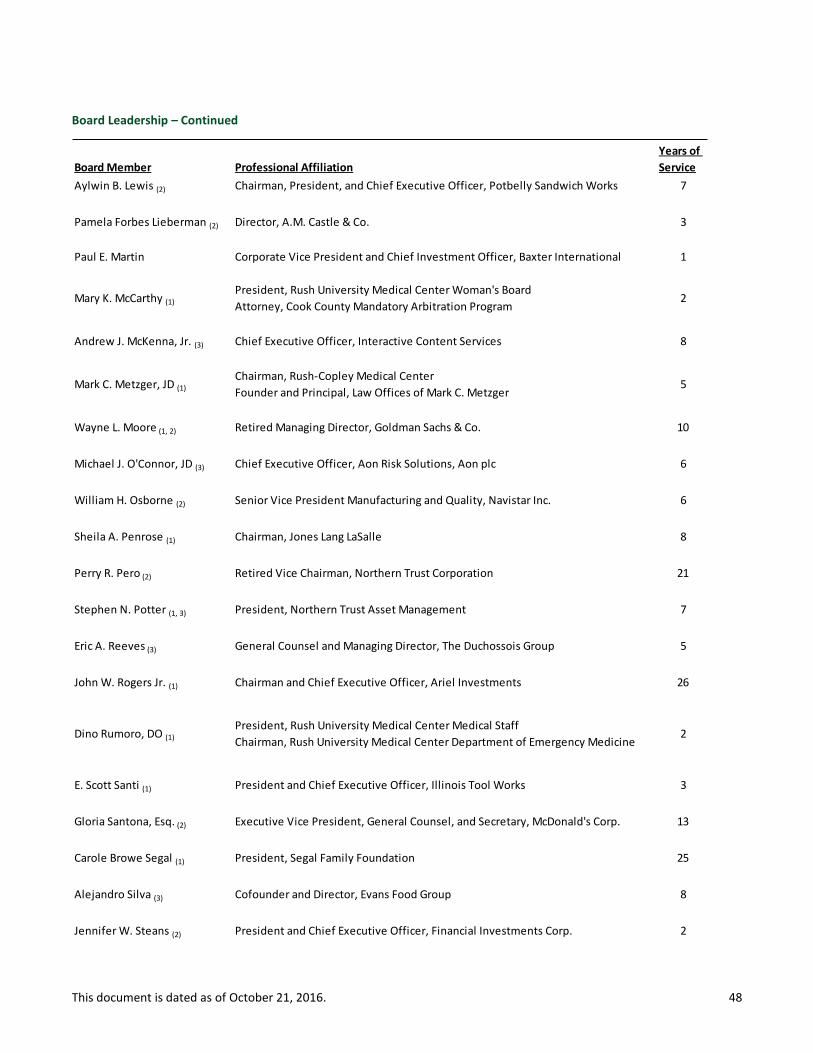
This document is dated as of October 21, 2016. 48
Board Leadership – Continued
Board Member Professional Affiliation
Years of
Service
Aylwin B. Lewis (2) Chairman, President, and Chief Executive Officer, Potbelly Sandwich Works 7
Pamela Forbes Lieberman (2) Director, A.M. Castle & Co. 3
Paul E. Martin Corporate Vice President and Chief Investment Officer, Baxter International 1
Mary K. McCarthy (1)
President, Rush University Medical Center Woman's Board
Attorney, Cook County Mandatory Arbitration Program2
Andrew J. McKenna, Jr. (3) Chief Executive Officer, Interactive Content Services 8
Mark C. Metzger, JD (1)
Chairman, Rush-Copley Medical Center
Founder and Principal, Law Offices of Mark C. Metzger5
Wayne L. Moore (1, 2) Retired Managing Director, Goldman Sachs & Co. 10
Michael J. O'Connor, JD (3) Chief Executive Officer, Aon Risk Solutions, Aon plc 6
William H. Osborne (2) Senior Vice President Manufacturing and Quality, Navistar Inc. 6
Sheila A. Penrose (1) Chairman, Jones Lang LaSalle 8
Perry R. Pero (2) Retired Vice Chairman, Northern Trust Corporation 21
Stephen N. Potter (1, 3) President, Northern Trust Asset Management 7
Eric A. Reeves (3) General Counsel and Managing Director, The Duchossois Group 5
John W. Rogers Jr. (1) Chairman and Chief Executive Officer, Ariel Investments 26
Dino Rumoro, DO (1)
President, Rush University Medical Center Medical Staff
Chairman, Rush University Medical Center Department of Emergency Medicine2
E. Scott Santi (1) President and Chief Executive Officer, Illinois Tool Works 3
Gloria Santona, Esq. (2) Executive Vice President, General Counsel, and Secretary, McDonald's Corp. 13
Carole Browe Segal (1) President, Segal Family Foundation 25
Alejandro Silva (3) Cofounder and Director, Evans Food Group 8
Jennifer W. Steans (2) President and Chief Executive Officer, Financial Investments Corp. 2

This document is dated as of October 21, 2016. 49
Board Leadership – Continued
Board Member Professional Affiliation
Years of
Service
Jonathan W. Thayer (3) Senior Executive Vice President and Chief Financial Officer, Exelon Corp. 2
John R. Willis (1) Retired Managing Partner, Willis Stein & Partners 16
James A. Bell Retired Corporate President and Chief Financial Officer, The Boeing Corporation 5
Matthew Boler President and Chief Executive Officer, The Boler Company 3
John L. Brennan Head of Private Wealth Management, William Blair & Co. 8
Marca Bristo Co-Founder, President, and Chief Executive Officer, Access Living of Metro Chicago 8
Karen B. Case President of Commercial Real Estate, The PrivateBank 3
Kelly McNamara Corley Executive Vice President and General Counsel, Discover Financial Services 2
Bruce W. DienstVice Chair, Rush-Copley Medical Center
President and Chief Executive Officer, Simpson Technologies Corp.3
William A. Downe President and Chief Executive Officer, BMO Financial Group 6
Bruce W. Duncan President and Chief Executive Officer, First Industrial Realty Trust, Inc. 10
Francesca Maher Edwardson Chief Executive Officer, American Red Cross of Chicago and Northern Illinois 4
Charles L. Evans, PhD President and Chief Executive Officer, Federal Reserve Bank of Chicago 6
William J. Friend Founder and Managing Partner, Core Capital Management LLC 18
Ronald J. Gidwitz Partner, GCG Partners 23
H. John Gilbertson Retired Managing Partner, Goldman Sachs & Co. 5
Steven Gitelis, MDImmediate Past President, Rush University Medical Center Medical Staff
Vice Chair, Rush University Medical Center Department of Orthopedic Surgery3
Christie Hefner Chairman, Hatch Beauty 23
Marcie B. Hemmelstein President, Carylon Foundation 13
Marvin J. Herb Chairman, Herbco LLC 20

This document is dated as of October 21, 2016. 50
Board Leadership – Continued
Board Member Professional Affiliation
Years of
Service
John W. Higgins Chairman and Chief Executive Officer, Higgins Development Partners 13
David W. Hines, MD
Immediate Past President, Alumni Association of Rush Medical College
Member Management Committee, Metro Infectious Disease Consultants,
LLC/RMC
5
Jerald W. HoekstraVice Chair, Riverside Healthcare
Senior Partner, Hoekstra Farms LLC8
Ron Huberman Executive Chair, TeacherMatch LLC 8
Anthony D. Ivankovich, MD
Past President, Rush University Medical Center Medical Staff
Chairman Emeritus, Rush University Medical Center Department of
Anesthesiology
11
P. Kasper Jakobsen President and Chief Executive Officer, Mead Johnson Nutrition 4
John P. Keller Chairman, Keller Group Inc. 32
Catherine J. King Immediate Past President, Rush University Medical Center Woman's Board 4
Kip Kirkpatrick Co-Chief Executive Officer, The Vistria Group 8
Fred A. Krehbiel Partner, KF Partners, LLC 32
Anthony M. Kotin, MDPresident, Rush Medical College Alumni Association
Chief Medical Officer, ComplexCare Solutions3
The Rt. Rev. Jeffrey D. Lee Bishop of Chicago, Episcopal Diocese of Chicago 7
Susan R. LichtensteinSenior Vice President of Corporate Affairs and Chief Legal Officer, Hill-Rom
Holdings, Inc.5
Todd LillibridgePresident and Chief Executive Officer, Lillibridge Healthcare Services, Inc.
Executive Vice President of Medical Property Operations, Ventas2
Robert A. Mariano Chairman, President, and Chief Executive Officer, Roundy's Supermarkets Inc. 4
Gary E. McCullough Chielf Executive Officer, ARI Packaging 5
James S. Metcalf Chairman, President, and Chief Executive Officer, USG Corp. 3
William A. Mynatt, Jr. Chairman and Chief Executive Officer, Dovenmuehle Mortgage Inc. 2
Marcia P. Murphy, DNPPresident, RPSL Nurses Alumni Association
Faculty, Rush University College of Nursing2
Martin H. Nesbitt Co-Chief Executive Officer, The Vistria Group 4
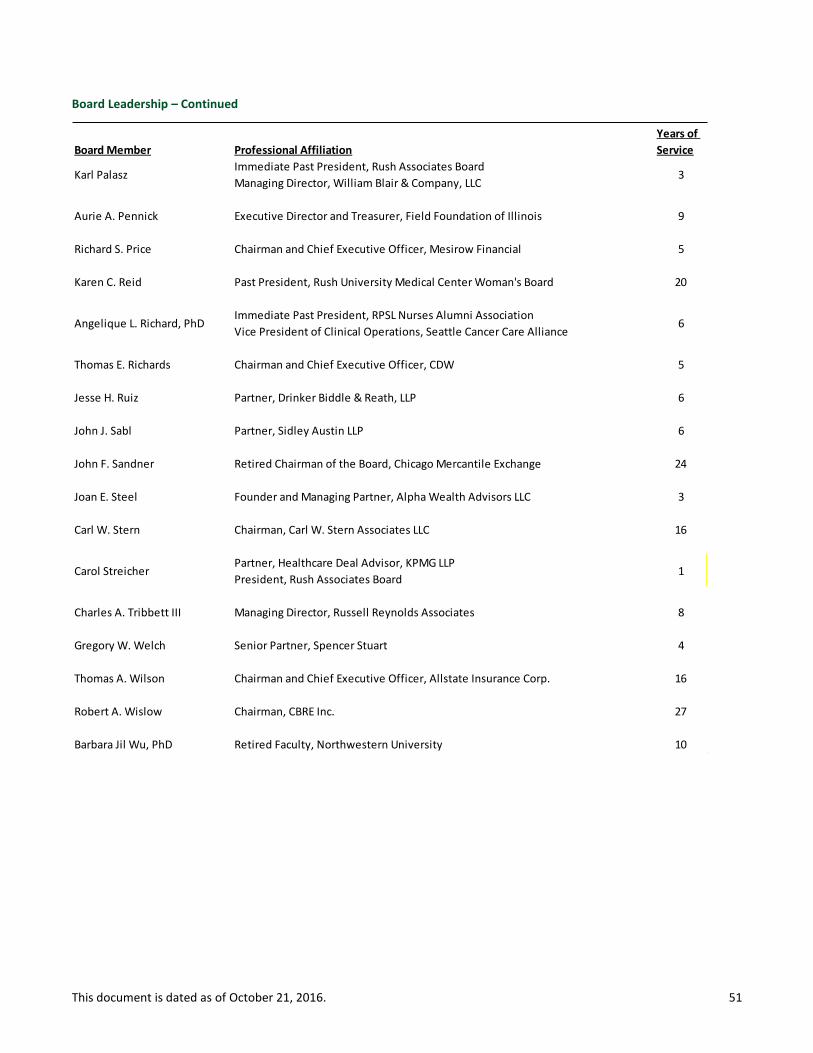
This document is dated as of October 21, 2016. 51
Board Leadership – Continued
Board Member Professional Affiliation
Years of
Service
Karl PalaszImmediate Past President, Rush Associates Board
Managing Director, William Blair & Company, LLC3
Aurie A. Pennick Executive Director and Treasurer, Field Foundation of Illinois 9
Richard S. Price Chairman and Chief Executive Officer, Mesirow Financial 5
Karen C. Reid Past President, Rush University Medical Center Woman's Board 20
Angelique L. Richard, PhDImmediate Past President, RPSL Nurses Alumni Association
Vice President of Clinical Operations, Seattle Cancer Care Alliance6
Thomas E. Richards Chairman and Chief Executive Officer, CDW 5
Jesse H. Ruiz Partner, Drinker Biddle & Reath, LLP 6
John J. Sabl Partner, Sidley Austin LLP 6
John F. Sandner Retired Chairman of the Board, Chicago Mercantile Exchange 24
Joan E. Steel Founder and Managing Partner, Alpha Wealth Advisors LLC 3
Carl W. Stern Chairman, Carl W. Stern Associates LLC 16
Carol Streicher Partner, Healthcare Deal Advisor, KPMG LLP
President, Rush Associates Board1
Charles A. Tribbett III Managing Director, Russell Reynolds Associates 8
Gregory W. Welch Senior Partner, Spencer Stuart 4
Thomas A. Wilson Chairman and Chief Executive Officer, Allstate Insurance Corp. 16
Robert A. Wislow Chairman, CBRE Inc. 27
Barbara Jil Wu, PhD Retired Faculty, Northwestern University 10
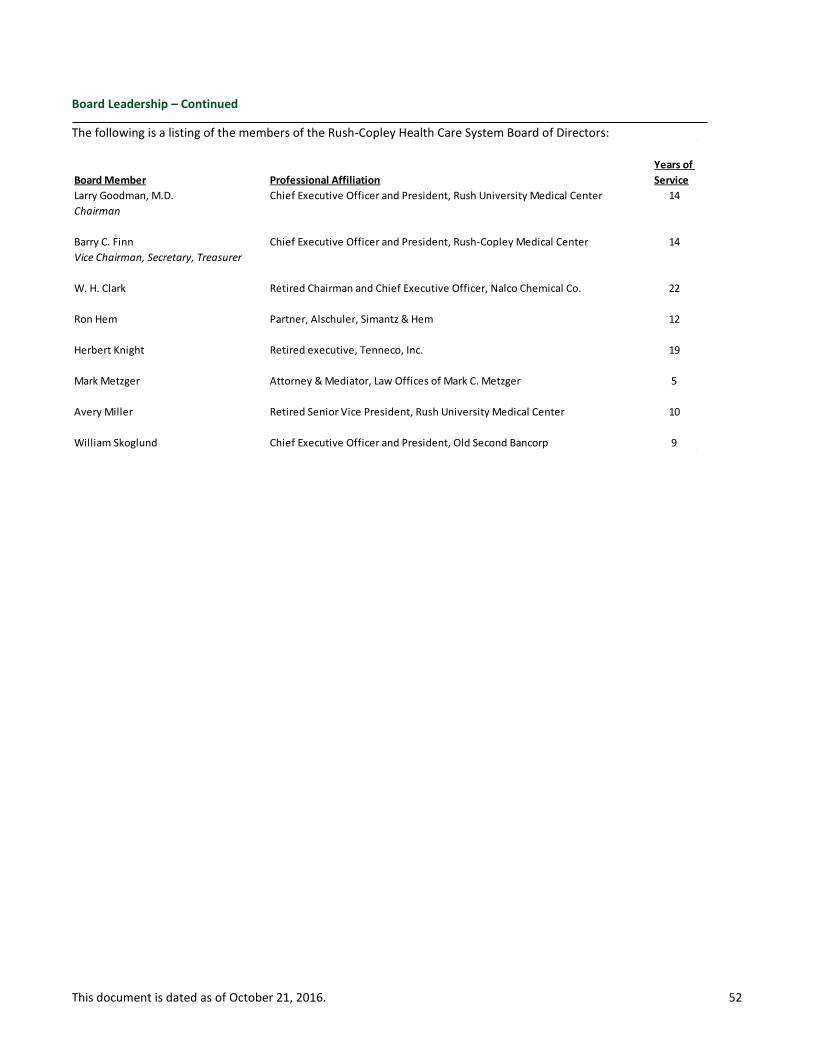
This document is dated as of October 21, 2016. 52
Board Leadership – Continued
The following is a listing of the members of the Rush-Copley Health Care System Board of Directors:
Board Member Professional Affiliation
Years of
Service
Larry Goodman, M.D. Chief Executive Officer and President, Rush University Medical Center 14
Chairman
Barry C. Finn Chief Executive Officer and President, Rush-Copley Medical Center 14
Vice Chairman, Secretary, Treasurer
W. H. Clark Retired Chairman and Chief Executive Officer, Nalco Chemical Co. 22
Ron Hem Partner, Alschuler, Simantz & Hem 12
Herbert Knight Retired executive, Tenneco, Inc. 19
Mark Metzger Attorney & Mediator, Law Offices of Mark C. Metzger 5
Avery Miller Retired Senior Vice President, Rush University Medical Center 10
William Skoglund Chief Executive Officer and President, Old Second Bancorp 9
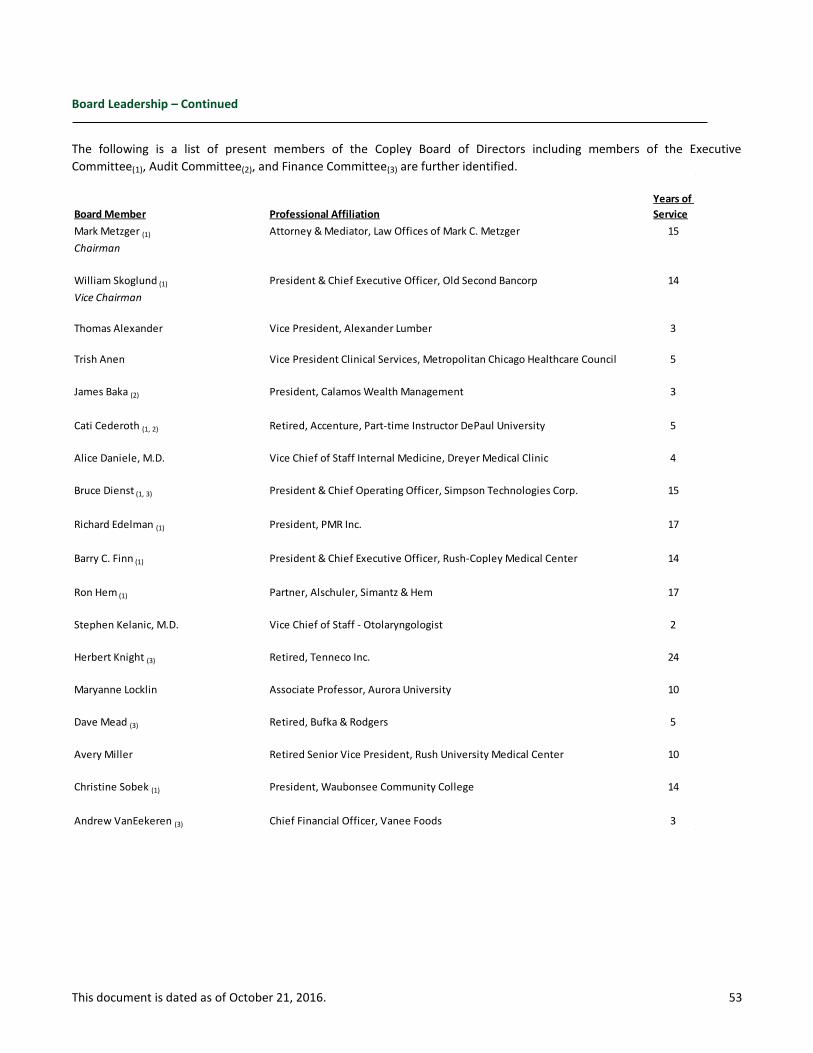
This document is dated as of October 21, 2016. 53
Board Leadership – Continued
The following is a list of present members of the Copley Board of Directors including members of the Executive
Committee(1), Audit Committee(2), and Finance Committee(3) are further identified.
Board Member Professional Affiliation
Years of
Service
Mark Metzger (1) Attorney & Mediator, Law Offices of Mark C. Metzger 15
Chairman
William Skoglund (1) President & Chief Executive Officer, Old Second Bancorp 14
Vice Chairman
Thomas Alexander Vice President, Alexander Lumber 3
Trish Anen Vice President Clinical Services, Metropolitan Chicago Healthcare Council 5
James Baka (2) President, Calamos Wealth Management 3
Cati Cederoth (1, 2) Retired, Accenture, Part-time Instructor DePaul University 5
Alice Daniele, M.D. Vice Chief of Staff Internal Medicine, Dreyer Medical Clinic 4
Bruce Dienst (1, 3) President & Chief Operating Officer, Simpson Technologies Corp. 15
Richard Edelman (1) President, PMR Inc. 17
Barry C. Finn (1) President & Chief Executive Officer, Rush-Copley Medical Center 14
Ron Hem (1) Partner, Alschuler, Simantz & Hem 17
Stephen Kelanic, M.D. Vice Chief of Staff - Otolaryngologist 2
Herbert Knight (3) Retired, Tenneco Inc. 24
Maryanne Locklin Associate Professor, Aurora University 10
Dave Mead (3) Retired, Bufka & Rodgers 5
Avery Miller Retired Senior Vice President, Rush University Medical Center 10
Christine Sobek (1) President, Waubonsee Community College 14
Andrew VanEekeren (3) Chief Financial Officer, Vanee Foods 3
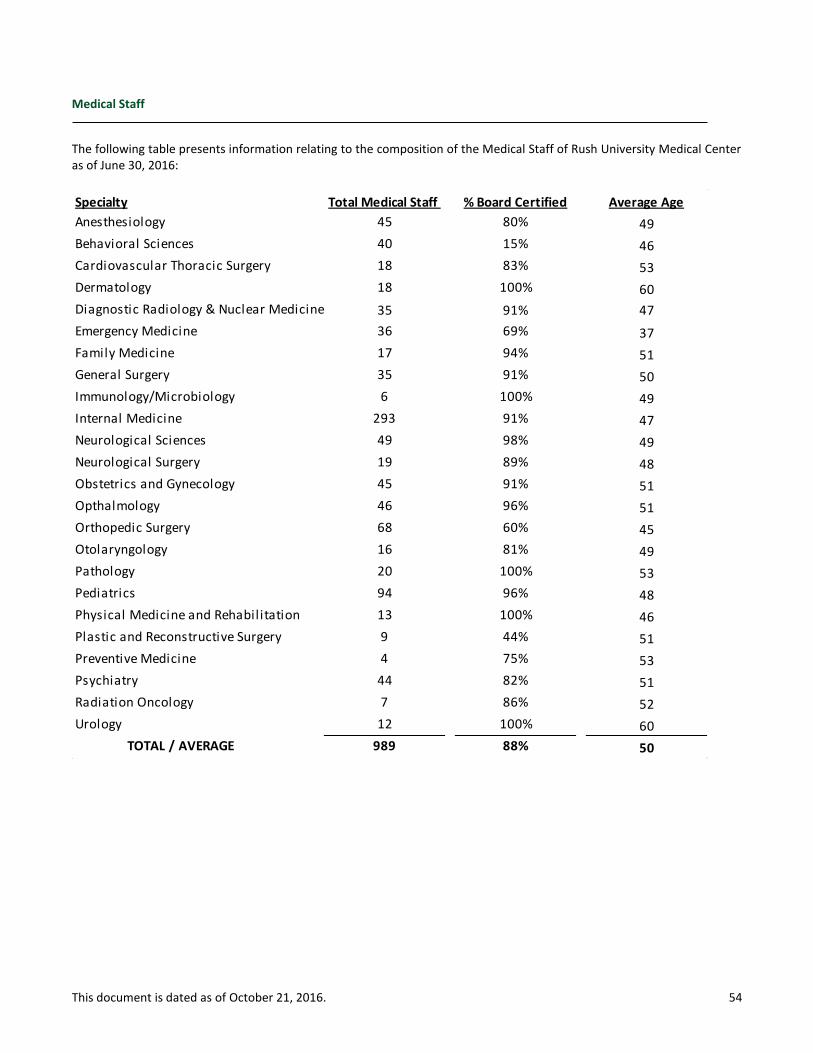
This document is dated as of October 21, 2016. 54
Medical Staff
The following table presents information relating to the composition of the Medical Staff of Rush University Medical Center as of June 30, 2016:
Specialty Total Medical Staff % Board Certified Average Age
Anesthesiology 45 80% 49
Behavioral Sciences 40 15% 46
Cardiovascular Thoracic Surgery 18 83% 53
Dermatology 18 100% 60
Diagnostic Radiology & Nuclear Medicine 35 91% 47
Emergency Medicine 36 69% 37
Family Medicine 17 94% 51
General Surgery 35 91% 50
Immunology/Microbiology 6 100% 49
Internal Medicine 293 91% 47
Neurological Sciences 49 98% 49
Neurological Surgery 19 89% 48
Obstetrics and Gynecology 45 91% 51
Opthalmology 46 96% 51
Orthopedic Surgery 68 60% 45
Otolaryngology 16 81% 49
Pathology 20 100% 53
Pediatrics 94 96% 48
Physical Medicine and Rehabilitation 13 100% 46
Plastic and Reconstructive Surgery 9 44% 51
Preventive Medicine 4 75% 53
Psychiatry 44 82% 51
Radiation Oncology 7 86% 52
Urology 12 100% 60
TOTAL / AVERAGE 989 88% 50
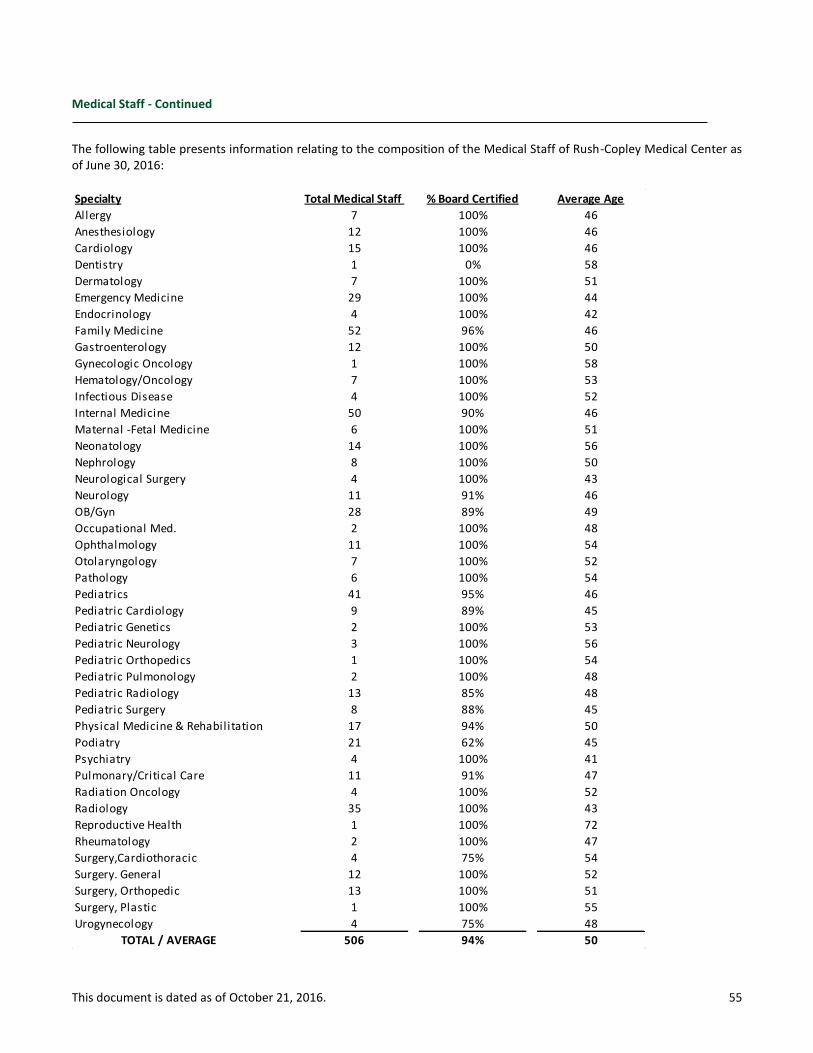
This document is dated as of October 21, 2016. 55
Medical Staff - Continued
The following table presents information relating to the composition of the Medical Staff of Rush-Copley Medical Center as of June 30, 2016:
Specialty Total Medical Staff % Board Certified Average Age
Allergy 7 100% 46
Anesthesiology 12 100% 46
Cardiology 15 100% 46
Dentistry 1 0% 58
Dermatology 7 100% 51
Emergency Medicine 29 100% 44
Endocrinology 4 100% 42
Family Medicine 52 96% 46
Gastroenterology 12 100% 50
Gynecologic Oncology 1 100% 58
Hematology/Oncology 7 100% 53
Infectious Disease 4 100% 52
Internal Medicine 50 90% 46
Maternal -Fetal Medicine 6 100% 51
Neonatology 14 100% 56
Nephrology 8 100% 50
Neurological Surgery 4 100% 43
Neurology 11 91% 46
OB/Gyn 28 89% 49
Occupational Med. 2 100% 48
Ophthalmology 11 100% 54
Otolaryngology 7 100% 52
Pathology 6 100% 54
Pediatrics 41 95% 46
Pediatric Cardiology 9 89% 45
Pediatric Genetics 2 100% 53
Pediatric Neurology 3 100% 56
Pediatric Orthopedics 1 100% 54
Pediatric Pulmonology 2 100% 48
Pediatric Radiology 13 85% 48
Pediatric Surgery 8 88% 45
Physical Medicine & Rehabilitation 17 94% 50
Podiatry 21 62% 45
Psychiatry 4 100% 41
Pulmonary/Critical Care 11 91% 47
Radiation Oncology 4 100% 52
Radiology 35 100% 43
Reproductive Health 1 100% 72
Rheumatology 2 100% 47
Surgery,Cardiothoracic 4 75% 54
Surgery. General 12 100% 52
Surgery, Orthopedic 13 100% 51
Surgery, Plastic 1 100% 55
Urogynecology 4 75% 48
TOTAL / AVERAGE 506 94% 50
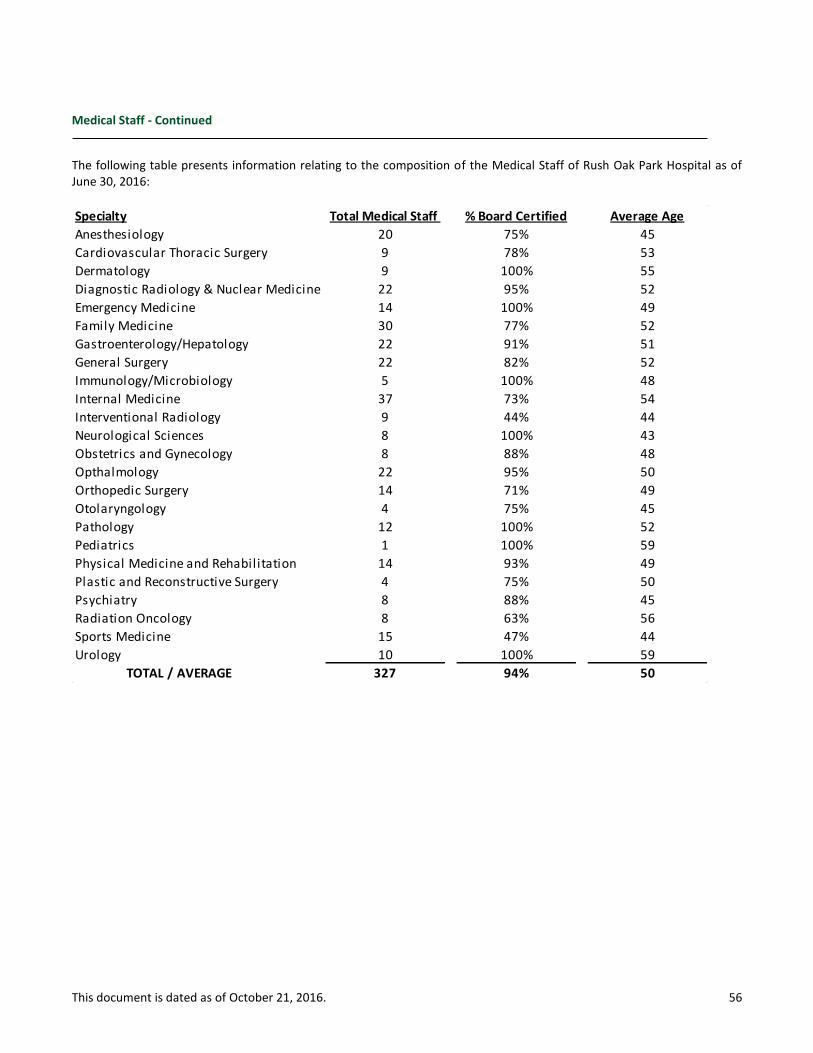
This document is dated as of October 21, 2016. 56
Medical Staff - Continued
The following table presents information relating to the composition of the Medical Staff of Rush Oak Park Hospital as of June 30, 2016:
Specialty Total Medical Staff % Board Certified Average Age
Anesthesiology 20 75% 45
Cardiovascular Thoracic Surgery 9 78% 53
Dermatology 9 100% 55
Diagnostic Radiology & Nuclear Medicine 22 95% 52
Emergency Medicine 14 100% 49
Family Medicine 30 77% 52
Gastroenterology/Hepatology 22 91% 51
General Surgery 22 82% 52
Immunology/Microbiology 5 100% 48
Internal Medicine 37 73% 54
Interventional Radiology 9 44% 44
Neurological Sciences 8 100% 43
Obstetrics and Gynecology 8 88% 48
Opthalmology 22 95% 50
Orthopedic Surgery 14 71% 49
Otolaryngology 4 75% 45
Pathology 12 100% 52
Pediatrics 1 100% 59
Physical Medicine and Rehabilitation 14 93% 49
Plastic and Reconstructive Surgery 4 75% 50
Psychiatry 8 88% 45
Radiation Oncology 8 63% 56
Sports Medicine 15 47% 44
Urology 10 100% 59
TOTAL / AVERAGE 327 94% 50