rural professionals in 2025: surviving or thriving? •background and recap •keepad response...
TRANSCRIPT
Rural Professionals in 2025: Surviving or Thriving?
1

Headlines in the Farmers Weekly?
2

Changes are afoot, the key to thriving will be planning for the future, not the past
3

Key messages
• Rural Professionals:
– Got to start thinking about a changing climate
– This issue is as important as any other
4
Outline • BACKGROUND AND RECAP • KEEPAD RESPONSE • RISK AND PROBABILITY • FARM BUSINESS RESILIENCE • FARMER RESPONSE (VIDEO) • SUSTAINABLE LAND MANAGEMENT REPORT • NZIPIM – PROFESSIONALISM AND FUTURE PROOFING • ON-LINE TOOLS • SCIENCE SOUND BITES • SUMMARY AND SURVEY
5

• BACKGROUND AND RECAP • RISK AND PROBABILITY
• FARM BUSINESS RESILIENCE
• SUSTAINABLE LAND MANAGEMENT REPORT
• FARMER RESPONSE (VIDEO)
• NZIPIM – PROFESSIONALISM AND FUTURE PROOFING
• ON-LINE TOOLS
• SCIENCE SOUND BITES
• SUMMARY AND SURVEY
6
• This workshop builds on information and discussion from last round of workshops
• May not be a sexy subject but it is relevant and of increasing importance
• Ag sector indicating a goal of 30% reduction in GHG emissions intensity by 2030 while growing at 2% each year.
• Requires some action by everybody
7

ReCap
• NZ is in a relatively good position (cf Aus for example) because of our temperate, maritime climate.
• The biggest threat is the expected higher level of variability which production systems will need to cope with.
8

Uneven Challenge: Climate Resilience
Source: Cline 2007, Graphics: UNEP/Grid Arendal
Slides courtesy of Dr Andy Reisinger, Dep. Dir. NZAGRC 9

2030-2049 compared with 1980 -1999 More biomass at lower quality with sharper seasons
% Change in seasonal DM production
10

ReCap
• Develop risk management strategies
– Some tools
• A3 planner
• Regional summaries
• Internet links
• Case studies available
11

A3 Farm business Resilience Planner
12

Effects and Impacts Summaries by
Region
13

From NZAGRC fact sheet #2
K k
Global links between NZ and Climate Change
14

• BACKGROUND AND RECAP • KEEPAD RESPONSE • RISK AND PROBABILITY • FARM BUSINESS RESILIENCE • SUSTAINABLE LAND MANAGEMENT REPORT • FARMER RESPONSE (VIDEO) • NZIPIM – PROFESSIONALISM AND FUTURE
PROOFING • ON-LINE TOOLS • SCIENCE SOUND BITES • SUMMARY AND SURVEY
15

Who is the real hero of Star Wars?
1 2 3 4 5 6
0% 0%
15%
8%
69%
8%
1. Gandalf
2. Bruce Willis
3. Darth Vader
4. Luke Skywalker
5. Chewbacca
6. R2D2
16

What sector do you work in?
9%
7%
11%
39%
20%
15%
17
1. Dairy
2. Sheep and Beef
3. Dairy, S&B, Deer
4. Horticulture
5. Arable
6. Forestry

What role do you have?
1 2 3 4 5 6
33%
18%
33%
3%
9%
4%
18
1. Consultant
2. Finance
3. Insurance
4. Technical Sales
5. Industry Rep
6. Council

NZIPIM membership?
1. Member
2. Registered Consultant
3. None
19
1 2 3
30%
62%
8%

How Good is your memory? What were the metrics 30 years ago?
Where are we now? Where will we be in 30 years time?
• Production
• Stocking rate
• Costs
20
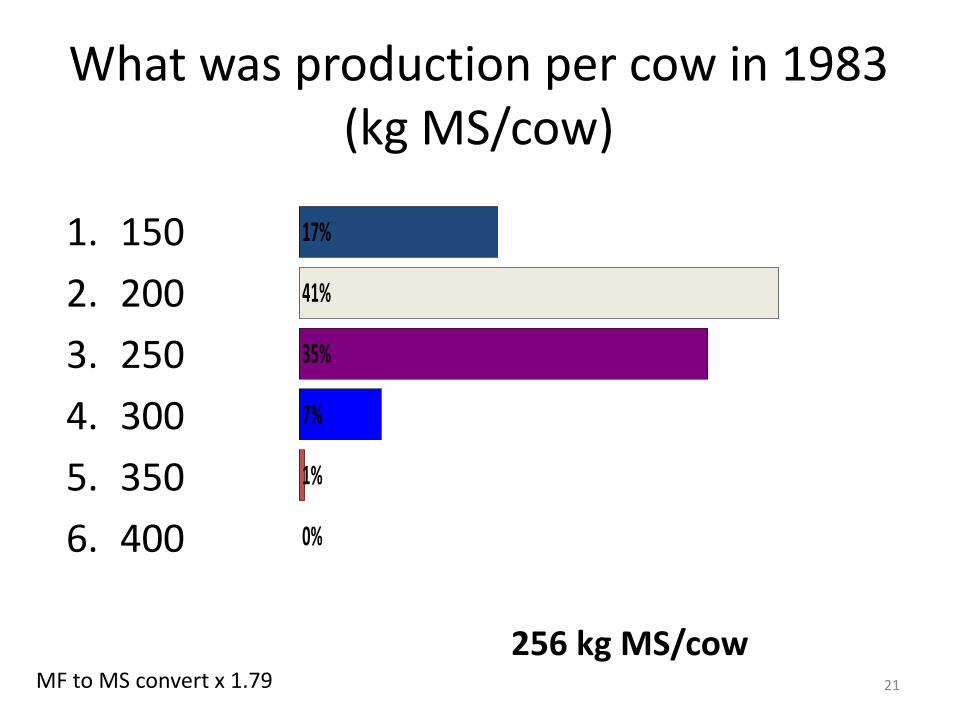
What was production per cow in 1983 (kg MS/cow)
0%
1%
7%
35%
41%
17%
21 MF to MS convert x 1.79
256 kg MS/cow
1. 150
2. 200
3. 250
4. 300
5. 350
6. 400
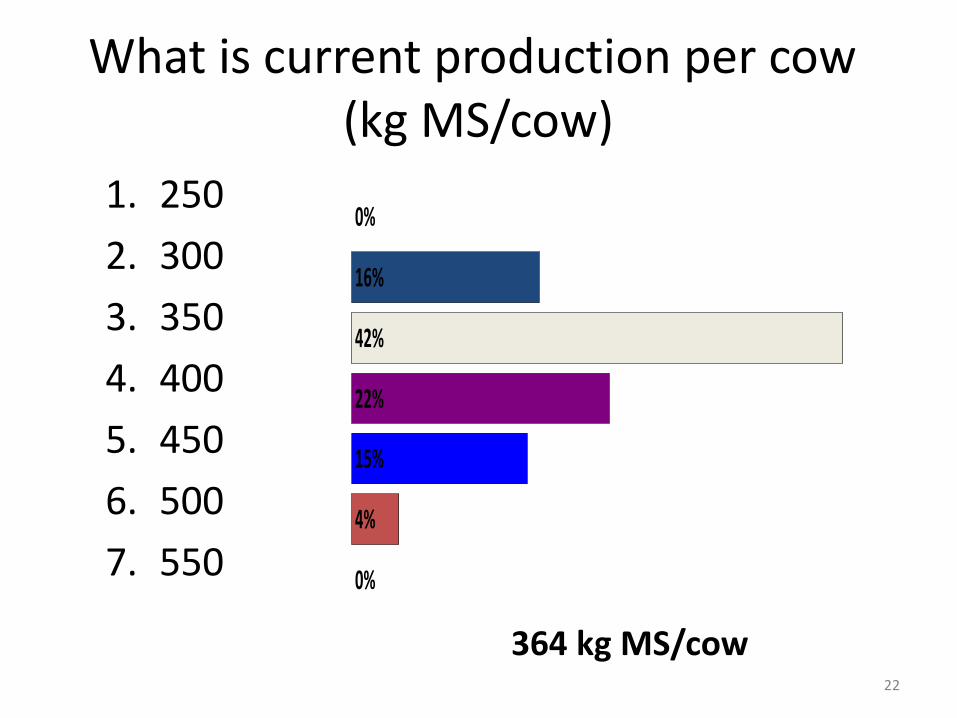
What is current production per cow (kg MS/cow)
0%
4%
15%
22%
42%
16%
0%
22
364 kg MS/cow
1. 250
2. 300
3. 350
4. 400
5. 450
6. 500
7. 550
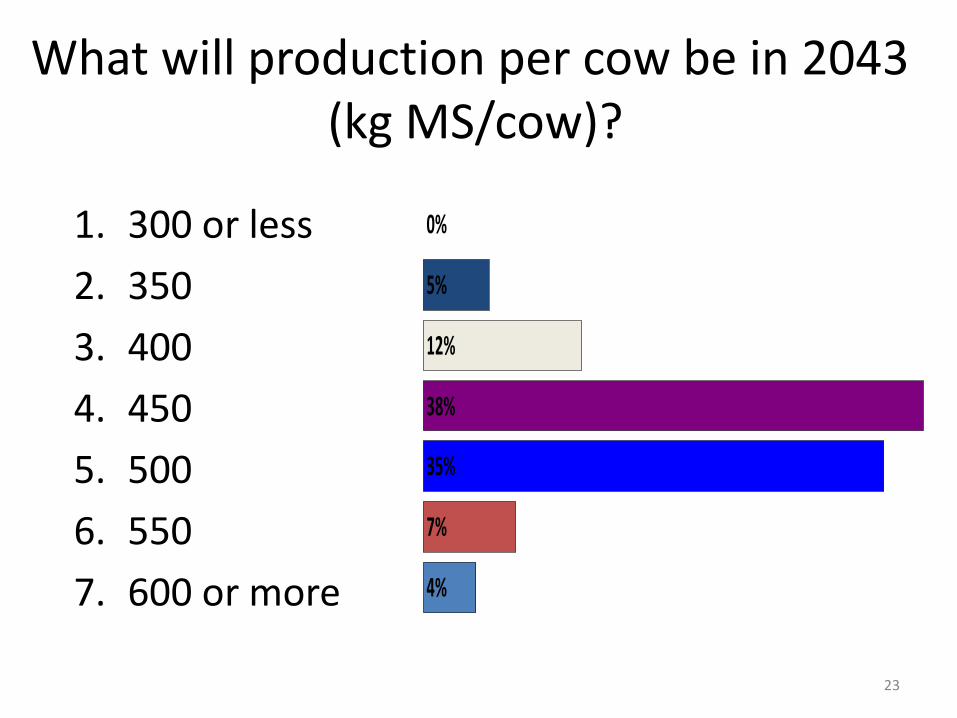
What will production per cow be in 2043 (kg MS/cow)?
4%
7%
35%
38%
12%
5%
0%
23
1. 300 or less
2. 350
3. 400
4. 450
5. 500
6. 550
7. 600 or more

What was lambing % in 1983
0%
1%
5%
34%
38%
23%
0%1. 70%
2. 80%
3. 90%
4. 100%
5. 110%
6. 120%
7. 130%
24
101 %

What is current lambing %
0%
2%
5%
20%
59%
14%
0%
25
129 %
1. 100%
2. 110%
3. 120%
4. 130%
5. 140%
6. 150%
7. 160%

What lambing % be in 2043?
0%
0%
1%
2%
13%
38%
38%
8%
1%
26
1. 120%
2. 130%
3. 140%
4. 150%
5. 160%
6. 170%
7. 180%
8. 190%
9. 200%
• BACKGROUND AND RECAP • KEEPAD RESPONSE • RISK AND PROBABILITY • FARM BUSINESS RESILIENCE • SUSTAINABLE LAND MANAGEMENT REPORT • FARMER RESPONSE (VIDEO) • NZIPIM – PROFESSIONALISM AND FUTURE
PROOFING • ON-LINE TOOLS • SCIENCE SOUND BITES • SUMMARY AND SURVEY
27
What risk?
28

The risks
• Increased variability and intensity
• Increased frequency of extreme climatic events
• Changes in ecology
– Heat Stress
– Water use
Droughts Floods
Slips
Pests and Diseases
Wind 29

Risk determined by...
• Frequency
– less time to recover between events - resilience
• Intensity
– makes us more vulnerable
• Impact
– but can we do something about that?
30

NZ drought risk
Current Future
For a mid-range emissions scenario, farmers in most North Island regions, as well as those in eastern regions of the South Island – especially Canterbury and eastern Southland – can expect to spend around ten per cent more time in drought by the middle of this century.
31

NZ drought risk (Hawkes Bay)
Current Future (2040)
20% time in drought equates to 2 years in ten
Current – 1 in 20 years 2040 – 1 in 10 years
Maps include soil water holding capacity factor and can be found in Clarke et al. 2012: Impacts of Climate Change on Land-based sectors and Adaptation Options – Stakeholder Report
32

Current NI drought situation
• CC is long term so year to year changes are not expected to represent CC
• “Regionally and locally the patterns can be made more complicated by New Zealand’s location relative to major atmospheric circulation systems and the effects of our complex terrain that cause regional variations”
University of Canterbury meteorologist Professor Andrew Sturman
33

How does that translate to the farm?
• Detailed modelling by AgResearch using NIWA projected data
• The key message is increased variability in DM production
34

Distribution of DM production (HB) (1°C warming between 1990 and 2040)
Variability Index
From Lieffering et al. 2012, SLMACC Impacts Technical Report, Chapter 4 35

Production curve Grey = 1990
Green = 2040
Variability Index (HB)
More variability Dec-Mar
36

Variability in Pasture Growth Rate
37 TE Pirita – South Canterbury
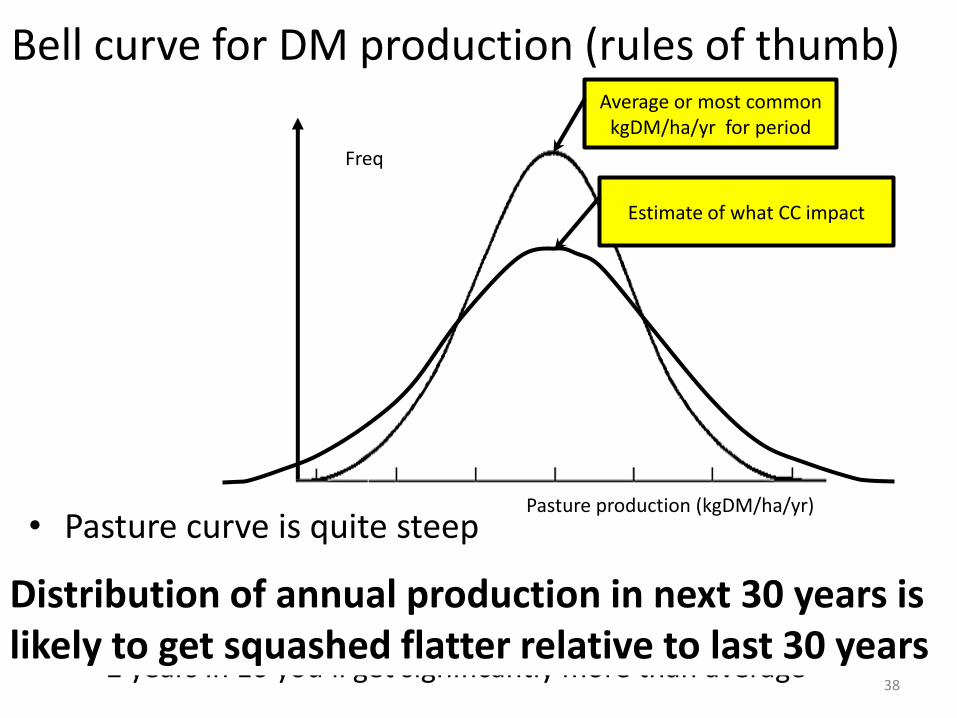
Bell curve for DM production (rules of thumb)
• Pasture curve is quite steep
– 6 years in 10 you’ll get close to average DM production
– 2 years in 10 you’ll get significantly less than average
– 2 years in 10 you’ll get significantly more than average
Average or most common kgDM/ha/yr for period
Pasture production (kgDM/ha/yr)
Freq
38
Estimate of what CC impact
Distribution of annual production in next 30 years is likely to get squashed flatter relative to last 30 years

Translates into Gross margin (HB) (Farmax®)
39

• $50,000/yr loss for 2 years in a row
• Frequency from 1 in 17 years to 1 in 8 years
– Reflect in cashflow budgets
– Strategic adaptation for survival.
• Use 5 year average values for product prices
• Improve flexibility of resource use / productivity
40

What farm models do you use for analysis?
21%
61%
14%
2%
16%
22%
48%
41
1. Overseer
2. Farmax
3. Red Sky/DairyBase
4. Udder
5. Others bio-based models
6. Spreadsheets
7. None
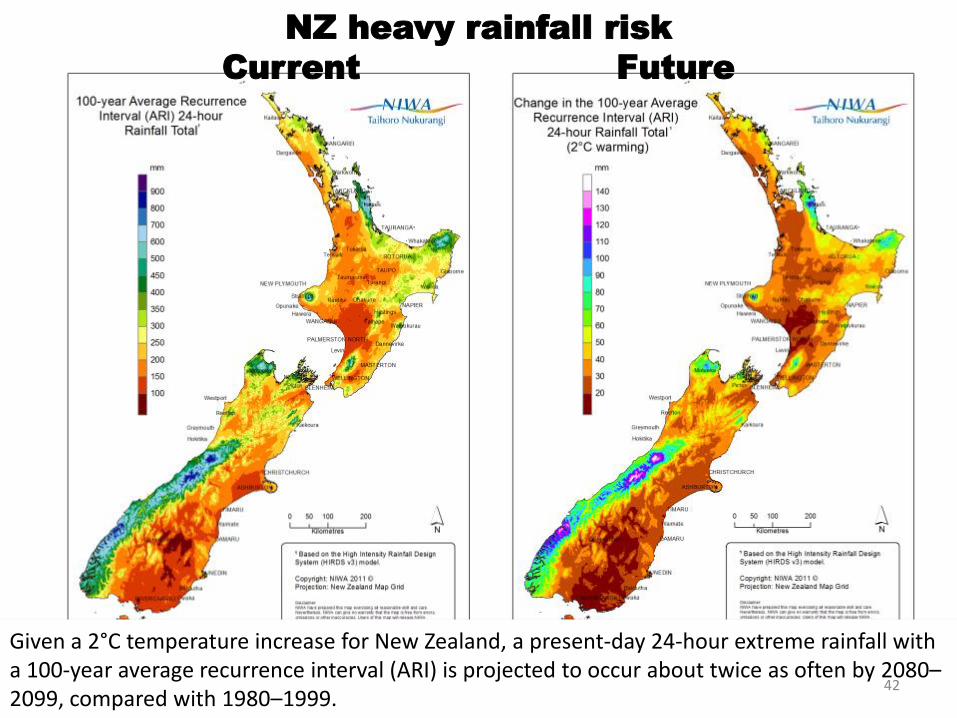
NZ heavy rainfall risk
Current Future
Given a 2°C temperature increase for New Zealand, a present-day 24-hour extreme rainfall with a 100-year average recurrence interval (ARI) is projected to occur about twice as often by 2080–2099, compared with 1980–1999.
42

NZ heavy rainfall risk
Current Future (2090)
250 to 400 mm in 24 hrs once in 100 years (1980 – 1999)
40-50 mms more in 24 hrs so 290 to 450 mm once in 100 years
43

What about Rainfall?
• Capture high river flows
• Higher risk of
– Erosion
– Nutrient runoff
– Sedimentation
• Greater risk soil damage
• Increase in stock deaths
• Increased crop losses
44

Projections – how confident?
From Clarke et al. 2012: Impacts of Climate Change on Land-based sectors and Adaptation Options – Stakeholder Report
45

Key Message
• There are challenges for farmers, growers, foresters and rural communities
• There is now enough information to understand what the impacts might be
46

• BACKGROUND AND RECAP
• KEEPAD RESPONSE
• RISK AND PROBABILITY
• FARM BUSINESS RESILIENCE • SUSTAINABLE LAND MANAGEMENT REPORT
• FARMER RESPONSE (VIDEO)
• NZIPIM – PROFESSIONALISM AND FUTURE PROOFING
• ON-LINE TOOLS
• SCIENCE SOUND BITES
• SUMMARY AND SURVEY
47

What is it?
• Resilience is the ability to bounce back after a shock
• For farm businesses this could be
– Financial (crash in returns)
– Climatic (drought, flood)
– Structural (DDD)
– Combinations of above
48

Some Theory - Three aspects of resilience
• Buffer capacity
– Tactical
• Adaptive capacity
– Strategic
• Transformability
– Transformation
Tactical, Strategic and Transformational adaptation are referred to in SLMACC report (later)
Adapted from work of Tony Rhodes, Nicola Shadbolt and David Gray
x
O
49

50

Managing Resources to Enhance Business Resilience
Business resilience is important!
Businesses that are more resilient can:
• cope with volatility (prices and climate)
• invest in business growth and development
• evolve and adapt in a changing environment
• Be more rewarding
51
Study Group
• North Island dry EC hill country sheep and beef farms
• Farmers seeking to better understand the resources within their farms and in the catchment and to explore options outside the business as usual model to address climate change and market failure.
• Whole-of-catchment
• Homogenous area (mostly class 6 LUC)
52

• Operating Profit (OP) = GFR – OE
• Gross Farm revenue (GFR) = sales - purchases + change in inventory
• Operating Expenses (OE) = cash farm working expenses + feed inventory/run- off adjustments + depreciation + value of family labour & management
Profitability - definitions
53

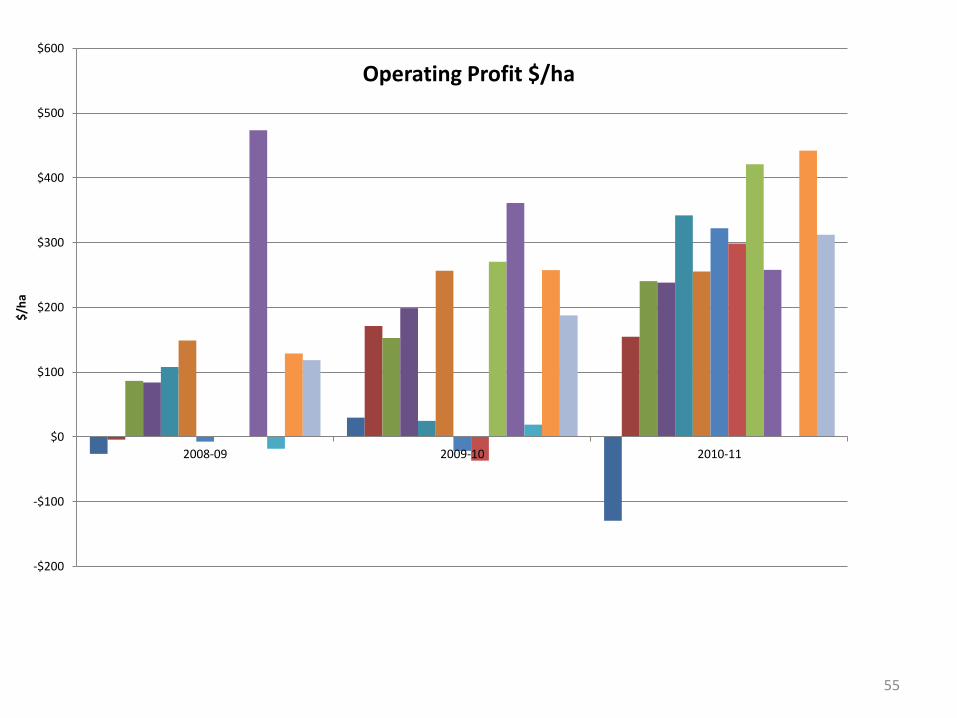
What range in operating profit would you expect for those farms over 3 years?
54
61%
29%
10%1. $100 to $300/ha
2. $50 to 400/ha
3. -$100 to $500/ha
-$200
-$100
$0
$100
$200
$300
$400
$500
$600
2008-09 2009-10 2010-11
$/h
a
Operating Profit $/ha
55
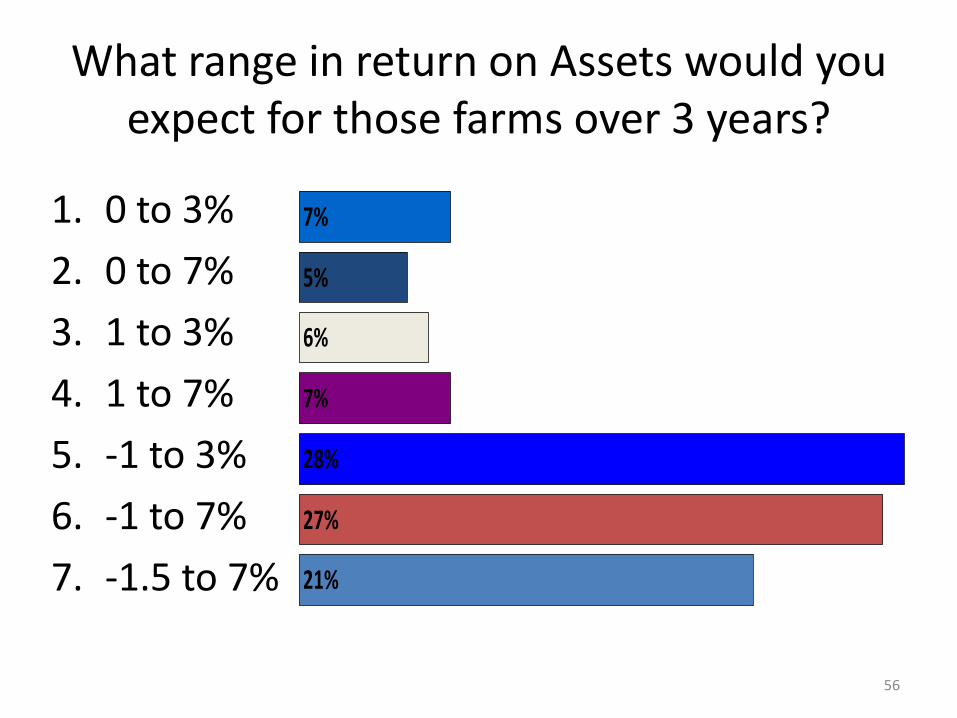
What range in return on Assets would you expect for those farms over 3 years?
56
21%
27%
28%
7%
6%
5%
7%1. 0 to 3%
2. 0 to 7%
3. 1 to 3%
4. 1 to 7%
5. -1 to 3%
6. -1 to 7%
7. -1.5 to 7%

-2.0%
-1.0%
0.0%
1.0%
2.0%
3.0%
4.0%
5.0%
6.0%
7.0%
8.0%
2008-09 2009-10 2010-11
Return on Assets
57
-$1,000
-$500
$0
$500
$1,000
$1,500
$2,000
$2,500
2008-09 2009-10 2010-11
$/h
a
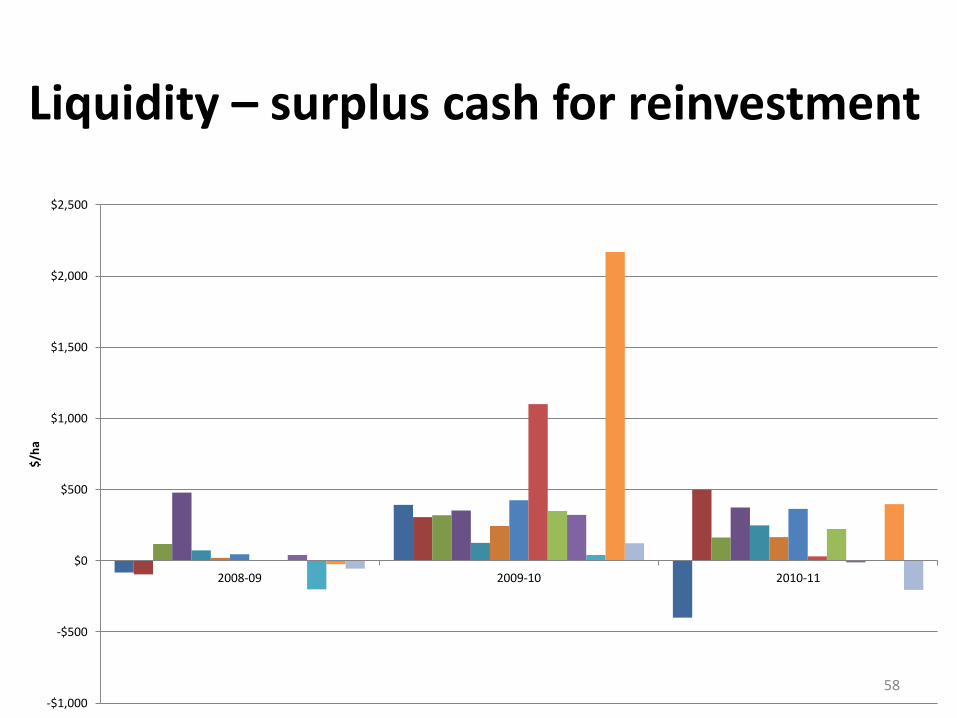
Liquidity – surplus cash for reinvestment
58
-$600
-$400
-$200
$0
$200
$400
$600
$800
$1,000
$1,200
Total
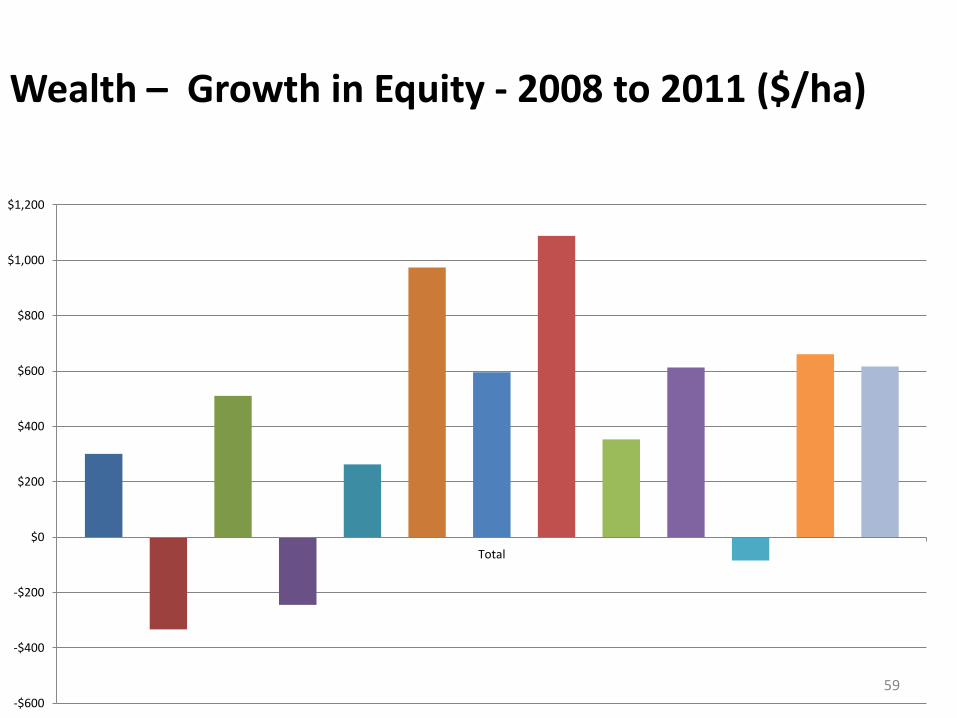
Wealth – Growth in Equity - 2008 to 2011 ($/ha)
59

Managing Resources to Enhance Business Resilience
• Wastage
• Sustainable Production
60

0%
20%
40%
60%
80%
100%
120%
140%
160%
180%
200%
2008-09 2009-10 2010-11
Flock Lambing %
61
0%
2%
4%
6%
8%
10%
12%
14%
16%
18%
2008-09 2009-10 2010-11
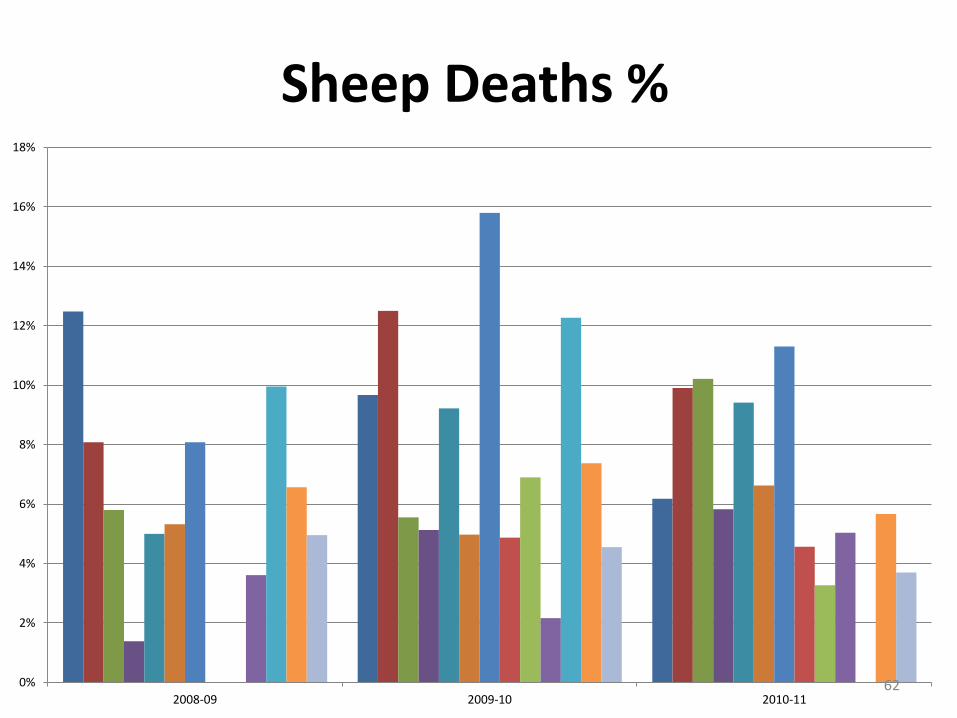
Sheep Deaths %
62

0%
1%
2%
3%
4%
5%
6%
7%
2008-09 2009-10 2010-11
Cattle Deaths %
63

Fertiliser $/su
$0
$2
$4
$6
$8
$10
$12
$14
$16
$18
$20
2008-09 2009-10 2010-11
Red line = Maint 64
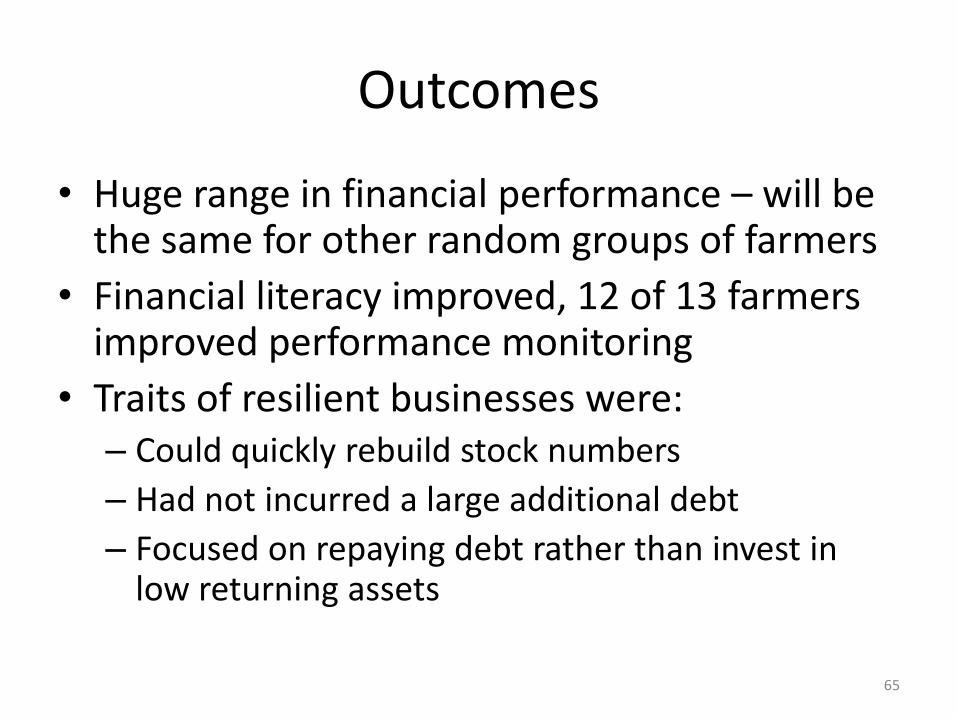
Outcomes
• Huge range in financial performance – will be the same for other random groups of farmers
• Financial literacy improved, 12 of 13 farmers improved performance monitoring
• Traits of resilient businesses were: – Could quickly rebuild stock numbers
– Had not incurred a large additional debt
– Focused on repaying debt rather than invest in low returning assets
65

Where should the KPIs be for a resilient farm business?
• We want your feedback on the where certain KPIs might be expected
66
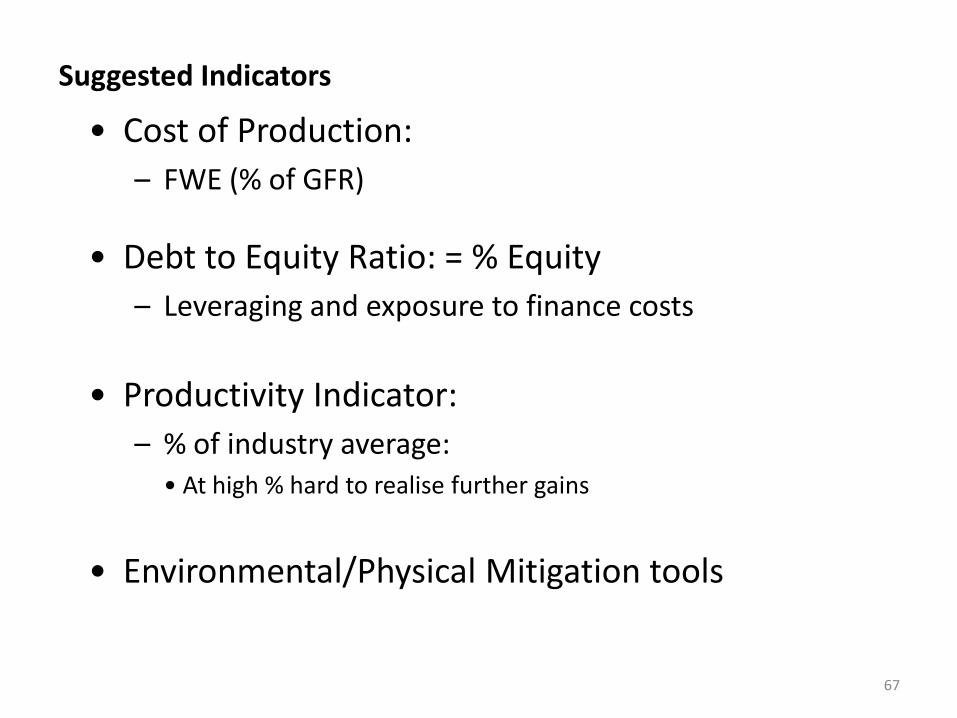
Suggested Indicators
• Cost of Production:
– FWE (% of GFR)
• Debt to Equity Ratio: = % Equity
– Leveraging and exposure to finance costs
• Productivity Indicator:
– % of industry average: • At high % hard to realise further gains
• Environmental/Physical Mitigation tools
67

What is industry average FWE as % of GFR?
8%
15%
8%
54%
15%
0%
FWE does not include interest, tax, drawings, depreciation or rent
68
1. <40%
2. 40 to 50%
3. 50 to 60%
4. 60 to 75%
5. 75 to 85%
6. 85% +
H’Bay / Wairarapa Sheep and Beef 48% Lower North Is Dairy 53%
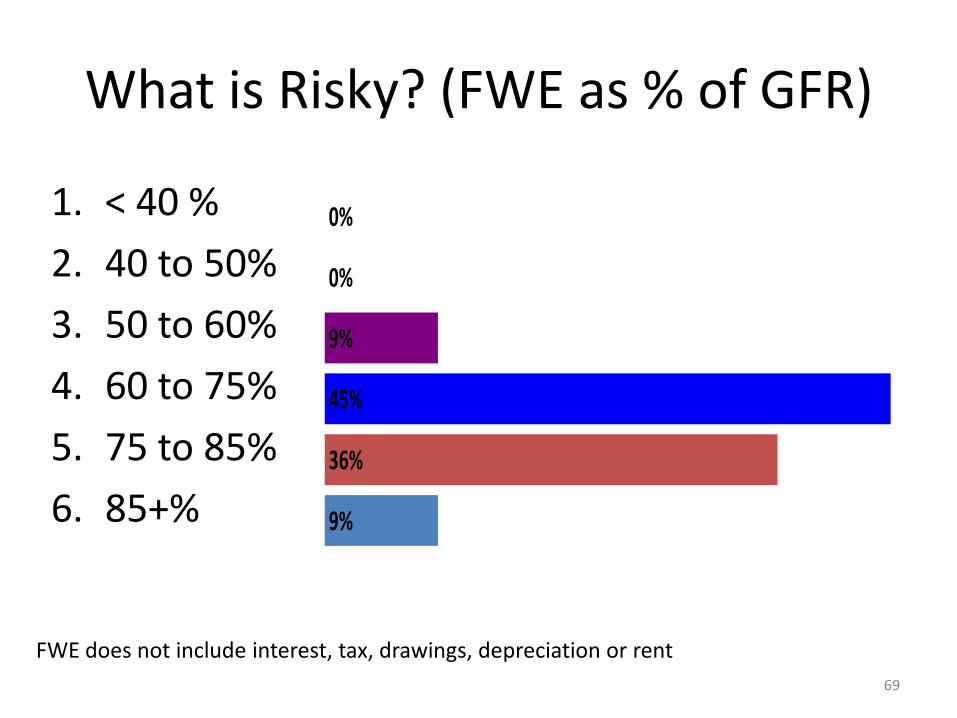
What is Risky? (FWE as % of GFR)
9%
36%
45%
9%
0%
0%
FWE does not include interest, tax, drawings, depreciation or rent
69
1. < 40 %
2. 40 to 50%
3. 50 to 60%
4. 60 to 75%
5. 75 to 85%
6. 85+%

What is Resilient? (FWE as % of GFR)
0%
0%
8%
42%
33%
17%
FWE does not include interest, tax, drawings, depreciation or rent
70
1. < 40 %
2. 40 to 50%
3. 50 to 60%
4. 60 to 75%
5. 75 to 85%
6. 85+%

Cost of production
Resilient Mix for growth? Risky
40 to 60 (best = 50%) 50 to 75%? 75 to 100% ?
71

% Equity
• Represents the Debt to equity ratio of the business
72
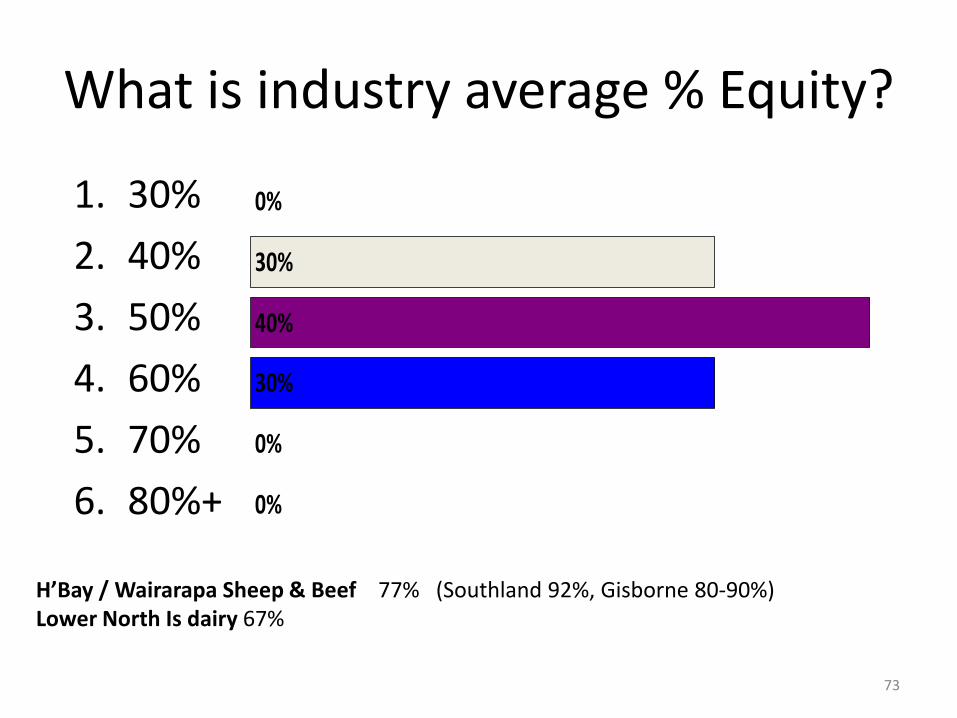
What is industry average % Equity?
0%
0%
30%
40%
30%
0%
73
1. 30%
2. 40%
3. 50%
4. 60%
5. 70%
6. 80%+
H’Bay / Wairarapa Sheep & Beef 77% (Southland 92%, Gisborne 80-90%) Lower North Is dairy 67%

What is risky % Equity?
74
1. 30%
2. 40%
3. 50%
4. 60%
5. 70%

What is Resilient % Equity?
8%
42%
33%
17%
0%
0%
75
1. 30%
2. 40%
3. 50%
4. 60%
5. 70%
6. 80%+

% Equity
Resilient Mix for growth? Risky
50 to 70% 40 to 60% 20 to 40%
76
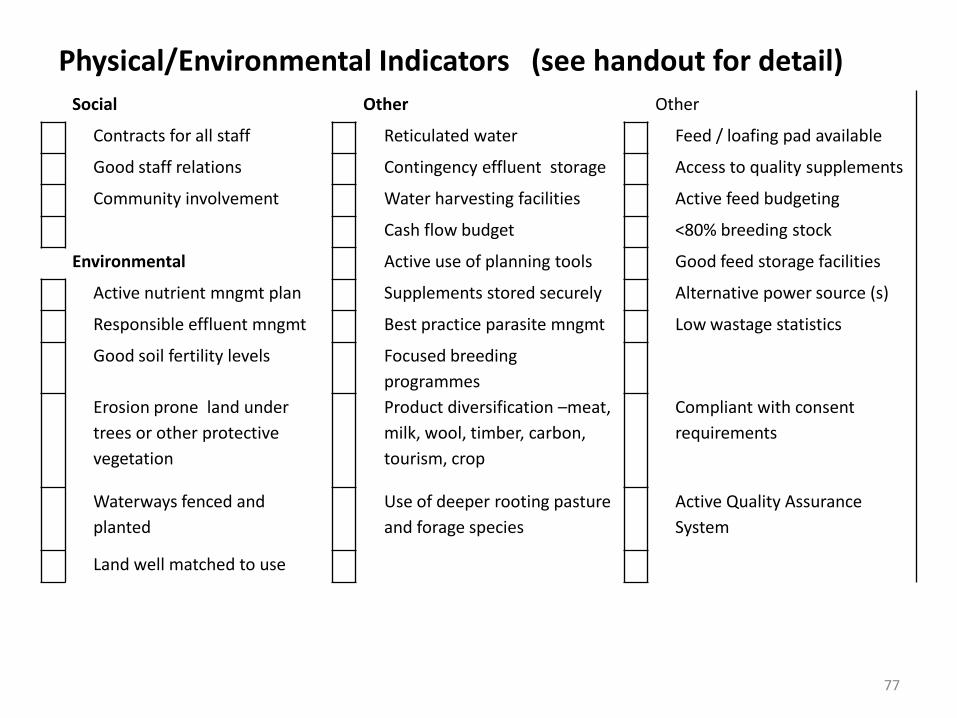
Physical/Environmental Indicators (see handout for detail) Social Other Other
Contracts for all staff Reticulated water Feed / loafing pad available
Good staff relations Contingency effluent storage Access to quality supplements
Community involvement Water harvesting facilities Active feed budgeting
Cash flow budget <80% breeding stock
Environmental Active use of planning tools Good feed storage facilities
Active nutrient mngmt plan Supplements stored securely Alternative power source (s)
Responsible effluent mngmt Best practice parasite mngmt Low wastage statistics
Good soil fertility levels Focused breeding
programmes
Erosion prone land under
trees or other protective
vegetation
Product diversification –meat,
milk, wool, timber, carbon,
tourism, crop
Compliant with consent
requirements
Waterways fenced and
planted
Use of deeper rooting pasture
and forage species
Active Quality Assurance
System
Land well matched to use
77
Take home message
• KPI’s you monitor are critical
– Think about what is really important & monitor zealously
• Identify and isolate the threats
• Constantly reassess what the opportunities are and act
78

• BACKGROUND AND RECAP
• KEEPAD RESPONSE
• RISK AND PROBABILITY
• FARM BUSINESS RESILIENCE
• SUSTAINABLE LAND MANAGEMENT REPORT
• FARMER RESPONSE (VIDEO) • NZIPIM – PROFESSIONALISM AND FUTURE
PROOFING
• ON-LINE TOOLS
• SCIENCE SOUND BITES
• SUMMARY AND SURVEY
79

Videos
Four videos available which show:
• A farmer identifying a climate related threat to his business
– How they have thought about the issues
– What they have chosen what to do
– How that response is panning out
80

Steele – Retaruke Hill Country S&B McKnight – Otago High country S&B
Woods – BOP lowland Dairy
81

Play Video
82

Key messages
• Clearly ID and quantify threat
• Research possible responses
– Preferably use some biological modelling if possible
• Plan the response so fiscally possible and with some control as compared with a forced response
83

Morning tea
84

• BACKGROUND AND RECAP
• KEEPAD RESPONSE
• RISK AND PROBABILITY
• FARM BUSINESS RESILIENCE
• SUSTAINABLE LAND MANAGEMENT REPORT • FARMER RESPONSE (VIDEO)
• NZIPIM – PROFESSIONALISM AND FUTURE PROOFING
• ON-LINE TOOLS
• SCIENCE SOUND BITES
• SUMMARY AND SURVEY
85

Sustainable Land Management and Climate Change (SLMACC) Report
86

What is it about?
• Adaptation
– nature does it all the time
87

Known as “Stakeholder report”
• Summarises 9 Technical Reports
• Science plus industry contribution
• Collaborative approach with outcomes in appropriate language
• A “must read” for land managers
88

Co
nte
nts
89

Some Examples of
useful information
and ideas
• Pgs 8-9 Sectors and levels of adaptation
90
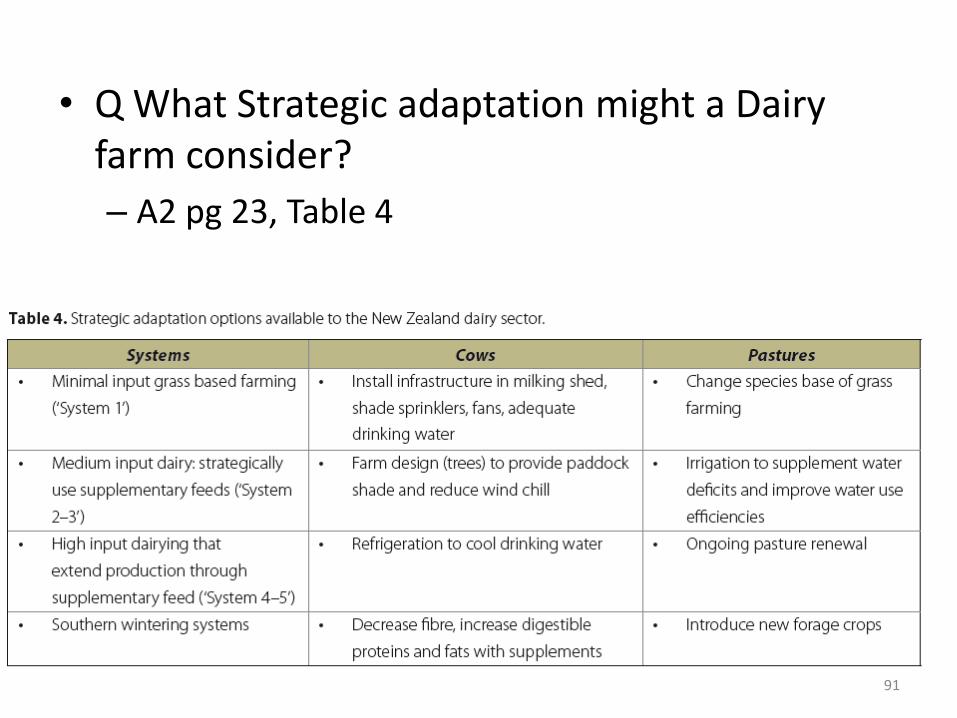
• Q What Strategic adaptation might a Dairy farm consider?
– A2 pg 23, Table 4
91
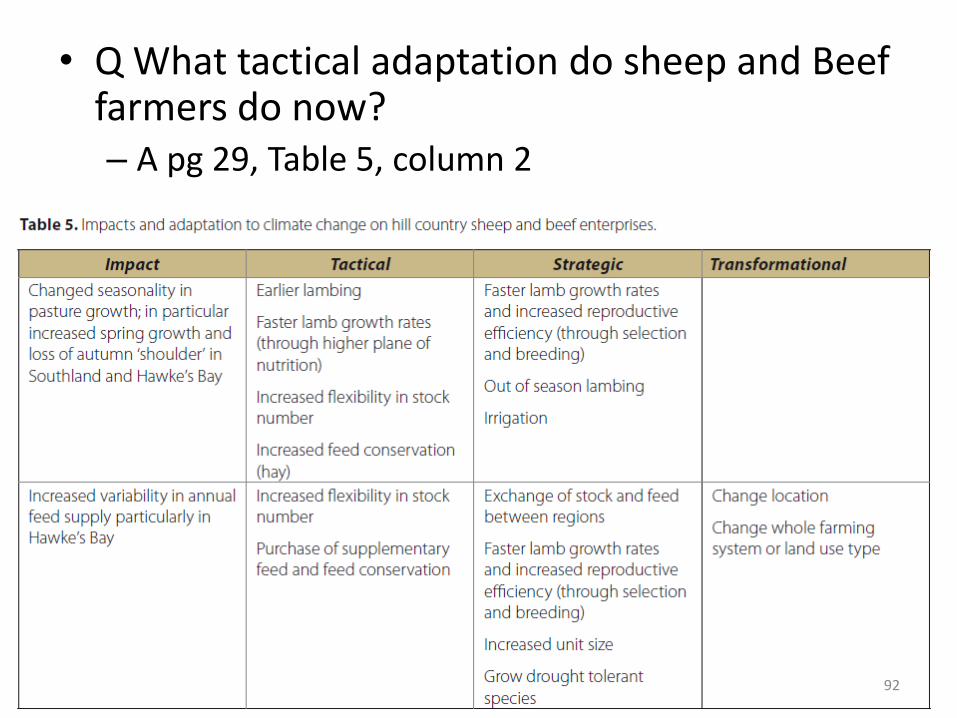
• Q What tactical adaptation do sheep and Beef farmers do now? – A pg 29, Table 5, column 2
92

• Q What transformational adaptations would reduce the impacts of a drought?
– A pg 33
93

• What strategic adaptation should cropping farmers consider?
– A pg 38
94

• What will the impacts be for horticulture?
95 From technical report (chap 6)

• Adaptations for horticulture? - pg 45
96
• Who has a critical role in fine tuning a successful approach at a farm level?
– A pg 23
“These results reinforce that the strategic adaptation options which demand greater financial risk and/or capital investment, need careful planning. There is no single best approach, and a degree of fine tuning is required at a farm level to bring about success. This highlights a critical role for rural professionals in climate change adaptation”
97
rural professionals

Key Message
• There are opportunities and challenges for farmers, foresters and rural communities
• Adaptation can range from existing good practice to more strategic or transformational options
• Understanding climate change and acting is key to future proofing and long-term resilience
98

• BACKGROUND AND RECAP
• RISK AND PROBABILITY
• FARM BUSINESS RESILIENCE
• SUSTAINABLE LAND MANAGEMENT REPORT
• FARMER RESPONSE (VIDEO)
• NZIPIM – PROFESSIONALISM AND FUTURE PROOFING
• ON-LINE TOOLS
• SCIENCE SOUND BITES
• SUMMARY AND SURVEY
99

NZIPIM – the New Zealand Institute of Primary Industry Management
A vital knowledge network for rural professionals

Risks
• Aging group farm consultants – Relying on capital built up by Advisory Services Division
– Succession arrangements
• Difficulty in establishing career pathways farm consultants
• Outside the dairy industry, advisory services in other sectors appears thin
• Keeping pace with rapid technological advancements in farming systems
• Linear relationship between research institutions and rural professionals
• Inability to articulate the value proposition to the farming community
• Consumer power

What are the two top risks to your business?
22%
30%31%
7%
10%9%
22%
5%
20%
1 2 3 4 5 6 7 8 9
1. Staffing
2. Upskilling
3. Succession
4. Litigation
5. Business Value / exit strategy
6. Professional accreditation
7. Competition from non-qualifies advisors
8. No risk, I am retiring
9. Regulatory eg FAA

What is NZIPIM doing?
NZIPIM is focusing on the following activities in the year ahead:
• Accreditation
• Building stronger branches
• Building and developing members
• Promoting career opportunities
• Constructive partnerships
• Increasing the profile and influence of NZIPIM

What the future may look like…. • Larger consultancy practices with a range of specialty skill sets
• Greater emphasis on governance structures and strategy
• Public/private arrangements in developing young rural professions
• Greater level of third party verification or client advocacy
• Increased connectivity with researchers and farming community
• Increased demand by consumers for accreditation/certification throughout value chain
• Increased sophistication and complexity of farm systems necessitating the need for expert advice, leading to different business models
• Time to be bold

Key messages
• Are you prepared for the next 15 years?
• Need to manage the risks to your business as an RP
• What will the future requirements be?
105

• BACKGROUND AND RECAP
• KEEPAD RESPONSE
• RISK AND PROBABILITY
• FARM BUSINESS RESILIENCE
• SUSTAINABLE LAND MANAGEMENT REPORT
• FARMER RESPONSE (VIDEO)
• NZIPIM – PROFESSIONALISM AND FUTURE PROOFING
• ON-LINE TOOLS • SCIENCE SOUND BITES
• SUMMARY AND SURVEY
106

Internet based data portals
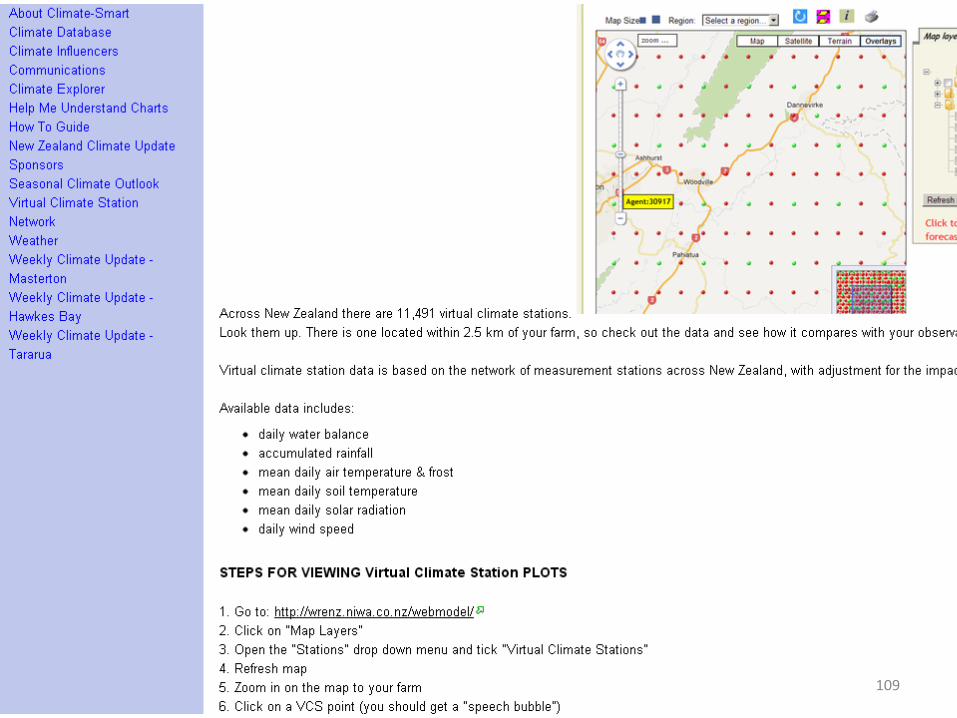
• Climate Smart Farmers and NIWA Virtual Climate Station Network
• NIWA 3 month outlook
• Horticultural crop irrigation scheduler
• Water balance – irrigation scheduling (AquaTrac, FAR)
• National Land Resource Centre
• S-map (user friendly, but not widely applicable)
• Adaptation toolbox (MPI website, case studies, work flow)
• Landuse capability (not user friendly, too coarse for farms)
107
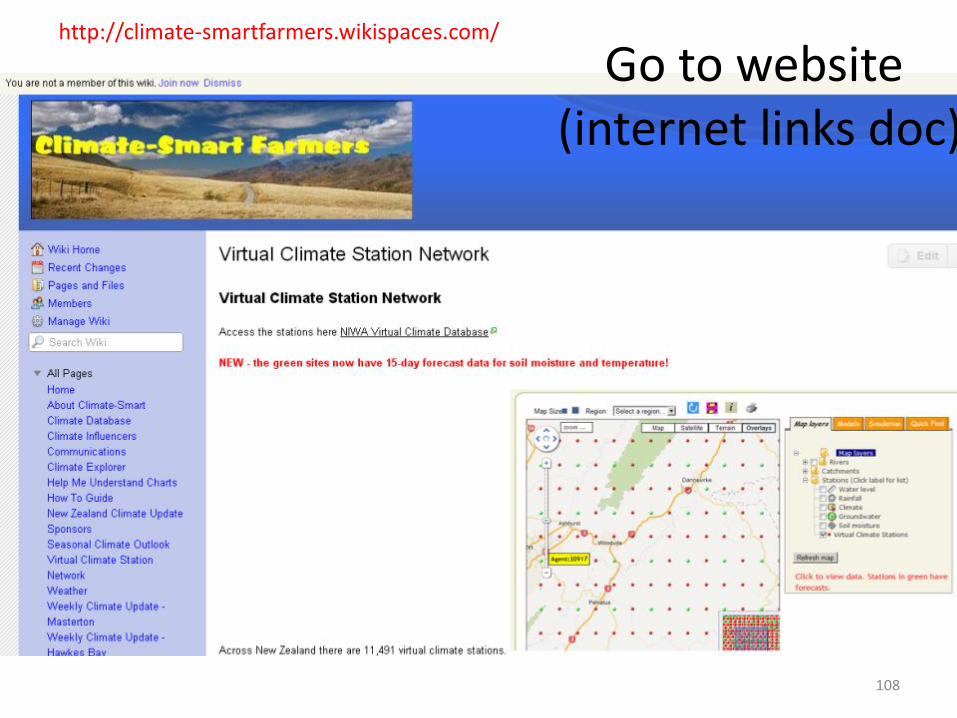
Go to website (internet links doc)
108
http://climate-smartfarmers.wikispaces.com/
109

Select region
110

Click on “Map Layers”
111
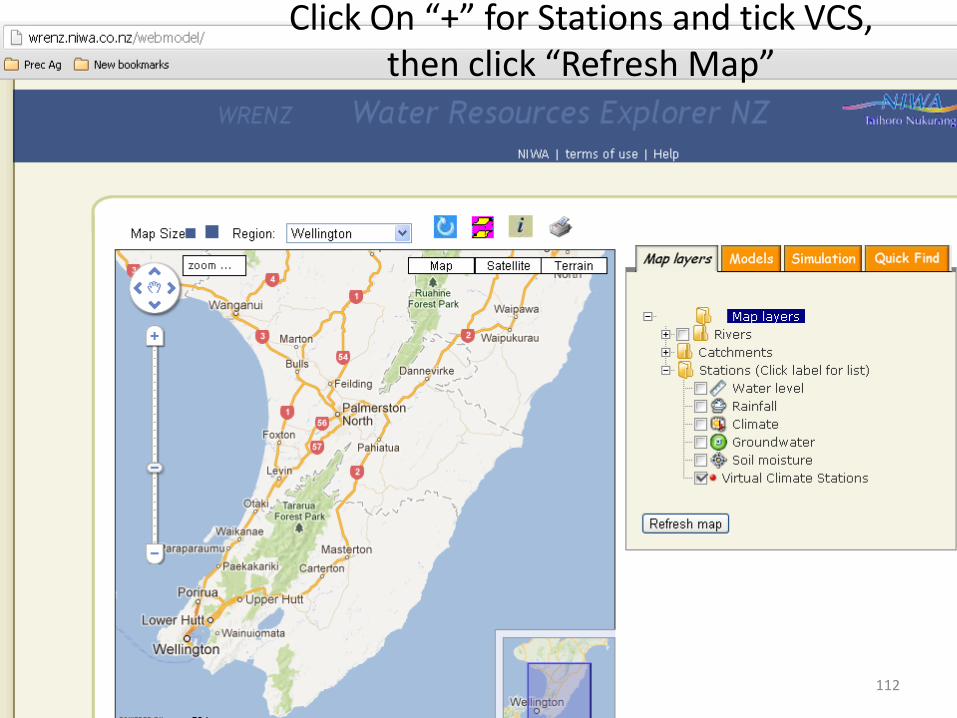
Click On “+” for Stations and tick VCS, then click “Refresh Map”
112
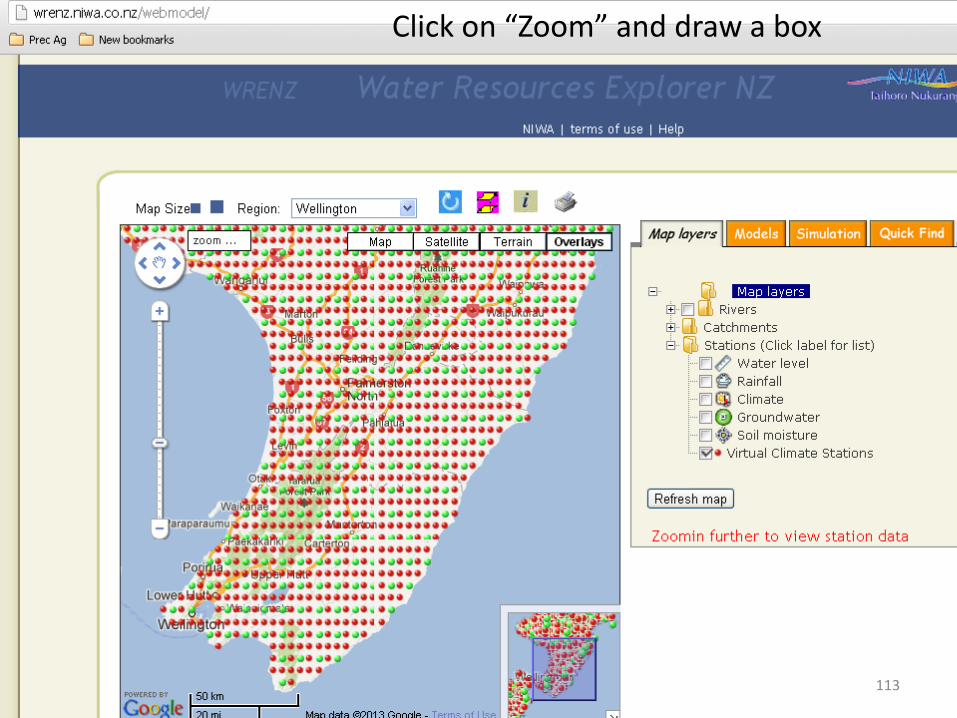
Click on “Zoom” and draw a box
113

Now you can select a station (5km grid, Green forecasts, red
114
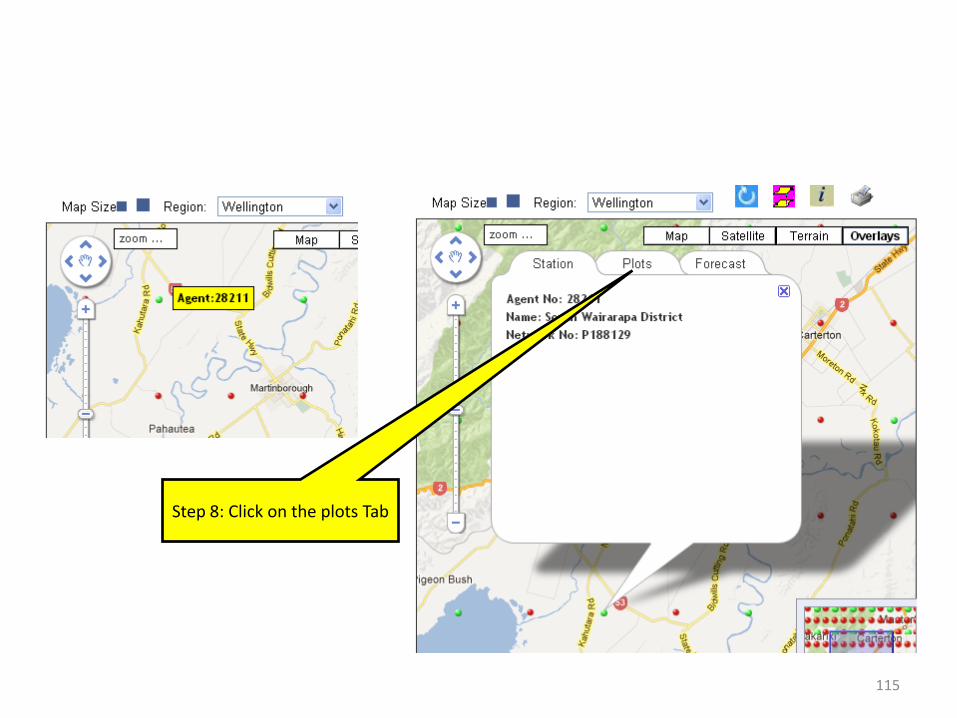
Step 8: Click on the plots Tab
115
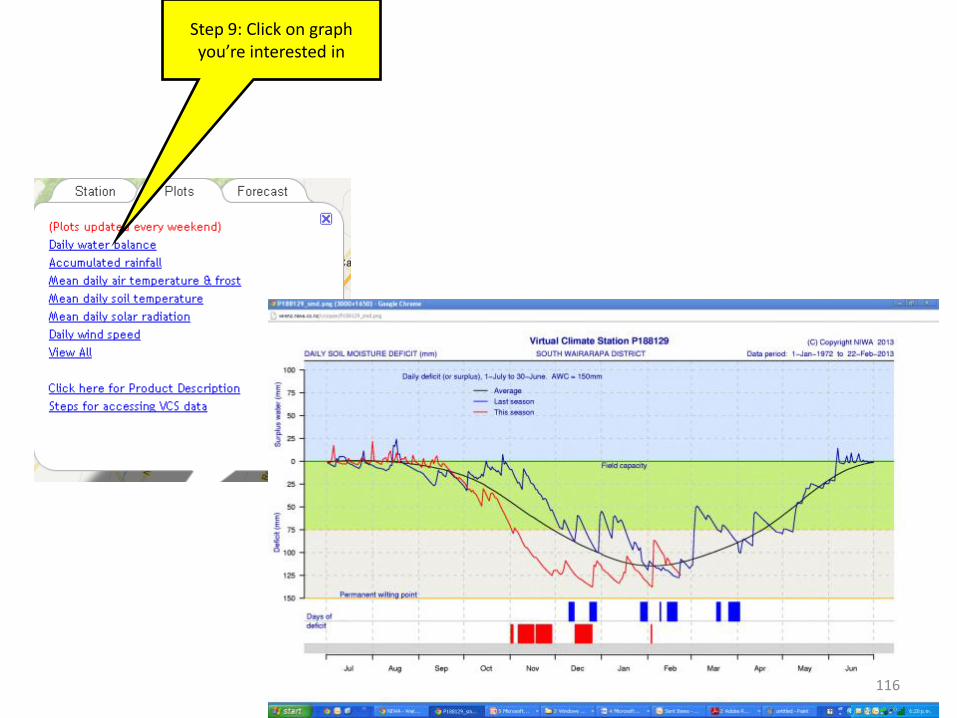
Step 9: Click on graph you’re interested in
116

Last season relatively wet
Good rain here brings moisture back to normal
A lot drier than a normal November
Below this line drier than normal
117

Click on “Forecast”
118

I reckon it was very dry here – and it is! 119

NIWA
• 3 month outlook
120

• National Land Resource Centre
• http://www.nlrc.org.nz/home
121

• Pipfruit, Summerfruit, Kiwifruit and Winegrapes
• http://www.cropirlog.co.nz/
122

• BACKGROUND AND RECAP
• KEEPAD
• RISK AND PROBABILITY
• FARM BUSINESS RESILIENCE
• SUSTAINABLE LAND MANAGEMENT REPORT
• FARMER RESPONSE (VIDEO)
• NZIPIM – PROFESSIONALISM AND FUTURE PROOFING
• ON-LINE TOOLS
• SCIENCE SOUND BITES • SUMMARY AND SURVEY
123

Science Sound Bites
• Update: current research on GHG mitigation
• Who:
– Pastoral Greenhouse gas Research consortium (PGgRc)
– NZ Agricultural Greenhouse Gas Research Centre
124

Why are they doing this?
• Improve • Resource-use efficiency
• profitability and sustainability
• Provide long-term solutions
• Options for farmers • future pressure on GHG emissions
• Market access
125

Work areas
• Methane (CH4)
• Nitrous Oxide (N2O)
• Soil carbon
• Farm Systems
126

Exciting progress
• Selected sheep for high and low ch4
• CH4 antibodies in test tube
• 25% less CH4 from sheep fed brassica
• Soil carbon is challenging….
127

Animal Breeding
• Developed a flock of selected sheep of around 150 with – 50% Hi methane emitters
– 50% Lo methane emitters
– Difference of >10%
• Heritability and maintained productivity suggests worth pursuing for breeding – but need low cost markers
• Targets are to have sheep markers by 2016, and cattle markers by 2018
128

Methane Vaccine / Methanogen Inhibitors
• antibody response to methanogens in ruminants which can impact cultured bacteria
• Established a protocol to fast track screening of inhibitor compounds
• The target is to be engaged with commercial parties by 2016 who will eventually provide on-farm solutions.
• Critical to better understand rumen function and long term sustainability of blocking Methane production
129

Low GHG Feed
• Some brassicas showing 25% less methane than ryegrass and some reduction in nitrous oxide.
• First evidence of a forage effect enduring.
• Also looking at Maize silage and PKE effects
• The target is to have the tools that can predict and verify low GHG feeds by 2016.
130

Nitrous Oxide
• manipulate N inputs (e.g. plant breeding) and the processes that form and release N2O (e.g. inhibitors)
• nutrient management (Overseer), best practice fertiliser
use and effluent management can reduce N2O emissions and leaching
• Recent setback has been the suspension of current DCD use. There is ongoing work to provide accepted evidence to assure markets of its safety
131

Soil Carbon
• NZ has high soil carbon: fluctuations in carbon content are normal and can be uncertain (e.g. drought)
• Doing good things for soil carbon are generally good for soil quality (earthworms, soil structure, moisture holding capacity, nutrition)
• Currently large cost to effectively measure highly variable and small changes in soil carbon
132

Systems Fit
• Taking these mitigations through to delivery.
• End user group to work with Farmers and their advisors
• The Toward 2030 framework recognises the activities that need to come together to achieve the best outcome.
133

Illustration of the ‘NZ Inc Towards 2030 Framework’ championed by PGgRc and NZAGRC with support from MPI
134
• BACKGROUND AND RECAP
• KEEPAD
• RISK AND PROBABILITY
• FARM BUSINESS RESILIENCE
• SUSTAINABLE LAND MANAGEMENT REPORT
• FARMER RESPONSE (VIDEO)
• NZIPIM – PROFESSIONALISM AND FUTURE PROOFING
• ON-LINE TOOLS
• SCIENCE SOUND BITES
• SUMMARY AND SURVEY
135

Key messages
• There are good tools to help with assessing and responding to the impacts of a changing climate
– A3 planner, online monitoring, Stakeholder report
– A combination of climate, biological and financial analysis is highlighting risks and quantifying the impacts
– A planned, farm based response is needed, not a knee jerk reaction
136

• Rural Professionals:
– Got to start thinking about a changing climate
– Need to Raise the issues – clients & industry
– This issue is as important as any other
• Need Resilience for CC and other pressures
• Need resilient RP business as well as farm businesses
• You are part of the solution
137

Thank you
Please fill in the brief survey form
138

Additional slides
139
Sea level rise
• Hauraki, Manawatu, Taieri Basin
• Projected to be 0.8m by 2090
• Add coastal storm surge and flooding on land and have major threat to livelihood
• Get involved in the discussion with councils because rural concerns need to be considered
• Otherwise rural land will be sacrificed to the benefit/protection of urban infrastructure
• Engage from day 1
140

Areas at risk from Sea level change which require a conservative plan to deal with 0.8m rise by 2090
141
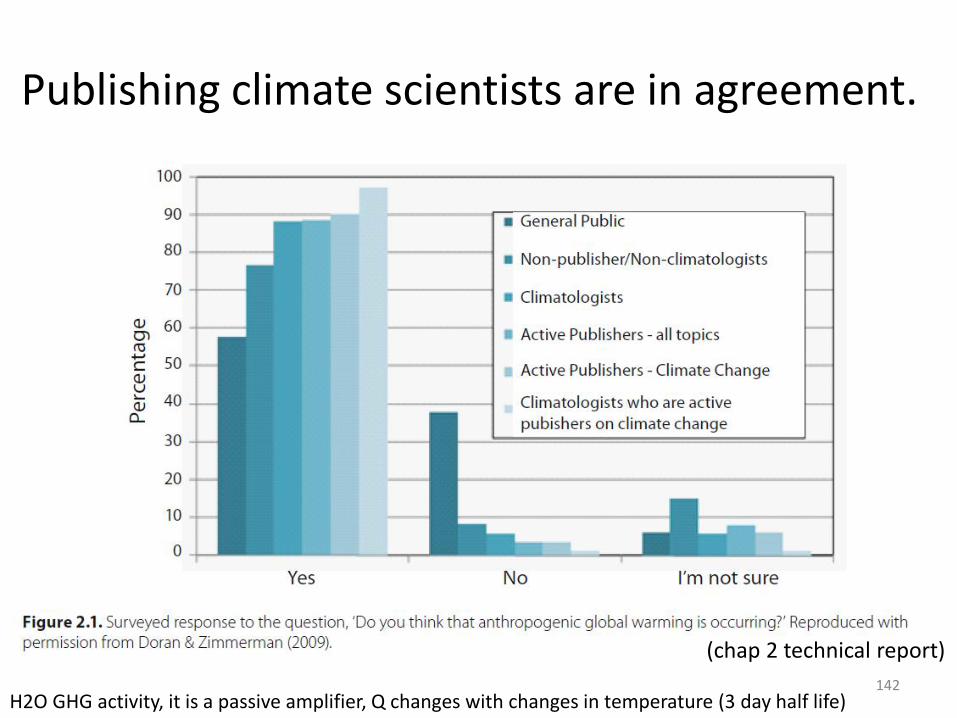
Publishing climate scientists are in agreement.
H2O GHG activity, it is a passive amplifier, Q changes with changes in temperature (3 day half life)
(chap 2 technical report)
142

Southland data
143

Distribution of DM production (Sthld) (1°C warming between 1990 and 2040)
Variability Index
From Lieffering et al. 2012, SLMACC Impacts Technical Report, Chapter 4 144

Production curve Grey = 1990
Green = 2040
Variability Index
More variability Feb-Mar
145
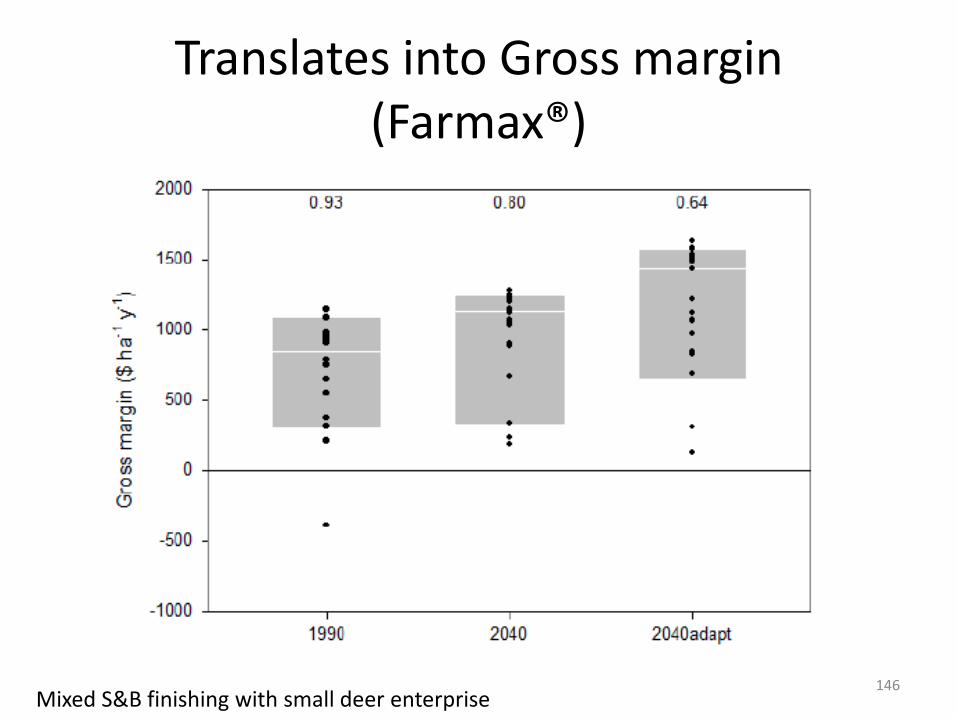
Translates into Gross margin (Farmax®)
Mixed S&B finishing with small deer enterprise 146

Waikato Data
147

Distribution of DM production (Wkto) (1°C warming between 1990 and 2040)
From Lieffering et al. 2012, SLMACC Impacts Technical Report, Chapter 4 148
Variability Index

Variability in Pasture Growth Rate
149 TE Pirita – South Canterbury

Production curve Grey = 1990
Green = 2040
Variability Index
More variability Feb-Mar
150

Bell curve for DM production (rules of thumb)
• Pasture curve is quite steep
– 6 years in 10 you’ll get close to average DM production
– 2 years in 10 you’ll get significantly less than average
– 2 years in 10 you’ll get significantly more than average
Average or most common kgDM/ha/yr for period
Pasture production (kgDM/ha/yr)
Freq
151
Estimate of what CC impact
Distribution of annual production in next 30 years is likely to get squashed flatter relative to last 30 years

Translates into Gross margin (Farmax®)
Four stock enterprises: breeding sheep, breeding cattle, trading sheep and trading cattle 152