running head: symbolic racism: prejudice or...
TRANSCRIPT

Why Do White Americans 1 Running head: SYMBOLIC RACISM: PREJUDICE OR CONSERVATISM?
Why Do White Americans Oppose Race-Targeted Policies? Clarifying the Impact of Symbolic Racism
Joshua L. Rabinowitz
University of Michigan
David O. Sears University of California, Los Angeles
Jim Sidanius
Harvard University
Jon A. Krosnick Stanford University
Note: The first author was supported by a Grant-in-Aid Award from the Society for the Psychological Study of Social Issues while at the University of California, Los Angeles, and by a grant (T32-MH19728) from the National Institute of Mental Health while at The Ohio State University. Data collection at California State University, Northridge, was funded by grants from the College of Social and Behavioral Sciences and the Office of Graduate Studies, Research, and International Programs.
We thank Rosellen Bronson, Karina Kortbein, and Amber Landini for their help with data collection and entry. We also thank Peter Bentler and Charles Judd for statistical advice.
Correspondence should be addressed to Joshua L. Rabinowitz, Research Center for Group Dynamics, Institute for Social Research, University of Michigan, P.O. Box 1248, Ann Arbor, MI 48106-1248. E-mail correspondence should be sent to [email protected].

Why Do White Americans 2
Abstract
Measures of symbolic racism (SR) have often been used to tap racial prejudice toward Blacks.
However, given the wording of questions used for this purpose, some of the apparent effects on
attitudes toward policies to help Blacks may instead be due to political conservatism, attitudes
toward government, and/or attitudes toward redistributive government policies in general. Using
data from national probability sample surveys and an experiment, we explored whether SR has
effects even when controlling for these potential confounds and whether its effects are specific to
policies involving Blacks. Holding constant conservatism and attitudes toward limited government,
SR predicted Whites’ opposition to policies designed to help Blacks and more weakly predicted
attitudes toward social programs whose beneficiaries were racially ambiguous. An experimental
manipulation of policy beneficiaries revealed that SR predicted policy attitudes when Blacks were
the beneficiary but not when women were. These findings are consistent with the claim that SR’s
association with racial policy preferences are not due to these confounds.
Keywords: symbolic racism; modern racism; prejudice; policy attitudes; liberal-conservative
ideology; structural equation modeling

Why Do White Americans 3
Why Do White Americans Oppose Race-Targeted Policies?
Clarifying the Impact of Symbolic Racism
One of the most contested issues in studies of race in America concerns the role of
government in addressing social inequality. To state the question at issue in its simplest form,
“Exactly why do some White Americans oppose government policies designed to aid Black
Americans?” Researchers have debated to what extent it is due to racial prejudice or adherence to
less racial value systems (e.g., equality, individualism, and/or opposition to big government).
Symbolic racism (SR) theory (McConahay & Hough, 1976; Sears, 1988; Sears & Henry, 2005;
Sears & Kinder, 1971; Sears, van Laar, Carrillo, & Kosterman, 1997)—and its close relatives, such
as modern racism (McConahay, 1986) and racial resentment (Kinder & Sanders, 1996)—is a
particularly visible theory of racial prejudice. Although measures of SR have been used extensively
throughout the social scientific literature, two particular concerns about them have been raised that
merit investigation. First, we test whether the confounding of SR with race-neutral beliefs and
ideologies is in fact responsible for SR’s apparent effects instead of racial prejudice. We also
explore whether the apparent effects of Black-focused SR on policy preferences are specific to
policies that benefit Blacks in particular.
Symbolic Racism
On the one hand, most White Americans appear to be dedicated to ideals of equality and
true integration. But at the same time, many of those same White Americans were unwilling to
support the implementation of specific policies designed to ameliorate unfair group differences.
How, then, to explain this “principle-implementation gap” (Bobo, 1997; Schuman, Steeh, Bobo, &
Krysan, 1997)? The tendency to oppose racial policies might still be fueled by adherence to old-

Why Do White Americans 4 fashioned, racist notions of group inferiority/superiority. However, few Whites in the past 30 years
have actually subscribed to such beliefs (Bobo & Smith, 1998; Schuman, et al., 1997; Sears, 1988).
SR has been conceptualized as a blend of basic anti-Black antipathy and the sense that African
Americans are violating consensually-held values, such as working hard (Sears, 1988; Sears &
Henry, 2003). SR is said to share an affective component (i.e., anti-Black affect) with old-
fashioned racism. But according to the theory, Whites do not oppose racial policies because they
think Blacks are subhuman or even because they are not wedded to egalitarian ideals, as was the
case with old-fashioned racism (Hughes, 1997; Sears, 1988; also see Bobo & Kluegel, 1997).
Rather, the SR construct has a unique component: resentment toward Blacks for not pulling
themselves up out of poverty by their collective bootstraps. In other words, symbolic racism may
produce opposition to such policies because (a) it contains generally negative affect toward Blacks
along with (b) the belief that Blacks are not doing what all Americans should do to get ahead and
that is to work hard rather than relying on the largesse of other groups or government (Sears &
Henry, 2003).
Various survey questions have been devised over the years to measure SR (Henry & Sears,
2002; Kinder & Sanders, 1996; McConahay, 1986; Sears 1988). And although many would argue
with the assertion that old-fashioned forms of racial prejudice had faded away (e.g., Federico &
Sidanius, 2002; Sidanius, Pratto, & Bobo, 1996; Sidanius, Devereux, & Pratto, 1992), in the
contemporary era the SR scales have usually predicted Whites’ opposition to government policies
designed to help Blacks and opposition to political candidates from ethnic minority groups better
than does old-fashioned racism (see, e.g., Hughes, 1997; Kinder & Sanders, 1996; Sears, 1988;
Sears, van Laar, Carrillo, & Kosterman, 1997).
Why Do White Americans 5
Concerns about Evidence Regarding Symbolic Racism’s Apparent Effects
The relations of SR with these outcome variables may be due to the processes outlined by
SR theory, but these relations may be attributable to different processes instead (see, e.g., Carmines
& Merriman, 1993; Feldman & Huddy, 2005; Roth, 1990; Sniderman & Carmines, 1997;
Sniderman, Crosby, & Howell, 2000; Sniderman & Piazza, 1993; Sniderman, Piazza, Tetlock, &
Kendrick, 1991; Sniderman & Tetlock, 1986; Sniderman, Tetlock, Carmines, & Peterson, 1993;
Tetlock, 1994). Adherence to traditional values—without concomitant racial prejudice—could
drive Whites’ responses to SR measures and their opinions on racial policy issues. For example,
Whites’ devotion to true equality may lead them to oppose what they might view as inherently
inequitable policies, such as affirmative action, because it provides advantages for some social
groups and not others. Similarly affirmative action may be perceived to violate the traditional
principle of judging people on their merits, not their skin color. Consequently, opposition to such
policies may result from their perceived violation of widely- and closely-held principles rather than
racism.
A second possibility is that the observed associations of SR with policy preferences may be
spurious because both may reflect preferences about the scope and character of government
interventions in private life. Liberals often argue that government should help people in need of
economic help, in addition to helping its citizens to thrive in a variety of other ways. In contrast,
conservatives often argue that government should allow citizens to get ahead economically on their
own and should interfere with the free enterprise system as little as possible. If a person prefers a
small government that carries out a very limited set of activities and minimizes its intrusions into
the lives of its citizens, this preference could inspire opposition to policies that would help Blacks

Why Do White Americans 6 or any other groups. And such general preferences about the size of government may also
determine responses to SR measures that ask about government action directly. As a result, what
appears to be an effect of SR on policy attitudes may occur because both are caused by preferences
about size of government. Consequently, SR may predict racial policy stances because measures of
SR force people who endorse conservative views of what government should do to agree with the
SR items (Sniderman & Tetlock, 1986; Sniderman et al., 1991; Tetlock, 1994; also see Roth,
1990).
Previous Attempts to Overcome These Potential Problems
These alternative interpretations are reasonable, and much research has been done to
address them. To overcome the potential problems of spuriousness outlined above, previous
studies have typically conducted multiple regressions to gauge the ability of SR to predict policy
attitudes or candidate evaluations while holding constant various potentially confounding
variables, including race-neutral conservatism, beliefs about the proper size of government, and/or
egalitarian values. And in such analyses, SR has usually continued to predict attitudes when
statistically controlling for these competing constructs (see, e.g., Hughes, 1997; Kinder & Sanders,
1996; Sears, 1988; Sears et al., 1997; also see Henry & Sears, 2002; Sears & Henry, 2003, 2005).
Generally, though, these studies have not controlled for all of the variables that we include in the
structural equation models reported below.
Given the popularity of the SR construct, it is surprising that there remain some
unanswered, fundamental questions. Many past studies have identified outcome variables of which
SR is a predictor (e.g., Henry & Sears, 2002; Hughes, 1997; Kinder & Sanders, 1996; Sears, 1988;
Sears et al., 1997), but few have pointed out the instances in which SR does not predict. Another

Why Do White Americans 7 way to evaluate the performance of SR in predicting policy preferences is to assess discriminant
validity, by examining whether SR predicts policy attitudes that do not involve a focus on Black
Americans (see Schuman, 2000). If Black-focused SR truly represents racism, it should work well
in predicting Black-targeted policy attitudes and less well in predicting other, non-Black-targeted
policy attitudes—even if these non-Black-targeted policies still represent government-sponsored
redistribution of wealth. However, if SR’s association with Black-focused policy attitudes is
spuriously attributable to ideological conservatism or beliefs about government’s proper size or
role, then SR should be an equally effective predictor of attitudes toward a wide variety of
redistributive policies, regardless of their focus. Thus, the claim that SR is a measure of Black-
focused racial prejudice can be tested by attempting to identify the limiting conditions of its
predictive abilities.
To our knowledge, three attempts have been made to examine SR’s ability to predict a
range of policy attitudes across racial and non-racial domains. Kinder and Sanders (1996) found
that SR was a better predictor of racial policy attitudes (e.g., integration of schools, preferential
hiring of Blacks, and racial quotas in college admissions) than of non-racial policies, such as gay
rights and defense spending. In addition, SR predicted attitudes toward “issues where race is
present only by assumption” (e.g., food stamps and sanctions against the former apartheid regime
in South Africa; Kinder & Sanders, 1996, p. 121). These findings are consistent with the
conclusion that the SR scale does not predict opposition to all government activities equally well.
Similarly, Kinder and Mendelberg (2000) documented stronger apparent effects of racial prejudice
on aid to Blacks and other race-targeted policies than on social welfare policies not targeted for
blacks (while controlling for individualism and egalitarianism values). Sears, Citrin, Cheleden, &

Why Do White Americans 8 van Laar (1999) found that SR predicted opposition to explicitly Black-targeted policies better than
it did opposition to implicitly Black-targeted policies (e.g., crime or welfare) and in turn better than
opposition to policies explicitly targeted for other groups (e.g., immigration or language policies).
The Present Studies
The studies reported below sought to conduct analyses employing the best facets of all of
these previous studies while improving the methods employed. We conducted covariance structure
modeling, held constant all control variables at once, and gauged the ability of SR to predict
attitudes toward a variety of policies, both racial and non-racial. Specifically, we assessed
whether:
1. SR predicts race-related policy attitudes even when controlling for political
conservatism, equality values, and attitudes toward a large, interventionist government,
2. SR predicts race-related policy attitudes when SR questions with wordings that overlap
with the policies themselves are removed from the analysis, and
3. SR predicts attitudes toward redistributive policies that are not explicitly race-targeted
(e.g., welfare, food stamps, and aid to the poor) less well than it predicts attitudes toward explicitly
race-related policies.
The first study involved analysis of data from two national samples of adults who were
interviewed for the American National Election Studies (ANES). To identify what policies SR
does and does not predict, we used the ANES data and structural equation models to examine SR’s
associations, controlling for other factors, with a variety of policy attitudes—some racial, some
non-racial. In the second study, we experimentally manipulated the beneficiaries of a policy
(Blacks vs. women) to assess whether removing race targeting weakened the ability of SR to

Why Do White Americans 9 predict preferences among college students.
STUDY 1
Method
Data
Sample 1. For the 1990 American National Election Study (Miller, Kinder, Rosenstone, &
the National Election Studies, 1999), a representative national sample of 1,980 adults was
interviewed face-to-face in their homes between November 6, 1990, and January 26, 1991,
following the U.S. Presidential Election. The response rate was 71.4%.
Sample 2. The 2000 edition of the American National Election Study (Miller, Kinder,
Rosenstone, & the National Election Studies, 1999) consisted of both pre-election and post-
election interviews, which were conducted either by telephone or face-to-face. A representative
national sample of 1,807 adults were interviewed before the election (i.e., between September 5th
and November 6th), and 1,555 were interviewed after the election (i.e., between November 8th and
December 18th). The overall response rate was 61.2%. Some of the variables we used were
assessed during the pre-election interview, whereas others were asked during the post-election
interview. Specifically, all of the policy items, thermometer ratings of Republicans and Democrats,
party identification, and liberal-conservative self-identification were assessed in the pre-election
interview. The rest of the questions, including SR and thermometer ratings of conservatives and
liberals, were asked after the election.
Measures
Symbolic Racism
The NES symbolic racism scale consisted of four items, which asked respondents to

Why Do White Americans 10 agree or disagree with the following statements: “Over the past few years, Blacks have
gotten less than they deserve” (SR1); “Irish, Italians, Jewish and many other minorities
overcame prejudice and worked their way up. Blacks should do the same without any
special favors” (SR 2); “It’s really a matter of some people not trying hard enough; if
Blacks would only try harder, they could be just as well off as whites” (SR 3); and
“Generations of slavery and discrimination have created conditions that make it difficult for
Blacks to work their way out of the lower class” (reversed coded; SR4). Responses could
range across five values, which were coded between 0 (disagree strongly) and 1 (agree
strongly).
Egalitarianism
Anti-egalitarian values were measured with four questions that asked about what
the nation ought to do about social equality. They offered the same response choices as the
SR items. The statements were: “Our society should do whatever is necessary to make sure
that everyone has equal opportunity to succeed” (reverse coded; Anti-egalitarianism 1),
“This country would be better off if we worried less about how equal people are” (Anti-
egalitarianism 2), “It is not really that big a problem if some people have more of a chance
in life than others” (Anti-egalitarianism 3), and “If people were treated more equally in this
country, we would have many fewer problems” (reverse coded; Anti-egalitarianism 4).
These items were coded so that higher scores indicated greater anti-egalitarianism.
Liberal-conservative Ideology
Liberal-conservative ideology was assessed with two measures: (a) liberal-conservative
self-identification on a 7-point scale, and (b) the difference between ratings of liberals and

Why Do White Americans 11 conservatives of a 101-point feeling thermometer (assessing how warm or cold respondents felt
toward each group). Scores were coded to range from 0 to 1, with higher values indicating greater
conservatism. Many respondents responded “don’t know” or “I haven’t thought much about this”
when asked to place themselves on the 7-point liberal-to-conservative continuum. These people
were asked a follow-up: “If you had to choose, would you consider yourself a liberal or a
conservative?” People who said “liberal” were coded as being slight liberals (i.e., a score of 0.33),
and people who said “conservative” were coded as being slight conservatives (i.e., 0.67). People
who replied “moderate or middle of the road” to the follow-up question were coded at the midpoint
of the scale.
Desired Government Size
Two items measured respondents’ opinions about the proper role and size of government.
Respondents chose one of two statements that most agreed with their own views. One question
(Desired govt. size 1) asked respondents to choose between (a) “the less government the better,” or
(b) “there are more things that government should be doing.” The second item (Desired govt. size
2) offered these statements: (a) “...We need a strong government to handle today's complex
economic problems,” or (b) “the free market can handle these problems without government being
involved.” Higher scores (on a 0-to-1 scale) indicated a desire for less government.
Political Party Identification
Party identification was measured in two ways. First, respondents placed themselves on a 7-
point scale from strong Democrat to strong Republican. Second, we computed the difference
between the respondents’ thermometer ratings of Republicans and of Democrats. In both cases, the
recoded scores ranged from 0 to 1, with higher scores reflecting greater identification with the

Why Do White Americans 12 Republican Party.1
Attitudes toward Redistributive Policies
Preferential hiring and promotion of Blacks. The following question measured attitudes
toward affirmative action in both studies: “Some people say that, because of past discrimination,
Blacks should be given preference in hiring and promotion. Others say that such preference in
hiring and promotion of Blacks is wrong because it gives Blacks advantages they haven’t earned.
What about your opinion—are you for or against preferential hiring of Blacks?” Responses had
four possible values: 0 (favor strongly), 0.25 (favor not strongly), 0.75 (oppose not strongly), and 1
(oppose strongly).
Mandatory, compensatory affirmative action. The 2000 NES also included a separate
assessment of attitudes toward the government requiring companies to adopt affirmative action to
compensate for previous discriminatory policies against Blacks (see Stoker, 1998). It read: “Some
people think that if a company has a history of discriminating against Blacks when making hiring
decisions, then they should be required to have an affirmative action program that gives Blacks
preference in hiring. What do you think? Should companies that have discriminated against Blacks
have to have an affirmative action program? Do you feel strongly or not strongly?” Responses to
this question also ranged on a four-point scale from 0 (Feel strongly—should have to have
affirmative action) to 1 (Feel strongly—should not have to have affirmative action).
1 We also tested a version of the model in which the two liberal-conservative ideology items and the
two political party identification items all loaded on the same factor. The coefficients for the paths between
the predictor and outcome variables in that model did not differ substantially from the model we report below.
However, overall model fit was harmed.

Why Do White Americans 13
Other policies. Attitudes toward federal spending on food stamps (used in both studies),
welfare (Study 2), and social security (both studies), as well as attitudes toward assistance to the
homeless (Study 1) and assistance to the poor (Study 2), were measured by items that asked
respondents whether they believed government spending on these programs should be increased
(coded 0), decreased (coded 1), or kept the same (coded 0.5). (Those few participants who
volunteered a response to any of the spending questions that the program should be completely
eliminated were coded as supporting decreased funding.)
Demographics
Age, gender, level of highest educational attainment, and annual household income were
included as demographic control variables.
Samples
Sample 1
We restricted our analyses to those respondents who identified their race as “White.”
Although all respondents were asked most of the questions we used, the egalitarianism questions
and the preferential hiring question were asked only of a randomly selected subset of respondents.
In our case, this limited the data to 825 White respondents. Of these individuals, only respondents
who provided valid values on all variables were included in the analyses reported below. As a
consequence, 256 cases were excluded, and our final sample size was 569.2 Generally, missing
values made up less than 1 percent of each variable’s responses. (The item asking for self-
identification on the liberal-conservative dimension had the most missing data [8.6% of cases].)
2 We also ran a model based on data with the missing values replaced. Using the expectation-maximization (EM) procedure available in EQS 6.1, we were able to keep the data from all 825 people. The magnitudes of the coefficients did not differ substantially from the results reported below.

Why Do White Americans 14 Fifty-one percent of the sample was female. The median respondent was 43 years old and, in terms
of education completed, had a high school diploma with some college courses completed. The
median family income was in the $25,000 to $30,000 category (in 1989 dollars).
Sample 2
The data came from 708 respondents to the 2000 NES who identified their race as being
“White” and who had complete data. (There were originally 1,393 White respondents.3) The
sample was similar demographically to the sample of Study 1. Females and males were evenly split
(i.e., women represented 50.5% of the sample), and the mean age was 47 years. The average pre-
tax, household income was between $50,000 and $60,000 (in 1999 dollars).
Models and Parameter Estimation
For each sample, a covariance structure model was specified in which the policy attitudes
(each presumed to be perfectly measured with a single indicator) were predicted by latent factors
representing symbolic racism, egalitarianism, liberal-conservative ideology, desired size of
government, and party identification (each tapped by multiple indicators), as well as the
demographics (each presumed to be perfectly measured with a single indicator). The predictors
were allowed to freely covary with one another, and the errors to the policy attitudes were also
allowed to covary freely with one another. The metric of each latent variable was specified by
fixing an indicator’s loading at 1.0, thus allowing us to calculate unstandardized regression
3 As with Sample 1, EM imputation of missing data in this sample yielded coefficients that were similar to the results reported below. However, because of the dramatic improvement in statistical power as a result of adding the missing 685 people, tests of significance generally had lower p-values.

Why Do White Americans 15 coefficients using the robust maximum likelihood technique in EQS 5.7b (Bentler, 1992).
Results
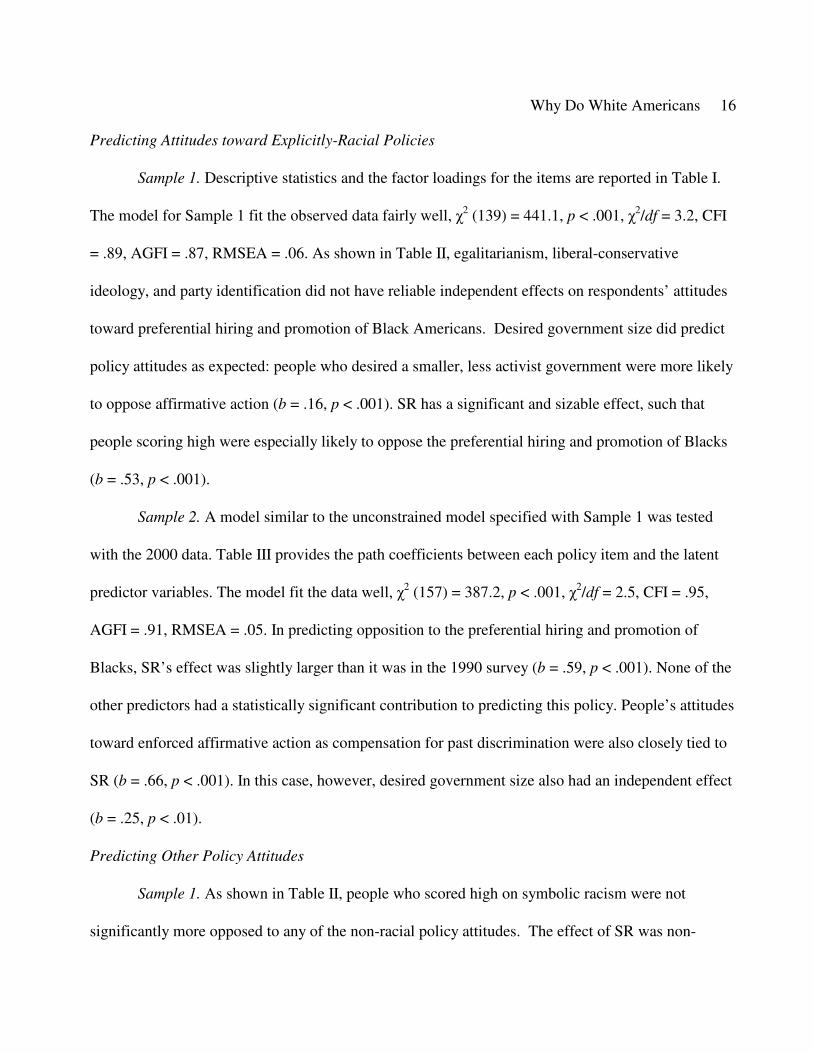
Why Do White Americans 16 Predicting Attitudes toward Explicitly-Racial Policies
Sample 1. Descriptive statistics and the factor loadings for the items are reported in Table I.
The model for Sample 1 fit the observed data fairly well, χ2 (139) = 441.1, p < .001, χ2/df = 3.2, CFI
= .89, AGFI = .87, RMSEA = .06. As shown in Table II, egalitarianism, liberal-conservative
ideology, and party identification did not have reliable independent effects on respondents’ attitudes
toward preferential hiring and promotion of Black Americans. Desired government size did predict
policy attitudes as expected: people who desired a smaller, less activist government were more likely
to oppose affirmative action (b = .16, p < .001). SR has a significant and sizable effect, such that
people scoring high were especially likely to oppose the preferential hiring and promotion of Blacks
(b = .53, p < .001).
Sample 2. A model similar to the unconstrained model specified with Sample 1 was tested
with the 2000 data. Table III provides the path coefficients between each policy item and the latent
predictor variables. The model fit the data well, χ2 (157) = 387.2, p < .001, χ2/df = 2.5, CFI = .95,
AGFI = .91, RMSEA = .05. In predicting opposition to the preferential hiring and promotion of
Blacks, SR’s effect was slightly larger than it was in the 1990 survey (b = .59, p < .001). None of the
other predictors had a statistically significant contribution to predicting this policy. People’s attitudes
toward enforced affirmative action as compensation for past discrimination were also closely tied to
SR (b = .66, p < .001). In this case, however, desired government size also had an independent effect
(b = .25, p < .01).
Predicting Other Policy Attitudes
Sample 1. As shown in Table II, people who scored high on symbolic racism were not
significantly more opposed to any of the non-racial policy attitudes. The effect of SR was non-
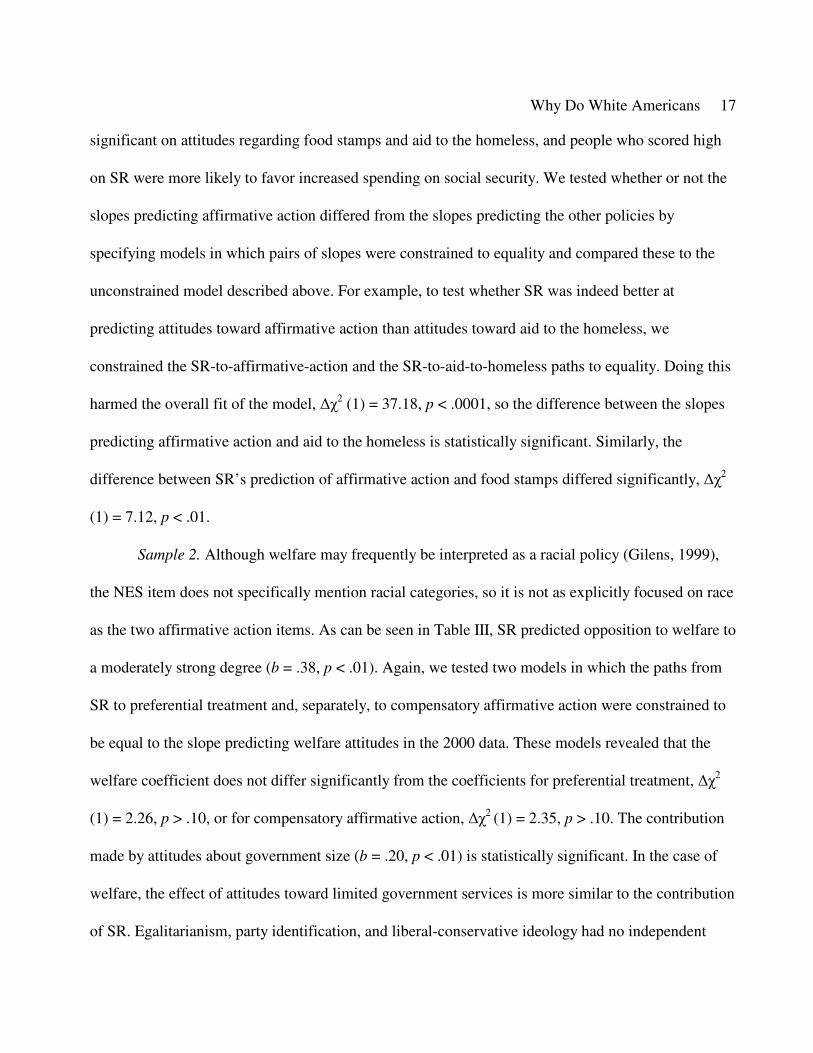
Why Do White Americans 17 significant on attitudes regarding food stamps and aid to the homeless, and people who scored high
on SR were more likely to favor increased spending on social security. We tested whether or not the
slopes predicting affirmative action differed from the slopes predicting the other policies by
specifying models in which pairs of slopes were constrained to equality and compared these to the
unconstrained model described above. For example, to test whether SR was indeed better at
predicting attitudes toward affirmative action than attitudes toward aid to the homeless, we
constrained the SR-to-affirmative-action and the SR-to-aid-to-homeless paths to equality. Doing this
harmed the overall fit of the model, ∆χ2 (1) = 37.18, p < .0001, so the difference between the slopes
predicting affirmative action and aid to the homeless is statistically significant. Similarly, the
difference between SR’s prediction of affirmative action and food stamps differed significantly, ∆χ2
(1) = 7.12, p < .01.
Sample 2. Although welfare may frequently be interpreted as a racial policy (Gilens, 1999),
the NES item does not specifically mention racial categories, so it is not as explicitly focused on race
as the two affirmative action items. As can be seen in Table III, SR predicted opposition to welfare to
a moderately strong degree (b = .38, p < .01). Again, we tested two models in which the paths from
SR to preferential treatment and, separately, to compensatory affirmative action were constrained to
be equal to the slope predicting welfare attitudes in the 2000 data. These models revealed that the
welfare coefficient does not differ significantly from the coefficients for preferential treatment, ∆χ2
(1) = 2.26, p > .10, or for compensatory affirmative action, ∆χ2 (1) = 2.35, p > .10. The contribution
made by attitudes about government size (b = .20, p < .01) is statistically significant. In the case of
welfare, the effect of attitudes toward limited government services is more similar to the contribution
of SR. Egalitarianism, party identification, and liberal-conservative ideology had no independent

Why Do White Americans 18 effects on attitudes toward spending on welfare.
The effect of SR on attitudes toward spending on food stamps was larger than in Sample 1
and was statistically significant (b = .28, p < .05), but it was smaller than SR’s effects in predicting
affirmative action or welfare attitudes. None of the other predictor variables included in the model
contributed to a statistically significant degree. The constrained models indicated that SR was a
better predictor of both forms of affirmative action than food stamps, ∆χ2 (1) = 5.19, p < .05 and ∆χ2
(1) = 4.34, p < .05, for preferential treatment and for compensatory affirmative action, respectively.
SR did not show a statistically significant relationship with attitudes regarding spending on
aid to the poor (b = -.12, ns). In this case, both anti-egalitarianism (b = .51, p < .001) and attitudes
toward government size (b = .20, p < .01) were the only other variables that exhibited statistically
significant effects. The constrained models revealed that not only did SR’s prediction of aid to the
poor differ significantly from the slopes for the two forms of affirmative action, but it also differed
from the slope predicting welfare, ∆χ2 (1) = 14.28, p < .001.
The findings concerning social security replicated what was found in Sample 1. SR
negatively predicted opposition to social security spending (b = -.35, p < .001). Attitudes toward
government size (b = .20, p < .01) and anti-egalitarianism (b = .34, p < .01) had positive effects, as
they did in 1990; however, party identification did not have an independent effect in 2000.
Discussion
We found evidence consistent with the claim that attitudes toward redistributive policies are
driven in part by egalitarian values, attitudes toward big government, and liberal-conservative
ideology. But even when controlling for these factors, SR was strongly related to attitudes toward
affirmative action for Black Americans. And SR was not positively associated with opposition to

Why Do White Americans 19 redistributive government efforts that did not explicitly target Blacks. SR did not predict Whites’
attitudes toward assistance to the homeless or toward government spending on food stamps. This
pattern is consistent with the conclusion that SR may be a determinant of opposition to government
aid to Blacks via the processes outlined by SR theory. Welfare spending appears to be an
exception—the test of nested models revealed that SR predicted welfare attitudes to the same degree
as the affirmative action programs—but the magnitude of the slope puts it somewhere between
affirmative action programs and spending on food stamps and the poor in terms of SR’s ability to
predict variability on this issue. This may not be too surprising because welfare in particular carries a
clear racial connotation for most Americans (Gilens, 1999). The greater success of SR in predicting
race-targeted than non-targeted redistributive programs is consistent with the claim that SR is not
merely a proxy for general political conservatism, opposition to economic redistribution, or
preference for small government. Rather, race appears to be an important factor (although certainly
not the only one) in the minds of Whites when they calculate their stance on racial policies such as
affirmative action. The finding that SR predicts attitudes toward affirmative action more strongly
than attitudes toward food stamps or aid to the poor—is consistent with the contention that symbolic
racism is tapping some sort of race-based sentiment.
Furthermore, SR’s correlation with support for increased governmental spending on social
security goes against the criticism that SR is just a non-racial measure of conservatism and/or
preference for smaller government. A possible explanation for this correlation is that social security
may have particularly racial connotations for Americans. However, as Winter (2006) argued, for
many Americans the prototypical social security recipient is a White person. If so, SR’s relation with
endorsement of social security spending may have occurred because people high in SR are especially

Why Do White Americans 20 likely to endorse government programs that offer help to older Whites who have retired after years of
hard work. These data replicate the correlations between SR and social security spending found by
Winter (2006). Although the result was not expected, this interpretation is consistent with the
essentially racial nature of SR.
STUDY 2
Another explanation for SR’s differential predictive abilities could be that White respondents
who score high on the SR scale are troubled by the idea of government helping Blacks, but they also
have a problem with the idea of government helping any targeted social group. Perhaps SR predicts
opposition to preferential treatment of Blacks better than it predicts attitudes toward food stamps
because beneficiaries of affirmative action are chosen based solely on their membership in a
particular group and not because of any demonstrated socioeconomic need. According to this
argument, therefore, SR should predict any policy attitude where any targeted groups stand to
benefit, not just racial groups (see Carmines & Merriman, 1993). The fact that the affirmative action
variables in Study 1 specifically mentioned Blacks would be of secondary importance; high-SR
respondents would have opposed this policy had any group in society been singled out for special
treatment. It would be worthwhile, then, to compare Black-targeted redistributive policies to policies
targeting other groups. If this group-targeting argument is correct, high SR should correlate with
opposition to redistributive policies whenever a particular social group stands to benefit (also see
Sears & Henry, 2003).
In Study 2, the beneficiary of the policy was experimentally manipulated by asking
respondents how supportive they were of the government setting aside contracts for either (1) Black-
owned businesses or (2) women-owned businesses. Bobo and Kluegel (1993) used a similar strategy

Why Do White Americans 21 (also see Sidanius et al., 2000; Stoker, 1998), and found that prejudice predicted Whites’ opinions
about race-targeted policies better than they predicted opinions about income-targeted versions of the
same policies. This is consistent with the expectations of symbolic racism theory, but Bobo and
Kluegel did not measure symbolic racism. Furthermore, our distinction is not between race- and
income-targeted policies; rather, we explore whether SR differentially predicts attitudes toward the
same policy that targets different groups in society. In other words, we used an experimental design
to test whether the relationship between symbolic racism and attitudes toward affirmative action is
moderated by characteristics of the groups who stand to benefit.
Method
Sample
A 13-page questionnaire concerning a variety of social and political issues was administered
to 210 undergraduate students at California State University, Northridge, during the Fall, 2001, and
Spring, 2002, semesters. Students received partial credit for the requirements of an introductory
psychology course. Only the 84 students who reported their ethnicity/race as being
“White/Caucasian” were eligible for inclusion in this study. Of these, 69% were female, and 31%
were male. Seven cases with missing data were removed, which created a final sample size of 77.
Variables
Symbolic Racism
Six items assessed SR. The item wordings are provided in the appendix. The response
options ranged along a 7-point scale. As with all of the measured variables reported below, the
variable scores were transformed to 0-to-1 scales. These six items were averaged to create a single
composite SR score for each respondent (Cronbach’s alpha = .78).

Why Do White Americans 22 Anti-Egalitarianism
Twelve items assessed the value people placed on equality of opportunity and equality of
outcome (see McClosky & Zaller, 1984; Rae, 1981). A sample item from the former scale is, “How
much do you think it would help or hurt America if we were to provide equal opportunities for all
social groups to get ahead in life?” An example from the outcome scale is, “Do you think reducing
the differences in wealth between people in America is a good thing, a bad thing, or neither good nor
bad?” There were seven response options that were coded on a 0-to-1 scale. Higher scores indicated
greater anti-egalitarianism. The resulting factors had acceptable to fairly good reliability (α = .58 for
outcomes and α = .73 for opportunity).
Conservative Self-Identification
Liberal-conservatism was measured on a 7-point scale ranging from 0 (extremely liberal) to 1
(extremely conservative).
Political Party Identification
Respondents were asked to identify as Democrat, Republican, or Independent or something
else. Those who considered themselves Democrats or Republicans were asked whether they
considered their affiliation to be strong or not very strong, and those who selected Independent or
something else were asked whether they thought of themselves as being closer to one party or the
other or equally close to both parties. All of these response options created a 7-point scale from 0
(strong Democrat) to 1 (strong Republican).
Feelings toward Democrats and Republicans were rated on a 9-point scale from extremely
warm to extremely cold. The difference between each respondent’s ratings was transformed to range
from 0 (i.e., maximally warm toward Democrats) to 1 (i.e., maximally warm toward Republicans).

Why Do White Americans 23 The mean of these two items defined respondents’ political party preference scores. The reliability
of these questions was quite high (α = .79).
Limited Government Role
Four items measured individuals’ beliefs about the proper role of government in the lives of
individual citizens and businesses. Participants were asked questions, such as: “Do you think
government involvement in the lives of individual people is good, bad, or neither good nor bad?”
Responses were made on 7-point scales (transformed to 0-to-1 scales); higher scores indicated
support for a more limited role for government. The reliability for the four items was acceptable (α =
.58).
Contract Set-Asides for Blacks or Women
The dependent variable was attitude toward government contract set-asides. The target group
of the policy was manipulated between groups. Randomly-selected halves of the sample were asked
about set-asides for businesses owned by either Black Americans or women. The exact wording was
as follows (with the wording manipulations presented in parentheses): “Some people think that
government agencies should definitely give some of their contracts to (women-owned/Black-owned)
businesses. Other people think that government agencies should not use the (gender/race) of the
owners of a business when deciding whether to give a contract to it. How about your opinion--do you
favor or oppose government agencies definitely giving some contracts to (women-owned/Black-
owned) businesses?” Participants rated the degree to which they favored or opposed this practice on
a 7-point scale from 0 (strongly favor) to 1 (strongly oppose). The manipulated policy beneficiary
variable was coded 0 for those asked about Black-owned businesses and 1 for those asked about
women-owned businesses.

Why Do White Americans 24
Results
The key test is the comparison between the SR coefficients predicting scores on the
two versions of the contract set-asides item. If SR mainly reflects racism, and not simply
concerns about group-targeted policies, then the simple slope for the Black-targeted policy
item should be greater than the simple slope for the women-targeted item. We conducted a
hierarchical multiple regression analysis to see whether the ability of SR to predict policy
opposition depended on the beneficiary of the policy. To test this SR × Policy Beneficiary
interaction, we centered the scores around the respective variables’ means and created an
interaction term by multiplying participants’ SR score by their score for the dummy-coded
policy-beneficiary manipulation (see Table IV for descriptive statistics and item correlations).
In step 1 of the multiple regression analysis, the policy beneficiary variable and all of the
control variables (viz., liberal-conservative self-identification, political party preference,
limited government role, egalitarianism of opportunity, and egalitarianism of outcomes) were
entered as predictors of policy opposition; at step 2, SR was added; and, finally the SR ×
Policy Beneficiary term was added in step 3.
The results of the multiple regression analysis are presented in Table V. Step 1 does
not do a particularly good job of predicting policy opposition. However, consistent with the
previous studies, the addition of symbolic racism in the second step improves the regression
model to a statistically significant degree. Higher scores on SR were associated with greater
opposition to contract set-asides, b = 0.46, p < .05. More important, in the final model
specification, there is evidence for a Symbolic Racism × Policy Beneficiary interaction, b = -
0.75, p < .05. Adding this interaction term to the overall equation significantly improves the

Why Do White Americans 25 prediction of the model over and above the contributions of all other variables, ∆R
2 = .05, p <
.05.
To interpret the interaction, we calculated simple slopes for both the Black-
beneficiaries and the female-beneficiaries subsamples (see Aiken & West, 1991; Preacher,
Patrick, & Curran, 2006). The mean values of the control variables (i.e., values of 0, because
the variables were centered) were plugged into the rearranged equations. The simple slopes
analysis revealed that SR did not significantly predict opposition to contract set-asides when
the beneficiaries were women, b = 0.12, SE b = 0.26, p = .64, but strongly predicted
opposition when the beneficiaries were Blacks, b = 0.87, SE b = 0.28, p = .003.4
Discussion
The results of Study 2 bolster the findings from the previous study. As with the
studies that used national probability samples, the student data provide an opportunity to test
the effect of SR while controlling for the effects of other, race-neutral variables. This
experimental manipulation affords the additional opportunity to test SR’s independent effect
on attitudes toward two versions of the same policy. The only difference between the two
versions of affirmative action was the target group that was specified as the beneficiary of the
policy: Black-owned businesses versus women-owned businesses.
SR predicted attitudes toward race-focused affirmative action but not attitudes toward
gender-focused affirmative action. The pattern of slopes, in combination with the findings of
the other study that used different measures and vastly different samples, represents evidence
4 When we drop from the analyses all of those participants who belong to one of the beneficiary groups—in this case, that would entail excluding females—we are left with 26 male, White respondents. Despite the low statistical power among
this sample, the SR × Policy Beneficiary interaction remains statistically significant, b = -2.23, SE b = 0.79, p = .012, and

Why Do White Americans 26 that symbolic racism taps racial sentiment, not just respondents’ frustration with or anger
over redistributive policies or group-targeted policies in general. These results are consistent
with the hypothesis that White opposition to racial policies incorporates an explicitly racial
component; opposition does not reflect a blanket rejection of group-based targeting.
GENERAL DISCUSSION
The studies presented here provide evidence that, although Whites’ attitudes toward
racial policies may be the results of general political orientations, these attitudes are also a
function of considerations specific to race. First, our studies explore the possibility that
measures of symbolic racism (SR) have sometimes posed a no-win situation for non-racist,
conservative respondents (Sniderman, Crosby, & Howell, 2000; Tetlock, 1994; also see
Feldman & Huddy, 2005). Such individuals, when answering SR questions, would agree that
Blacks should work their way up just like everyone else. But these individuals may harbor no
ill will toward Black Americans in particular; they may simply feel that everyone should have
to work his or her way up. The SR scale, therefore, may confound anti-Black racism with
basic race-neutral, conservative and individualistic principles.
The studies presented here appear to suggest that this account does not completely
explain the covariations observed in past studies. Conservative ideology and opposition to
large government were often strongly associated with policy preferences and with symbolic
racism. However, the SR scale strongly predicted Whites’ opposition to policies designed to
aid Blacks, even after the scale’s association with ideology and beliefs about government
involvement were statistically controlled. This pattern appeared in each instance when
follows the expected pattern.

Why Do White Americans 27 attitudes toward a race-focused policy were being predicted.
SR’s predictive properties become attenuated when the policy strayed from
specifically targeting African Americans. When attitudes such as ideology and the role of
government were controlled, symbolic racism did not predict attitudes toward assistance to
the homeless, assistance to the poor, or food stamps, and predicted attitudes toward welfare
as powerfully as it predicted attitudes toward affirmative action for Black Americans. This is
despite the possibility that the homeless, the poor, and recipients of food stamps and welfare
may be viewed by many Whites as being disproportionately Black (Gilens, 1999).
Our data also challenge the conclusion that the SR scale’s apparent predictive success
is attributable partly to the fact its items are too closely related in content to the racial policy
attitudes being predicted. Study 2 used variations of the SR scale that are not as problematic
in this regard as were the NES scales, which were more closely tied to denial of anti-Black
discrimination and resentment of Blacks’ anger over their position in society than to
perceptions of undeserved group-based claims or economic redistribution. And in Study 2,
SR exhibited stronger associations with race-targeted policy stances than with gender-
targeted policy stances despite identical wordings of the SR questions.
Our findings in this regard resonate with findings reported by Sears and his
colleagues, who found that SR predicts opposition to Black candidates for public office
independently of liberal-conservatism (Sears et al., 1997; Tarman & Sears, 2005). This has
also been more recently demonstrated with the latest version of the symbolic racism scale
(Henry & Sears, 2002). Our study and other recent research reveal that the effects of SR on
racial policy preferences are almost identical irrespective of what particular SR items are

Why Do White Americans 28 used (e.g., Tarman & Sears, 2005). Most important, the effects are the same regardless of
whether the items refer to politics and government or merely to Blacks’ social status, such as
the magnitude of discrimination they face or how hard-working they are perceived to be.
Our findings also resonate with other past studies. In particular, a number of studies
have controlled for individuals’ non-racial attitudes (e.g., liberal-conservatism), and doing so
did not weaken the associations of SR with racial policy attitudes (see, e.g., Kinder &
Sanders, 1996 Sears et al., 1997; Tarman & Sears, 2005; also see Hutchings & Valentino,
2004; Sears & Henry, 2005). The complementary (but less frequently adopted) paradigm used
here is to compare SR’s impact on attitudes toward explicitly racial, implicitly racial, and
non-racial policies.
Much evidence has been presented before attesting to symbolic racism’s predictive
capabilities. But no past study has tested the discriminant validity of symbolic racism
measures as we have here. By identifying the variables that it does predict and those that it
does not, the results reported here suggest that much of the variance that explains opposition
to explicitly racially-targeted programs is due to anti-Black antipathy blended with
perceptions of value violation, not simply anti-redistributive attitudes or attitudes toward
group-based claims and demands.
Finally, these studies illustrate the continued importance and meaningfulness of
parsing opinions about racial policies. Enough variability exists in White Americans’ policy
attitudes to make meaningful claims about psychological and political antecedents. Even
attitudes toward affirmative action programs like preferences in hiring and promotion, which
appear to be widely opposed, provide a fruitful context for exploring the influences of wide-

Why Do White Americans 29 ranging beliefs and psychological values. Indeed, affirmative action appears to be the most
racial of all the redistributive policies examined here.

Why Do White Americans 30
References
Aiken, L. S., & West, S. G. (1991). Multiple regression: Testing and reporting interactions.
Newbury Park, CA: Sage.
Bentler, P. M. (1992). EQS structural equations program manual. Los Angeles: BMDP
Statistical Software.
Bobo, L. D. (1997). The color line, the dilemma, and the dream. In J. Higham (Ed.), Civil rights
and social wrongs: Black-White relations since World War II. University Park, PA:
Pennsylvania State University.
Bobo, L., & Kluegel, J. R. (1993). Opposition to race-targeting: Self-interest, stratification
ideology, or racial attitudes? American Sociological Review, 58, 443-464.
Bobo, L., & Kluegel, J. R. (1997). Status, ideology, and dimensions of Whites’ racial beliefs and
attitudes: Progress and stagnation. In S. A. Tuch & J. K. Martin (Eds.), Racial attitudes in
the 1990s: Continuity and change (pp. 93-120). Westport, CT: Praeger.
Bobo, L. D., & Smith, R. A. (1998). From Jim Crow racism to laissez-faire racism: The
transformation of racial attitudes. In W. F. Katkin, N. Landsman, & A. Tyree (Eds.), Beyond
pluralism: The conception of groups and group identities in America (pp. 182-220). Urbana,
IL: University of Illinois.
Carmines, E. G., & Merriman, W. R., Jr. (1993). In P. M. Sniderman, P. E. Tetlock, & E. G.
Carmines (Eds.), Prejudice, politics, and the American dilemma (pp. 237-255). Stanford,
CA: Stanford University.
Federico, C. M., & Sidanius, J. (2002). Racism, ideology, and affirmative action revisited: The
antecedents and consequences of "principled objections" to affirmative action. Journal of

Why Do White Americans 31
Personality and Social Psychology, 82, 488-502.
Feldman, S., & Huddy, L. (2005). Racial resentment and White opposition to race-conscious
programs: Principles or prejudice? American Journal of Political Science, 49, 168-183.
Gilens, M. (1999). Why Americans hate welfare: Race, media, and the politics of antipoverty
policy. Chicago: University of Chicago.
Henry, P. J., & Sears, D. O. (2002). The Symbolic Racism 2000 scale. Political Psychology, 23,
253-283.
Hughes, M. (1997). Symbolic racism, old-fashioned racism, and whites’ opposition to affirmative
action. In S. A. Tuch & J. K. Martin (Eds.), Racial attitudes in the 1990s: Continuity and
change (pp. 45-75). Westport, CT: Praeger.
Hutchings, V. L., & Valentino, N. A. (2004). The centrality of race in American politics. Annual
Review of Political Science, 7, 383-408.
Kinder, D. R., & Mendelberg, T. (2000). Individualism reconsidered: Principles and prejudice in
contemporary American opinion. In D. O. Sears, J. Sidanius, & L. Bobo (Eds.), Racialized
politics: The debate about racism in America (pp. 44-74). Chicago: University of Chicago.
Kinder, D. R., & Sanders, L. M. (1996). Divided by color: Racial politics and democratic ideals.
Chicago: University of Chicago.
McClosky, H., & Zaller, J. (1984). The American ethos. Cambridge, MA: Harvard University.
McConahay, J. B. (1986). Modern racism, ambivalence, and the modern racism scale. In J. F.
Dovidio & S. L. Gaertner (Eds.), Prejudice, discrimination, and racism (pp. 91-126). New
York: Academic Press.
McConahay, J. B., & Hough, J., Jr. (1976). Symbolic racism. Journal of Social Issues, 32, 23-45.

Why Do White Americans 32 Miller, W. E., Kinder, D. R., Rosenstone, S. J., & the National Election Studies. (1999).
American National Election Study, 1990: Post-election survey [dataset]. Ann Arbor, MI:
University of Michigan, Center for Political Studies, and Inter-university Consortium for
Political and Social Research [producer and distributor]. Available at
www.electionstudies.org.
The National Election Studies. (2001). American National Election Study, 2000: Pre- and post-
election survey [dataset]. Ann Arbor, MI: University of Michigan, Center for Political
Studies [producer and distributor]. Available at www.electionstudies.org.
Preacher, K. J., Curran, P. J., & Bauer, D. J. (2006). Computational tools for probing interactions
in multiple linear regression, multilevel modeling, and latent curve analysis. Journal of
Educational and Behavioral Statistics, 31, 437-448.
Rae, D. (1981). Equalities. Cambridge, MA: Harvard University.
Roth, B. M. (1990). Social psychology’s “racism.” The Public Interest, 98, 26-36.
Schuman, H. (2000). The perils of correlation, the lure of labels, and the beauty of negative
results. In D. O. Sears, J. Sidanius, & L. Bobo (Eds.), Racialized politics: The debate about
racism in America (pp. 302-323). Chicago: University of Chicago.
Schuman, H., Steeh, C., Bobo, L., & Krysan, M. (1997). Racial attitudes in America: Trends and
interpretations (Rev. ed.). Cambridge, MA: Harvard University.
Sears, D. O., (1988). Symbolic racism. In P. A. Katz & D. A. Taylor (Eds.), Eliminating racism:
Profiles in controversy (pp. 53-84). New York: Plenum Press.
Sears, D. O., Citrin, J., Cheleden, S. V., & van Laar, C. (1999). Cultural diversity and
multicultural politics: Is ethnic balkanization psychologically inevitable? In D. A. Prentice
& D. T. Miller (Eds.), Cultural divides: Understanding and overcoming group conflict (pp.

Why Do White Americans 33
35-79). New York: Russell Sage.
Sears, D. O., & Henry, P. J. (2003). The origins of symbolic racism. Journal of Personality and
Social Psychology, 85, 259-275.
Sears, D. O., & Henry, P. J. (2005). Over thirty years later: A contemporary look at symbolic
racism. In M. P. Zanna (Ed.), Advances in Experimental Social Psychology (Vol. 37, pp. 95-
150). San Diego, CA: Elsevier Academic.
Sears, D. O., & Kinder, D. R. (1971). Racial tensions and voting in Los Angeles. In W. Hirsch
(Ed.), Los Angeles: Viability and prospects for metropolitan leadership (pp. 51-88). New
York: Praeger.
Sears, D. O., van Laar, C., Carrillo, M., & Kosterman, R. (1997). Is it really racism? The origins
of white Americans’ opposition to race-targeted policies. Public Opinion Quarterly, 61, 16-
53.
Sidanius, J., Devereux, E., & Pratto, F. (1992). A comparison of symbolic racism theory and
social dominance theory as explanations for racial policy attitudes. Journal of Social
Psychology, 132, 377-395.
Sidanius, J., Pratto, F., & Bobo, L. (1996). Racism, conservatism, affirmative action, and
intellectual sophistication: A matter of principled conservatism or group dominance?
Journal of Personality and Social Psychology, 70, 476-490.
Sidanius, J., Singh, P., Hetts, J. J., & Federico, C. M. (2000). It’s not affirmative action, it’s the
Blacks: The continuing relevance of race in American politics. In D. O. Sears, J. Sidanius, &
L. Bobo (Eds.), Racialized politics: The debate about racism in America. (pp. 183-219).
Chicago: University of Chicago.
Sniderman, P. M., & Carmines, E. G. (1997). Reaching beyond race. Cambridge, MA: Harvard

Why Do White Americans 34
University.
Sniderman, P. M., Crosby, G. C., & Howell, W. G. (2000). The politics of race. In D. O. Sears, J.
Sidanius, & L. Bobo (Eds.), Racialized politics: The debate about racism in America. (pp.
236- 279). Chicago: University of Chicago.
Sniderman, P. M., & Piazza, T. (1993). The scar of race. Cambridge, MA: Belknap Press.
Sniderman, P. M., Piazza, T., Tetlock, P. E., & Kendrick, A. (1991). The new racism. American
Journal of Political Science, 35, 423-447.
Sniderman, P. M., & Tetlock, P. E. (1986). Symbolic racism: Problems of motive attribution in
political debate. Journal of Social Issues, 42, 129-150.
Sniderman, P. M., Tetlock, P. E., Carmines, E. G., & Peterson, R. S. (1993). The politics of the
American dilemma: Issue pluralism. In P. M. Sniderman, P. E. Tetlock, & E. G. Carmines
(Eds.), Prejudice, politics, and the American dilemma (pp. 212-236). Stanford, CA:
Stanford University.
Stoker, L. (1998). Understanding Whites’ resistance to affirmative action: The role of principled
commitments and racial prejudice. In J. Hurwitz & M. Peffley (Eds.), Perception and
prejudice: Race and politics in the United States (pp. 135-170). New Haven, CT: Yale
University.
Tarman, C., & Sears, D. O. (2005). The conceptualization and measurement of symbolic racism.
The Journal of Politics, 67, 731-761.
Tetlock, P. E. (1994). Political psychology or politicized psychology: Is the road to scientific hell
paved with good moral intentions? Political Psychology, 15, 509-529.
Winter, N. J. G. (2006). Beyond welfare: Framing and the racialization of White opinion on
social security. American Journal of Political Science, 50, 400-420.

Why Do White Americans 35
Appendix
Symbolic Racism Items from the Student Survey (Study 2)
1. “How much do you agree or disagree with this statement: ‘Generations of slavery and
discrimination have created conditions that make it difficult for Blacks to work their
way out of the lower class.’” (Response options: 0 [strongly agree], 0.17 [more or
less agree], 0.33 [somewhat agree], 0.5 [neither agree nor disagree], 0.67 [somewhat
disagree], 0.83 [more or less disagree], and 1.0 [strongly disagree].)
2. “How much do you agree or disagree with this statement: ‘Blacks are getting too
demanding in their push for civil rights.’” (Reverse coded)
3. “How much do you agree or disagree with this statement: ‘Discrimination against Blacks is
no longer a problem in the United States.’” (Reverse coded)
4. “How much do you agree or disagree with this statement: ‘Although Black Americans still
face some discrimination, they can easily overcome it by working hard.’” (Reverse
coded)
5. “How easy or difficult is it for you to understand the anger of Black Americans?”
(Response options were: 0 [extremely easy], 0.17 [very easy], 0.33 [somewhat easy],
0.5 [neither easy nor difficult], 0.67 [somewhat difficult], 0.83 [very difficult], and 1.0
[extremely difficult].)
6. “Over the past few years, have Black Americans gotten less than they deserve, more than
they deserve, or about what they deserve?” (Response options were: 0 [a great deal
less], 0.17 [quite a bit less], 0.33 [a little less], 0.5 [about what they deserve], 0.67 [a
little more], 0.83 [quite a bit more], and 1.0 [a great deal more].)

Table I Descriptive Statistics and Unstandardized Factor Loadings for Variables in the 1990 and 2000 Samples Sample 1
Sample 2
Item
M
SD
Loading
M
SD
Loading
Aid to the homeless
0.21
0.29
--
--
--
--
Preferential hiring and promotion
0.79
0.33
--
0.87
0.25
--
Food stamps
0.58
0.31
--
0.62
0.33
--
Social security spending
0.22
0.28
--
0.22
0.29
--
Compensatory affirmative action
-- -- --
0.56
0.44
-- Aid to the poor
--
--
--
0.34
0.34
--
Welfare
--
--
--
0.66
0.35
--
Liberal-conservative identification
0.53
0.21
1.00a
0.57
0.28
1.00a
Conservative - liberal thermometer
0.53
0.16
0.89
0.53
0.17
0.64
Political party identification
0.49
0.36
1.00a
0.51
0.35
1.00a
Republican - Democrat thermometer
0.53
0.16
0.55
0.50
0.20
0.59
Anti-egalitarianism 1
0.14
0.22
0.39
0.20
0.28
0.46
Anti-egalitarianism 2
0.53
0.34
1.00a
0.51
0.34
1.00a
Anti-egalitarianism 3
0.42
0.31
0.82
0.40
0.30
0.73
Anti-egalitarianism 4
0.34
0.30
0.64
0.39
0.32 0.76
Desired government size 1
0.35
0.47
1.00a
0.44
0.50
1.00a
Desired government size 2
0.27
0.44
0.59
0.48
0.50
0.76
SR 1
0.55
0.29
0.69
0.66
0.30
0.74
SR 2
0.69
0.29
0.95
0.75
0.28
0.87
SR 3
0.60
0.32
1.00a
0.60
0.32
1.00a
SR 4
0.45
0.33
0.73
0.59
0.34
0.95
aFactor loading fixed at 1.0.

Table II Path Coefficients of the Structural Equation Model Using the 1990 ANES Data
Outcome variable
Opposition to
preferential hiring of Blacks
Opposition to food stamps
Opposition to aid to the homeless
Opposition to social security
Predictor
b
SE
β
b
SE
β
b
SE
β
b
SE
β
Symbolic racism
0.53***
0.09
.38
0.16
0.09
.13
0.08
0.08
.07
-0.42***
0.08
-.35
Party identification
0.02
0.08
.02
-0.06
0.07
-.06
-0.06
0.06
.06
0.14*
0.07
.15 Liberal-conservative ideology
-0.02
0.16
.01
0.38**
0.14
.19
0.22
0.13
.12
-0.14
0.15
.07
Government size
0.16***
0.05
.20
0.08*
0.04
.11
0.16***
0.04
.22
0.09*
0.04
.13
Anti-egalitarian values
0.00
0.12
.00
0.26*
0.13
.17
0.30*
0.13
.21
0.51***
0.13
.37
Age 0.000 0.001 .02
-0.002* 0.001 -.10
0.000 0.001 -.01
-0.001 0.001 -.05
Gender (male) -0.01 0.03 -.02
-0.05* 0.03 -.09
-0.05* 0.02 -.09
-0.02 0.03 -.03
Education 0.01 0.004 .07
0.001 0.001 .02
0.01*** 0.003 .09
0.003 0.003 .05
Income 0.002 0.001 .07
0.003* 0.001 .09
0.003* 0.001 .12
0.002 0.001 .09 R
2
.20
.16
.20
.20

Note: N = 569. Variables were scored such that higher scores entail higher racism, greater opposition to equality and large government, more conservative ideology, and stronger identification with the Republican Party. Standard errors are robust estimates provided by EQS version 5.7b. *p < .05 **p < .01 ***p < .001

Table III Path Coefficients of the Structural Equation Model Using 2000 NES Data
Outcome variable
Opposition to
preferential hiring of Blacks
Opposition to compensatory
affirmative action
Opposition to
welfare
Opposition to food
stamps
Opposition to aid to
the poor
Opposition to social
security Predictor
b
SE
β
b
SE β
b
SE β
b
SE β
b
SE β
b
SE β
Symbolic racism
0.59***
0.09
.53
0.66***
0.15
.34
0.38**
0.12
.25
0.28*
0.12
.19
-0.12
0.11
-.08
-0.35***
0.10
-.27
Party identification
-0.02
0.08
-.02
-0.09
0.14
-.06
-0.14
0.11
-.12
0.09
0.10
.08
-0.14
0.10
-.13
-0.02
0.09
-.02 Liberal-conservatism
0.04
0.12
.04
-0.08
0.21
.04
0.21
0.17
.13
0.02
0.16
.01
0.20
0.17
.12
0.09
0.14
.06 Government size
0.07
0.05
.11
0.25**
0.09
.22
0.20**
0.08
.22
0.11
0.07
.12
0.20**
0.08
.23
0.20**
0.06
.26 Anti-egalitarian values -0.13
0.09
-.12
0.14
0.18
.07
0.07
0.14
.05
0.14
0.13
.10
0.51***
0.15
.33
0.34**
0.13
.26
Age 0.001 0.001 .04 0.002* 0.001 .08 -0.001 0.001 -.07 0.000 0.01 -.02 -0.002* 0.001 -.09 0.000 0.001 -.03
Gender (male) -0.02 0.02 -.05 0.04 0.03 .04 -0.05 0.03 -.07 -0.05* 0.03 -.08 0.004 0.03 .01 0.07** 0.02 .11
Education 0.03*** 0.01 .15 0.03* 0.01 .11 0.02 0.10 .08 0.01 0.01 .05 0.03** 0.01 .12 0.01 0.01 .06
Income 0.002 0.003 .03 -0.01** 0.004 -.11 0.001 0.003 .01 0.001 0.003 .01 -0.004 0.003 -.04 -0.002 0.003 -.03 R
2
.24
.21
.17
.15
.22
.21
Note: N = 708. Attitude variables were scored such that higher scores entail higher racism, greater opposition to equality and large government, more conservative ideology, and stronger identification with the Republican Party. Standard errors are

robust estimates provided by EQS version 5.7b.Standard errors are the robust estimates provided by EQS version 5.7b. *p < .05. **p < .01. ***p < .001.

Table IV Descriptive Statistics and Correlation Matrix for Variables in the Student Survey (Study 2)
M
SD
1
2
3
4
5
6
7
1. Opp. to contract set-asides
0.57
0.31
--
2. Policy beneficiary (Black)
0.48
0.50
-.23
--
3. Limited government
0.38
0.16
.01
.07
--
4. Liberal-conservative ID
0.41
0.24
.27
-.09
.01
--
5. Political party preference
0.42
0.23
.16
-.09
-.03
.59
--
6. Anti-egal. of opportunity
0.21
0.14
.02
.13
-.03
.17
.23
--
7. Anti-egal. of outcomes
0.41
0.15
.09
.13
-.13
.14
.14
.49
--
8. Symbolic racism
0.46
0.18
.34
-.08
-.09
.35
.27
.27
.24
Note: Means and standard deviations represent the values based on 0-to-1 scales.

Table V
Unstandardized Coefficients from the Hierarchical Multiple Regression Model Predicting
Opposition to Contract Set-Asides (Study 2)
Step 1
Step 2
Step 3
Variable
b
SE
b
SE
b
SE
Policy beneficiary
-0.14+
0.07
-0.12+
0.07
-0.12+
0.07
Limited government
0.08
0.22
0.11
0.21
0.08
0.21
Liberal-conservative ID
0.31+
0.18
0.21
0.18
0.28
0.17
Political party preference
-0.02
0.19
-0.03
0.18
-0.05
0.18
Anti-egal. (opportunity)
-0.12
0.29
-0.22
0.29
-0.25
0.28
Anti-egal. (outcomes)
0.25
0.26
0.18
0.26
0.24
0.25
Symbolic racism
--
--
0.46*
0.20
0.49*
0.20
SR × Policy Beneficiary
--
--
--
--
-0.75*
0.36
(Constant)
0.57***
0.03
0.57***
0.03
0.56***
0.03
R
2 for model
.13
.19*
.24*
∆R
2 over previous model -- .06*
.05*
+p < .10. *p < .05. ***p < .001.
Note: The manipulation of policy beneficiary was dummy-coded (viz., 0 = women, 1 = Blacks). Attitude variables were scored such that higher scores entail higher racism, greater opposition to equality and large government, more conservative ideology, and stronger identification with the Republican Party. The adjusted R2 for the final step is .15.