running head: concurrent validity & … validity and diagnostic accuracy of the dynamic...
TRANSCRIPT

DIBELS/CTOPP 1
Running head: CONCURRENT VALIDITY & DIAGNOSTIC ACCURACY
Concurrent Validity and Diagnostic Accuracy of the Dynamic Indicators of Basic Early Literacy
Skills and the Comprehensive Test of Phonological Processing
John M. Hintze, Amanda L. Ryan, Gary Stoner
University of Massachusetts at Amherst
___________________
Direct correspondence regarding this manuscript to John M. Hintze, Ph.D., University of
Massachusetts at Amherst, School Psychology Program, 362 Hills South, Amherst, MA, 01003 or [email protected].

DIBELS/CTOPP 2
Abstract
The purpose of this study was to: (a) examine the concurrent validity of the DIBELS with the
CTOPP, and (b) explore the diagnostic accuracy of the DIBELS in predicting CTOPP
performance using suggested and alternative cut-scores. Eighty-six students were administered
the DIBELS and the CTOPP in the winter of their Kindergarten year. Patterns of correlations
between the two sets of measures were examined and decision accuracy studies conducted based
on suggested cut-scores and cut-scores determined as a result of Receiver Operator Characteristic
(ROC) curve analysis. Results showed moderate to strong correlations between the DIBELS and
the CTOPP suggesting that both measure a similar construct. Analysis of decision accuracy
indicated that using the author suggested cut-scores resulted in extremely high sensitivity,
however this was at the expense of an inordinate number of false-positives. Follow-up analyses
using adjusted cut-scores improved specificity and positive predictive power, reduced false-
positives, and increased the number of correct classifications sizably.

DIBELS/CTOPP 3
Concurrent Validity and Diagnostic Accuracy of the Dynamic Indicators of Basic Early
Literacy Skills and the Comprehensive Test of Phonological Processing
Over the past twenty years an overwhelming body of evidence has emerged indicating a
powerful link between phonological awareness and reading acquisition (Adams, 1990; Lundberg,
Frost, & Petersen, 1988; Vellutino et al., 1996). Phonological awareness has been described as
the awareness of and access to the sounds of language (Wagner & Torgesen, 1987) and the
cognizance of and ability to manipulate phonemes (Blachman, 1991). Several studies now have
shown that proficiency in phonological awareness skills is highly predictive of reading success,
or conversely, that limited skill in this area is predictive of reading failure (Adams, 1990; Ball &
Blachman, 1991). Furthermore the work of Juel (1988) and Stanovich (1986) has left reading
researchers with the unsavory image of the likely poor learning trajectories of many struggling
early readers. That is, unless educators have the tools to assess and intervene before that learning
trajectory is underway.
Early identification and intervention is critical to educators’ success in improving
outcomes for low achieving beginning readers. Now that researchers have identified skills that
appear to represent phonological awareness, such as phoneme blending and segmentation
(Adams, 1990; Blachman, 1991) and have found that such skills can effectively be taught
(Bradley & Bryant, 1983; Lundberg, Frost & Peterson, 1988), educators need to be equipped
with valid and reliable instruments to guide identification and intervention efforts. Ideally, an
assessment system must be designed to measure the skills that research has found to be
representative of phonological awareness, predictive of early reading success, and aligned with
effective beginning reading instruction. Recent research has indicated that the most beneficial

DIBELS/CTOPP 4
approach to beginning reading instruction provides a combination of lessons in phonological
awareness and alphabetic understanding, combined with direct instruction in reading (Byrne &
Fielding-Barnsley, 1989). Alphabetic understanding is the ability to map sounds onto their
corresponding letters. Torgesen and Wagner (1987) suggest that initial skills in phonological
awareness facilitate the acquisition of alphabetic understanding.
The Dynamic Indicators of Basic Early Literacy Skills (DIBELS) is a set of pre-reading
measures that have been embraced by the school psychology community to assess skills in
phonological awareness and alphabetic understanding (Kaminski & Good, 1996). The DIBELS
are attractive to educators because they are quick and easy to administer, can be used for making
educational decisions, and are well suited for use in a formative manner alongside a problem-
solving model. According to the authors (Good & Kaminski, 1996), the DIBELS can be used in
schools, especially with kindergarten and first-grade children, to answer such questions as: (a)
Which children are at risk for reading difficulty because of inadequate phonological awareness
skills? (b) Which children need additional instruction in phonological awareness skills? (c) Is the
current instruction effective in increasing phonological awareness skills? and (d) When has a
child developed phonological awareness skills to a degree that is no longer indicative of
difficulty learning to read?
The purpose of the present study was to determine the degree to which the DIBELS
correlate with another standardized measure of pre-reading skills, namely the Comprehensive
Test of Phonological Processing (CTOPP). The CTOPP (Wagner, Torgesen, & Rashotte, 1999)
is a published, norm-referenced test with sufficient reliability and validity to support its use as a
measure of phonological processing. This study attempts to step beyond the intuitive appeal of
the DIBELS by establishing its concurrent validity, with a test that purports to measure a similar

DIBELS/CTOPP 5
construct. Previous research on the DIBELS has examined concurrent validity, but not using
other direct measures of phonological awareness.
In addition to examining concurrent validity, a second purpose of this study was to
examine the decision validity of the DIBELS (Swets, 1996). In doing so, the study attempted to
evaluate the efficiency of the DIBELS in identifying those students who may or may not be at
risk for early phonological awareness/processing problems as compared to another commonly
used commercially available test of phonological awareness. Importantly, if DIBELS are to be
used for such educational purposes as resource allocation, placement or identification, the
measures should be able to accurately differentiate between children who have not yet acquired
such skills and those who have.
Method
Participants and Setting
Participants of this study included 86 randomly selected kindergarten students from a
mid-sized city in Northwestern Massachusetts. Students attended three elementary schools and
were from 10 different kindergarten classrooms. Overall, the district served 165 kindergarten
students with approximately 39% qualifying for free or reduced lunch. The students in the
sample were primarily Caucasian (93%). All data collection took place in the schools in specially
designated areas for assessment, by school psychology faculty and graduate students trained in
the administration of all measures.
Measures
DIBELS. Three sub-tests from the DIBELS were administered including Letter Naming
Fluency, Initial Sound Fluency, and Phonemic Segmentation Fluency For each subtest or
DIBELS/CTOPP 6
measure, three alternate form probes were administered, with the median scores across the three
forms serving as the basic datum of interest. Each measure is described below.
Letter Naming Fluency (LNF). LNF is a measure that is administered for one minute. The
child is presented with a printed page containing rows of randomly ordered upper and lower case
letters and is asked to name as many letters as he/she can in one minute. The total number of
letters correctly identified in one minute is the score. Alternate-forms reliability for LNF is .93
(Good, Kaminski, Simmons, & Kame’enui, 2001). The concurrent validity with the Woodcock-
Johnson Psycho-Educational Battery readiness score is .70 in kindergarten. Predictive validity of
LNF in spring of kindergarten with Woodcock-Johnson Psycho-Educational Battery in spring of
first grade is .65 and is .71 with first grade oral reading fluency (ORF) using Curriculum Based
Measurement (CBM) (Good, Kaminski, Simmons, & Kame’enui, 2001).
Initial Sound Fluency (ISF). ISF is a task that requires children to identify from an array
of four pictures, the word that begins with a target sound. For example, the examiner would say
“This is a sink, cat, gloves and a hat. Which picture begins with /s/?” There are a total of 12
items on each probe. Every fourth item requires that the child produce the onset sound for a
target word. There are 20 alternate forms and alternate-form reliability is .72 (Good, Kaminski,
Simmons, & Kame’enui, 2001). Concurrent validity of ISF with the readiness cluster score of the
Woodcock-Johnson Psycho-Educational Battery is .36, and the correlation was the same for
predictive validity one year later. Predictive validity of ISF with CBM ORF in spring of first
grade is .45 (Good, Kaminski, Simmons, & Kame’enui, 2001).
Phoneme Segmentation Fluency (PSF). PSF assesses a child’s ability to segment three
and four phoneme words into individual phonemes with fluency. Words are presented orally to
the student for one minute and the child is instructed to orally repeat the word in segmented

DIBELS/CTOPP 7
syllables. The number of correct phonemes per minute represents the child’s score. There are 20
alternate forms available and alternate –form reliability for PSF is .88 for kindergarten children
(Kaminski & Good, 1996). Concurrent, criterion-related validity of PSF with the readiness
cluster score of the Woodcock-Johnson Psycho-Educational Battery was .54 in the spring of
kindergarten (Good, Kaminski, Simmons, & Kame’enui, 2001). Concurrent validity estimates
ranged from .43 to .65 on other measures such as the McCarthy Scales of Children’s Abilities,
the Metropolitan Readiness Test and the Rhode Island Pupil Identification Scale (Kaminski &
Good, 1996). Predictive validity of spring, kindergarten PSF with spring, first grade Woodcock-
Johnson Psycho-Educational Battery is .68 and with Curriculum Based Measurement Oral
Reading Fluency (ORF) is .62 (Good, Kaminski, Simmons, & Kame’enui, 2001).
The Comprehensive Test of Phonological Processing (CTOPP). The sub-tests of the five
and six year old version of the CTOPP included Elision (EL), Rapid Color Naming (RC),
Blending Words (BW), Sound Matching (SM), Rapid Object Naming (RO), Memory for Digits
(MD), and Non-word Repetition (NR). Briefly, EL requires the child to repeat a verbally
presented stimulus word while omitting a sound. For example, “Say ball. Now say ball without
saying /b/.” RC and RD are both timed tasks on which the child is expected to rapidly identify
several rows of either colors or objects from pages in a stimulus booklet. A score is derived
based on the total time it takes a child to complete a page. On SM the child is asked to identify
the correct picture from an array of three that shares the same onset or ending sound as a
stimulus picture. For example, “Which word starts with the same sound as bear? Pig, bat, or
rabbit?”?” Standard scores for each sub-test and three composite scores were obtained. The
Phonological Awareness Composite (PACom) is comprised of Elision, Sound Matching and
Blending Words. The Phonological Memory Composite (PMCom) includes Memory for Digits

DIBELS/CTOPP 8
and Nonword Repetition. The Rapid Naming Composite (RNCom) is made up of Rapid Object
Naming and Rapid Color Naming. MD is a measure of a child’s ability to repeat increasingly
longer lists of numbers in the exact order as presented on an audiotape. Finally, NR requires that
a child repeat nonwords, varying in length from 3 to 15 sounds.
Coefficient Alphas for the sub-tests range from .74 -. 93 for children age five and six. For
the composite scores the internal consistency reliability coefficients at age five are .95, .84 and
.87 for Phonological Awareness, Phonological Memory and Rapid Naming, respectively. At age
six coefficients were .96, .81 and .89. Test-retest reliability ranged from .74 - .97 for the sub-tests
and was .79, .92 and .70 for the composites.
Predictive validity of the CTOPP composites with the Woodcock Reading Mastery Tests
- Revised one year later was .71 for Phonological Awareness, .42 for Phonological Memory, and
.66 for Rapid Naming. Concurrent validity correlations for the sub-tests ranged from .41 - .75
with the Lindamood Auditory Conceptualization Tests, .32 - .74 on Word Attack from the
Woodcock reading Mastery Tests-R, from .29 - .62 on the Wide range Achievement Test – 3 and
.15 - .62 on rate and accuracy of the Gray Oral Reading Test – 3.
Procedure
All children were presented with both the DIBELS and the CTOPP, in approximately 20-
minute sessions for each measure. Students were provided a break between measures. The order
of presentation between the two measures was counterbalanced. The maximum amount of time
that elapsed between administrations was three school days.
DIBELS/CTOPP 9
Results
Descriptive Statistics
Table 1 contains the descriptive statistics for all children on both the DIBELS and the
CTOPP. As can be seen, aggregated across all children, participants performed well within the
average range on all subtests and composite scores of the CTOPP. Examination of the
distribution of scores suggests adequate variability with aggregate scores assuming a normal
distribution. Moreover, the average of the aggregated median scores on the DIBELS were
normally distributed indicating the variability of scores were adequate for further correlational
analyses. Not surprisingly, however, the average age of the participants was positively skewed,
with the majority of children falling within the age range of 5 years, 3 months to 6 years, 7
months.
Concurrent Criterion-Related Validity
Table 2 contains the corrected correlation coefficients between the DIBELS measures
and the individual subtests and composite scores of the CTOPP. Examination of the coefficients
indicates that the DIBELS strongly correlates with most subtest and composite scores of the
CTOPP. Closer inspection of the pattern of coefficients suggests that both the ISF and PSF tasks
of the DIBELS correlate most strongly with those subtests and composite scores on the CTOPP
that are designed to measure both phonological awareness and memory (i.e., Elision, Blending
Words, Sound Matching, and Nonsense Word Repetition) and less strongly with those tasks that
involve rapid naming activities (i.e., Rapid Color Naming, Rapid Object Naming, and Memory
for Digits). In addition to providing support for the concurrent validity of the DIBELS, this
pattern also lends support for the construct validity of measures as well. Furthermore, the Letter
Naming Fluency (LNF) task correlated strongly with subtest and composite scores on the

DIBELS/CTOPP 10
CTOPP that represent both phonological awareness and memory, as well as rapid naming
abilities. Such findings support the efficacy of letter naming fluency as it relates to a beginning
understanding of the alphabetic principle, as well as a critical component in overall phonological
development.
Diagnostic Accuracy Analysis
Initial analyses. To examine the diagnostic accuracy of the DIBELS, a series of
diagnostic accuracy studies were conducted using the DIBELS as predictor variables and the
CTOPP as the criterion measure. The goal of these studies was to assess the sensitivity,
specificity, and predictive power of the DIBELS over a range of cut-score values. Brief
definitions of each type of diagnostic accuracy decision are as follows (Swets, Dawes, &
Monahan, 2000):
Sensitivity. Refers to the likelihood that the DIBELS will accurately identify those
students who have been identified by the CTOPP as exhibiting a problem (i.e., presence
of a problem).
Specificity. Refers to the likelihood that the DIBELS will accurately identify those
students who have been identified by the CTOPP as not exhibiting a problem (i.e.,
absence of a problem).
False negatives. Refers to the likelihood that the DIBELS will fail to accurately identify
those students who have been identified by the CTOPP as exhibiting a problem. False
negatives and sensitivity sum to 100%.
False positives. Refers to the likelihood that the DIBELS will fail to accurately identify
those students who have been identified by the CTOPP as not exhibiting a problem. False
positives and specificity sum to 100%.
DIBELS/CTOPP 11
Positive predictive power. Refers to the likelihood that those students identified as having
a problem on the DIBELS will be corroborated by the CTOPP.
Negative predictive power. Refers to the likelihood that those students identified as not
having a problem on the DIBELS will be corroborated by the CTOPP.
From these descriptions, it is apparent that there is an obvious trade-off between sensitivity and
specificity (and positive and negative predictive power). Specifically the relationship is inverse
such that as sensitivity increases concomitant decreases in specificity are observed and vice
versa. As such, sensitivity can be increased only at the expense of specificity; and specificity can
only be increased at the expense of sensitivity. The challenge then for any assessment instrument
is to set cut-scores that maximize each characteristic to its fullest potential.
In the first two studies, the ISF task of the DIBELS was used to predict the PACom and
PMCom scores of the CTOPP, respectively. Similarly, subsequent third and forth studies
attempted to predict the PACom and PMCom scores on the CTOPP from PSF performance of
the DIBELS. All analyses were conducted using author suggested cut-scores of less than 25
onsets per minute for the ISF task, and less than 35 phonemes per minute for the PSF task of the
DIBELS (Dynamic Indicators of Basic Early Literacy Skills, 2000-2001; Good et al., 2001).
Similarly, for the CTOPP a standard score of less than 85 on the Phonological Awareness and
Phonological Memory Composite scores was considered indicative of a problem (i.e., greater
than one standard deviation away from the mean).
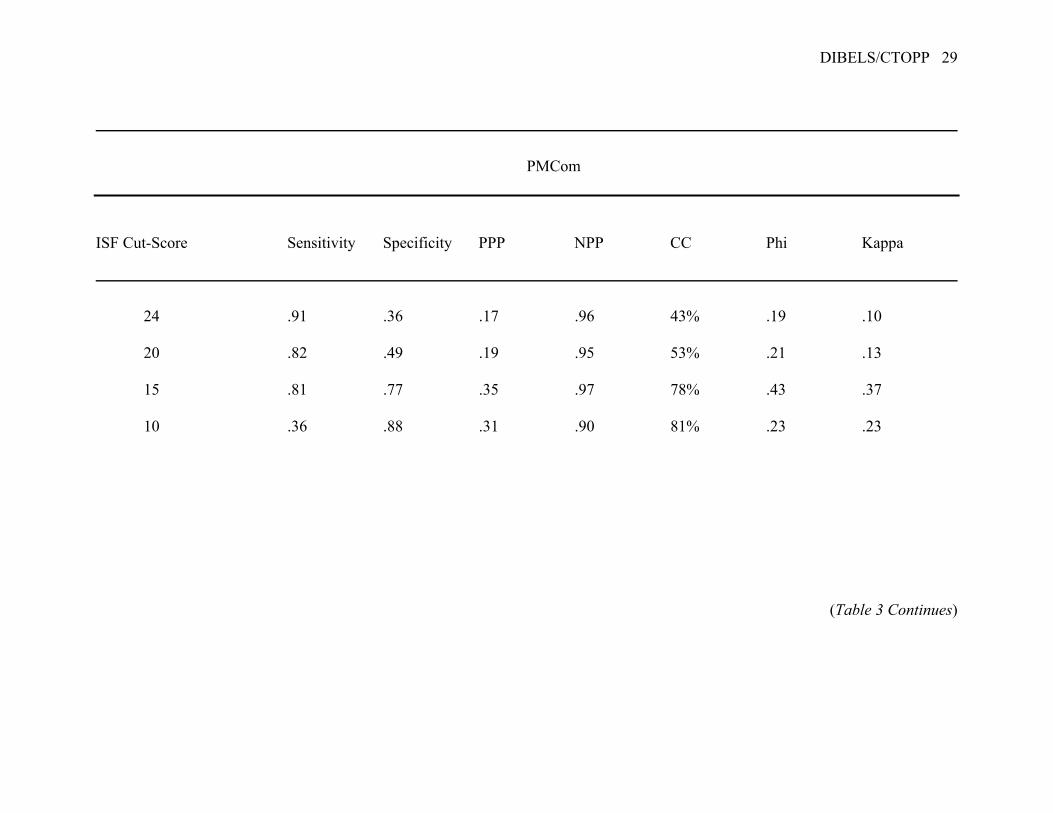
The results of these studies are contained in Table 3. As can be seen, the ISF task of the
DIBELS is quite sensitive to both the PACom and PMCom scores of the CTOPP (1.00 and .91,
respectively). Comparatively, however, the specificity of the ISF task appears somewhat low (.39
and .36 for PACom and PMCom, respectively). In addition, the ability of the ISF task to

DIBELS/CTOPP 12
accurately predict who is likely to exhibit a problem on the CTOPP appears poor (positive
predictive power for the PACom and PMCom are .26 and .17, respectively); while its ability to
accurately predict who is not likely to exhibit a problem on the CTOPP appears high (negative
predictive power for the PACom and PMCom are 1.00 and .96, respectively). Furthermore, the
overall ability of the ISF measure to accurately predict a student’s correct diagnostic
classification using the suggested cut-score is no better than chance (50% for the PACom and
43% for the PMCom) and is represented by lower levels of association between the diagnostic
decisions made by each of the measures (i.e., lower Phi and Kappa coefficients).
Similarly, the sensitivity of the PSF task is also quite strong in predicting PACom and
PMCom score performance (.93 and 1.00, respectively). As with ISF, however, PSF also
demonstrates relatively weak specificity (.23 for both the PACom and PMCom), again
suggesting that the sole use of this measure will likely overidentify students as having
weaknesses in phonological awareness skills that are perhaps not present. Likewise, the ability of
the PSF task to accurately predict who is likely to exhibit a problem on the CTOPP appears poor
(positive predictive power for the PACom and PMCom are .20 and .16, respectively); while its
ability to accurately predict who is not likely to exhibit a problem on the CTOPP again appears
high (negative predictive power for the PACom and PMCom are .96 and 1.00, respectively). As
with the ISF, the overall ability of the PSF measure to accurately predict a student’s correct
diagnostic classification using the suggested cut-score is no better than chance (35% for the
PACom and 33% for the PMCom) and is represented by lower levels of association between the
diagnostic decisions made by each of the measures (i.e., lower Phi and Kappa coefficients).
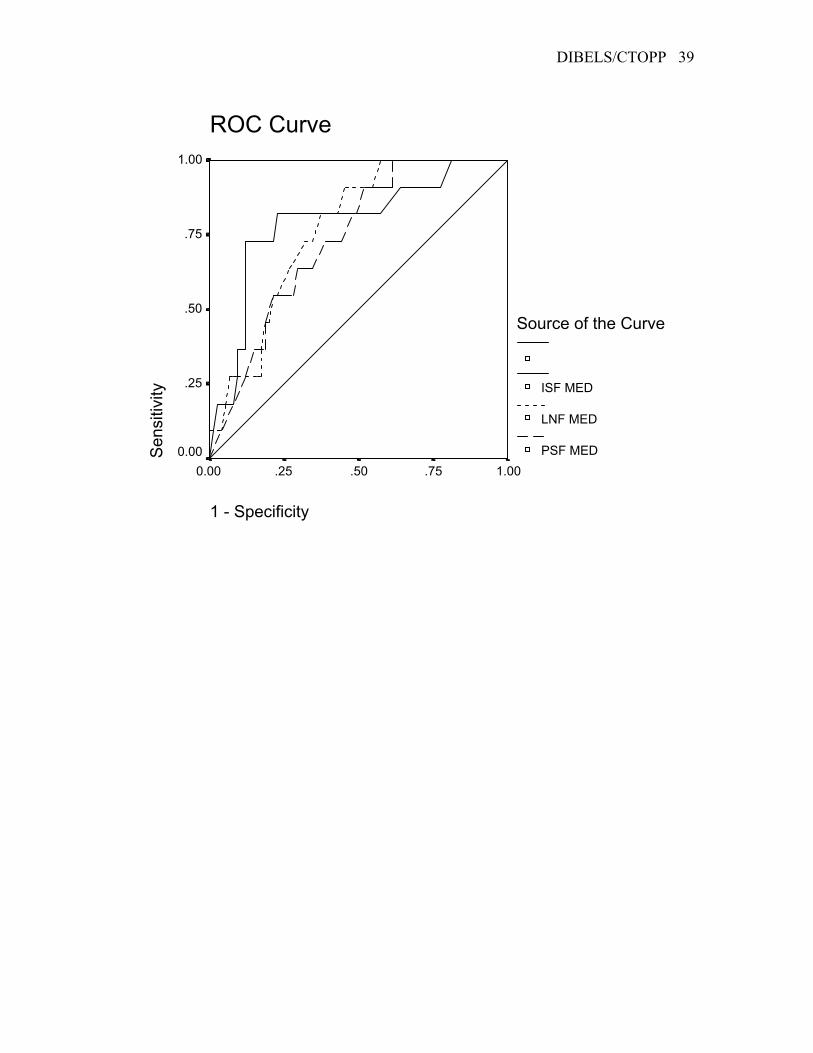
Follow-up analyses. In an effort to more fully explore the predictive nature of the
DIBELS, a series of Receiver Operating Characteristic (ROC) curves were developed that

DIBELS/CTOPP 13
modeled the diagnostic accuracy of the measures over a range of cut-scores (Swets, 1996). In
doing so, sensitivity (i.e., true-positive) is plotted against 1-specificity (i.e., false-positive) over a
range of possible cut-score values (Fletcher, Fletcher, & Wagner, 1996). Figures 1 through 3
represent each DIBELS measure modeled against the composite scores of the CTOPP.
Interpretation of the ROC curves is relatively straightforward. The optimum cut-score is
generally at or near the shoulder of the ROC curve (Swets, Dawes, & Monahan, 2000). As such,
the ideal ROC curve arises almost vertically from the lower left corner to the upper left corner
where it then moves horizontally along the upper portion of the graph. The upper left corner near
the shoulder then, represents a sensitivity of 100% and a false-positive rate of 0%. Assessment
instruments that discriminate well congregate in the upper left corner of the ROC curve, which
indicates as the sensitivity progressively increases there is little, if any, loss is specificity, until
very high levels of sensitively are reached (Tatano-Beck & Gable, 2001). Assessment
instruments that do not discriminate well have curves that are nearer the diagonal running from
the lower left to upper right. The diagonal line indicates the relationship between true-positive
and false-positive rates when an assessment instrument yields no useful diagnostic information
beyond mere chance (i.e., 50/50 chance of correct classification) (Fletcher et al., 1996).
Figure 1 represents the ROC curves for the DIBELS measures (i.e., ISF, PSF, LNF) in
predicting the PACom score on the CTOPP. As can be seen from the figure, both the ISF and
LNF tasks demonstrate adequate diagnostic accuracy in predicting PACom. Indeed, inspection of
Table 3 suggests that cut-scores of 15 for ISF and 25 for LNF result in adequate levels of both
sensitivity and specificity (approximately .75 or higher are generally considered adequate; Swets,
1988). Moreover, PSF failed in its attempts to accurately predict PACom skills over a range of
cut-scores. Although moderate to high levels of sensitivity are observed when using cut-scores in
DIBELS/CTOPP 14
the range of 20 to 34 on the PSF task, less than adequate levels of specificity are noted across a
wide range of cut-scores. That is, while the PSF task can efficiently predict those students who
are likely to exhibit phonological awareness problems as measured on the CTOPP, this is done at
the expense of an inordinate number of false-positives. Simply, the PSF task overidentifies
students who are likely to demonstrate phonological awareness problems that are not
corroborated by the CTOPP. This appears to be the case across a wide range of cut-scores
ranging anywhere from 10 to 34 phonemes per minute as measured by the PSF task.
Figure 2 presents the ROC curves for the DIBELS measures modeled against the
PMCom. As with the previous analysis, OnF demonstrates adequate diagnostic accuracy in
predicting PMCom at a cut-score of 15. However, neither the PSF or LNF tasks were able to
adequately predict PMCom performance over a range of possible cut-scores. As can be seen in
Table 3, although the PSF task demonstrates adequate to exceptionally high sensitivity across a
range of cut-scores starting at 20; the proportion of true-positives is offset by an exceedingly
high percentage of false-positive (i.e., 1 minus specificity). Nowhere along the continuum of cut-
scores were both sensitivity and specificity at adequate levels. A similar pattern also was
observed for the LNF task with high levels of sensitivity being offset by low levels of specificity.
Lastly, Figure 3 provides the results of the ROC curve analysis for the DIBELS measures
used to predict RNCom performance. Not surprisingly, none of the measures were able to
provide adequate levels of diagnostic accuracy in predicting rapid naming skill performance.
Discussion
Relationship of the DIBELS and the CTOPP
The purpose of this study was to examine the concurrent validity and diagnostic accuracy
of the DIBELS compared to the CTOPP. Results suggest that the DIBELS strongly correlates

DIBELS/CTOPP 15
with subtest and composite scores of the CTOPP that are designed to measure phonological
awareness and memory, and less strongly with rapid naming tasks. Not surprisingly, the ISF task
of the DIBELS correlated most strongly with the Elision, Blending Words, Sound Matching, and
NonWord Repetition subtests of the CTOPP. Moreover, ISF was quite strongly associated with
the Phonological Awareness Composite of the CTOPP and demonstrated a moderate relationship
with the Phonological Memory Composite as well.
Like ISF, the PSF task of the DIBELS also evidenced moderate to strong associations
with the Elision, Blending Words, and Phonological Awareness Composite sections of the
CTOPP, but was less strongly related to the Sound Matching, NonWord Repetition, and
Phonological Memory portions of the criterion measure. One plausible explanation for this
observation might lie in the time of the year that the measures were administered. While
kindergarten students in the latter part of the Winter would be fully expected to have mastered
many of the skills assessed with the ISF task, children at this age are only beginning to develop
the type of more finely developed phonological awareness skills that are assessed with the PSF
task. In the current sample there was a fair amount of variability in the samples’ ability to display
this skill. Interestingly, the PSF task of the DIBELS correlated most strongly with the Blending
Words subtest of the CTOPP. In general, the ability to blend words is thought to precede the
ability to segment or partition words into their component phonological sounds (Adams, 1990;
National Reading Panel, 2000). If this in fact is the case, it comes as no surprise that the PSF task
correlates well with blending tasks as these would be the most proximally developing skills. In
the current study, it is hypothesized that it was simply too early in the year to observe consistent
segmenting skills which may have thus led to inconsistent patterns of correlations with the
CTOPP.
DIBELS/CTOPP 16
Perhaps most interesting was the LNF task and its relationship with the CTOPP. Like ISF
and PSF, LNF showed moderate to strong correlations with all subtest and composite scores of
the CTOPP; including the naming-speed tasks of Rapid Color Naming, Rapid Object Naming,
Memory for Digits, and the Rapid Naming Composite. Indeed, facility in naming letters has been
shown to be a powerful predictor of phonological awareness and later reading achievement
(Bond & Dykstra, 1967; Chall, 1967). For example, it has been demonstrated that learning the
names of letters is a strong predictor of a child’s interest in letter sounds and phonological
awareness development (Chomsky, 1979; Ehri 1986, 1987; Mason, 1980) and that not knowing
letter names is associated with problems with the alphabetic principle and early word reading
(Mason, 1980). Moreover, results of current study suggest that the LNF task might also serve as
a good indicator of naming-speed (i.e., processes involved in the rapid recognition and retrieval
of visually presented linguistic stimuli), a critical variable that has been shown to be associated
with reading development and difficulties (Wolf & Bowers, 1999).
Cut-Scores and Diagnostic Accuracy
Perhaps the most interesting findings from the current study were the results of the
diagnostic accuracy analyses. For both the ISF and PSF tasks of the DIBELS, use of the authors’
suggested cut-scores resulted in extremely high levels of sensitivity with low levels of
specificity. Such diagnostic accuracy led to only approximately one-third to one-half of the
participants being correctly classified on the basis of their CTOPP scores, with none being
significantly better than chance. More simply, the use of these cut-scores led to a very high
percentage of true positives; however, this came at the expense of an exceeding number of false-
positives. While this result, if typical, is not necessarily a bad test characteristic, such tests
should only be used for screening purposes where all positively identified cases can be

DIBELS/CTOPP 17
reassessed with instruments of higher fidelity in order to identify false-positives within the
originally screened sample. If, however, practitioners would like to use the ISF and PSF tasks for
making more high-stakes decisions such as resource allocation or entitlement decisions, lower
cut-scores might be in order. Results of the current study suggest that a cut-score of 15 for the
ISF task led to a better balance of sensitivity, specificity, and false-positives, while at the same
time significantly improving the percentage of correctly classified students beyond chance on the
PACom and PMCom sections of the CTOPP. Even better, perhaps, would be to combine the
results of both analyses and adopt the use of different cut-scores based on the type of decision to
be made. If the decision to be made is relatively low stakes and the assessor can afford a high
percentage of false-positives, a relatively liberal (i.e., higher) cut-score can be used. If, however,
the assessor needs to be more accurate in his/her prediction or has less assessment resources at
his/her disposal, a more conservative cut-score might be better suited to this type of educational
decision. Simply, cut-scores should be chosen with a understanding of the types of decisions that
need to be made balanced against the risk of incorrect classification.
Implications for Practice
The results of this research need to be interpreted in relation to both current school
psychology and education practices, and the continuing development of the DIBELS. Relevant
contemporary issues in school psychology research and practice are those of data-based decision
making, and prevention- and intervention-linked assessment (see for examples, Harrison, 2000;
Stone, 2001; Ysseldyke et al., 1997). In these realms, and those of our National education
agenda, certainly reading skill development is a primary area of interest and concern (No Child
Left Behind Act, 2001). The development of DIBELS took place and continues in the context of
these important areas of education.
DIBELS/CTOPP 18
The purpose(s) of DIBELS as described on the “Official DIBELS Home Page” (DIBELS,
2000-2002) is/are as follows:
The Dynamic Indicators of Basic Early Literacy Skills (DIBELS) are a set of
standardized, individually administered measures of early literacy development.
They are designed to be… used to regularly monitor the development of pre-
reading and early reading skills.
The measures were developed upon the essential early literacy domains discussed
in both the National Reading Panel (2000) and National Research Council (1998)
reports to assess student development of phonological awareness, alphabetic
understanding, and automaticity and fluency with the code. Each measure has
been thoroughly researched and demonstrated to be reliable and valid indicators
of early literacy development and predictive of later reading proficiency to aid in
the early identification of students who are not progressing as expected. When
used as recommended, the results can be used to evaluate individual student
development as well as provide grade-level feedback toward validated
instructional objectives.
In addition to these purposes, DIBELS have been described as tools useful for district-, school-,
and class-wide screening purposes to identify individual students in need of intervention services
(Simmons et al., 2002). This last purpose, in particular, is the focus of the current research and
discussion.
Salvia and Ysseldyke (1998) discuss 13 types of educational decisions that can be
informed by educational assessment. In the language of Special Education services, when the
DIBELS are used for early screening purposes are, they are being used for the broad purpose of

DIBELS/CTOPP 19
"Pre-Referral Classroom Decisions"; this class of decisions is further divided into (a) decisions
to provide special help or enrichment, (b) decisions to refer a child to an assistance team, and (c)
decisions to provide intervention assistance. In essence, these are classification decisions that can
be accurate or inaccurate, result in a cost (e.g., allocation of resources, potential stigma, etc.) to a
school district and children, and have the potential to generate benefits to a school district and its
students.
The moderate to strong correlations between the DIBELS and the CTOPP found in this
study provide evidence the two instruments are measuring a similar construct. As such, school
psychologists and other educational practitioners might find both of these instruments useful for
assessing various aspects of child skill development in areas related to phonological awareness.
This research also demonstrated that using the DIBELS recommended cut-scores for ISF and
PSF resulted in high sensitivity to identifying children with low phonological awareness skills as
indicated by the CTOPP (i.e., true positives). However, use of those DIBELS measures and cut-
scores also resulted in the identification of many children as having difficulties who did not
perform poorly on the CTOPP (i.e., false positives). From a practical standpoint, then, using the
DIBELS and these cut-scores could lead to school districts unnecessarily allocating resources to
children, and children being inaccurately identified as "at-risk" for early reading problems.
However, when the DIBELS are truly used as screening measures, whereby identified children
are provided further, more detailed assessment, the likelihood of a costly mistake appears small.
Finally, ROC Curve analyses provided evidence that using lower DIBELS cut-scores can
result in improved specificity and positive predictive power, thereby reducing the numbers of
false positive identifications made. Collectively, the results of this study suggest the DIBELS
"benchmark" or cut-scores may be set too high, from a diagnostic accuracy point of view. As a

DIBELS/CTOPP 20
result, the use of the DIBELS as a classification tool in practice should be undertaken with
caution. It may indeed be the case that the potential benefits of identifying children early, when
the likelihood of successful intervention is high, will outweigh the potential costs of providing
early intervention services to some children who, in fact, do not need such services. However,
when the DIBELS are used district-wide to classify children as in need of early intervention
services, the potential for costly mistakes (i.e., large numbers of false positives = high costs)
suggests further research on benchmark or cut-scores is warranted. Further ROC Curve analysis
and decision makiing research with the DIBELS is warranted, with a focus on exploring different
cut-scores, and predicting different outcomes, from both a diagnostic accuracy viewpoint, as well
as an educational cost-benefit analysis perspective.

DIBELS/CTOPP 21
References
Adams, M. J. (1990). Beginning to read: Thinking and learning about print. Cambridge,
MA: MIT Press.
Ball, E. W., & Blachman, B. A. (1991). Does phoneme awareness training in
kindergarten make a difference in early word recognition and developmental
spelling? Reading Research Quarterly, 26, 49-66.
Blachman, B. A. (1991). Phonological awareness: Implications for prereading and
early reading instruction. In S. A. Brady & D. P. Shankweiler (Ed.),
Phonological processes in literacy (pp. 29-36). Hillsdale, NJ: Erlbaum Associates.
Bond, G. L., & Dykstra, R. (1967). The cooperative research program in first-grade reading
instruction. Reading Research Quarterly, 2, 5-14.
Bradley, L. & Bryant, P. E. (1983). Categorizing sounds and learning to read – A
causal connection, Nature, 30,, 419-421.
Byrne, B., & Fielding-Barnsley, R. (1989). Phonemic awareness and letter knowledge
in the child’s acquisition of the alphabetic principle. Journal of Educational
Review, 81, 313-321.
Chall, J. S. (1967). Learning to read: The great debate. New York: McGraw-Hill.
Chomsky, C. (1979). Approaching reading through invented spelling. In L. B. resnick and P.A.
Weaver (Eds.), Theory and practice of early reading (vol. 2, pp. 43-65). Hillsdale, N.J.:
Erlbaum Associates.
Dynamic Indicators of Basic Early Literacy Skills (2000-2001). Retrieved March 2, 2001
from http://dibels.uoregon.edu/
Dynamic Indicators of Basic Early Literacy Skills (2000-2002). Retrieved May 3, 2002

DIBELS/CTOPP 22
from http://dibels.uoregon.edu/
Ehri. L. C. (1986). Sources of difficulty in learning to spell and read. In M. L. Wolraich and D.
Routh (Eds.), Advances in developmental and behavioral pediatrics (vol. 7, pp. 121-195).
Greenwich, CT: JAI Press.
Ehri, L. C. (1987). Learning to read and spell words. Journal of Reading Behavior, 19, 5-31.
Fletcher, R. H., Fletcher, S. W., & Wagner, E. H. (1996). Clinical epidemiology: The essentials.
Baltimore: Williams & Wilkins.
Harrison, P. L. (2000). School Psychology Review: Ending the 20th century and looking ahead to
the future [Special Issue]. School Psychology Review, 29(4).
Juel, C. (1988). Learning to read and write: A longitudinal study of 54 children from first
through fourth grades. Journal of Educational Psychology, 80, 437-447.
Kaminski, R. A., & Good, R. H., III. (1996). Toward a technology for assessing basic
early literacy skills. School Psychology Review, 25, 215-227.
Good, R. H. III, Kaminski, R.A., Simmons, D., Kame’enui, E. J. (2001). Using Dynamic
Indicators of Basic Early Literacy Skills (DIBELS) in an outcomes-driven model:
Steps to reading outcomes. Unpublished manuscript, University of Oregon at
Eugene.
Lundberg, I., Frost, J., & Peterson, O. P. (1988). Effects of an extensive program for
stimulating phonological awareness in preschool children. Reading Research
Quarterly, 23, 263-284.
Mason, J. L. (1980). When do children begin to read: An exploration of our year old children’s
letter and work reading competencies. Reading Research Quarterly, 15, 203-227.
National Reading Panel. (2000). Teaching children to read: An evidence-based assessment of the
DIBELS/CTOPP 23
scientific research literature on reading and its implications for reading instruction.
Washington, D.C.: National Institute of Child Health and Human Development.
National Research Council (1998). Preventing reading difficulties in young children.
Washington, D.C.: National Academy Press.
No Child Left Behind Act of 2001, H.R. 1, 107th Cong. (2001).
Simmons, D. C., Kame’enui, E. J., & Good, R. H., Harn, B. A., Cole, C., & Braun, D. (2002).
Building, implementing, and sustaining a beginning reading improvement model:
Lessons learned school by school. In M. R. Shinn, H. M. Walker, & G. Stoner (Eds.),
Interventions for academic and behavior problems II: Preventative and remedial
approaches (pp. 537-570). Bethesda, MD: National Association of School Psychologists.
Stanovich, K. E. (1986). Matthew effects in reading: Some consequences of individual
differences in the acquisition of literacy. Reading Research Quarterly, 21,
360-406.
Stone, C. A. (2001). Issues in data-based decision making in special education: Introduction to
the special series [Special Issue]. School Psychology Review, 30(4).
Swets, J. A. (1988). Measuring the accuracy of diagnostic systems. Science, 240, 1285-1293.
Swets, J. A. (1996). Signal detection theory and ROC analysis in psychology and diagnostics.
NJ: Lawrence Erlbaum.
Swets, J. A., Dawes, R. M., & Monahan, J. (2000). Psychological science can improve
diagnostic decisions. Psychological Science in the Public Interest, 1, 1-26.
Tatano-Beck, C., & Gable, R. K. (2001). Further validation of the postpartum depression
screening scale. Nursing Research, 50, 155-164.
Vellutino, F. R., Scanlon, D. M., Sipay, E. R., Small, S. G., Pratt, A., Chen, R., &

DIBELS/CTOPP 24
Denckla, M. B. (1996). Cognitive profiles of difficult-to-remediate and
readily remediated poor readers: Early intervention as a vehicle for
distinguishing between cognitive and experiential deficits as basic causes
of specific reading disability. Journal of Educational Psychology, 88,
601-638.
Wagner, R. K., Torgesen, J. K., & Rashotte, C. A. (1999). Comprehensive Test of
Phonological Processing. Austin, TX: PRO-ED, Inc.
Wagner, R. K., & Torgesen, J. K. (1987). The nature of phonological processing and its
causal role in the acquisition of reading skills. Psychological Bulletin, 101,
192-212.
Wolf, M. & Bowers, P. G. (1999). The double-deficit hypothesis for the developmental
dyslexias. Journal of Educational Psychology, 91, 415-438.
Ysseldyke, J., Dawson, P., Lehr, C., Reschly, D., Reynolds, M., & Telzrow, K. School
Psychology: A blueprint for training and practice II. Bethesda, MD: National Association of
School Psychologists.

DIBELS/CTOPP 25
Table 1.
Descriptive Statistics for Total Sample (N = 86).
Variable Mean (SD) Min. Max. Skew. SE Skew. Kur. SE Kur.
Age (mos.) 71.07 (3.93) 65 83 .655 .260 -.142 .514
LNF 29.45 (14.93) 0 74 .386 .260 .345 .514
ISF 19.74 (8.99) 0 40 -.179 .260 -.219 .514
PSF 18.72 (15.11) 0 52 .399 .260 -.917 .514
ELI 9.14 (2.19) 5 13 .120 .260 -.913 .514
RCN 9.61 (2.07) 5 16 .211 .263 .850 .520
BLW 9.26 (2.36) 4 17 .116 .260 .274 .514
SM 9.29 (1.95) 4 13 -.450 .260 -.083 .514
RON 9.67 (2.51) 4 17 .341 .266 .431 .526
(Table 1 Continues)

DIBELS/CTOPP 26
Variable Mean (SD) Min. Max. Skew. SE Skew. Kur. SE Kur.
MD 8.85 (2.45) 3 14 -.112 .260 -.148 .514
NWR 9.51 (2.38) 3 15 -.161 .260 -.152 .514
PACom 95.07 (11.54) 68 117 -.157 .260 -.769 .514
PMCom 95.08 (11.76) 67 121 -.211 .260 .004 .514
RNCom 98.16 (12.64) 73 133 .234 .269 .388 .532
Note. LNF = Letter Naming Fluency; ISF = Initial Sound Fluency; PSF = Phoneme Segmentation Fluency; ELI = Elision; RCN =
Rapid Color Naming; BLW = Blending Words; SM = Sound Matching; RON = Rapid Object Naming; MD = Memory for Digits;
NWR = Nonsense Word Repetition; PACom = Phonological Awareness Composite; PMCom = Phonological Memory Composite;
RNCom = Rapid Naming Composite.

DIBELS/CTOPP 27
Table 2
Intercorrelations for Scores on the DIBELS and CTOPP
Measure ELI RCN BLW SM RON MD NWR PACom PMCom RNCom
LNF .45 .59 .38 .53 .59 .43 .44 .53 .52 .58
ISF .52 .21 .51 .51 .24 .34 .44 .60 .46 .20
PSF .47 .08 .63 .25 .14 .32 .33 .53 .39 .09
Note. LNF = Letter Naming Fluency; ISF = Initial Sound Fluency; PSF = Phoneme Segmentation Fluency; ELI = Elision; RCN =
Rapid Color Naming; BLW = Blending Words; SM = Sound Matching; RON = Rapid Object Naming; MD = Memory for Digits;
NWR = Nonsense Word Repetition; PACom = Phonological Awareness Composite; PMCom = Phonological Memory Composite;
RNCom = Rapid Naming Composite.

DIBELS/CTOPP 28
Table 3
Performance of the DIBELS Over a Range of Cut-Scores Using the CTOPP Composite Scores as the Criteria
PACom
ISF Cut-Score Sensitivity Specificity PPP NPP CC Phi Kappa
24 1.00 .39 .26 1.00 50% .32 .19
20 .87 .52 .28 .95 58% .30 .21
15 .73 .79 .42 .93 78% .43 .41
10 .33 .89 .38 .86 79% .23 .23
(Table 3 Continues)
DIBELS/CTOPP 29
PMCom
ISF Cut-Score Sensitivity Specificity PPP NPP CC Phi Kappa
24 .91 .36 .17 .96 43% .19 .10
20 .82 .49 .19 .95 53% .21 .13
15 .81 .77 .35 .97 78% .43 .37
10 .36 .88 .31 .90 81% .23 .23
(Table 3 Continues)

DIBELS/CTOPP 30
RNCom
ISF Cut-Score Sensitivity Specificity PPP NPP CC Phi Kappa
24 .90 .37 .17 .96 44% .19 .10
20 .70 .50 .17 .92 53% .13 .08
15 .40 .73 .19 .89 69% .09 .08
10 .10 .86 .09 .87 76% .04 .04
(Table 3 Continues)

DIBELS/CTOPP 31
PACom
PSF Cut-Score Sensitivity Specificity PPP NPP CC Phi Kappa
34 .93 .23 .20 .96 35% .15 .07
30 .93 .39 .24 .94 47% .25 .14
25 .87 .39 .23 .93 48% .21 .13
20 .80 .42 .23 .91 49% .17 .11
15 .60 .55 .22 .87 56% .11 .09
13 .60 .58 .23 .87 58% .14 .11
10 .53 .68 .26 .87 65% .17 .15
(Table 3 Continues)

DIBELS/CTOPP 32
PMCom
PSF Cut-Score Sensitivity Specificity PPP NPP CC Phi Kappa
34 1.00 .23 .16 1.00 33% .19 .07
30 1.00 .36 .19 1.00 44% .26 .13
25 .91 .39 .18 .97 45% .21 .11
20 .91 .43 .19 .97 49% .23 .13
15 .73 .56 .20 .93 58% .19 .13
13 .73 .59 .21 .94 60% .21 .15
10 .64 .68 .23 .93 67% .22 .18
(Table 3 Continues)

DIBELS/CTOPP 33
RNCom
PSF Cut-Score Sensitivity Specificity PPP NPP CC Phi Kappa
34 .80 .21 .13 .88 29% .00 .00
30 .70 .31 .13 .88 36% .01 .00
25 .60 .34 .12 .86 38% .04 .02
20 .60 .39 .12 .87 41% .01 .01
15 .50 .53 .13 .88 53% .02 .01
13 .40 .54 .11 .86 53% .04 .03
10 .20 .63 .07 .85 58% .12 .10
(Table 3 Continues)
DIBELS/CTOPP 34
PACom
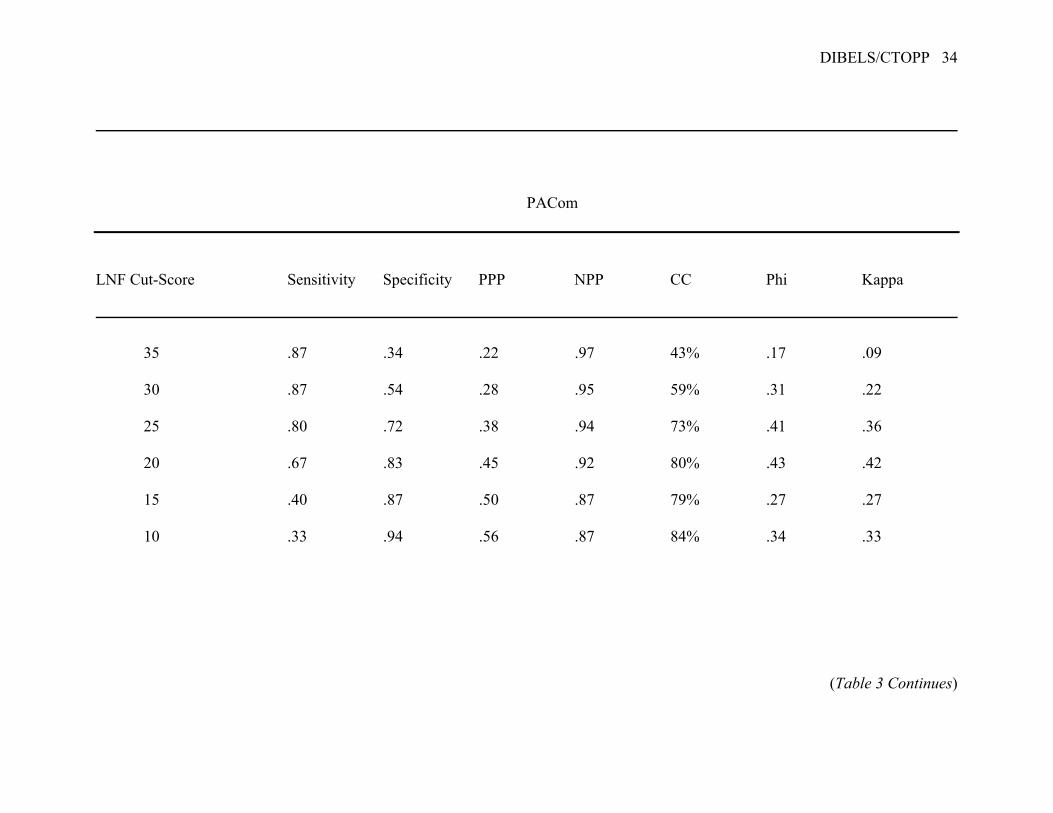
LNF Cut-Score Sensitivity Specificity PPP NPP CC Phi Kappa
35 .87 .34 .22 .97 43% .17 .09
30 .87 .54 .28 .95 59% .31 .22
25 .80 .72 .38 .94 73% .41 .36
20 .67 .83 .45 .92 80% .43 .42
15 .40 .87 .50 .87 79% .27 .27
10 .33 .94 .56 .87 84% .34 .33
(Table 3 Continues)

DIBELS/CTOPP 35
PMCom
LNF Cut-Score Sensitivity Specificity PPP NPP CC Phi Kappa
35 1.00 .35 .18 1.00 43% .25 .12
30 .91 .52 .22 .98 57% .29 .18
25 .73 .65 .24 .94 66% .26 .20
20 .55 .79 .27 .92 74% .25 .23
15 .27 .84 .30 .89 77% .10 .10
10 .27 .92 .33 .89 84% .21 .21
(Table 3 Continues)

DIBELS/CTOPP 36
RNCOM
LNF Cut-Score Sensitivity Specificity PPP NPP CC Phi Kappa
35 1.00 .36 .18 1.00 41% .26 .12
30 1.00 .55 .24 1.00 57% .37 .24
25 .70 .59 .24 .94 64% .27 .21
20 .50 .82 .29 .92 73% .27 .25
15 .20 .87 .18 .88 73% .07 .07
10 .10 .91 .14 .88 76% .02 .02
____________________________________________________________________________________________________________
Note. PPP = Positive Predictive Power; Npp = Negative Predictive Power; CC = Correct Classification; OnF = Onset Recognition
Fluency; PSF = Phoneme Segmentation Fluency; LNF = Letter Naming Fluency; PACom = Phonological Awareness Composite;
PMCom = Phonological Memory Composite; RNCom = Rapid Naming Composite.

DIBELS/CTOPP 37
Figure Captions
Figure 1. ROC curves for DIBELS measures predicting Phonological Awareness
Composite.
Figure 2. ROC curves for DIBELS measures predicting Phonological Memory
Composite.
Figure 3. ROC curves for DIBELS measures predicting Rapid Naming Composite.

DIBELS/CTOPP 38
ROC Curve
1 - Specificity
1.00.75.50.250.00
Sens
itivi
ty1.00
.75
.50
.25
0.00
Source of the Curve
ISF MED
LNF MED
PSF MED
DIBELS/CTOPP 39
ROC Curve
1 - Specificity
1.00.75.50.250.00
Sens
itivi
ty1.00
.75
.50
.25
0.00
Source of the Curve
ISF MED
LNF MED
PSF MED

DIBELS/CTOPP 40
ROC Curve
1 - Specificity
1.00.75.50.250.00
Sens
itivi
ty1.00
.75
.50
.25
0.00
Source of the Curve
ISF MED
LNF MED
PSF MED