rts financial analysis - sevak solutions incsevaksolutions.org/docs/rts financial analysis.pdfrts...
TRANSCRIPT

RTS Financial Analysis
Evaluation of Three Business Models Tested in Uganda Pilot
CONVENING PARTNER
Hewlett-Packard Company
Janine Firpo, HP Director and Project Leader
MICRODEVELOPMENT FINANCE TEAM
Hewlett-Packard Company ACCION International
Bizcredit LLC eChange LLC
FINCA International Freedom From Hunger
Grameen Foundation USA PRIDE AFRICA
USAID
GDA Grant
STANFORD GRADUATE SCHOOL OF BUSINESS
STUDENT TEAM: Rachel Payne – Team Leader
Maurizio Fronza Maria Gonzalez-Alvarez
Fred Swaniker
FACULTY SPONSOR: Dr. George Parker
MICRO-FINANCE DOMAIN SPECIALISTS
ECHANGE LLC (IT INTEGRATION AND DEPLOYMENT) Laura Frederick, President
BIZCREDIT LLC (FINANCIAL ANALYSIS) Lisa Lindsley, CEO
QUICKCYCLE CONSULTING LLC (FINANCIAL ANALYSIS AND BUSINESS DEVELOPMENT) Richard Parenteau, Managing Partner
CYNDEO LLC (TECHNOLOGY DEVELOPMENT) Sandeep Chatterjee, CEO
RTS Business Model Analysis Page 1 of 61 © June, 2005. Microdevelopment Finance Team
TABLE OF CONTENTS
OVERVIEW 3 OVERVIEW 3
1.1. UGANDA MICROFINANCE SECTOR CASE STUDY 3 1.2. OVERVIEW OF UGANDA 5 1.3. UGANDA’S MICROFINANCE SECTOR 6 1.4. MFT AFFILIATES IN UGANDA 8
TABLE 1: MFT Affiliates in Uganda 8 1.5. UMU OVERVIEW 9 1.6. FINCA OVERVIEW 11 1.7. FOCCAS OVERVIEW 12
2. DESCRIPTION OF FINANCIAL MODEL 14 2.1. OBJECTIVES FOR MODEL 15 2.2. ACTIVITIES PERFORMED 16
3. RTS FINANCIAL ANALYSIS AND FINDINGS 17 3.1. WHAT IS THE RTS? 17 3.2. SUMMARY FINDINGS 19 3.3. THE MFI CLIENT 23 3.4. FINANCIAL RESULTS FOR NEW AND EXISTING CLIENTS 24
TABLE 2: CLIENT BACKGROUND SUMMARY 26 TABLE 3: EXISTING CLIENT RTS SAVINGS SUMMARY 26 TABLE 4: NEW CLIENT RTS SAVINGS SUMMARY 27
3.5. THE AGENT 27 3.6. FINANCIAL RESULTS FOR AGENTS 28
TABLE 5: AGENT BACKGROUND SUMMARY 29 TABLE 6: AGENT RTS SAVINGS SUMMARY 29
3.7. THE MFI 30 3.7.1. FINANCIAL RESULTS FOR MICRO FINANCE INSTITUTIONS 30 3.7.2. GROUP MODEL 31 3.7.3. BRANCH MODEL 33 3.7.4. INDIVIDUAL MODEL 33 3.7.5. IMPLEMENTATION CONSIDERATIONS FOR ALL MODELS 35
TABLE 7: MFI BACKGROUND SUMMARY 38 TABLE 8: MFI RTS CAPITAL & START-UP COSTS SUMMARY 40 TABLE 9: MFI RTS OPERATIONS SUMMARY 41 TABLE 10: MFI RTS INDIVIDUAL MODEL – ALTERNATE FEES 41
3.8. INTANGIBLE FACTORS 44 3.9. OPEN QUESTIONS 45 3.10. RISK AREAS 46
4. APPENDIX A: INPUT DATA COLLECTION TOOLS 49 5. APPENDIX B: DETAILS OF ECONOMIC MODELS 50 6. APPENDIX C: FLOW CHARTS FOR ECONOMIC MODELS 59
RTS Business Model Analysis Page 2 of 61 © June, 2005. Microdevelopment Finance Team
Overview
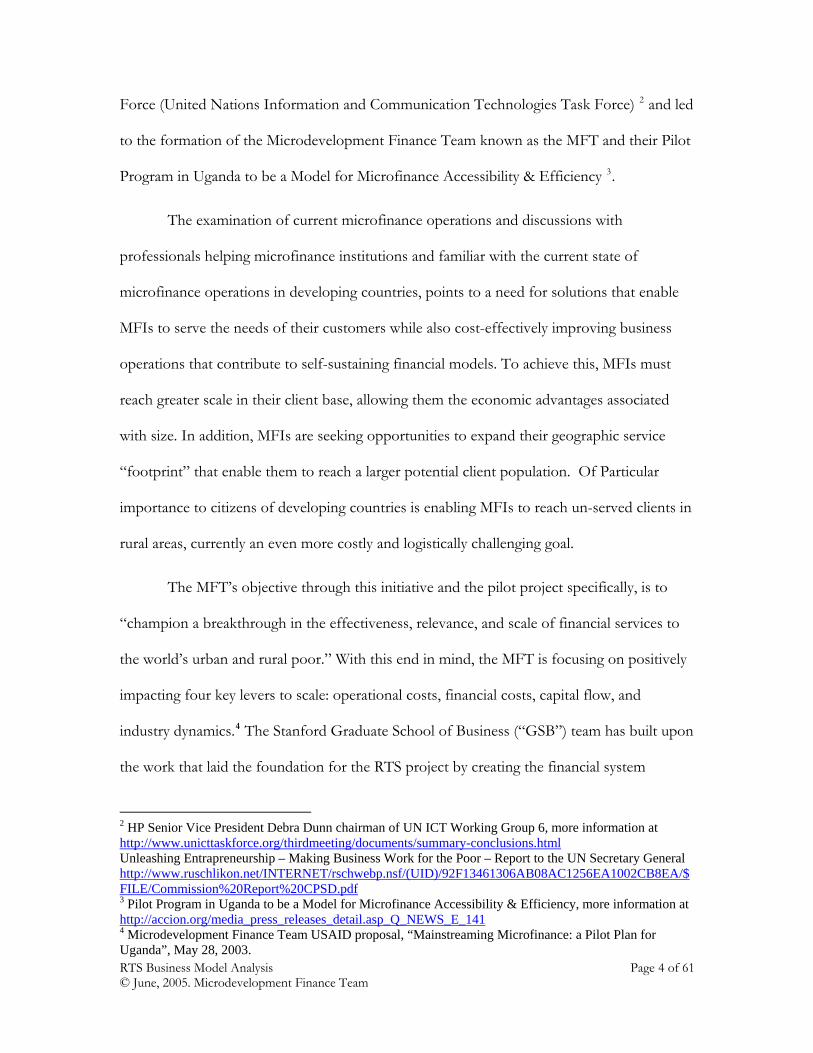
1.1. Uganda Microfinance Sector Case Study
Worldwide Microfinance serves a current customer base of between 40 and 70
million clients and has achieved a remarkable record as one of the few sustainable
approaches for alleviating severe poverty in developing countries1. This is accomplished via
access to credit and other financial services tailored to serve these people and allowing
individual “micro entrepreneurs” to create small business activities in their home or local
community creating sustainable economic value. Unfortunately the need is much greater
than current capacity, with a potential market of nearly 500 million clients worldwide at the
“bottom” of the pyramid. A further opportunity one step up the economic ladder is the
“unbanked” client population, estimated to exceed 4 Billion in the low and middle income
counties of the world. The current growth curve of microfinance institutions is orders of
magnitude below what is needed to service the potential market in any acceptable time
frame. Current operating models for microfinance institutions in the developing world show
many small/medium size players in a fragmented market, who are typically characterized by
a lack of data standardization, infrastructure and operational capacity. The challenge is to
identify and address systemic barriers to more rapid growth. The authors and participants
set out to answer the question “What changes in operating philosophy, methods and
infrastructure are needed to allow scaling of microfinance services orders of magnitude more
rapidly?” This challenge was taken up by HP as part of its work with the UN ICT Task
1 UN International Year of Microcredit 2005 http://www.yearofmicrocredit.org/pages/reslib/reslib_recreading.aspAnalysis of the Effects of Microfinance on Poverty Reduction, Jonathan Morduch, Barbara Haley http://www.nyu.edu/wagner/public_html/cgi-bin/workingPapers/wp1014.pdfRTS Business Model Analysis Page 3 of 61 © June, 2005. Microdevelopment Finance Team
Force (United Nations Information and Communication Technologies Task Force) 2 and led
to the formation of the Microdevelopment Finance Team known as the MFT and their Pilot
Program in Uganda to be a Model for Microfinance Accessibility & Efficiency 3.
The examination of current microfinance operations and discussions with
professionals helping microfinance institutions and familiar with the current state of
microfinance operations in developing countries, points to a need for solutions that enable
MFIs to serve the needs of their customers while also cost-effectively improving business
operations that contribute to self-sustaining financial models. To achieve this, MFIs must
reach greater scale in their client base, allowing them the economic advantages associated
with size. In addition, MFIs are seeking opportunities to expand their geographic service
“footprint” that enable them to reach a larger potential client population. Of Particular
importance to citizens of developing countries is enabling MFIs to reach un-served clients in
rural areas, currently an even more costly and logistically challenging goal.
The MFT’s objective through this initiative and the pilot project specifically, is to
“champion a breakthrough in the effectiveness, relevance, and scale of financial services to
the world’s urban and rural poor.” With this end in mind, the MFT is focusing on positively
impacting four key levers to scale: operational costs, financial costs, capital flow, and
industry dynamics.4 The Stanford Graduate School of Business (“GSB”) team has built upon
the work that laid the foundation for the RTS project by creating the financial system
2 HP Senior Vice President Debra Dunn chairman of UN ICT Working Group 6, more information at http://www.unicttaskforce.org/thirdmeeting/documents/summary-conclusions.htmlUnleashing Entrapreneurship – Making Business Work for the Poor – Report to the UN Secretary General http://www.ruschlikon.net/INTERNET/rschwebp.nsf/(UID)/92F13461306AB08AC1256EA1002CB8EA/$FILE/Commission%20Report%20CPSD.pdf3 Pilot Program in Uganda to be a Model for Microfinance Accessibility & Efficiency, more information at http://accion.org/media_press_releases_detail.asp_Q_NEWS_E_1414 Microdevelopment Finance Team USAID proposal, “Mainstreaming Microfinance: a Pilot Plan for Uganda”, May 28, 2003. RTS Business Model Analysis Page 4 of 61 © June, 2005. Microdevelopment Finance Team
modeling tool. This tool is used for understanding how the revenue and expense drivers can
be captured for on-going analysis of how well the RTS pilot and participating MFIs are
achieving the goals set forth by the MFT.
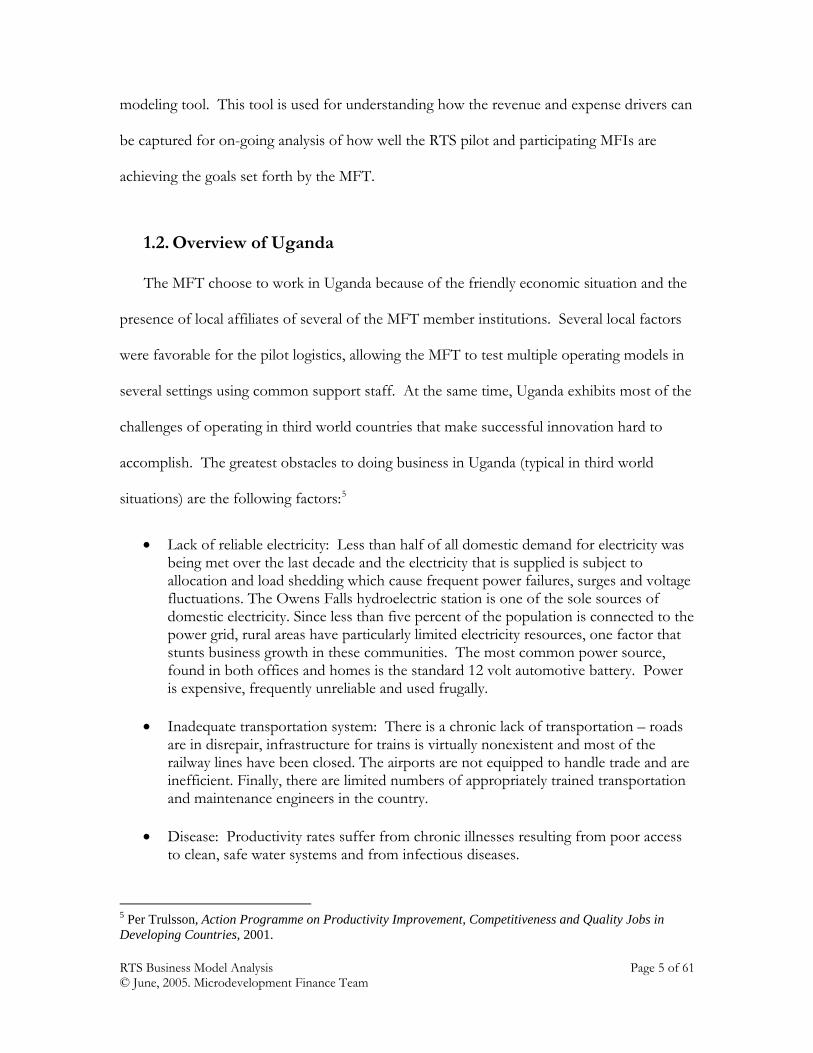
1.2. Overview of Uganda
The MFT choose to work in Uganda because of the friendly economic situation and the
presence of local affiliates of several of the MFT member institutions. Several local factors
were favorable for the pilot logistics, allowing the MFT to test multiple operating models in
several settings using common support staff. At the same time, Uganda exhibits most of the
challenges of operating in third world countries that make successful innovation hard to
accomplish. The greatest obstacles to doing business in Uganda (typical in third world
situations) are the following factors:5
• Lack of reliable electricity: Less than half of all domestic demand for electricity was being met over the last decade and the electricity that is supplied is subject to allocation and load shedding which cause frequent power failures, surges and voltage fluctuations. The Owens Falls hydroelectric station is one of the sole sources of domestic electricity. Since less than five percent of the population is connected to the power grid, rural areas have particularly limited electricity resources, one factor that stunts business growth in these communities. The most common power source, found in both offices and homes is the standard 12 volt automotive battery. Power is expensive, frequently unreliable and used frugally.
• Inadequate transportation system: There is a chronic lack of transportation – roads
are in disrepair, infrastructure for trains is virtually nonexistent and most of the railway lines have been closed. The airports are not equipped to handle trade and are inefficient. Finally, there are limited numbers of appropriately trained transportation and maintenance engineers in the country.
• Disease: Productivity rates suffer from chronic illnesses resulting from poor access
to clean, safe water systems and from infectious diseases.
5 Per Trulsson, Action Programme on Productivity Improvement, Competitiveness and Quality Jobs in Developing Countries, 2001. RTS Business Model Analysis Page 5 of 61 © June, 2005. Microdevelopment Finance Team
• Limited telecommunications network: Outside of Kampala, where approximately ten percent of the population has access to a phone, only 0.3% of the populations had phone line and 0.04% had cellular access – with rural areas being the most underserved. Although Uganda Telecom privatized in 1998 and competition is on the rise, service is still very limited, especially in rural areas.
1.3. Uganda’s Microfinance Sector
The MFT decided to focus on a specific geography to develop the technology
solution and study the implementation process and challenges in a realistic environment that
reflects many of the conditions MFIs face in developing economies. Uganda was chosen due
to these factors as well as the progressive nature of government regulations and the
dynamism of its microfinance sector, which is representative of the broader microfinance
market, particularly in Africa.6 In addition, Uganda’s fragmented and emerging information
and communications infrastructure poses exactly the type of challenge and sets the
appropriate environment for understanding how well the RTS can function in an
environment “hostile” to technology typical of developing countries. Important to the pilot
activities, all the network institutions represented in the MFT have affiliates in Uganda and
extensive experience in that market in setting up or maintaining microfinance operations of
some kind (see Table 1). 7
MFIs based in Uganda face increasing pressure to improve financial performance,
provide a broader range of financial services at competitive rates and to increase their
outreach to rural clients (see Section 1.5 through 1.7). Pressure from commercial banks,
regulators (such as the Bank of Uganda), donors and clients are challenging MFIs to re-
evaluate existing operations and find better ways to serve customers, tailor their products,
6 Africa currently has less than 17% penetration and depth of outreach of microfinance services. Source: The MicroBanking Bulletin web site: http://www.mixmbb.org/en/ 7 Microdevelopment Finance Team USAID proposal, “Mainstreaming Microfinance: a Pilot Plan for Uganda”, May 28, 2003. RTS Business Model Analysis Page 6 of 61 © June, 2005. Microdevelopment Finance Team

expand their product offering and grow their client base at rates exceeding historical trends.
As is the case in many emerging countries, increasing saturation in urban markets is pushing
MFIs to broaden their geographic footprint and acquire customers in rural and peri-urban
areas. Without significant modifications in outreach methods and operating efficiency, these
goals will be nearly impossible to achieve.8
In addition, the recently passed MDI Bill permits MFIs to become deposit-taking
institutions, subject to their meeting stringent regulatory criteria issued by the Bank of
Uganda (such financial performance history, capitalization, governance structure and
controls), which also increases the pressure on large MFIs to comply with regulations and
new reporting burdens.
8 The donor community in Uganda developed a vision for the future of the industry that includes 25% growth in the microfinance client base through 2005. Microdevelopment Finance Team USAID proposal, “Mainstreaming Microfinance: a Pilot Plan for Uganda”, May 28, 2003. RTS Business Model Analysis Page 7 of 61 © June, 2005. Microdevelopment Finance Team
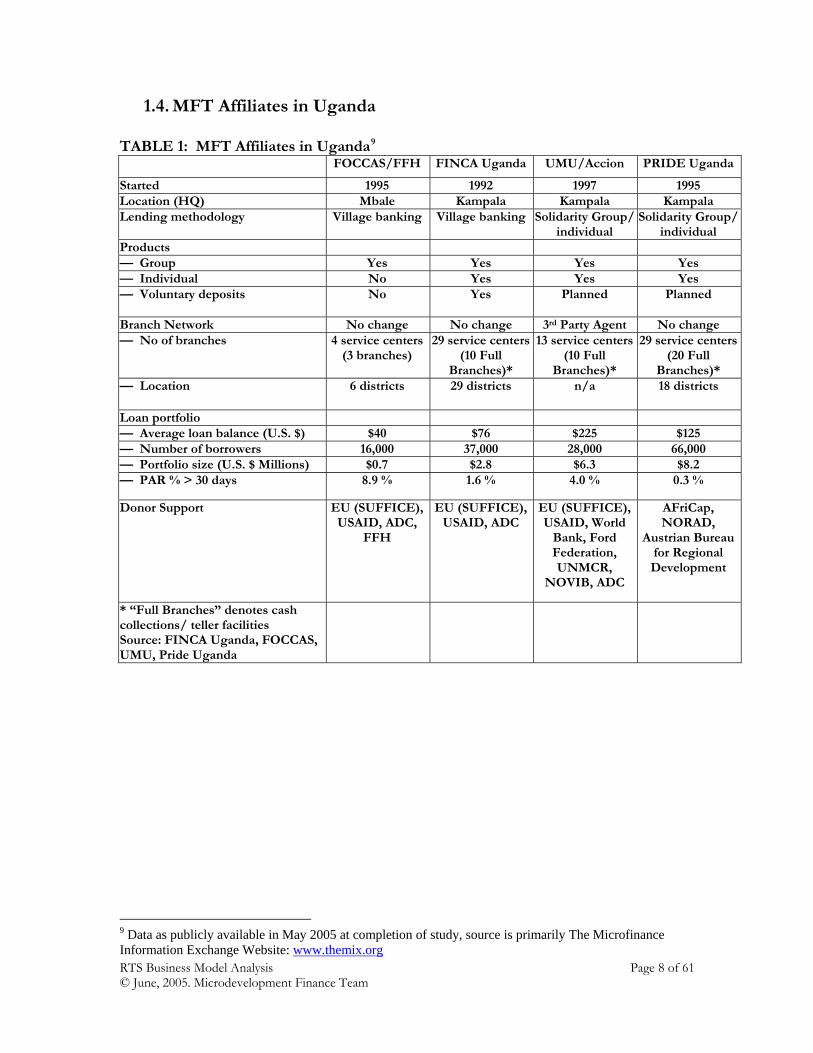
1.4. MFT Affiliates in Uganda
TABLE 1: MFT Affiliates in Uganda9
FOCCAS/FFH FINCA Uganda UMU/Accion PRIDE Uganda
Started 1995 1992 1997 1995 Location (HQ) Mbale Kampala Kampala Kampala Lending methodology Village banking Village banking Solidarity Group/
individual Solidarity Group/
individual Products — Group Yes Yes Yes Yes — Individual No Yes Yes Yes — Voluntary deposits No Yes Planned Planned
Branch Network No change No change 3rd Party Agent No change — No of branches 4 service centers
(3 branches) 29 service centers
(10 Full Branches)*
13 service centers (10 Full
Branches)*
29 service centers(20 Full
Branches)* — Location 6 districts 29 districts n/a 18 districts
Loan portfolio — Average loan balance (U.S. $) $40 $76 $225 $125 — Number of borrowers 16,000 37,000 28,000 66,000 — Portfolio size (U.S. $ Millions) $0.7 $2.8 $6.3 $8.2 — PAR % > 30 days 8.9 % 1.6 % 4.0 % 0.3 %
Donor Support EU (SUFFICE), USAID, ADC,
FFH
EU (SUFFICE), USAID, ADC
EU (SUFFICE), USAID, World
Bank, Ford Federation, UNMCR,
NOVIB, ADC
AFriCap, NORAD,
Austrian Bureau for Regional Development
* “Full Branches” denotes cash collections/ teller facilities Source: FINCA Uganda, FOCCAS, UMU, Pride Uganda
9 Data as publicly available in May 2005 at completion of study, source is primarily The Microfinance Information Exchange Website: www.themix.orgRTS Business Model Analysis Page 8 of 61 © June, 2005. Microdevelopment Finance Team
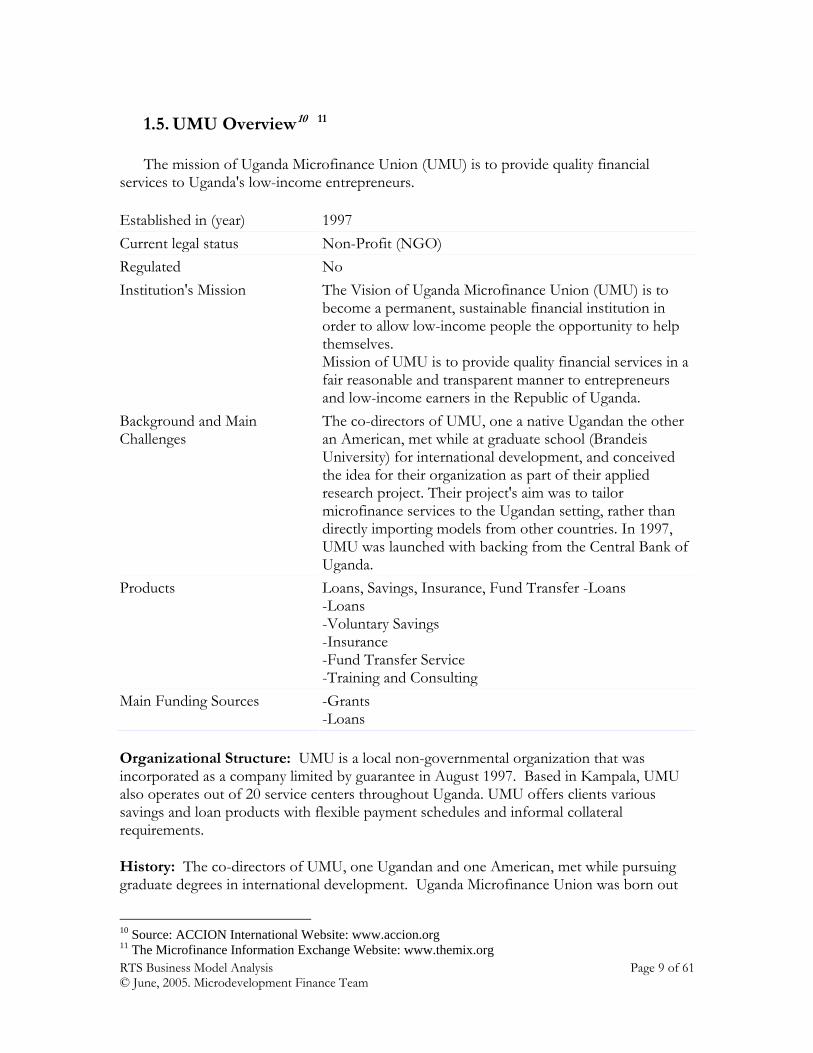
1.5. UMU Overview10 11
The mission of Uganda Microfinance Union (UMU) is to provide quality financial services to Uganda's low-income entrepreneurs. Established in (year) 1997 Current legal status Non-Profit (NGO) Regulated No Institution's Mission The Vision of Uganda Microfinance Union (UMU) is to
become a permanent, sustainable financial institution in order to allow low-income people the opportunity to help themselves. Mission of UMU is to provide quality financial services in a fair reasonable and transparent manner to entrepreneurs and low-income earners in the Republic of Uganda.
Background and Main Challenges
The co-directors of UMU, one a native Ugandan the other an American, met while at graduate school (Brandeis University) for international development, and conceived the idea for their organization as part of their applied research project. Their project's aim was to tailor microfinance services to the Ugandan setting, rather than directly importing models from other countries. In 1997, UMU was launched with backing from the Central Bank of Uganda.
Products Loans, Savings, Insurance, Fund Transfer -Loans -Loans -Voluntary Savings -Insurance -Fund Transfer Service -Training and Consulting
Main Funding Sources -Grants -Loans
Organizational Structure: UMU is a local non-governmental organization that was incorporated as a company limited by guarantee in August 1997. Based in Kampala, UMU also operates out of 20 service centers throughout Uganda. UMU offers clients various savings and loan products with flexible payment schedules and informal collateral requirements.
History: The co-directors of UMU, one Ugandan and one American, met while pursuing graduate degrees in international development. Uganda Microfinance Union was born out
10 Source: ACCION International Website: www.accion.org 11 The Microfinance Information Exchange Website: www.themix.org RTS Business Model Analysis Page 9 of 61 © June, 2005. Microdevelopment Finance Team
of their thesis paper, with the aim of tailoring microfinance services to the Ugandan setting, rather than directly importing models from other countries. In 1997, UMU was launched with a small seed grant from the Central Bank of Uganda.
Client Profile: Uganda has a population of approximately 25 million people, 90 percent of whom are located in rural areas. UMU originally began serving rural clients and has since expanded to cover peri-urban and urban areas as well
Impact: UMU has grown rapidly in its 7 years of existence, and now serves over 50,000 clients with credit and savings products. Its historical repayment rate tops 99 percent.
New Initiatives: UMU is finalizing its application to the Central Bank for status as a regulated Micro Deposit Taking Institution. It is hoped that transformation will occur in early to mid 2005, with conversion to a private share company. ACCION continues to work with UMU on building a greater training department capacity, upgrading the reporting functionality of its MIS, improving customer service and building a stronger brand image. UMU is also piloting a small enterprise loan product this year.
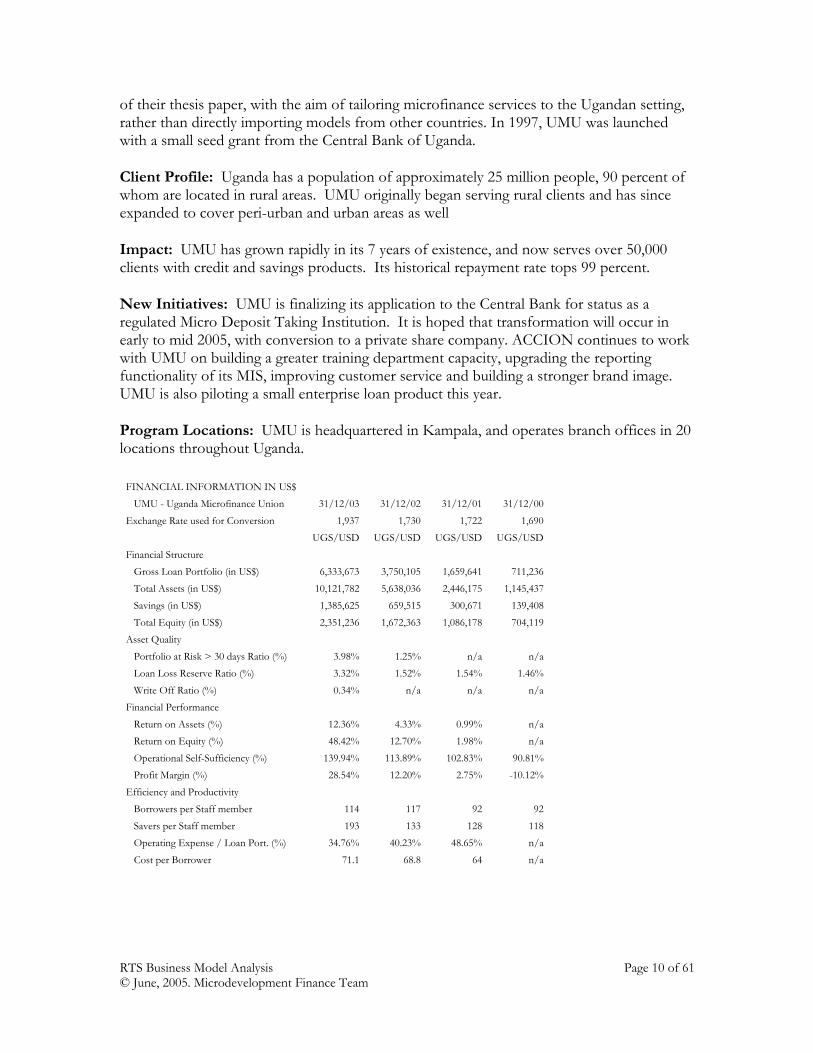
Program Locations: UMU is headquartered in Kampala, and operates branch offices in 20 locations throughout Uganda.
FINANCIAL INFORMATION IN US$ UMU - Uganda Microfinance Union 31/12/03 31/12/02 31/12/01 31/12/00Exchange Rate used for Conversion 1,937 1,730 1,722 1,690 UGS/USD UGS/USD UGS/USD UGS/USD Financial Structure Gross Loan Portfolio (in US$) 6,333,673 3,750,105 1,659,641 711,236 Total Assets (in US$) 10,121,782 5,638,036 2,446,175 1,145,437 Savings (in US$) 1,385,625 659,515 300,671 139,408 Total Equity (in US$) 2,351,236 1,672,363 1,086,178 704,119Asset Quality Portfolio at Risk > 30 days Ratio (%) 3.98% 1.25% n/a n/a Loan Loss Reserve Ratio (%) 3.32% 1.52% 1.54% 1.46% Write Off Ratio (%) 0.34% n/a n/a n/a Financial Performance Return on Assets (%) 12.36% 4.33% 0.99% n/a Return on Equity (%) 48.42% 12.70% 1.98% n/a Operational Self-Sufficiency (%) 139.94% 113.89% 102.83% 90.81% Profit Margin (%) 28.54% 12.20% 2.75% -10.12%Efficiency and Productivity Borrowers per Staff member 114 117 92 92 Savers per Staff member 193 133 128 118 Operating Expense / Loan Port. (%) 34.76% 40.23% 48.65% n/a Cost per Borrower 71.1 68.8 64 n/a
RTS Business Model Analysis Page 10 of 61 © June, 2005. Microdevelopment Finance Team
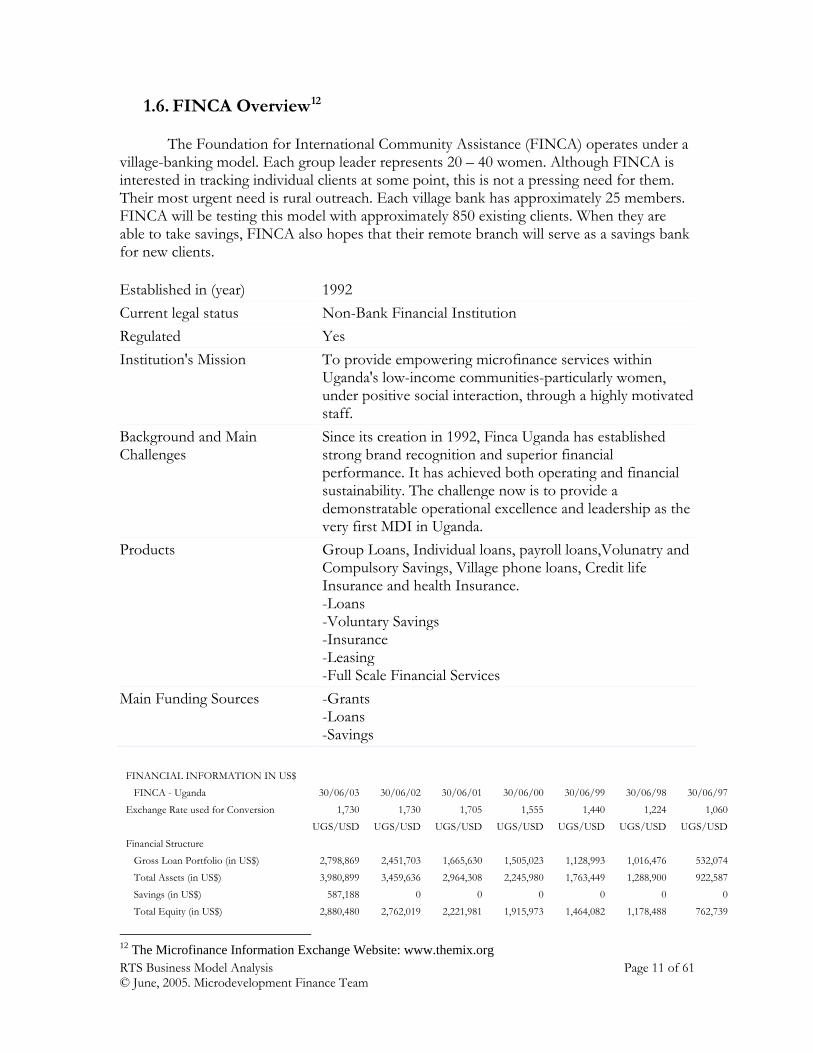
1.6. FINCA Overview12
The Foundation for International Community Assistance (FINCA) operates under a village-banking model. Each group leader represents 20 – 40 women. Although FINCA is interested in tracking individual clients at some point, this is not a pressing need for them. Their most urgent need is rural outreach. Each village bank has approximately 25 members. FINCA will be testing this model with approximately 850 existing clients. When they are able to take savings, FINCA also hopes that their remote branch will serve as a savings bank for new clients.
Established in (year) 1992 Current legal status Non-Bank Financial Institution Regulated Yes Institution's Mission To provide empowering microfinance services within
Uganda's low-income communities-particularly women, under positive social interaction, through a highly motivated staff.
Background and Main Challenges
Since its creation in 1992, Finca Uganda has established strong brand recognition and superior financial performance. It has achieved both operating and financial sustainability. The challenge now is to provide a demonstratable operational excellence and leadership as the very first MDI in Uganda.
Products Group Loans, Individual loans, payroll loans,Volunatry and Compulsory Savings, Village phone loans, Credit life Insurance and health Insurance. -Loans -Voluntary Savings -Insurance -Leasing -Full Scale Financial Services
Main Funding Sources -Grants -Loans -Savings
FINANCIAL INFORMATION IN US$ FINCA - Uganda 30/06/03 30/06/02 30/06/01 30/06/00 30/06/99 30/06/98 30/06/97Exchange Rate used for Conversion 1,730 1,730 1,705 1,555 1,440 1,224 1,060 UGS/USD UGS/USD UGS/USD UGS/USD UGS/USD UGS/USD UGS/USD Financial Structure Gross Loan Portfolio (in US$) 2,798,869 2,451,703 1,665,630 1,505,023 1,128,993 1,016,476 532,074 Total Assets (in US$) 3,980,899 3,459,636 2,964,308 2,245,980 1,763,449 1,288,900 922,587 Savings (in US$) 587,188 0 0 0 0 0 0 Total Equity (in US$) 2,880,480 2,762,019 2,221,981 1,915,973 1,464,082 1,178,488 762,739
12 The Microfinance Information Exchange Website: www.themix.org RTS Business Model Analysis Page 11 of 61 © June, 2005. Microdevelopment Finance Team
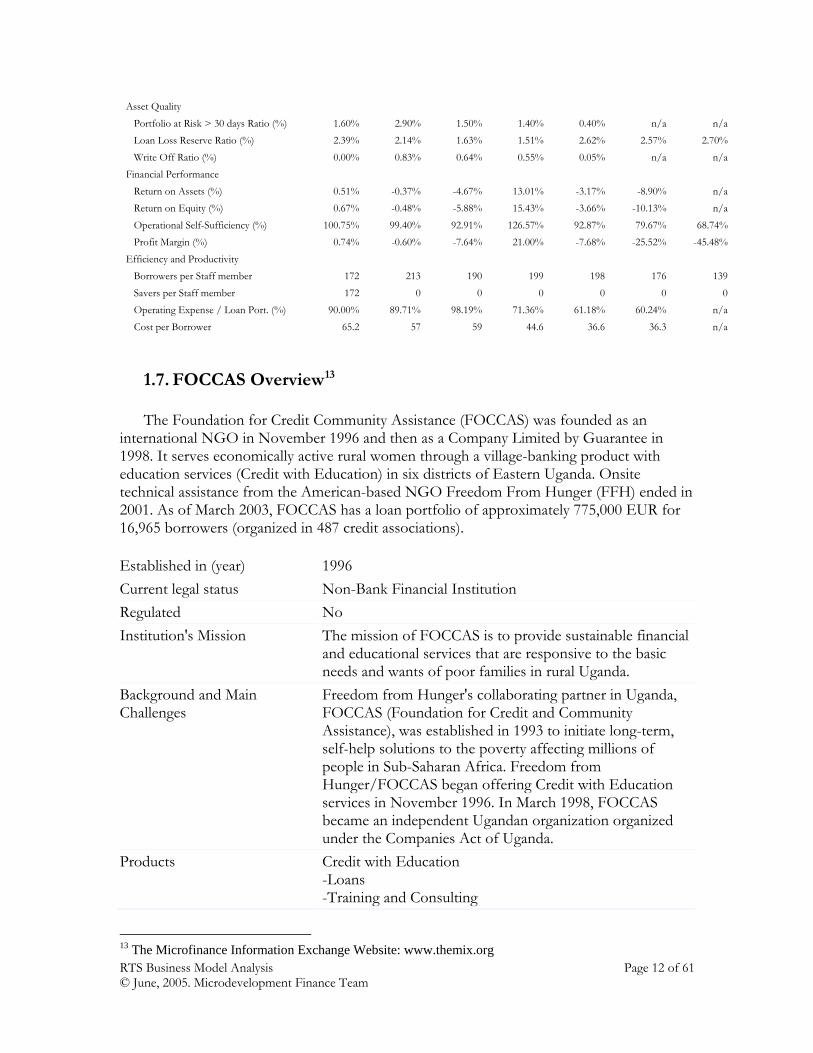
Asset Quality Portfolio at Risk > 30 days Ratio (%) 1.60% 2.90% 1.50% 1.40% 0.40% n/a n/a Loan Loss Reserve Ratio (%) 2.39% 2.14% 1.63% 1.51% 2.62% 2.57% 2.70% Write Off Ratio (%) 0.00% 0.83% 0.64% 0.55% 0.05% n/a n/a Financial Performance Return on Assets (%) 0.51% -0.37% -4.67% 13.01% -3.17% -8.90% n/a Return on Equity (%) 0.67% -0.48% -5.88% 15.43% -3.66% -10.13% n/a Operational Self-Sufficiency (%) 100.75% 99.40% 92.91% 126.57% 92.87% 79.67% 68.74% Profit Margin (%) 0.74% -0.60% -7.64% 21.00% -7.68% -25.52% -45.48%Efficiency and Productivity Borrowers per Staff member 172 213 190 199 198 176 139 Savers per Staff member 172 0 0 0 0 0 0 Operating Expense / Loan Port. (%) 90.00% 89.71% 98.19% 71.36% 61.18% 60.24% n/a Cost per Borrower 65.2 57 59 44.6 36.6 36.3 n/a
1.7. FOCCAS Overview13
The Foundation for Credit Community Assistance (FOCCAS) was founded as an international NGO in November 1996 and then as a Company Limited by Guarantee in 1998. It serves economically active rural women through a village-banking product with education services (Credit with Education) in six districts of Eastern Uganda. Onsite technical assistance from the American-based NGO Freedom From Hunger (FFH) ended in 2001. As of March 2003, FOCCAS has a loan portfolio of approximately 775,000 EUR for 16,965 borrowers (organized in 487 credit associations). Established in (year) 1996 Current legal status Non-Bank Financial Institution Regulated No Institution's Mission The mission of FOCCAS is to provide sustainable financial
and educational services that are responsive to the basic needs and wants of poor families in rural Uganda.
Background and Main Challenges
Freedom from Hunger's collaborating partner in Uganda, FOCCAS (Foundation for Credit and Community Assistance), was established in 1993 to initiate long-term, self-help solutions to the poverty affecting millions of people in Sub-Saharan Africa. Freedom from Hunger/FOCCAS began offering Credit with Education services in November 1996. In March 1998, FOCCAS became an independent Ugandan organization organized under the Companies Act of Uganda.
Products Credit with Education -Loans -Training and Consulting
13 The Microfinance Information Exchange Website: www.themix.org RTS Business Model Analysis Page 12 of 61 © June, 2005. Microdevelopment Finance Team
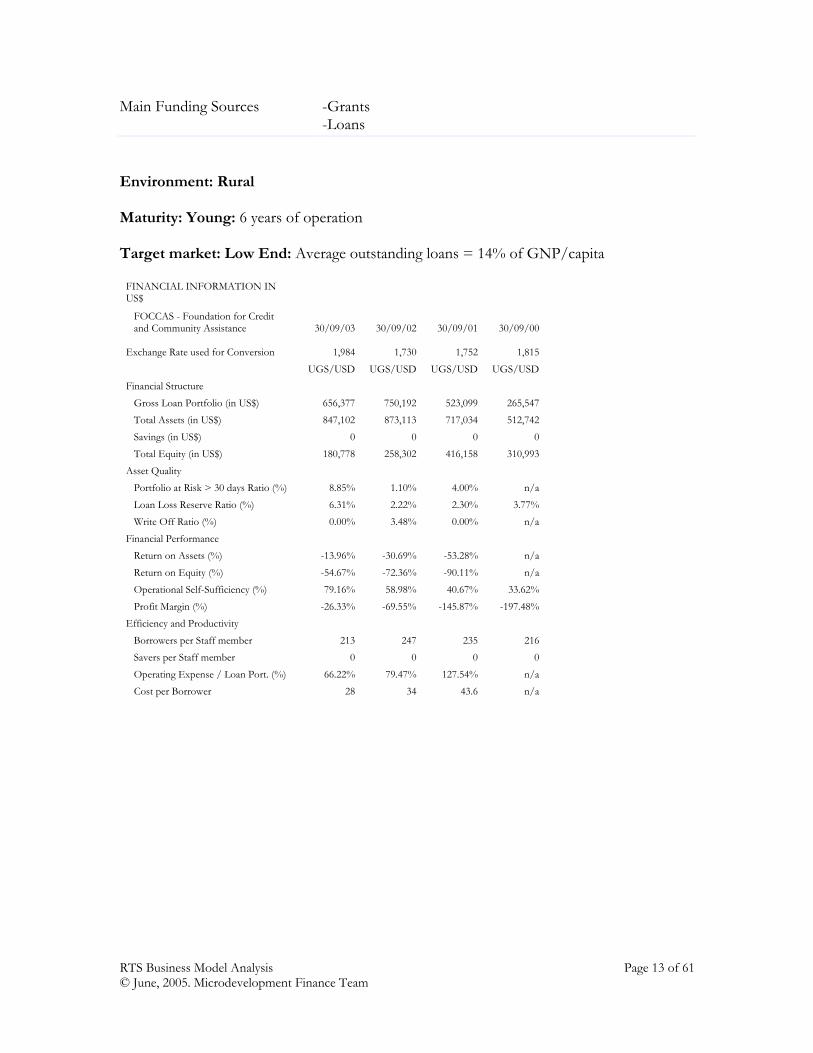
Main Funding Sources -Grants -Loans
Environment: Rural Maturity: Young: 6 years of operation Target market: Low End: Average outstanding loans = 14% of GNP/capita
FINANCIAL INFORMATION IN US$
FOCCAS - Foundation for Credit and Community Assistance 30/09/03 30/09/02 30/09/01 30/09/00
Exchange Rate used for Conversion
1,984 1,730 1,752 1,815 UGS/USD UGS/USD UGS/USD UGS/USD Financial Structure Gross Loan Portfolio (in US$) 656,377 750,192 523,099 265,547 Total Assets (in US$) 847,102 873,113 717,034 512,742 Savings (in US$) 0 0 0 0 Total Equity (in US$) 180,778 258,302 416,158 310,993 Asset Quality Portfolio at Risk > 30 days Ratio (%) 8.85% 1.10% 4.00% n/a Loan Loss Reserve Ratio (%) 6.31% 2.22% 2.30% 3.77% Write Off Ratio (%) 0.00% 3.48% 0.00% n/a Financial Performance Return on Assets (%) -13.96% -30.69% -53.28% n/a Return on Equity (%) -54.67% -72.36% -90.11% n/a Operational Self-Sufficiency (%) 79.16% 58.98% 40.67% 33.62% Profit Margin (%) -26.33% -69.55% -145.87% -197.48% Efficiency and Productivity Borrowers per Staff member 213 247 235 216 Savers per Staff member 0 0 0 0 Operating Expense / Loan Port. (%) 66.22% 79.47% 127.54% n/a Cost per Borrower 28 34 43.6 n/a
0 2001 2002 2003(a) 2000 2001 2002 2003(a)
RTS Business Model Analysis Page 13 of 61 © June, 2005. Microdevelopment Finance Team
2. Description of Financial Model
Given the dynamic factors inherent in the pilot and the iterative product development
process underway, to develop the analysis method we chose to follow the Discovery-Driven
Planning Model as described in the article published in the Harvard Business Review. 14 It is a
way to develop the measurement framework in advance and in parallel with the pilot project
in Uganda. Breaking down the assumptions into variables at the most granular level possible,
the model forces a disciplined approach for projecting potential income, running from the
bottom line up – laying out all of the activities required to produce, sell and deliver the
service to understand the revenues necessary for achieving sustainable operation. Once a
reasonable model of the economics and logistics of the venture is established, the enterprise
can then assess the magnitude of the challenges, the sensitivity of the economics to changes
in key variables, and use milestone events to test the assumptions.15
By developing a financial systems model that examines each unit of analysis (MFI client,
MFI and RTS Agent), the GSB 390 Team provided a method to analyze the economic value
for each unit and helped the field team measure and interpret the results of the pilot test.
This model is being used to help determine the viability and potential impact of the RTS
solution. Working closely with advisors provided by HP and with the input of the Ugandan
field team, the GSB Team has used the Discovery-Driven Planning Model approach to
develop the following components for the analysis model project:
• Determine key assumptions • Create financial summaries for each entity • Determine pro forma operations specifications, listing all activities required
14 Rita Gunther and Ian C. MacMillan, “Discovery-Driven Planning,” Harvard Business Review, July-August 1995, pps. 4-12. 15 Rita Gunther and Ian C. MacMillan, “Discovery-Driven Planning,” Harvard Business Review, July-August 1995, p. 11. RTS Business Model Analysis Page 14 of 61 © June, 2005. Microdevelopment Finance Team
• Develop an assumptions (inputs)-tracking tool • Run sensitivity analyses to determine critical success factors for each entity • Provide an easily-updated, dynamic financial systems model • Enable the field team to test assumptions at key milestones
2.1. Objectives for Model
The objective of the RTS business is not necessarily to maximize profits. However,
in order to be self-sustaining and replicable to other markets, it is critical to know if the
revenues will cover all the expenses and if not, what level of subsidies are needed and at
what points. This will allow the HP team to structure RTS and related organizations in the
most viable manner. The way to determine this is through an analytic framework for the
Uganda pilot in order to test the assumptions in a real-life setting and document the results.
If the pilot can demonstrate that the concept works, it is likely that other MFIs and their
clients will adopt it and that the Remote Transaction System Entity (RTSE) would be a
viable business opportunity.
The objective of this model is to provide a working framework for the field team to
continually monitor and report on the pilot project results. By constructing a model that
allows them to input data for each variable as new data comes in, the pilot team will be able
to understand the underlying economics that drive profitability for each entity in the model
and identify where the inputs in the model depart from the reality on the ground. Most
importantly, this approach is an iterative, dynamic process, which enables all parties involved
to work to maximize the pilot’s chances of success by incorporating the most accurate data
available into a model designed for the true conditions in the field. Since the model is
developed in advance of the field experience, it provides a reference for planning collection
methods. However the model will also need revision to reflect the reality of information
available in the field. Some data elements may not be readily available and the model will
RTS Business Model Analysis Page 15 of 61 © June, 2005. Microdevelopment Finance Team
need adaptation accordingly. As each of the identified milestones in the pilot are
accomplished, the Pilot team will test the related assumptions and report the results and then
support distribution of these to the rest of the Microdevelopment Finance Team and other
interested parties.
2.2. Activities performed
During the Academic Winter Quarter 2004, the Stanford GSB Team developed the
following deliverables (with the assistance of the advisors assigned by HP): a financial system
model outlining the economic value for each entity, an impact analysis for the MFIs based
upon best-available information, an economic structure map that outlines the major revenue
and cost elements for each entity, an input-tracking tool and a model manual (this
document). The GSB Team conducted the following activities to meet these deliverable
requirements:
• Developed understanding of Ugandan microcredit environment and institutions • Developed process maps of the RTS Microfinance Business System • Identified key assumptions • Developed pro forma financial statements for each entity • Constructed financial model of the RTS Microfinance Business System • Outlined data requirements and verified input accuracy • Explored preliminary revenue schemes • Developed system to track and tested assumptions within the model • Provided summary of project work and presented to HP, MFT and Student Teams
During the period July 2004 through February 2005, Rachael Payne the leader of the
Stanford GSB Team, participated in a field internship with the MFT Uganda Pilot and
implemented the data collection methods for the model. This work included:
• Developing the data collection methods and reporting forms • Writing the supporting training materials • Training RTS pilot field personnel • Initiating data collection at each MFIs HQ site and Field sites
RTS Business Model Analysis Page 16 of 61 © June, 2005. Microdevelopment Finance Team
• Monitoring and guiding data collection activities • Consolidating field data received from the RTS pilot personnel This particularly valuable experience allowed the initial model to be adapted to the
realities of the field experience and available data from various Pilot sources. The model and
results in the remainder of this paper are based upon this experience and the data collected
during the Pilot period.
During the period March 2005 through April 2005, Richard Parenteau a microfinance
consultant to the MFT, HP and advisor to the GSB Team, performed final data collection
and analysis activities for the RTS pilot. This work included:
• Receiving the remaining field data • Visiting each of the MFI HQ sites to gather additional information • Cleaning data and seeking clarifying information • Consolidating the data for analysis • Performing data analysis • Working with other contributors to develop the summary and final report of results The remainder of this paper focuses on the analysis and results of the RTS pilot with
associated conclusions, observations and recommendations.
3. RTS Financial Analysis and Findings
3.1. What is the RTS?
The Remote Transaction System (RTS) is a combination of technology and business
processes that enable transactions by microfinance clients via a remote transaction system.
By providing both online and batch offline processing modes, features for both group and
individual lending as well as MFI back-office MIS transaction synchronization, the flexibility
of the RTS approach supports several MFI operating models. Three of these were
demonstrated in the Uganda Pilot.
RTS Business Model Analysis Page 17 of 61 © June, 2005. Microdevelopment Finance Team
Participating microfinance institutions were equipped with the technology (hardware
and software) needed to use the RTS. The RTS enabled MFIs to electronically capture
transaction data at the client or group level and MFIs to create an electronic identification
system. The integration of the RTS in MFI operations has potential positive externalities
contributing to the development of related financial institutions (such as credit bureaus)16
and access to regulated financial switches for interaction with commercial banks. The RTS
should be viewed within the context of a larger purpose of establishing a “transaction
processing backbone” or an end-to-end data management system that facilitates information
transfer from the client level to the microfinance institution and importantly to the broader
stakeholder level (such as banks, credit bureaus, institutional services, regulators, civil
services including schools and pensions, donor agencies, etc.).17 The RTS is the critical
access-enabling piece in the overall process of establishing financial systems infrastructure
that reaches the poor and the unbanked.
Through the pilot project, the participating entities worked together to develop the
infrastructure and implement the RTS. They worked to collaboratively develop necessary
business processes for automating data collection and field service operation through the use
of the RTS. The pilot project was used to test the RTS technology, identify desirable changes
to business processes, and the overall level of effort (including resources expended) to
implement the RTS. The RTS was designed to be adaptable to individual as well as group
lending and account management approaches. The pilot was conducted in collaboration with
16 The donor community in Uganda recently agreed on a common set of industry-wide performance reporting metrics for MFIs. This information was being aggregated and managed in a central database at the Association for Microfinance Institutions in Uganda, which has been charged with creating an industry wide repository of MFI performance data called the ‘Performance Management System.” Microdevelopment Finance Team USAID proposal, “Mainstreaming Microfinance: a Pilot Plan for Uganda”, May 28, 2003. 17 Microdevelopment Finance Team USAID proposal, “Mainstreaming Microfinance: a Pilot Plan for Uganda”, May 28, 2003. RTS Business Model Analysis Page 18 of 61 © June, 2005. Microdevelopment Finance Team
the following MFT affiliates in Uganda: UMU, FOCCAS and FINCA Uganda. We greatly
appreciate many aspects of our experience working with them, including: Enthusiasm for
our work; Open discussions about many of the details of their operations; Shared goals for
improvement; Support helping integrate the RTS technology into their MIS systems; Access
to their clients and their experiences; Devotion to operation of the pilot and resolving the
issues that inevitably arise during pilot situations. These are good earnest organizations and
dedicated people look for ways to better server their customers. They are open to
experiments that may help them toward this goal. We applaud their many contributions to
the results of this project.
3.2. Summary Findings
Summary Conclusion: The three pilots allowed the MFT to examine several
diverse operating scenarios and evaluate the value that RTS added into each situation. These
different operating models were: 1) Traditional group lending [the “Group” model], 2)
Branch based group lending [the “Branch” model] and 3) Individual lending with payments
both via 3rd party agents or existing branches [the “Individual” model]. In each situation
the MFIs business processes were examined and decisions made with MFI management
about where the RTS technology would be applied in order to demonstrate improvements in
client service and operating efficiency. Each situation is discussed in more detail below
together with a number of opportunities provided by using the RTS. We highlight the
addition of 3rd party agents here because this innovative approach appears to provide
significant benefits to both clients and to MFI operations. In the pilot 3rd party agents were
demonstrated in the Individual model. We also discuss later in the paper how also to gain
the primary 3rd party agent benefits in the Group model. These 3rd party agents cost-
RTS Business Model Analysis Page 19 of 61 © June, 2005. Microdevelopment Finance Team

effectively extended the MFI service footprint by providing improved client access, reduced
client expense, reduced risk and reduced MFI cash transportation and management
expenses.
3.2.1 Modeling Tools The Stanford Graduate School of Business developed a modeling tool that is
designed to be a dynamic and iterative. It was intended to be modified over time and as
additional data becomes available, the insights gleaned from the data and pilot experiences
are likely to cause extensions to the tool to support further analysis.
Overall, the value created in the RTS financial system will have to be shared
appropriately among the entities in the system in order to ensure buy-in and adoption – each
entity must extract sufficient value to justify expenses or effort expended. The sustainability
of the economic model for each entity hinges upon only three or four key assumptions;
therefore, certain variables are weighted more heavily than others and should be the focal
points for any program adjustments. Based upon the current model structure and the
available data, the following summary findings are provided.
3.2.2 RTS Viability The pilot results indicate that RTS appears more viable in some settings than others.
RTS creates the most value when it expands access to credit for new clients, reduces risk
variables, reduces transportation and lost-time costs for all clients (as opposed to mainly
providing process efficiencies to existing operations) and improves operating economics for
the MFIs. Scale-up will be important to producing the benefits needed for significant
improvement.
3.2.2 MFI Client Income Improvement
RTS Business Model Analysis Page 20 of 61 © June, 2005. Microdevelopment Finance Team
Under the current framework, the value of the RTS for MFI clients differs
considerably depending on whether they are existing clients or new clients. Given this, there
are two client subsets represented: one with new clients (considered those clients whose
experience with the MFI has always been RTS enabled) which emphasizes the increased
revenue and reduced leakage that access to the RTS provides (resulting from their access to
loans and savings) and the existing clients, who in addition to the benefits just mentioned
gain value from reduced costs and time saved by using RTS when compared to their prior
non-RTS experience. It is important to maintain distinct client subsets so that the value to
each does not become blurred and so that MFIs can recognize the distinctions when
planning changes to the fee structure and service terms for each type of client.
3.2.3 Agent Income Improvement In order to provide a regular framework for analysis, the model tool identifies the
“Agent” as either (a) an MFI’s loan officer (Group model), (b) an MFI’s teller (Branch
models) or (c) a 3rd party agent (Individual model). The bulk of revenues for the Agent are
driven either for loan officers and tellers by the employee pay policy or for 3rd party agents
by the number of accounts they service and the transaction fees paid for cash deposits and
disbursements. Therefore, the Agent makes its RTS related money under the Individual
model by servicing clients (planned rates are 400 clients per agent) and collecting the
incremental transaction fee revenue as well as incremental sales to clients that visit. For loan
officers the main return is an improvement in account management and the quality of their
personal loan portfolio. In all cases, the RTS system is either revenue neutral or profitable
for the agent.
RTS Business Model Analysis Page 21 of 61 © June, 2005. Microdevelopment Finance Team
3.2.4 MFI Income Improvement The Pilot data indicates that the Individual model appears to be the most profitable
model for the MFIs, due to benefits from the lower operating expenses in the RTS 3rd party
agent approach. Another important factor in the MFI profitability structure is whether or
not the RTS improves client retention and reduces the MFIs associated Client replacement
cost. Further benefits come from scaling due to decreasing RTS supply costs – one of the
larger capital cost categories for the MFIs – as greater numbers of equipment and supplies
are ordered, economies will be achievable for MFIs with larger volumes. Finally,
telecommunications costs comprise the major variable expense category for MFIs. Focusing
on ways to reduce these cost areas will improve MFI profitability with the RTS system.
Creative approaches to help the MFI explore rates, establish policies or devise incentives to
help keep these per-transaction costs low are advised.
3.2.5 RTS Entity Income Improvement To assist the MFIs with use of the RTS system and share local support costs, a local
entity we call the RTSE is identified to provide support services such as RTS technical
support, smart card acquisition, and implementation assistance. In Uganda this role is being
filled by BushNet, a local ISP and ASP. As the model tool stands now, it includes monthly
payments by MFIs to the RTSE but does not include a complete cost picture for the RTSE
economics, and therefore cannot determine the RTSE profitability with respect to RTS
activities. Further work on this aspect is required in order to better understand the costs
related to staff and operations. Initial project grants have covered the RTSE/Bushnet
startup costs, along with pilot costs, and Bushnet is now operational as the RTSE providing
infrastructure support for interested MFIs. Although installation volume for the RTS device
RTS Business Model Analysis Page 22 of 61 © June, 2005. Microdevelopment Finance Team
will be low in the initial period, BushNet indicates that the RTS and MFI related revenue
from Bushnet’s primary communications business, along with RTS-related monthly support
payment will cover RTS support costs for the near term. This payment is included in the
tables later in this paper and in the model tool for MFI costs. Bushnet is also actively
investigating the value of the RTS for other verticals, such as health care delivery, supply
chain, and agriculture. This additional business volume would help assure a profitable
economic model for the RTS at BushNet.
3.3. The MFI Client
The MFI Client refers to the entity that would be receiving services from the MFI
and conducting financial transactions via the RTS and the Agent. The client would either be
an individual borrower (who may be a member of a loan group) or the group representative
of a classic loan group. Classified generally as a micro-entrepreneur, the MFI Client interacts
with the RTS device via the agent or bank branch facility. Under the current framework, the
sources of value for MFI clients differ considerably depending on whether they are existing
clients or new clients and whether they are individual borrowers or group borrowers. Given
this, there are two client subsets represented: one with new clients (considered those clients
whose experience with the MFI has always been RTS enabled) which emphasizes the
increased revenue that access to the RTS provides (resulting from their now having access to
loans and savings) and the existing clients, who gain value primarily from reduced costs and
time saved from using RTS when compared to their non-RTS experience. It is important to
maintain distinct client subsets so that the value to each does not become blurred and so that
MFIs can recognize the distinctions when planning changes to the fee structure and service
terms for each type of client.
RTS Business Model Analysis Page 23 of 61 © June, 2005. Microdevelopment Finance Team
Pilot results will provide an opportunity to correlate the models current findings with
the expectations from the MFI Client focus group sessions18 conducted in the summer 2003.
These sessions reported enthusiasm and positive value expectations by potential Clients
from using the RTS. Some of the reasons given included reducing risk of assault/theft, time
away from work location and transportation costs. Additionally, the ability to make smaller
more frequent payments to reduce the likelihood of spending the money elsewhere was
mentioned. During the pilot, an attempt was made to verify the structure of a MFI client’s
financial operations (such as number of working hours per day, cost of transportation,
number of accounts held, cost of stolen payments, etc.) in order to correctly capture those
values for the model.
3.4. Financial Results for New and Existing Clients
The tables below summarize the effects of the RTS device on the finances of new
and existing clients. Figures shown in the table are based upon values determined during the
pilot and are shown on a per client annualized basis. Table 2 summarizes the client context
for each of the MFIs with respect to their Loan and Savings experience. Table 3 identifies
the impact of RTS on the existing client situation. Table 4 refers to results for new clients.
To avoid repetition of information, MFI related payments and fees to clients for interest,
loan origination and transaction charges are provided one time in the MFI related tables,
although they may also be discussed in the context of any of the discussion sections.
As the tables show, the Individual model together with the 3rd party agent provides
the most interesting improvements for the client. Further we can infer the same key benefits
could be achieved in the Group model by modifying some operating characteristics. In the
18 Leonard Mutesasira, Koncepts Unlimited: Financial Services Solutions study, “Remote Transaction System: a Client Perspective”, August 29, 2003. RTS Business Model Analysis Page 24 of 61 © June, 2005. Microdevelopment Finance Team

Individual model we see the majority of an existing client’s RTS benefit comes from costs
saved – lower transportation and lost work time opportunity costs plus the reduced time
spent on each transaction, particularly noteworthy in the Individual model. In the current
model for new clients, it is the higher return on assets that is made possible by access to a
loan as well as access to savings interest income, which provides greatest revenue
opportunities. The RTS helps when it extends the MFI footprint allowing more diverse and
competitive services to formerly under served clients. The majority of the client’s
incremental expenses come from transaction fees charged by the agent and perhaps for
commissions (MFIs are currently not interested in paying commissions for existing loan
transactions, however for new loan business this could become viable).
The analysis indicates that RTS agent servicing for loans to new clients is a slightly
profitable benefit to clients and the value rests primarily on small differences in fees (no
saved transport costs are perceived for new clients). This makes it critical that fees charged
to clients will support what the market can bear and do not exceed the client’s non-RTS
costs.
A key finding is the very important benefit that both old and new clients will realize
by having the ability to make frequent payments and deposits at a reasonable cost to reduce
“leakage”. Experience and surveys consistently report that women are very likely to have
their earnings taken by family members or spent in unplanned ways. They consistently
report that the ability to make small frequent loan and savings payments on the way home
measurably reduces “leakage” since they do not have cash on their person that can be taken
away when they arrive home.
RTS Business Model Analysis Page 25 of 61 © June, 2005. Microdevelopment Finance Team
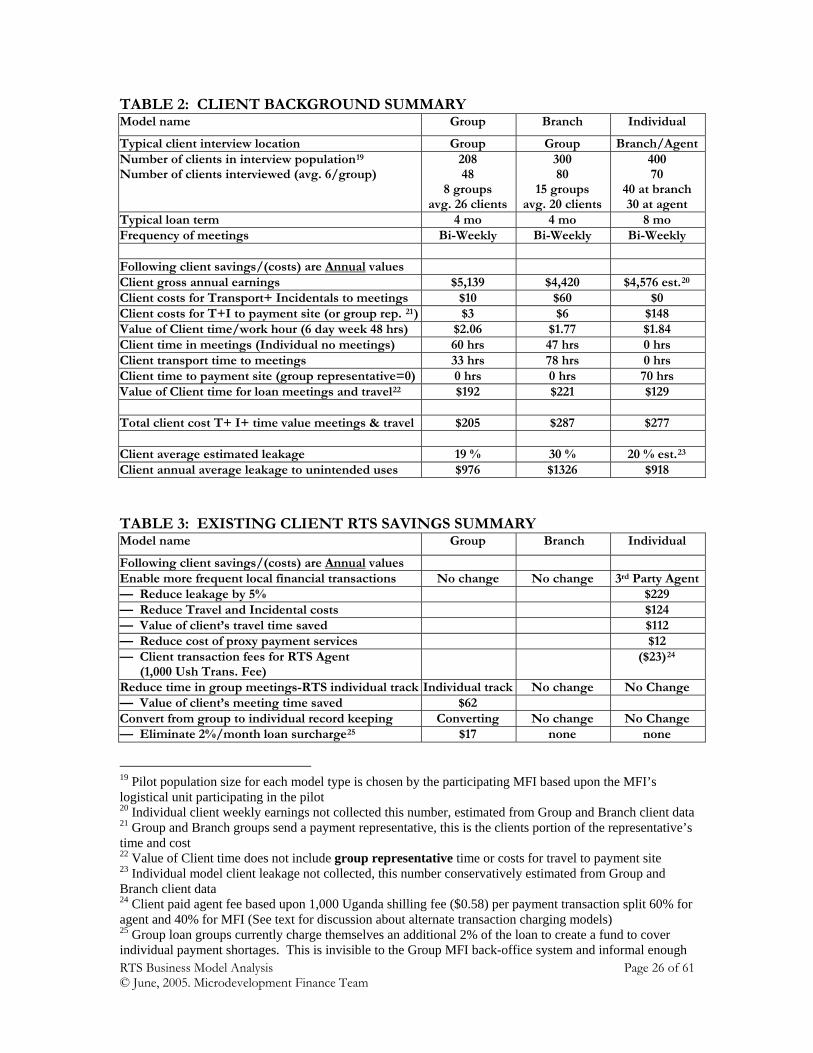
TABLE 2: CLIENT BACKGROUND SUMMARY Model name Group Branch Individual
Typical client interview location Group Group Branch/AgentNumber of clients in interview population19 Number of clients interviewed (avg. 6/group)
208 48
8 groups avg. 26 clients
300 80
15 groups avg. 20 clients
400 70
40 at branch 30 at agent
Typical loan term 4 mo 4 mo 8 mo Frequency of meetings Bi-Weekly Bi-Weekly Bi-Weekly Following client savings/(costs) are Annual values Client gross annual earnings $5,139 $4,420 $4,576 est.20
Client costs for Transport+ Incidentals to meetings $10 $60 $0 Client costs for T+I to payment site (or group rep. 21) $3 $6 $148 Value of Client time/work hour (6 day week 48 hrs) $2.06 $1.77 $1.84 Client time in meetings (Individual no meetings) 60 hrs 47 hrs 0 hrs Client transport time to meetings 33 hrs 78 hrs 0 hrs Client time to payment site (group representative=0) 0 hrs 0 hrs 70 hrs Value of Client time for loan meetings and travel22 $192 $221 $129 Total client cost T+ I+ time value meetings & travel $205 $287 $277 Client average estimated leakage 19 % 30 % 20 % est.23
Client annual average leakage to unintended uses $976 $1326 $918
TABLE 3: EXISTING CLIENT RTS SAVINGS SUMMARY Model name Group Branch Individual
Following client savings/(costs) are Annual values Enable more frequent local financial transactions No change No change 3rd Party Agent— Reduce leakage by 5% $229 — Reduce Travel and Incidental costs $124 — Value of client’s travel time saved $112 — Reduce cost of proxy payment services $12 — Client transaction fees for RTS Agent (1,000 Ush Trans. Fee)
($23)24
Reduce time in group meetings-RTS individual track Individual track No change No Change — Value of client’s meeting time saved $62 Convert from group to individual record keeping Converting No change No Change — Eliminate 2%/month loan surcharge25 $17 none none
19 Pilot population size for each model type is chosen by the participating MFI based upon the MFI’s logistical unit participating in the pilot 20 Individual client weekly earnings not collected this number, estimated from Group and Branch client data 21 Group and Branch groups send a payment representative, this is the clients portion of the representative’s time and cost 22 Value of Client time does not include group representative time or costs for travel to payment site 23 Individual model client leakage not collected, this number conservatively estimated from Group and Branch client data 24 Client paid agent fee based upon 1,000 Uganda shilling fee ($0.58) per payment transaction split 60% for agent and 40% for MFI (See text for discussion about alternate transaction charging models) 25 Group loan groups currently charge themselves an additional 2% of the loan to create a fund to cover individual payment shortages. This is invisible to the Group MFI back-office system and informal enough RTS Business Model Analysis Page 26 of 61 © June, 2005. Microdevelopment Finance Team
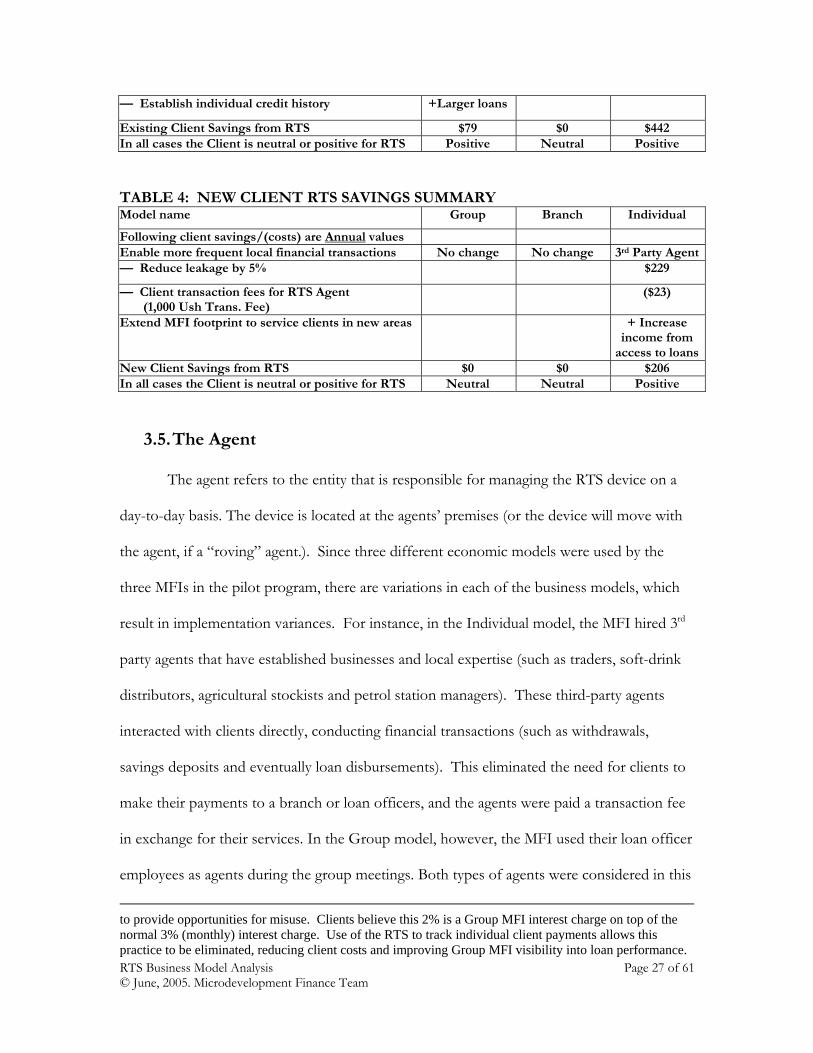
— Establish individual credit history +Larger loans
Existing Client Savings from RTS $79 $0 $442 In all cases the Client is neutral or positive for RTS Positive Neutral Positive
TABLE 4: NEW CLIENT RTS SAVINGS SUMMARY Model name Group Branch Individual
Following client savings/(costs) are Annual values Enable more frequent local financial transactions No change No change 3rd Party Agent— Reduce leakage by 5% $229
— Client transaction fees for RTS Agent (1,000 Ush Trans. Fee)
($23)
Extend MFI footprint to service clients in new areas + Increase income from
access to loansNew Client Savings from RTS $0 $0 $206 In all cases the Client is neutral or positive for RTS Neutral Neutral Positive
3.5. The Agent
The agent refers to the entity that is responsible for managing the RTS device on a
day-to-day basis. The device is located at the agents’ premises (or the device will move with
the agent, if a “roving” agent.). Since three different economic models were used by the
three MFIs in the pilot program, there are variations in each of the business models, which
result in implementation variances. For instance, in the Individual model, the MFI hired 3rd
party agents that have established businesses and local expertise (such as traders, soft-drink
distributors, agricultural stockists and petrol station managers). These third-party agents
interacted with clients directly, conducting financial transactions (such as withdrawals,
savings deposits and eventually loan disbursements). This eliminated the need for clients to
make their payments to a branch or loan officers, and the agents were paid a transaction fee
in exchange for their services. In the Group model, however, the MFI used their loan officer
employees as agents during the group meetings. Both types of agents were considered in this
to provide opportunities for misuse. Clients believe this 2% is a Group MFI interest charge on top of the normal 3% (monthly) interest charge. Use of the RTS to track individual client payments allows this practice to be eliminated, reducing client costs and improving Group MFI visibility into loan performance. RTS Business Model Analysis Page 27 of 61 © June, 2005. Microdevelopment Finance Team
analysis. Differences in the economics behind each agent scenario are represented in the
values used for the agent inputs. For example, MFI employees, such as loan officers or
tellers, who served as agents do not receive a transaction fee.
3.6. Financial Results for Agents
Table 5 provides agent background and Table 6 summarizes the incremental effect
of the RTS device on the agent’s income. For an employed Field Officer agent, the use of
RTS does not change the salary economics. However the improved efficiency of operation
should allow the field officer to meet other sales targets more easily. The pilot data provides
an estimate of the agent’s economics. In the example shown in the table, the 3rd Party agent
receives an extra $2,683 profit each year as a result of his/her participation in the delivery of
RTS services. This is estimated to be an increase in gross margin of 4 to 12 percent for the
agent. Since there is no capital investment required to participate as an RTS 3rd party agent,
only transaction-related variable costs, the RTS agency should be very attractive to
merchants. The majority of the agent’s incremental revenue comes from fees he/she
receives for each transaction. The majority of the agent’s incremental expenses come from
the telecommunications costs that he/she would have to incur in transmitting data back and
forth to the MFI (a small amount of staff time expense is considered as well). There is a
good case for the MFI to change the structure of communications costs used in the pilot and
who pays them in order to negotiate volume discounts for RTS communications activity
(discussed further in the MFI section below).
For certain 3rd party agents that can leverage additional business from visits by RTS
based clients, there is an opportunity for a additional incremental business. Such agents
would have an added incentive to participate in providing RTS services.
RTS Business Model Analysis Page 28 of 61 © June, 2005. Microdevelopment Finance Team

TABLE 5: AGENT BACKGROUND SUMMARY Model name Group Branch Individual
Per Field Officer Load – Avg. Groups / Avg. ClientsPer Agent Load – Avg. Groups / Avg. Clients
23 / 600 banks as agents
18 / 400 no agents
— / 275 — / 400
MFI Load – Total Groups / Total Clients26 621 / 16,000 2,100 / 48,000 — / 36,000 Time spent with Clients and services provided — Loan origination Field Officer
+ Office Staff Field Officer + Office Staff
Field Officer + Office Staff
— Training in group meetings Occasional by Field Officer
Program Plan by Field Officer
No meetings
— Loan servicing in group meetings Tracking Pmts(group manual)
Tracking Pmts (group manual)
No meetings
— Loan servicing at branch locations Only for problem
resolution
Cash services and problem
resolution
Cash services and problem
resolution — Loan servicing at 3rd party banks Cash services Not used Not used — Loan servicing at 3rd party agents Not used Not used Cash services
Transaction fees Bank fees MFI fees MFI fees + Agent fees
Example agent: Petrol station estimated annual gross margin used in Table 6 to compare added value of being MFI cash services agent
$64,240
TABLE 6: AGENT RTS SAVINGS SUMMARY MFI name Group Branch Individual
Enable more frequent local financial transactions At banks At Branch At Branch and 3rd Pty Agent
— Expense Impact on Agent (3rd P. or Field Officer) None None Telecom+labor Per client annual $6.70 Per 400 3rd Pty Agent client base annual $2,670 — Revenue Impact on Agent (3rd P. or Field Officer) + Bank fees None + 3rd Pty Fees Per client annual (600 Ush Trans. Fee) $13.4027
Per 400 3rd Pty Agent client base annual $5,350 — 3rd Party Agent annual gross margin = 4 to 12 % gross margin increase for agent
$2,680
— Other Revenue Impact None None Add’l 3rd Pty goods sold to
client RTS ROI Analysis for 3rd Party Agent — Required volume to achieve breakeven 1 — Operating Revenue $13.40 — Operating Expense $6.70 * — Depreciation Expense (all agent costs variable) $0 — Operating Income (Loss) $6.70
26 Client totals include both group and individual borrowers, in rare cases a client may have both a group and individual loan 27 Client paid agent fee based upon 1,000 Uganda shilling fee ($0.58) per payment transaction split 60% for agent and 40% for MFI (See text for discussion about multiple transaction charging models) RTS Business Model Analysis Page 29 of 61 © June, 2005. Microdevelopment Finance Team
* In the Individual model, for the MFI to avoid risk with the agents, it was required
that the agents deposit funds and maintain a working account balance with the MFI. The
required balance is monitored by the RTS and transactions will fail if an overdraw attempt is
made. This advance payment represents an opportunity cost for the agent as the funds are
tied up until clients transact. The deposit pays bank rate interest, but that may not be
sufficient incentive for the agent to willingly commit the required level of funds. We believe
a better approach will be to reduce the current committed funds and look for more efficient
ways to smoothly interact between the agent’s bank and the MFI’s bank. One approach
suggested is an initial risk management approach that is phased out after perhaps 6 months
as a 3rd party agent.
3.7. The MFI
The MFI refers to the entity that delivers microfinance products and services,
managing the account of MFI Clients, sourcing, training and managing Agent relationships
and interacting with the RTS Entity for the RTS device and associated services.
3.7.1. Financial Results for Micro Finance Institutions
Table 7 provides additional MFI background information for discussion of the
impact of RTS on the different types of operating models being examined in the pilot.
Table 8 shows the capital costs required to deploy each of the models and also the start-up
expenses that typically would be required to enable a new MFI to use the RTS system. For
many MFIs, especially those using the group model, these costs would typically be funded by
a grant for this purpose. Table 9 summarizes the ongoing RTS operating revenue and
expense for participating MFIs. This provides critical planning information for each model
and shows whether the RTS is self funding or when a particular MFI approach needs
RTS Business Model Analysis Page 30 of 61 © June, 2005. Microdevelopment Finance Team
justification and ongoing funding based on other savings or non-monetary operating benefits
like better access to capital or improved loan portfolio performance. Table 10 focuses just
on the Individual model and summarizes three similar scenarios with key variations. The
first column of Table 10 shows the same scenario as the Individual model for Table 9 except
it is scaled up to full deployment. Even when both start-up and depreciation costs are
added, it still generates a positive annual return of $171,000. The second column is the same
as the first except the MFI portion of the transaction fee is cut by 50 percent and results in a
positive annual return modestly above breakeven, a very respectable performance. The third
column is the same as the second column except that the communications expense portion
of the transaction fee (about one third of the agent transaction fee) is moved from the agent
to the MFI and the agent fee portion is correspondingly reduced. This results in the same
gross margin for the agent and allows the MFI to manage the communication costs and any
benefits that can be derived from volume. This also results in a 50/50 split of the
transaction fee of $0.47 (800 Ush).
The following results are specific to the particular deployment approaches used in
the pilots, and demonstrate the breadth of opportunity provided by the RTS in varying
situations. The pilot data collected and specific models used along with other analytic tools
will be provided at www.sevaksolutions.org.
3.7.2. Group Model
In Table 9, the Group model generates an operating savings for the MFI of $1,080
annually from deployment of RTS for all of its Groups and clients when compared with the
cost of manual transcription and entry of individual account payment information. This
demonstrates essentially a breakeven implementation of RTS to accomplish this business
RTS Business Model Analysis Page 31 of 61 © June, 2005. Microdevelopment Finance Team
objective. Note also the Table 8 capital and start-up costs of $181,000 that need to be grant
funded because they are not covered by the expected savings. The key value of this project
is the conversion of this MFI from a purely group lending operation where all of the
financial records are maintained at the lending group level to a more capable hybrid that
maintains the values of group lending along with new data records and performance metrics
at the individual level. Several benefits flow from this important business process change:
i) Rapid visibility into the quality of the lending group, allowing assessment of the
individual performance of each group borrower. This added transparency also
provides the means to improve the MFI’s loan portfolio quality.
ii) With individual accounting it becomes possible for the MFI to deploy additional
services for the individual, while maintaining the value of the lending group. In
particular the MFI can now provide the high value service of accepting loan
payments and savings on a frequent basis in order to reduce leakage. The MFI
can improve the economics of this by employing the transaction fee and various
types of 3rd party agents for efficient and convenient payment processing.
iii) Payments made outside of the group meeting can be brought into the meeting
via RTS receipt or the RTS system “real time” supporting the group model while
gaining the advantage of individual transactions at an economical cost.
iv) A key finding is the importance to clients of the ability to make frequent
convenient transactions at reasonable cost to reduce “leakage”. Further detail is
provided in the Individual model discussion.
RTS Business Model Analysis Page 32 of 61 © June, 2005. Microdevelopment Finance Team
3.7.3. Branch Model
In Table 9, the Branch model was used to support the concept of branch
mobility where a sub-branch is maintained closer to the clients and a teller visits the location
once or twice a week. The value of RTS in this setting is marginal and does not contribute
significantly to the economics of the sub-branches. In this case, the cost of deploying RTS
for the limited volume transaction traffic generated and in the absence of transaction fees
overwhelms the savings from using RTS. The pilot results demonstrate that the RTS is a
small part of the value the sub-branch brings to rural clients. In this case, the RTS does not
provide sufficient direct benefit to the MFI to recommend using the RTS in this approach.
Clearly there are indirect benefits to the rural clients from access to loans, reduced
transportation and lost-time costs, but client savings shared with the MFI (if any) result
primarily from the proximity of the sub-branch and not the use of RTS as part of the model.
When considering the Branch model where the RTS adds expense of $960 per branch each
year plus annual HQ operating expense of $24,600 it is clear that a more expansive use of
the technology would be needed to realize substantial value from the RTS.
3.7.4. Individual Model
In Table 9, the Individual model using 3rd party agents shows that the deployment
of RTS generates actual cash revenue and in the pilot situation would become sustainable
once use reaches about 8% of the available client base - a small deployment of 2,630 clients.
With broader deployment this solution not only sustains itself, but can also begin to pay off
the capital and start-up costs as well. This is possible because the model for this pilot
charges the client a transaction fee for use of the RTS. This is economically viable because
the transaction fee of 800 to 1000 Ush ($0.47 to $0.59) is substantially less than the pilot
RTS Business Model Analysis Page 33 of 61 © June, 2005. Microdevelopment Finance Team

client population’s typical time and travel expense to go to the MFI’s branch for the
transaction.
Four Major Benefits:
Below we discuss multiple benefits of the Individual model coupled with 3rd party
agents. We also remind the reader that many of these benefits can also be associated with
the Group model once that model is enabled with individual record keeping and individual
3rd party agent based transactions.
Reduced Client Time and Travel Expense: Pilot data shows that time away from
work and travel expense to payment location are significant costs to many clients. With a 3rd
party agent close by to receive payments, these client costs are significantly reduced - and
allow payment of a transaction fee while still providing a substantial savings to the client.
Depending on the 3rd party agent’s business, the agent may also gain added sales from the
visit by the client. Unfortunately, the clients’ awareness of this savings only applies to old
clients that were actually incurring the extra time and transport costs.
Reduced “Leakage”: Experience and surveys consistently report that the social
status of women in many countries, as well as the view that everything is “family” property,
makes it very likely that daily earnings needed for pending expenses will instead be taken by
family members and casually spent in unplanned ways. The availability of convenient
transaction locations could allow clients to make small frequent loan and savings payments
on the way home measurably reducing this “leakage”. This is a Key Finding ( a) because
it affects 20 to 30 percent of the income and any improvement of behaviors related to this
money significantly impacts the client’s financial situation, and (b) because this benefit
applies to both old and new client subsets. This opportunity is an order of magnitude
RTS Business Model Analysis Page 34 of 61 © June, 2005. Microdevelopment Finance Team
more valuable than other benefits studied in the pilot and should be an important
consideration as MFIs’ plan product and transaction fee policies.
Reduced Cash Management Risk and Expense: Moving cash carries a high risk of
robbery in most locations where the RTS system is designed to be used. The cost of security
as a preventative measure is expensive. A local 3rd party agent makes frequent small
transactions practical, reducing risk and the cash flows through the merchant’s cash
management system. The RTS’ electronic transactions allow the MFI to receive payment
from the agent’s bank and credit these payments to the proper client account while the risk
and expense of actual cash transportation is eliminated.
Reduced MFI costs for brick-and-mortar branches: The use of 3rd party agents also
reduces the MFI’s expense for “brick and mortar” branch locations as well as the expense of
permanent staff. When branch locations do need to be established, they are for the
convenience of bringing Loan Officers together for periodic loan origination activities and
staff meetings. With no cash on premises, suitable existing locations are easier to locate and
are less expensive.
3.7.5. Implementation Considerations for All Models
Given the Key Finding that frequent convenient small transactions have important
client benefits, the per transaction fee charging approach needs re-examination. A per
transaction fee is a disincentive to customers and is a block against frequent small
transactions “on the way home”. This defeats the ability to reduce leakage.
On this basis we suggest a redesign of the 3rd party agent fee payment approach. We
believe client fees should be monthly, or part of loan origination, and collected by the MFI
as part of loan processing. The use of the 3rd party agent should “feel” to the client like it is
RTS Business Model Analysis Page 35 of 61 © June, 2005. Microdevelopment Finance Team
low cost or free, and of course should not be onerous in actuality. One approach could be
that the client has a generous number of transactions built into their fee. However, if the
client goes “wild” and exceeds these credits, then additional fees are charged. This has
implications for the 3rd party agents since the MFI needs to craft payments to 3rd party agents
that encourage them to seek clients and treat those clients respectfully. We suggest that even
though the client does not pay each time, the agent should still be paid on a per transaction
basis to ensure their respective attention to the client. The transaction fee should be volume
related. In other words, the agent would make a certain fee per transaction for the first 100
transactions per week (or bi-week, we think a month is too long), then a smaller fee for the
next 300 transactions, and a yet smaller fee for the rest of the time period. The MFI should
cover the difference between the fixed client fee and the actual variable transaction fee paid
to the 3rd party agent. Experience will allow the MFI to adjust the average client fee and
agent payments so they tend to be in balance.
It is important to remember that if a client is transacting frequently then she is either
making more loan or other payments. Some of this is likely to be savings, for regulated
MFIs, which is positive for MFI operating costs. Frequent transacting should be positive for
added sales for most 3rd party agents. Before discouraging the clients with a frequent
transaction pattern, investigation is appropriate to determine whether the client is
uncovering a new advantage the MFI could capitalize upon. Additionally, the MFI can still
charge for some “unusual” transactions such as School payments or cash transfers to remote
destinations, which are services that can be built into future versions of the RTS.
Communications costs are the single largest ongoing expense associated with the
RTS. In the pilot, communications costs for airtime and paper supplies for the RTS device
were established as a 3rd party agent expense. In order to implement the fee structure
RTS Business Model Analysis Page 36 of 61 © June, 2005. Microdevelopment Finance Team
changes just discussed above, the communications cost should move to the MFI. By doing
this the 3rd party agent fee can be reduced from 600 Ush to 400 Ush while still providing the
3rd party agent with the same net revenue opportunity and incentive. This change of
responsibility for communications fees now will position the MFI, rather than the 3rd party
agent, to reap the rewards that inevitably will flow as (a) the RTS system efficiency increases
and communications costs are reduced, and (b) a volume reduction in communications fees
is negotiated by the MFI for all their agents. By aggregating the communications costs, the
MFI has the opportunity, perhaps in collaboration with other RTS users, to negotiate lower
communications costs through volume purchasing. This advantage increases as client
transactions increase and the savings can either flow to the bottom line or be returned to the
client as an incentive. Refer to Table 10 for modeling of some of these alternate approaches.
In the case of the Individual model, use of the 3rd party agent provides positive
benefits even with a small deployment for 2,630 clients. For all models, the majority of the
MFIs’ revenue comes from the number of clients in their loan and savings portfolio. This
supports the notion that scale matters and improved outreach at lower cost could be achieved via the RTS
when accompanied by selected business practice changes like 3rd party agents.
The net margin here indicates that profitability is driven by how the model is
implemented – the numbers show considerable difference across the types of
implementation schemes. There are also non-monetary factors (such as planned changes to
MFI business practices), which have not been described in this business model analysis.
RTS Business Model Analysis Page 37 of 61 © June, 2005. Microdevelopment Finance Team
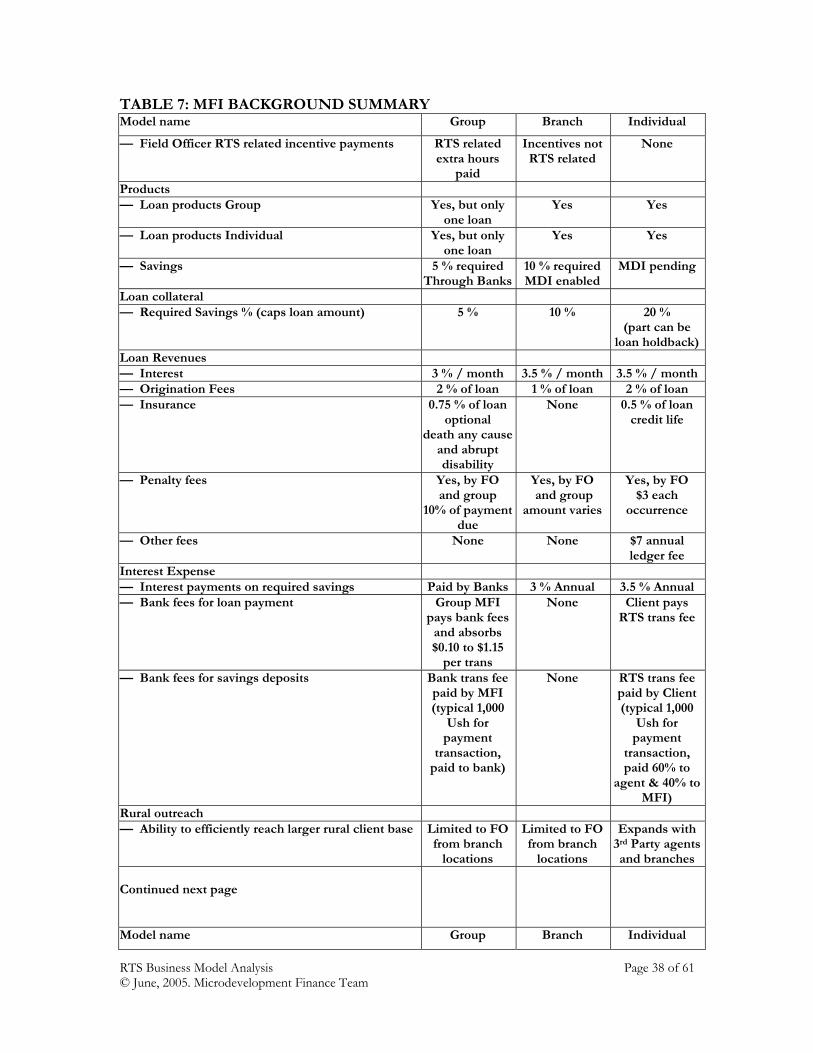
TABLE 7: MFI BACKGROUND SUMMARY Model name Group Branch Individual
— Field Officer RTS related incentive payments RTS related extra hours
paid
Incentives not RTS related
None
Products — Loan products Group Yes, but only
one loan Yes Yes
— Loan products Individual Yes, but only one loan
Yes Yes
— Savings 5 % required Through Banks
10 % required MDI enabled
MDI pending
Loan collateral — Required Savings % (caps loan amount) 5 % 10 % 20 %
(part can be loan holdback)
Loan Revenues — Interest 3 % / month 3.5 % / month 3.5 % / month— Origination Fees 2 % of loan 1 % of loan 2 % of loan — Insurance 0.75 % of loan
optional death any cause
and abrupt disability
None 0.5 % of loan credit life
— Penalty fees Yes, by FO and group
10% of payment due
Yes, by FO and group
amount varies
Yes, by FO $3 each
occurrence
— Other fees None None $7 annual ledger fee
Interest Expense — Interest payments on required savings Paid by Banks 3 % Annual 3.5 % Annual — Bank fees for loan payment Group MFI
pays bank fees and absorbs $0.10 to $1.15
per trans
None Client pays RTS trans fee
— Bank fees for savings deposits Bank trans fee paid by MFI (typical 1,000
Ush for payment
transaction, paid to bank)
None RTS trans fee paid by Client (typical 1,000
Ush for payment
transaction, paid 60% to
agent & 40% to MFI)
Rural outreach — Ability to efficiently reach larger rural client base Limited to FO
from branch locations
Limited to FO from branch
locations
Expands with 3rd Party agents and branches
Continued next page
Model name Group Branch Individual
RTS Business Model Analysis Page 38 of 61 © June, 2005. Microdevelopment Finance Team
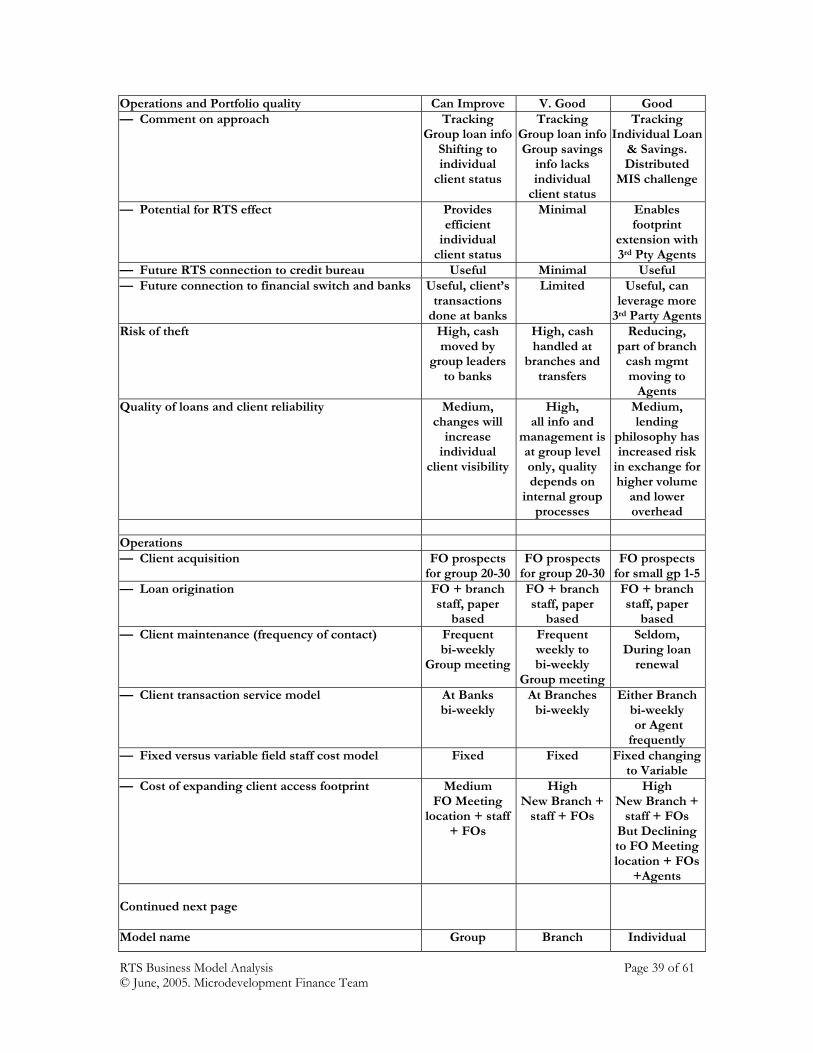
Operations and Portfolio quality Can Improve V. Good Good — Comment on approach Tracking
Group loan infoShifting to individual
client status
Tracking Group loan info Group savings
info lacks individual
client status
Tracking Individual Loan
& Savings. Distributed
MIS challenge
— Potential for RTS effect Provides efficient
individual client status
Minimal Enables footprint
extension with 3rd Pty Agents
— Future RTS connection to credit bureau Useful Minimal Useful — Future connection to financial switch and banks Useful, client’s
transactions done at banks
Limited Useful, can leverage more
3rd Party AgentsRisk of theft High, cash
moved by group leaders
to banks
High, cash handled at
branches and transfers
Reducing, part of branch
cash mgmt moving to
Agents Quality of loans and client reliability Medium,
changes will increase
individual client visibility
High, all info and
management is at group level only, quality depends on
internal group processes
Medium, lending
philosophy has increased risk
in exchange for higher volume
and lower overhead
Operations — Client acquisition FO prospects
for group 20-30FO prospects
for group 20-30 FO prospects
for small gp 1-5— Loan origination FO + branch
staff, paper based
FO + branch staff, paper
based
FO + branch staff, paper
based — Client maintenance (frequency of contact) Frequent
bi-weekly Group meeting
Frequent weekly to bi-weekly
Group meeting
Seldom, During loan
renewal
— Client transaction service model At Banks bi-weekly
At Branches bi-weekly
Either Branchbi-weekly or Agent frequently
— Fixed versus variable field staff cost model Fixed Fixed Fixed changing to Variable
— Cost of expanding client access footprint Medium FO Meeting
location + staff + FOs
High New Branch +
staff + FOs
High New Branch +
staff + FOs But Decliningto FO Meeting location + FOs
+Agents Continued next page
Model name Group Branch Individual
RTS Business Model Analysis Page 39 of 61 © June, 2005. Microdevelopment Finance Team
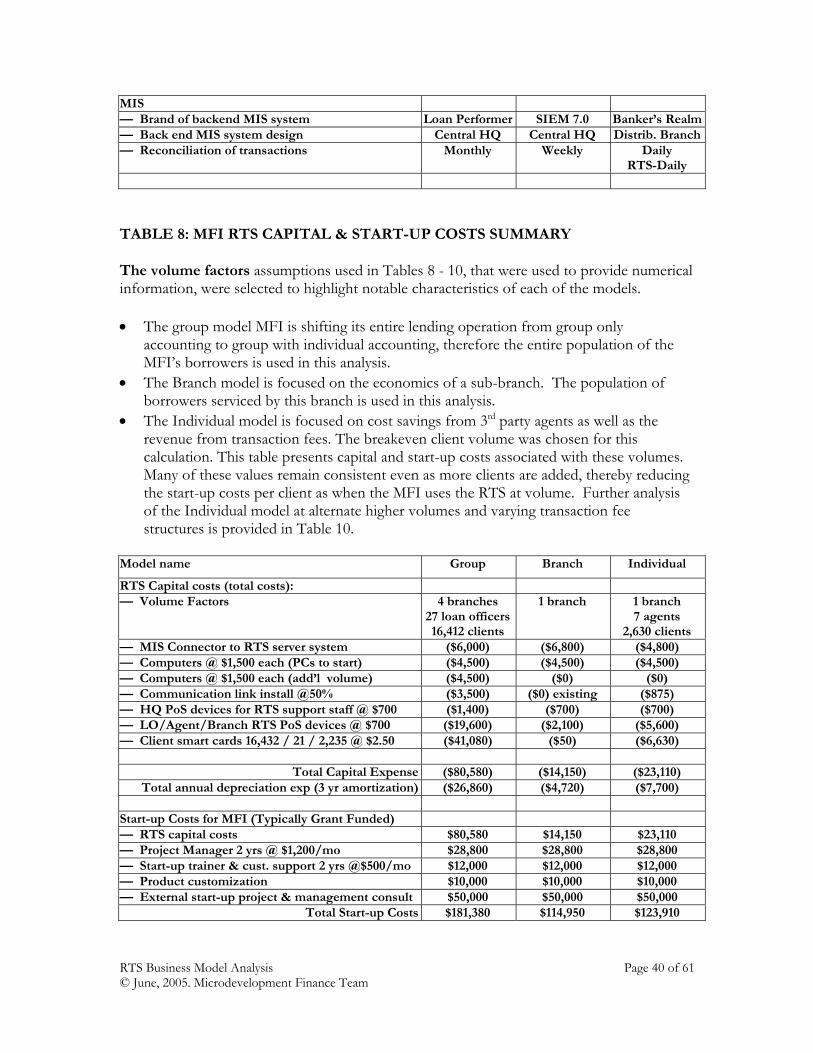
MIS — Brand of backend MIS system Loan Performer SIEM 7.0 Banker’s Realm— Back end MIS system design Central HQ Central HQ Distrib. Branch— Reconciliation of transactions Monthly Weekly Daily
RTS-Daily
TABLE 8: MFI RTS CAPITAL & START-UP COSTS SUMMARY The volume factors assumptions used in Tables 8 - 10, that were used to provide numerical information, were selected to highlight notable characteristics of each of the models. • The group model MFI is shifting its entire lending operation from group only
accounting to group with individual accounting, therefore the entire population of the MFI’s borrowers is used in this analysis.
• The Branch model is focused on the economics of a sub-branch. The population of borrowers serviced by this branch is used in this analysis.
• The Individual model is focused on cost savings from 3rd party agents as well as the revenue from transaction fees. The breakeven client volume was chosen for this calculation. This table presents capital and start-up costs associated with these volumes. Many of these values remain consistent even as more clients are added, thereby reducing the start-up costs per client as when the MFI uses the RTS at volume. Further analysis of the Individual model at alternate higher volumes and varying transaction fee structures is provided in Table 10.
Model name Group Branch Individual
RTS Capital costs (total costs): — Volume Factors 4 branches
27 loan officers16,412 clients
1 branch 1 branch 7 agents
2,630 clients — MIS Connector to RTS server system ($6,000) ($6,800) ($4,800) — Computers @ $1,500 each (PCs to start) ($4,500) ($4,500) ($4,500) — Computers @ $1,500 each (add’l volume) ($4,500) ($0) ($0) — Communication link install @50% ($3,500) ($0) existing ($875) — HQ PoS devices for RTS support staff @ $700 ($1,400) ($700) ($700) — LO/Agent/Branch RTS PoS devices @ $700 ($19,600) ($2,100) ($5,600) — Client smart cards 16,432 / 21 / 2,235 @ $2.50 ($41,080) ($50) ($6,630)
Total Capital Expense ($80,580) ($14,150) ($23,110) Total annual depreciation exp (3 yr amortization) ($26,860) ($4,720) ($7,700)
Start-up Costs for MFI (Typically Grant Funded) — RTS capital costs $80,580 $14,150 $23,110 — Project Manager 2 yrs @ $1,200/mo $28,800 $28,800 $28,800 — Start-up trainer & cust. support 2 yrs @$500/mo $12,000 $12,000 $12,000 — Product customization $10,000 $10,000 $10,000 — External start-up project & management consult $50,000 $50,000 $50,000
Total Start-up Costs $181,380 $114,950 $123,910
RTS Business Model Analysis Page 40 of 61 © June, 2005. Microdevelopment Finance Team
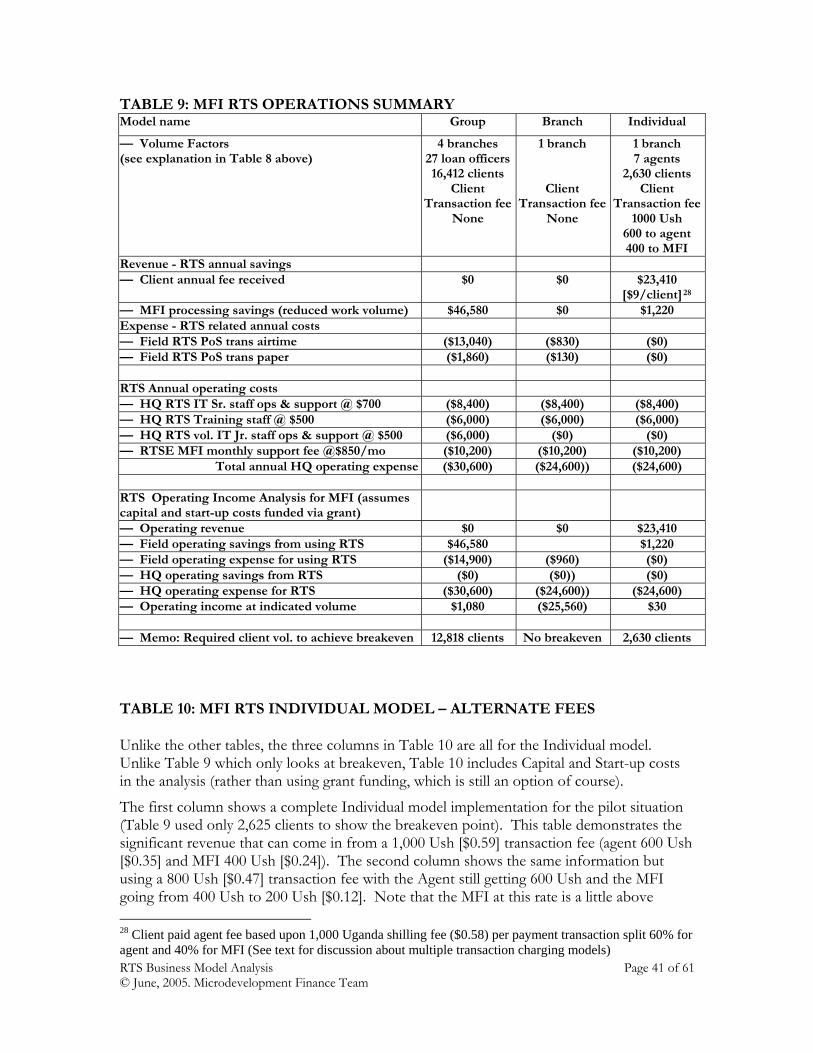
TABLE 9: MFI RTS OPERATIONS SUMMARY Model name Group Branch Individual
— Volume Factors (see explanation in Table 8 above)
4 branches 27 loan officers16,412 clients
Client Transaction fee
None
1 branch
Client Transaction fee
None
1 branch 7 agents
2,630 clients Client
Transaction fee1000 Ush
600 to agent 400 to MFI
Revenue - RTS annual savings — Client annual fee received $0 $0 $23,410
[$9/client]28
— MFI processing savings (reduced work volume) $46,580 $0 $1,220 Expense - RTS related annual costs — Field RTS PoS trans airtime ($13,040) ($830) ($0) — Field RTS PoS trans paper ($1,860) ($130) ($0) RTS Annual operating costs — HQ RTS IT Sr. staff ops & support @ $700 ($8,400) ($8,400) ($8,400) — HQ RTS Training staff @ $500 ($6,000) ($6,000) ($6,000) — HQ RTS vol. IT Jr. staff ops & support @ $500 ($6,000) ($0) ($0) — RTSE MFI monthly support fee @$850/mo ($10,200) ($10,200) ($10,200)
Total annual HQ operating expense ($30,600) ($24,600)) ($24,600) RTS Operating Income Analysis for MFI (assumes capital and start-up costs funded via grant)
— Operating revenue $0 $0 $23,410 — Field operating savings from using RTS $46,580 $1,220 — Field operating expense for using RTS ($14,900) ($960) ($0) — HQ operating savings from RTS ($0) ($0)) ($0) — HQ operating expense for RTS ($30,600) ($24,600)) ($24,600) — Operating income at indicated volume $1,080 ($25,560) $30 — Memo: Required client vol. to achieve breakeven 12,818 clients No breakeven 2,630 clients
TABLE 10: MFI RTS INDIVIDUAL MODEL – ALTERNATE FEES Unlike the other tables, the three columns in Table 10 are all for the Individual model. Unlike Table 9 which only looks at breakeven, Table 10 includes Capital and Start-up costs in the analysis (rather than using grant funding, which is still an option of course).
The first column shows a complete Individual model implementation for the pilot situation (Table 9 used only 2,625 clients to show the breakeven point). This table demonstrates the significant revenue that can come in from a 1,000 Ush [$0.59] transaction fee (agent 600 Ush [$0.35] and MFI 400 Ush [$0.24]). The second column shows the same information but using a 800 Ush [$0.47] transaction fee with the Agent still getting 600 Ush and the MFI going from 400 Ush to 200 Ush [$0.12]. Note that the MFI at this rate is a little above 28 Client paid agent fee based upon 1,000 Uganda shilling fee ($0.58) per payment transaction split 60% for agent and 40% for MFI (See text for discussion about multiple transaction charging models) RTS Business Model Analysis Page 41 of 61 © June, 2005. Microdevelopment Finance Team
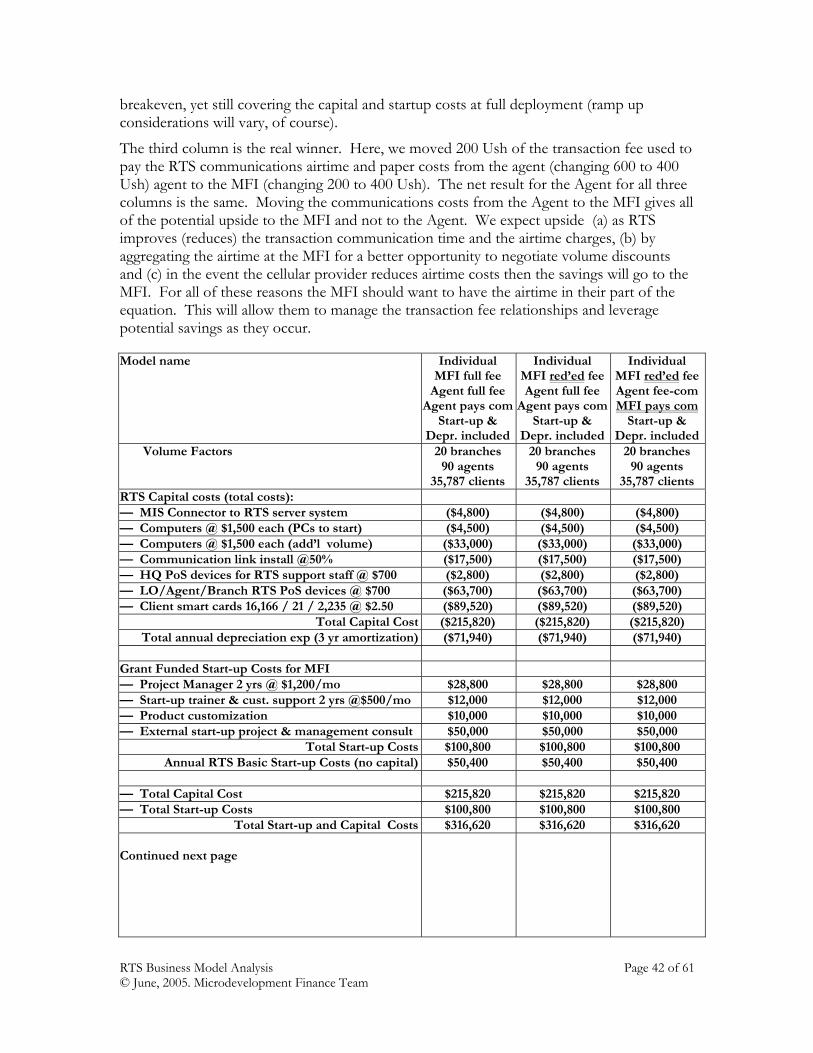
breakeven, yet still covering the capital and startup costs at full deployment (ramp up considerations will vary, of course).
The third column is the real winner. Here, we moved 200 Ush of the transaction fee used to pay the RTS communications airtime and paper costs from the agent (changing 600 to 400 Ush) agent to the MFI (changing 200 to 400 Ush). The net result for the Agent for all three columns is the same. Moving the communications costs from the Agent to the MFI gives all of the potential upside to the MFI and not to the Agent. We expect upside (a) as RTS improves (reduces) the transaction communication time and the airtime charges, (b) by aggregating the airtime at the MFI for a better opportunity to negotiate volume discounts and (c) in the event the cellular provider reduces airtime costs then the savings will go to the MFI. For all of these reasons the MFI should want to have the airtime in their part of the equation. This will allow them to manage the transaction fee relationships and leverage potential savings as they occur.
Model name Individual MFI full fee
Agent full feeAgent pays com
Start-up & Depr. included
Individual MFI red’ed fee Agent full fee
Agent pays com Start-up &
Depr. included
Individual MFI red’ed feeAgent fee-comMFI pays com
Start-up & Depr. included
Volume Factors 20 branches 90 agents
35,787 clients
20 branches 90 agents
35,787 clients
20 branches 90 agents
35,787 clients RTS Capital costs (total costs): — MIS Connector to RTS server system ($4,800) ($4,800) ($4,800) — Computers @ $1,500 each (PCs to start) ($4,500) ($4,500) ($4,500) — Computers @ $1,500 each (add’l volume) ($33,000) ($33,000) ($33,000) — Communication link install @50% ($17,500) ($17,500) ($17,500) — HQ PoS devices for RTS support staff @ $700 ($2,800) ($2,800) ($2,800) — LO/Agent/Branch RTS PoS devices @ $700 ($63,700) ($63,700) ($63,700) — Client smart cards 16,166 / 21 / 2,235 @ $2.50 ($89,520) ($89,520) ($89,520)
Total Capital Cost ($215,820) ($215,820) ($215,820) Total annual depreciation exp (3 yr amortization) ($71,940) ($71,940) ($71,940)
Grant Funded Start-up Costs for MFI — Project Manager 2 yrs @ $1,200/mo $28,800 $28,800 $28,800 — Start-up trainer & cust. support 2 yrs @$500/mo $12,000 $12,000 $12,000 — Product customization $10,000 $10,000 $10,000 — External start-up project & management consult $50,000 $50,000 $50,000
Total Start-up Costs $100,800 $100,800 $100,800 Annual RTS Basic Start-up Costs (no capital) $50,400 $50,400 $50,400
— Total Capital Cost $215,820 $215,820 $215,820 — Total Start-up Costs $100,800 $100,800 $100,800
Total Start-up and Capital Costs $316,620 $316,620 $316,620 Continued next page
RTS Business Model Analysis Page 42 of 61 © June, 2005. Microdevelopment Finance Team
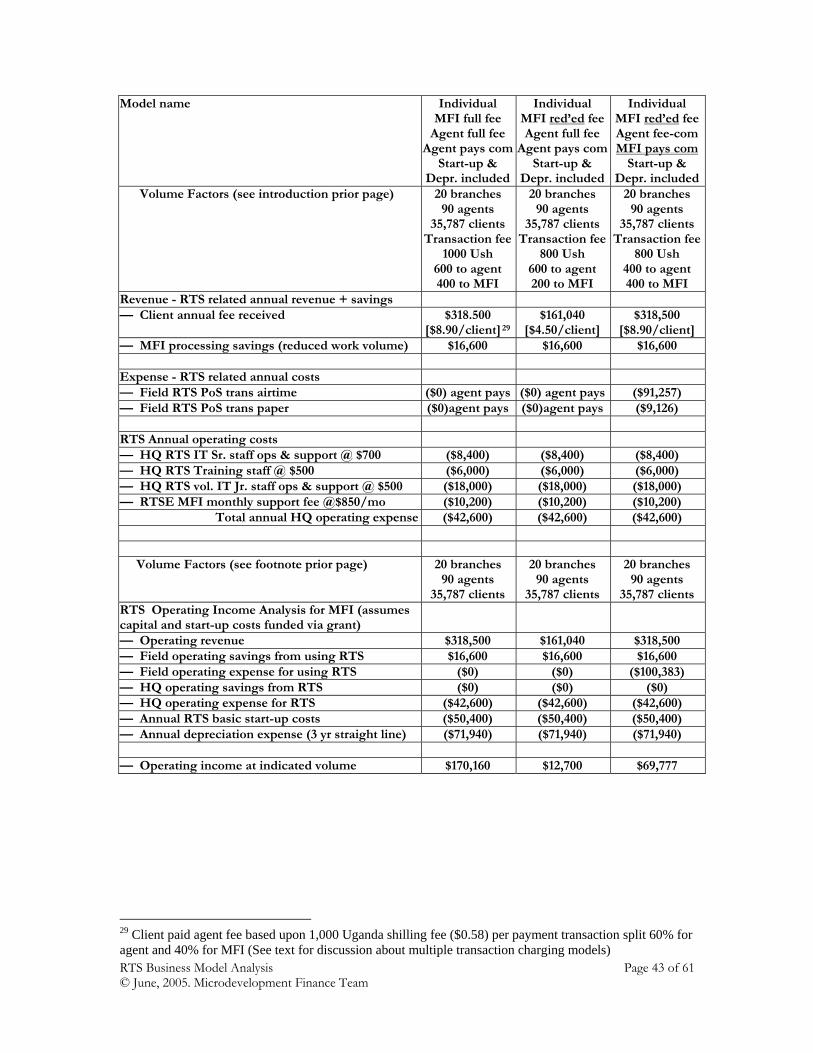
Model name Individual MFI full fee
Agent full feeAgent pays com
Start-up & Depr. included
Individual MFI red’ed fee Agent full fee
Agent pays com Start-up &
Depr. included
Individual MFI red’ed feeAgent fee-comMFI pays com
Start-up & Depr. included
Volume Factors (see introduction prior page) 20 branches 90 agents
35,787 clients Transaction fee
1000 Ush 600 to agent 400 to MFI
20 branches 90 agents
35,787 clients Transaction fee
800 Ush 600 to agent 200 to MFI
20 branches 90 agents
35,787 clients Transaction fee
800 Ush 400 to agent 400 to MFI
Revenue - RTS related annual revenue + savings — Client annual fee received $318.500
[$8.90/client]29$161,040
[$4.50/client] $318,500
[$8.90/client] — MFI processing savings (reduced work volume) $16,600 $16,600 $16,600 Expense - RTS related annual costs — Field RTS PoS trans airtime ($0) agent pays ($0) agent pays ($91,257) — Field RTS PoS trans paper ($0)agent pays ($0)agent pays ($9,126) RTS Annual operating costs — HQ RTS IT Sr. staff ops & support @ $700 ($8,400) ($8,400) ($8,400) — HQ RTS Training staff @ $500 ($6,000) ($6,000) ($6,000) — HQ RTS vol. IT Jr. staff ops & support @ $500 ($18,000) ($18,000) ($18,000) — RTSE MFI monthly support fee @$850/mo ($10,200) ($10,200) ($10,200)
Total annual HQ operating expense ($42,600) ($42,600) ($42,600) Volume Factors (see footnote prior page) 20 branches
90 agents 35,787 clients
20 branches 90 agents
35,787 clients
20 branches 90 agents
35,787 clients RTS Operating Income Analysis for MFI (assumes capital and start-up costs funded via grant)
— Operating revenue $318,500 $161,040 $318,500 — Field operating savings from using RTS $16,600 $16,600 $16,600 — Field operating expense for using RTS ($0) ($0) ($100,383) — HQ operating savings from RTS ($0) ($0) ($0) — HQ operating expense for RTS ($42,600) ($42,600) ($42,600) — Annual RTS basic start-up costs ($50,400) ($50,400) ($50,400) — Annual depreciation expense (3 yr straight line) ($71,940) ($71,940) ($71,940) — Operating income at indicated volume $170,160 $12,700 $69,777
29 Client paid agent fee based upon 1,000 Uganda shilling fee ($0.58) per payment transaction split 60% for agent and 40% for MFI (See text for discussion about multiple transaction charging models) RTS Business Model Analysis Page 43 of 61 © June, 2005. Microdevelopment Finance Team
3.8. Intangible Factors
It is important to recognize that intangible factors may be a prime motivator for
some of the approaches used and these are not explained in the numerical analysis. We are
aware for example from surveys and interviews of a “prestige factor” that clients feel when
they have a RTS “smart card”. This is a symbol of being part of a larger activity, of being
“trusted” by an institution in financial matters. It is a symbol of “technology knowledge”.
For these reasons a client may be favorably inclined toward a MFI offering RTS as part of its
service even though the loan product is otherwise similar to competitors.
MFIs like most businesses have outside expectations to meet from donors,
regulators, competition and clients. We are aware of an example where the MFI needed to
improve loan portfolio management in order to track problem loans on a more timely basis.
This required a change to business processes to accomplish and in this case the RTS was one
of the potential ways to implement the change. When the efficiency of the RTS combined
with the operating cost of the RTS was compared with a manually implemented solution, the
implementation costs were about the same. However by making the effort to upgrade from
a manual approach to the RTS technology, the MFI gains the intangible benefit of an ability
to add future services at little added cost.
In another situation the MFI management was innovating a new product delivery
method and could incorporate the RTS pilot along with the larger project. Since the focus
was on the existing project in progress, we benefited from a pilot opportunity, but the MFIs
ability to adapt its business practices for maximal advantage from RTS was limited. In that
case the intangible factor resulted in only modest benefit from the RTS and a future effort
will be needed to more fully exploit the RTS system.
RTS Business Model Analysis Page 44 of 61 © June, 2005. Microdevelopment Finance Team
While we recognize these additional factors affect specific approaches used, we
believe the financial opportunities we have highlighted resulting from analysis of the results
from these pilots point to real advantages that are available to many potential deployments
of the RTS system. Sevak Solutions (www.sevaksolutions.org), a new non-profit, that holds
the rights to the RTS has been established to provide an Open Source license to the
solution. This is an easy low cost access point for any microfinance institution to the
technology, and to help prospective users identify how the RTS System would be most
usefully deployed in their setting.
3.9. Open Questions
3.10.1 Impact of Savings Mobilization: As the participating MFIs become
designated as MDIs (Microfinance Deposit taking Institutions), the impact of savings
mobilization upon the RTS system should be monitored. It is expected that accepting
deposits via the RTS will improve the profitability of the MFIs and increase the RTS’ overall
value. Indeed, one of the strongest Key Findings from the pilot data was the ability to
reduce leakage and the ability to make savings deposits is a likely enabler of this. This
opportunity is so significant that we believe it warrants its own study and pilot activity to
determine how to convey the importance of this to clients and encourage them to take
advantage of it.
3.10.2 RTS vs. Branch Cost Differences: Since it is still unclear what the
magnitude of the cost difference is for setting up the RTS versus establishing a typical
branch set-up (and maintenance investment costs on both sides), it is important that when
information becomes available, these costs are explicitly captured and the difference is
RTS Business Model Analysis Page 45 of 61 © June, 2005. Microdevelopment Finance Team
monitored. The value of the RTS may depend on its lower costs of set-up, overhead and
general operations versus a typical bank branch. It is important to more fully understand the
magnitude of costs associated with a branch. For example, is cash management and security
a heavier cost burden than the administrative overhead. Depending on relative expense
levels, the RTS may be an advantage but not a “significant” advantage when weighed against
other components of branch operation.
3.10.3 Incremental Increase in Customers: Another important area for future
investigation is the incremental increase in customers that the MFI achieves as a result of the
RTS. Since this depends upon the strategy of each MFI and the RTS business processes
adopted, future research will need to determine which approach yields the greatest increase.
This remains an open question at this time. We have concluded from the pilot results that
this analysis requires longer and higher volume activity in order to create enough data for a
confident analytic result.
3.10. Risk Areas
There are a few areas, which pose potential risks for the success of the RTS pilot
project and the future viability of the RTS.
3.11.1 Lack of Measurement: An area that often poses significant challenge
during a pilot is tracking the pilot’s progress and knowing which variables to measure to
determine whether or not it is successful. By creating the Input Tracking Tool30, the GSB
Team intended to assist the pilot team in identifying key factors for success and has a readily
available and usable tool to update these measures. Only by remaining diligent and
30 This tool will be available on the Sevak Solutions website (www.sevaksolutions.org) RTS Business Model Analysis Page 46 of 61 © June, 2005. Microdevelopment Finance Team
continuing to update the model as more data is obtained will the model serve its purpose
and allow future users to make an informed decision.
As anticipated, one of the most significant challenges has been reliable collection of
data from the field. HQ support personnel have been excellent providers of information
and willing researchers of answers from available information. However the variability of
the field data demonstrates the importance of thorough training and an “on the ground in
the field” person dedicated to managing data collection efforts.
3.11.2 Model Complexity: One of the pitfalls this team has tried to avoid is over-
complicating the model. In order for it to make sense for the field teams, the summary page
of the model was kept as simple and streamlined as possible, avoiding unnecessary
complexity. As the model becomes more sophisticated, special effort will need to be taken
to ensure that it remains usable and understandable, not only for the ones doing the
modeling but also for the people who will be using it (in the field). This remains a challenge
and effort continues to be made in this area.
3.11.3 Mapping Business Processes: As business processes adjusted and evolved
over the course of the pilot, we attempted to mirror those changes in the model. Starting
first with a diagrammatic representation of the change is the most productive approach.
Regardless of method employed, all changes on the ground need to be reflected in the model
in order for it to be of use. The model has been updated to reflect actual circumstances and
data collection. The advantage of multiple concurrent pilots has demonstrated clearly the
different results that come from higher or lower attention to business processes as leverage
factors in the deployment of new technology like the RTS system.
RTS Business Model Analysis Page 47 of 61 © June, 2005. Microdevelopment Finance Team

3.11.4 Allocation of Costs: For the purpose of simplicity, many costs in the model
are attributed to only one entity. As more data is collected from the ongoing rollout of the
RTS, these costs need to be monitored to ensure that they are being captured in the right
proportions and for the right entities, since this can significantly impact each entity’s
profitability. As discussed elsewhere in the paper, we did identify important areas of
business practice where the RTS system as implemented and deployed is not optimal for the
situation. In particular we are referring to the advanced deposit required of 3rd party agents
used by the MFI to manage risk of payment default. It is evident that this ties up too much
of the agents capital and requires frequent attention by the agent which is detrimental to
there regular business activities. In addition the transaction fee model for 3rd party agents
can be improved as previously discussed.
RTS Business Model Analysis Page 48 of 61 © June, 2005. Microdevelopment Finance Team

4. Appendix A: Input Data Collection Tools This information is available on the Sevak Solutions web site at www.sevaksolutions.org
RTS Business Model Analysis Page 49 of 61 © June, 2005. Microdevelopment Finance Team
5. Appendix B: Details of Economic Models The model tool uses a number of elements to model the economic relationships in the RTS “ecosystem”. The model tools, field data and related information are provided in the Uganda pilot portion of the Sevak Solutions web site. The elements that the Stanford team designed into the analysis tools are described in this appendix. Actual pilot data collection subsequently affected the ability to utilize all of the design elements and adjustments were made accordingly during analysis and these considerations are reflected in the discussion. Economics of the MFI Client Sources of Incremental Revenue (or cost savings) - New Clients Incremental revenue for new clients as a result of the RTS device is grouped into two major categories, although there may be additional sources that were not identified during the pilot:
Return on Assets This refers to the productivity of assets used by the client. Given a set of assets, how well is the client able to generate a positive return? That level of productive use is the return on assets. Due to the limited number of revenue sources relating to microfinance services, the sales made using existing assets is an important variable for understanding overall client profitability. In the model, a percentage of the amount disbursed to clients is invested in working capital – what is used up in the production process. What is left over is an invested asset that can be used again for future production. This remainder affects the client’s return on assets, the higher the number, the greater the return. In the pilot situation it was not possible to collect reliable information for calculating the Return on Assets. This is caused by the casual and informal client information where there are usually no periodic written records to refer to. In addition, the access of the RTS staff to clients is limited to interviews of a varying subset of clients in each meeting of the lending groups (typically 6 out of 20). The results of this data item are summarized outside of the model in subjective section of the report. Savings Interest Revenue Another source of revenue for clients is savings revenue, calculated as the interest earned on funds deposited into monthly interest-earning savings accounts. This figure will be a small source of incremental revenue and will change depending up on the interest rate yield and the number and size of accounts held.
Sources of Incremental Expenses – New Clients Incremental expenses for new clients are grouped into seven major categories:
Transportation Expense Although new clients will not recognize the cost savings for most of their expenses since they will have no basis for comparing the cost differential, they will enjoy a lower cost
RTS Business Model Analysis Page 50 of 61 © June, 2005. Microdevelopment Finance Team
structure on nearly all sources of expenses. Transportation expense is one instance where few trips to a bank branch will ever be required and the client’s overall profitability is higher due to these lower expenses. Opportunity Cost of Time Again, new clients will be interacting with a system that is presumably much faster and more efficient. Therefore, their opportunity cost of conducting each transaction, from meeting times to wait times, will also be lower. Cost of Leakage This is perhaps the greatest value of the RTS for new clients, outside of just getting access to a loan. In Pilot interviews leakage was frequently identified by clients at levels from 20 to 30 percent of earnings and sometimes more. With a savings account that enables them to make frequent, small deposits into a trusted savings account, clients will be able to eliminate a portion of the losses they incur on a daily basis when most of their earnings are taken by various members of their family (and social network). Since Ugandan custom is to give much of what you have to your loved ones, cash in hand is viewed by some as “disposable income” when in reality, much of that cash is already earmarked for loan payments, working capital expenses, upcoming family or business-related expenses (such as school fees or special events) and needed business investments. Reducing leakage via increased access to savings instruments is of paramount importance to clients, new and old. Cost of Proxy Payments Before the pilot it was felt that new clients will not yield much benefit on this variable since they would not be sending proxies to make their loan payments (since we assume that they do not have loans yet). An interesting finding was that even with use of the RTS, there is still a level of proxy payment use. Therefore the RTS provides actual value in reducing the time and cost for prosy use. This is a more relevant variable for new clients than we initially understood. Cost of Delinquency The pilot assumes that the convenience of the RTS and the improved accuracy of account data will give rise to lower delinquency rates. From collecting payments to reducing wait times and possible theft, delinquency rates caused by various sources will decline in nearly every category. Lower delinquency is beneficial for the client (since it improves the likelihood of their being approved for future loans) as well as the MFI and should be included in information about the benefits of the RTS. For one of the Pilots, the benefits of RTS to the MFI in addressing this area caused the MFI to embark on a business process change to take advantage of the RTS to increase transparency of their loan process and reduce the cost of delinquency.
Cost of Cash Disbursements Any charges for use of the RTS system, whether per transaction or on a commission basis, is an expense that will be incurred by new clients. This is one of the most important factors behind a client’s profitability. How high the payments are (i.e., % of transaction or fixed fees) will not only determine whether the costs can be borne by
RTS Business Model Analysis Page 51 of 61 © June, 2005. Microdevelopment Finance Team
the client (and perceived as reasonable) but also whether or not this system will be adopted by the market. The Pilot has confirmed the critical nature of this element and the importance of how these charges are structured. Cost of Cash Deposits Again, any charges for use of the RTS system, in this case for a savings deposit transaction, are an expense incurred by new clients. This is one of the most important factors behind a client’s profitability. How high the payments are (i.e., % of transaction or fixed fees) determines whether the costs can be borne by the client (and perceived as reasonable) but also whether or not the market will adopt this system. In this case, since savings mobilization is a critical initiative for most MFIs in Uganda, fees for savings deposits that are perceived of as too high (for example, greater than the perceived amount that would have been lost to leakage), will deter savings activity among new clients, since their basis for comparison is a “without charge” option (though not free due to costs of leakage).
Sources of Incremental Revenue (or cost savings) - Existing Clients Incremental revenue for existing clients as a result of the RTS device is grouped into two major categories:
Increase in sales due to time saved Increases in productivity and decreased time spent for each transaction drive the logic behind this factor. Increased sales due to lower opportunity costs are measured by looking at the average sales per hour (during working hours) and multiplying that by the time saved using the RTS. Leakage Reduction Because the decrease in leakage is a negative expense (or conversely, a revenue source), this figure is similar to the leakage factor for new clients, except that it appears as a positive source. In Pilot interviews leakage was frequently identified by clients at levels from 20 to 30 percent of earnings or more. Again, leakage refers to losses incurred by clients when most of their earnings are taken by various members of their family (and others in their social network). Since Ugandan custom is to give much of what you have to family and others in one’s personal network, cash in hand is viewed by some as income that others have rights and make claims to; when in reality, much of that cash is already earmarked for loan payments, working capital expenses, upcoming family or business-related expenses (such as school fees or special events) and needed business investments. Reducing leakage via increased access to savings instruments is of paramount importance to all clients. Reduced cost of Proxy Payments Existing rural clients will yield considerable benefit from this factor since they are often currently sending proxies to make their loan payments for them and there are high risks associated with this practice, from robbery (of or by the proxy), time spent (even family members have a cost since that’s lost labor) and the costs of transportation for the proxy. Given their knowledge of how costly or precarious sending proxies can be, they
RTS Business Model Analysis Page 52 of 61 © June, 2005. Microdevelopment Finance Team
understand what the potential value of the RTS is for their business. The pilot has documented that the use of proxies will continue at perhaps a somewhat lower level. The reduced time and travel distances for the proxy will result in lower costs to the client and reduced risk of loss. Reduced cost of Delinquency The pilot assumes that the convenience of the RTS and the improved accuracy of account data will give rise to lower delinquency rates. From collecting payments to reducing wait times and possible theft, delinquency rates caused by various sources will decline in nearly every category. Lower delinquency is beneficial for existing clients since it improves the likelihood of their being approved for future loans. For one of the Pilots, the benefits of RTS to the MFI in addressing this area caused the MFI to embark on a business process change to take advantage of the RTS to increase transparency of their loan process and reduce the cost of delinquency. Of particular note is the effect on individual payment patterns that had been opaque and are not transparent. This has a very direct effect on the creditworthiness of individuals and when the changes contemplated are in effect will reduce the cost of loans to clients by 2% without changing the economics for the MFI. A remarkable achievement accomplished directly from an RTS enabled process change.
Sources of Incremental Expenses – Existing Clients Incremental expenses for existing clients as a result of the RTS device is grouped into seven major categories:
Cost of Cash Disbursements Any charges for use of the RTS system, whether per transaction or on a commission basis, is an expense that did not otherwise exist for existing clients. This is an important factor behind an existing client’s profitability. How high the payments are (i.e., % of transaction or fixed fees) will not only determine whether the costs can be borne by the client (and perceived as reasonable) but also whether or not this system will be adopted by the market. The Pilot has provided useful information about fees and fee structure that will help address this issue for clients. Cost of Cash Deposits Again, any charges for use of the RTS system, in this case for a savings deposit transaction, are a new expense incurred by existing clients. This is one of the most important factors behind a client’s profitability. How high the payments are (i.e., % of transaction or fixed fees) determines whether the costs can be borne by the client (and perceived as reasonable) but also whether or not the market will adopt this system. In this case, since savings mobilization is a critical initiative for most MFIs in Uganda, fees for savings deposits that are perceived of as too high (such as greater than the incremental amount that is no longer lost to leakage), may deter savings activity via the RTS among existing clients, since their basis for comparison is a “without charge” savings option (though it includes costs associated with the previous practices, including leakage).
RTS Business Model Analysis Page 53 of 61 © June, 2005. Microdevelopment Finance Team
Economics of the Agent Sources of Incremental Revenue Incremental revenue for the agent as a result of the RTS device is grouped into 3 major categories:
Transaction Revenue This refers to all revenue collected by the agent on a per-transaction basis. Such revenue comes from transaction fees (of a fixed dollar amount) that are paid to the agent irrespective of the size of the transaction. It is also irrelevant whether the MFI or the customer is paying the transaction fee. All that matters is that the agent collects certain fees for each transaction it processes. The model currently assumes a flat fee per transaction. However, it can be refined to include separate fees for cash disbursements versus deposits. As a result of feedback from the Pilot a new variation on transaction revenue is being examined. Feedback has made it clear that to keep Agents interested in performing this service for the Clients and MFIs that a meaningful level of revenue must be generated by the Agent’s RTS service. In the Pilot, petrol stations were used as the initial Agent location. The positive aspect is the service is available for long periods each day and the petrol station has sufficient cash to handle the RTS transactions without stress. The negative is that many MFI clients do not own vehicles and therefore do not provide incremental sales revenue. Therefore the Agent’s interest in the RTS is more reliant on transaction fees. A new approach for collecting the Client’s transaction fees as a fixed monthly cost added to the loan allows 1) the agent to have a more predictable revenue stream (assuming the Client has an assigned “home” agent) and 2) there is no disincentive for the client to transact because there is not a per transaction charge (for at least some number of transactions). This should increase frequency of use and benefit derived from Client use of the RTS/Agent model. Commission Revenue This refers to all compensation that the agent receives based on the size of the transaction. It is assumed that the agent could collect a certain percentage (fixed or sliding) of the amount of cash disbursed or deposited. The model allows different commission rates to be set for cash disbursements versus cash deposits. For example, if the commission rate were set at 5% for cash deposits and 0% for cash disbursements, the agent would receive $5 for each $100 it receives as a deposit and $0 for each $100 that it disburses. The current Pilot results do not indicate an interest in a commission approach to compensating the Agent, however this remains as one of the potential methods. Indications are that a commission is much more likely when associated with loan origination. In a future version of the RTS where remote loan origination was possible the savings in employee field time could permit some type of commission approach. It
RTS Business Model Analysis Page 54 of 61 © June, 2005. Microdevelopment Finance Team
is important to consider the effect of incentives and regulatory requirements to assure the client’s best interests are ultimately being served. Incremental sales Revenue This refers to incremental sales that the agent makes as a result of the additional customer traffic it receives. The MFI’s customers who come into the store to use the RTS cause this additional traffic. The additional traffic leads to sales of other goods and services (e.g. soap, butter, etc.) that the agent would not have made otherwise. Unfortunately the Pilot agents products are not frequently purchased by the MFI’s Clients. This suggests that part of the Agent choice procedure should be to match Agent business with Client interests to achieve a sustainable long term relationship.
Sources of Incremental Expenses Incremental expenses for the agent caused by the deployment of the RTS device is grouped into 6 major categories in the model:
Telecommunications Costs This refers to all costs incurred for the “airtime” that is used by the RTS device each time a transaction is made, and also for any additional telephone calls the agent has to make as a result of the RTS (e.g. calls to the MFI to report a failure of the RTS device.) The model currently assumes that all transactions are done in a real-time basis. It can be refined to deal with transactions that are done in batches. The Pilot results indicate that as the agents become familiar with the RTS device that the frequency of hardware related problems has quickly diminished to relatively inconsequential numbers. There are essentially no device failures reported in the data collected. Therefore, telecommunication costs will be mostly transaction transmission time and time spent resolving process problems. While the RTS system has been very reliable, the human element has created occasional operational problems and some of these manifest themselves when the Client attempts an Agent transaction. This creates a call for assistance using airtime to resolve the problem. The most common issue is an improperly configured Client card that has been issued with the wrong initialization data. Opportunity Cost of Time Spent on RTSThis measures the costs the agent incurs as a result of time he/she has to take away from “usual” activities in order to serve clients that walk in to use the RTS device. The time spent serving RTS customers is costly to the agent because he/she could have been using that time to sell other goods to other customers. The Pilot results indicate that the Agent transaction time is small. The agents report completing basic transactions in less than 2 minutes including transmission time. It is helpful that the Agents chosen for the Pilot have other devices similar to the RTS and are familiar with operating the equipment. Lost Interest on depositsThis variable measures costs the agent incurs as a result of keeping extra cash on hand to honor RTS customers’ cash withdrawals. Prior to having the RTS device, the agent
RTS Business Model Analysis Page 55 of 61 © June, 2005. Microdevelopment Finance Team
would have kept such money in a bank account and would have received interest income from the bank. As such, the interest income that the agent is losing from keeping this extra cash around should be accounted for in the model. An interesting development in the Pilot is what we call the “Dell operating model”. As you are probably aware, the secret of Dell Computer’s business model is that they collect payment for computers ordered before they purchase the parts to build the ordered computer. They have one of the very few business models that by design has a negative cash-conversion cycle31 In the Pilot of one of the MFIs using the 3rd Party Agent model requires the Agent to deposit funds in anticipation of collecting payments from Clients. When sufficient payments have been collected to offset the deposited funds, the deposit is replenished. In the way, the MFI is always cash positive with respect to deposit status and has no risk of an Agent failing to deposit collections.
Cost of incremental goods sold This measures the cost of the additional goods that the agent sells due to the incremental store traffic caused by the RTS device. As mentioned earlier it is important to match the goods offered with the likely purchases of the Clients in order for this dimension of the Agent model to have value. Opportunity Cost of RTS failure This measures the cost incurred by the agent when the RTS device fails (both hardware or software issues.) For every minute that the RTS device is malfunctioning, the agent is losing an opportunity to serve RTS clients (and to receive commission and transaction fees from these clients.) As such, the lost revenue due to RTS failure is captured in the model as a cost for the agent. In the Pilot expedience we have not seen significant issues with the basic hardware or software failing. We do see mistakes made by operators of the system where they miss configure the Client smart-cards causing subsequent failures. During use of the system we have also uncovered additional MFI transaction types not previously disclosed which needed to be accommodated in the software. Both of these types of problems will lessen as the software matures and makes it more difficult for these types of errors to occur. Costs of paper for RTS device This measures the cost incurred by the agent in keeping the RTS device stocked with paper (for printing receipts, etc.). Since the device uses a thermal printing mechanism, it is assumed there are no costs for the toner for the RTS device. In pilot experience we have seen an expendables cost of one roll of paper every two days which represents a supplies cost of $0.50 per day. However, we have had complaints from users in the pilot that the thermal paper used in the current RTS device fades rather quickly and so the transaction record is only semi-permanent. This is an important consideration in this system that needs to be rectified
31 Thomas Meredith - Dell Computer Corp. “PERFORMANCE MEASUREMENT & RISK MANAGEMENT At Dell Computer Corp.,” Stephen Barr, CFO Magazine : September Issue 1998 RTS Business Model Analysis Page 56 of 61 © June, 2005. Microdevelopment Finance Team
before the system is expanded to multi-party transactions where reconciliation issues may depend upon receipts for proof of activity.
Economics of the MFI Sources of Incremental Revenue (or cost savings) Incremental revenue for the MFI as a result of the RTS device is grouped into six major categories, although there may be additional sources that will be identified during the pilot:
Interest Revenue on New Accounts This refers to the incremental increase in loan interest revenue that is directly attributable to the RTS device only (and not the normally expected growth of the client base). This is measured by determining the increased customer acquisition rate, the number of agents (or loan officers) servicing these customers, the average loan disbursement amount for these new clients and the average interest rate charged for new clients. The revenue generated from the loan interest revenue of these incremental clients is the increased interest revenue. • When examining acquisition rate, it must be the incremental increase in acquisition
rate, not the overall rate. • The key drivers for MFI (as well as the client) on the customer acquisition variable
are cost per acquisition and per transaction. • The key driver for agent is also cost per transaction and commission (fees) but on
the revenue side (unlike clients). Transaction Revenues (from Agents) This refers to the percent of the transaction fee that is not retained by the agent and is passed to the MFI (multiplied by the number of agents working with each MFI). In our initial pilot set-up, the MFI is not capturing any of the fees charged by the agent to the client but in subsequent phases, this could be a possible source of revenue for the MFI. • For FINCA, the number # of clients refers to people coming to the store NOT who
they represent (i.e., not the 875 number; this is also the case in the agent model). Transaction revenue changes a lot therefore whether or not it's a "group" client or an individual.
Commission Revenues (from Agents) This refers to the percent of the commission fee that is not retained by the agent and is passed to the MFI (multiplied by the number of agents working with each MFI). In our initial pilot set-up, the MFI is not capturing any of the fees charged by the agent to the client but in subsequent phases, this could be a possible source of revenue for the MFI. Revenues from Increase in Savings Accounts This refers to the incremental increase in savings account revenue that is directly attributable to the RTS device (and not just the normally expected growth of clients with
RTS Business Model Analysis Page 57 of 61 © June, 2005. Microdevelopment Finance Team
savings accounts). This is measured by determining the increased customer acquisition rate, the number of agents (or loan officers) servicing these customers, the average savings account balance for new clients, the percent of new clients that open a savings account and the average margin on a savings account for the MFI. Eventually, we will also want to compare the difference in the cost of capital for the MFI but it is too early in the process to accurately estimate how that would be structured into the model (given the donor-based funding received to date by most MFIs). The margin the MFI enjoys on each savings account is thus a source of revenue. Revenues from Decrease in Delinquency This refers to the assumed decrease in delinquency resulting from the convenience offered by the RTS, the reduced wait time at the branches (and therefore, the improved ability of the MFI to serve clients and lower abandonment), and the improved accuracy of account data. From collecting payments more frequently (in smaller amounts) to reducing wait times, leakage, and possible theft, delinquency rates caused by various sources will decline in nearly every category. Lower delinquency is also beneficial for new and existing clients since it improves the likelihood of being approved for future loans. Revenues from Increase in Client Retention Retention generally refers to several positive effects: reduced customer attrition, improved customer satisfaction (due to the device), increased lifetime value of a customer, decreased in cost per acquisition (no longer investing to obtain the client, merely keep the client), lowered cost per transaction (MFI and Client alike) and increase in interest income earned (for future years). In our model, due to the lack of data available, we focused on the lower cost of acquisition and per transaction. Eventually, these other retention variables will need to better reflect the true value.
Sources of Incremental Expenses Incremental expenses for the MFI are grouped into three major categories:
Payment to Agent from MFI Expense Fixed payments to agents refers to the possibility that the MFI might create an incentive pay structure to agent in addition to commission and transaction fees agents collect, to reduce agent risk and increase adoption/trial of RTS as a business. MFI Fixed RTS Costs This refers to the upfront costs of implementing the RTS and the on-going costs of maintaining it. Included in this cost category are the incremental RTS operating costs (rent, utilities, salaries, capital expenditures, insurance, security, etc.), travel expenses, sales and marketing, training, failure and downtime costs, infrastructure maintenance costs and other related technology expenses. MFI Variable and Stepped Costs This refers to the costs associated with the growth of the RTS and the on-going working capital expenditures and other variable costs. Included in this cost category are the following variable and stepped costs: RTS supply (and material) costs, customer support, training, licensing and other related expenses.
RTS Business Model Analysis Page 58 of 61 © June, 2005. Microdevelopment Finance Team
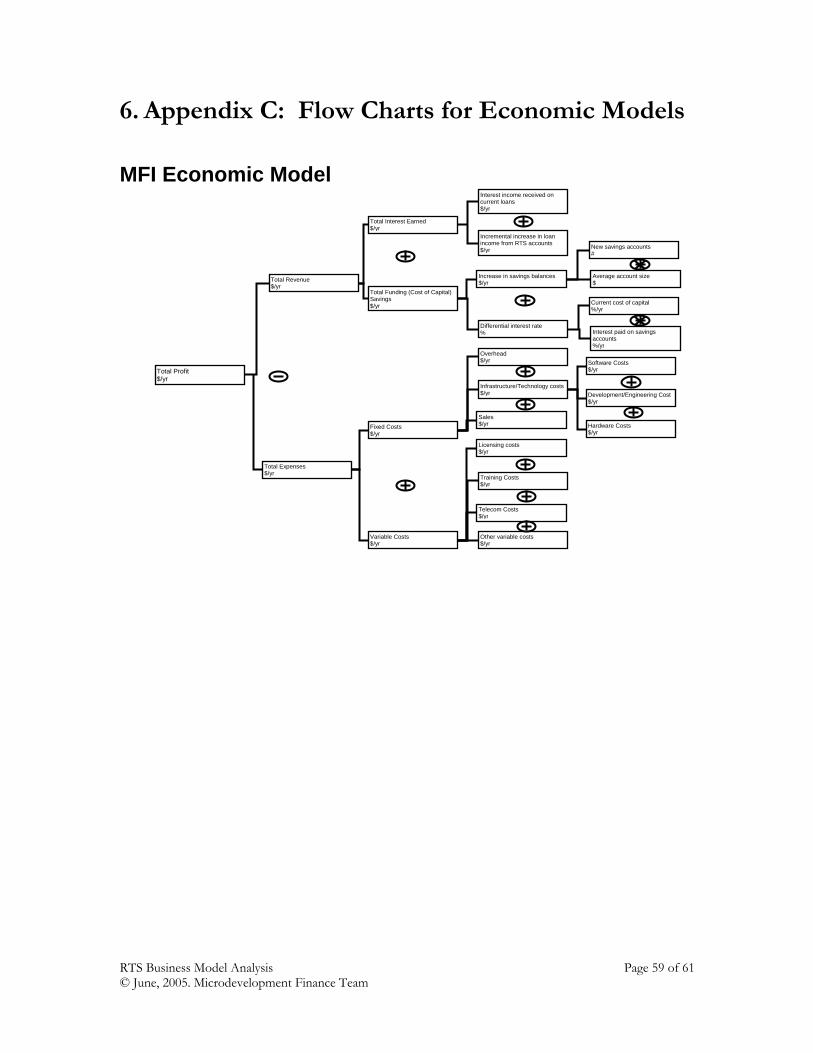
6. Appendix C: Flow Charts for Economic Models
Development/Engineering Cost $/yr
Software Costs $/yr
Average account size $
Telecom Costs $/yr
Infrastructure/Technology costs $/yr
MFI Economic Model Interest income received on current loans $/yr
Incremental increase in loan income from RTS accounts $/yr
Total Interest Earned $/yr
Total Revenue $/yr
Total Profit $/yr
Total Expenses $/yr
Increase in savings balances $/yr
New savings accounts #
Current cost of capital %/yr
Total Funding (Cost of Capital) Savings $/yr
Interest paid on savings accounts %/yr
Differential interest rate %
Fixed Costs $/yr
Variable Costs $/yr
Training Costs $/yr
Sales $/yr
Licensing costs $/yr
Other variable costs $/yr
Overhead $/yr
Hardware Costs $/yr
RTS Business Model Analysis Page 59 of 61 © June, 2005. Microdevelopment Finance Team
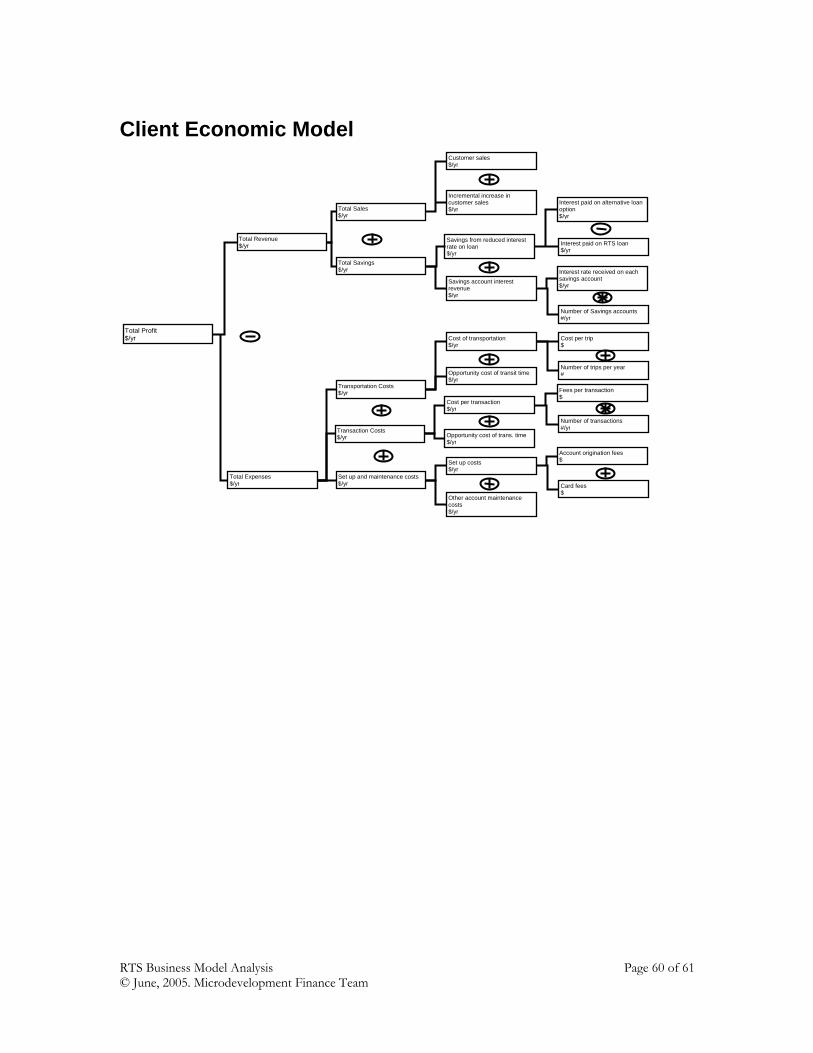
Opportunity cost of transit time $/yr
Client Economic ModelCustomer sales $/yr
Incremental increase in customer sales $/yrTotal Sales
$/yr
Total Revenue $/yr
Total Profit $/yr
Total Expenses $/yr
Savings from reduced interest rate on loan $/yr
Interest paid on alternative loan option $/yr
Interest paid on RTS loan $/yr
Interest rate received on each savings account $/yr
Total Savings $/yr
Number of Savings accounts #/yr
Savings account interest revenue $/yr
Cost of transportation $/yr
Transportation Costs $/yr
Cost per transaction $/yr
Fees per transaction $
Number of transactions #/yr
Account origination fees $
Set up and maintenance costs $/yr Card fees
$
Set up costs $/yr
Transaction Costs $/yr
Cost per trip $
Number of trips per year #
Opportunity cost of trans. time $/yr
Other account maintenance costs $/yr
RTS Business Model Analysis Page 60 of 61 © June, 2005. Microdevelopment Finance Team
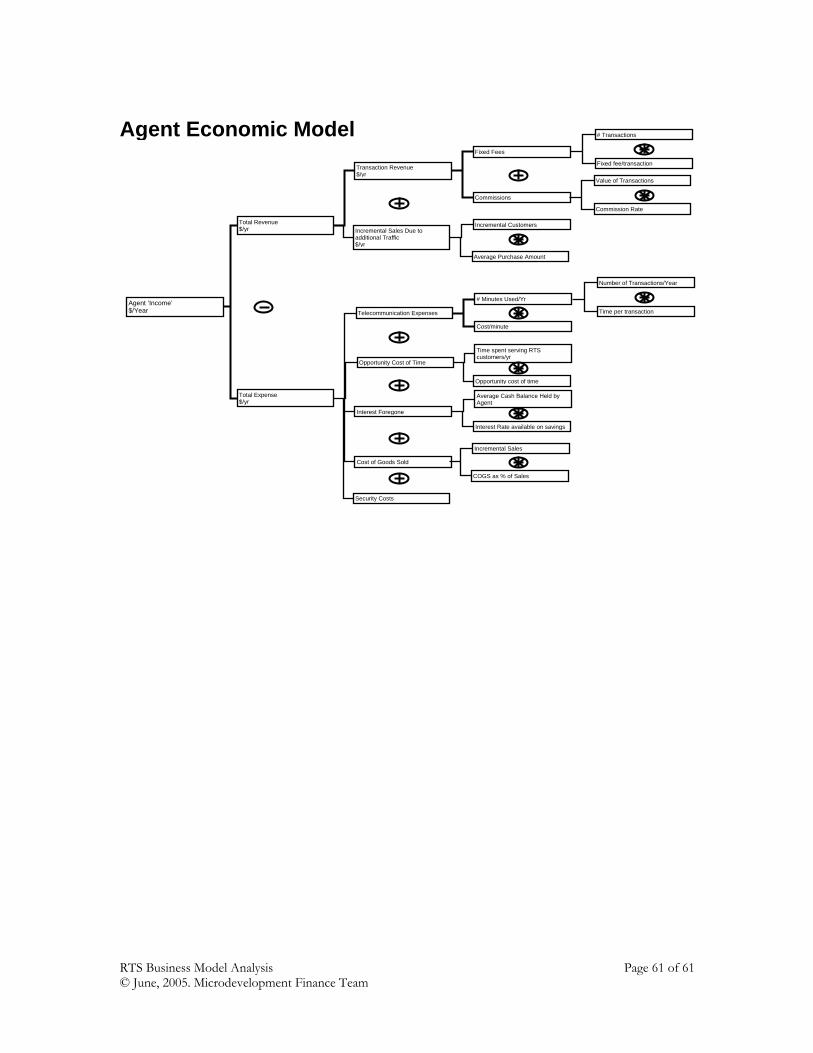
Agent Economic ModelFixed Fees
Commissions
Incremental Customers
Transaction Revenue $/yr
Total Revenue $/yr
Agent ‘Income’ $/Year
Total Expense $/yr
Incremental Sales Due to additional Traffic $/yr
Average Purchase Amount
# Transactions
Fixed fee/transaction
# Minutes Used/Yr
Cost/minute
Time spent serving RTS customers/yr
Average Cash Balance Held by Agent
Telecommunication Expenses
Interest Foregone
Opportunity Cost of Time
Opportunity cost of time
Interest Rate available on savings
Security Costs
Cost of Goods Sold
Value of Transactions
Commission Rate
Number of Transactions/Year
Time per transaction
Incremental Sales
COGS as % of Sales
RTS Business Model Analysis Page 61 of 61 © June, 2005. Microdevelopment Finance Team