rsc advances accepted manuscripteprints.utm.my/id/eprint/54266/1/mohd.azraaikassim... · 2.2...
TRANSCRIPT
Page 1 of 24 RSC Advances
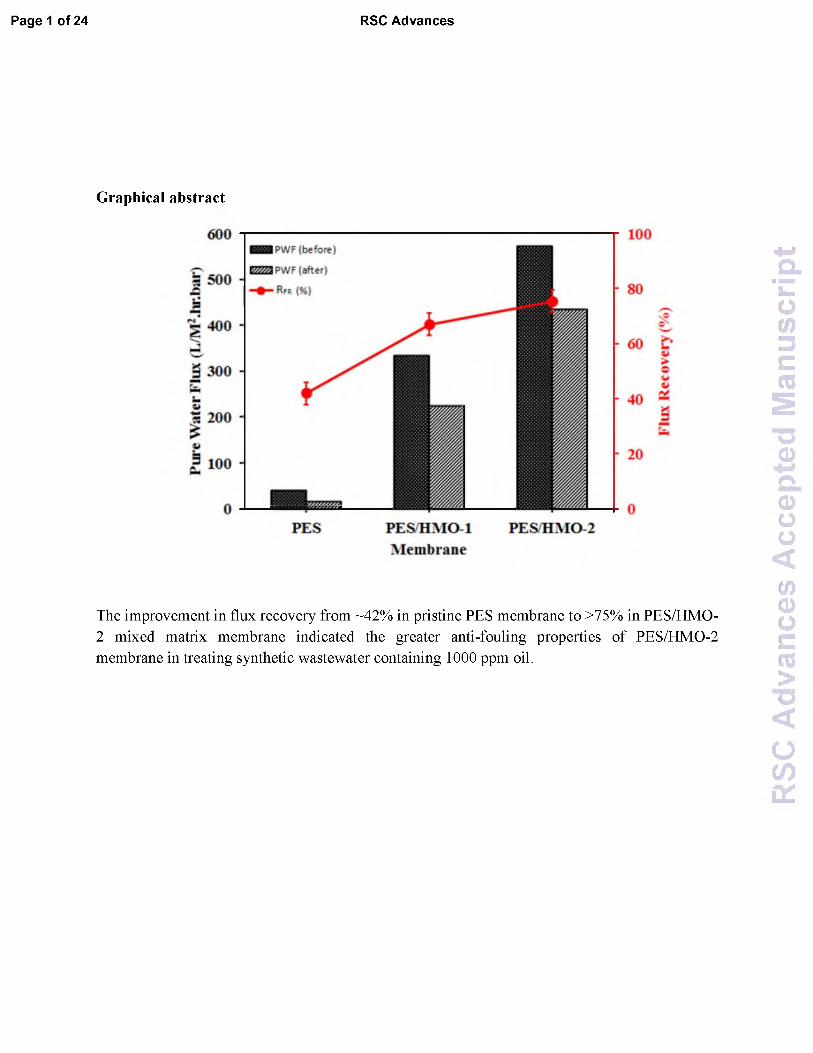
Graphical abstract
The improvement in flux recovery from ~42% in pristine PES membrane to >75% in PES/HMO- 2 mixed matrix membrane indicated the greater anti-fouling properties of PES/HMO-2 membrane in treating synthetic wastewater containing 1000 ppm oil.
RSC
Adva
nces
Ac
cept
ed
Man
uscr
ipt
RSC Advances Page 2 of 24
Novel polyethersulfone (PES)/hydrous manganese dioxide (HMO) mixed
matrix membranes with improved anti-fouling properties for oily wastewater
treatment process
R. Jamshidi Goharia,b, E. Halakooa , W.J. Laua, M.A.Kassima, T. Matsuuraa,c, A.F. Ismaila*
aAdvanced Membrane Technology Research Centre (AMTEC), Universiti Teknologi Malaysia, 81310
Skudai, Johor, Malaysia.
bDepartment of Chemical Engineering, Bardsir Branch, Islamic Azad University, Bardsir, Iran.
cIndustrial Membrane Research Laboratory, Department of Chemical and Biological Engineering,
University of Ottawa, 161 Louis Pasteur St, Ottawa, ON K1N 6N5, Canada.
Corresponding author. E-mail address: [email protected]
Tel.: +60 7 553 5592; fax: +60 7 558 1463.
Abstract
In this work, hydrophilic hydrous manganese dioxide (HMO) nanoparticles were synthesized and
used as the inorganic filler for the preparation of mixed matrix membranes (MMMs). The aim of
adding HMO nanoparticles into polyethersulfone (PES) membrane matrix is to improve
membrane hydrophilicity and anti-fouling resistance against oil deposition and/or adsorption.
The resulting membranes were characterized by SEM, AFM, FTIR, contact angle measurement
and ultrafiltration (UF) of synthetic oily wastewater. Experimental results showed that the
hydrophilicity of the PES/HMO membrane was significantly improved to a low value of contact
angle (16.4o) by HMO loading, which as a consequence led to a promising pure water
permeability (573.2 L/m .h.bar). In comparison, the pristine PES membrane only demonstrated
69.5° and 39 L/m .h.bar, respectively. Furthermore, the PES/HMO membrane exhibited an
excellent oil rejection (almost 100%) and a promising water flux recovery (75.4%) when it was
used to treat synthetic oily solution containing 1000 ppm oil. The promising anti-fouling
properties of PES/HMO membrane could be attributed to the presence of hydrophilic -O H
groups on the membrane surface resulted from HMO addition, making this membrane less
susceptible to fouling when challenged with oil-in-water emulsion.
Keywords: mixed matrix membrane; ultrafiltration; oily wastewater; hydrous manganese
dioxide; hydrophilicity; anti-fouling property
1
RSC
Adva
nces
Ac
cept
ed
Man
uscr
ipt
Page 3 of 24 RSC Advances
2
Highlights
• Properties of PES membrane was remarkably improved upon addition of HMO particles• PES/HMO MMM displayed almost complete rejection of oil molecules• High water recovery of MMM indicated its excellent anti-fouling properties
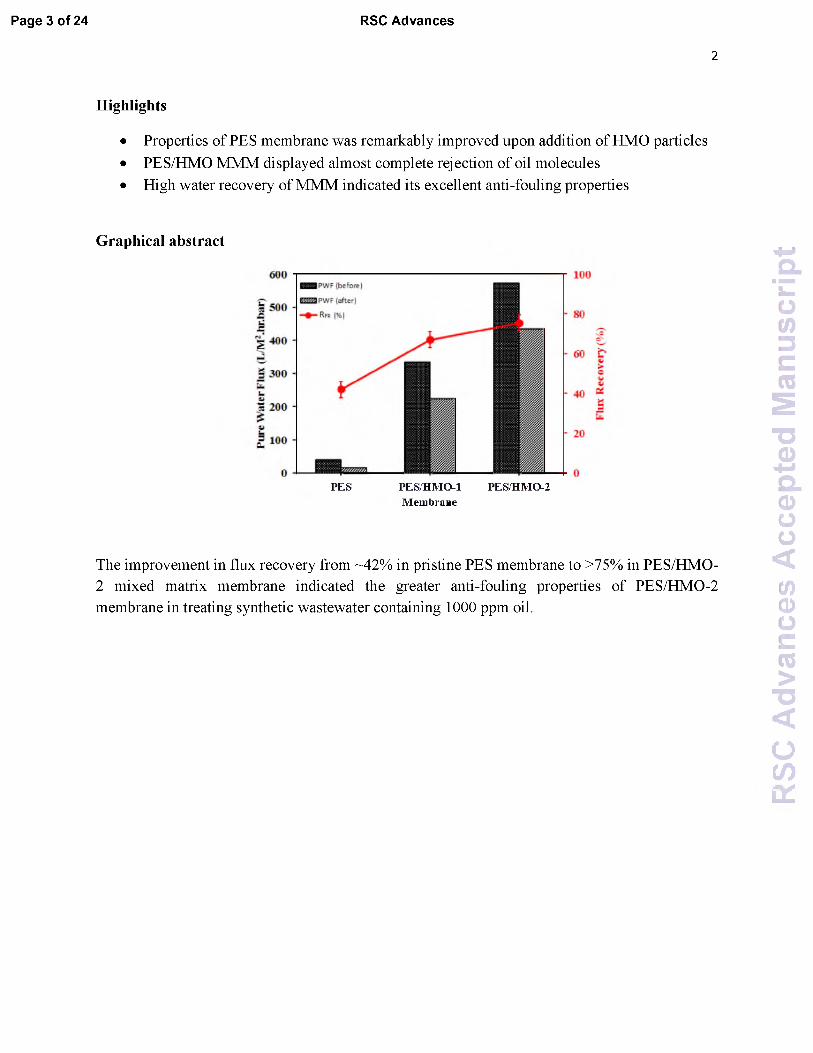
Graphical abstract
PES PES/HMO-1 PES/HMO-2Membrane
The improvement in flux recovery from ~42% in pristine PES membrane to >75% in PES/HMO- 2 mixed matrix membrane indicated the greater anti-fouling properties of PES/HMO-2 membrane in treating synthetic wastewater containing 1000 ppm oil.
RSC
Adva
nces
Ac
cept
ed
Man
uscr
ipt
RSC Advances Page 4 of 24
1. Introduction
Industrially, oil and gas operations are among the sectors that produce the largest amount of
wastewater which contains not only high amount of oil and grease but also other minor toxic
components.1 Because of this, the wastewater must be properly treated before discharging into
any receiving water body in order to protect aquatic life. The presence of oil and grease in
wastewater can be seen in different forms such as free, dispersed or emulsified which. . . 2 3predominantly have differences in size. , In most of the cases, the oil droplets are spread
extremely well in small droplet of less than 10 |im, making the conventional techniques such as
gravity separation, centrifugation and air flotation ineffective in separating them from the2 4 8wastewater. , - Typical oily wastewaters may contain between 50 and 1000 ppm total oil and
grease (TOG), depending on the type of application. The maximum content of TOG in discharge
water however is limited to 5-40 ppm according to regulations, with a typical requirement of 101 215 ppm. , In view of this, the use of ultrafiltration (UF) membrane as treatment technology has
offered a potential alternative solution to tackle the problem owing to its unique advantages such
as excellent separation efficiency, easy operation, low energy and maintenance costs and no
chemical use.9-11 As UF membranes have sub-micron pore size on their surface, they are in
general very effective in separating small oil droplets even at operating pressure of less than 1
bar.2,5,6,12-142 15Chakrabarty et al. , in their two different published works have investigated the
performance of several kinds of polysulfone (PSF) membranes made of different additives in the
treatment of oily wastewater and found that almost all of the membranes tested were able to
reject more than 90% of oil molecules when tested with feed solution of 100 mg/L oil. Lee and
Frankiewicz16 on the other hand used a hydrophilic UF membrane in a cross-flow mode to treat
oily wastewater. By incorporating this UF membrane with hydrocyclone as pretreatment process,
a permeate of high quality was able to produce (with TOC less than 2 mg/L) even though the17feed oil concentration was varied between 100 and 1000 ppm. Wu et al. also reported that a
hydrophilic polyvinyl alcohol (PVA) UF membrane could reject more than 96.5% oil with
permeate flux recorded at 360 L/m .h when tested with 806.75 mg/L oil solution at operating
pressure of 2 bar. Although previous studies have showed that UF membrane has encountered no
major problem in treating oily wastewater, its susceptibility to fouling problem still remains a
main concern to many. The membrane fouling problems resulted from oil adsorption and
3
RSC
Adva
nces
Ac
cept
ed
Man
uscr
ipt

Page 5 of 24 RSC Advances
deposition has negative impacts on water permeability, causing it to deteriorate as a function of2 5 7 1 1 1 8 22time if proper cleaning process is not frequently conducted. , , , , - Although optimizing
filtration conditions could reduce membrane fouling tendency to certain extent, many researchers
believed that improving membrane hydrophilicity itself is the most sustainable solution in• • • • r v 6,9,12,23,24minimizing fouling propensity.
Several studies have reported the use of membranes made of either PSF or polyethersulfone
(PES) or polyvinylidene difluoride (PVDF) polymer for oily wastewater treatment process, but
the hydrophobic nature of these polymers is the main concern that is strongly linked to fouling in
long run.19,25,26 In order to improve the hydrophilicity of these membranes, attempts have been
made to incorporate the membrane with different types of hydrophilic inorganic fillers with the
aims of not only improving membrane hydrophilicity but also its water permeability and anti-• • 6 9 25 27 • • ** • • • •fouling resistance. , , , This kind of membrane comprising both organic and inorganic material
is denoted as a ‘mixed matrix membrane’ (MMM) and is able to demonstrate the positive
features of each material, achieving the synergistic effect for membrane performance
enhancement.
Zhang et al.9 reported that inorganic metal oxide particles are able to increase the membrane
capability and performance during oily wastewater treatment process. Their findings showed that
both hydrophilicity and anti-fouling property of membrane could be enhanced upon addition of
sulfated Y-doped nonstoichiometric zirconia to PSF membrane matrix. The addition of inorganic
nano-sized alumina particles (Al2O3) to PVDF membrane was also evaluated by Li et al.6 They
experienced that the modified PVDF membrane was able to enhance water flux of unmodified
membrane by two orders without compromising its good separation efficiency. The improved
membrane performance might be attributed to the hydrophilic effect of Al2 O3 which could
improve not only membrane permeability but also its antifouling performance. In the study by
Yuliwati et al.10, they embedded hydrophilic titanium dioxide (TiO2) nanoparticles in PVDF
membrane and used the membrane to treat oily wastewater under submerged conditions. As
reported, the membrane surface was altered and was able to demonstrate balance performance of
permeability and selectivity when the membrane was subject to a synthetic oily wastewater.28Ahmad et al. also carried out research work on modification of PSF UF membrane using
inorganic silica (SiO2) nanoparticles. The improved properties of the PSF-SiO2 membrane with
4
RSC
Adva
nces
Ac
cept
ed
Man
uscr
ipt
RSC Advances Page 6 of 24
respect to hydrophilicty and antifouling resistance have been evidenced during filtration process
of oil-in-water emulsion.
Considering the advantages of inorganic particles for membrane performance enhancement,
the aim of this study was to synthesize highly hydrophilic MMMs with improved performance
and fouling resistance by incorporating PES membrane with self-synthesized nanoparticles, i.e.
hydrous manganese dioxide (HMO). The performances of the resulting MMMs were
characterized with respect to water permeability, oil rejection and water flux recovery in addition
to the instrumental characterizations using contact angle goniometer, FTIR, SEM and AFM.
2. Experimental2.1 MaterialsPES (Radel® A300, MW: ~ 15000 g/mol) was purchased from Amoco Chemicals. Manganese
(II) sulfate monohydrate (MnSO4.H2O), potassium permanganate (KMnO4) and sodium
hydroxide (NaOH) supplied by Merck were used to synthesize inorganic hydrophilic HMO
nanoparticles. Polyvinylpyrrolidone (PVP) (MW: 24000g/mol) and N-methyl-2-pyrrolidinone
(NMP) obtained from Merck were used as pore forming agent and solvent, respectively. DI
water was used in all procedures.
2.2 Preparation of HMO nanoparticles
Inorganic HMO nanoparticles were synthesized via oxidation of manganous ions by29permanganate in accordance to the Parida’s method. A solution was first prepared by
dissolving 40 g of KMnO4 in 500 mL DI water (with pH of the solution adjusted to 12.5 using 1
M NaOH solution). Then, the resulting solution was added dropwise to an equal volume of
aqueous solution containing 60 g of MnSO4.H2O under vigorous stirring until the brownish
precipitates appeared. Afterwards, the resulting product, HMO powder, was filtered and washed
several times with DI water. Finally, the synthesized HMO nanoparticles were heated in vacuum
oven at 60oC for 24 h, followed by grinding before storing in a desiccator until use.
2.3 UF membrane preparation
In this study, the PES and PES/HMO UF MMMs were fabricated by immersion precipitation
(i.e. phase inversion) method, and the process was as follows:
5
RSC
Adva
nces
Ac
cept
ed
Man
uscr
ipt
Page 7 of 24 RSC Advances
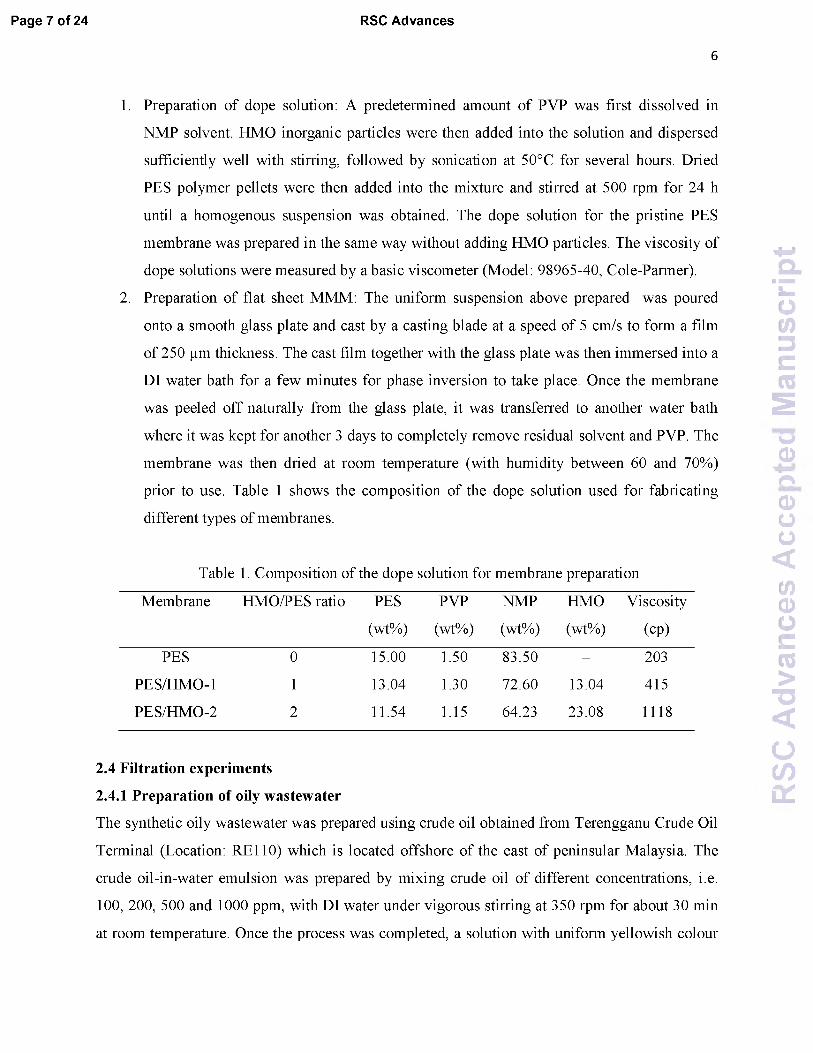
1. Preparation of dope solution: A predetermined amount of PVP was first dissolved in
NMP solvent. HMO inorganic particles were then added into the solution and dispersed
sufficiently well with stirring, followed by sonication at 50°C for several hours. Dried
PES polymer pellets were then added into the mixture and stirred at 500 rpm for 24 h
until a homogenous suspension was obtained. The dope solution for the pristine PES
membrane was prepared in the same way without adding HMO particles. The viscosity of
dope solutions were measured by a basic viscometer (Model: 98965-40, Cole-Parmer).
2. Preparation of flat sheet MMM: The uniform suspension above prepared was poured
onto a smooth glass plate and cast by a casting blade at a speed of 5 cm/s to form a film
of 250 |im thickness. The cast film together with the glass plate was then immersed into a
DI water bath for a few minutes for phase inversion to take place. Once the membrane
was peeled off naturally from the glass plate, it was transferred to another water bath
where it was kept for another 3 days to completely remove residual solvent and PVP. The
membrane was then dried at room temperature (with humidity between 60 and 70%)
prior to use. Table 1 shows the composition of the dope solution used for fabricating
different types of membranes.
6
Table 1. Composition of the dope solution for membrane preparation
Membrane HMO/PES ratio PES
(wt%)
PVP
(wt%)
NMP
(wt%)
HMO
(wt%)
Viscosity
(cp)
PES 0 15.00 1.50 83.50 - 203
PES/HMO-1 1 13.04 1.30 72.60 13.04 415
PES/HMO-2 2 11.54 1.15 64.23 23.08 1118
2.4 Filtration experiments
2.4.1 Preparation of oily wastewater
The synthetic oily wastewater was prepared using crude oil obtained from Terengganu Crude Oil
Terminal (Location: RE110) which is located offshore of the east of peninsular Malaysia. The
crude oil-in-water emulsion was prepared by mixing crude oil of different concentrations, i.e.
100, 200, 500 and 1000 ppm, with DI water under vigorous stirring at 350 rpm for about 30 min
at room temperature. Once the process was completed, a solution with uniform yellowish colour
RSC
Adva
nces
Ac
cept
ed
Man
uscr
ipt
RSC Advances Page 8 of 24
was obtained. Considering coalescence of oil droplets that may occur during a prolonged period
of storage, synthetic wastewater was prepared a day before experiment to keep the feed
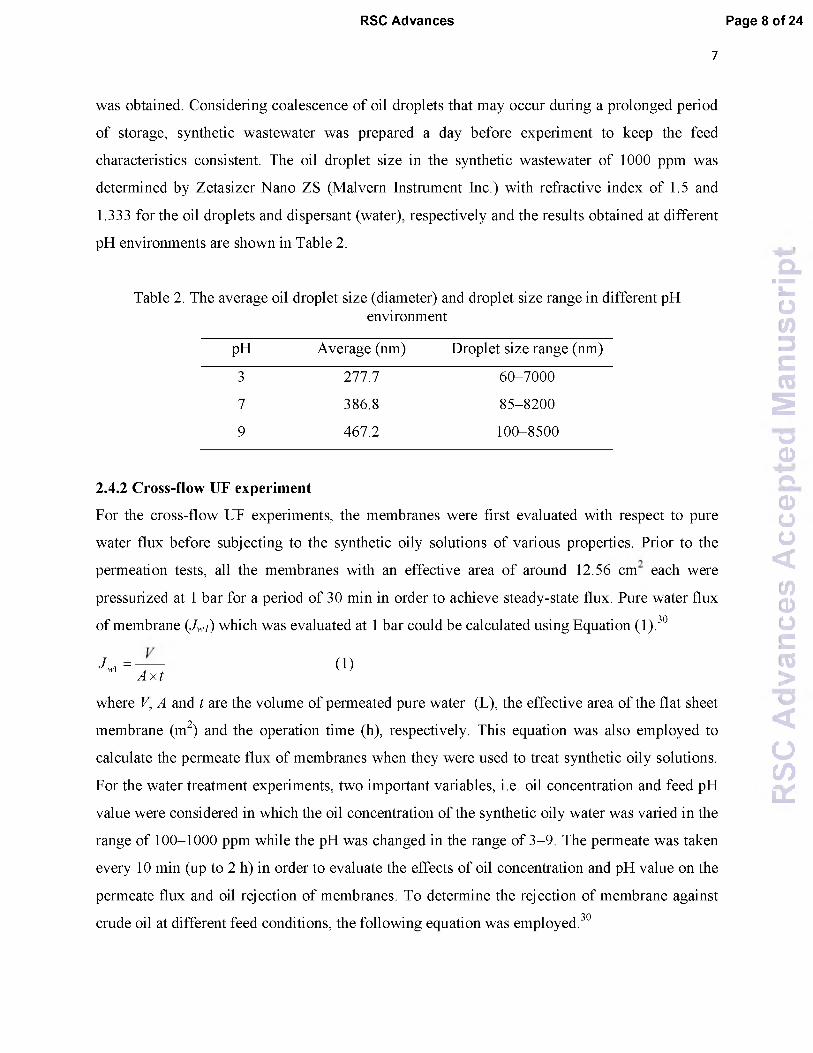
characteristics consistent. The oil droplet size in the synthetic wastewater of 1000 ppm was
determined by Zetasizer Nano ZS (Malvern Instrument Inc.) with refractive index of 1.5 and
1.333 for the oil droplets and dispersant (water), respectively and the results obtained at different
pH environments are shown in Table 2.
Table 2. The average oil droplet size (diameter) and droplet size range in different pHenvironment
pH Average (nm) Droplet size range (nm)
3 277.7 60-7000
7 386.8 85-8200
9 467.2 100-8500
2.4.2 Cross-flow UF experiment
For the cross-flow UF experiments, the membranes were first evaluated with respect to pure
water flux before subjecting to the synthetic oily solutions of various properties. Prior to the
permeation tests, all the membranes with an effective area of around 12.56 cm each were
pressurized at 1 bar for a period of 30 min in order to achieve steady-state flux. Pure water flux30of membrane (Jwl) which was evaluated at 1 bar could be calculated using Equation (1).
J w = 7 T , ( 1 )
where V , A and t are the volume of permeated pure water (L), the effective area of the flat sheet
membrane (m2) and the operation time (h), respectively. This equation was also employed to
calculate the permeate flux of membranes when they were used to treat synthetic oily solutions.
For the water treatment experiments, two important variables, i.e. oil concentration and feed pH
value were considered in which the oil concentration of the synthetic oily water was varied in the
range of 100-1000 ppm while the pH was changed in the range of 3-9. The permeate was taken
every 10 min (up to 2 h) in order to evaluate the effects of oil concentration and pH value on the
permeate flux and oil rejection of membranes. To determine the rejection of membrane against30crude oil at different feed conditions, the following equation was employed.
7
RSC
Adva
nces
Ac
cept
ed
Man
uscr
ipt
Page 9 of 24 RSC Advances
8
CR (% ) = (1 - C ) x100 (2)
C/where Cp and C/ are the concentration of oil in the permeate and the feed (mg/L), respectively.
UV-vis spectrophotometer (Model: DR5000, Hach) was used to determine the oil concentration
of samples at the wavelength of around 305 nm. In order to obtain the flux recovery ratio (Rfr)
of membrane, the feed solution tank was refilled with DI water after 2 h of UF of synthetic oily
solution and the membrane was rinsed by letting the DI water flow thoroughly for 30 min under
the same condition as pure water permeation test. Then, the pure water flux (Jw2) was re-31evaluated to obtain Rfr using Equation (3).
R f r (%) = (JjW1 ) X100 (3)Jw 1
2.5 Membrane characterization
2.5.1 Overall porosity32The membrane porosity (s) was calculated by the following equation.
W -Wd V 100 (4)p x A x L y
where Ww and Wd are the weight of wet and dry membrane (g), respectively; A, the effective area
of the membrane (cm2); p , the density of water; L the wet membrane thickness (cm). A circular
membrane piece was weighed (Wd) after vacuum drying for 24 h at 50°C. Then, the membrane
was immersed in DI water overnight and weighed (Ww) after the surface was blotted with a filter
paper.
2.5.2Transmission electron microscopy
Transmission electron microscope (TEM) (Model: HT 7700, Hitachi) was used to analyze the
morphology and determine particle size of the synthesized HMO nanoparticles. Prior to the
analysis, the fine HMO particles were dispersed in absolute alcohol and were sonicated for 10
min to produce homogenous suspension. A droplet of this suspension was then placed on a
coated grid before drying in vacuum oven at 60 °C for 1 h.
RSC
Adva
nces
Ac
cept
ed
Man
uscr
ipt
RSC Advances Page 10 of 24
2.5.3. Scanning electron microscopy
Scanning electron microscope (SEM) (Model: TM 3000, Hitachi) equipped with energy
dispersive X-ray spectroscope (EDX) (Model: X-flash min SVE, Bruker) was used to monitor
the morphology of the pristine PES membrane and the PES/HMO MMMs. Prior to scanning, the
cross-sectional membrane samples were prepared by freeze-fracturing in liquid nitrogen to
prevent the collapse of the porous structure. The membrane was later sputter-coated with gold to
avoid charging during SEM analysis.
2.5.4 Fourier-transform infrared spectroscopy
ATR-FTIR spectroscope (Model: UATR, Perkin Elmer) was conducted to investigate the
changes of functional groups and elements in the inorganic HMO nanoparticles and PES/HMO
MMMs. The IR spectrum for the nanoparticles was obtained via the KBr pellet technique.
2.5.5 X-Ray diffractometry
X-ray diffraction patterns of the synthesized HMO particles and all fabricated membranes were
recorded by an X-ray diffractometer (Model: D5000, Siemens) equipped with monochromatic
Cu K a radiation at diffraction angle 29 in the range of 10°-90°.
2.5.6 Atomic force microscopy
Surface morphology of fabricated membranes was visualized by atomic force microscope (AFM)
(Model: SPA-300 HV, Seiko). The scan was made over an area of 10 |im x 10 |im to obtain
surface roughness and pore size by tapping mode at room temperature of 25°C. The mean
roughness, Ra, representing the mean value of the surface relative to the center plane for which
the values enclosed by the images above and below this plane are equal was obtained from the
line profiles at different locations chosen arbitrarily for each membrane sample using the AFM33software program. The surface pore size of the membranes was measured by visually
inspecting the line profiles of various pores observed on AFM image at different areas of the
same membrane.34
9
RSC
Adva
nces
Ac
cept
ed
Man
uscr
ipt
Page 11 of 24 RSC Advances
2.5.7 Contact angle measurement
To determine membrane surface hydrophilicity, the water contact angle of the membranes was
measured by sessile drop method using an automated contact angle goniometer (Model: OCA
15plus, DataPhysics). A droplet of DI water with a volume of 0.5 |iL was carefully formed at ten
spots randomly chosen on the membrane surface using a motor-driven microsyringe and the
average value was reported.
3.0 Results and discussion
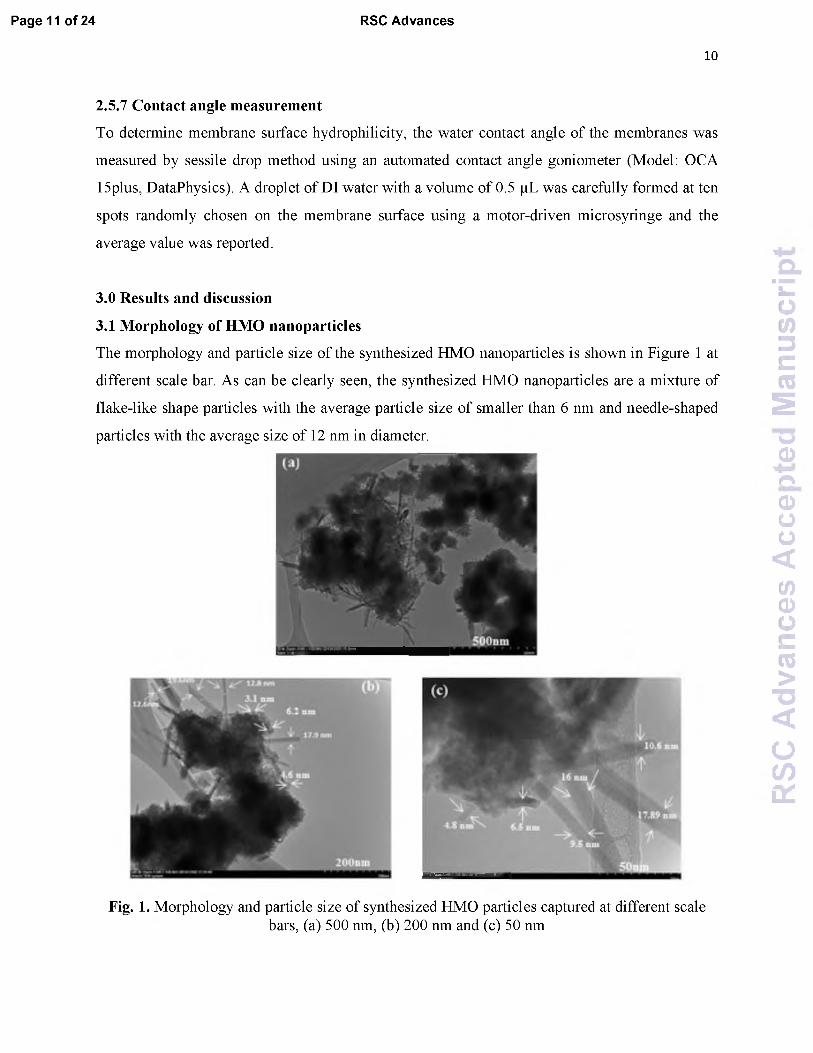
3.1 Morphology of HMO nanoparticles
The morphology and particle size of the synthesized HMO nanoparticles is shown in Figure 1 at
different scale bar. As can be clearly seen, the synthesized HMO nanoparticles are a mixture of
flake-like shape particles with the average particle size of smaller than 6 nm and needle-shaped
particles with the average size of 12 nm in diameter.
10
Fig. 1. Morphology and particle size of synthesized HMO particles captured at different scalebars, (a) 500 nm, (b) 200 nm and (c) 50 nm
RSC
Adva
nces
Ac
cept
ed
Man
uscr
ipt
RSC Advances Page 12 of 24
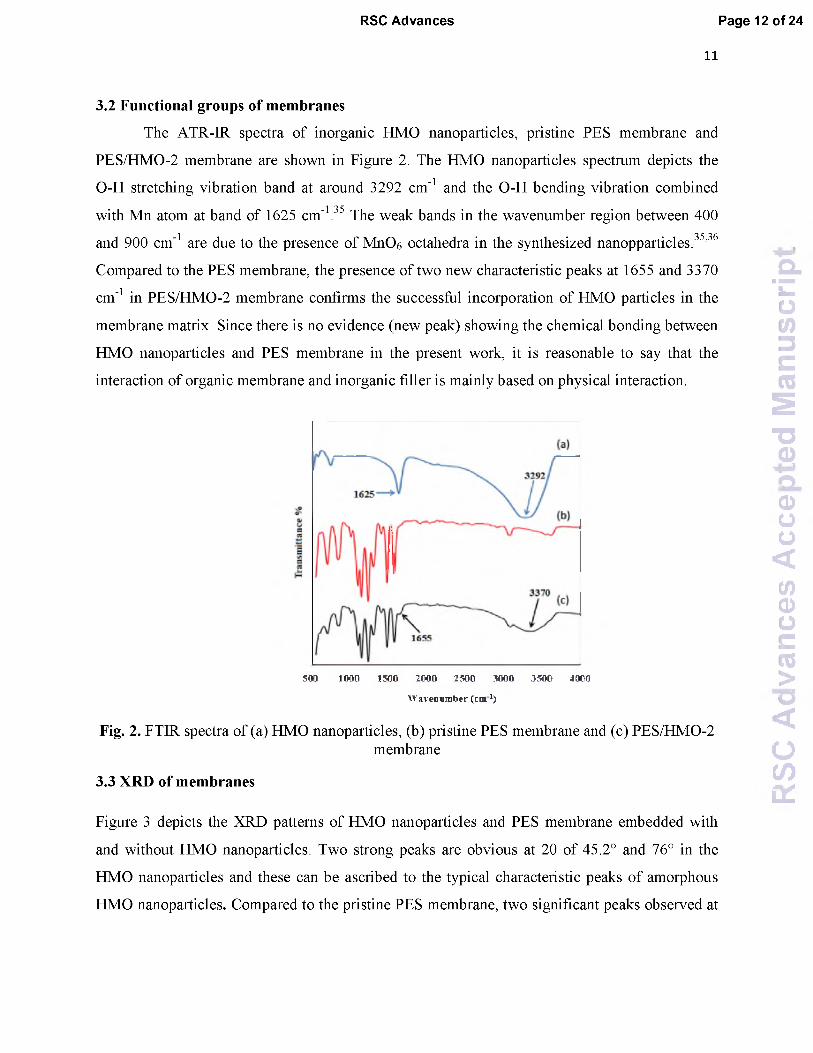
3.2 Functional groups of membranes
The ATR-IR spectra of inorganic HMO nanoparticles, pristine PES membrane and
PES/HMO-2 membrane are shown in Figure 2. The HMO nanoparticles spectrum depicts the
O-H stretching vibration band at around 3292 cm-1 and the O-H bending vibration combined1 35with Mn atom at band of 1625 cm- . The weak bands in the wavenumber region between 400
and 900 cm-1 are due to the presence of MnO6 octahedra in the synthesized nanopparticles.35,36
Compared to the PES membrane, the presence of two new characteristic peaks at 1655 and 3370
cm-1 in PES/HMO-2 membrane confirms the successful incorporation of HMO particles in the
membrane matrix. Since there is no evidence (new peak) showing the chemical bonding between
HMO nanoparticles and PES membrane in the present work, it is reasonable to say that the
interaction of organic membrane and inorganic filler is mainly based on physical interaction.
11
500 1000 1500 2000 2500 3000 3500 4000
W avenum ber (c m 1)
Fig. 2. FTIR spectra of (a) HMO nanoparticles, (b) pristine PES membrane and (c) PES/HMO-2membrane
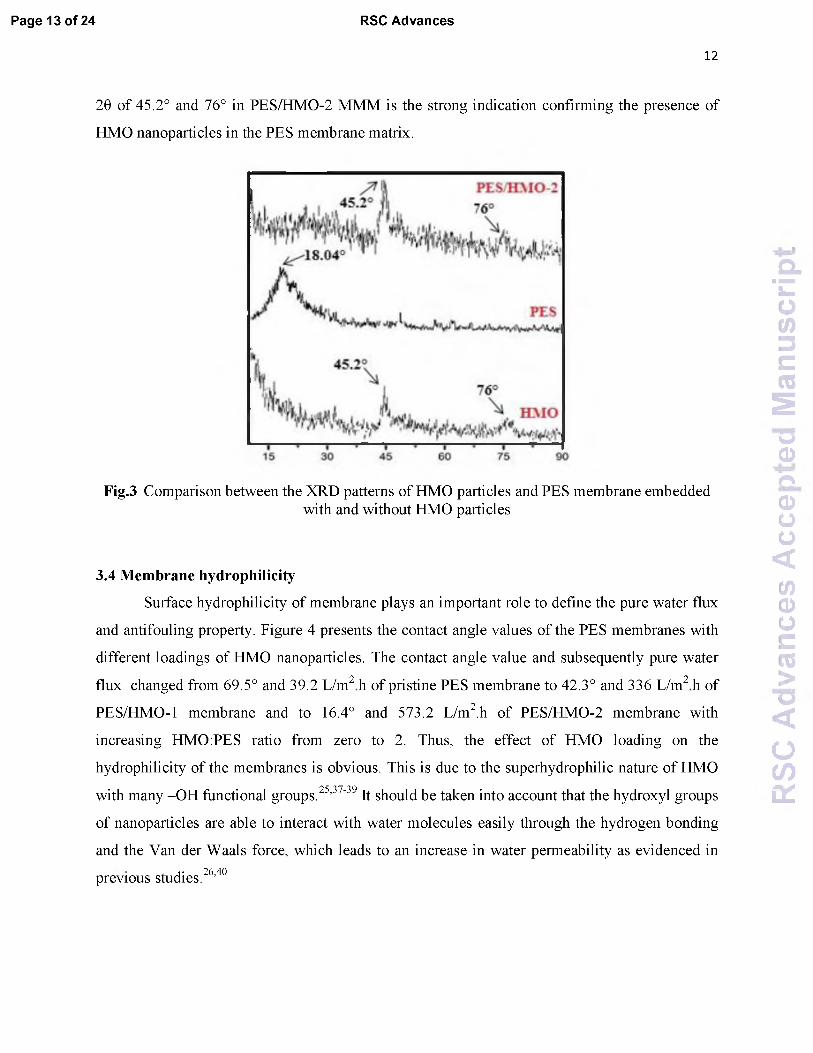
3.3 XRD of membranes
Figure 3 depicts the XRD patterns of HMO nanoparticles and PES membrane embedded with
and without HMO nanoparticles. Two strong peaks are obvious at 29 of 45.2° and 76° in the
HMO nanoparticles and these can be ascribed to the typical characteristic peaks of amorphous
HMO nanoparticles. Compared to the pristine PES membrane, two significant peaks observed at
RSC
Adva
nces
Ac
cept
ed
Man
uscr
ipt
Page 13 of 24 RSC Advances
12
29 of 45.2° and 76° in PES/HMO-2 MMM is the strong indication confirming the presence of
HMO nanoparticles in the PES membrane matrix.
Fig.3 Comparison between the XRD patterns of HMO particles and PES membrane embeddedwith and without HMO particles
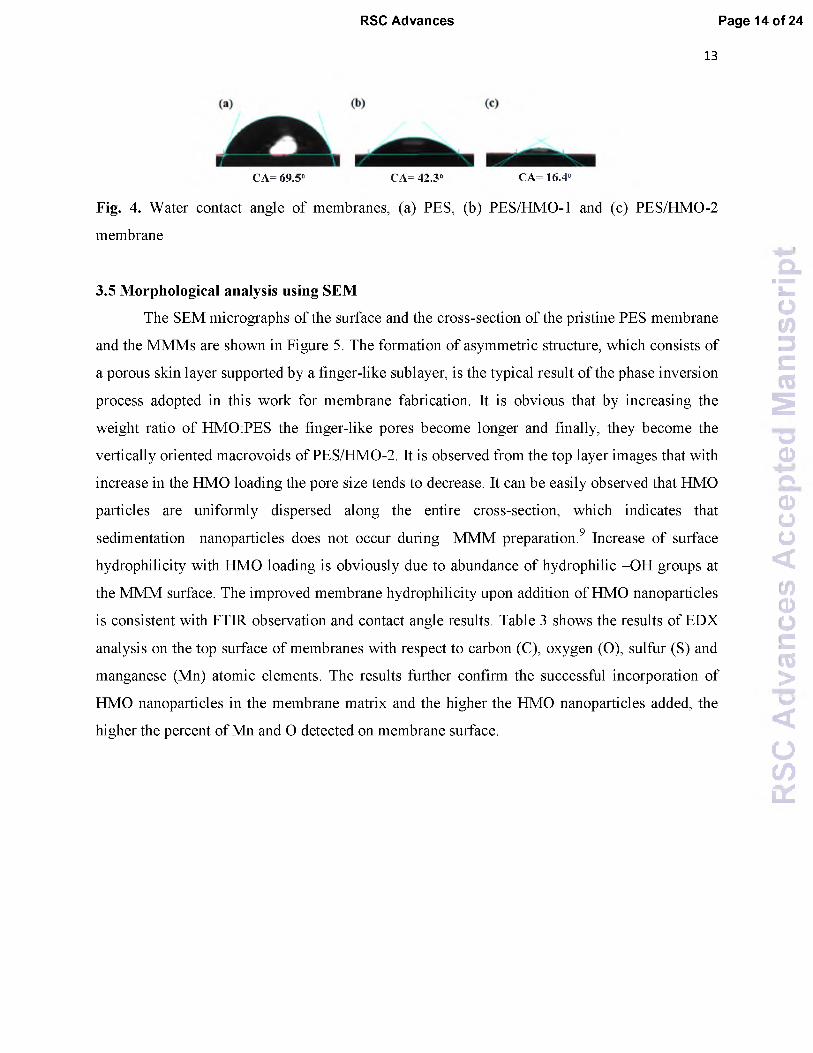
3.4 Membrane hydrophilicity
Surface hydrophilicity of membrane plays an important role to define the pure water flux
and antifouling property. Figure 4 presents the contact angle values of the PES membranes with
different loadings of HMO nanoparticles. The contact angle value and subsequently pure water
flux changed from 69.5° and 39.2 L/m2 h of pristine PES membrane to 42.3° and 336 L/m2 h of
PES/HMO-1 membrane and to 16.4° and 573.2 L/m2.h of PES/HMO-2 membrane with
increasing HMO:PES ratio from zero to 2. Thus, the effect of HMO loading on the
hydrophilicity of the membranes is obvious. This is due to the superhydrophilic nature of HMO25 37 39with many -O H functional groups. ’ - It should be taken into account that the hydroxyl groups
of nanoparticles are able to interact with water molecules easily through the hydrogen bonding
and the Van der Waals force, which leads to an increase in water permeability as evidenced in. i- 26,40previous studies. ,
RSC
Adva
nces
Ac
cept
ed
Man
uscr
ipt
RSC Advances Page 14 of 24
13
CA= 69.5° CA= 42.3® CA= 16.4°
Fig. 4. Water contact angle of membranes, (a) PES, (b) PES/HMO-1 and (c) PES/HMO-2
membrane
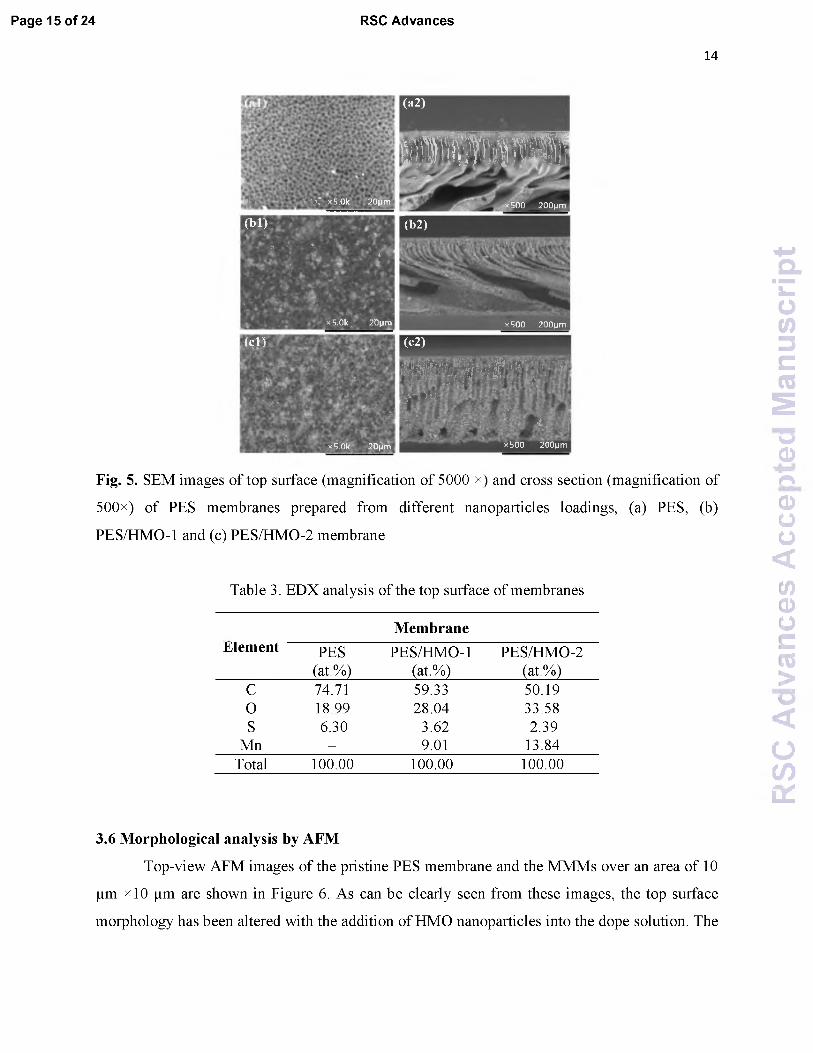
3.5 Morphological analysis using SEM
The SEM micrographs of the surface and the cross-section of the pristine PES membrane
and the MMMs are shown in Figure 5. The formation of asymmetric structure, which consists of
a porous skin layer supported by a finger-like sublayer, is the typical result of the phase inversion
process adopted in this work for membrane fabrication. It is obvious that by increasing the
weight ratio of HMO:PES the finger-like pores become longer and finally, they become the
vertically oriented macrovoids of PES/HMO-2. It is observed from the top layer images that with
increase in the HMO loading the pore size tends to decrease. It can be easily observed that HMO
particles are uniformly dispersed along the entire cross-section, which indicates that
sedimentation nanoparticles does not occur during MMM preparation.9 Increase of surface
hydrophilicity with HMO loading is obviously due to abundance of hydrophilic -O H groups at
the MMM surface. The improved membrane hydrophilicity upon addition of HMO nanoparticles
is consistent with FTIR observation and contact angle results. Table 3 shows the results of EDX
analysis on the top surface of membranes with respect to carbon (C), oxygen (O), sulfur (S) and
manganese (Mn) atomic elements. The results further confirm the successful incorporation of
HMO nanoparticles in the membrane matrix and the higher the HMO nanoparticles added, the
higher the percent of Mn and O detected on membrane surface.
RSC
Adva
nces
Ac
cept
ed
Man
uscr
ipt
Page 15 of 24 RSC Advances
14
► .. ‘
b \ \ • ‘ *7 x5.0k 20pm
( a 2 )
m m u mfr
x500 200pm
( b i > ( b 2 )
* r • \ . * * - • ’’‘ 1 A ' J v i "
'1$ \ ,
• * t ■» | ^4 ••. * * 7 ; ■* , • * ' * j **
x5.0k 20pm x500 200pm
( c l ) ( c 2 )
■ , ‘ '
v, £ •' ** 'ft. > '-3* *
u *',£ * Sfii* *'W .* ' f - A
x5.0k 20pm
llilpfisffi, v t - • Y U « » r, v , ‘ «! •>.;■< . 4 .» ':$■ & £ -ftF - • VtJr •*“: 5 iff M 1 ' V
..J;- ■' ' f A . V ' . J . ■ 'r ,V; ' V . ! ‘I .. ■ i ' f r '
^ ’• ... ‘x500 200pm
Fig. 5. SEM images of top surface (magnification of 5000 x) and cross section (magnification of
500x) of PES membranes prepared from different nanoparticles loadings, (a) PES, (b)
PES/HMO-1 and (c) PES/HMO-2 membrane
Table 3. EDX analysis of the top surface of membranes
MembraneElement PES
(at.%)PES/HMO-1
(at.%)PES/HMO-2
(at.%)C 74.71 59.33 50.19O 18.99 28.04 33.58S 6.30 3.62 2.39
Mn - 9.01 13.84Total 100.00 100.00 100.00
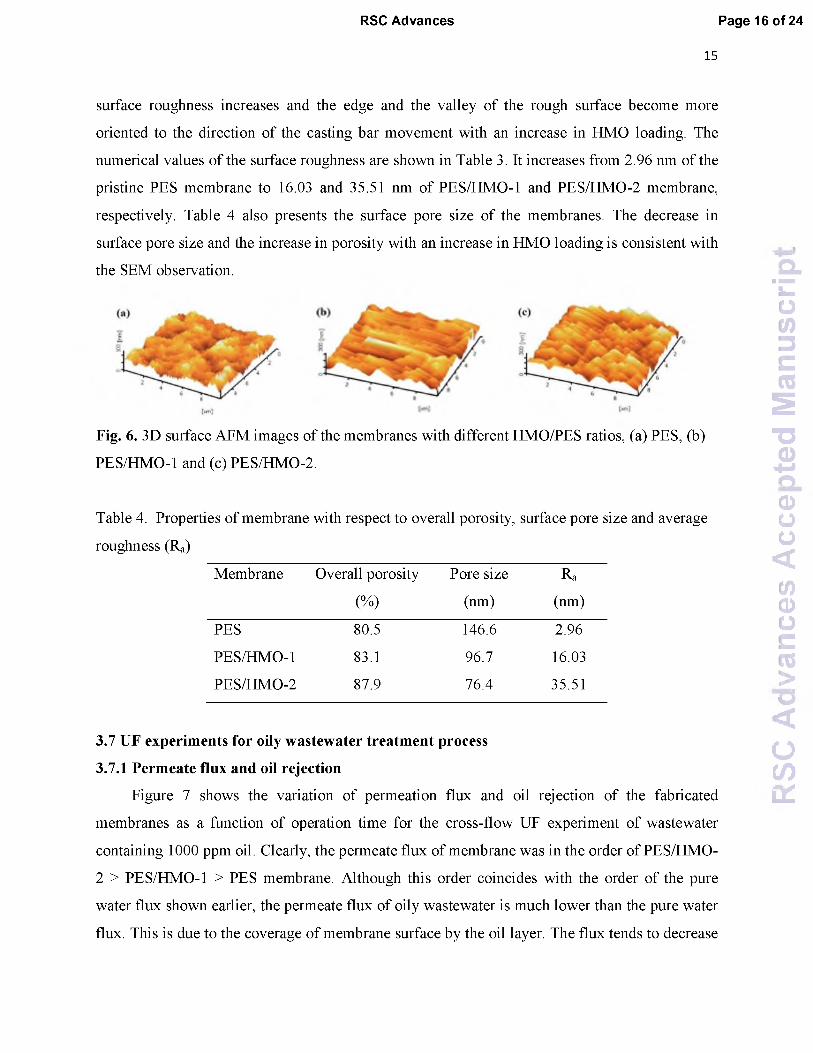
3.6 Morphological analysis by AFM
Top-view AFM images of the pristine PES membrane and the MMMs over an area of 10
|im x i0 |im are shown in Figure 6. As can be clearly seen from these images, the top surface
morphology has been altered with the addition of HMO nanoparticles into the dope solution. The
RSC
Adva
nces
Ac
cept
ed
Man
uscr
ipt
RSC Advances Page 16 of 24
surface roughness increases and the edge and the valley of the rough surface become more
oriented to the direction of the casting bar movement with an increase in HMO loading. The
numerical values of the surface roughness are shown in Table 3. It increases from 2.96 nm of the
pristine PES membrane to 16.03 and 35.51 nm of PES/HMO-1 and PES/HMO-2 membrane,
respectively. Table 4 also presents the surface pore size of the membranes. The decrease in
surface pore size and the increase in porosity with an increase in HMO loading is consistent with
the SEM observation.
15
Fig. 6. 3D surface AFM images of the membranes with different HMO/PES ratios, (a) PES, (b)
PES/HMO-1 and (c) PES/HMO-2.
Table 4. Properties of membrane with respect to overall porosity, surface pore size and average
roughness (Ra)
Membrane Overall porosity
(%)
Pore size
(nm)
Ra
(nm)
PES 80.5 146.6 2.96
PES/HMO-1 83.1 96.7 16.03
PES/HMO-2 87.9 76.4 35.51
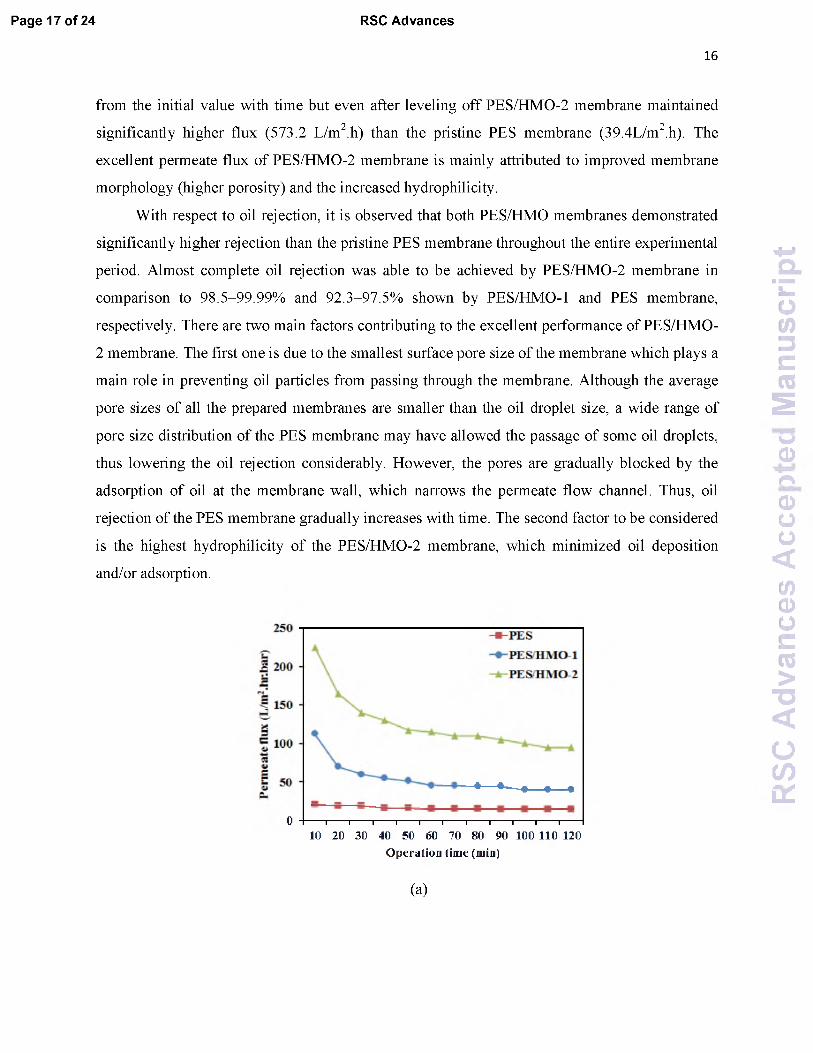
3.7 UF experiments for oily wastewater treatment process
3.7.1 Permeate flux and oil rejection
Figure 7 shows the variation of permeation flux and oil rejection of the fabricated
membranes as a function of operation time for the cross-flow UF experiment of wastewater
containing 1000 ppm oil. Clearly, the permeate flux of membrane was in the order of PES/HMO-
2 > PES/HMO-1 > PES membrane. Although this order coincides with the order of the pure
water flux shown earlier, the permeate flux of oily wastewater is much lower than the pure water
flux. This is due to the coverage of membrane surface by the oil layer. The flux tends to decrease
RSC
Adva
nces
Ac
cept
ed
Man
uscr
ipt
Page 17 of 24 RSC Advances
from the initial value with time but even after leveling off PES/HMO-2 membrane maintained
significantly higher flux (573.2 L/m2.h) than the pristine PES membrane (39.4L/m2.h). The
excellent permeate flux of PES/HMO-2 membrane is mainly attributed to improved membrane
morphology (higher porosity) and the increased hydrophilicity.
With respect to oil rejection, it is observed that both PES/HMO membranes demonstrated
significantly higher rejection than the pristine PES membrane throughout the entire experimental
period. Almost complete oil rejection was able to be achieved by PES/HMO-2 membrane in
comparison to 98.5-99.99% and 92.3-97.5% shown by PES/HMO-1 and PES membrane,
respectively. There are two main factors contributing to the excellent performance of PES/HMO-
2 membrane. The first one is due to the smallest surface pore size of the membrane which plays a
main role in preventing oil particles from passing through the membrane. Although the average
pore sizes of all the prepared membranes are smaller than the oil droplet size, a wide range of
pore size distribution of the PES membrane may have allowed the passage of some oil droplets,
thus lowering the oil rejection considerably. However, the pores are gradually blocked by the
adsorption of oil at the membrane wall, which narrows the permeate flow channel. Thus, oil
rejection of the PES membrane gradually increases with time. The second factor to be considered
is the highest hydrophilicity of the PES/HMO-2 membrane, which minimized oil deposition
and/or adsorption.
16
0 H----1---- 1---- 1----1----1----1---- 1----1----1----1----1----10 20 30 40 50 60 70 80 90 100 110 120
Operation time (min)
(a)
RSC
Adva
nces
Ac
cept
ed
Man
uscr
ipt

RSC Advances Page 18 of 24
17
(b)
Fig. 7 . Separation performance of PES and PES/HMO membranes in the treatment of synthetic
oily wastewater (feed oil concentration: 1000 ppm and pH: 7) as a function of operation time, (a)
permeate flux and (b) oil rejection
3.7.2 Flux recovery ratio
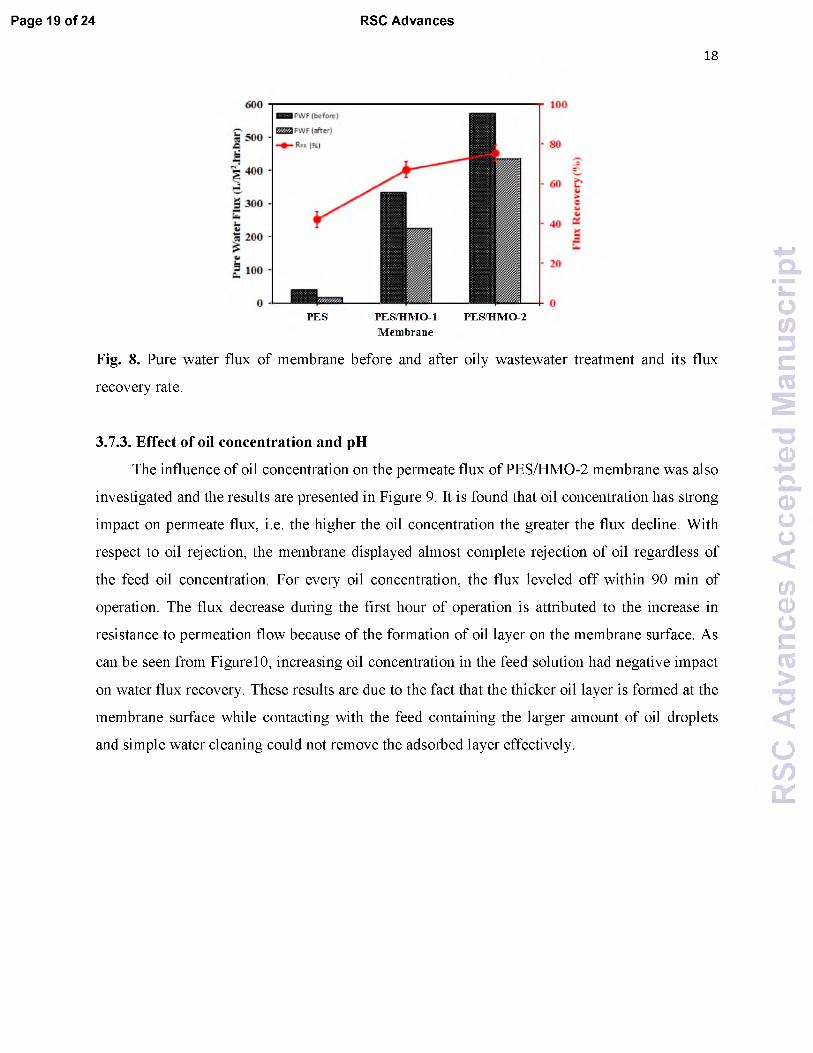
Figure 8 shows the flux recovery ratio, defined by equation (3), of the membranes. As the
figure shows, there is substantial improvement of water flux recovery by HMO loading, i.e. 42%,
68% and ~75% for PES, PES/HMO-1 and PES/HMO-2 membrane, respectively. The high
recovery ratio of the PES/HMO-2 also indicates its excellent antifouling property by reducing
the formation of oil layer on membrane surface (and/or pore blocking by smaller oil droplet). As
a conclusion, it can be said that hydrophilic HMO nanoparticle has a potential of enhancing
membrane hydrophilicity and further its antifouling resistance against oil droplets during
treatment of oily wastewater process.
RSC
Adva
nces
Ac
cept
ed
Man
uscr
ipt
Page 19 of 24 RSC Advances
18
PES PES/HMO-1 PES/HMO-2Membrane
Fig. 8. Pure water flux of membrane before and after oily wastewater treatment and its flux
recovery rate.
3.7.3. Effect of oil concentration and pH
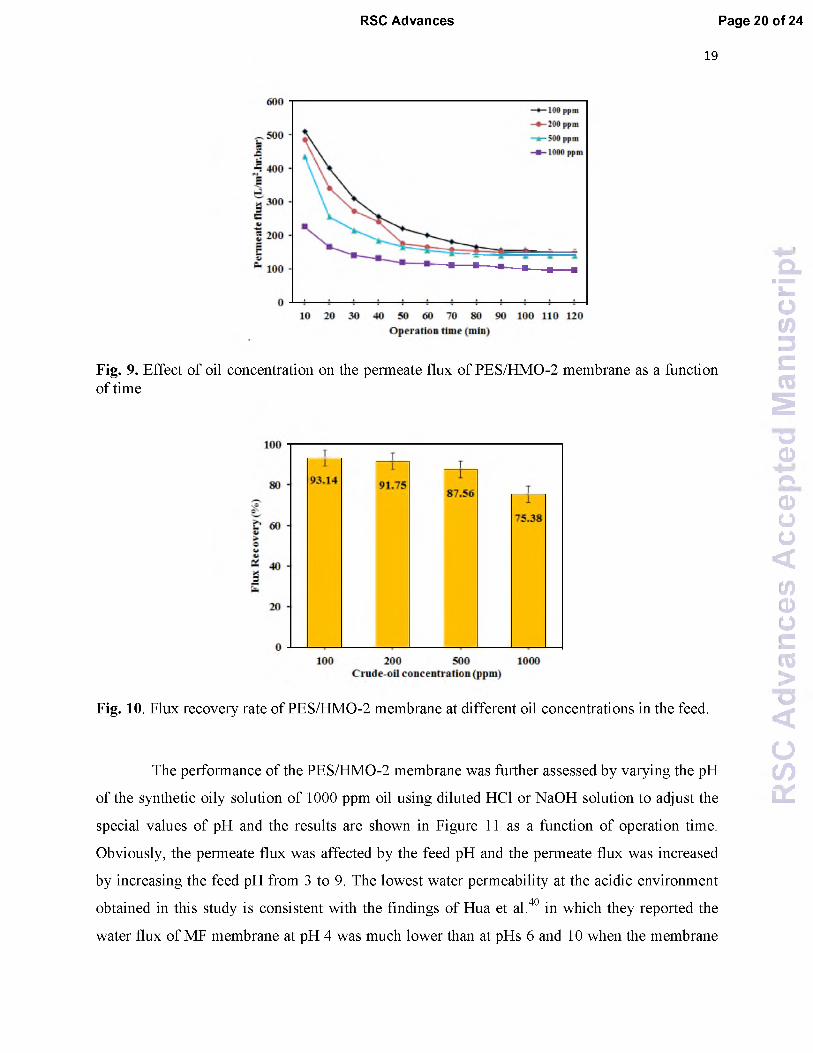
The influence of oil concentration on the permeate flux of PES/HMO-2 membrane was also
investigated and the results are presented in Figure 9. It is found that oil concentration has strong
impact on permeate flux, i.e. the higher the oil concentration the greater the flux decline. With
respect to oil rejection, the membrane displayed almost complete rejection of oil regardless of
the feed oil concentration. For every oil concentration, the flux leveled off within 90 min of
operation. The flux decrease during the first hour of operation is attributed to the increase in
resistance to permeation flow because of the formation of oil layer on the membrane surface. As
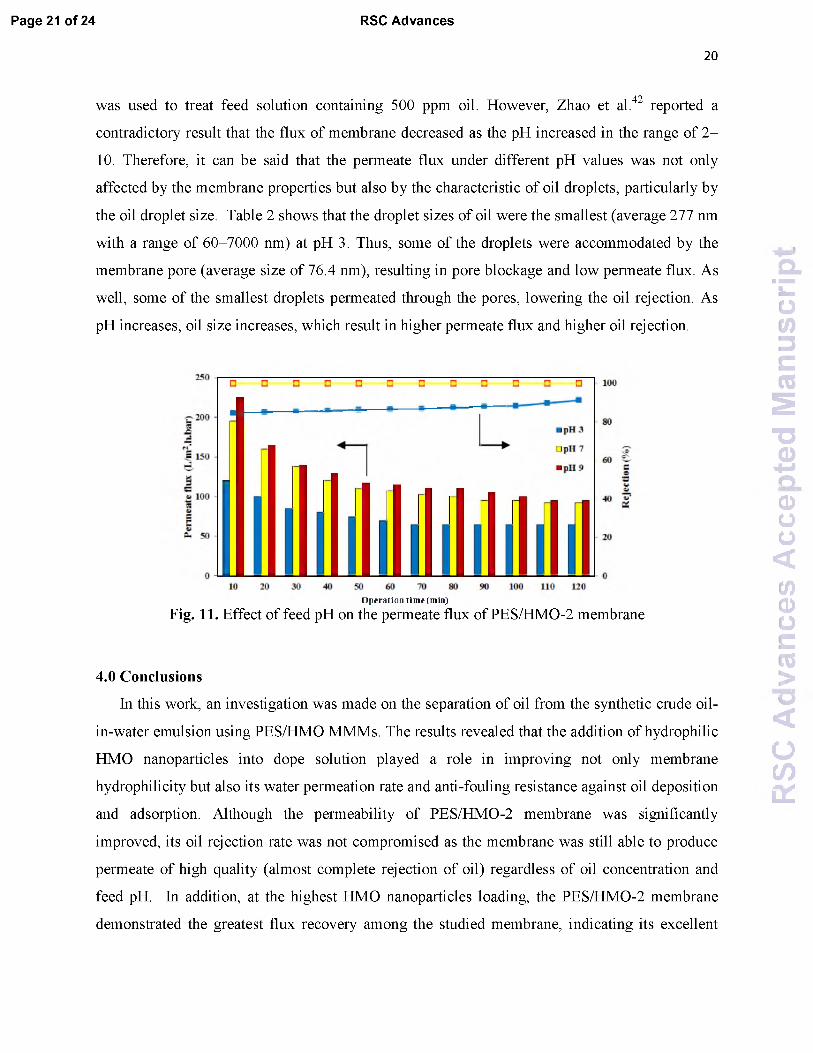
can be seen from Figure10, increasing oil concentration in the feed solution had negative impact
on water flux recovery. These results are due to the fact that the thicker oil layer is formed at the
membrane surface while contacting with the feed containing the larger amount of oil droplets
and simple water cleaning could not remove the adsorbed layer effectively.
RSC
Adva
nces
Ac
cept
ed
Man
uscr
ipt
RSC Advances Page 20 of 24
19
Fig. 9. Effect of oil concentration on the permeate flux of PES/HMO-2 membrane as a function of time
Fig. 10. Flux recovery rate of PES/HMO-2 membrane at different oil concentrations in the feed.
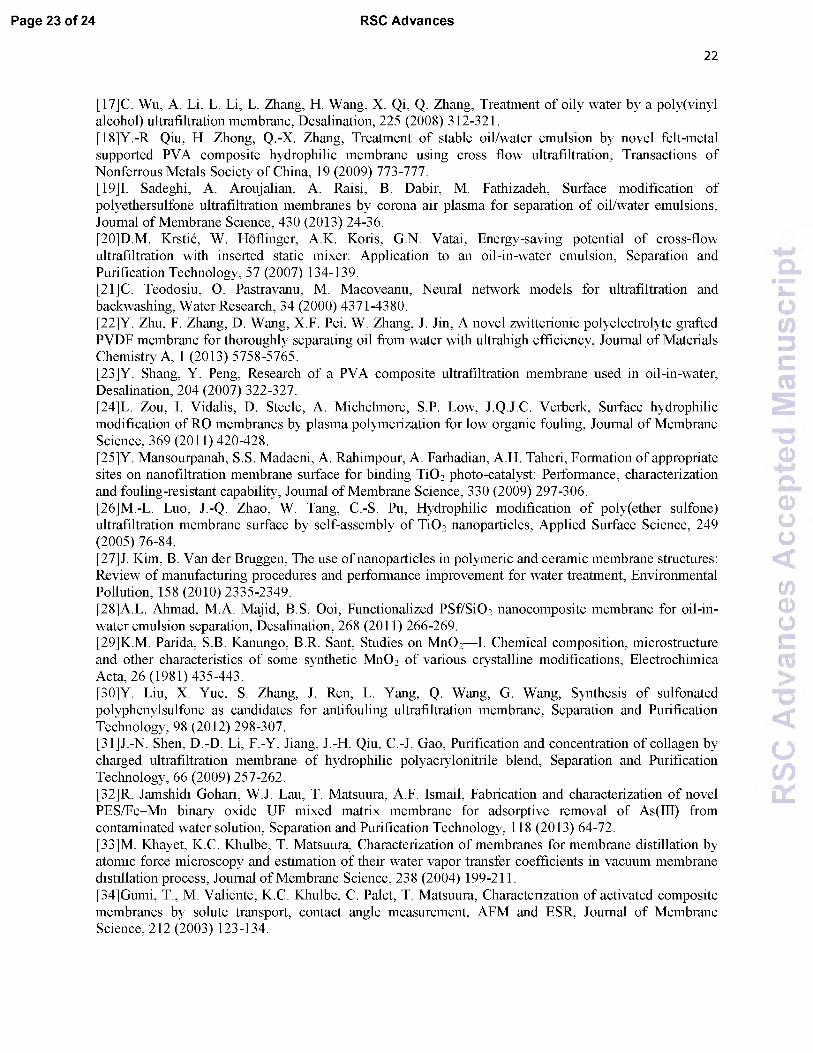
The performance of the PES/HMO-2 membrane was further assessed by varying the pH
of the synthetic oily solution of 1000 ppm oil using diluted HCl or NaOH solution to adjust the
special values of pH and the results are shown in Figure 11 as a function of operation time.
Obviously, the permeate flux was affected by the feed pH and the permeate flux was increased
by increasing the feed pH from 3 to 9. The lowest water permeability at the acidic environment
obtained in this study is consistent with the findings of Hua et al.40 in which they reported the
water flux of MF membrane at pH 4 was much lower than at pHs 6 and 10 when the membrane
RSC
Adva
nces
Ac
cept
ed
Man
uscr
ipt
Page 21 of 24 RSC Advances
20
was used to treat feed solution containing 500 ppm oil. However, Zhao et al. reported a
contradictory result that the flux of membrane decreased as the pH increased in the range of 2
10. Therefore, it can be said that the permeate flux under different pH values was not only
affected by the membrane properties but also by the characteristic of oil droplets, particularly by
the oil droplet size. Table 2 shows that the droplet sizes of oil were the smallest (average 277 nm
with a range of 60-7000 nm) at pH 3. Thus, some of the droplets were accommodated by the
membrane pore (average size of 76.4 nm), resulting in pore blockage and low permeate flux. As
well, some of the smallest droplets permeated through the pores, lowering the oil rejection. As
pH increases, oil size increases, which result in higher permeate flux and higher oil rejection.
42
Operation tim e (min)
Fig. l l . Effect of feed pH on the permeate flux of PES/HMO-2 membrane
4.0 Conclusions
In this work, an investigation was made on the separation of oil from the synthetic crude oil-
in-water emulsion using PES/HMO MMMs. The results revealed that the addition of hydrophilic
HMO nanoparticles into dope solution played a role in improving not only membrane
hydrophilicity but also its water permeation rate and anti-fouling resistance against oil deposition
and adsorption. Although the permeability of PES/HMO-2 membrane was significantly
improved, its oil rejection rate was not compromised as the membrane was still able to produce
permeate of high quality (almost complete rejection of oil) regardless of oil concentration and
feed pH. In addition, at the highest HMO nanoparticles loading, the PES/HMO-2 membrane
demonstrated the greatest flux recovery among the studied membrane, indicating its excellent
RSC
Adva
nces
Ac
cept
ed
Man
uscr
ipt

RSC Advances Page 22 of 24
21
anti-fouling properties in reducing oil deposition and/or adsorption. This study shows the
potential of using HMO nanoparticles as alternative promising filler in improving PES
membrane properties, making it suitable for treating oily wastewater.
References
[1] J. Mueller, Y. Cen, R.H. Davis, Crossflow microfiltration of oily water, Journal of Membrane Science, 129 (1997) 221-235.[2] B. Chakrabarty, A.K. Ghoshal, M.K. Purkait, Cross-flow ultrafiltration of stable oil-in-water emulsion using polysulfone membranes, Chemical Engineering Journal, 165 (2010) 447-456.[3] M. Cheryan, N. Rajagopalan, Membrane processing of oily streams. Wastewater treatment and waste reduction, Journal of Membrane Science, 151 (1998) 13-28.[4] P. Srijaroonrat, E. Julien, Y. Aurelle, Unstable secondary oil/water emulsion treatment using ultrafiltration: fouling control by backflushing, Journal of Membrane Science, 159 (1999) 11-20.[5] W. Chen, J. Peng, Y. Su, L. Zheng, L. Wang, Z. Jiang, Separation of oil/water emulsion using Pluronic F127 modified polyethersulfone ultrafiltration membranes, Separation and Purification Technology, 66 (2009) 591-597.[6] Y.S. Li, L. Yan, C.B. Xiang, L.J. Hong, Treatment of oily wastewater by organic-inorganic composite tubular ultrafiltration (UF) membranes, Desalination, 196 (2006) 76-83.[7] A. Lobo, A. Cambiella, J.M. Benito, C. Pazos, J. Coca, Ultrafiltration of oil-in-water emulsions with ceramic membranes: Influence of pH and crossflow velocity, Journal of Membrane Science, 278 (2006) 328-334.[8] N. Moulai-Mostefa, M. Frappart, O. Akoum, L. Ding, M.Y. Jaffrin, Separation of water from metal working emulsions by ultrafiltration using vibratory membranes, Journal of hazardous materials, 177 (2010) 978-982.[9] Y. Zhang, P. Cui, T. Du, L. Shan, Y. Wang, Development of a sulfated Y-doped nonstoichiometric zirconia/polysulfone composite membrane for treatment of wastewater containing oil, Separation and Purification Technology, 70 (2009) 153-159.[10]E. Yuliwati, A.F. Ismail, Effect of additives concentration on the surface properties and performance of PVDF ultrafiltration membranes for refinery produced wastewater treatment, Desalination, 273 (2011) 226-234.[11]X.S. Yi, W.X. Shi, S.L.Yu, C. Ma, N. Sun, S. Wang, L.M. Jin, L.P. Sun, Optimization of complex conditions by response surface methodology for APAM-oil/water emulsion removal from aqua solutions using nano-sized TiO2 /Al2 O3 PVDF ultrafiltration membrane, Journal of hazardous materials, 193 (2011) 37-44.[12]H.-J. Li, Y.-M. Cao, J.-J. Qin, X.-M. Jie, T.-H. Wang, J.-H. Liu, Q. Yuan, Development and characterization of anti-fouling cellulose hollow fiber UF membranes for oil-water separation, Journal of Membrane Science, 279 (2006) 328-335.[13]C.S. Ong, W.J. Lau, P.S. Goh, B.C. Ng, A.F. Ismail, Preparation and characterization of PVDF- PVP-TiO 2 composite hollow fiber membranes for oily wastewater treatment using submerged membrane system, Desalination and Water Treatment, In Press. doi: 10.1080/19443994.2013.855679.[14]H. Ma, K. Yoon, L. Rong, Y. Mao, Z. Mo, D. Fang, Z. Hollander, J. Gaiteri, B.S. Hsiao, B. Chu, High-flux thin-film nanofibrous composite ultrafiltration membranes containing cellulose barrier layer, Journal of Materials Chemistry, 20 (2010) 4692-4704.[15]B. Chakrabarty, A.K. Ghoshal, M.K. Purkait, Ultrafiltration of stable oil-in-water emulsion by polysulfone membrane, Journal of Membrane Science, 325 (2008) 427-437.[16]J. Lee, T. Frankiewicz, Treatment of produced water with an ultrafiltration (UF) membrane-a field trial, in: SPE Annual Technical Conference and Exhibition, 2005.
RSC
Adva
nces
Ac
cept
ed
Man
uscr
ipt
Page 23 of 24 RSC Advances
22
[17]C. Wu, A. Li, L. Li, L. Zhang, H. Wang, X. Qi, Q. Zhang, Treatment of oily water by a poly(vinyl alcohol) ultrafiltration membrane, Desalination, 225 (2008) 312-321.[18]Y.-R. Qiu, H. Zhong, Q.-X. Zhang, Treatment of stable oil/water emulsion by novel felt-metal supported PVA composite hydrophilic membrane using cross flow ultrafiltration, Transactions of Nonferrous Metals Society of China, 19 (2009) 773-777.[19]I. Sadeghi, A. Aroujalian, A. Raisi, B. Dabir, M. Fathizadeh, Surface modification of polyethersulfone ultrafiltration membranes by corona air plasma for separation of oil/water emulsions, Journal of Membrane Science, 430 (2013) 24-36.[20]D.M. Krstic, W. Hoflinger, A.K. Koris, G.N. Vatai, Energy-saving potential of cross-flow ultrafiltration with inserted static mixer: Application to an oil-in-water emulsion, Separation and Purification Technology, 57 (2007) 134-139.[21]C. Teodosiu, O. Pastravanu, M. Macoveanu, Neural network models for ultrafiltration and backwashing, Water Research, 34 (2000) 4371-4380.[22]Y. Zhu, F. Zhang, D. Wang, X.F. Pei, W. Zhang, J. Jin, A novel zwitterionic polyelectrolyte grafted PVDF membrane for thoroughly separating oil from water with ultrahigh efficiency, Journal of Materials Chemistry A, 1 (2013) 5758-5765.[23]Y. Shang, Y. Peng, Research of a PVA composite ultrafiltration membrane used in oil-in-water, Desalination, 204 (2007) 322-327.[24]L. Zou, I. Vidalis, D. Steele, A. Michelmore, S.P. Low, J.Q.J.C. Verberk, Surface hydrophilic modification of RO membranes by plasma polymerization for low organic fouling, Journal of Membrane Science, 369 (2011) 420-428.[25]Y. Mansourpanah, S.S. Madaeni, A. Rahimpour, A. Farhadian, A.H. Taheri, Formation of appropriate sites on nanofiltration membrane surface for binding TiO2 photo-catalyst: Performance, characterization and fouling-resistant capability, Journal of Membrane Science, 330 (2009) 297-306.[26]M.-L. Luo, J.-Q. Zhao, W. Tang, C.-S. Pu, Hydrophilic modification of poly(ether sulfone) ultrafiltration membrane surface by self-assembly of TiO2 nanoparticles, Applied Surface Science, 249 (2005) 76-84.[27]J. Kim, B. Van der Bruggen, The use of nanoparticles in polymeric and ceramic membrane structures: Review of manufacturing procedures and performance improvement for water treatment, Environmental Pollution, 158 (2010) 2335-2349.[28]A.L. Ahmad, M.A. Majid, B.S. Ooi, Functionalized PSf/SiO2 nanocomposite membrane for oil-in- water emulsion separation, Desalination, 268 (2011) 266-269.[29]K.M. Parida, S.B. Kanungo, B.R. Sant, Studies on MnO2—I. Chemical composition, microstructure and other characteristics of some synthetic MnO2 of various crystalline modifications, Electrochimica Acta, 26 (1981) 435-443.[30]Y. Liu, X. Yue, S. Zhang, J. Ren, L. Yang, Q. Wang, G. Wang, Synthesis of sulfonated polyphenylsulfone as candidates for antifouling ultrafiltration membrane, Separation and Purification Technology, 98 (2012) 298-307.[31]J.-N. Shen, D.-D. Li, F.-Y. Jiang, J.-H. Qiu, C.-J. Gao, Purification and concentration of collagen by charged ultrafiltration membrane of hydrophilic polyacrylonitrile blend, Separation and Purification Technology, 66 (2009) 257-262.[32]R. Jamshidi Gohari, W.J. Lau, T. Matsuura, A.F. Ismail, Fabrication and characterization of novel PES/Fe-Mn binary oxide UF mixed matrix membrane for adsorptive removal of As(III) from contaminated water solution, Separation and Purification Technology, 118 (2013) 64-72.[33]M. Khayet, K.C. Khulbe, T. Matsuura, Characterization of membranes for membrane distillation by atomic force microscopy and estimation of their water vapor transfer coefficients in vacuum membrane distillation process, Journal of Membrane Science, 238 (2004) 199-211.[34]Gumi, T., M. Valiente, K.C. Khulbe, C. Palet, T. Matsuura, Characterization of activated composite membranes by solute transport, contact angle measurement, AFM and ESR, Journal of Membrane Science, 212 (2003) 123-134.
RSC
Adva
nces
Ac
cept
ed
Man
uscr
ipt
RSC Advances Page 24 of 24
23
[35]F. Pagnanelli, C. Sambenedetto, G. Furlani, F. Veglio, L. Toro, Preparation and characterisation of chemical manganese dioxide: Effect of the operating conditions, Journal of Power Sources, 166 (2007) 567-577.[36]E. Eren, B. Afsin, Y. Onal, Removal of lead ions by acid activated and manganese oxide-coated bentonite, Journal of hazardous materials, 161 (2009) 677-685.[37]C. Dong, G. He, H. Li, R. Zhao, Y. Han, Y. Deng, Antifouling enhancement of poly(vinylidene fluoride) microfiltration membrane by adding Mg(OH)2 nanoparticles, Journal of Membrane Science, 387-388 (2012)40-47.[38]A.K. Nair, A.M. Isloor, R. Kumar, A.F. Ismail, Antifouling and performance enhancement of polysulfone ultrafiltration membranes using CaCO3 nanoparticles, Desalination, 322 (2013) 69-75.[39]J.-E. Zhou, Q. Chang, Y. Wang, J. Wang, G. Meng, Separation of stable oil-water emulsion by the hydrophilic nano-sized ZrO2 modified Al2 O3 microfiltration membrane, Separation and Purification Technology, 75 (2010) 243-248.[40]S.S. Madaeni, N. Ghaemi, Characterization of self-cleaning RO membranes coated with TiO2
particles under UV irradiation, Journal of Membrane Science, 303 (2007) 221-233.[41]F.L. Hua, Y.F. Tsang, Y.J. Wang, S.Y. Chan, H. Chua, S.N. Sin, Performance study of ceramic microfiltration membrane for oily wastewater treatment, Chemical Engineering Journal, 128 (2007) 169175.[42]Y. Zhao, W. Xing, N. Xu, F.-S. Wong, Effects of inorganic salt on ceramic membrane microfiltration of titanium dioxide suspension, Journal of Membrane Science, 254 (2005) 81-88.
RSC
Adva
nces
Ac
cept
ed
Man
uscr
ipt