rr-00-11 research r puerto rico and u.s. … · luis m. laosa august 2000 r e s e a r c h ... too,...
TRANSCRIPT
RR-00-11
PUERTO RICO AND U.S. MAINLANDSCHOOLS: EFFECTS OF MIGRATION AND
LINGUISTIC SEGREGATION ON CHILDREN’SENGLISH-LANGUAGE DEVELOPMENT
Luis M. Laosa
August 2000
RESEARCH R
EPORT
Princeton, New Jersey 08541
Puerto Rico and U.S. Mainland Schools: Effects of Migration and Linguistic Segregation
on Children's English-Language Development
Luis M. Laosa
Educational Testing Service, Princeton, New Jersey

Research Reports provide preliminary and limiteddissemination of ETS research prior to publication. They areavailable without charge from the
Research Publications OfficeMail Stop 07-REducational Testing ServicePrinceton, NJ 08541
1
Puerto Rico and U.S. Mainland Schools: Effects of Migration and Linguistic Segregation
on Children's English-Language Development
Luis M. Laosa
Educational Testing Service, Princeton, New Jersey
Abstract
Using a longitudinal research design with multiple migration waves and grade cohorts, this study
examined the effects of migration and of school segregation by native language on the English-
language development of Spanish-speaking students. Participants were 231 normal children
who arrived from Puerto Rico in 67 U.S. mainland (New Jersey) elementary schools. Each
child's English-language proficiency was tested initially at arrival from Puerto Rico, using the
Language Assessment Battery (listening, reading, writing, and speaking tests), and twice again
in the course of two academic years, even during returns to Puerto Rico. The student body of
each mainland school that the participants attended during their longitudinal span was
measured for linguistic composition and, for statistical control, economic poverty level. As
hypothesized, participants' English proficiency developed more slowly in schools in which
student bodies had relatively high percentages of native speakers of Spanish, faster in schools
in which student bodies had relatively high percentages of monolingual native speakers of
English (p < .03). Although participants' English-proficiency raw scores generally increased
substantially between successive longitudinal occasions, the grade-level percentile ranks
(derived from U.S. norms for native speakers of English) for these scores increased very little--a
probably frustrating contrast between absolute and relative achievement. Participants who
returned to schools in Puerto Rico continued to develop their English-language proficiency,
although considerably more slowly than during their stay in stateside schools.
Key words: language minorities, second-language development, second-language acquisition, school segregation,school characteristics, student-body characteristics, socioeconomic status, longitudinal research, Puerto Ricanstudents, English-language proficiency, international migration, child migration, elementary schools, literacy,language assessment, limited-English-proficient, English-language learners
2
Puerto Rico and U.S. Mainland Schools: Effects of Migration and Linguistic Segregation
on Children's English-Language Development
Luis M. Laosa
Educational Testing Service, Princeton, New Jersey
Introduction
This study sought to ascertain whether segregation, or isolation, of language-minority
children in U.S. mainland schools can affect those children's English-language development.
The study focuses particularly on elementary school children who migrate from Puerto Rico, a
Caribbean island where the predominant language is Spanish, to New Jersey, a state on the
northeastern seaboard of the United States.1, 2 Beginning at each child's arrival from Puerto
Rico, longitudinal measurements were taken of his or her English-language proficiency and of
the linguistic composition and (for control) economic poverty level of his or her schools' student
bodies.
In addition to addressing the impact of mainland school segregation, this study, which
tested the children longitudinally, including in Puerto Rico if they returned thereto, compared
their rate of English-language development on the mainland with that on the island. The study
also identified predictors of return migration to Puerto Rico.
Segregation of Hispanic/Latino students has been steadily increasing in the public
schools of the United States. Indeed, U.S. national statistics show that since 1980,
Hispanics/Latinos have been more likely than African Americans to attend predominantly
minority schools.3 School segregation of African Americans declined dramatically from the mid
1960s through the early 1970s, as a consequence of the 1954 U.S. Supreme Court decision in
Brown v. Board of Education and the ensuing struggles culminating in the 1964 Civil Rights Act
(Laosa, 1984, 1998b); it then remained largely stable until the late 1980s when, in a reversal of
this trend, it began to rise (Orfield, 1993; Orfield, Bachmeier, James, & Eitle, 1997; Orfield &
Yun, 1999; U.S. Department of Education, 1995). In sharp contrast, school segregation of
3
Hispanics/Latinos has continued to increase steadily since at least the mid 1960s, when
nationwide data on the subject were first collected (Orfield, 1993; Orfield et al., 1997; Orfield &
Yun, 1999; U.S. Department of Education, 1995).
Nationwide in the 1968-69 school year, 77% of African American and 55% of
Hispanic/Latino students attended predominantly minority schools. This difference soon
narrowed: In 1972-73, the figures were 64% and 57%. By 1980-81, they had switched to 63%
and 68%. In 1996-97, 69% and 75%, respectively, of African American and Hispanic/Latino
students attended predominantly minority schools (Orfield, 1993; Orfield et al., 1997; Orfield &
Yun, 1999). Patterns similar to these are evident in other measures of segregation; such
measures include the percentage of students from a particular ethnic/racial group in schools
with a 90% to 100% minority enrollment (Orfield, 1993; Orfield et al., 1997; Orfield & Yun, 1999;
U.S. Department of Education, 1995) and the weighted average percentage of European
American students in the schools that children of a particular ethnic/racial group attend (Orfield,
1993; Orfield et al., 1997; Orfield & Yun, 1999).
The level of school segregation for Hispanic/Latino children is high across the country; it
is highest for the substantially Puerto Rican population of the Northeast, although it is rapidly
rising in other regions with significant concentrations of Hispanics/Latinos. African Americans,
too, face the highest segregation levels in the Northeast, although they encounter rising levels in
other regions because of resegregation trends (Orfield, 1993; Orfield et al., 1997; Orfield & Yun,
1999).
These patterns of segregation are consistent with findings from a recent study (Laosa,
1998b) which, like the present study, is part of a larger, ongoing scientific investigation of child
migration from Puerto Rico. That study described the student bodies of U.S. elementary
schools to which a large sample of students had transferred from Puerto Rico.4 It showed that
in many of those schools, a high proportion of the student body is native speakers of Spanish,
thus demonstrating school segregation not only by ethnicity/race, but also by linguistic
background.5 This situation allowed the present study to analyze the predicted impact of such
intense levels of linguistic segregation.
4
Also importantly, however, there was considerable variation among the schools in level
of segregation, allowing the present analyses of a continuum of such impact. For example,
native speakers of Spanish were the majority of the student body in about one third of the
schools, but at the other end of this statistical distribution, in another one third of the schools,
native speakers of Spanish were only a small minority. Similarly, monolingual native speakers
of English were 75% or more of the student body in one third of the schools, but they were a
minority in another one third of the schools. Generally, the schools enrolled few or no pupils
with a native language other than Spanish or English. The higher a student body's percentage
of native speakers of Spanish, the higher tended to be its percentage of economically
impoverished pupils.
The present study asked, Do these between-school differences in linguistic segregation
statistically account for any variance in the children's English-language development rate? If so,
is this effect still evident after controlling for the student bodies' economic poverty level?
Two specific hypotheses provide grounds for predicting a statistically significant
relationship between linguistic segregation in U.S. schools and language-minority children's
English-language development rate. This study sought to ascertain the validity of this general
prediction rather than to judge whether particular hypotheses validly explain the relationship.
The second-language motivation hypothesis posits that the motivation to gain proficiency
in a second language will vary as a function of the need to communicate through that language.
If this hypothesis is correct, then the higher a school's concentration of students who are native
speakers of Spanish, the less such students need English to communicate with peers; hence
their motivation to learn English will be weaker, and their development of English proficiency will
be slower. The second-language exposure hypothesis posits that the rate of learning a second
language will depend on the exposure to that language (i.e., on the frequency, or probability, of
opportunities to hear and use the language). This hypothesis predicts a relatively slow rate of
English-language development in the schools with relatively few pupils who are monolingual,
proficient speakers of English (Laosa, 1998b).

5
Both hypotheses make the same general prediction: a negative relationship between a
stateside school's proportion of pupils who are native speakers of Spanish (as opposed to
monolingual, proficient speakers of English) and those pupils' English-language development
rate. The present study sought to establish whether such a relationship exists, as a necessary
next step in this line of inquiry. In addition, because each child was tested longitudinally,
including in Puerto Rico if he or she returned thereto, the data allowed analyses to ascertain
whether characteristics of the stateside student bodies and the child's English-language
proficiency level predict this return migration. Other analyses compared the rate of English-
language development on the mainland with that on the island.
Method
Research Design
For the larger investigation, I used an overlapping longitudinal design encompassing
grades three through five, with multiple migration waves. This age span is when children
typically poise themselves to enter adolescence and when academic problems for many
language-minority students in the United States seem to emerge. Multiple migration waves
make it possible to ascertain the temporal stability of the data.
The present study is based on two annual migration waves from Puerto Rico to New
Jersey, described in the section below. Each wave comprises two grade cohorts: The
3rd-grade-entrant cohort and the 4th-grade-entrant cohort are, respectively, children who
transferred in from Puerto Rico to the third and fourth grades. Each child entered the sample
and was initially tested at arrival from Puerto Rico (i.e., the child's Time 1 [T1]; i.e., within
approximately two months of his or her transfer-in from Puerto Rico). The child was again
tested in the spring of the same academic year (i.e., the spring of his or her Year 1 [his or her
SY1]),6 and a third time in the spring of the following academic year (i.e., his or her SY2). Thus,
a child's Year 1 is the academic year when he or she transferred in from Puerto Rico; his or her
Year 2 is the following academic year. Children who changed residences or schools after
entering the sample were followed, regardless of destination, and tested on schedule in their
new locations, including Puerto Rico if the child returned thereto.
6
Preparatory Demographic Studies
To inform the development of the research design and sampling plan for the present
study, I had conducted a series of empirical demographic studies (e.g., Laosa, 1998a) to obtain
detailed data on schoolchildren's migratory movements between Puerto Rico and New Jersey.
Such information, not available from centralized sources, was needed to identify the geographic
areas and to determine the number of school districts (and schools) required to draw a sample
as representative as possible of schoolchildren arriving from Puerto Rico to urban and suburban
areas and small towns in the state of New Jersey.
Sample
The present study used a sample of 231 normal children (Table 1), obtained as follows.
On the basis of the demographic studies, I selected 27 New Jersey public school districts,
together comprising 241 elementary schools.7, 8 The enrollment records of each school were
then continually monitored during two full, consecutive academic years (i.e., two annual
migration waves [Waves 1 and 2]). All the children who transferred in from Puerto Rico
(regardless of prior migration history) to the third and fourth grades, at any time during those two
years, were identified within approximately two months of their arrival. Those with informed
consents (self and parental) became research participants (i.e., focal children). For analytic
control, this sample excludes focal children who during their longitudinal span (i.e., T1-SY2)
were officially classified as having a learning disability or mental retardation and were
consequently receiving special education. As reported elsewhere (Laosa, n.d.), the consent
rate and sample retention rate were quite adequate by scientific sampling standards; there is no
reason to suspect significant sample bias.
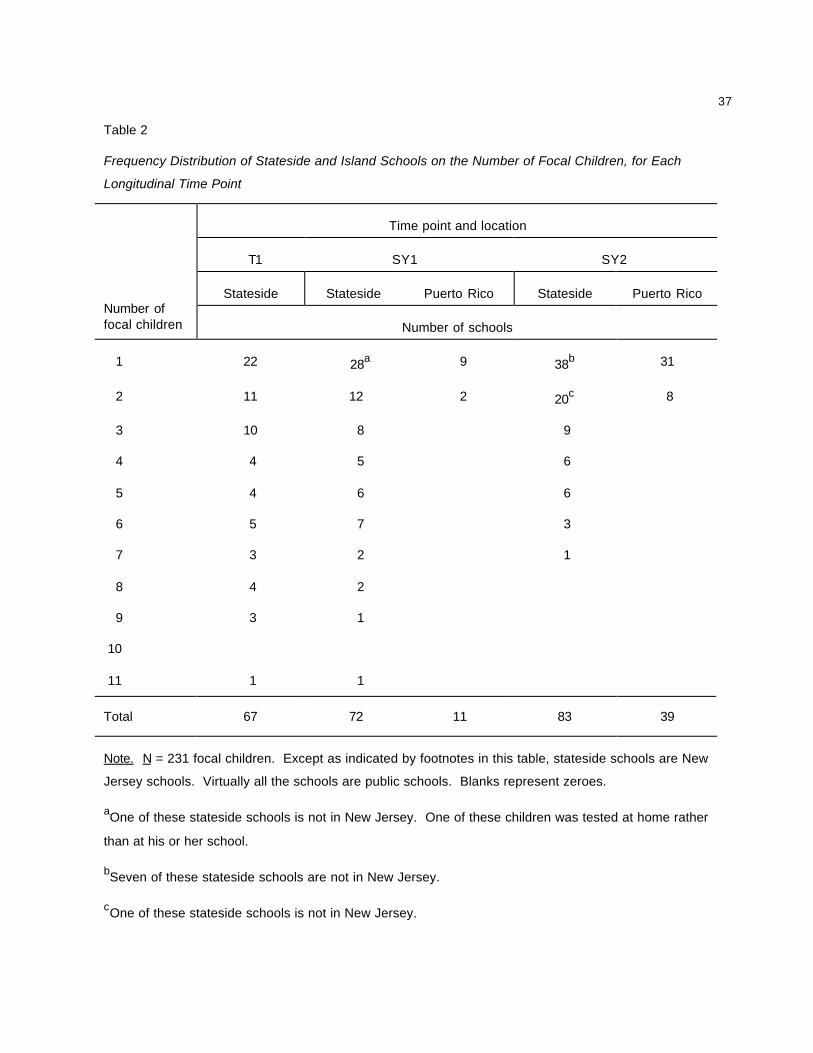
The distribution of the 231 focal children among their initial receiving schools (i.e., at T1)
was as follows. Twenty-two (22) schools each had only one child; 11 schools each had two
children; 10 each had three; four schools each had four children; another four schools each had
five; 15 schools each had 6 to 9 children; and one school had 11 (Table 2). Fifty-eight percent
(57.6%) of the focal children changed schools at least once during their longitudinal span (i.e.,
between the child's T1 and the end of his or her Year 2); specifically, 16.0% changed schools

7
between their T1 and the end of their Year 1; 48.9% changed schools between the end of their
Year 1 and the end of their Year 2 (Appendix A). (The changes include returns to schools in
P.R.). Nearly all who transferred out of their initial receiving schools did so either to other New
Jersey public schools or back to Puerto Rico; thus, almost all the mainland schools in the
present study are New Jersey public schools (Table 2). Because the present study focuses on
a highly specific and relatively small migratory population, the sample size is, again by scientific
standards, exceptionally large.
Variables
School's student body. The following variables characterize the student body of each
school the focal child attended during his or her longitudinal span, in terms of linguistic
composition and level of economic disadvantage. % Native speakers of Spanish is the
percentage of the school's total student body that is native speakers of Spanish. % Monolingual
native speakers of English is the percentage that is monolingual native speakers of English.
% Native speakers of other languages is the percentage that is native speakers of languages
other than English or Spanish. % Limited-English-proficient/English-language learners
(LEP/ELL) is the percentage of the school's total student body that the school's officials formally
classified as limited-English-proficient (LEP) pupils; also called English-language learners, this
classification can be applied only to pupils who are not native speakers of English.
From the longitudinal measurements on these linguistic composition variables, I derived
the stateside student body's Linguistic Composition factor: As described in Table 3, a principal-
components analysis of these measurements yielded a single factor with eigenvalue greater
than one. The regression method of calculating factor scores produced scores for the focal
children based on this unrotated bipolar factor. Focal children with high positive scores on this
Linguistic Composition factor were those whose stateside schools' student bodies had relatively
high proportions of native speakers of Spanish and of LEP/ELL pupils and, conversely, low
proportions of monolingual native speakers of English.
% Subsidized lunch is the percentage of the school's total student body that is eligible for
fully subsidized (i.e., free) lunches. Some measures that are based on meal subsidy
8
information have been criticized because not all pupils eligible for subsidy apply for it (Entwisle
& Astone, 1994). To avoid such measurement error, the present study used the percentage of
subsidy eligible pupils rather than the percentage who receive the subsidy. Some investigators
(e.g., Hauser, 1994) have argued that, because the cost (to the schools) of the lunch subsidy
program is low, so is the cost of classification errors low, a contingency that could limit a
school's care to avoid or correct such errors; they have thus expressed concern about the
precision of measures based on school lunch-subsidy records. Even if proved correct, this
concern would pertain more to the use of those records for measuring individual differences in
students' own household economic status than to their use, as in the present study, in the
aggregate for measuring schools' student bodies. A recent study (Laosa, 1998b) provides
convincing evidence of the validity of the student body measures used in the present study.
% Public assistance is the percentage of the student body who reside with a
householder receiving public assistance (i.e., welfare).9 This measure does not confound any
effects of the welfare-to-work policies enacted during the Clinton presidency, since the data
were collected before the implementation of those policies.
From the longitudinal measurements on these two economic disadvantage variables, I
derived the stateside student bodies' Economic Poverty factor: As Table 4 shows, a principal-
components analysis of these measurements produced a single factor with eigenvalue greater
than one. The regression method of calculating factor scores generated scores for the focal
children based on this unrotated factor. Focal children with high scores on this Economic
Poverty factor were those whose stateside schools had relatively high percentages of pupils
who are eligible for fully subsidized lunch and who reside with householders on public
assistance.
The data on the student bodies were obtained directly from the schools' principals,
primarily through structured questionnaires; however, when necessary, the questionnaire was
supplemented or replaced by telephone calls or site visits to examine school records or to
interview principals or other school staff.

9
Focal child's English-language proficiency. Each focal child took four standardized
English-language proficiency tests at each longitudinal time point, whether stateside or, if the
child had returned to Puerto Rico, on the island. The tests, described below, are from the
Language Assessment Battery (Board of Education of the City of New York, 1982a-d, 1991).
Level 2 of the battery, appropriate for the range of grade levels in the present study, was used.
To avoid or minimize familiarity effects, the two psychometrically parallel forms (Forms A and B)
of each test were used: At each longitudinal time point, a child took one form of each test,
alternating between forms across time points. The time limits are 18, 20, 12, and 8 minutes,
respectively, for each form of the Listening, Reading, Writing, and Speaking tests (Board of
Education of the City of New York, 1982a, c). Each test, intended for use with children who are
not native speakers of English and whose English proficiency may therefore be limited, is
designed to be sensitive to diverse levels of this proficiency and to changes in it over time
(Abbott, 1985; Board of Education of the City of New York, 1991).
The Listening Test (30 items) measures aural comprehension of continuous
English-language discourse. It includes items presented as complete sentences and related to
pictorial content, and items in the form of dictated questions and possible answers.
The Reading Test (36 items) measures proficiency in reading English-language
discourse. It applies a cloze procedure to reading passages.10
The Writing Test (20 items) measures knowledge of selected elements of language
usage that are necessary for proficient English-language writing. Because of the practical
problems involved in scoring writing samples, this test is designed to measure writing
proficiency by means of a multiple-choice procedure that resembles a language usage test
(Abbott, 1985; Board of Education of the City of New York, 1991).
The Speaking Test (26 items) measures speaking proficiency by requiring free oral
responses. The examiner orally presents 13 stimuli (i.e., a question or a request), some of
which refer to pictorial stimuli, in order to elicit multi-word responses, which receive two scores:
one for relevance and one for grammar.

10
Trained examiners administered the tests to the children in their schools according to the
procedures specified in the Examiner's Directions (Board of Education of the City of New York,
1982a, c). As the Directions call for, the Listening Test was administered individually to each
child, and the other three tests were administered either individually or in groups.
Raw scores (i.e., number of items answered correctly) were used in the statistical
analyses. The total English-language proficiency score, or total LAB score, is the sum of the
focal child's raw scores on the four tests. For each of the three longitudinal time points, I
computed a principal-components analysis of the focal children's scores on the four tests; each
analysis yielded a single factor with eigenvalue greater than one (Table 5). These results justified
using the total LAB scores rather than the individual tests' scores in subsequent analyses.
To allow comparisons of the focal children's average scores with those of the U.S.
population of students who are native, proficient speakers of English, I converted the total LAB's
mean raw scores to grade-level percentile ranks, since a percentile rank is the percentage of
students in a specified norms group who scored below a particular raw score (Board of
Education of the City of New York, 1991). For example, if the mean raw score for a sample of
focal children is at the 10th percentile for 3rd-grade norms, then those children, on average,
scored lower than did 90% of the norms group (i.e., a representative sample of the U.S.
mainland's native speakers of English in the 3rd grade).
Reliability analyses had shown that the focal children's test scores are reliable (Laosa,
2000). Kuder-Richardson Formula 20 (KR-20) reliability coefficients,11 computed separately for
each of the six cohort-by-longitudinal-time-point cells (i.e., two grade cohorts at three longitudinal
time points), range (across the six cells) from .89 to .96 for Listening, .91 to .94 for Reading, .85
to .93 for Writing, and .94 to .98 for Speaking; and .97 in each cell for the total LAB.
Focal child's sociodemographic variables. The focal children's sociodemographic
variables were coded or measured as follows for each focal child (some of these variables are
further described elsewhere in the Method section): migration wave (1 = Wave 1, 2 = Wave 2),
grade cohort (3 = 3rd-grade entrant, 4 = 4th-grade entrant), gender (1 = boy, 2 = girl),
chronological age (measured in days, the age on September 1 of his or her Year 1), arrival

11
time-of-year (measured as the number of calendar days elapsed between May 20 of the
academic year preceding the child's Year 1 and the date of his or her transfer-in from Puerto
Rico [i.e., the transfer-in that qualified him or her for sample eligibility]), grade promotion (1 = the
child was retained in grade at the end of his or her Year 1, 2 = promoted), and return migration
to Puerto Rico (1 = the child stayed in schools stateside from his or her T1 until at least the end
of his or her Year 2, 2 = returned to schools in Puerto Rico).
Statistical Analyses
The unit of analysis is the focal child. I used a multiple-regression technique to test the
hypothesized statistical association between focal children's English-language development rate
and characteristics of their stateside schools' student bodies. I then extended this technique in
order to ascertain whether (or the extent to which) focal children's return migration to Puerto
Rico affects their English-language development rate. The multiple-regression analyses were
performed on the subsample of focal children who stayed in schools stateside from their T1 until
at least the end of their Year 1, since a principal objective was to examine the effects of
stateside student bodies; this subsample is 94.4% of the full sample of focal children. (I.e.,
5.6% returned to schools in Puerto Rico before the end of their Year 1; they were, therefore,
excluded from the multiple-regression analyses. Sixteen percent [15.6%] returned to schools in
Puerto Rico at, or generally shortly after, the end of their Year 1; they were included in the
multiple-regression analyses [Table 1].)
Such a regression equation takes the form indicated below (see, e.g., Cohen & Cohen,
1983; Norušis, 1985). The terms to the right of the equality sign represent independent variables--
either single variables or groups (blocks, sets) of variables--which I entered (forced) one at a time
into the equation to evaluate the cumulative effect of each such entry on the dependent variable.
Γt + x = Γt + Φ t, t + y + Ωt, t + y + Θ t + z
Γt + x , the dependent variable, represents later proficiency: the focal child's English-
language proficiency test score at time t + x. First into each equation is Γt , the earlier-
proficiency block, which consists of two variables entered simultaneously: (a) the focal child's
12
performance, at an earlier occasion (t), on the same test as (or on a psychometrically parallel
form of) that used for the dependent variable; and (b) the focal child's arrival time-of-year, which
accounts for whether the child arrived from Puerto Rico relatively early or late in the academic
year. Because this block and the dependent variable thus measure the same proficiency
dimension on different occasions, the analysis will essentially ascertain the effects of
subsequently entered independent variables on the rate of change in, or development of, that
proficiency between those two occasions.
Entered second, Φ t, t + y is a variable representing the level of economic disadvantage of
the student bodies in the stateside schools the focal child attended between his or her earlier
and later proficiency measures. The values on this variable are the focal children's scores on
the stateside student bodies' Economic Poverty factor. (This factor is derived from
measurements of the student bodies in the stateside schools the focal child attended during his
or her Year 1, as described in the Variables section). This independent variable in the analysis
will show the effect of the stateside student bodies' economic disadvantage level on the focal
children's English-language development rate. The analysis will then control for this effect when
calculating the effects of the subsequently entered independent variables.
Third into the equation, Ωt, t + y is a variable representing the linguistic composition of
those student bodies. The values on this variable are the focal children's scores on the
Linguistic Composition factor, derived from measurements of those student bodies (Variables
section). This independent variable will thus show the effect of the stateside student bodies'
linguistic composition on the focal children's English-language development rate. The analysis
will also control for this effect when calculating the effect of the next independent variable, Θ t + z.
Entered last, Θ t + z represents return migration to Puerto Rico. This variable will show
the effect of focal children's return to Puerto Rico on their English-language development rate.
To examine effects separately for each of the two time intervals (i.e., T1-SY1 and SY1-
SY2) as well as for the full longitudinal span (i.e., T1-SY2), I ran the multiple-regression
analyses thrice, varying only the definitions of earlier and later. The initial run, which is for the

13
full span, defines earlier and later as T1 and SY2, respectively. The next run is for the first
interval of that span; therefore, it defines earlier as T1 and later as SY1. The final run, which is
for the second interval, defines earlier and later, respectively, as SY1 and SY2.
Using principal-components analyses to reduce the number of independent variables
prevented the problems of multicollinearity that can occur from substantial intercorrelations
among independent variables. (See Variables section.)
To test for differences among, or between, longitudinal time points, migration waves,
grade cohorts, genders, and locations (mainland versus island)--and for their interactions--I
variously performed, as called for, doubly multivariate, multivariate, or univariate
repeated-measures analyses of covariance or of variance, using as dependent variables the
focal children's English-proficiency scores (controlling for arrival time-of-year) and the student
bodies' linguistic composition and economic poverty measures. Statistics include effect sizes
and confidence intervals. To test for assumptions of particular analytic techniques, I variously
computed such statistics as Box's M (multivariate test for homogeneity of dispersion matrices
across cells of the between-subjects effects); Mauchly's W (sphericity test for the within-subjects
effects); Greenhouse-Geisser, Huynh-Feldt, and lower-bound epsilons (for results requiring
degrees-of-freedom adjustment); F tests of interactions between the covariate and the between-
subjects effects (homogeneity of slopes); and Cochran's C or Bartlett-Box F (univariate test for
homogeneity of variances of dependent variable across cells of the between-subjects effects).
In addition, I had computed Pearson product-moment correlation coefficients to examine
bivariate associations; Kuder-Richardson Formula 20 (KR-20) internal-consistency coefficients
to ascertain the reliability of the test scores; and descriptive statistics for all the variables,
including means (M), standard deviations (SD), skewness values (S), and standard errors of the
mean (SEMean).12
I treated missing data by mean substitution, separately for each of the twelve cells in a
three-by-two-by-two breakdown: three longitudinal time points (T1, SY1, SY2) by two grade
cohorts (third-grade entrants, fourth-grade entrants) by whether the child was attending school
stateside or in Puerto Rico at the particular longitudinal time point (yes, no). That is, a variable's
14
mean for a particular cell replaced that variable's missing values, if any, for that cell. There is no
reason to suspect significant sample bias from missing data.
Results and Conclusions
Tests for Confounding Effects
The intercorrelations among the focal child's six sociodemographic variables are
nonsignificant, thus demonstrating an absence of confounding among gender, grade cohort,
migration wave, arrival time-of-year, grade promotion, and return migration (Table 6). That is to
say, the statistical effect of any one of these variables cannot be attributed to effects of the
others.
Gender Comparisons
Focal boys and girls did not differ significantly either on the measures of their schools'
student bodies or in their own English-proficiency test scores (Appendix B).
Description of the Stateside Student Bodies
School segregation by both linguistic background and economic poverty was intense in
many of the schools the focal children attended stateside. At arrival from Puerto Rico (i.e., at
T1), over one third (i.e., 36.4%) of the focal children enrolled in schools in which native speakers
of Spanish were the majority of the student body, and more than a half enrolled in schools in
which economically impoverished pupils were the majority (Appendix C).
As the means (i.e., average weighted percentages) for the student body variables show,
the average stateside school that the focal children attended at their T1 was one in which native
speakers of Spanish were almost a half of the student body, and monolingual native speakers of
English were the other half; native speakers of other languages were only four percent of the
student body; pupils classified as limited-English-proficient/English-language learners
(LEP/ELL) were a fourth of the student body; pupils eligible for fully subsidized lunch composed
nearly three fourths of the student body; and pupils from families on welfare were a half of the
student body (Appendix C).
There is, however, considerable variability around each of these means, as the standard
deviations and summary frequency distributions demonstrate (Appendix C). That is, although

15
many of the focal children enrolled in stateside schools in which native-Spanish-speaking and
economically impoverished pupils predominated, others did not. For instance, at arrival from
Puerto Rico (i.e., at T1), 19.9% of the focal children enrolled in schools in which native speakers
of Spanish were three quarters or more of the student body, but, as the other tail of the
distribution shows, 14.3% enrolled in schools in which this linguistic group was less than a
quarter of the student body. Similarly, 24.7% enrolled in schools in which pupils from families
on welfare constituted three quarters or more of the student body, but 11.3% enrolled in schools
in which pupils from such families were fewer than a quarter of the student body. In short, the
focal children were distributed among widely diverse stateside schools, ranging from schools
with extremely high concentrations of native-Spanish-speaking and economically impoverished
pupils, to those with a balanced student body, to those with very small proportions of such
pupils.
Approximately a half of the focal children changed stateside schools at least once during
their full longitudinal span (i.e., between the child's T1 and the end of his or her Year 2). Eleven
percent (11.0%) changed stateside schools between their T1 and the end of their Year 1; 40.1%
changed stateside schools between the end of their Year 1 and the end of their Year 2
(Appendix A).
If a focal child changed stateside schools, that transfer was likely between fairly similar
schools. For example, for the variable labeled % native speakers of Spanish, the stateside
means are similar across longitudinal time points: 46.4, 44.3, and 42.6, respectively, at T1, SY1,
and SY2. Similarly, the corresponding standard deviations are practically identical across
longitudinal time points: 23.2, 23.6, and 22.7. Moreover, the variable's cross-time correlations
are of considerable size: .84, .61, and .58, respectively, between T1 and SY1, SY1 and SY2,
and T1 and SY2 (Appendix D). Nevertheless, although such cross-time differences in means as
these are small, they reached statistical significance for the linguistic composition variables,
although not for the economic poverty variables (as shown by doubly multivariate repeated-
measures analyses of variance; Appendix E). Specifically, these longitudinal data show that, on
average, the longer a focal child stayed stateside, the smaller tended to be his or her (stateside)
school's student body's proportion of native speakers of Spanish.

16
Correlation Between Stateside Student Bodies' Linguistic Composition and Economic Poverty
The correlation between the stateside student bodies' Linguistic Composition and
Economic Poverty factors is .22, p < .001 (Appendix F). That is, as expected on the basis of
previous analyses (Laosa, 1998b), the higher a stateside student body's percentages of native-
Spanish-speaking and LEP/ELL pupils, the higher tends to be its proportion of economically
impoverished pupils.
Language Proficiency Level
At arrival from Puerto Rico, the focal children's English-language proficiency was, on
average, very low. That is to say, low relative to the norms for the same-grade population of
native speakers of English in mainland schools. Specifically, at T1, the focal third graders' mean
raw score on the LAB reached only the first percentile for third-grade norms; likewise, the focal
fourth graders' mean reached only the first percentile for fourth-grade norms (Appendix G).
The mean raw scores increased considerably, however, across longitudinal time points,
signifying development of the focal children's English-language proficiency. At T1, SY1, and
SY2, respectively, these means are 21.6, 51.6, and 71.7 for the third-grade-entrant cohort; and
29.9, 60.7, and 78.5 for the fourth-grade entrant (Table 7). For each cohort, these increases are
statistically significant, as demonstrated by repeated-measures analysis of covariance
(Appendix H).
There is again much variability around each mean, as the standard deviations and
summary frequency distributions for these raw scores show. For example, at arrival from
Puerto Rico (i.e., T1), 41% of the third-grade-entrant cohort obtained a raw score lower than 10,
but at the other tail of the same distribution, 15% obtained a raw score of 50 or higher.
Similarly, at the last longitudinal time point (i.e., SY2), 12% scored lower than 40, but 14%
scored 100 or higher (Appendix I). That is, the focal children differed widely from one another in
proficiency at each longitudinal time point. The multiple-regression analyses, reported below,
identified variables that partly account for individual differences in the rate at which the focal
children developed this proficiency.
17
Effects of Stateside Student Bodies on Language Development
Table 8 presents the results of the multiple-regression analysis in which earlier and later
proficiency are the focal child's English-language test scores, respectively, at arrival from Puerto
Rico (T1) and in the spring of the following academic year (SY2). The results are as follows.
Earlier proficiency accounts for a statistically significant percentage of the variance in
later proficiency, as expected. The Economic Poverty factor does not account for additional
variance in later proficiency, but the Linguistic Composition factor's effect is statistically
significant. That is, even after the analysis accounted both for the focal child's English
proficiency at arrival from Puerto Rico (together with the child's arrival time-of-year) and for his
or her stateside student body's level of economic disadvantage, that student body's linguistic
composition has a statistically significant effect on the child's subsequent English proficiency.
Although this effect is small in magnitude, it is in the hypothesized direction, and it reaches a
significance level beyond that originally set for testing it.
It can be concluded that, as predicted, for the focal population, the linguistic composition
of stateside schools' student bodies may influence English-language development. Specifically,
focal children developed English-language proficiency more slowly in stateside schools with
high concentrations of native-Spanish-speaking, limited-English-proficient pupils than in
stateside schools with relatively high concentrations of monolingual native speakers of English.
Returns to Puerto Rico
Six percent (5.6%) of the focal children returned to schools in Puerto Rico before the end
of their Year 1. Of the other 94.4%, 16.5% also returned to schools in Puerto Rico, but they did
so after the end of their Year 1 [but generally well before the end of their Year 2]; Table 1). The
children who returned to schools in Puerto Rico before versus after the end of their Year 1 had
not differed significantly at T1 on any of the study's variables (Appendix J). Four percent (4.1%)
of those who returned to schools in Puerto Rico subsequently came back to stateside schools
before the end of their Year 2 (Table 1).
Schools in Puerto Rico. Virtually all the schools in which focal children enrolled upon
returning to Puerto Rico were secular, public schools, in which English was taught as one of the
18
subjects in an otherwise Spanish-language curriculum. These schools and those they had
attended stateside did not differ significantly in percentage of pupils eligible for subsidized lunch,
but they differed significantly in percentage of pupils from families on welfare (as shown by
doubly multivariate repeated-measures analysis of variance and univariate significance tests;
Appendix K): The mean percentage of pupils from households on welfare was higher for the
student bodies of the schools in Puerto Rico than for those the children had attended stateside.
Effects of Return Migration to Puerto Rico on Language Development
The multiple-regression analyses show the following effects of return migration to Puerto
Rico on the rate of English-language development, after controlling for the stateside student
bodies' economic poverty level and linguistic composition. Step 4 of the multiple-regression
analysis in Table 8 shows a significant effect of return migration to Puerto Rico on English-
language development rate during the entire longitudinal span (i.e., T1-SY2); however, as
Table 9 shows, this effect occurred during the second interval of that time span (i.e., SY1-SY2).
That is, in the interval during which both the focal children who did and those who did not return
to Puerto Rico were stateside, they did not differ significantly in rate of English-language
development (R2 change = .009, p = .078; Table 9, T1-SY1 interval). When those who did
return were back in Puerto Rico, however, their rate declined significantly relative to those
remaining stateside (R2 change = .072, p < .001; Table 9, SY1-SY2 interval).
Specifically, in the interval when all those who had returned to Puerto Rico were there
(i.e., SY1-SY2), they increased their mean English-proficiency scores from 43.2 to 53.6, while
those remaining stateside increased theirs from 59.3 to 80.6 (unadjusted means; Table 7).
Each of these two increases is statistically significant, although one is significantly greater than
the other (as indicated by repeated-measures analyses of covariance; Appendices L and M).
From these results, it can be concluded that generally children who returned to Puerto
Rico after attending stateside schools for about a year did continue to develop their English-
language proficiency in Puerto Rico, but at a significantly slower rate than their counterparts
who remained stateside.

19
Predictors of Return Migration to Puerto Rico
Two variables significantly predicted (p < .01) whether a focal child would return to
schools in Puerto Rico: his or her English-proficiency test performance upon arrival stateside
and his or her stateside school's percentage of pupils eligible for subsidized lunch (Table 10).
That is, the focal children more likely to return to schools in Puerto Rico (than to stay in
stateside schools) were those who had the lower English-language proficiency level and were
attending stateside schools with the higher concentrations of economically impoverished pupils.
Other Results
Grade cohort. The two grade cohorts did not differ significantly with regard to either the
linguistic composition or the economic poverty level of their schools' student bodies (Appendix
B). Similarly, the two grade cohorts did not differ significantly in English-language development
rate; however, they differed significantly in English-language development level (as
demonstrated, respectively, by a nonsignificant Cohort x Longitudinal Occasion interaction and a
significant cohort main effect in a repeated-measures analysis of covariance; Appendix H). That
is, English-language proficiency level at arrival from Puerto Rico was better among those who
arrived as fourth graders than among those who arrived as third graders.
This cross-sectional result is consonant with and extends a conclusion from longitudinal
analyses reported in a previous section. This cross-sectional result shows that some English-
language development had occurred in the third grade in Puerto Rico. A combination of cross-
sectional and longitudinal results leads to the conclusion that children develop some English-
language proficiency in Puerto Rico, before as well as after their stay stateside, although
considerably more slowly than during their stay stateside.
Arrival time-of-year. Focal children arrived (i.e., transferred in) from Puerto Rico
throughout the year--indeed almost every month; however, the vast majority arrived very close
to the academic year's starting date (Table 11). These data are consistent with those from a
previous sample of the same population (Laosa, 1998a). It thus appears that, generally in this
population, families time the migration of their school-age children by the school calendar.
20
As hypothesized, arrival time-of-year had a significant effect on the rate of English-
language development. The closer the child's arrival from Puerto Rico was to the academic
year's start, the faster his or her subsequent rate of English-language development (as shown
by multiple-regression beta weight after all the variables had been entered: standardized beta =
−.102, p < .05, one-tailed test; Table 8, footnote a).
Migration wave. The two consecutive annual migration waves (i.e., Waves 1 and 2) did
not differ significantly in English-language proficiency (as demonstrated by analysis of
covariance; Appendix O). Similarly, the two waves did not differ significantly in economic
poverty level of their schools' student bodies (as shown by multivariate analysis of variance;
Appendix N).
The two waves differed significantly, however, although narrowly, in linguistic
composition of their schools' student bodies (as shown by multivariate analysis of variance and
univariate significance tests; Appendix N): The T1 student bodies' percentage of native
speakers of Spanish and percentage of LEP/ELL were slightly higher for Wave 2, which arrived
stateside 12 months later than did Wave 1. This result accords with nation-wide studies
(reviewed in the introduction) that have reported and projected a trend of increasing segregation
of Hispanic/Latino students in U.S. mainland schools. On the other hand, as reported in a
previous section, results of longitudinal analysis show that in the course of their stay stateside,
focal children tended to move between schools with successively lower percentages of native-
Spanish-speaking pupils. The present study's ability to make this differentiation (i.e., waves of
individuals versus individual's longitudinal time points) illustrates a further advantage of a
research design that incorporates both cross-sectional and longitudinal features.
Grade promotion. The schools' student body variables did not correlate significantly with
whether the schools promoted or retained focal children in grade (Appendix B).
Percentile ranks. During the time that focal children were in stateside schools, their
mean LAB raw scores increased considerably across longitudinal time points, as noted in earlier
sections. Nevertheless, the grade-level percentile ranks for these mean raw scores increased
very little. For example, for the subsample of fourth-grade entrants who stayed stateside during
21
their entire longitudinal span and were promoted in grade during that span, the mean LAB raw
scores at T1, SY1, and SY2 were, respectively, 38.6, 69.0, and 87.3. The first of these means
(38.6), which reflects these focal children's proficiency level at arrival from Puerto Rico, is at the
first percentile for fourth-grade fall norms. The second mean (69.0), which reflects their
proficiency in the spring of the same academic year, is at the fifth percentile for fourth-grade
spring norms. The third mean (87.3), which reflects their proficiency level twelve months later,
reached only the sixth percentile for fifth-grade spring norms (Appendix G). These focal
children had been attending mainland schools for nearly two consecutive academic years by the
time they were about to complete their fifth grade, yet their English-language proficiency level
was still lower than that of 94% of the U.S. fifth-grade population of monolingual native speakers
of English. That is, their class standing was practically identical to that which they had attained
a year earlier, notwithstanding their gain in terms of raw scores.
The focal children's gains in raw scores reflect some absolute increase in their English-
language proficiency, whereas their corresponding gains in percentile ranks express this
absolute increase relative to that which native speakers of English in mainland schools typically
achieve during the particular grade span. This contrast between absolute and relative
attainment reveals a difficult challenge faced by language-minority students and their
educators--a challenge reminiscent of the task faced by King Sisyphus of Corinth in classic
Greek mythology (the Odyssey), who was fated to have to roll a boulder repeatedly up a hill,
only to have it roll down again each time upon reaching the summit.
Discussion
The analysis results clearly confirmed the study's prediction: In the United States,
school segregation of students by linguistic background can affect language-minority students'
English-language development.
While the longstanding public debate concerning school segregation in the United States
continues to focus on race/ethnicity and socioeconomic status, this study demonstrates
considerable school segregation by language in this country, and shows that this linguistic
22
segregation may have consequences for language-minority students' English-language
development rate.
These results are consistent with a theoretical view (Laosa, 1979/1989, 1999) that
regards the development of competence as functional adaptation to specific environments.
That is to say, competence develops partly as a response to a real or perceived need to adapt
to (e.g., learn to function in) a particular environment. Each environment makes its own specific
demands for functional adaptation. Typically, a student arriving from Puerto Rico possesses all
the linguistic skills necessary to interact competently with peers, as well as many opportunities
to do so, in any school with a high concentration of pupils who are native speakers of Spanish.
In such a school, English-language proficiency is only a weak or largely irrelevant element of
that child's social competence. The environmental demands on him or her to develop English-
language proficiency for social adaptation are thus lower in such peer environments than in
schools in which monolingual speakers of English predominate. The theory predicts, therefore,
and the present study empirically confirmed, faster English-language development in the latter
schools.
A practical implication of these findings is that, all else equal, the schools in which a
language-minority child can most rapidly develop English proficiency are those with (a) a
preponderance of pupils who are monolingual, proficient speakers of English and (b) a small
minority to none who are native speakers of the child's native language. Specifically, for a child
arriving stateside from Puerto Rico, the smaller the stateside school's percentage of pupils who
are native speakers of Spanish and whose English proficiency is low (i.e., the larger the
percentage who are monolingual native speakers of English), the faster will likely be the rate of
English-language development. This effect of the student bodies' linguistic composition on
English-language development, although small, was statistically significant. Also, even a small
effect will have a cumulative impact and thus may have serious long-term consequences. That
is, if two children are developing their proficiency at different rates, then their proficiency levels
are diverging; over time, the effect that accounts for this divergence becomes increasingly large.

23
These findings raise questions about educational policies that, intentionally or
unintentionally, would isolate language-minority children from native speakers of English in
order to facilitate those language-minority children's English-language development or
acquisition. The findings suggest that such policies may contribute to the formation of social
contexts (in schools) that could work against the policies' intended effects. I again stress the
qualifying phrase all else equal, indicating a need for attention to potential moderators of the
effects of the linguistic composition of student bodies. For instance, a language-minority child
may well acquire English-language proficiency faster in a high quality educational program that
is especially appropriate for that child than in a poorly implemented or less appropriate program,
regardless of the student body's linguistic composition. Research is needed to identify specific
factors or conditions that can moderate the influence of the linguistic composition of student
bodies.
Although student bodies with very large proportions of monolingual native speakers of
English may indeed accelerate the English-language development of a language-minority child,
which is clearly a desirable effect, a growing fund of biographical, clinical, and theoretical
evidence (reviewed in Laosa, 1999) suggests that such environments may also have
undesirable or even harmful consequences for that child. These consequences include the loss
of native-language fluency and related academic and socio-emotional issues. For instance,
lacking the need or opportunity to use the native language with peers, a child may lose fluency
in it, a loss that may in turn impede normal development of child-family relationships and hence
lead to behavioral, socio-emotional, or academic maladjustment. For children who return to
Puerto Rico, a diminution in Spanish fluency may hinder the resumption of scholastic
competition or social relationships on the island. In short, Can a student-body composition that
facilitates English-language development, which is a clearly desirable outcome, also engender
undesirable consequences, which ought to be weighed when judging what may be best for a
particular child? Empirical research is needed to examine these concerns and answer this
question.
The findings also suggest practical implications for parents--including, for instance,
families who plan to migrate to the states from Puerto Rico. If parents' priorities for their
24
language-minority child include a relatively rapid rate of English-language development, then
they should consider selecting a community or school with a high proportion of native speakers
of English and a low proportion of native speakers of Spanish. For many migrant families,
however, such options are limited.
Most policy debates in the United States about the education of language-minority
students pivot on theories and conjectures about what may facilitate or delay English-language
development. Issues of linguistic segregation rarely enter those debates. Parents, educators,
policy framers, and researchers should be informed of the present findings, including the
accompanying concerns; moreover, studies are needed to explore these same issues in other
cultures, languages, and societies.
25
References
Abbott, M. M. (1985, April). Theoretical considerations in the measurement of the
English-language proficiency of limited-English-proficient students. Paper presented at the
Annual Meeting of the National Council on Measurement in Education, Chicago, IL.
Board of Education of the City of New York. (1982a). Language Assessment
Battery--English, Level 2, Form A: Examiner's directions. New York: Author.
Board of Education of the City of New York. (1982b). Language Assessment
Battery--English, Level 2, Form A: Student booklet. New York: Author.
Board of Education of the City of New York. (1982c). Language Assessment
Battery--English, Level 2, Form B: Examiner's directions. New York: Author.
Board of Education of the City of New York. (1982d). Language Assessment
Battery--English, Level 2, Form B: Student booklet. New York: Author.
Board of Education of the City of New York. (1991). Language Assessment Battery
(LAB) norms booklet--native speakers of English. Forms A and B, grades K-12, fall and spring.
New York: Author.
Cohen, J., & Cohen, P. (1983). Applied multiple regression/correlation analysis for the
behavioral sciences (2nd ed.). Hillsdale/Mahwah, NJ: Erlbaum.
Entwisle, D. R., & Astone, N. M. (1994). Some practical guidelines for measuring youth's
race/ethnicity and socioeconomic status. Child Development, 65, 1521-1540.
Hauser, R. M. (1994). Measuring socioeconomic status in studies of child development.
Child Development, 65, 1541-1545.
Laosa, L. M. (1984). Social policies toward children of diverse ethnic, racial, and
language groups in the United States. In H. W. Stevenson & A. E. Siegel (Eds.), Child
development research and social policy (pp. 1-109). Chicago, IL: University of Chicago Press.
Laosa, L. M. (1989). Social competence in childhood: Toward a developmental,
socioculturally relativistic paradigm. Journal of Applied Developmental Psychology, 10, 447-468.
Reprinted from M. W. Kent & J. E. Rolf (Eds.) (1979), Primary prevention of psychopathology:
26
Vol. 3. Social competence in children (pp. 253-279). Hanover, NH: University Press of New
England.
Laosa, L. M. (1998a). Child migration from Puerto Rico to public and private schools in
the United States: Sampling a difficult-to-reach population (Research Rep. No. 98-24).
Princeton, NJ: Educational Testing Service.
Laosa, L. M. (1998b). School segregation of children who migrate to the United States
from Puerto Rico (Research Rep. No. 98-25). Princeton, NJ: Educational Testing Service.
Laosa, L. M. (1999). Intercultural transitions in human development and education.
Journal of Applied Developmental Psychology, 20(3), 355-406.
Laosa, L. M. (2000). English-language development among children who migrate to the
United States from Puerto Rico: Longitudinal analyses. Unpublished manuscript, Princeton, NJ:
Educational Testing Service.
Laosa, L. M. (n.d.). Psychosocial stress and Hispanic immigrant children's coping and
adaptation to their role as students: Puerto Rican migration. Progress report. Princeton, NJ:
Educational Testing Service.
Lord, F. M., & Novick, M. R. (1968). Statistical theories of mental test scores. Reading,
MA: Addison-Wesley.
Norušis, M. J. (1985). SPSSX advanced statistics guide. New York: McGraw-Hill.
Orfield, G. (1993). The growth of segregation in American schools: Changing patterns of
separation and poverty since 1968. Alexandria, VA: Council of Urban Boards of Education,
National School Boards Association.
Orfield, G., Bachmeier, M., James, D. R., & Eitle, T. (1997). Deepening segregation in
American public schools. Cambridge, MA: Harvard Project on School Desegregation, Harvard
University.
Orfield, G., & Yun, J. T. (1999). Resegregation in American schools. Cambridge, MA:
Civil Rights Project, Harvard University.
27
Pérez, S. M., & Martínez, D. (1993). State of Hispanic America 1993: Toward a Latino
anti-poverty agenda. Washington, DC: National Council of La Raza.
U.S. Bureau of the Census. (1992). 1990 Census of population. General population
characteristics: United States (1990 CP-1-1). Washington, DC: U.S. Government Printing
Office.
U.S. Bureau of the Census. (1993). 1990 Census of population and housing. Population
and housing unit counts: United States (1990 CPH-2-1). Washington, DC: U.S. Government
Printing Office.
U.S. Bureau of the Census. (1994). The Hispanic population in the United States: March
1993 (Current Population Reports, Series P20, No. 475; by P. A. Montgomery). Washington,
DC: U.S. Government Printing Office.
U.S. Department of Education. (1995). Findings from The Condition of
Education 1995: No. 4. The educational progress of Hispanic students (NCES 95-767, by T. M.
Smith). Washington, DC: National Center for Education Statistics, U.S. Government Printing
Office.
28
Author Note
The research presented in this report was made possible in part by research grants from
the William T. Grant Foundation and the Spencer Foundation to the author. The data
presented, the statements made, and the views expressed are solely the responsibility of the
author. This study is part of the author's large-scale longitudinal research project focusing on
children who migrate to the United States from Puerto Rico.
Correspondence concerning this report should be addressed to Luis M. Laosa,
Educational Testing Service, Turnbull Hall, 8-R, Rosedale Road, Princeton, NJ 08541, USA; or
by electronic mail to [email protected].

29
Footnotes
1Of the 50 states of the United States of America, New Jersey has the highest Puerto
Rican population density and the second-largest proportion of the total Puerto Rican population
residing in the states (Pérez & Martínez, 1993; U.S. Bureau of the Census, 1992, 1993).
2For editorial simplicity, the term country is used in this report as if Puerto Rico and the
United States were two distinct countries. Following this usage, the terms United States (U.S.)
and American are used exclusively in reference to the 50 states (and the District of Columbia)
and the people therein. Similarly, the term Hispanic/Latino is used exclusively to refer to the
Hispanic/Latino population of the 50 states (and the District of Columbia). The present usage
does not imply any view regarding Puerto Rico's sociopolitical status, which at present is neither
that of an independent nation nor that of a state of the United States.
3A predominantly minority school is one in which more than half of the school's
combined enrollment is African American, American Indian/Native American, Asian/Pacific
Islander American, or Hispanic/Latino (Orfield, 1993, p. 5).
4Focusing on the schools that the focal children attended stateside, that study (i.e.,
Laosa, 1998b) took the school as the unit of analysis, examining characteristics of the schools
independently of the focal children. In contrast, the present study takes the focal child as the
unit of analysis, focusing principally on relationships between characteristics of that child (e.g.,
English-language proficiency) and characteristics of the schools the particular child attended
(e.g., student body's linguistic composition).
5As used in reference to the data from either study, the term school segregation, or
school isolation, does not necessarily imply that the school boards or other public school
officials caused the observed ethnic/racial, linguistic, or socioeconomic segregation.
6If a child's test administration at T1 coincided with that at SY1 (i.e., if that child's T1 and
SY1 test administrations were scheduled within approximately two months of each other), one
and not the other was conducted. This situation occurred only rarely, however, because nearly
all the children transferred in from Puerto Rico during the early part of the academic year (Table
30
11). For the very few children for whom T1 coincided with SY1, the analyses treat their Year 1
scores as both T1 and SY1 data. These cases are so few (Table 11) that there is no reason to
suspect any effect on the analysis results.
7This study focuses on public and not private schools because a previous study (Laosa,
1998a) showed that of the total population of elementary-school transfers-in from Puerto Rico to
New Jersey, only a tiny proportion are transfers-in to non-public schools.
8More specifically, schools with at least one 3rd- or 4th-grade class.
9Consistent with the usage adopted by the U.S. Bureau of the Census, the term
householder (rather than head of household) is used in the presentation of data that had
previously been presented with the designation head (e.g., U.S. Bureau of the Census, 1994,
p. A-2).
10In a cloze procedure, each reading passage is presented with every nth word deleted.
The test-taker identifies words that appropriately replace the missing ones.
11A Kuder-Richardson Formula 20 (KR-20) coefficient can range in magnitude from 0 to
1.00. If there is no error of measurement, the magnitude will be 1.00 (virtually never realized in
practice); if all the variation in the measurements is the result of errors of measurement, the
magnitude will be zero. Some items in the Reading and Speaking tests might not fully meet the
assumption of measurement independence, in which case a slight inflation may occur in their
reliability estimates. Measurement independence refers to the assumption that a correct
response to an item will not depend on the examinee's having responded correctly to another
item in the same test (Lord & Novick, 1968).
12The standard error of the mean (not to be confused with the standard error of
measurement) is an estimate of the standard deviation of the sampling distribution for the mean.
That is, the means of a very large number of successive samples randomly drawn from the focal
population will form, in theory, a normal distribution centered on the true mean for the population;
the standard deviation of this sampling distribution is the standard error of the mean.
31
Tables and Appendices

32
List of Tables
Table 1 Descriptive Statistics for the Focal Children's Sociodemographic Variables
Table 2 Frequency Distribution of Stateside and Island Schools on the Number of FocalChildren, for Each Longitudinal Time Point
Table 3 Linguistic Composition Measures of the Focal Children's Stateside Schools'Student Bodies at the First Two Longitudinal Time Points: Contemporaneous andCross-Time Intercorrelations, Principal-Components Analysis, and DescriptiveStatistics
Table 4 Economic Poverty Measures of the Focal Children's Stateside Schools' StudentBodies at the First Two Longitudinal Time Points: Contemporaneous and Cross-Time Intercorrelations, Principal-Components Analysis, and Descriptive Statistics
Table 5 Focal Children's English-Proficiency Test Scores at Each Longitudinal TimePoint: Cross-Time Correlations, Contemporaneous Intercorrelations, Principal-Components Analyses, and Descriptive Statistics
Table 6 Intercorrelations Among the Focal Children's Sociodemographic Variables
Table 7 Descriptive Statistics for the Focal Children's Total LAB Scores, by Grade Cohortand Longitudinal Time Point, for the Full Sample and Selected Subsamples
Table 8 Multiple-Regression Analysis for the Full Longitudinal Span (I.e., T1-SY2):Regression of SY2 Proficiency on the Arrival Time-of-Year, T1 Proficiency, theT1 and SY1 Stateside Schools' Student-Body Factors, and Return Migration toPuerto Rico
Table 9 Effect of Return Migration to Puerto Rico for Each Time Interval of the FullLongitudinal Span: Step 4 of Two Multiple-Regression Analyses
Table 10 Predictors of Return Migration to Puerto Rico: Predictive Correlations BetweenT1 Measures and Return Migration
Table 11 Frequency Distribution of Focal Children by Month of Arrival, for Each of TwoAnnual Migration Waves
33
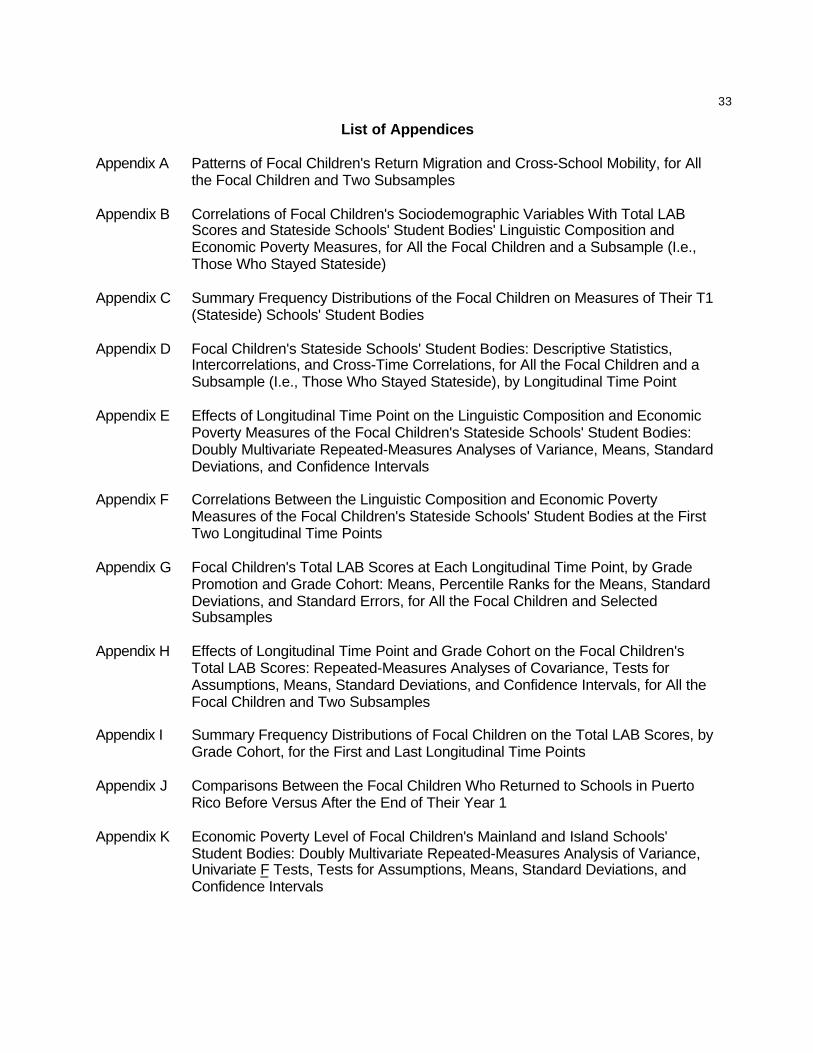
List of Appendices
Appendix A Patterns of Focal Children's Return Migration and Cross-School Mobility, for Allthe Focal Children and Two Subsamples
Appendix B Correlations of Focal Children's Sociodemographic Variables With Total LABScores and Stateside Schools' Student Bodies' Linguistic Composition andEconomic Poverty Measures, for All the Focal Children and a Subsample (I.e.,Those Who Stayed Stateside)
Appendix C Summary Frequency Distributions of the Focal Children on Measures of Their T1(Stateside) Schools' Student Bodies
Appendix D Focal Children's Stateside Schools' Student Bodies: Descriptive Statistics,Intercorrelations, and Cross-Time Correlations, for All the Focal Children and aSubsample (I.e., Those Who Stayed Stateside), by Longitudinal Time Point
Appendix E Effects of Longitudinal Time Point on the Linguistic Composition and EconomicPoverty Measures of the Focal Children's Stateside Schools' Student Bodies:Doubly Multivariate Repeated-Measures Analyses of Variance, Means, StandardDeviations, and Confidence Intervals
Appendix F Correlations Between the Linguistic Composition and Economic PovertyMeasures of the Focal Children's Stateside Schools' Student Bodies at the FirstTwo Longitudinal Time Points
Appendix G Focal Children's Total LAB Scores at Each Longitudinal Time Point, by GradePromotion and Grade Cohort: Means, Percentile Ranks for the Means, StandardDeviations, and Standard Errors, for All the Focal Children and SelectedSubsamples
Appendix H Effects of Longitudinal Time Point and Grade Cohort on the Focal Children'sTotal LAB Scores: Repeated-Measures Analyses of Covariance, Tests forAssumptions, Means, Standard Deviations, and Confidence Intervals, for All theFocal Children and Two Subsamples
Appendix I Summary Frequency Distributions of Focal Children on the Total LAB Scores, byGrade Cohort, for the First and Last Longitudinal Time Points
Appendix J Comparisons Between the Focal Children Who Returned to Schools in PuertoRico Before Versus After the End of Their Year 1
Appendix K Economic Poverty Level of Focal Children's Mainland and Island Schools'Student Bodies: Doubly Multivariate Repeated-Measures Analysis of Variance,Univariate F Tests, Tests for Assumptions, Means, Standard Deviations, andConfidence Intervals
34
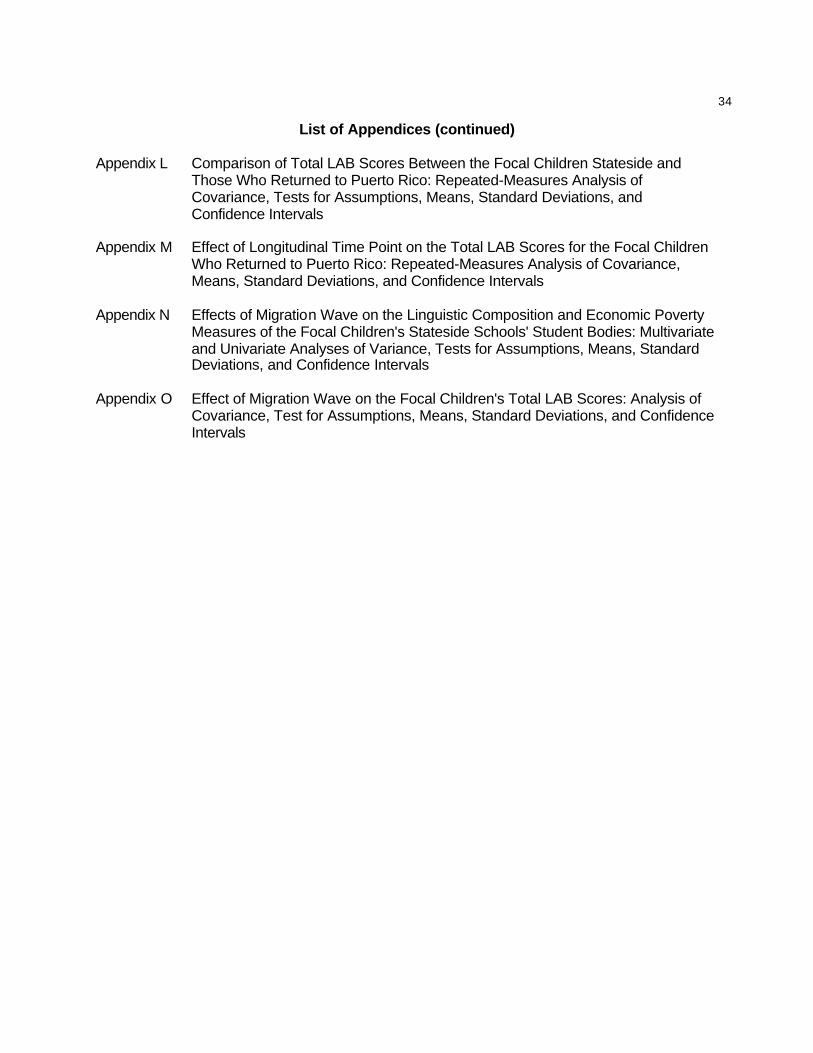
List of Appendices (continued)
Appendix L Comparison of Total LAB Scores Between the Focal Children Stateside andThose Who Returned to Puerto Rico: Repeated-Measures Analysis ofCovariance, Tests for Assumptions, Means, Standard Deviations, andConfidence Intervals
Appendix M Effect of Longitudinal Time Point on the Total LAB Scores for the Focal ChildrenWho Returned to Puerto Rico: Repeated-Measures Analysis of Covariance,Means, Standard Deviations, and Confidence Intervals
Appendix N Effects of Migration Wave on the Linguistic Composition and Economic PovertyMeasures of the Focal Children's Stateside Schools' Student Bodies: Multivariateand Univariate Analyses of Variance, Tests for Assumptions, Means, StandardDeviations, and Confidence Intervals
Appendix O Effect of Migration Wave on the Focal Children's Total LAB Scores: Analysis ofCovariance, Test for Assumptions, Means, Standard Deviations, and ConfidenceIntervals
35
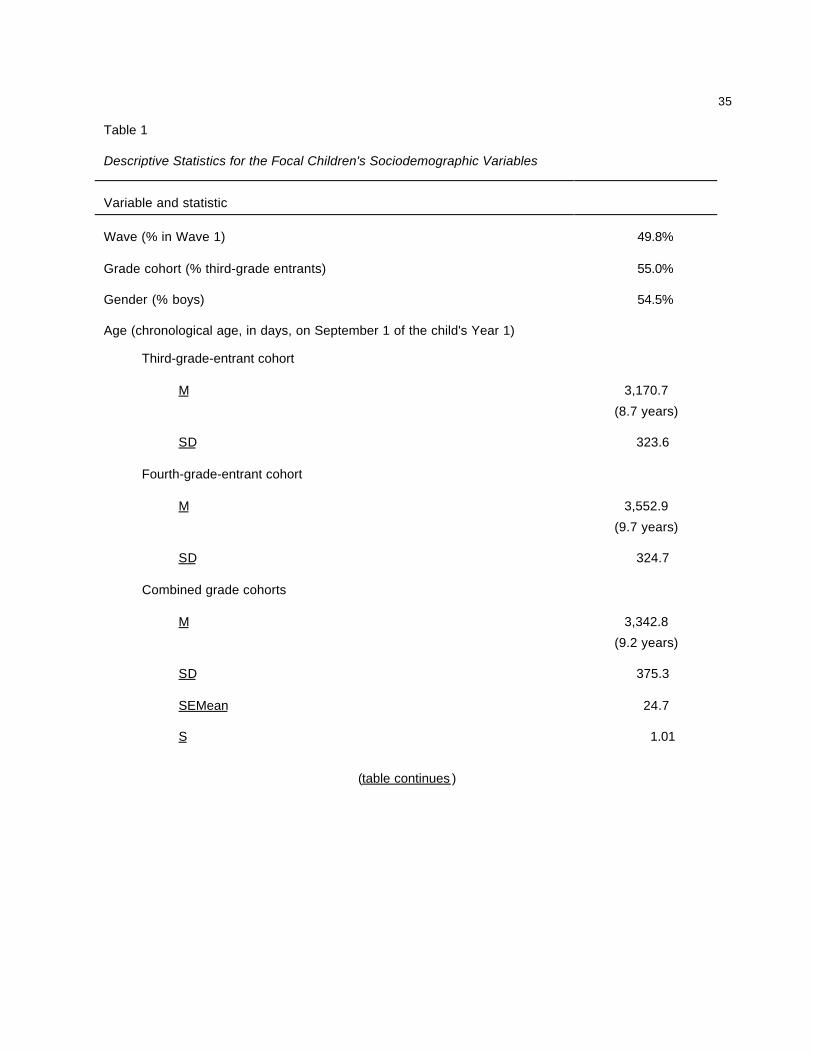
Table 1
Descriptive Statistics for the Focal Children's Sociodemographic Variables
Variable and statistic
Wave (% in Wave 1) 49.8%
Grade cohort (% third-grade entrants) 55.0%
Gender (% boys) 54.5%
Age (chronological age, in days, on September 1 of the child's Year 1)
Third-grade-entrant cohort
M 3,170.7
(8.7 years)
SD 323.6
Fourth-grade-entrant cohort
M 3,552.9
(9.7 years)
SD 324.7
Combined grade cohorts
M 3,342.8
(9.2 years)
SD 375.3
SEMean 24.7
S 1.01
(table continues )
36
Table 1 continued
Variable and statistic
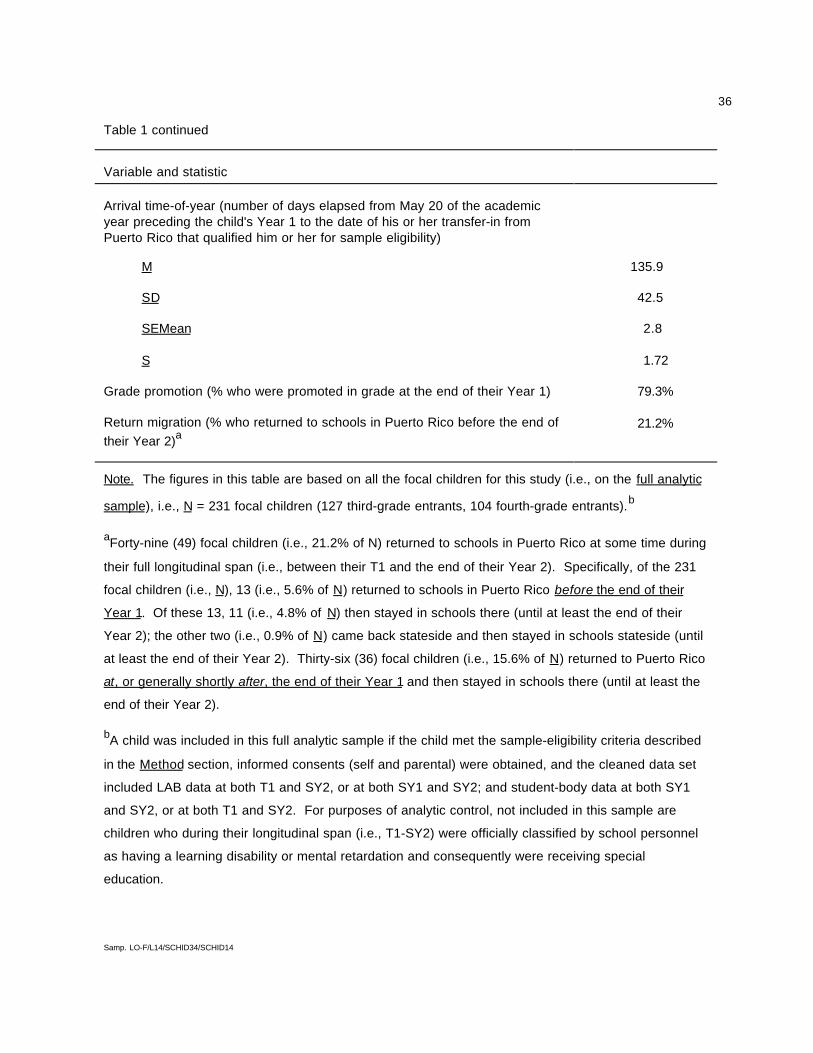
Arrival time-of-year (number of days elapsed from May 20 of the academicyear preceding the child's Year 1 to the date of his or her transfer-in fromPuerto Rico that qualified him or her for sample eligibility)
M 135.9
SD 42.5
SEMean 2.8
S 1.72
Grade promotion (% who were promoted in grade at the end of their Year 1) 79.3%
Return migration (% who returned to schools in Puerto Rico before the end oftheir Year 2)a
21.2%
Note. The figures in this table are based on all the focal children for this study (i.e., on the full analytic
sample), i.e., N = 231 focal children (127 third-grade entrants, 104 fourth-grade entrants).b
aForty-nine (49) focal children (i.e., 21.2% of N) returned to schools in Puerto Rico at some time during
their full longitudinal span (i.e., between their T1 and the end of their Year 2). Specifically, of the 231
focal children (i.e., N), 13 (i.e., 5.6% of N) returned to schools in Puerto Rico before the end of their
Year 1. Of these 13, 11 (i.e., 4.8% of N) then stayed in schools there (until at least the end of their
Year 2); the other two (i.e., 0.9% of N) came back stateside and then stayed in schools stateside (until
at least the end of their Year 2). Thirty-six (36) focal children (i.e., 15.6% of N) returned to Puerto Rico
at, or generally shortly after, the end of their Year 1 and then stayed in schools there (until at least the
end of their Year 2).
bA child was included in this full analytic sample if the child met the sample-eligibility criteria described
in the Method section, informed consents (self and parental) were obtained, and the cleaned data set
included LAB data at both T1 and SY2, or at both SY1 and SY2; and student-body data at both SY1
and SY2, or at both T1 and SY2. For purposes of analytic control, not included in this sample are
children who during their longitudinal span (i.e., T1-SY2) were officially classified by school personnel
as having a learning disability or mental retardation and consequently were receiving special
education.
Samp. LO-F/L14/SCHID34/SCHID14
37
Table 2
Frequency Distribution of Stateside and Island Schools on the Number of Focal Children, for Each
Longitudinal Time Point
Time point and location
T1 SY1 SY2
Stateside Stateside Puerto Rico Stateside Puerto RicoNumber offocal children Number of schools
1 22 28a 9 38b 31
2 11 12 2 20c 8
3 10 8 9
4 4 5 6
5 4 6 6
6 5 7 3
7 3 2 1
8 4 2
9 3 1
10
11 1 1
Total 67 72 11 83 39
Note. N = 231 focal children. Except as indicated by footnotes in this table, stateside schools are New
Jersey schools. Virtually all the schools are public schools. Blanks represent zeroes.
aOne of these stateside schools is not in New Jersey. One of these children was tested at home rather
than at his or her school.
bSeven of these stateside schools are not in New Jersey.
cOne of these stateside schools is not in New Jersey.
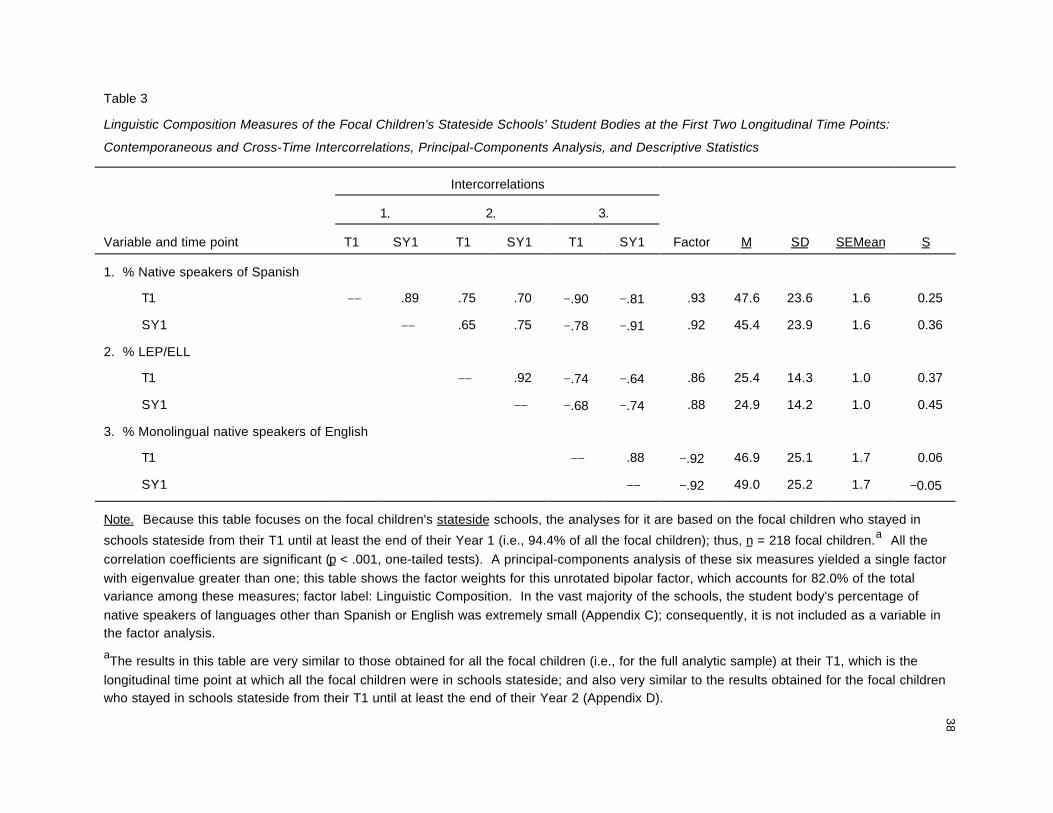
38Table 3
Linguistic Composition Measures of the Focal Children's Stateside Schools' Student Bodies at the First Two Longitudinal Time Points:
Contemporaneous and Cross-Time Intercorrelations, Principal-Components Analysis, and Descriptive Statistics
Intercorrelations
1. 2. 3.
Variable and time point T1 SY1 T1 SY1 T1 SY1 Factor M SD SEMean S
1. % Native speakers of Spanish
T1 −− .89 .75 .70 −.90 −.81 .93 47.6 23.6 1.6 0.25
SY1 −− .65 .75 −.78 −.91 .92 45.4 23.9 1.6 0.36
2. % LEP/ELL
T1 −− .92 −.74 −.64 .86 25.4 14.3 1.0 0.37
SY1 −− −.68 −.74 .88 24.9 14.2 1.0 0.45
3. % Monolingual native speakers of English
T1 −− .88 −.92 46.9 25.1 1.7 0.06
SY1 −− −.92 49.0 25.2 1.7 −0.05
Note. Because this table focuses on the focal children's stateside schools, the analyses for it are based on the focal children who stayed in
schools stateside from their T1 until at least the end of their Year 1 (i.e., 94.4% of all the focal children); thus, n = 218 focal children.a All thecorrelation coefficients are significant (p < .001, one-tailed tests). A principal-components analysis of these six measures yielded a single factorwith eigenvalue greater than one; this table shows the factor weights for this unrotated bipolar factor, which accounts for 82.0% of the totalvariance among these measures; factor label: Linguistic Composition. In the vast majority of the schools, the student body's percentage ofnative speakers of languages other than Spanish or English was extremely small (Appendix C); consequently, it is not included as a variable inthe factor analysis.
aThe results in this table are very similar to those obtained for all the focal children (i.e., for the full analytic sample) at their T1, which is thelongitudinal time point at which all the focal children were in schools stateside; and also very similar to the results obtained for the focal childrenwho stayed in schools stateside from their T1 until at least the end of their Year 2 (Appendix D).
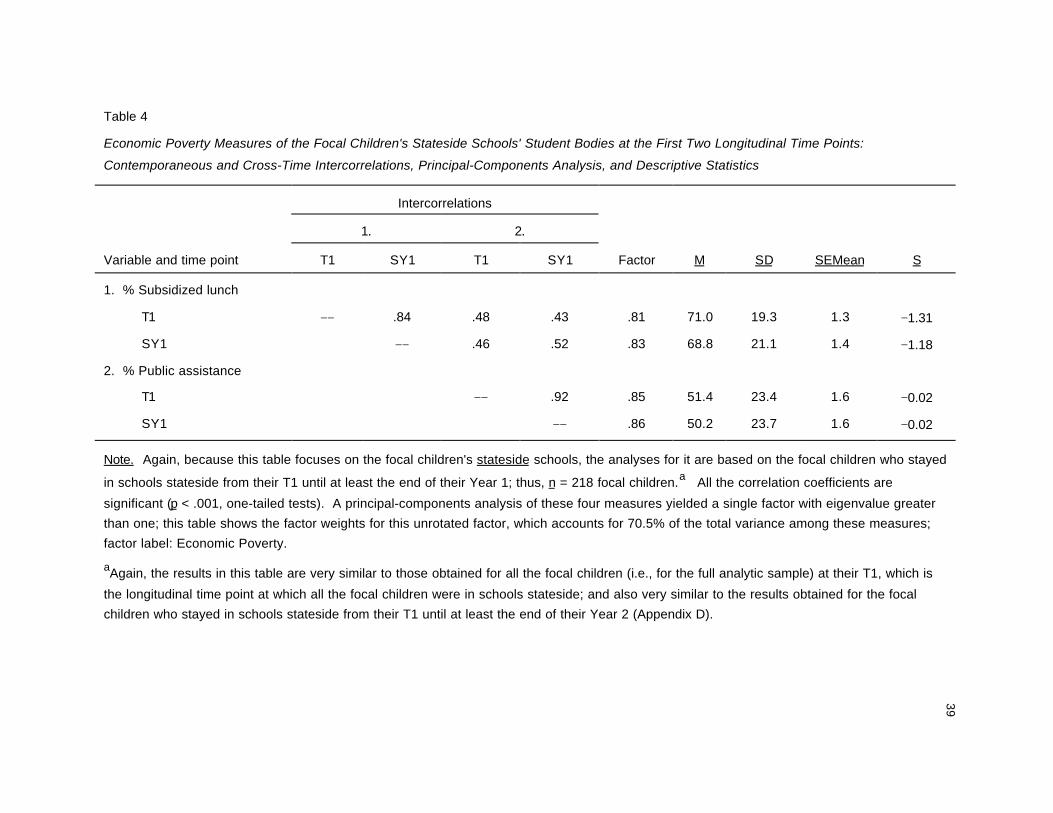
39Table 4
Economic Poverty Measures of the Focal Children's Stateside Schools' Student Bodies at the First Two Longitudinal Time Points:
Contemporaneous and Cross-Time Intercorrelations, Principal-Components Analysis, and Descriptive Statistics
Intercorrelations
1. 2.
Variable and time point T1 SY1 T1 SY1 Factor M SD SEMean S
1. % Subsidized lunch
T1 −− .84 .48 .43 .81 71.0 19.3 1.3 −1.31
SY1 −− .46 .52 .83 68.8 21.1 1.4 −1.18
2. % Public assistance
T1 −− .92 .85 51.4 23.4 1.6 −0.02
SY1 −− .86 50.2 23.7 1.6 −0.02
Note. Again, because this table focuses on the focal children's stateside schools, the analyses for it are based on the focal children who stayed
in schools stateside from their T1 until at least the end of their Year 1; thus, n = 218 focal children.a All the correlation coefficients are
significant (p < .001, one-tailed tests). A principal-components analysis of these four measures yielded a single factor with eigenvalue greater
than one; this table shows the factor weights for this unrotated factor, which accounts for 70.5% of the total variance among these measures;
factor label: Economic Poverty.
aAgain, the results in this table are very similar to those obtained for all the focal children (i.e., for the full analytic sample) at their T1, which is
the longitudinal time point at which all the focal children were in schools stateside; and also very similar to the results obtained for the focal
children who stayed in schools stateside from their T1 until at least the end of their Year 2 (Appendix D).

40Table 5
Focal Children's English-Proficiency Test Scores at Each Longitudinal Time Point: Cross-Time Correlations, Contemporaneous
Intercorrelations, Principal-Components Analyses, and Descriptive Statistics
Cross-time correlations
Score T1-SY1 SY1-SY2 T1-SY2
Listening .57 .55 .31
Reading .45 .46 .28
Writing .50 .60 .34
Speaking .56 .47 .25
Total LAB .60 .60 .37
Factor .60 .62 .36
Intercorrelations
Score at T1 1. 2. 3. 4. 5.
Factor(85.8% variance) M SD SEMean S
1. Listening −− .82 .80 .80 .91 .92 10.0 8.9 0.6 0.49
2. Reading −− .89 .75 .91 .94 6.0 6.8 0.5 1.18
3. Writing −− .80 .91 .94 3.8 4.7 0.3 1.42
4. Speaking −− .92 .90 5.8 7.4 0.5 1.38
5. Total LAB −− 25.5 25.4 1.7 1.04
(table continues )
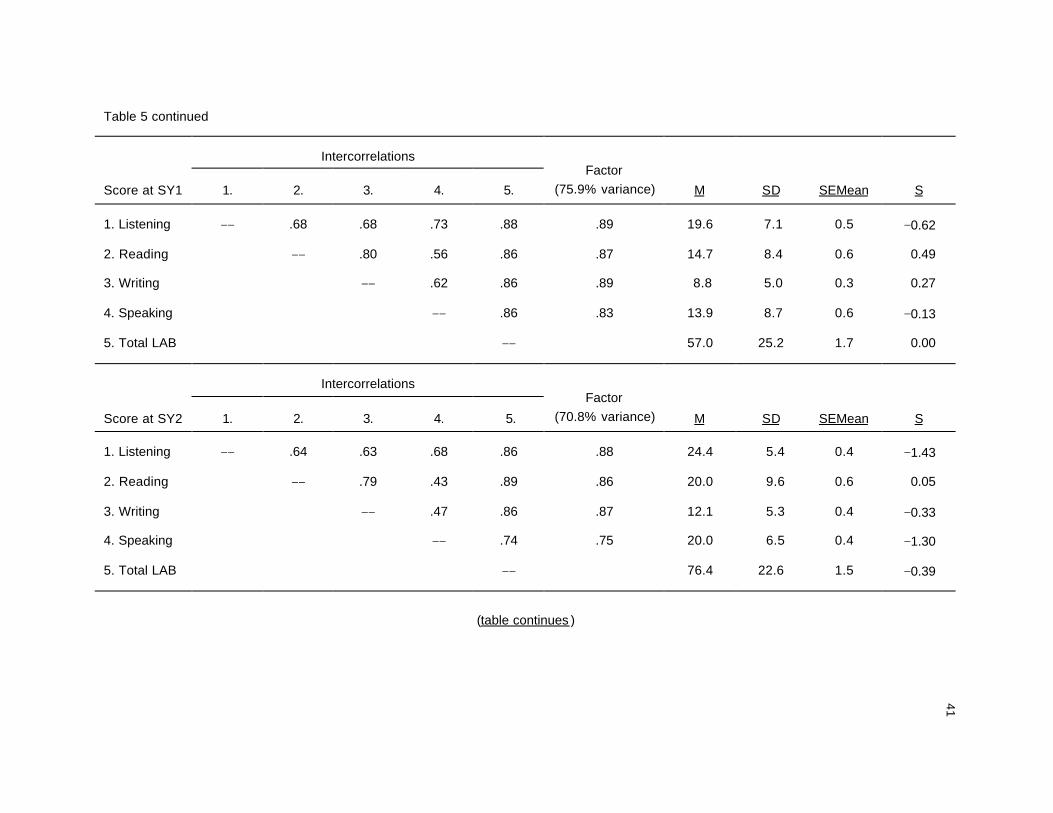
41Table 5 continued
Intercorrelations
Score at SY1 1. 2. 3. 4. 5.
Factor(75.9% variance) M SD SEMean S
1. Listening −− .68 .68 .73 .88 .89 19.6 7.1 0.5 −0.62
2. Reading −− .80 .56 .86 .87 14.7 8.4 0.6 0.49
3. Writing −− .62 .86 .89 8.8 5.0 0.3 0.27
4. Speaking −− .86 .83 13.9 8.7 0.6 −0.13
5. Total LAB −− 57.0 25.2 1.7 0.00
Intercorrelations
Score at SY2 1. 2. 3. 4. 5.
Factor(70.8% variance) M SD SEMean S
1. Listening −− .64 .63 .68 .86 .88 24.4 5.4 0.4 −1.43
2. Reading −− .79 .43 .89 .86 20.0 9.6 0.6 0.05
3. Writing −− .47 .86 .87 12.1 5.3 0.4 −0.33
4. Speaking −− .74 .75 20.0 6.5 0.4 −1.30
5. Total LAB −− 76.4 22.6 1.5 −0.39
(table continues )

42Table 5 continued
Note. Corresponding to the focus of the multiple-regression analyses (Tables 8 and 9), the analyses for this table are based on the focal
children who stayed in schools stateside from their T1 until at least the end of their Year 1; thus, n = 218 focal children. All the correlation
coefficients are significant (p < .001, one-tailed tests). A principal-components analysis of the four LAB tests' scores was performed at each
longitudinal point; each of these three analyses yielded a single factor with eigenvalue greater than one; this table shows the factor weights for
each of these unrotated factors and the percentage of total variance that each factor accounts for. LAB = Language Assessment Battery.
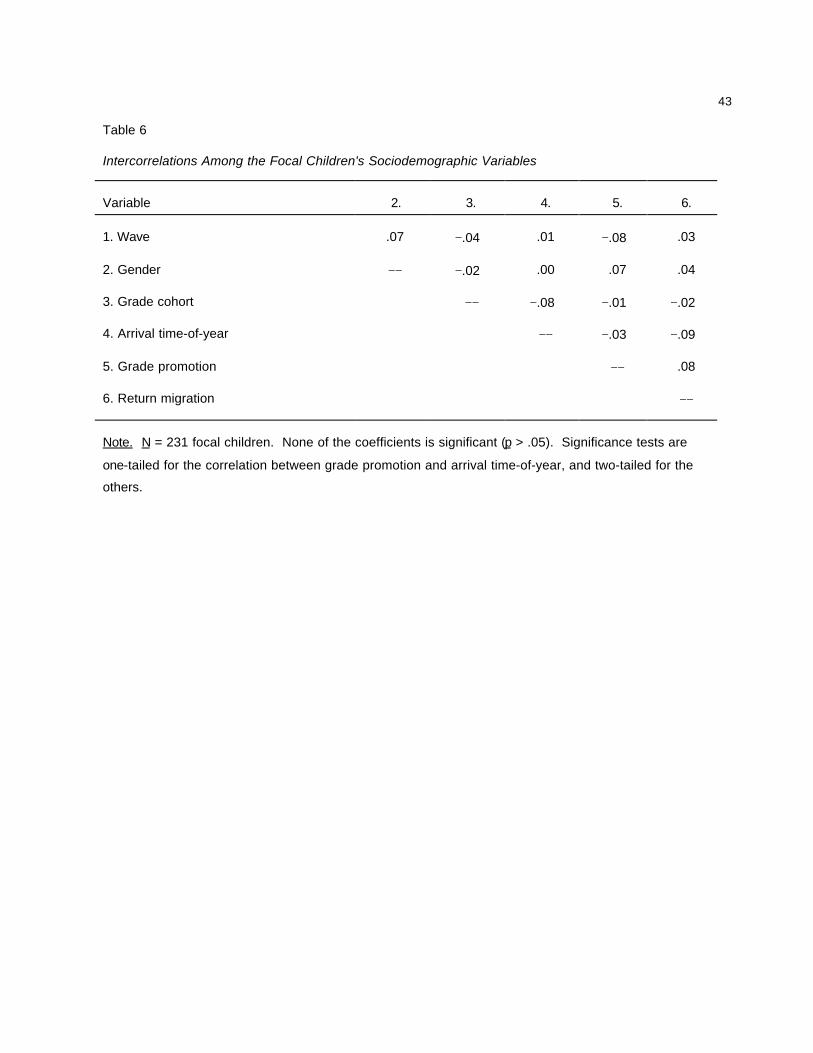
43
Table 6
Intercorrelations Among the Focal Children's Sociodemographic Variables
Variable 2. 3. 4. 5. 6.
1. Wave .07 −.04 .01 −.08 .03
2. Gender −− −.02 .00 .07 .04
3. Grade cohort −− −.08 −.01 −.02
4. Arrival time-of-year −− −.03 −.09
5. Grade promotion −− .08
6. Return migration −−
Note. N = 231 focal children. None of the coefficients is significant (p > .05). Significance tests are
one-tailed for the correlation between grade promotion and arrival time-of-year, and two-tailed for the
others.
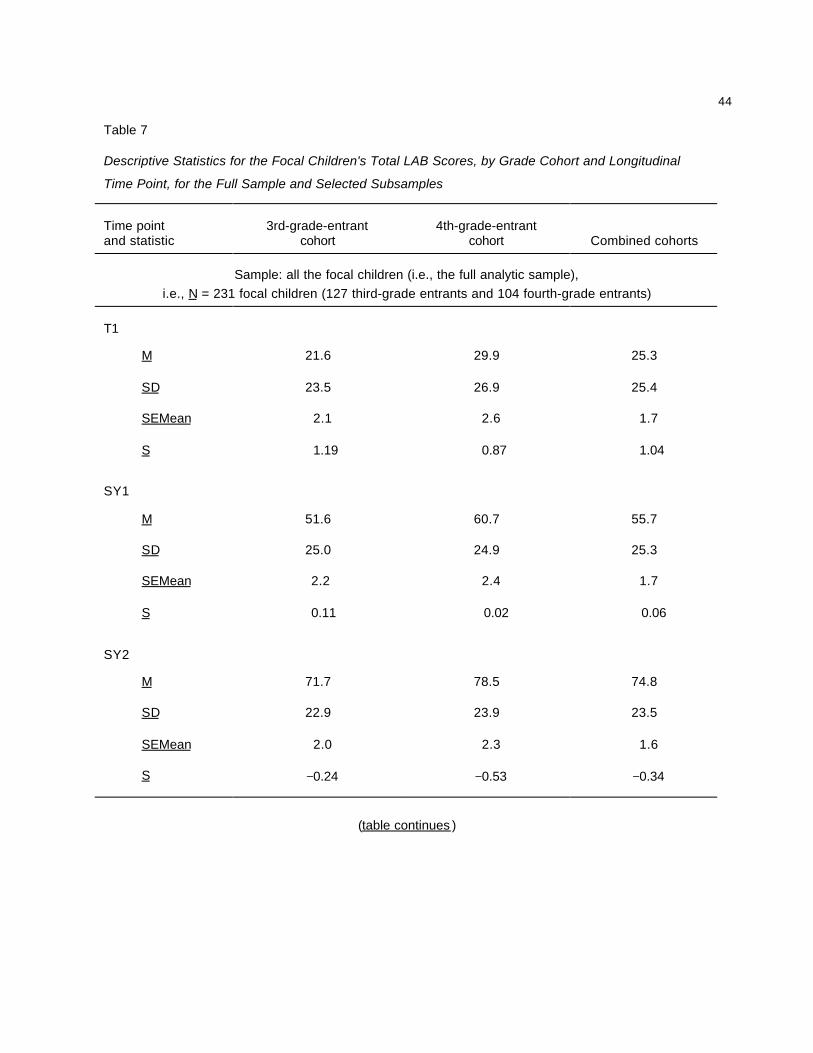
44
Table 7
Descriptive Statistics for the Focal Children's Total LAB Scores, by Grade Cohort and Longitudinal
Time Point, for the Full Sample and Selected Subsamples
Time pointand statistic
3rd-grade-entrantcohort
4th-grade-entrantcohort Combined cohorts
Sample: all the focal children (i.e., the full analytic sample),i.e., N = 231 focal children (127 third-grade entrants and 104 fourth-grade entrants)
T1
M 21.6 29.9 25.3
SD 23.5 26.9 25.4
SEMean 2.1 2.6 1.7
S 1.19 0.87 1.04
SY1
M 51.6 60.7 55.7
SD 25.0 24.9 25.3
SEMean 2.2 2.4 1.7
S 0.11 0.02 0.06
SY2
M 71.7 78.5 74.8
SD 22.9 23.9 23.5
SEMean 2.0 2.3 1.6
S −0.24 −0.53 −0.34
(table continues )

45
Table 7 continued
Time pointand statistic
3rd-grade-entrantcohort
4th-grade-entrantcohort Combined cohorts
Subsample: the focal children who stayed in schools statesidefrom their T1 until at least the end of their Year 1;
thus, n = 218 focal children (120 third-grade entrants and 98 fourth-grade entrants)
T1
M 22.4 29.3 25.5
SD 23.8 26.9 25.4
SEMean 2.2 2.7 1.7
S 1.14 0.93 1.04
SY1
M 53.0 61.9 57.0
SD 24.9 24.8 25.2
SEMean 2.3 2.5 1.7
S 0.03 −0.03 0.00
SY2
M 73.8 79.7 76.4
SD 21.6 23.4 22.6
SEMean 2.0 2.4 1.5
S −0.25 −0.61 −0.39
(table continues )
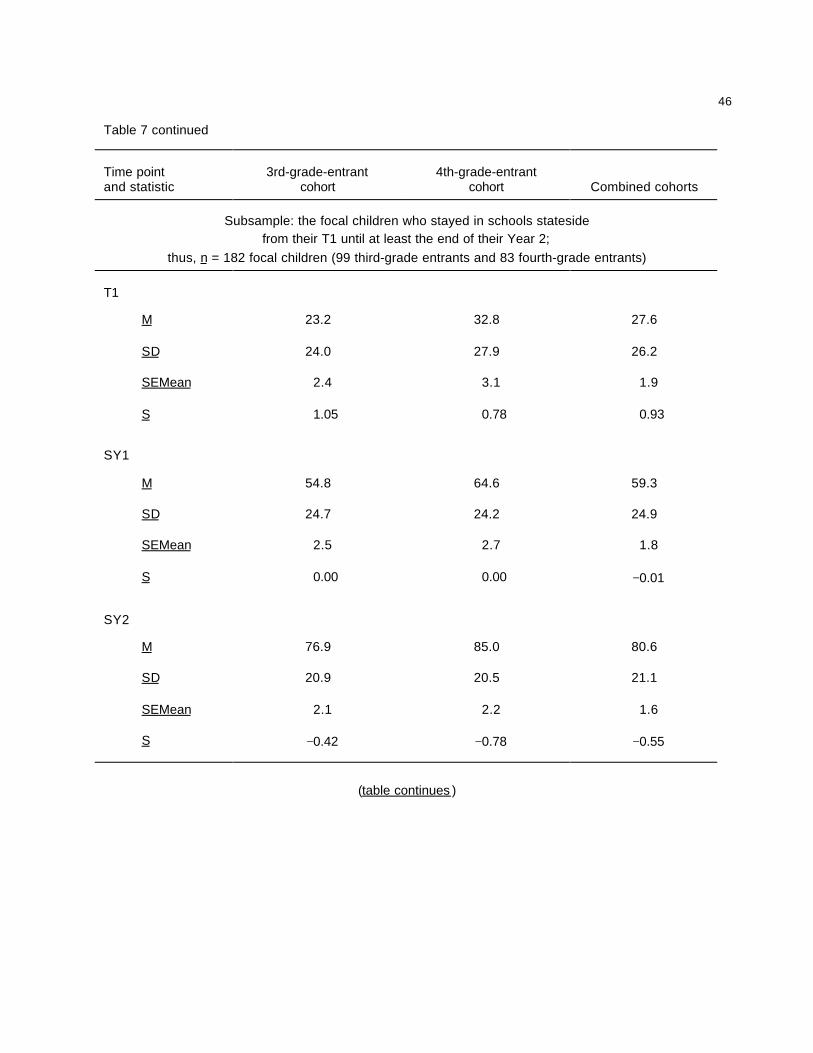
46
Table 7 continued
Time pointand statistic
3rd-grade-entrantcohort
4th-grade-entrantcohort Combined cohorts
Subsample: the focal children who stayed in schools statesidefrom their T1 until at least the end of their Year 2;
thus, n = 182 focal children (99 third-grade entrants and 83 fourth-grade entrants)
T1
M 23.2 32.8 27.6
SD 24.0 27.9 26.2
SEMean 2.4 3.1 1.9
S 1.05 0.78 0.93
SY1
M 54.8 64.6 59.3
SD 24.7 24.2 24.9
SEMean 2.5 2.7 1.8
S 0.00 0.00 −0.01
SY2
M 76.9 85.0 80.6
SD 20.9 20.5 21.1
SEMean 2.1 2.2 1.6
S −0.42 −0.78 −0.55
(table continues )
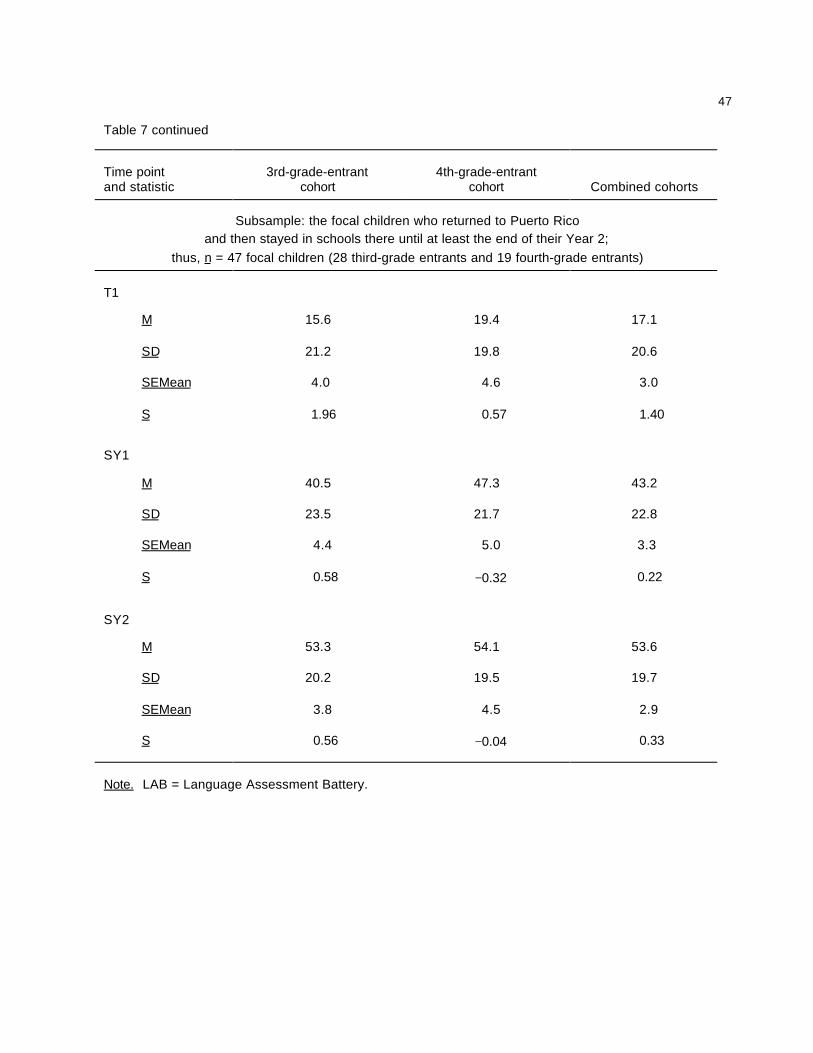
47
Table 7 continued
Time pointand statistic
3rd-grade-entrantcohort
4th-grade-entrantcohort Combined cohorts
Subsample: the focal children who returned to Puerto Ricoand then stayed in schools there until at least the end of their Year 2;
thus, n = 47 focal children (28 third-grade entrants and 19 fourth-grade entrants)
T1
M 15.6 19.4 17.1
SD 21.2 19.8 20.6
SEMean 4.0 4.6 3.0
S 1.96 0.57 1.40
SY1
M 40.5 47.3 43.2
SD 23.5 21.7 22.8
SEMean 4.4 5.0 3.3
S 0.58 −0.32 0.22
SY2
M 53.3 54.1 53.6
SD 20.2 19.5 19.7
SEMean 3.8 4.5 2.9
S 0.56 −0.04 0.33
Note. LAB = Language Assessment Battery.
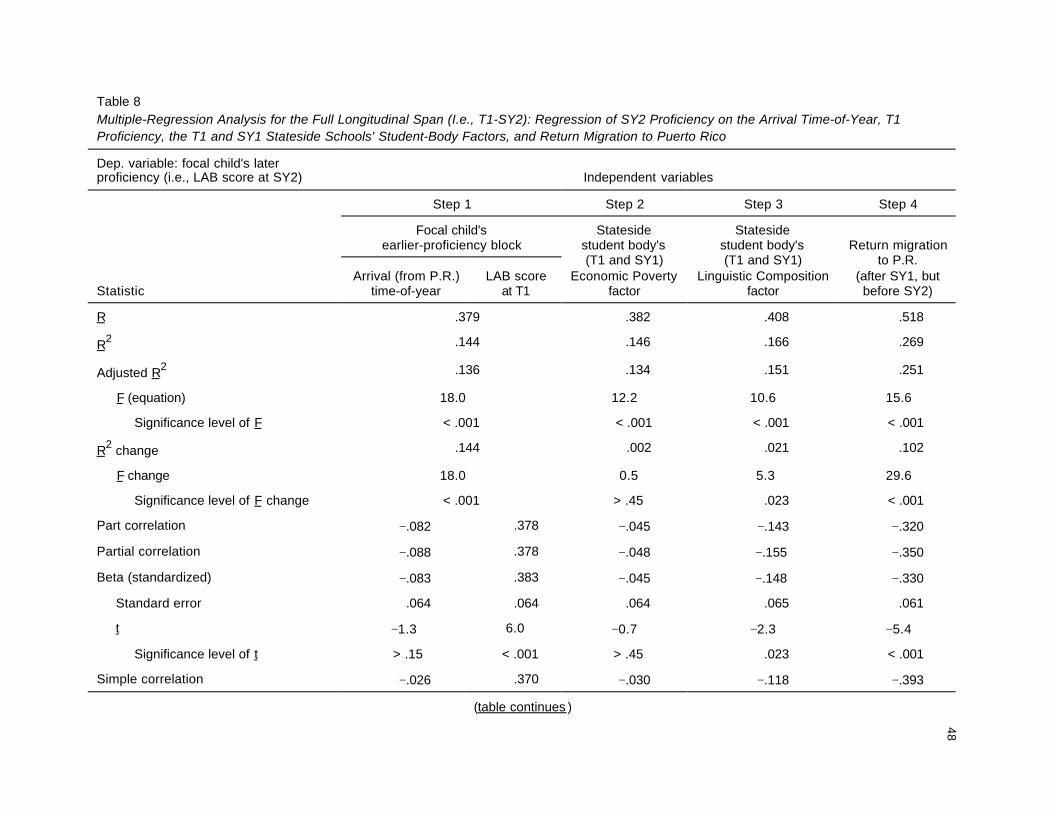
48Table 8Multiple-Regression Analysis for the Full Longitudinal Span (I.e., T1-SY2): Regression of SY2 Proficiency on the Arrival Time-of-Year, T1Proficiency, the T1 and SY1 Stateside Schools' Student-Body Factors, and Return Migration to Puerto Rico
Dep. variable: focal child's laterproficiency (i.e., LAB score at SY2) Independent variables
Step 1 Step 2 Step 3 Step 4
Focal child'searlier-proficiency block
StatisticArrival (from P.R.)
time-of-yearLAB score
at T1
Statesidestudent body's(T1 and SY1)
Economic Povertyfactor
Statesidestudent body's(T1 and SY1)
Linguistic Compositionfactor
Return migrationto P.R.
(after SY1, butbefore SY2)
R .379 .382 .408 .518
R2 .144 .146 .166 .269
Adjusted R2 .136 .134 .151 .251
F (equation) 18.0 12.2 10.6 15.6
Significance level of F < .001 < .001 < .001 < .001
R2 change .144 .002 .021 .102
F change 18.0 0.5 5.3 29.6
Significance level of F change < .001 > .45 .023 < .001
Part correlation −.082 .378 −.045 −.143 −.320
Partial correlation −.088 .378 −.048 −.155 −.350
Beta (standardized) −.083 .383 −.045 −.148 −.330
Standard error .064 .064 .064 .065 .061
t −1.3 6.0 −0.7 −2.3 −5.4
Significance level of t > .15 < .001 > .45 .023 < .001
Simple correlation −.026 .370 −.030 −.118 −.393
(table continues )
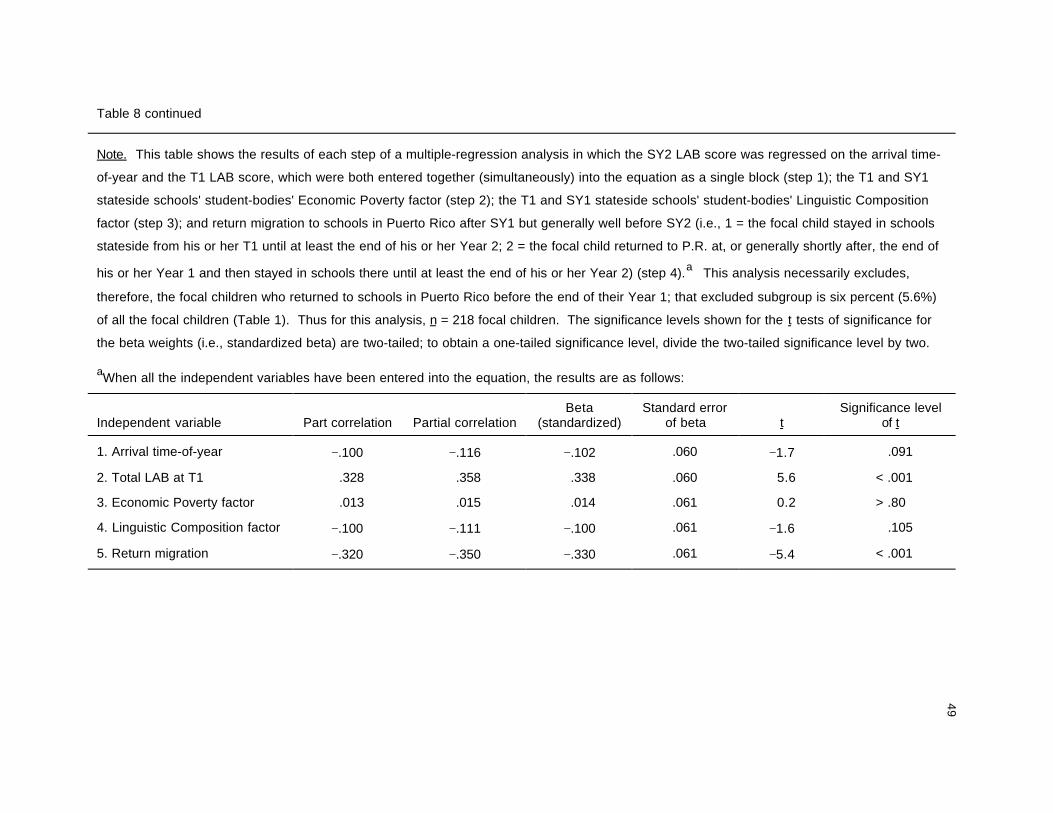
49Table 8 continued
Note. This table shows the results of each step of a multiple-regression analysis in which the SY2 LAB score was regressed on the arrival time-
of-year and the T1 LAB score, which were both entered together (simultaneously) into the equation as a single block (step 1); the T1 and SY1
stateside schools' student-bodies' Economic Poverty factor (step 2); the T1 and SY1 stateside schools' student-bodies' Linguistic Composition
factor (step 3); and return migration to schools in Puerto Rico after SY1 but generally well before SY2 (i.e., 1 = the focal child stayed in schools
stateside from his or her T1 until at least the end of his or her Year 2; 2 = the focal child returned to P.R. at, or generally shortly after, the end of
his or her Year 1 and then stayed in schools there until at least the end of his or her Year 2) (step 4).a This analysis necessarily excludes,
therefore, the focal children who returned to schools in Puerto Rico before the end of their Year 1; that excluded subgroup is six percent (5.6%)
of all the focal children (Table 1). Thus for this analysis, n = 218 focal children. The significance levels shown for the t tests of significance for
the beta weights (i.e., standardized beta) are two-tailed; to obtain a one-tailed significance level, divide the two-tailed significance level by two.
aWhen all the independent variables have been entered into the equation, the results are as follows:
Independent variable Part correlation Partial correlationBeta
(standardized)Standard error
of beta tSignificance level
of t
1. Arrival time-of-year −.100 −.116 −.102 .060 −1.7 .091
2. Total LAB at T1 .328 .358 .338 .060 5.6 < .001
3. Economic Poverty factor .013 .015 .014 .061 0.2 > .80
4. Linguistic Composition factor −.100 −.111 −.100 .061 −1.6 .105
5. Return migration −.320 −.350 −.330 .061 −5.4 < .001
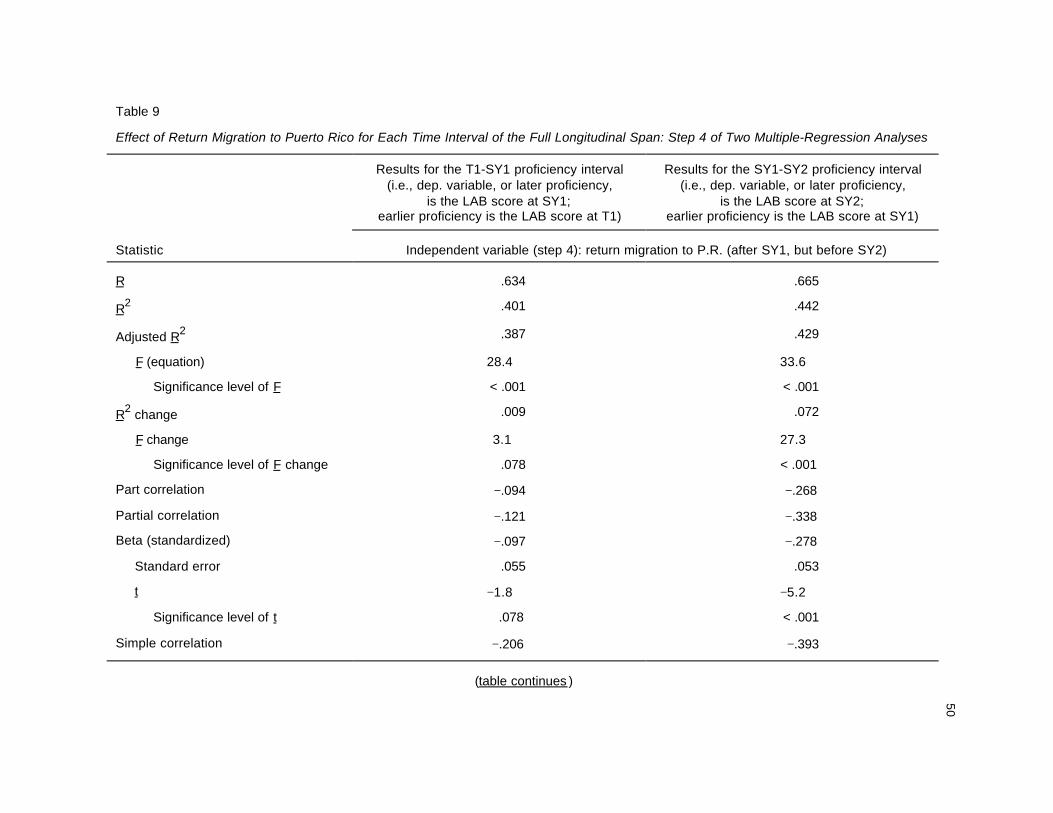
50Table 9
Effect of Return Migration to Puerto Rico for Each Time Interval of the Full Longitudinal Span: Step 4 of Two Multiple-Regression Analyses
Results for the T1-SY1 proficiency interval(i.e., dep. variable, or later proficiency,
is the LAB score at SY1;earlier proficiency is the LAB score at T1)
Results for the SY1-SY2 proficiency interval(i.e., dep. variable, or later proficiency,
is the LAB score at SY2;earlier proficiency is the LAB score at SY1)
Statistic Independent variable (step 4): return migration to P.R. (after SY1, but before SY2)
R .634 .665
R2 .401 .442
Adjusted R2 .387 .429
F (equation) 28.4 33.6
Significance level of F < .001 < .001
R2 change .009 .072
F change 3.1 27.3
Significance level of F change .078 < .001
Part correlation −.094 −.268
Partial correlation −.121 −.338
Beta (standardized) −.097 −.278
Standard error .055 .053
t −1.8 −5.2
Significance level of t .078 < .001
Simple correlation −.206 −.393
(table continues )
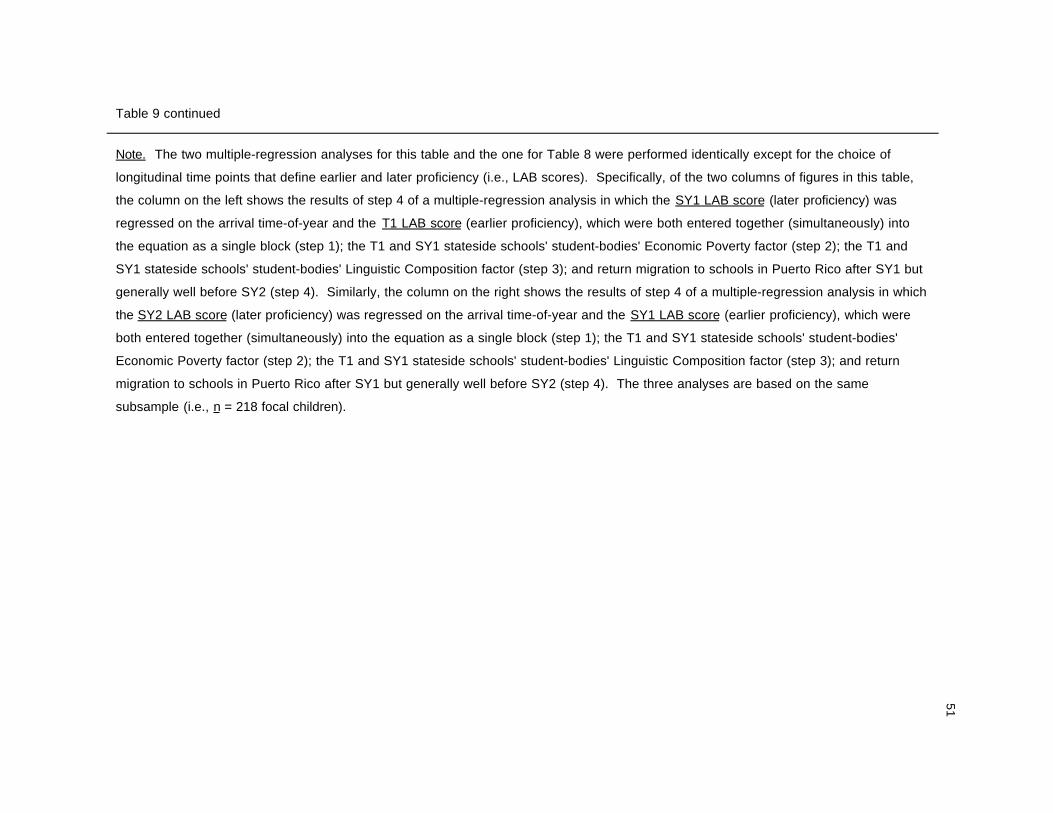
51Table 9 continued
Note. The two multiple-regression analyses for this table and the one for Table 8 were performed identically except for the choice of
longitudinal time points that define earlier and later proficiency (i.e., LAB scores). Specifically, of the two columns of figures in this table,
the column on the left shows the results of step 4 of a multiple-regression analysis in which the SY1 LAB score (later proficiency) was
regressed on the arrival time-of-year and the T1 LAB score (earlier proficiency), which were both entered together (simultaneously) into
the equation as a single block (step 1); the T1 and SY1 stateside schools' student-bodies' Economic Poverty factor (step 2); the T1 and
SY1 stateside schools' student-bodies' Linguistic Composition factor (step 3); and return migration to schools in Puerto Rico after SY1 but
generally well before SY2 (step 4). Similarly, the column on the right shows the results of step 4 of a multiple-regression analysis in which
the SY2 LAB score (later proficiency) was regressed on the arrival time-of-year and the SY1 LAB score (earlier proficiency), which were
both entered together (simultaneously) into the equation as a single block (step 1); the T1 and SY1 stateside schools' student-bodies'
Economic Poverty factor (step 2); the T1 and SY1 stateside schools' student-bodies' Linguistic Composition factor (step 3); and return
migration to schools in Puerto Rico after SY1 but generally well before SY2 (step 4). The three analyses are based on the same
subsample (i.e., n = 218 focal children).

52
Table 10
Predictors of Return Migration to Puerto Rico: Predictive Correlations Between T1 Measures and
Return Migration
Variable Correlation with return migration
Measures of the focal child's T1 (stateside) school'sstudent body
% Native speakers of Spanish .12
% Monolingual native speakers of English −.13*
% Limited-English-proficient/English-language learners (LEP/ELL)
.12
% Subsidized lunch .22**
% Public assistance .01
Focal child's T1 total LAB score −.17**
Note. N = 231 focal children. The coefficients are correlations with return migration, a dichotomous
variable: 1 = the focal child stayed in schools stateside from his or her T1 until at least the end of his or
her Year 2; 2 = returned to schools in Puerto Rico.
*p < .05 **p < .01 ***p < .001 (two-tailed tests)
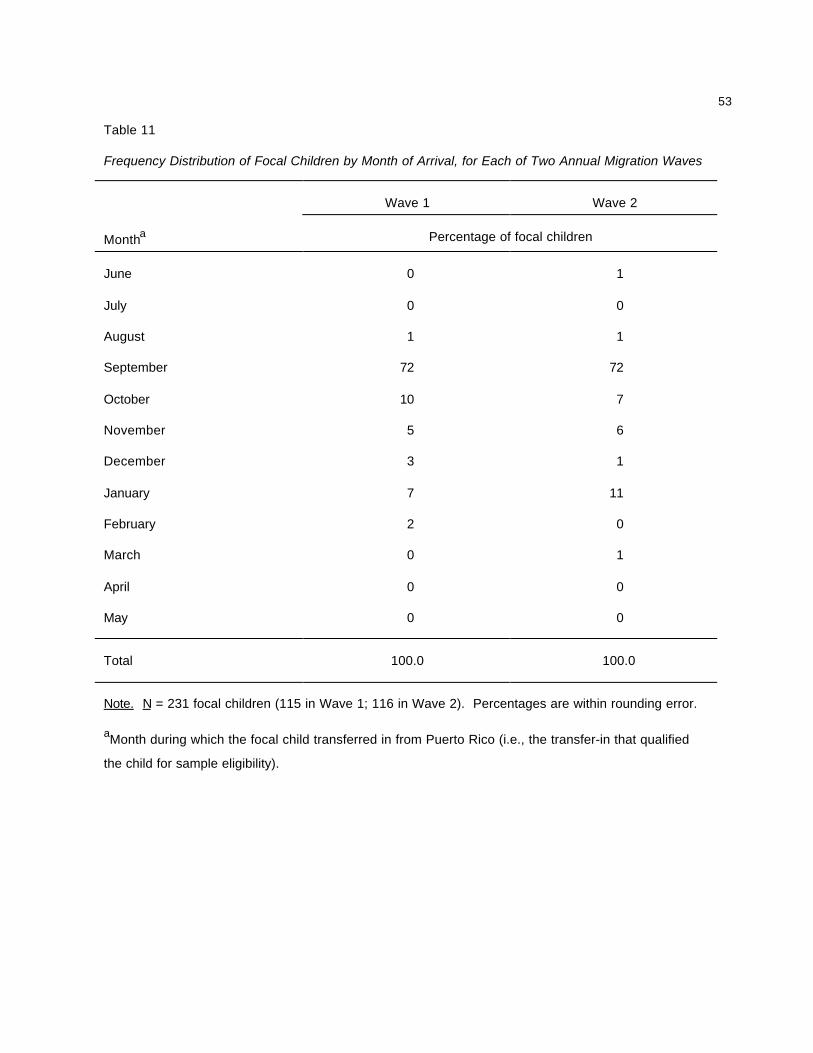
53
Table 11
Frequency Distribution of Focal Children by Month of Arrival, for Each of Two Annual Migration Waves
Wave 1 Wave 2
Montha Percentage of focal children
June 0 1
July 0 0
August 1 1
September 72 72
October 10 7
November 5 6
December 3 1
January 7 11
February 2 0
March 0 1
April 0 0
May 0 0
Total 100.0 100.0
Note. N = 231 focal children (115 in Wave 1; 116 in Wave 2). Percentages are within rounding error.
aMonth during which the focal child transferred in from Puerto Rico (i.e., the transfer-in that qualified
the child for sample eligibility).
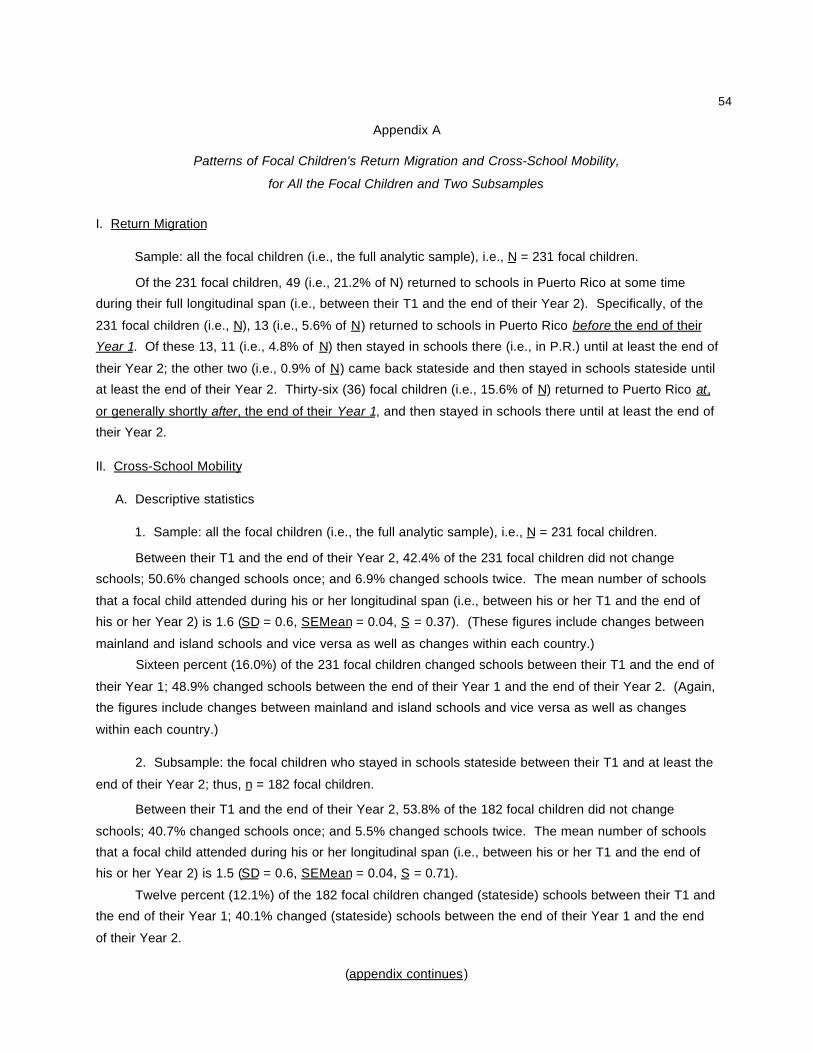
54
Appendix A
Patterns of Focal Children's Return Migration and Cross-School Mobility,
for All the Focal Children and Two Subsamples
I. Return Migration
Sample: all the focal children (i.e., the full analytic sample), i.e., N = 231 focal children.
Of the 231 focal children, 49 (i.e., 21.2% of N) returned to schools in Puerto Rico at some time
during their full longitudinal span (i.e., between their T1 and the end of their Year 2). Specifically, of the
231 focal children (i.e., N), 13 (i.e., 5.6% of N) returned to schools in Puerto Rico before the end of their
Year 1. Of these 13, 11 (i.e., 4.8% of N) then stayed in schools there (i.e., in P.R.) until at least the end of
their Year 2; the other two (i.e., 0.9% of N) came back stateside and then stayed in schools stateside until
at least the end of their Year 2. Thirty-six (36) focal children (i.e., 15.6% of N) returned to Puerto Rico at,
or generally shortly after, the end of their Year 1, and then stayed in schools there until at least the end of
their Year 2.
II. Cross-School Mobility
A. Descriptive statistics
1. Sample: all the focal children (i.e., the full analytic sample), i.e., N = 231 focal children.
Between their T1 and the end of their Year 2, 42.4% of the 231 focal children did not change
schools; 50.6% changed schools once; and 6.9% changed schools twice. The mean number of schools
that a focal child attended during his or her longitudinal span (i.e., between his or her T1 and the end of
his or her Year 2) is 1.6 (SD = 0.6, SEMean = 0.04, S = 0.37). (These figures include changes between
mainland and island schools and vice versa as well as changes within each country.)
Sixteen percent (16.0%) of the 231 focal children changed schools between their T1 and the end of
their Year 1; 48.9% changed schools between the end of their Year 1 and the end of their Year 2. (Again,
the figures include changes between mainland and island schools and vice versa as well as changes
within each country.)
2. Subsample: the focal children who stayed in schools stateside between their T1 and at least the
end of their Year 2; thus, n = 182 focal children.
Between their T1 and the end of their Year 2, 53.8% of the 182 focal children did not change
schools; 40.7% changed schools once; and 5.5% changed schools twice. The mean number of schools
that a focal child attended during his or her longitudinal span (i.e., between his or her T1 and the end of
his or her Year 2) is 1.5 (SD = 0.6, SEMean = 0.04, S = 0.71).
Twelve percent (12.1%) of the 182 focal children changed (stateside) schools between their T1 and
the end of their Year 1; 40.1% changed (stateside) schools between the end of their Year 1 and the end
of their Year 2.
(appendix continues)
55
Appendix A continued
II. Cross-School Mobility (continued)
A. Descriptive statistics (continued).
3. Subsample: the focal children who stayed in schools stateside between their T1 and at least the
end of their Year 1; thus, n = 218 focal children.
Of these 218 focal children, 11.0% changed (stateside) schools between their T1 and the end of
their Year 1.
4. Subsample: the focal children who returned to Puerto Rico and then stayed in schools there
until at least the end of their Year 2; thus, n = 47 focal children.
Between their T1 and the end of their Year 2, 91.5% of these 47 focal children changed schools
once; and 8.5% changed schools twice. The mean number of schools that a focal child attended during
his or her longitudinal span (i.e., between his or her T1 and the end of his or her Year 2) is 2.1 (SD = 0.3,
SEMean = 0.04, S = 3.07). (These figures include changes between mainland and island schools and
vice versa as well as changes within each country.)
Twenty-eight percent (27.7%) of the 47 focal children changed schools between their T1 and the
end of their Year 1; 80.9% changed schools between the end of their Year 1 and the end of their Year 2.
(Again, the figures include changes between mainland and island schools and vice versa as well as
changes within each country.)
III. Relationship Between Cross-School Mobility and Return Migration
The correlation between return migration to Puerto Rico and the cross-school mobility is .41 for the
full analytic sample (i.e., N = 231 focal children). That is, the cross-school mobility (i.e., the number of
schools a focal child attended between his or her T1 and the end of his or her Year 2)a, b is significantly
higher for those who returned to schools in Puerto Rico than for those who stayed in schools stateside
(p < .001). On the other hand, when the analysis excluded the school changes that are the returns to
schools in Puerto Rico, the cross-school mobility is lower for those who returned to schools in Puerto Rico
(M = 1.1) than for those who stayed in schools stateside (M = 1.5).
aThis figure includes mainland and island schools.
bThere is practically a full correspondence between the number of schools a focal child attended and the
number of changes he or she made between schools (i.e., if the child attended only one school, then the
number of changes is zero; if the child attended two schools, then the number of changes is one; etc.).
(appendix continues)
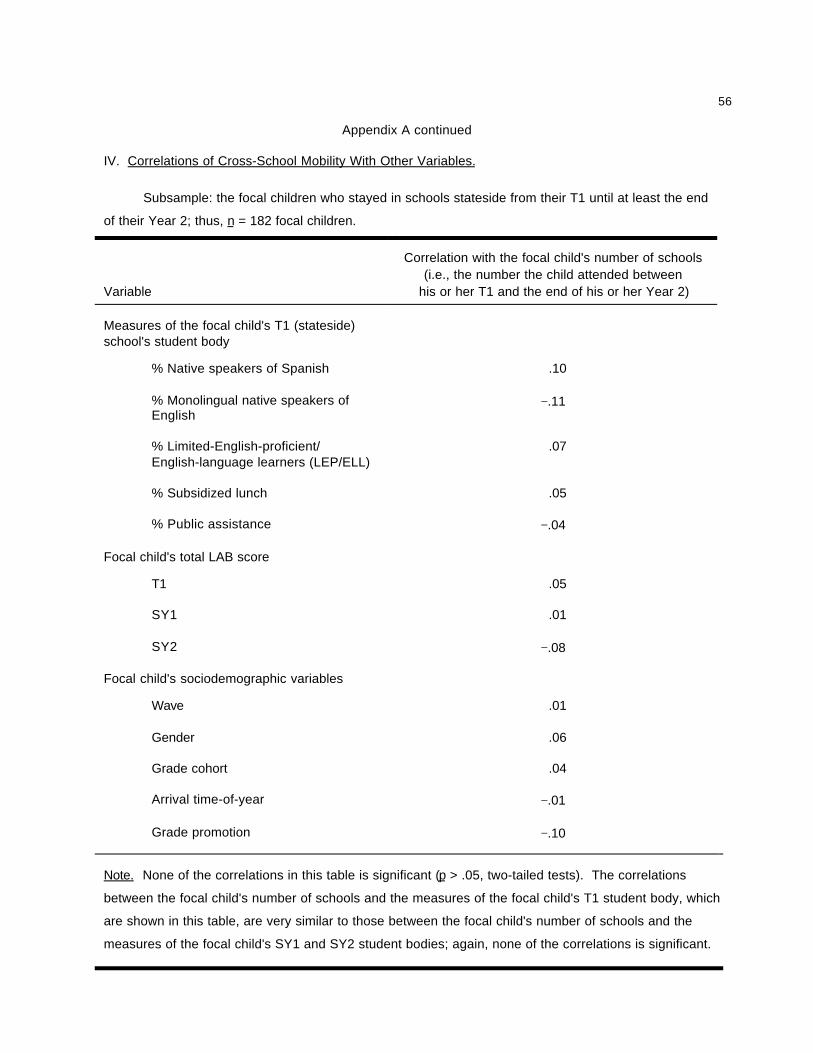
56
Appendix A continued
IV. Correlations of Cross-School Mobility With Other Variables.
Subsample: the focal children who stayed in schools stateside from their T1 until at least the end
of their Year 2; thus, n = 182 focal children.
Variable
Correlation with the focal child's number of schools(i.e., the number the child attended between
his or her T1 and the end of his or her Year 2)
Measures of the focal child's T1 (stateside)school's student body
% Native speakers of Spanish .10
% Monolingual native speakers ofEnglish
−.11
% Limited-English-proficient/English-language learners (LEP/ELL)
.07
% Subsidized lunch .05
% Public assistance −.04
Focal child's total LAB score
T1 .05
SY1 .01
SY2 −.08
Focal child's sociodemographic variables
Wave .01
Gender .06
Grade cohort .04
Arrival time-of-year −.01
Grade promotion −.10
Note. None of the correlations in this table is significant (p > .05, two-tailed tests). The correlations
between the focal child's number of schools and the measures of the focal child's T1 student body, which
are shown in this table, are very similar to those between the focal child's number of schools and the
measures of the focal child's SY1 and SY2 student bodies; again, none of the correlations is significant.

57
Appendix B
Correlations of Focal Children's Sociodemographic Variables With Total LAB Scores
and Stateside Schools' Student Bodies' Linguistic Composition and Economic Poverty Measures,
for All the Focal Children and a Subsample (I.e., Those Who Stayed Stateside)
I. Sample: all the focal children (i.e., the full analytic sample), i.e., N = 231 focal children (in 67
stateside schools). Note: At T1, all the focal children were in stateside schools.
A. Correlations
Variable Wave GenderGradecohort
Arrivaltime-of-year
Gradepromotion
Return migration
Focal child'sstudent body at T1:
% Native speakersof Spanish
.15* .10 .04 −.13* −.02 .12
% Monolingualnative speakers ofEnglish
−.12 −.08 .02 .09 −.02 −.13*
% LEP/ELL .16* .05 −.02 −.12 −.03 .12
% Subsidized lunch .12 .09 −.04 −.10 −.03 .22**
% Public assistance .11 .11 .02 −.09 .04 .01
Focal child's totalLAB score:
T1 −.01 .04 .16** .14* .12* −.17**
SY1 −.02 −.05 .18** −.03 .24*** −.27***
SY2 −.03 .06 .14** .01 .11* −.48***
Note. Significance tests are one-tailed for the correlations of the T1, SY1, and SY2 LAB scores with
grade cohort and grade promotion; and for the correlations of the SY1 and SY2 LAB scores with arrival
time-of-year and return migration. The others are two-tailed.
*p < .05 **p < .01 ***p < .001
(appendix continues)
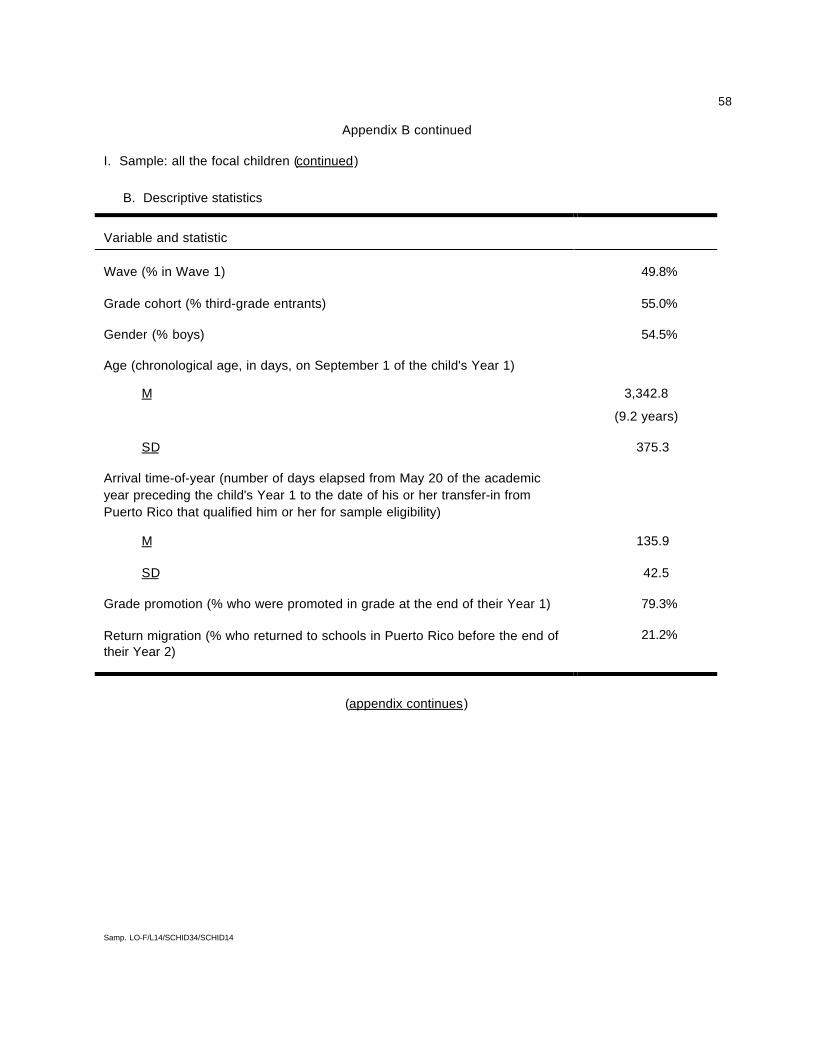
58
Appendix B continued
I. Sample: all the focal children (continued)
B. Descriptive statistics
Variable and statistic
Wave (% in Wave 1) 49.8%
Grade cohort (% third-grade entrants) 55.0%
Gender (% boys) 54.5%
Age (chronological age, in days, on September 1 of the child's Year 1)
M 3,342.8
(9.2 years)
SD 375.3
Arrival time-of-year (number of days elapsed from May 20 of the academicyear preceding the child's Year 1 to the date of his or her transfer-in fromPuerto Rico that qualified him or her for sample eligibility)
M 135.9
SD 42.5
Grade promotion (% who were promoted in grade at the end of their Year 1) 79.3%
Return migration (% who returned to schools in Puerto Rico before the end oftheir Year 2)
21.2%
(appendix continues)
Samp. LO-F/L14/SCHID34/SCHID14
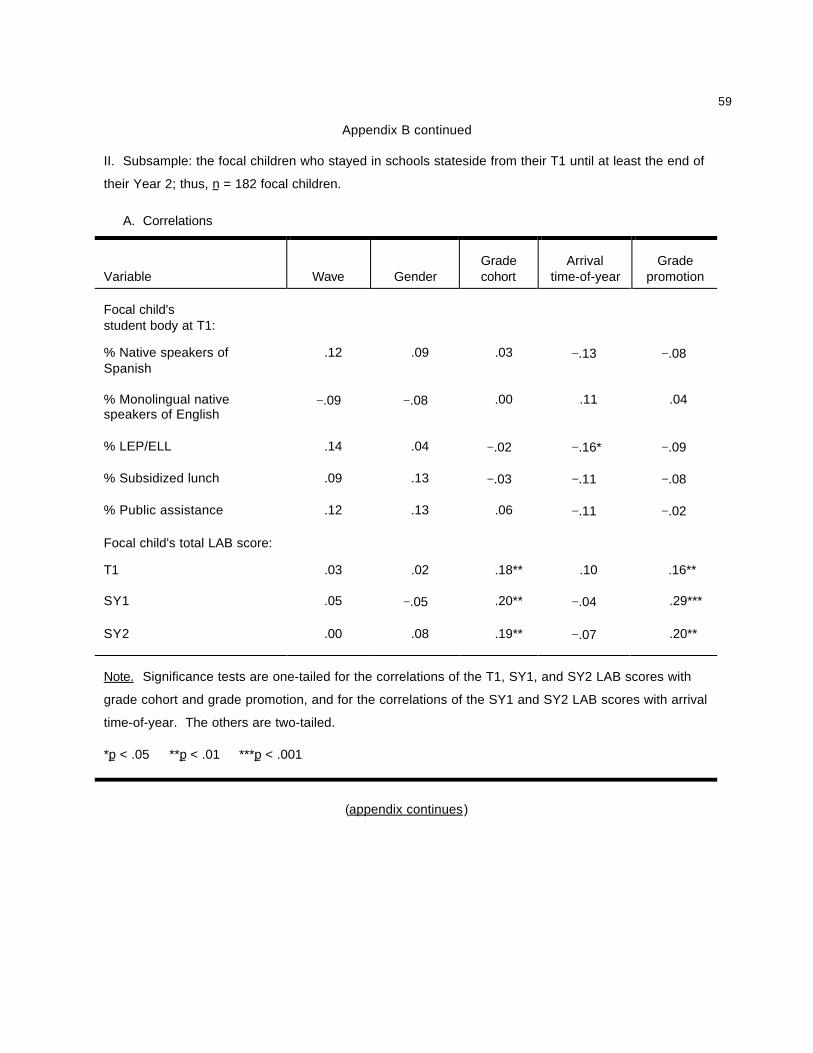
59
Appendix B continued
II. Subsample: the focal children who stayed in schools stateside from their T1 until at least the end of
their Year 2; thus, n = 182 focal children.
A. Correlations
Variable Wave GenderGradecohort
Arrivaltime-of-year
Gradepromotion
Focal child'sstudent body at T1:
% Native speakers ofSpanish
.12 .09 .03 −.13 −.08
% Monolingual nativespeakers of English
−.09 −.08 .00 .11 .04
% LEP/ELL .14 .04 −.02 −.16* −.09
% Subsidized lunch .09 .13 −.03 −.11 −.08
% Public assistance .12 .13 .06 −.11 −.02
Focal child's total LAB score:
T1 .03 .02 .18** .10 .16**
SY1 .05 −.05 .20** −.04 .29***
SY2 .00 .08 .19** −.07 .20**
Note. Significance tests are one-tailed for the correlations of the T1, SY1, and SY2 LAB scores with
grade cohort and grade promotion, and for the correlations of the SY1 and SY2 LAB scores with arrival
time-of-year. The others are two-tailed.
*p < .05 **p < .01 ***p < .001
(appendix continues)

60
Appendix B continued
II. Subsample: the focal children who stayed in schools stateside from their T1 until at least the end of
their Year 2 (continued)
B. Descriptive statistics
Variable and statistic
Wave (% in Wave 1) 50.5%
Grade cohort (% third-grade entrants) 54.4%
Gender (% boys) 55.5%
Age (chronological age, in days, on September 1 of the child's Year 1)
M 3,352.6
(9.2 years)
SD 377.5
Arrival time-of-year (number of days elapsed from May 20 of the academicyear preceding the child's Year 1 to the date of his or her transfer-in fromPuerto Rico that qualified him or her for sample eligibility)
M 137.9
SD 44.4
Grade promotion (% who were promoted in grade at the end of their Year 1) 77.6%
Samp. LO-F/L14/SCHID34/SCHID14
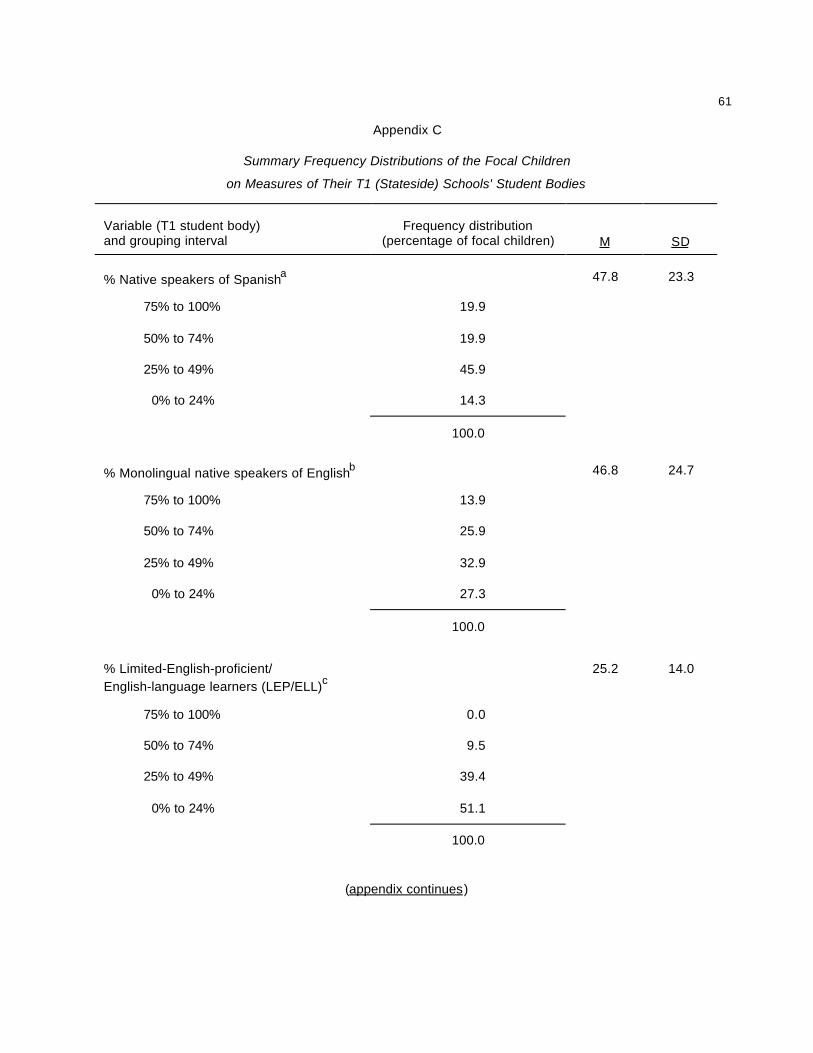
61
Appendix C
Summary Frequency Distributions of the Focal Children
on Measures of Their T1 (Stateside) Schools' Student Bodies
Variable (T1 student body)and grouping interval
Frequency distribution(percentage of focal children) M SD
% Native speakers of Spanisha 47.8 23.3
75% to 100% 19.9
50% to 74% 19.9
25% to 49% 45.9
0% to 24% 14.3
100.0
% Monolingual native speakers of Englishb 46.8 24.7
75% to 100% 13.9
50% to 74% 25.9
25% to 49% 32.9
0% to 24% 27.3
100.0
% Limited-English-proficient/English-language learners (LEP/ELL)c
25.2 14.0
75% to 100% 0.0
50% to 74% 9.5
25% to 49% 39.4
0% to 24% 51.1
100.0
(appendix continues)

62
Appendix C continued
Variable (T1 student body)and grouping interval
Frequency distribution(percentage of focal children) M SD
% Native speakers of languagesother than English or Spanishd
3.9 6.8
75% to 100% 0.0
50% to 74% 0.9
25% to 49% 0.4
0% to 24% 98.7
100.0
% Subsidized lunche 71.4 19.0
75% to 100% 52.4
50% to 74% 35.5
25% to 49% 8.2
0% to 24% 3.9
100.0
% Public assistancef 51.5 23.5
75% to 100% 24.7
50% to 74% 38.5
25% to 49% 25.5
0% to 24% 11.3
100.0
(appendix continues)

63
Appendix C continued
Note. The figures in this table are based on all the focal children (i.e., the full analytic sample), i.e.,
N = 231 focal children (in 67 stateside schools). This table summarizes each variable's frequency
distribution by collapsing its range into four grouping intervals; however, all the statistical analyses for
this study, including the Ms and SDs in this table, are based on the detailed data. Figures are within
rounding error.
THE COLUMN FOR THE FREQUENCY DISTRIBUTION READS: "At their first longitudinal time point
(i.e., T1), twenty percent (19.9%) of the focal children were in (stateside) schools in which native
speakers of Spanish constituted 75% or more of the student body."
THE COLUMN OF MEANS READS: "At their first longitudinal time point (i.e., T1), the focal children
were in (stateside) schools in which native speakers of Spanish constituted, on average, 47.8% of the
student body."
a36.4% of the focal children were in schools in which a majority (i.e., > 50%) of the student body was
native speakers of Spanish; 6.9% were in schools in which less than 10% of the student body was in
that linguistic category.
b34.2% of the focal children were in schools in which a majority of the student body was monolingual
native speakers of English; 11.3% were in schools in which less than 10% of the student body was in
that linguistic category.
c9.5% of the focal children were in schools in which a majority of the student body was LEP/ELL;
14.3% were in schools in which less than 10% of the student body was in that linguistic category.
dOne percent (i.e., 0.9%) of the focal children were in schools in which a majority of the student body
was native speakers of languages other than English or Spanish; 86.6% were in schools in which less
than 10% of the student body was in that linguistic category; 54.5% were in schools in which less than
2% of the student body was in that linguistic category.
e87.9% of the focal children were in schools in which a majority of the student body was eligible for
fully subsidized lunch; 3.9% were in schools in which less than 35% of the student body was eligible for
that subsidy.
f47.2% of the focal children were in schools in which a majority of the student body was from homes in
which the householder was on public assistance (i.e., welfare); 11.3% were in schools in which 20% or
less of the student body was from such homes.
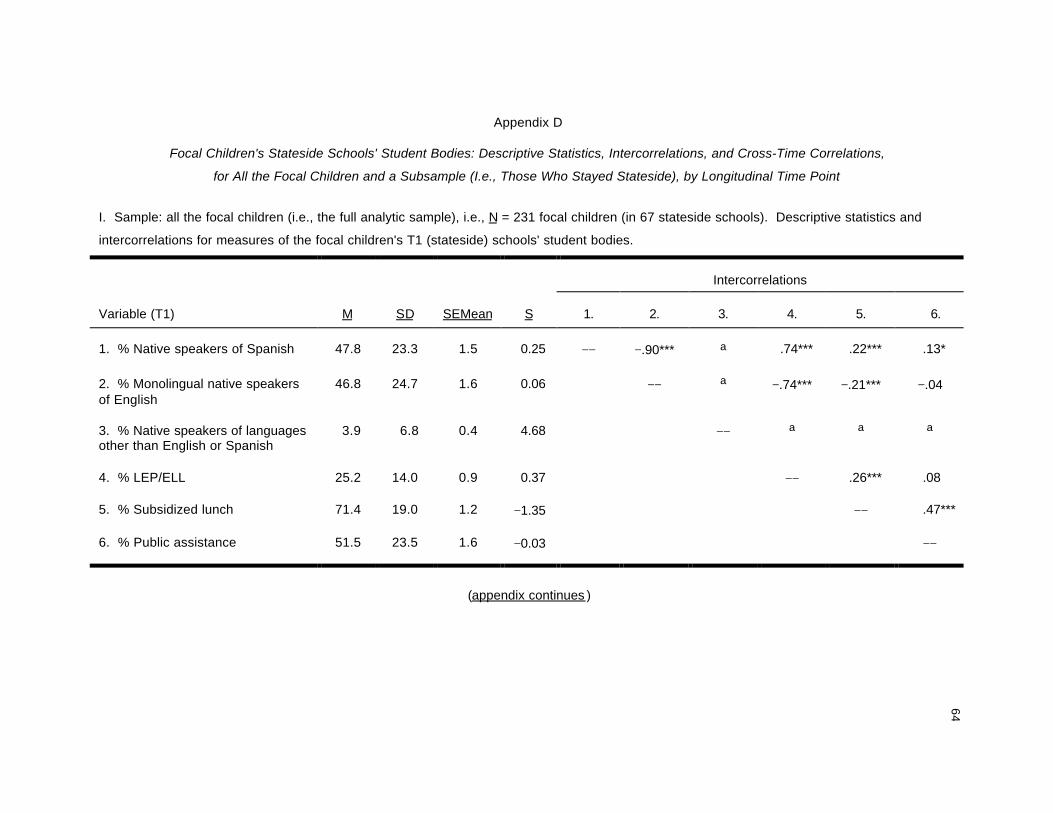
64
Appendix D
Focal Children's Stateside Schools' Student Bodies: Descriptive Statistics, Intercorrelations, and Cross-Time Correlations,
for All the Focal Children and a Subsample (I.e., Those Who Stayed Stateside), by Longitudinal Time Point
I. Sample: all the focal children (i.e., the full analytic sample), i.e., N = 231 focal children (in 67 stateside schools). Descriptive statistics and
intercorrelations for measures of the focal children's T1 (stateside) schools' student bodies.
Intercorrelations
Variable (T1) M SD SEMean S 1. 2. 3. 4. 5. 6.
1. % Native speakers of Spanish 47.8 23.3 1.5 0.25 −− −.90*** a .74*** .22*** .13*
2. % Monolingual native speakersof English
46.8 24.7 1.6 0.06 −− a −.74*** −.21*** −.04
3. % Native speakers of languagesother than English or Spanish
3.9 6.8 0.4 4.68 −− a a a
4. % LEP/ELL 25.2 14.0 0.9 0.37 −− .26*** .08
5. % Subsidized lunch 71.4 19.0 1.2 −1.35 −− .47***
6. % Public assistance 51.5 23.5 1.6 −0.03 −−
(appendix continues )
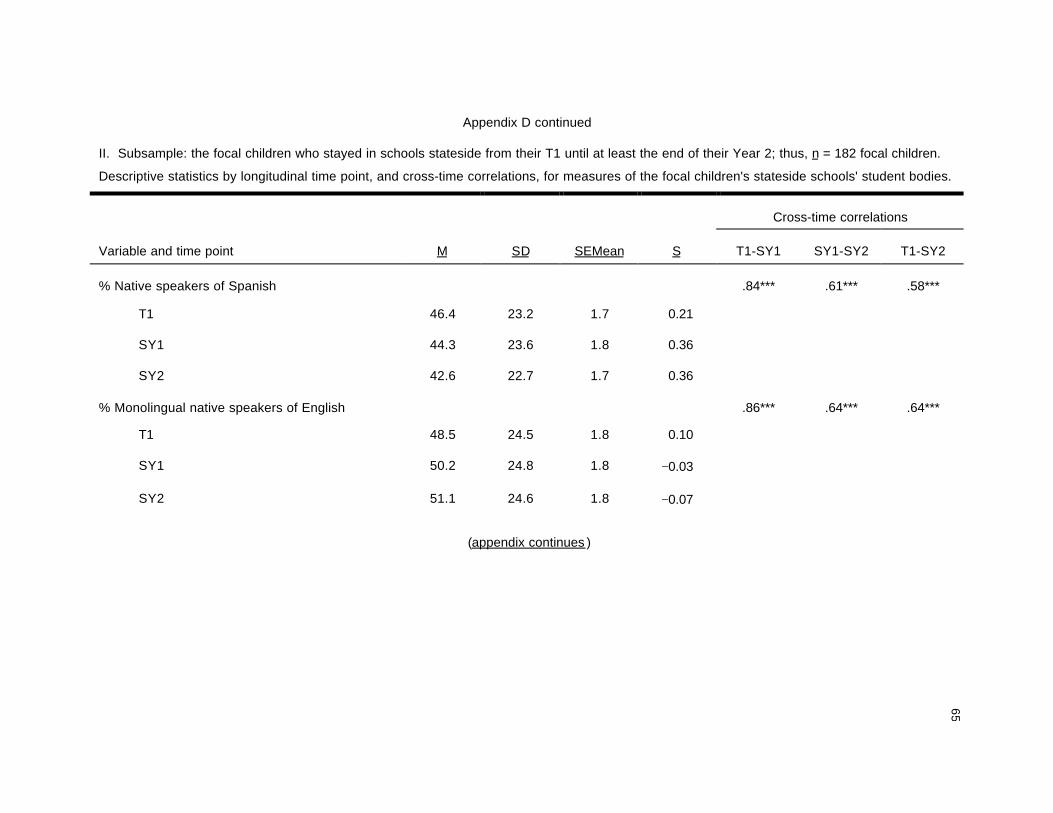
65
Appendix D continued
II. Subsample: the focal children who stayed in schools stateside from their T1 until at least the end of their Year 2; thus, n = 182 focal children.
Descriptive statistics by longitudinal time point, and cross-time correlations, for measures of the focal children's stateside schools' student bodies.
Cross-time correlations
Variable and time point M SD SEMean S T1-SY1 SY1-SY2 T1-SY2
% Native speakers of Spanish .84*** .61*** .58***
T1 46.4 23.2 1.7 0.21
SY1 44.3 23.6 1.8 0.36
SY2 42.6 22.7 1.7 0.36
% Monolingual native speakers of English .86*** .64*** .64***
T1 48.5 24.5 1.8 0.10
SY1 50.2 24.8 1.8 −0.03
SY2 51.1 24.6 1.8 −0.07
(appendix continues )
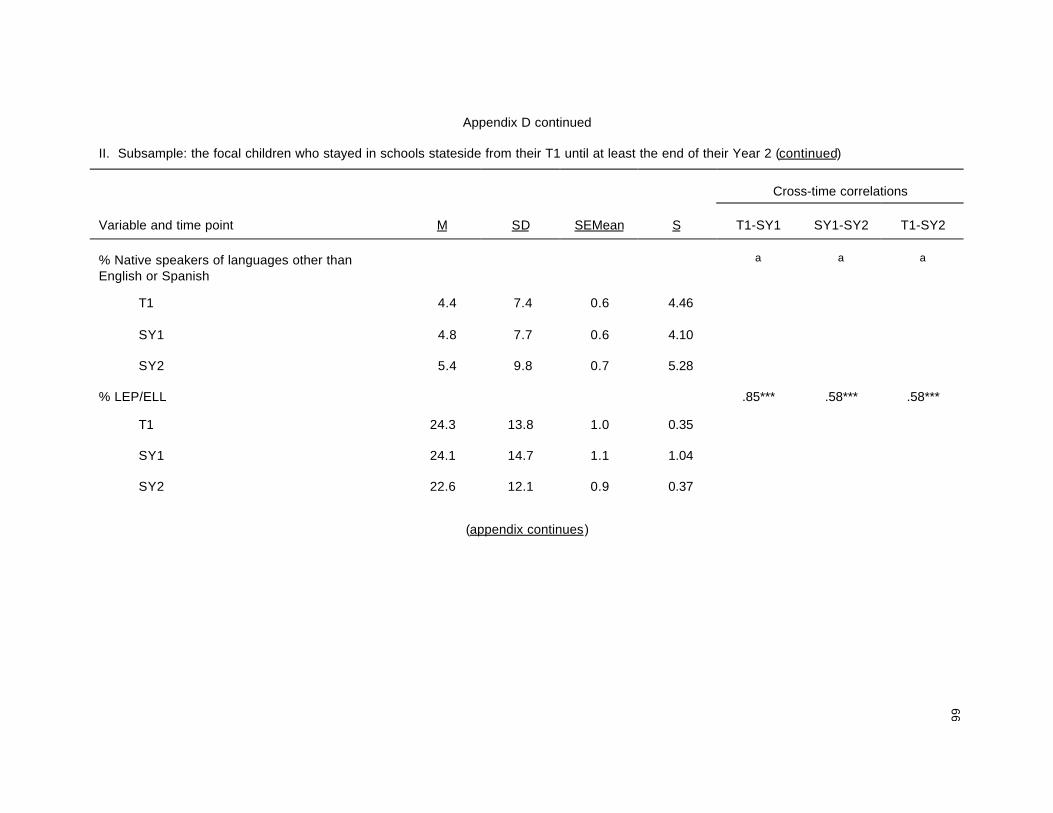
66
Appendix D continued
II. Subsample: the focal children who stayed in schools stateside from their T1 until at least the end of their Year 2 (continued)
Cross-time correlations
Variable and time point M SD SEMean S T1-SY1 SY1-SY2 T1-SY2
% Native speakers of languages other thanEnglish or Spanish
a a a
T1 4.4 7.4 0.6 4.46
SY1 4.8 7.7 0.6 4.10
SY2 5.4 9.8 0.7 5.28
% LEP/ELL .85*** .58*** .58***
T1 24.3 13.8 1.0 0.35
SY1 24.1 14.7 1.1 1.04
SY2 22.6 12.1 0.9 0.37
(appendix continues)
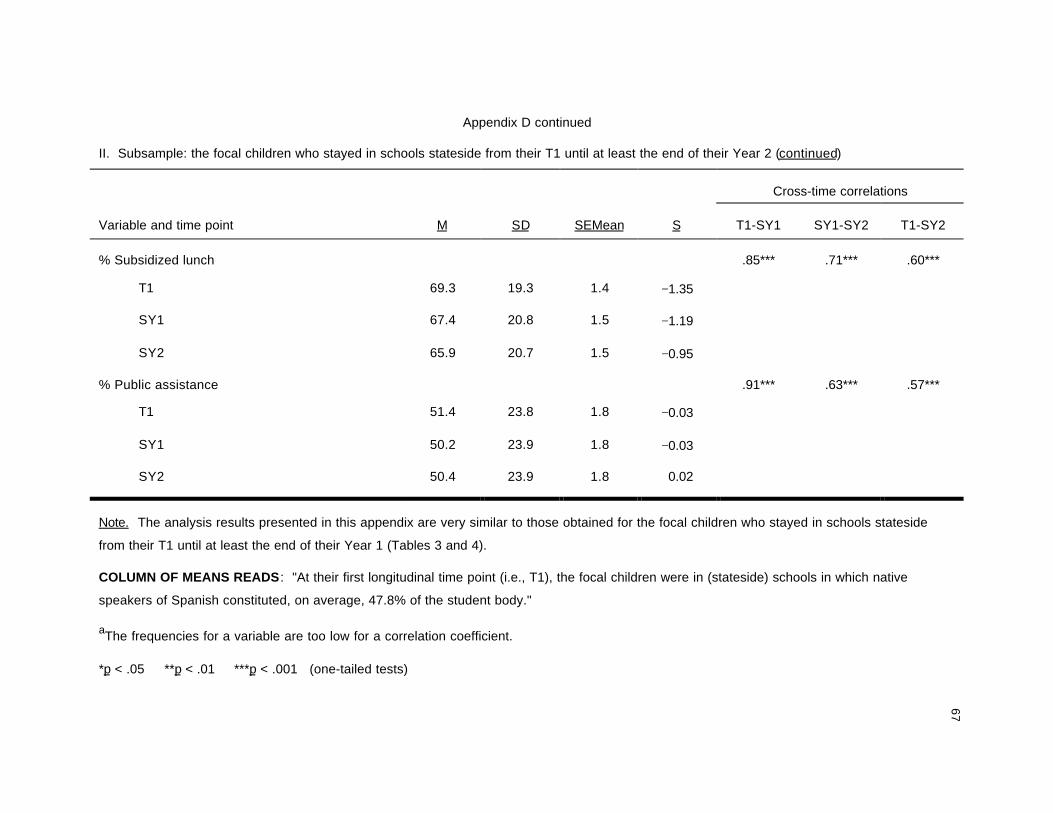
67
Appendix D continued
II. Subsample: the focal children who stayed in schools stateside from their T1 until at least the end of their Year 2 (continued)
Cross-time correlations
Variable and time point M SD SEMean S T1-SY1 SY1-SY2 T1-SY2
% Subsidized lunch .85*** .71*** .60***
T1 69.3 19.3 1.4 −1.35
SY1 67.4 20.8 1.5 −1.19
SY2 65.9 20.7 1.5 −0.95
% Public assistance .91*** .63*** .57***
T1 51.4 23.8 1.8 −0.03
SY1 50.2 23.9 1.8 −0.03
SY2 50.4 23.9 1.8 0.02
Note. The analysis results presented in this appendix are very similar to those obtained for the focal children who stayed in schools stateside
from their T1 until at least the end of their Year 1 (Tables 3 and 4).
COLUMN OF MEANS READS: "At their first longitudinal time point (i.e., T1), the focal children were in (stateside) schools in which native
speakers of Spanish constituted, on average, 47.8% of the student body."
aThe frequencies for a variable are too low for a correlation coefficient.
*p < .05 **p < .01 ***p < .001 (one-tailed tests)
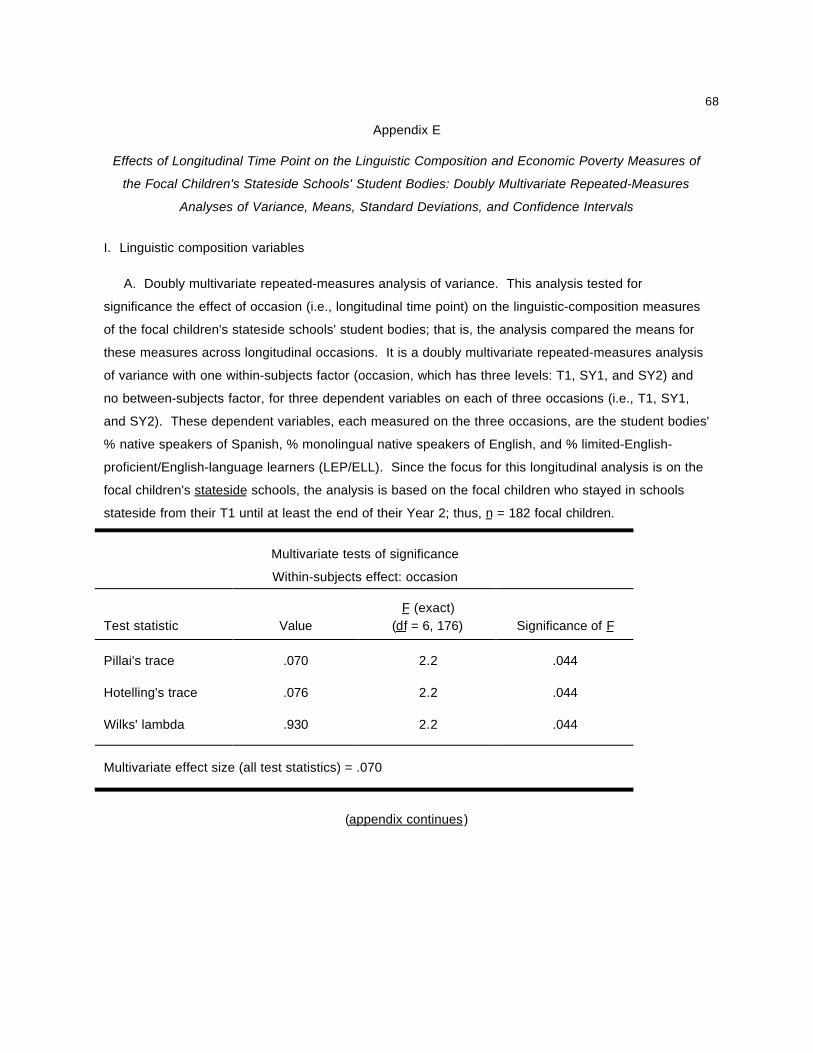
68
Appendix E
Effects of Longitudinal Time Point on the Linguistic Composition and Economic Poverty Measures of
the Focal Children's Stateside Schools' Student Bodies: Doubly Multivariate Repeated-Measures
Analyses of Variance, Means, Standard Deviations, and Confidence Intervals
I. Linguistic composition variables
A. Doubly multivariate repeated-measures analysis of variance. This analysis tested for
significance the effect of occasion (i.e., longitudinal time point) on the linguistic-composition measures
of the focal children's stateside schools' student bodies; that is, the analysis compared the means for
these measures across longitudinal occasions. It is a doubly multivariate repeated-measures analysis
of variance with one within-subjects factor (occasion, which has three levels: T1, SY1, and SY2) and
no between-subjects factor, for three dependent variables on each of three occasions (i.e., T1, SY1,
and SY2). These dependent variables, each measured on the three occasions, are the student bodies'
% native speakers of Spanish, % monolingual native speakers of English, and % limited-English-
proficient/English-language learners (LEP/ELL). Since the focus for this longitudinal analysis is on the
focal children's stateside schools, the analysis is based on the focal children who stayed in schools
stateside from their T1 until at least the end of their Year 2; thus, n = 182 focal children.
Multivariate tests of significance
Within-subjects effect: occasion
Test statistic ValueF (exact)
(df = 6, 176) Significance of F
Pillai's trace .070 2.2 .044
Hotelling's trace .076 2.2 .044
Wilks' lambda .930 2.2 .044
Multivariate effect size (all test statistics) = .070
(appendix continues)
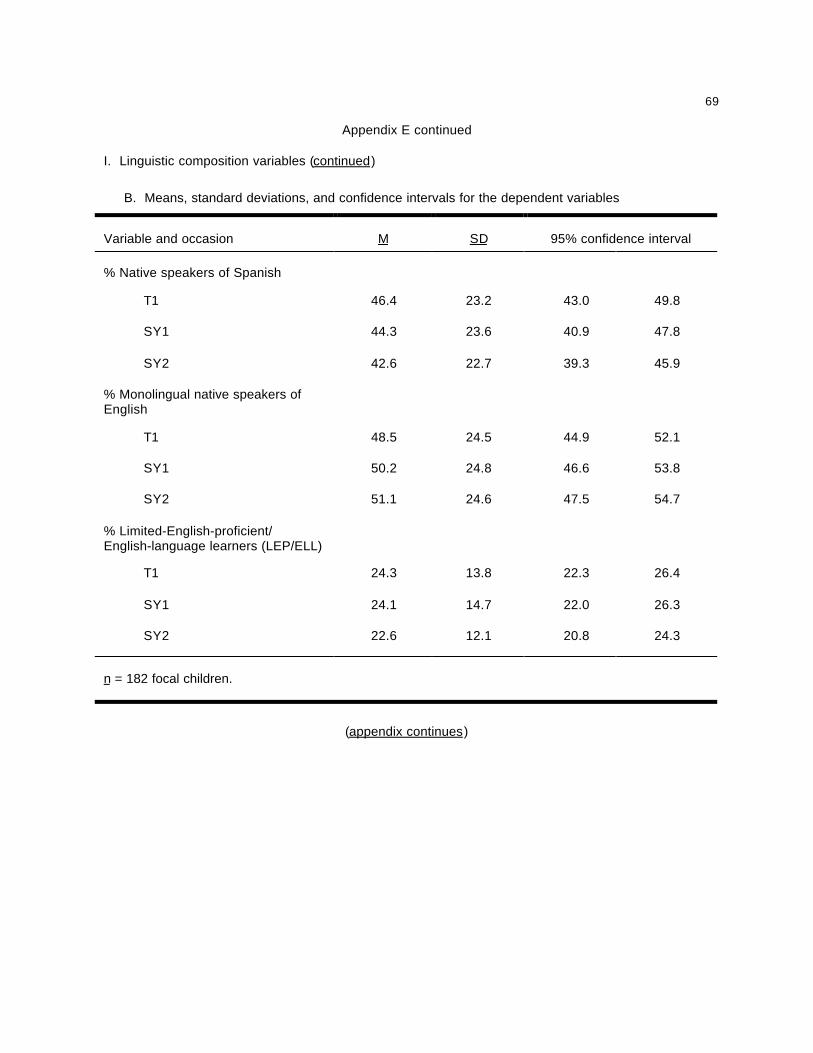
69
Appendix E continued
I. Linguistic composition variables (continued)
B. Means, standard deviations, and confidence intervals for the dependent variables
Variable and occasion M SD 95% confidence interval
% Native speakers of Spanish
T1 46.4 23.2 43.0 49.8
SY1 44.3 23.6 40.9 47.8
SY2 42.6 22.7 39.3 45.9
% Monolingual native speakers ofEnglish
T1 48.5 24.5 44.9 52.1
SY1 50.2 24.8 46.6 53.8
SY2 51.1 24.6 47.5 54.7
% Limited-English-proficient/English-language learners (LEP/ELL)
T1 24.3 13.8 22.3 26.4
SY1 24.1 14.7 22.0 26.3
SY2 22.6 12.1 20.8 24.3
n = 182 focal children.
(appendix continues)
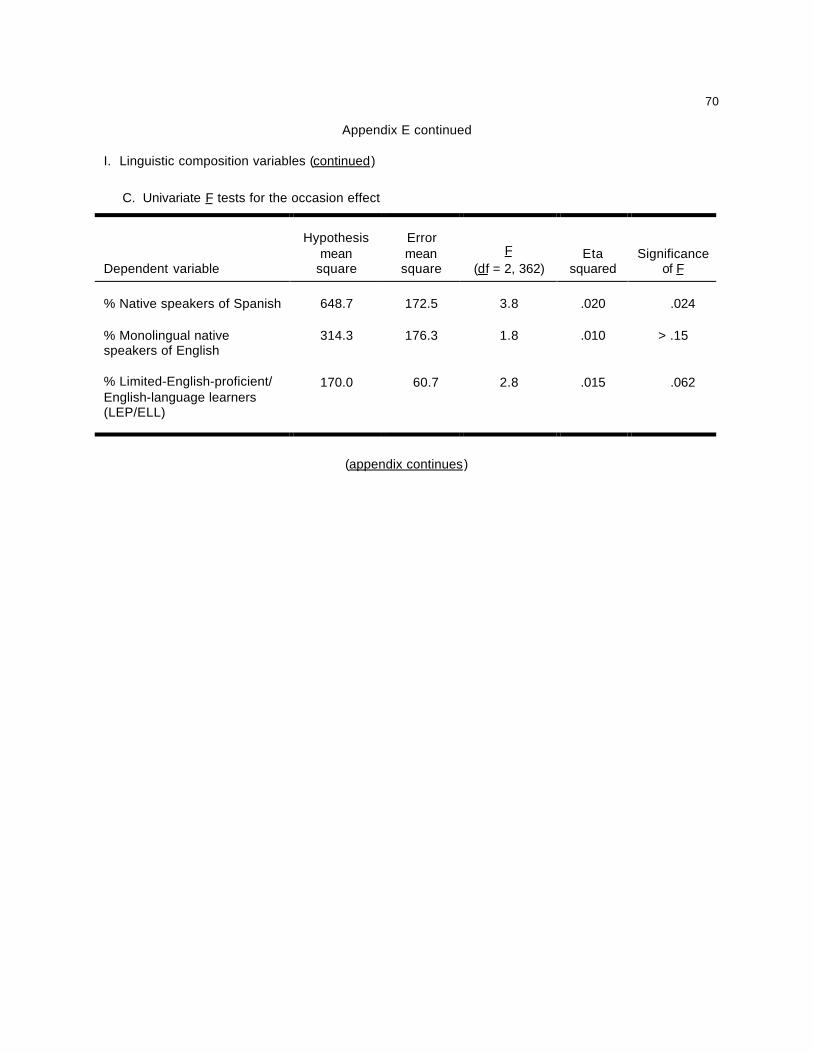
70
Appendix E continued
I. Linguistic composition variables (continued)
C. Univariate F tests for the occasion effect
Dependent variable
Hypothesismean
square
Errormean
squareF
(df = 2, 362)Eta
squaredSignificance
of F
% Native speakers of Spanish 648.7 172.5 3.8 .020 .024
% Monolingual nativespeakers of English
314.3 176.3 1.8 .010 > .15
% Limited-English-proficient/English-language learners(LEP/ELL)
170.0 60.7 2.8 .015 .062
(appendix continues)

71
Appendix E continued
II. Economic poverty variables
A. Doubly multivariate repeated-measures analysis of variance. This analysis tested for
significance the effect of occasion (i.e., longitudinal time point) on the economic poverty measures of
the focal children's stateside schools' student bodies; that is, the analysis compared the means for
these measures across longitudinal occasions. It is a doubly multivariate repeated-measures analysis
of variance with one within-subjects factor (occasion, with three levels: T1, SY1, and SY2) and no
between-subjects factor, for two dependent variables on each of three occasions (i.e., T1, SY1, and
SY2). These dependent variables, each measured on the three occasions, are the student bodies'
% subsidized lunch and % public assistance. Again, since the focus for this longitudinal analysis is on
the focal children's stateside schools, the analysis is based on the focal children who stayed in schools
stateside from their T1 until at least the end of their Year 2; thus, n = 182 focal children.
Multivariate tests of significance
Within-subjects effect: occasion
Test statistic ValueF (exact)
(df = 4, 178) Significance of F
Pillai's trace .044 2.1 .087
Hotelling's trace .046 2.1 .087
Wilks' lambda .956 2.1 .087
Multivariate effect size (all test statistics) = .044
(appendix continues)

72
Appendix E continued
II. Economic poverty variables (continued)
B. Means, standard deviations, and confidence intervals for the dependent variables
Variable and occasion M SD 95% confidence interval
% Subsidized lunch
T1 69.3 19.3 66.4 72.1
SY1 67.4 20.8 64.3 70.4
SY2 65.9 20.7 62.9 68.9
% Public assistance
T1 51.4 23.8 47.9 54.9
SY1 50.2 23.9 46.7 53.7
SY2 50.4 23.9 47.0 53.9
n = 182 focal children.
III. Conclusions
The multivariate analysis for the linguistic composition variables shows a significant occasion
effect. The analyses for the individual variables show that this effect is largely due to the % native
speakers of Spanish. On average, the longer a focal child stayed stateside, the smaller tended to be
his or her (stateside) school's student body's proportion of native speakers of Spanish. The
multivariate analysis for the economic poverty variables does not show a significant occasion effect.

73
Appendix F
Correlations Between the Linguistic Composition and Economic Poverty Measures
of the Focal Children's Stateside Schools' Student Bodies at the First Two Longitudinal Time Points
% Subsidized lunch % Public assistance
Variable and time point T1 SY1 T1 SY1
EconomicPovertyfactor
% Native speakers of Spanish
T1 .23*** .20*** .14* .15* .22***
SY1 .22*** .31*** .13* .21*** .26***
% Limited-English-proficient/English-language learners (LEP/ELL)
T1 .26*** .20*** .09 .07 .18**
SY1 .26*** .29*** .09 .12* .22***
% Monolingual native speakers of English
T1 −.22*** −.15** −.05 −.04 −.14*
SY1 −.20*** −.28*** −.04 −.12* −.19**
Linguistic Composition factor .26*** .26*** .10 .13* .22***
Note. The analyses for this table are based on the focal children who stayed in schools stateside from
their T1 until at least the end of their Year 1; thus, n = 218 focal children.
*p < .05 **p < .01 ***p < .001 (one-tailed tests)
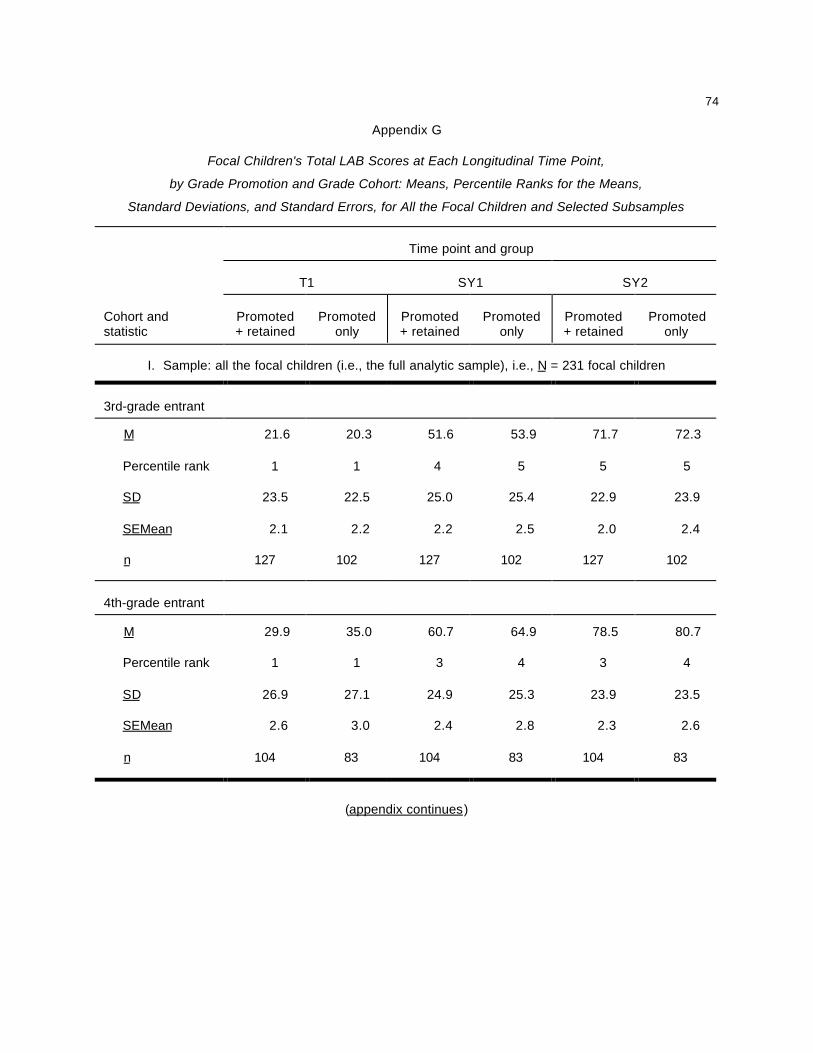
74
Appendix G
Focal Children's Total LAB Scores at Each Longitudinal Time Point,
by Grade Promotion and Grade Cohort: Means, Percentile Ranks for the Means,
Standard Deviations, and Standard Errors, for All the Focal Children and Selected Subsamples
Time point and group
T1 SY1 SY2
Cohort andstatistic
Promoted+ retained
Promotedonly
Promoted+ retained
Promotedonly
Promoted+ retained
Promotedonly
I. Sample: all the focal children (i.e., the full analytic sample), i.e., N = 231 focal children
3rd-grade entrant
M 21.6 20.3 51.6 53.9 71.7 72.3
Percentile rank 1 1 4 5 5 5
SD 23.5 22.5 25.0 25.4 22.9 23.9
SEMean 2.1 2.2 2.2 2.5 2.0 2.4
n 127 102 127 102 127 102
4th-grade entrant
M 29.9 35.0 60.7 64.9 78.5 80.7
Percentile rank 1 1 3 4 3 4
SD 26.9 27.1 24.9 25.3 23.9 23.5
SEMean 2.6 3.0 2.4 2.8 2.3 2.6
n 104 83 104 83 104 83
(appendix continues)

75
Appendix G continued
Time point and group
T1 SY1 SY2
Cohort andstatistic
Promoted+ retained
Promotedonly
Promoted+ retained
Promotedonly
Promoted+ retained
Promotedonly
II. Subsample: the focal children who stayed in schools stateside
from their T1 until at least the end of their Year 2; thus, n = 182 focal children
3rd-grade entrant
M 23.2 22.2 54.8 58.1 76.9 78.8
Percentile rank 1 1 5 6 7 7
SD 24.0 22.8 24.7 24.7 20.9 21.5
SEMean 2.4 2.6 2.5 2.8 2.1 2.4
n 99 77 99 77 99 77
4th-grade entrant
M 32.8 38.6 64.6 69.0 85.0 87.3
Percentile rank 1 1 4 5 5 6
SD 27.9 27.7 24.2 24.6 20.5 19.7
SEMean 3.1 3.4 2.7 3.0 2.2 2.4
n 83 66 83 66 83 66
(appendix continues)

76
Appendix G continued
Time point and group
T1 SY1 SY2
Cohort andstatistic
Promoted+ retained
Promotedonly
Promoted+ retained
Promotedonly
Promoted+ retained
Promotedonly
III. Subsample: the focal children who returned to Puerto Rico
and then stayed in schools there until at least the end of their Year 2; thus, n = 47 focal children
3rd-grade entrant
M 15.6 14.4 40.5 41.2 53.3 52.3
Percentile rank 1 1 2 2 2 2
SD 21.2 21.0 23.5 23.6 20.2 19.6
SEMean 4.0 4.2 4.4 4.7 3.8 3.9
n 28 25 28 25 28 25
4th-grade entrant
M 19.4 20.9 47.3 49.9 54.1 56.2
Percentile rank 1 1 2 2 1 1
SD 19.8 20.2 21.7 22.0 19.5 19.5
SEMean 4.6 5.0 5.0 5.5 4.5 4.9
n 19 16 19 16 19 16
(appendix continues)
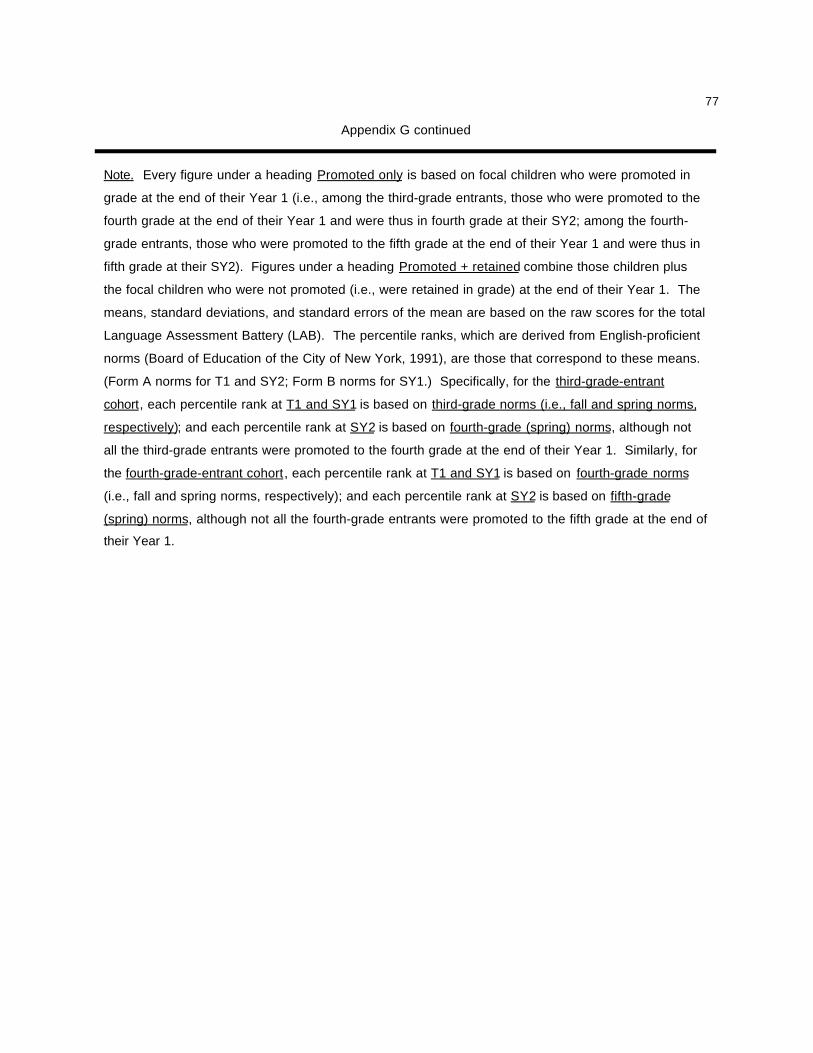
77
Appendix G continued
Note. Every figure under a heading Promoted only is based on focal children who were promoted in
grade at the end of their Year 1 (i.e., among the third-grade entrants, those who were promoted to the
fourth grade at the end of their Year 1 and were thus in fourth grade at their SY2; among the fourth-
grade entrants, those who were promoted to the fifth grade at the end of their Year 1 and were thus in
fifth grade at their SY2). Figures under a heading Promoted + retained combine those children plus
the focal children who were not promoted (i.e., were retained in grade) at the end of their Year 1. The
means, standard deviations, and standard errors of the mean are based on the raw scores for the total
Language Assessment Battery (LAB). The percentile ranks, which are derived from English-proficient
norms (Board of Education of the City of New York, 1991), are those that correspond to these means.
(Form A norms for T1 and SY2; Form B norms for SY1.) Specifically, for the third-grade-entrant
cohort, each percentile rank at T1 and SY1 is based on third-grade norms (i.e., fall and spring norms,
respectively); and each percentile rank at SY2 is based on fourth-grade (spring) norms, although not
all the third-grade entrants were promoted to the fourth grade at the end of their Year 1. Similarly, for
the fourth-grade-entrant cohort, each percentile rank at T1 and SY1 is based on fourth-grade norms
(i.e., fall and spring norms, respectively); and each percentile rank at SY2 is based on fifth-grade
(spring) norms, although not all the fourth-grade entrants were promoted to the fifth grade at the end of
their Year 1.

78
Appendix H
Effects of Longitudinal Time Point and Grade Cohort on the Focal Children's Total LAB Scores:
Repeated-Measures Analyses of Covariance, Tests for Assumptions, Means, Standard Deviations,
and Confidence Intervals, for All the Focal Children and Two Subsamples
I. Sample: all the focal children (i.e., the full analytic sample); i.e., N = 231 focal children.
A. Repeated-measures analysis of covariance (ANOCOVA). This analysis tested for significance
the effects of longitudinal occasion (i.e., time point) and grade cohort on the focal children's total LAB
scores. It is a repeated-measures ANOCOVA with one within-subjects factor (i.e., occasion, which has
three levels: T1, SY1, and SY2), one between-subjects factor (i.e., cohort, which has two levels: third-
grade-entrant cohort and fourth-grade-entrant cohort), and one covariate (i.e., arrival time-of-year).
The dependent variables are the total LAB scores on the three occasions (i.e., T1, SY1, and SY2).
Full factorial design. Method for calculating sums of squares: regression.
Source of variation df Mean square FPartial etasquared
Significanceof F
Tests of significance using unique sums of squares
Between-subjects effects
Within cells 228 1,225.7
Regression 1 1,338.3 1.1 .005 > .25
Cohort 1 11,786.8 9.6 .040 .002
Averaged tests of significance using unique sums of squares
Within-subjects effects
Within cells 458 285.3
Occasion 2 141,939.1 497.6 .685 < .001
Occasion by cohort 2 77.7 0.3 .001 > .75
(appendix continues)

79
Appendix H continued
I. Sample: all the focal children (continued)
B. Tests for assumptions
1. Tests for homogeneity of slopes. Three analyses tested for significance the interaction
between the ANOCOVA's covariate and between-subjects factor. These analyses, one for each of
three dependent variables (i.e., the focal child's total LAB score on each of three occasions: T1, SY1,
and SY2), had two independent variables, namely, arrival time-of-year (a continuous variable) and
cohort (two levels: third-grade entrant and fourth-grade entrant). Each analysis tested the interaction
between these two independent variables after controlling for these two independent variables'
individual effects.
Effect: arrival time-of-year by cohort
Dependentvariable
Hypothesismean square
Error meansquare
F(df = 1, 227)
Significanceof F
LAB score
T1 0.7 618.4 0.0 > .95
SY1 270.0 627.5 0.4 > .50
SY2 1,828.2 540.7 3.4 > .05
(appendix continues)

80
Appendix H continued
I. Sample: all the focal children (continued)
B. Tests for assumptions (continued)
2. Tests for homogeneity of variances for each dependent variable across levels of the
ANOCOVA's between-subjects factor
Results for LAB score
Test statistic T1 SY1 SY2
Cochran's C (df = 115, 2) .566 .504 .522
Significance level (approx.) > .10 > .90 > .60
Bartlett-Box F (df = 1, 153133) 2.03 0.01 0.22
Significance level > .15 > .90 > .60
3. Sphericity test for the effects involving the within-subjects factor
Mauchly's W = .909, Chi square (approx.) = 21.8 (df = 2), significance level < .001
Epsilon: Greenhouse-Geisser = .917, Huynh-Feldt = .928, lower-bound = .500
The ANOCOVA's F value for the occasion main effect remains significant after its df have been
adjusted for epsilon, including the lower-bound epsilon. I.e., original df = 2 and 458, which, when
adjusted for the obtained lower-bound epsilon value, become 1 and 229 (i.e., .500 x 2 = 1;
.500 x 458 = 229); for averaged F = 497.6 with df = 1 and 229, significance level < .001.
(appendix continues)
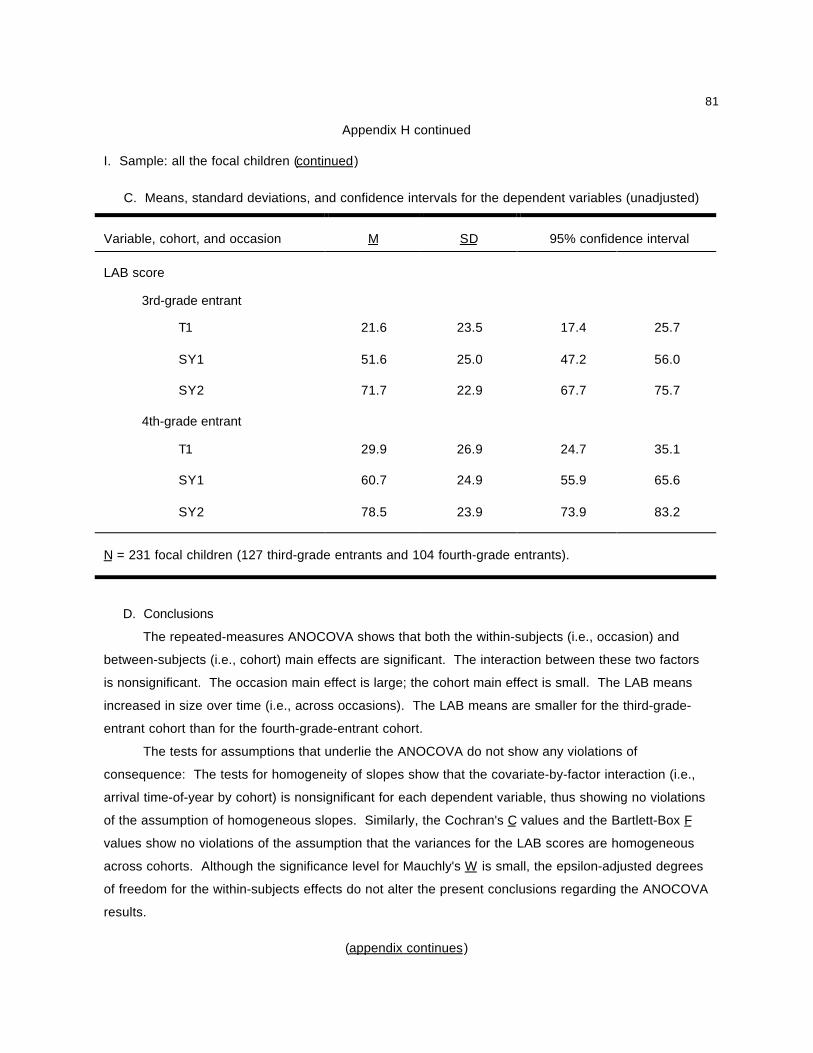
81
Appendix H continued
I. Sample: all the focal children (continued)
C. Means, standard deviations, and confidence intervals for the dependent variables (unadjusted)
Variable, cohort, and occasion M SD 95% confidence interval
LAB score
3rd-grade entrant
T1 21.6 23.5 17.4 25.7
SY1 51.6 25.0 47.2 56.0
SY2 71.7 22.9 67.7 75.7
4th-grade entrant
T1 29.9 26.9 24.7 35.1
SY1 60.7 24.9 55.9 65.6
SY2 78.5 23.9 73.9 83.2
N = 231 focal children (127 third-grade entrants and 104 fourth-grade entrants).
D. Conclusions
The repeated-measures ANOCOVA shows that both the within-subjects (i.e., occasion) and
between-subjects (i.e., cohort) main effects are significant. The interaction between these two factors
is nonsignificant. The occasion main effect is large; the cohort main effect is small. The LAB means
increased in size over time (i.e., across occasions). The LAB means are smaller for the third-grade-
entrant cohort than for the fourth-grade-entrant cohort.
The tests for assumptions that underlie the ANOCOVA do not show any violations of
consequence: The tests for homogeneity of slopes show that the covariate-by-factor interaction (i.e.,
arrival time-of-year by cohort) is nonsignificant for each dependent variable, thus showing no violations
of the assumption of homogeneous slopes. Similarly, the Cochran's C values and the Bartlett-Box F
values show no violations of the assumption that the variances for the LAB scores are homogeneous
across cohorts. Although the significance level for Mauchly's W is small, the epsilon-adjusted degrees
of freedom for the within-subjects effects do not alter the present conclusions regarding the ANOCOVA
results.
(appendix continues)

82
Appendix H continued
II. Subsample: the focal children who stayed in schools stateside from their T1 until at least the end of
their Year 1; thus, n = 218 focal children.
A. Repeated-measures analysis of covariance (ANOCOVA). This analysis tested for significance
the effects of occasion (i.e., longitudinal time point) and grade cohort on the total LAB scores for the
focal children in this subsample. It is a repeated-measures ANOCOVA with one within-subjects factor
(i.e., occasion, with two levels: T1 and SY1), one between-subjects factor (i.e., cohort, with two levels:
third-grade-entrant cohort and fourth-grade-entrant cohort), and one covariate (i.e., arrival time-of-
year). The dependent variables are the total LAB scores at T1 and SY1. Full factorial design. Method
for calculating sums of squares: regression.
Source of variation df Mean square FPartial etasquared
Significanceof F
Tests of significance using unique sums of squares
Between-subjects effects
Within cells 215 995.8
Regression 1 1,067.4 1.1 .005 > .25
Cohort 1 7,082.1 7.1 .032 .008
Within-subjects effects
Within cells 216 258.2
Occasion 1 107,939.3 418.1 .659 < .001
Occasion by cohort 1 98.0 0.4 .002 > .50
(appendix continues)
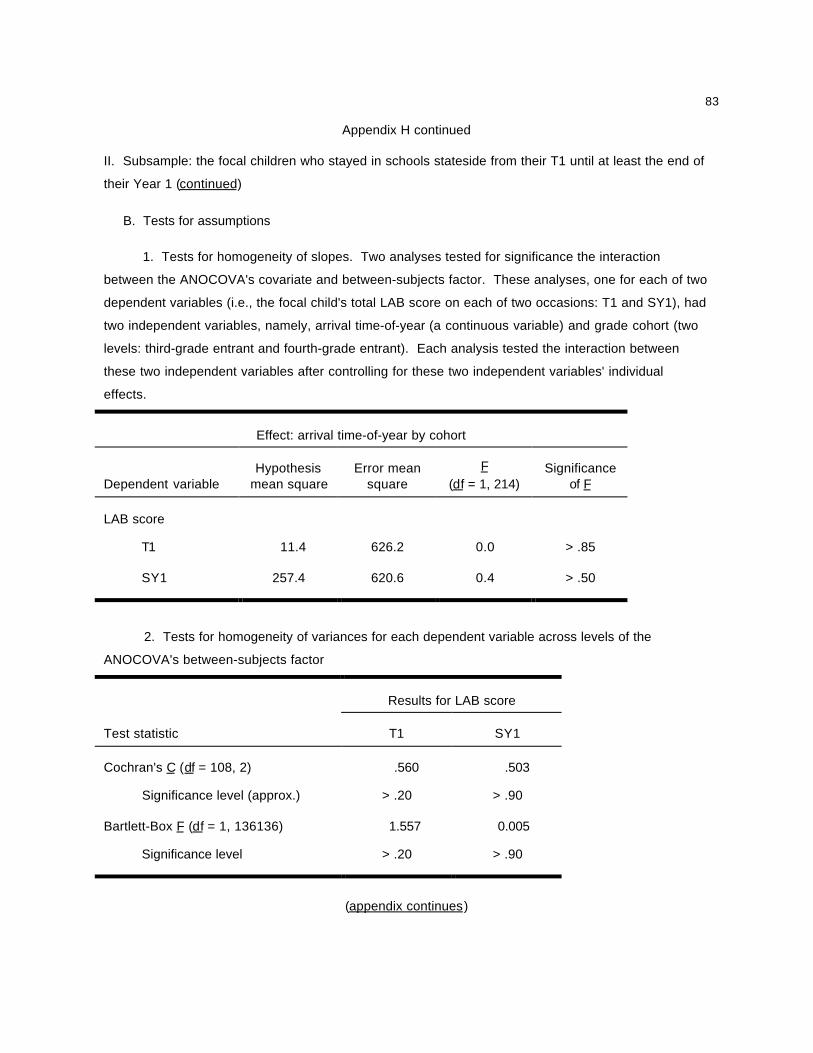
83
Appendix H continued
II. Subsample: the focal children who stayed in schools stateside from their T1 until at least the end of
their Year 1 (continued)
B. Tests for assumptions
1. Tests for homogeneity of slopes. Two analyses tested for significance the interaction
between the ANOCOVA's covariate and between-subjects factor. These analyses, one for each of two
dependent variables (i.e., the focal child's total LAB score on each of two occasions: T1 and SY1), had
two independent variables, namely, arrival time-of-year (a continuous variable) and grade cohort (two
levels: third-grade entrant and fourth-grade entrant). Each analysis tested the interaction between
these two independent variables after controlling for these two independent variables' individual
effects.
Effect: arrival time-of-year by cohort
Dependent variableHypothesis
mean squareError mean
squareF
(df = 1, 214)Significance
of F
LAB score
T1 11.4 626.2 0.0 > .85
SY1 257.4 620.6 0.4 > .50
2. Tests for homogeneity of variances for each dependent variable across levels of the
ANOCOVA's between-subjects factor
Results for LAB score
Test statistic T1 SY1
Cochran's C (df = 108, 2) .560 .503
Significance level (approx.) > .20 > .90
Bartlett-Box F (df = 1, 136136) 1.557 0.005
Significance level > .20 > .90
(appendix continues)

84
Appendix H continued
II. Subsample: the focal children who stayed in schools stateside from their T1 until at least the end of
their Year 1 (continued)
C. Means, standard deviations, and confidence intervals for the dependent variables (unadjusted)
Variable, cohort, and occasion M SD 95% confidence interval
LAB score
3rd-grade entrant
T1 22.4 23.8 18.1 26.7
SY1 53.0 24.9 48.5 57.6
4th-grade entrant
T1 29.3 26.9 23.9 34.7
SY1 61.9 24.8 56.9 66.8
n = 218 focal children (120 third-grade entrants and 98 fourth-grade entrants).
D. Conclusions
The repeated-measures ANOCOVA shows that both the within-subjects (i.e., occasion) and
between-subjects (i.e., cohort) main effects are significant. The interaction between these two factors
is nonsignificant. The occasion main effect is large; the cohort main effect is small. The LAB means
increased in size over time (i.e., across occasions). The LAB means are smaller for the third-grade-
entrant cohort than for the fourth-grade-entrant cohort.
The tests for assumptions that underlie the ANOCOVA do not show any violations: The tests for
homogeneity of slopes show that the covariate-by-factor interaction (i.e., arrival time-of-year by cohort)
is nonsignificant for each of the two dependent variables, thus showing no violations of the assumption
of homogeneous slopes. Similarly, the Cochran's C values and the Bartlett-Box F values show no
violations of the assumption of homogeneous variances.
(appendix continues)
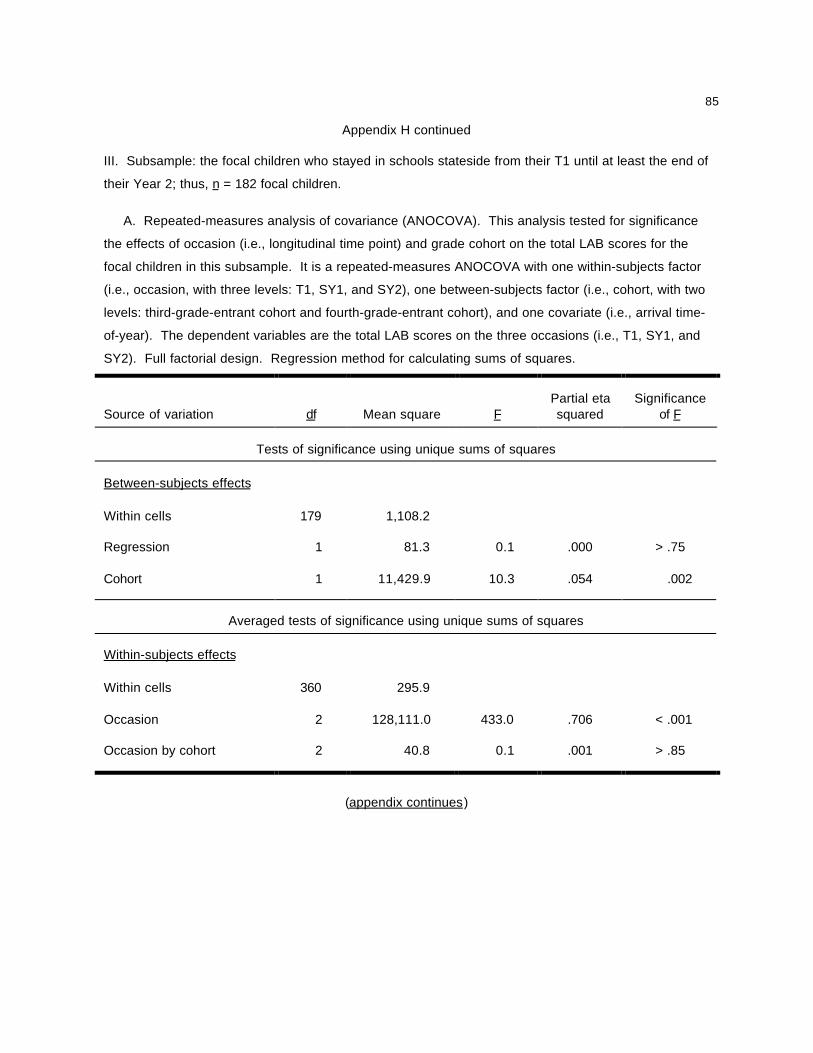
85
Appendix H continued
III. Subsample: the focal children who stayed in schools stateside from their T1 until at least the end of
their Year 2; thus, n = 182 focal children.
A. Repeated-measures analysis of covariance (ANOCOVA). This analysis tested for significance
the effects of occasion (i.e., longitudinal time point) and grade cohort on the total LAB scores for the
focal children in this subsample. It is a repeated-measures ANOCOVA with one within-subjects factor
(i.e., occasion, with three levels: T1, SY1, and SY2), one between-subjects factor (i.e., cohort, with two
levels: third-grade-entrant cohort and fourth-grade-entrant cohort), and one covariate (i.e., arrival time-
of-year). The dependent variables are the total LAB scores on the three occasions (i.e., T1, SY1, and
SY2). Full factorial design. Regression method for calculating sums of squares.
Source of variation df Mean square FPartial etasquared
Significanceof F
Tests of significance using unique sums of squares
Between-subjects effects
Within cells 179 1,108.2
Regression 1 81.3 0.1 .000 > .75
Cohort 1 11,429.9 10.3 .054 .002
Averaged tests of significance using unique sums of squares
Within-subjects effects
Within cells 360 295.9
Occasion 2 128,111.0 433.0 .706 < .001
Occasion by cohort 2 40.8 0.1 .001 > .85
(appendix continues)
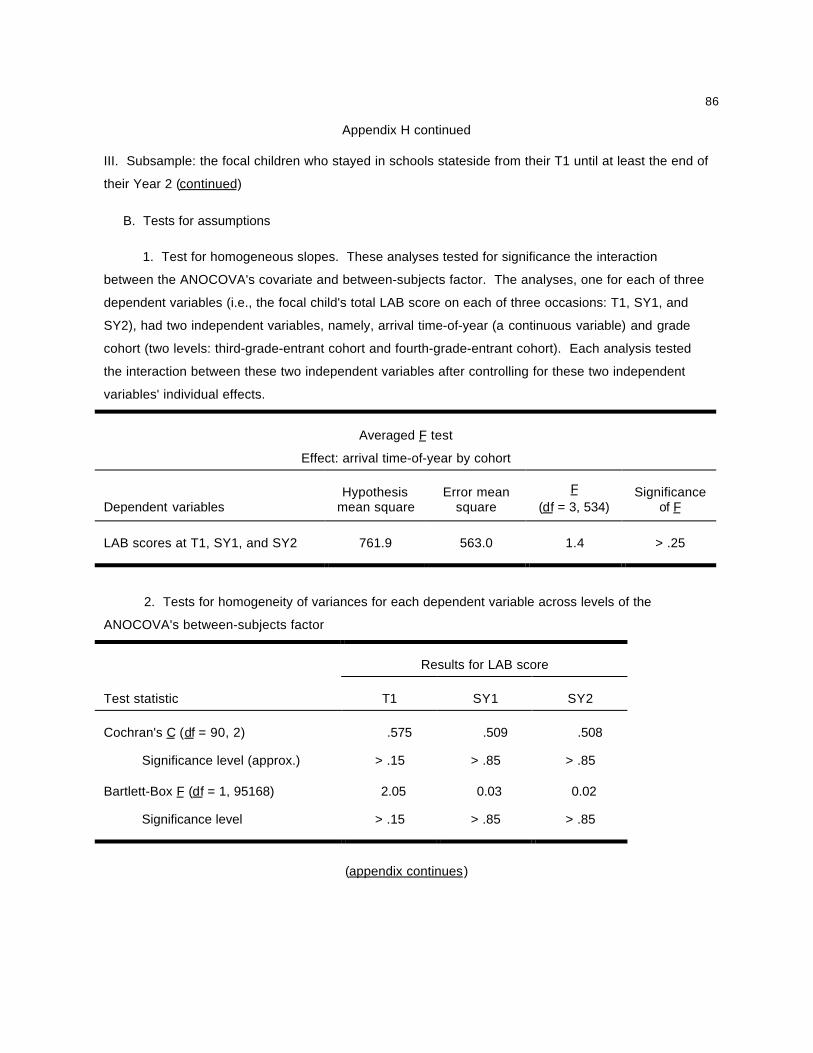
86
Appendix H continued
III. Subsample: the focal children who stayed in schools stateside from their T1 until at least the end of
their Year 2 (continued)
B. Tests for assumptions
1. Test for homogeneous slopes. These analyses tested for significance the interaction
between the ANOCOVA's covariate and between-subjects factor. The analyses, one for each of three
dependent variables (i.e., the focal child's total LAB score on each of three occasions: T1, SY1, and
SY2), had two independent variables, namely, arrival time-of-year (a continuous variable) and grade
cohort (two levels: third-grade-entrant cohort and fourth-grade-entrant cohort). Each analysis tested
the interaction between these two independent variables after controlling for these two independent
variables' individual effects.
Averaged F test
Effect: arrival time-of-year by cohort
Dependent variablesHypothesis
mean squareError mean
squareF
(df = 3, 534)Significance
of F
LAB scores at T1, SY1, and SY2 761.9 563.0 1.4 > .25
2. Tests for homogeneity of variances for each dependent variable across levels of the
ANOCOVA's between-subjects factor
Results for LAB score
Test statistic T1 SY1 SY2
Cochran's C (df = 90, 2) .575 .509 .508
Significance level (approx.) > .15 > .85 > .85
Bartlett-Box F (df = 1, 95168) 2.05 0.03 0.02
Significance level > .15 > .85 > .85
(appendix continues)

87
Appendix H continued
III. Subsample: the focal children who stayed in schools stateside from their T1 until at least the end of
their Year 2 (continued)
B. Tests for assumptions (continued)
3. Sphericity test for the effects involving the within-subjects factor
Mauchly's W = .912, Chi square (approx.) = 16.6 (df = 2), significance level < .001
Epsilon: Greenhouse-Geisser = .919, Huynh-Feldt = .933, lower-bound = .500
The ANOCOVA's F value for the occasion main effect remains significant after its df have been
adjusted for epsilon, including the lower-bound epsilon. I.e., original df = 2 and 360, which, when
adjusted for the obtained lower-bound epsilon value, become 1 and 180 (i.e., .500 x 2 = 1;
.500 x 360 = 180); for averaged F = 433 with df = 1 and 180, significance level < .001.
(appendix continues)

88
Appendix H continued
III. Subsample: the focal children who stayed in schools stateside from their T1 until at least the end of
their Year 2 (continued)
C. Means, standard deviations, and confidence intervals for the dependent variables (unadjusted)
Variable, cohort, and occasion M SD 95% confidence interval
LAB score
3rd-grade entrant
T1 23.2 24.0 18.5 28.0
SY1 54.8 24.7 49.8 59.7
SY2 76.9 20.9 72.7 81.0
4th-grade entrant
T1 32.8 27.9 26.7 38.8
SY1 64.6 24.2 59.4 69.9
SY2 85.0 20.5 80.5 89.4
n = 182 focal children (99 third-grade entrants and 83 fourth-grade entrants).
D. Conclusions
The repeated-measures ANOCOVA shows that both the within-subjects (i.e., occasion) and
between-subjects (i.e., cohort) main effects are significant. The interaction between these two factors
is nonsignificant. The occasion main effect is large; the cohort main effect is small. The LAB means
increased in size over time (i.e., across occasions). The LAB means are smaller for the third-grade-
entrant cohort than for the fourth-grade-entrant cohort.
The tests for assumptions that underlie the ANOCOVA do not show any violations of
consequence: The tests for homogeneity of slopes show that the covariate-by-factor interactions (i.e.,
arrival time-of-year by cohort) are nonsignificant, thus showing no violation of the assumption of
homogeneous slopes. Similarly, the Cochran's C values and the Bartlett-Box F values show no
violations of the assumption of homogeneous variances. Although the significance level for Mauchly's
W is small, the epsilon-adjusted degrees of freedom for the within-subjects effects do not alter the
present conclusions regarding the ANOCOVA results.

89
Appendix I
Summary Frequency Distributions of Focal Children on the Total LAB Scores, by Grade Cohort,
for the First and Last Longitudinal Time Points
3rd-grade-entrantcohort
4th-grade-entrant cohort Combined cohorts
T1 SY2 T1 SY2 T1 SY2
Raw-score interval Percentage of focal children
100 to 112 0 14 3 23 1 18
90 to 99 1 12 1 18 1 15
80 to 89 2 12 2 16 2 14
70 to 79 4 20 5 5 4 13
60 to 69 5 12 7 14 6 13
50 to 59 3 11 4 12 3 11
40 to 49 4 9 4 4 4 6
30 to 39 6 9 34 5 18 7
20 to 29 31 1 7 4 20 2
10 to 19 5 2 5 0 5 1
0 to 9 41 0 30 0 36 0
100 100 100 100 100 100
Note. N = 231 focal children (127 in the 3rd-grade-entrant cohort, 104 in the 4th-grade-entrant cohort).
This table summarizes each frequency distribution by collapsing the range of raw scores into grouping
intervals; however, all the statistical analyses for this study are based on the detailed data.
Percentages are within rounding error.
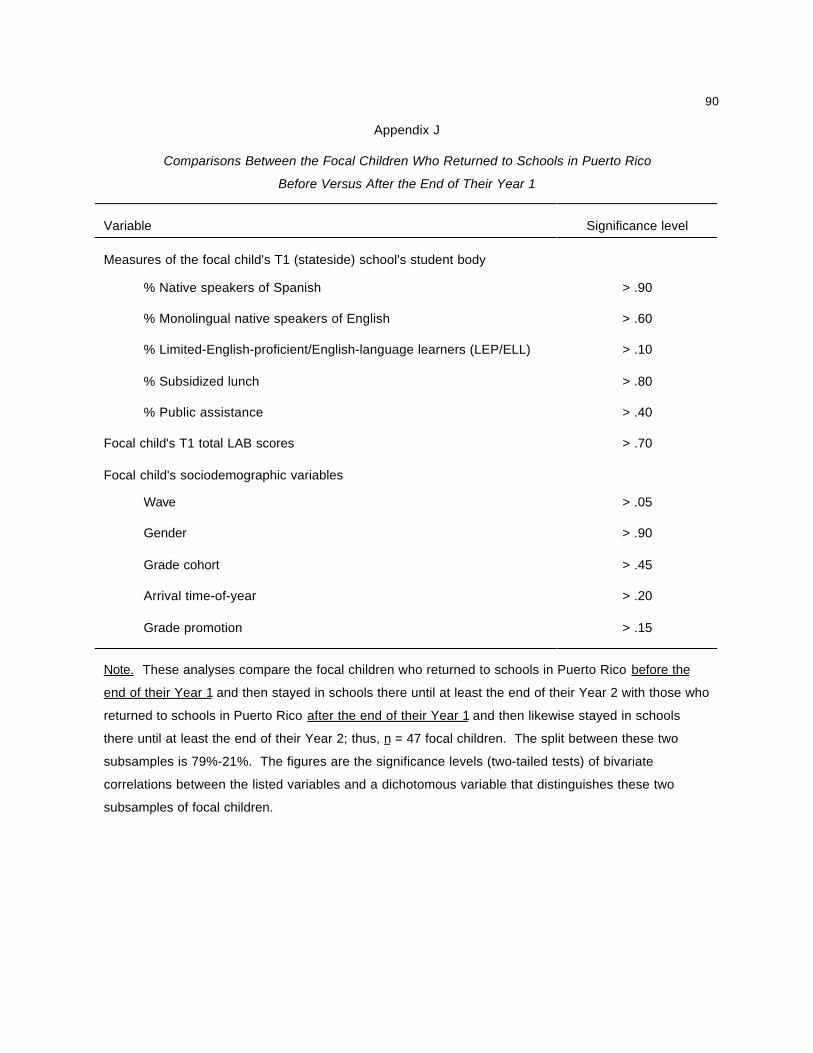
90
Appendix J
Comparisons Between the Focal Children Who Returned to Schools in Puerto Rico
Before Versus After the End of Their Year 1
Variable Significance level
Measures of the focal child's T1 (stateside) school's student body
% Native speakers of Spanish > .90
% Monolingual native speakers of English > .60
% Limited-English-proficient/English-language learners (LEP/ELL) > .10
% Subsidized lunch > .80
% Public assistance > .40
Focal child's T1 total LAB scores > .70
Focal child's sociodemographic variables
Wave > .05
Gender > .90
Grade cohort > .45
Arrival time-of-year > .20
Grade promotion > .15
Note. These analyses compare the focal children who returned to schools in Puerto Rico before the
end of their Year 1 and then stayed in schools there until at least the end of their Year 2 with those who
returned to schools in Puerto Rico after the end of their Year 1 and then likewise stayed in schools
there until at least the end of their Year 2; thus, n = 47 focal children. The split between these two
subsamples is 79%-21%. The figures are the significance levels (two-tailed tests) of bivariate
correlations between the listed variables and a dichotomous variable that distinguishes these two
subsamples of focal children.

91
Appendix K
Economic Poverty Level of Focal Children's Mainland and Island Schools' Student Bodies:
Doubly Multivariate Repeated-Measures Analysis of Variance, Univariate F Tests,
Tests for Assumptions, Means, Standard Deviations, and Confidence Intervals
I. Doubly multivariate repeated-measures analysis of variance. This analysis is based on the focal
children who returned to schools in Puerto Rico. It compares the economic poverty level of these
children's stateside schools (i.e., the schools they attended at their T1) with that of the schools they
attended in Puerto Rico upon returning thereto (i.e., the schools they attended at their SY2). It is a
doubly multivariate repeated-measures analysis of variance with one within-subjects factor (i.e.,
longitudinal occasion, with two levels: T1 and SY2) and one between-subjects factor (i.e., grade cohort,
also with two levels: third-grade-entrant cohort and fourth-grade-entrant cohort). Dependent variables:
student bodies' % subsidized lunch and % public assistance, both measured on each of the two
occasions (i.e., T1 and SY2). Full factorial design. Regression method for calculating sums of
squares. Subsample: the focal children who returned to Puerto Rico and then stayed in schools there
until at least the end of their Year 2; thus, n = 47 focal children (28 third-grade entrants and 19 fourth-
grade entrants).
Multivariate tests of significance
Test statistic ValueF (exact)
(df = 2, 44) Significance of F
Between-subjects main effect: cohort
Pillai's trace .019 0.4 > .65
Hotelling's trace .019 0.4 > .65
Wilks' lambda .981 0.4 > .65
(appendix continues)

92
Appendix K continued
I. Doubly multivariate repeated-measures analysis of variance (continued)
Multivariate tests of significance (continued)
Test statistic ValueF (exact)
(df = 2, 44) Significance of F
Within-subjects interaction effect: cohort by occasion
Pillai's trace .009 0.2 > .80
Hotelling's trace .009 0.2 > .80
Wilks' lambda .991 0.2 > .80
Within-subjects main effect: occasion
Pillai's trace .208 5.8 .006
Hotelling's trace .262 5.8 .006
Wilks' lambda .792 5.8 .006
II. Univariate F tests for the occasion main effect
VariableHypothesis
mean squareError mean
squareF
(df = 1, 45) Significance of F
% Subsidized lunch 212.1 301.7 0.7 > .40
% Public assistance 5,391.6 457.2 11.8 .001
(appendix continues)
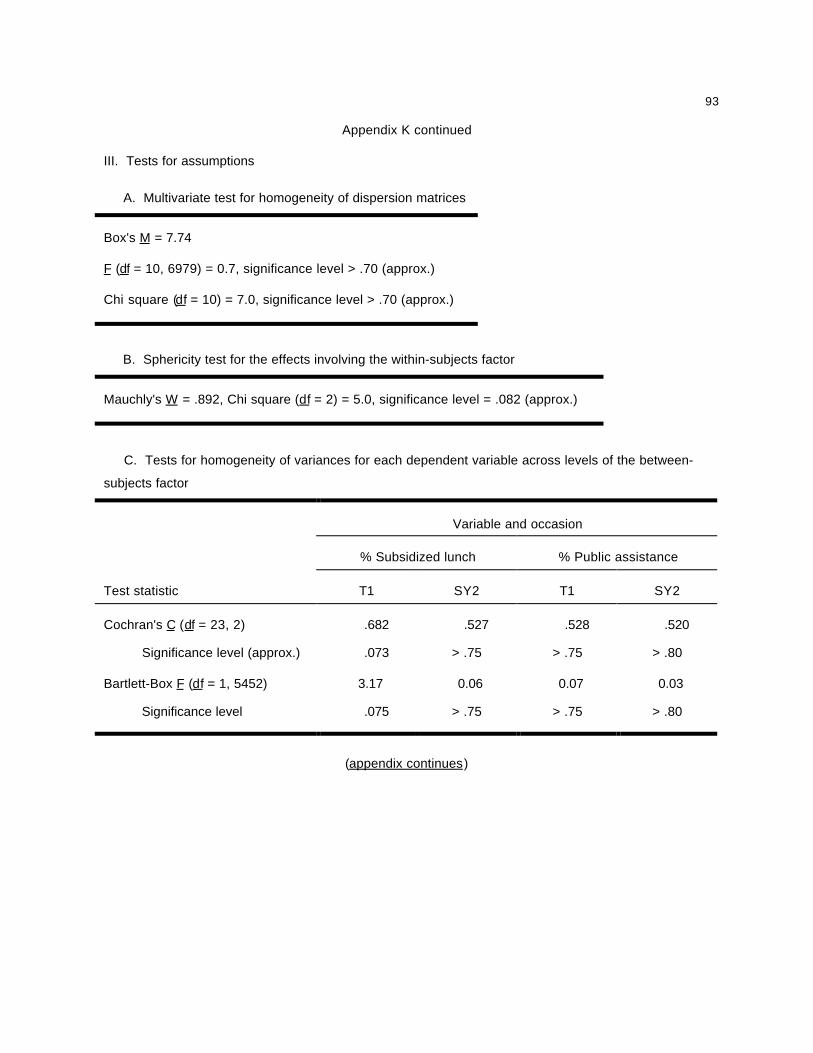
93
Appendix K continued
III. Tests for assumptions
A. Multivariate test for homogeneity of dispersion matrices
Box's M = 7.74
F (df = 10, 6979) = 0.7, significance level > .70 (approx.)
Chi square (df = 10) = 7.0, significance level > .70 (approx.)
B. Sphericity test for the effects involving the within-subjects factor
Mauchly's W = .892, Chi square (df = 2) = 5.0, significance level = .082 (approx.)
C. Tests for homogeneity of variances for each dependent variable across levels of the between-
subjects factor
Variable and occasion
% Subsidized lunch % Public assistance
Test statistic T1 SY2 T1 SY2
Cochran's C (df = 23, 2) .682 .527 .528 .520
Significance level (approx.) .073 > .75 > .75 > .80
Bartlett-Box F (df = 1, 5452) 3.17 0.06 0.07 0.03
Significance level .075 > .75 > .75 > .80
(appendix continues)
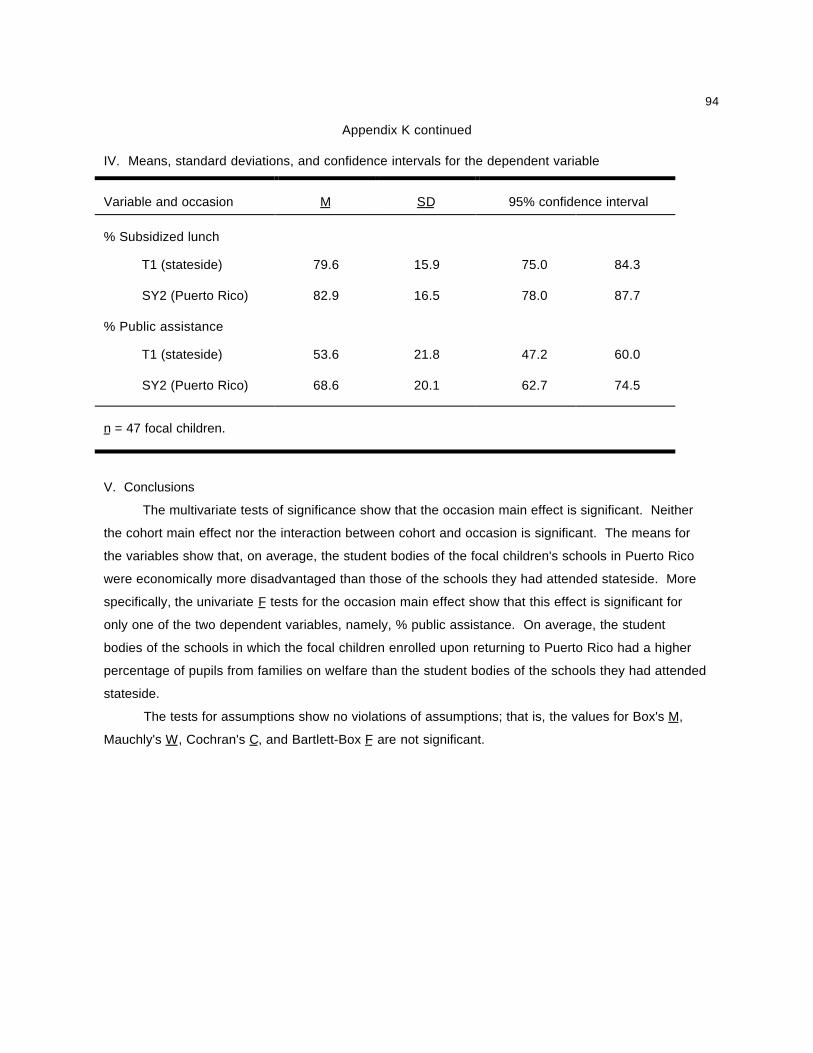
94
Appendix K continued
IV. Means, standard deviations, and confidence intervals for the dependent variable
Variable and occasion M SD 95% confidence interval
% Subsidized lunch
T1 (stateside) 79.6 15.9 75.0 84.3
SY2 (Puerto Rico) 82.9 16.5 78.0 87.7
% Public assistance
T1 (stateside) 53.6 21.8 47.2 60.0
SY2 (Puerto Rico) 68.6 20.1 62.7 74.5
n = 47 focal children.
V. Conclusions
The multivariate tests of significance show that the occasion main effect is significant. Neither
the cohort main effect nor the interaction between cohort and occasion is significant. The means for
the variables show that, on average, the student bodies of the focal children's schools in Puerto Rico
were economically more disadvantaged than those of the schools they had attended stateside. More
specifically, the univariate F tests for the occasion main effect show that this effect is significant for
only one of the two dependent variables, namely, % public assistance. On average, the student
bodies of the schools in which the focal children enrolled upon returning to Puerto Rico had a higher
percentage of pupils from families on welfare than the student bodies of the schools they had attended
stateside.
The tests for assumptions show no violations of assumptions; that is, the values for Box's M,
Mauchly's W, Cochran's C, and Bartlett-Box F are not significant.
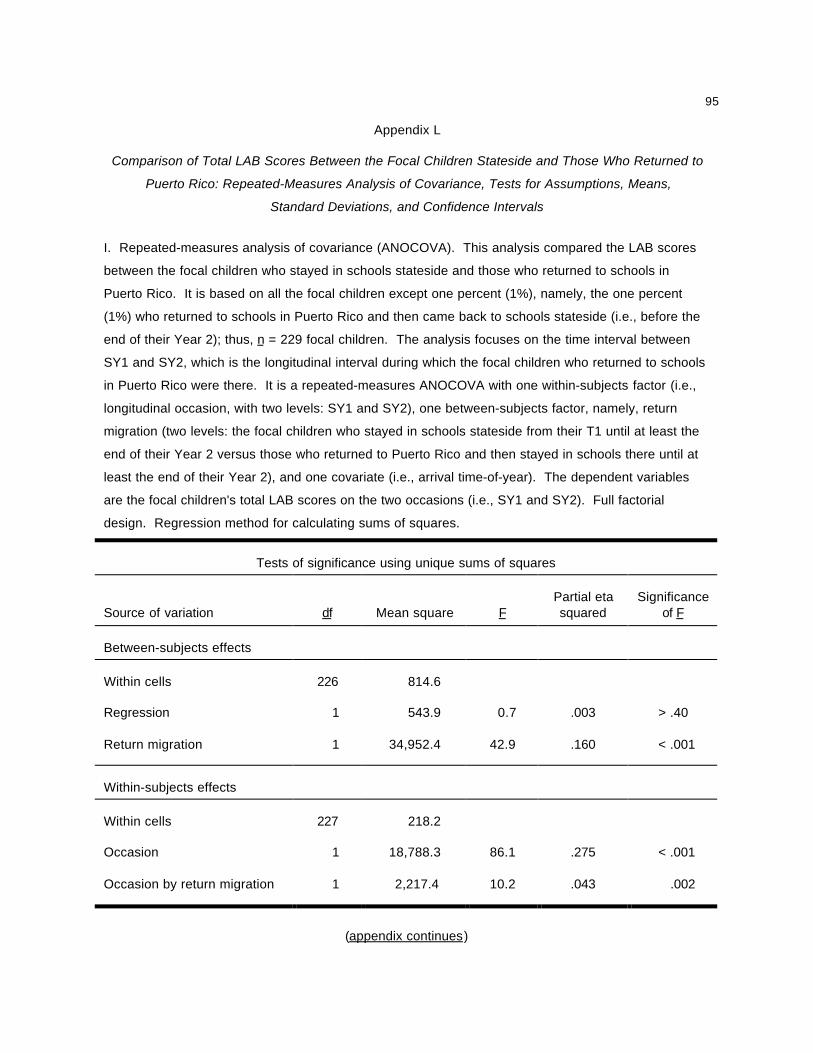
95
Appendix L
Comparison of Total LAB Scores Between the Focal Children Stateside and Those Who Returned to
Puerto Rico: Repeated-Measures Analysis of Covariance, Tests for Assumptions, Means,
Standard Deviations, and Confidence Intervals
I. Repeated-measures analysis of covariance (ANOCOVA). This analysis compared the LAB scores
between the focal children who stayed in schools stateside and those who returned to schools in
Puerto Rico. It is based on all the focal children except one percent (1%), namely, the one percent
(1%) who returned to schools in Puerto Rico and then came back to schools stateside (i.e., before the
end of their Year 2); thus, n = 229 focal children. The analysis focuses on the time interval between
SY1 and SY2, which is the longitudinal interval during which the focal children who returned to schools
in Puerto Rico were there. It is a repeated-measures ANOCOVA with one within-subjects factor (i.e.,
longitudinal occasion, with two levels: SY1 and SY2), one between-subjects factor, namely, return
migration (two levels: the focal children who stayed in schools stateside from their T1 until at least the
end of their Year 2 versus those who returned to Puerto Rico and then stayed in schools there until at
least the end of their Year 2), and one covariate (i.e., arrival time-of-year). The dependent variables
are the focal children's total LAB scores on the two occasions (i.e., SY1 and SY2). Full factorial
design. Regression method for calculating sums of squares.
Tests of significance using unique sums of squares
Source of variation df Mean square FPartial etasquared
Significanceof F
Between-subjects effects
Within cells 226 814.6
Regression 1 543.9 0.7 .003 > .40
Return migration 1 34,952.4 42.9 .160 < .001
Within-subjects effects
Within cells 227 218.2
Occasion 1 18,788.3 86.1 .275 < .001
Occasion by return migration 1 2,217.4 10.2 .043 .002
(appendix continues)
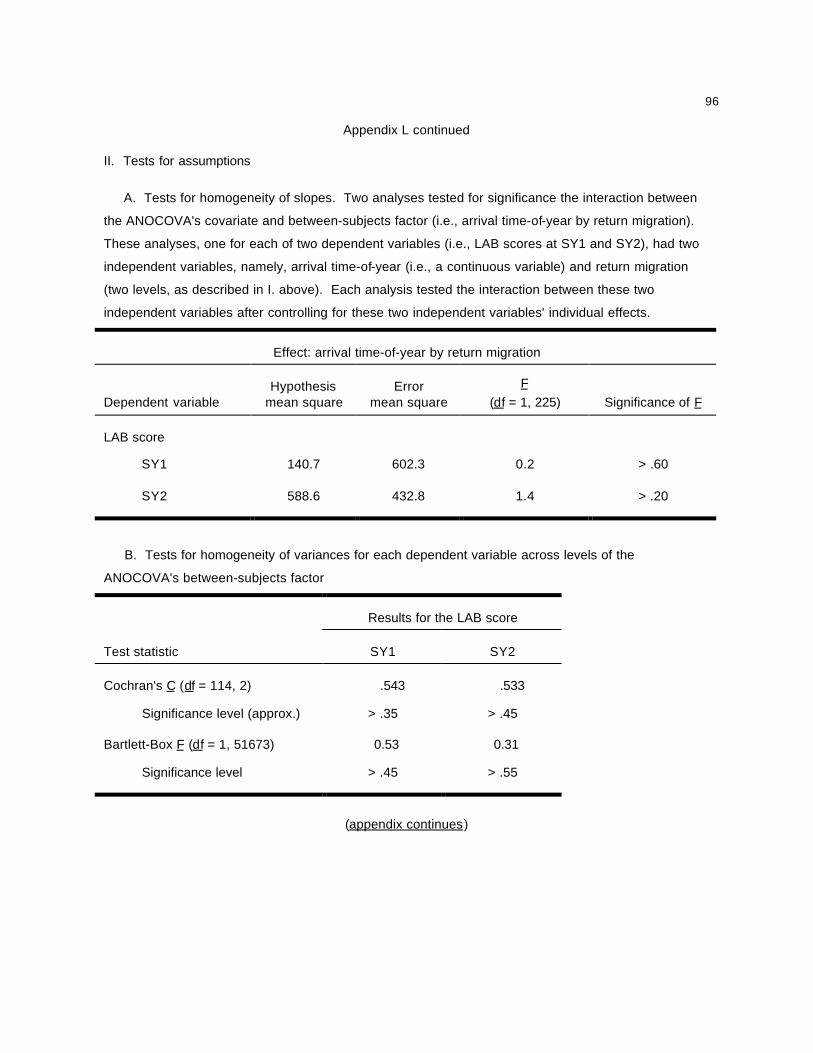
96
Appendix L continued
II. Tests for assumptions
A. Tests for homogeneity of slopes. Two analyses tested for significance the interaction between
the ANOCOVA's covariate and between-subjects factor (i.e., arrival time-of-year by return migration).
These analyses, one for each of two dependent variables (i.e., LAB scores at SY1 and SY2), had two
independent variables, namely, arrival time-of-year (i.e., a continuous variable) and return migration
(two levels, as described in I. above). Each analysis tested the interaction between these two
independent variables after controlling for these two independent variables' individual effects.
Effect: arrival time-of-year by return migration
Dependent variableHypothesis
mean squareError
mean squareF
(df = 1, 225) Significance of F
LAB score
SY1 140.7 602.3 0.2 > .60
SY2 588.6 432.8 1.4 > .20
B. Tests for homogeneity of variances for each dependent variable across levels of the
ANOCOVA's between-subjects factor
Results for the LAB score
Test statistic SY1 SY2
Cochran's C (df = 114, 2) .543 .533
Significance level (approx.) > .35 > .45
Bartlett-Box F (df = 1, 51673) 0.53 0.31
Significance level > .45 > .55
(appendix continues)
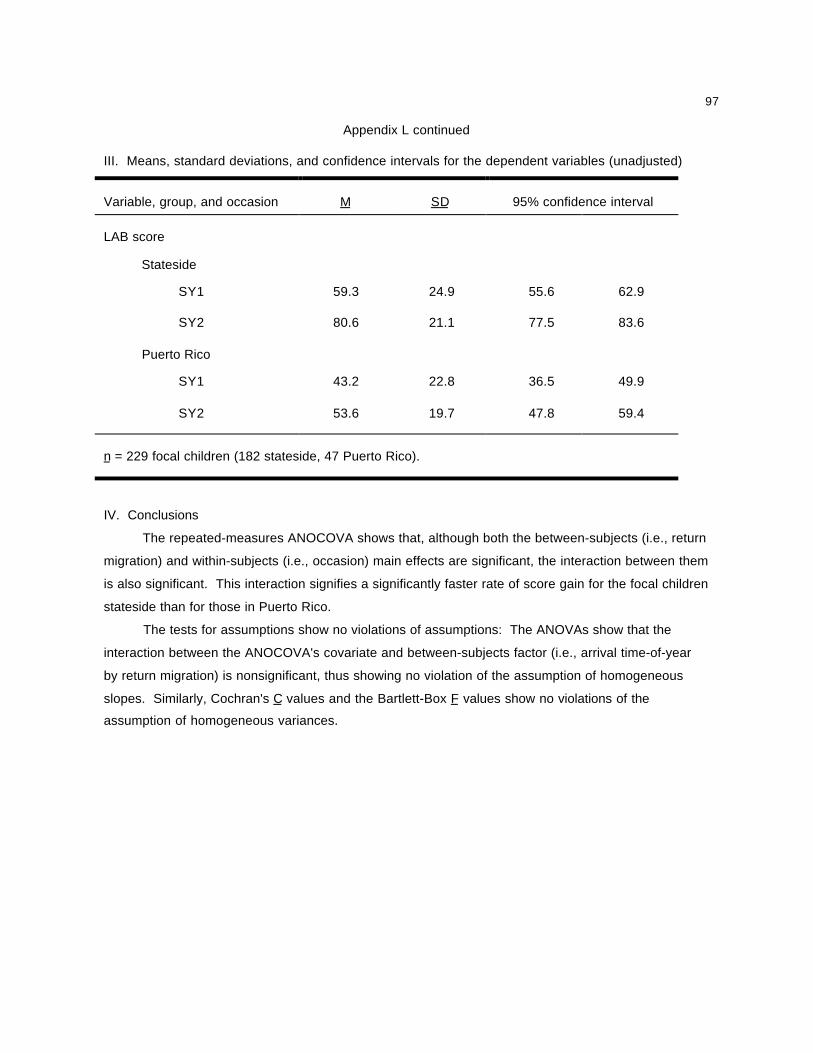
97
Appendix L continued
III. Means, standard deviations, and confidence intervals for the dependent variables (unadjusted)
Variable, group, and occasion M SD 95% confidence interval
LAB score
Stateside
SY1 59.3 24.9 55.6 62.9
SY2 80.6 21.1 77.5 83.6
Puerto Rico
SY1 43.2 22.8 36.5 49.9
SY2 53.6 19.7 47.8 59.4
n = 229 focal children (182 stateside, 47 Puerto Rico).
IV. Conclusions
The repeated-measures ANOCOVA shows that, although both the between-subjects (i.e., return
migration) and within-subjects (i.e., occasion) main effects are significant, the interaction between them
is also significant. This interaction signifies a significantly faster rate of score gain for the focal children
stateside than for those in Puerto Rico.
The tests for assumptions show no violations of assumptions: The ANOVAs show that the
interaction between the ANOCOVA's covariate and between-subjects factor (i.e., arrival time-of-year
by return migration) is nonsignificant, thus showing no violation of the assumption of homogeneous
slopes. Similarly, Cochran's C values and the Bartlett-Box F values show no violations of the
assumption of homogeneous variances.
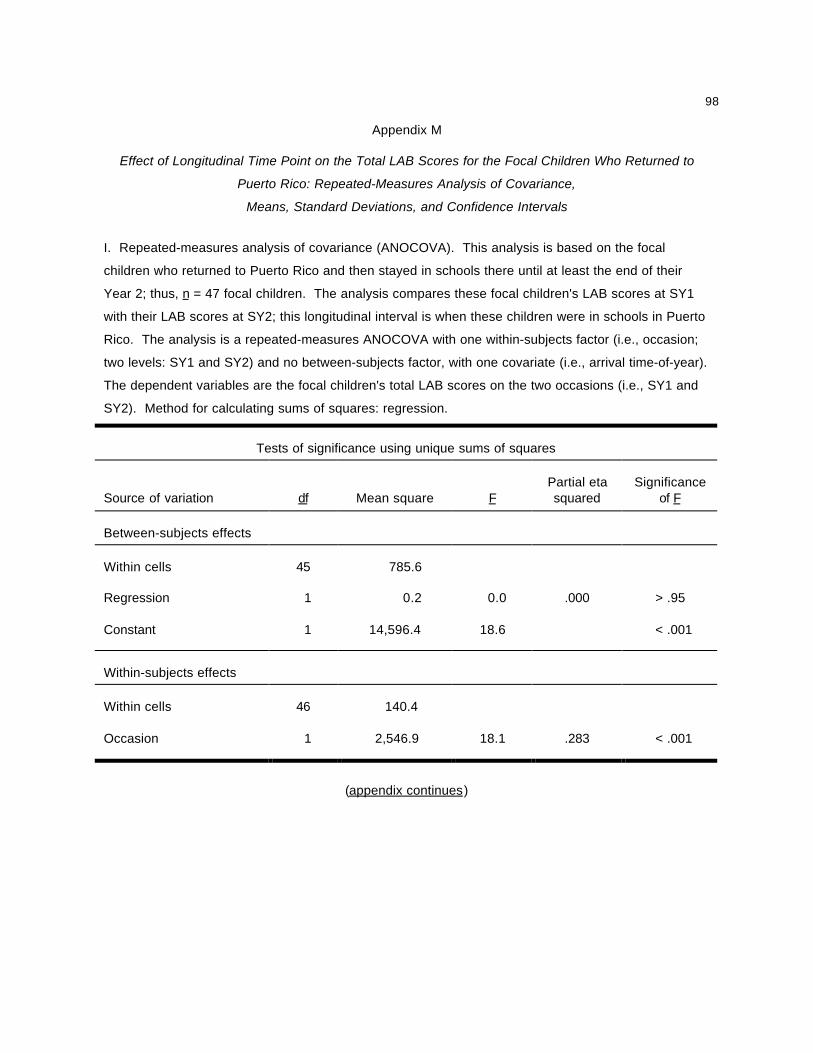
98
Appendix M
Effect of Longitudinal Time Point on the Total LAB Scores for the Focal Children Who Returned to
Puerto Rico: Repeated-Measures Analysis of Covariance,
Means, Standard Deviations, and Confidence Intervals
I. Repeated-measures analysis of covariance (ANOCOVA). This analysis is based on the focal
children who returned to Puerto Rico and then stayed in schools there until at least the end of their
Year 2; thus, n = 47 focal children. The analysis compares these focal children's LAB scores at SY1
with their LAB scores at SY2; this longitudinal interval is when these children were in schools in Puerto
Rico. The analysis is a repeated-measures ANOCOVA with one within-subjects factor (i.e., occasion;
two levels: SY1 and SY2) and no between-subjects factor, with one covariate (i.e., arrival time-of-year).
The dependent variables are the focal children's total LAB scores on the two occasions (i.e., SY1 and
SY2). Method for calculating sums of squares: regression.
Tests of significance using unique sums of squares
Source of variation df Mean square FPartial etasquared
Significanceof F
Between-subjects effects
Within cells 45 785.6
Regression 1 0.2 0.0 .000 > .95
Constant 1 14,596.4 18.6 < .001
Within-subjects effects
Within cells 46 140.4
Occasion 1 2,546.9 18.1 .283 < .001
(appendix continues)

99
Appendix M continued
II. Means, standard deviations, and confidence intervals for the dependent variables (unadjusted)
Variable and occasion M SD 95% confidence interval
LAB score
SY1 43.2 22.8 36.5 49.9
SY2 53.6 19.7 47.8 59.4
n = 47 focal children.
III. Conclusion
The repeated-measures ANOCOVA shows a significant difference in LAB scores between the
two longitudinal occasions. That is, after focal children returned to Puerto Rico, their mean LAB scores
continued to increase at a statistically significant rate.
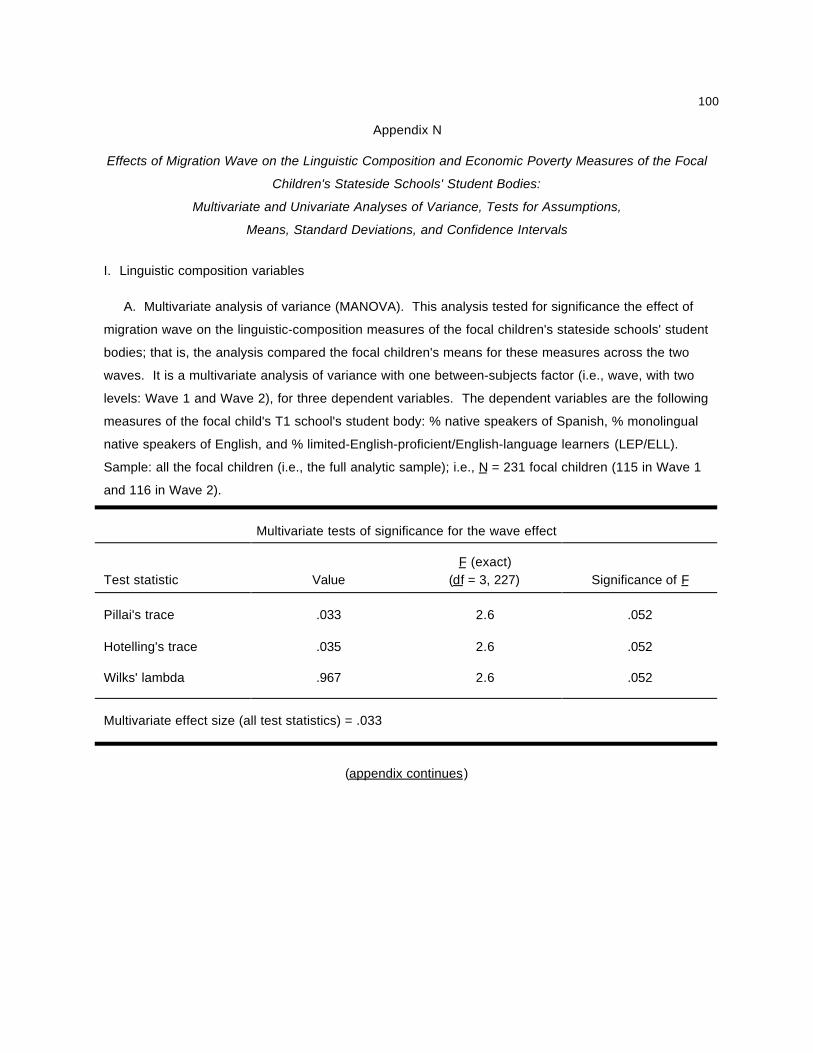
100
Appendix N
Effects of Migration Wave on the Linguistic Composition and Economic Poverty Measures of the Focal
Children's Stateside Schools' Student Bodies:
Multivariate and Univariate Analyses of Variance, Tests for Assumptions,
Means, Standard Deviations, and Confidence Intervals
I. Linguistic composition variables
A. Multivariate analysis of variance (MANOVA). This analysis tested for significance the effect of
migration wave on the linguistic-composition measures of the focal children's stateside schools' student
bodies; that is, the analysis compared the focal children's means for these measures across the two
waves. It is a multivariate analysis of variance with one between-subjects factor (i.e., wave, with two
levels: Wave 1 and Wave 2), for three dependent variables. The dependent variables are the following
measures of the focal child's T1 school's student body: % native speakers of Spanish, % monolingual
native speakers of English, and % limited-English-proficient/English-language learners (LEP/ELL).
Sample: all the focal children (i.e., the full analytic sample); i.e., N = 231 focal children (115 in Wave 1
and 116 in Wave 2).
Multivariate tests of significance for the wave effect
Test statistic ValueF (exact)
(df = 3, 227) Significance of F
Pillai's trace .033 2.6 .052
Hotelling's trace .035 2.6 .052
Wilks' lambda .967 2.6 .052
Multivariate effect size (all test statistics) = .033
(appendix continues)

101
Appendix N continued
I. Linguistic composition variables (continued)
B. Univariate F tests for the wave effect
Dependent variable
Hypothesismean
square
Errormean
squareF
(df = 1, 229)Eta
squaredSignificance
of F
% Native speakers of Spanish 2,931.7 531.6 5.5 .024 .020
% Monolingual nativespeakers of English
1,924.7 602.8 3.2 .014 .075
% Limited-English-proficient/English-language learners(LEP/ELL)
1,200.5 192.9 6.2 .026 .013
(appendix continues)
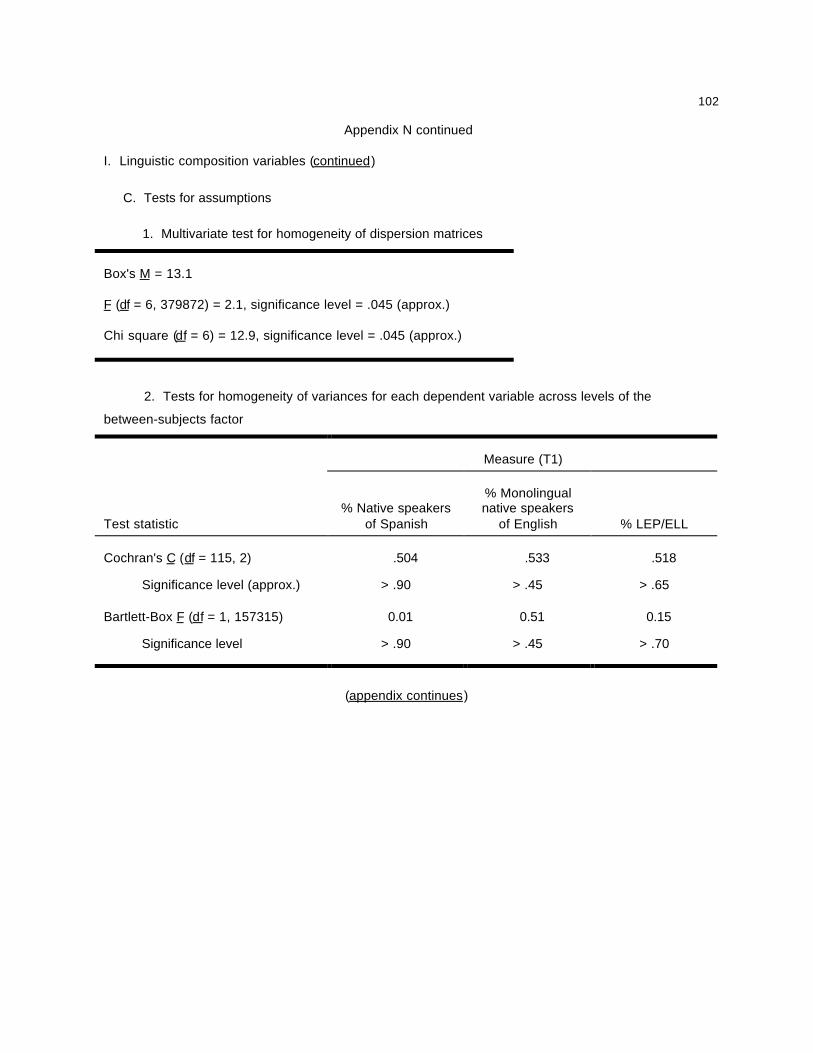
102
Appendix N continued
I. Linguistic composition variables (continued)
C. Tests for assumptions
1. Multivariate test for homogeneity of dispersion matrices
Box's M = 13.1
F (df = 6, 379872) = 2.1, significance level = .045 (approx.)
Chi square (df = 6) = 12.9, significance level = .045 (approx.)
2. Tests for homogeneity of variances for each dependent variable across levels of the
between-subjects factor
Measure (T1)
Test statistic% Native speakers
of Spanish
% Monolingualnative speakers
of English % LEP/ELL
Cochran's C (df = 115, 2) .504 .533 .518
Significance level (approx.) > .90 > .45 > .65
Bartlett-Box F (df = 1, 157315) 0.01 0.51 0.15
Significance level > .90 > .45 > .70
(appendix continues)
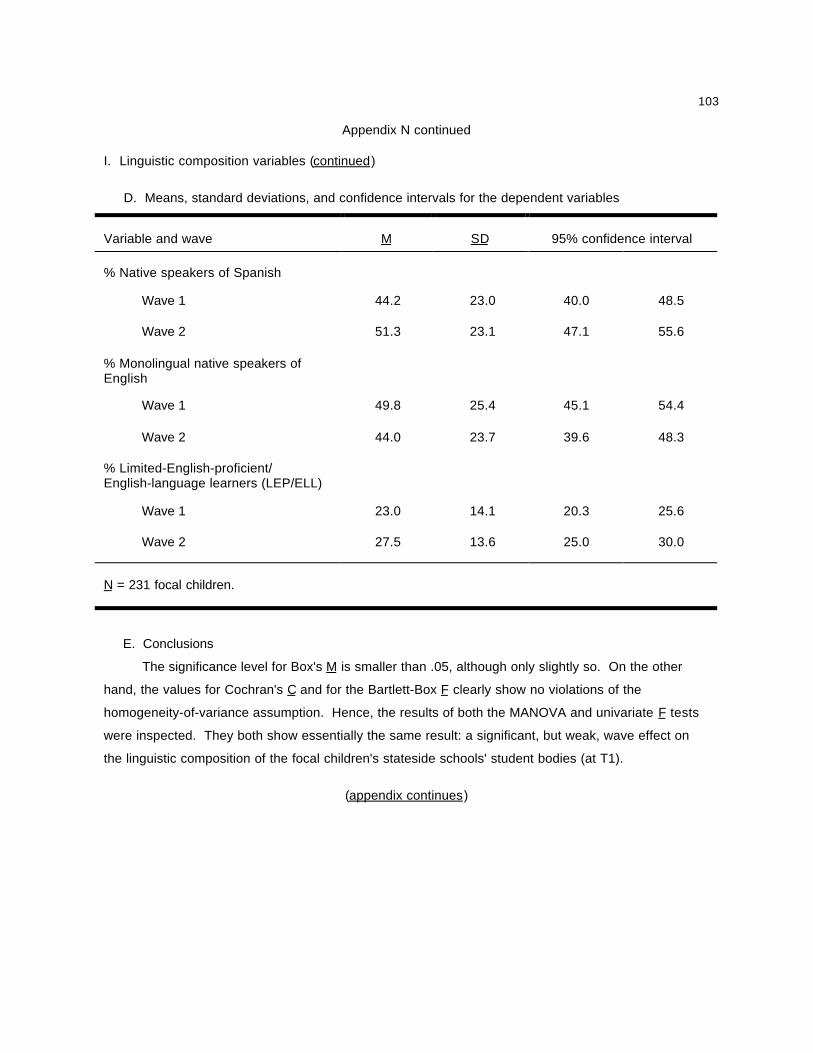
103
Appendix N continued
I. Linguistic composition variables (continued)
D. Means, standard deviations, and confidence intervals for the dependent variables
Variable and wave M SD 95% confidence interval
% Native speakers of Spanish
Wave 1 44.2 23.0 40.0 48.5
Wave 2 51.3 23.1 47.1 55.6
% Monolingual native speakers ofEnglish
Wave 1 49.8 25.4 45.1 54.4
Wave 2 44.0 23.7 39.6 48.3
% Limited-English-proficient/English-language learners (LEP/ELL)
Wave 1 23.0 14.1 20.3 25.6
Wave 2 27.5 13.6 25.0 30.0
N = 231 focal children.
E. Conclusions
The significance level for Box's M is smaller than .05, although only slightly so. On the other
hand, the values for Cochran's C and for the Bartlett-Box F clearly show no violations of the
homogeneity-of-variance assumption. Hence, the results of both the MANOVA and univariate F tests
were inspected. They both show essentially the same result: a significant, but weak, wave effect on
the linguistic composition of the focal children's stateside schools' student bodies (at T1).
(appendix continues)
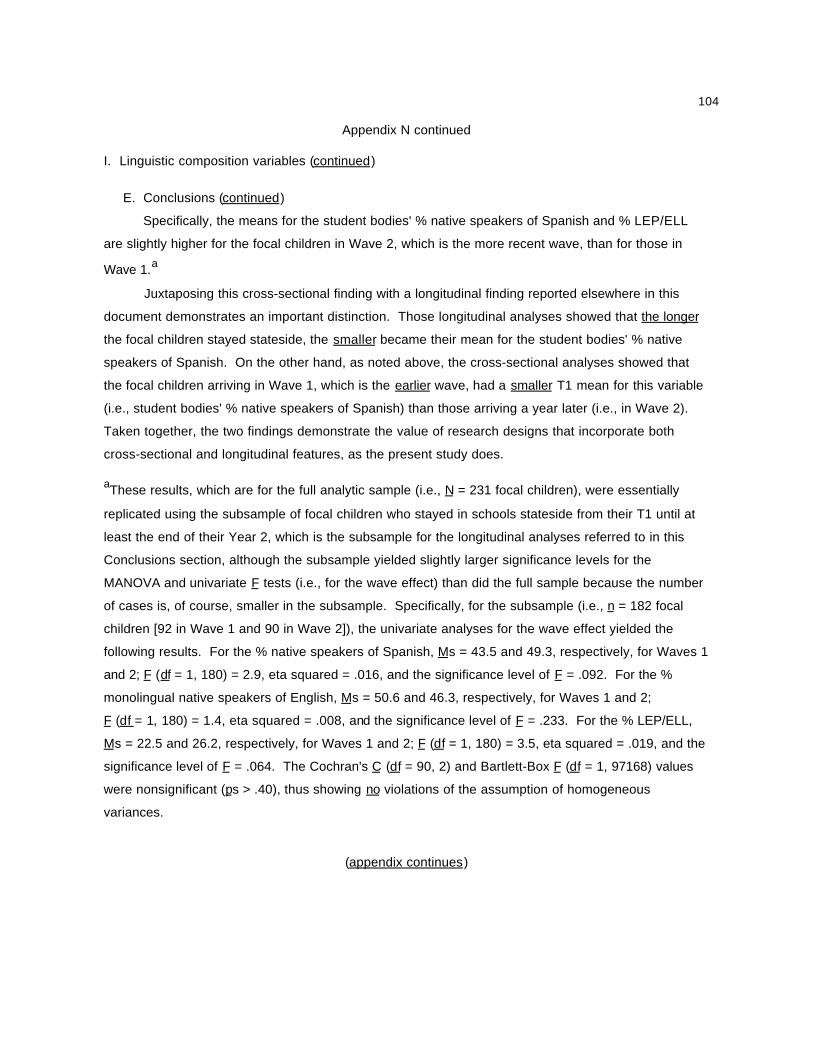
104
Appendix N continued
I. Linguistic composition variables (continued)
E. Conclusions (continued)
Specifically, the means for the student bodies' % native speakers of Spanish and % LEP/ELL
are slightly higher for the focal children in Wave 2, which is the more recent wave, than for those in
Wave 1.a
Juxtaposing this cross-sectional finding with a longitudinal finding reported elsewhere in this
document demonstrates an important distinction. Those longitudinal analyses showed that the longer
the focal children stayed stateside, the smaller became their mean for the student bodies' % native
speakers of Spanish. On the other hand, as noted above, the cross-sectional analyses showed that
the focal children arriving in Wave 1, which is the earlier wave, had a smaller T1 mean for this variable
(i.e., student bodies' % native speakers of Spanish) than those arriving a year later (i.e., in Wave 2).
Taken together, the two findings demonstrate the value of research designs that incorporate both
cross-sectional and longitudinal features, as the present study does.
aThese results, which are for the full analytic sample (i.e., N = 231 focal children), were essentially
replicated using the subsample of focal children who stayed in schools stateside from their T1 until at
least the end of their Year 2, which is the subsample for the longitudinal analyses referred to in this
Conclusions section, although the subsample yielded slightly larger significance levels for the
MANOVA and univariate F tests (i.e., for the wave effect) than did the full sample because the number
of cases is, of course, smaller in the subsample. Specifically, for the subsample (i.e., n = 182 focal
children [92 in Wave 1 and 90 in Wave 2]), the univariate analyses for the wave effect yielded the
following results. For the % native speakers of Spanish, Ms = 43.5 and 49.3, respectively, for Waves 1
and 2; F (df = 1, 180) = 2.9, eta squared = .016, and the significance level of F = .092. For the %
monolingual native speakers of English, Ms = 50.6 and 46.3, respectively, for Waves 1 and 2;
F (df = 1, 180) = 1.4, eta squared = .008, and the significance level of F = .233. For the % LEP/ELL,
Ms = 22.5 and 26.2, respectively, for Waves 1 and 2; F (df = 1, 180) = 3.5, eta squared = .019, and the
significance level of F = .064. The Cochran's C (df = 90, 2) and Bartlett-Box F (df = 1, 97168) values
were nonsignificant (ps > .40), thus showing no violations of the assumption of homogeneous
variances.
(appendix continues)
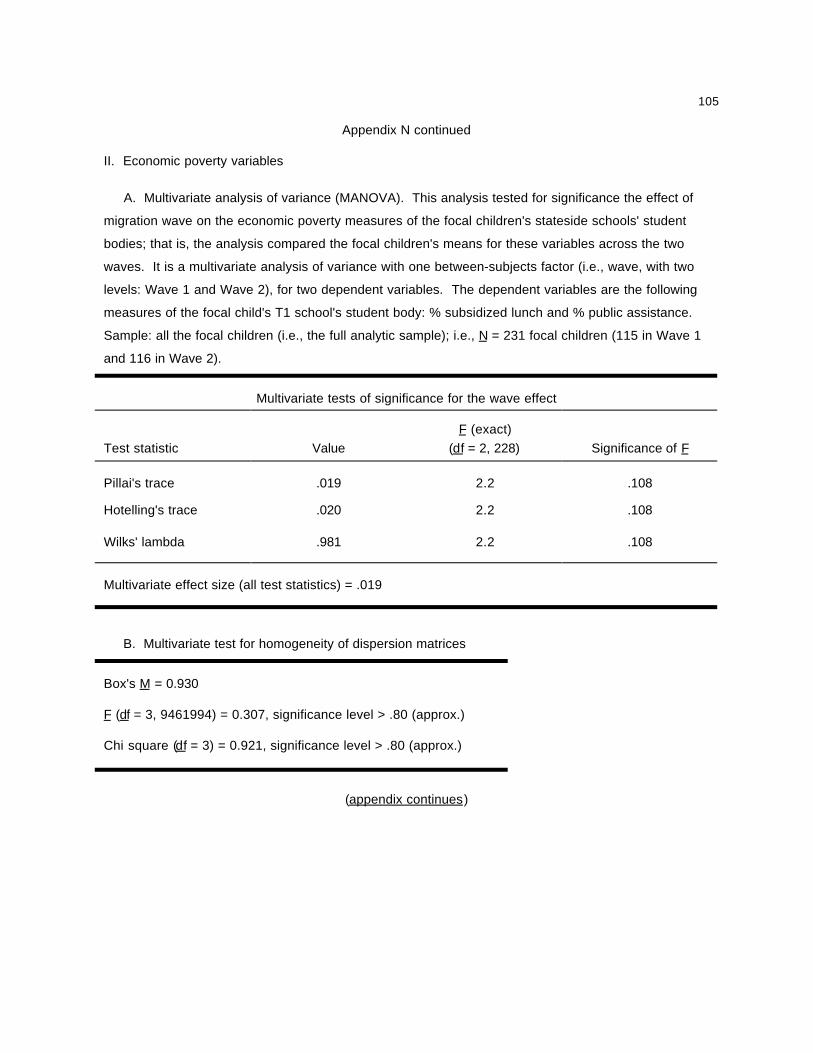
105
Appendix N continued
II. Economic poverty variables
A. Multivariate analysis of variance (MANOVA). This analysis tested for significance the effect of
migration wave on the economic poverty measures of the focal children's stateside schools' student
bodies; that is, the analysis compared the focal children's means for these variables across the two
waves. It is a multivariate analysis of variance with one between-subjects factor (i.e., wave, with two
levels: Wave 1 and Wave 2), for two dependent variables. The dependent variables are the following
measures of the focal child's T1 school's student body: % subsidized lunch and % public assistance.
Sample: all the focal children (i.e., the full analytic sample); i.e., N = 231 focal children (115 in Wave 1
and 116 in Wave 2).
Multivariate tests of significance for the wave effect
Test statistic ValueF (exact)
(df = 2, 228) Significance of F
Pillai's trace .019 2.2 .108
Hotelling's trace .020 2.2 .108
Wilks' lambda .981 2.2 .108
Multivariate effect size (all test statistics) = .019
B. Multivariate test for homogeneity of dispersion matrices
Box's M = 0.930
F (df = 3, 9461994) = 0.307, significance level > .80 (approx.)
Chi square (df = 3) = 0.921, significance level > .80 (approx.)
(appendix continues)
106
Appendix N continued
II. Economic poverty variables (continued)
C. Conclusions
The MANOVA for the economic poverty variables shows that the wave effect on these variables
is not significant. Box's M shows that the assumption of homogeneous dispersion matrices is not
violated. The focal children's means for the economic poverty measures of their T1 (stateside)
schools' student bodies do not differ significantly across migration waves.b
bThese results, which are for the full analytic sample, were replicated using the subsample of focal
children who stayed in schools stateside from their T1 until at least the end of their Year 2.
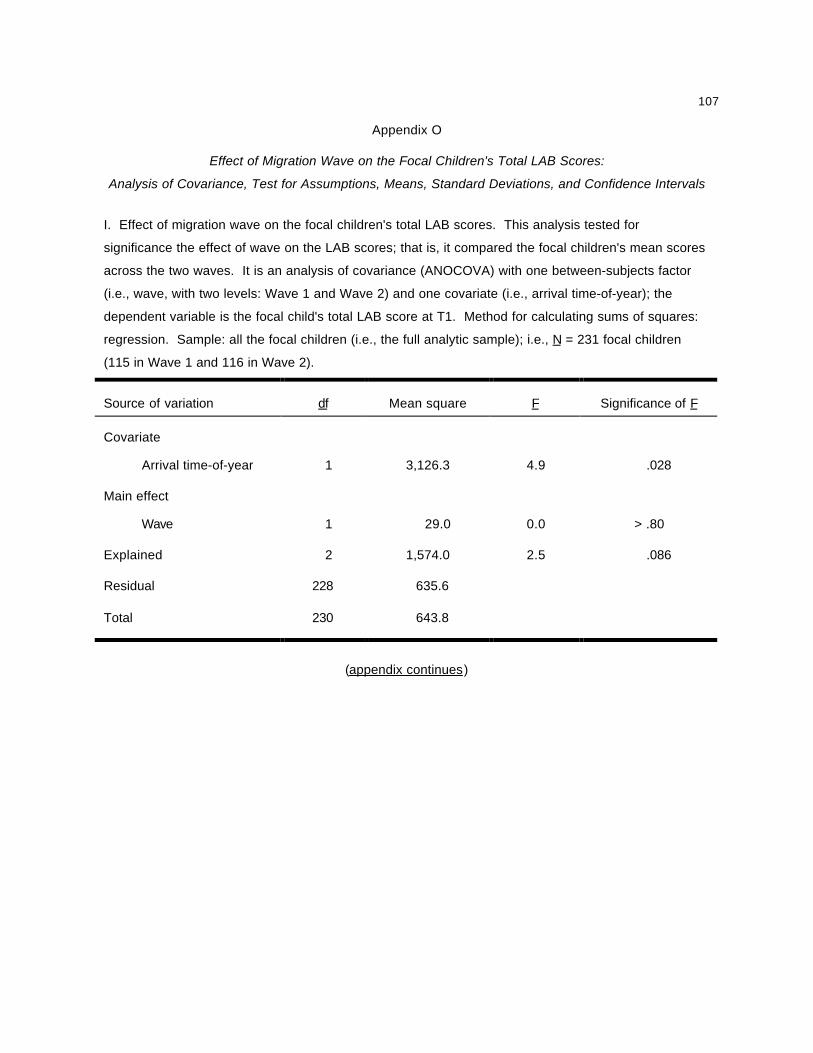
107
Appendix O
Effect of Migration Wave on the Focal Children's Total LAB Scores:
Analysis of Covariance, Test for Assumptions, Means, Standard Deviations, and Confidence Intervals
I. Effect of migration wave on the focal children's total LAB scores. This analysis tested for
significance the effect of wave on the LAB scores; that is, it compared the focal children's mean scores
across the two waves. It is an analysis of covariance (ANOCOVA) with one between-subjects factor
(i.e., wave, with two levels: Wave 1 and Wave 2) and one covariate (i.e., arrival time-of-year); the
dependent variable is the focal child's total LAB score at T1. Method for calculating sums of squares:
regression. Sample: all the focal children (i.e., the full analytic sample); i.e., N = 231 focal children
(115 in Wave 1 and 116 in Wave 2).
Source of variation df Mean square F Significance of F
Covariate
Arrival time-of-year 1 3,126.3 4.9 .028
Main effect
Wave 1 29.0 0.0 > .80
Explained 2 1,574.0 2.5 .086
Residual 228 635.6
Total 230 643.8
(appendix continues)
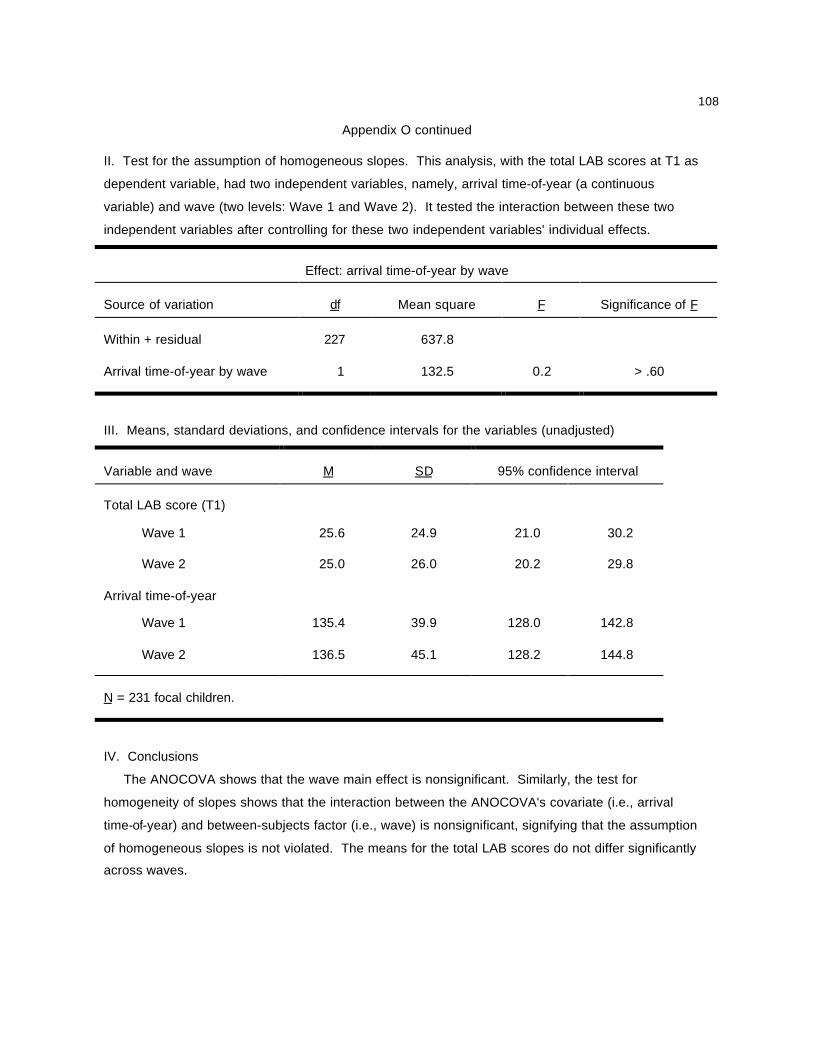
108
Appendix O continued
II. Test for the assumption of homogeneous slopes. This analysis, with the total LAB scores at T1 as
dependent variable, had two independent variables, namely, arrival time-of-year (a continuous
variable) and wave (two levels: Wave 1 and Wave 2). It tested the interaction between these two
independent variables after controlling for these two independent variables' individual effects.
Effect: arrival time-of-year by wave
Source of variation df Mean square F Significance of F
Within + residual 227 637.8
Arrival time-of-year by wave 1 132.5 0.2 > .60
III. Means, standard deviations, and confidence intervals for the variables (unadjusted)
Variable and wave M SD 95% confidence interval
Total LAB score (T1)
Wave 1 25.6 24.9 21.0 30.2
Wave 2 25.0 26.0 20.2 29.8
Arrival time-of-year
Wave 1 135.4 39.9 128.0 142.8
Wave 2 136.5 45.1 128.2 144.8
N = 231 focal children.
IV. Conclusions
The ANOCOVA shows that the wave main effect is nonsignificant. Similarly, the test for
homogeneity of slopes shows that the interaction between the ANOCOVA's covariate (i.e., arrival
time-of-year) and between-subjects factor (i.e., wave) is nonsignificant, signifying that the assumption
of homogeneous slopes is not violated. The means for the total LAB scores do not differ significantly
across waves.