"royal bank of canada: annual report 2010" - · pdf filethis annual report contains...
TRANSCRIPT
Royal Bank of Canada
2010Annual Report

Vision Values Strategic goals
• Always earning the right to be ourclients’ first choice
• Excellent service to clients and eachother
• Working together to succeed
• Personal responsibility for highperformance
• Diversity for growth and innovation
• Trust through integrity in everything wedo
• In Canada, our goal is to be theundisputed leader in financialservices.
• Globally, our goal is to be a leadingprovider of capital markets and wealthmanagement solutions
• In targeted markets, our goal is tobe a leading provider of selectfinancial services complementary toour core strengths.
ROYAL BANK OF CANADA (RY on TSX and NYSE) and its subsidiaries operate under the master brand name RBC. We are Canada’slargest bank as measured by assets and market capitalization, and among the largest banks in the world, based on marketcapitalization. We are one of North America’s leading diversified financial services companies, and provide personal andcommercial banking, wealth management services, insurance, corporate and investment banking and transaction processingservices on a global basis. We employ approximately 79,000 full- and part-time employees who serve close to 18 millionpersonal, business, public sector and institutional clients through offices in Canada, the U.S. and 50 other countries. For moreinformation, please visit rbc.com.
CONTENTS1 Chief Executive Officer’s message
4 Chairman’s message
5 Management’s Discussion and Analysis
6 Overview and outlook
9 Financial performance
12 Business segment results
30 Quarterly financial information
32 Results by geographic segment
33 Financial condition
37 Risk management
48 Overview of other risks
50 Capital management
54 Additional financial information
56 Accounting and control matters
63 Key performance and non-GAAP measures
64 Related party transactions
65 Supplemental information
73 Reports and Consolidated Financial Statements
74 Management’s Responsibility for Financial Reporting
74 Report of Independent Registered CharteredAccountants
74 Comments by Independent Registered CharteredAccountants on Canada-U.S. Reporting Difference
75 Management’s Report on Internal Control overFinancial Reporting
75 Report of Independent Registered CharteredAccountants
76 Consolidated Balance Sheets
77 Consolidated Statements of Income
78 Consolidated Statements of Comprehensive Incomeand Changes in Shareholders’ Equity
79 Consolidated Statements of Cash Flows
80 Notes to the Consolidated Financial Statements
152 Glossary
156 Directors and executive officers
157 Principal subsidiaries
158 Shareholder information
See our Glossary for definitions of terms used throughout thisdocument.
This annual report contains forward-looking statements within the meaning of certain securities laws, including the “safe harbour” provisions ofthe United States Private Securities Litigation Reform Act of 1995 and applicable Canadian securities legislation. We caution readers not to placeundue reliance on these statements as a number of risk factors could cause our actual results to differ materially from the expectationsexpressed in such forward-looking statements. Additional information about our forward-looking statements and risk factors can be found underthe Caution regarding forward-looking statements on page 5.

CHIEF EXECUTIVE OFFICER’S MESSAGE
In the midst of continued and significant changes in thefinancial services sector, RBC remained focused on our long-term strategy and delivered strong shareholder results. Wegrew our franchise both in Canada and internationally,illustrating once more our commitment to putting clients first,the power of our diversified business mix, our values-basedculture and our people.
Although economic and market conditions for financialinstitutions improved, they remained challenging in 2010,marked by low interest rates, regulatory reform and thechanging needs and expectations of clients.
In the face of this, we maintained our disciplined approach torisk and capital management while taking significant steps toadvance our leading position in Canada, expand globally,strengthen our competitive position and invest in futuresources of growth.
We launched new products to meet clients’ changing needs,entered new markets and collaborated across our enterpriseto deepen relationships and provide a richer client experience.We made significant investments in the areas of risk controlsand technology to ensure we have the sound infrastructure toeffectively and efficiently support both our clients and ourgrowth.
Our financial results from fiscal 2010 demonstrate thisprogress, with net income of $5.2 billion, compared to$3.9 billion last year. Excluding certain items, earnings wereup 10 per cent for the year1. These results reflect recordperformance in Canadian Banking and solid results in WealthManagement, Capital Markets and Insurance.
We also delivered top quartile shareholder returns for three-and five-year time horizons versus our global peer group. OurTier 1 capital ratio of 13 per cent and Tier 1 common ratio of9.8 per cent (as at October 31), coupled with our low leverage,demonstrate the strength of our balance sheet and capitalposition.
Standing behind this performance are the capabilities andclient focus of 79,000 dedicated RBC employees across52 countries who advised and served close to 18 millionclients.
Fundamental to long-term success is our continued leadershipin Canada, which generates approximately two-thirds of ourtotal revenues. Strong businesses and a recognized andrespected brand in our home market have enabled us toextend our businesses into new markets around the world.
Advancing our leadership through 2010We are committed to maintaining our leadership in Canadaacross all our businesses through a range of industry-leadingfinancial and non-financial measures including clientretention, satisfaction, loyalty and brand strength.
Virtually all our Canadian lines of business have advancedtheir position in each market and product category. We seemore opportunities to increase market share based on thestrength of our brand and the desire of Canadian families andbusinesses for sound advice and solutions that help themachieve their financial goals.
In Canadian Banking, RBC serves approximately 11 millionpersonal, small business and commercial clients through themost extensive and integrated distribution network in Canadaincluding branches, Automated teller machines (ATMs), aspecialized mobile sales force, online channels and contactcentres.
This year, Canadian Banking grew market share andimplemented cost reduction initiatives while makingsignificant investments in its distribution network, products,services and processes in order to improve our efficiency. Wewere the first Canadian issuer of both Visa and MasterCardand we launched our first new retail store, which transformsthe branch experience into an interactive learning andshopping opportunity for both existing and prospectiveclients.
In Canada, we are the leading full-service brokerage firm asmeasured by assets under administration (AUA), with close to1,440 investment advisors serving affluent and high-net-worthclients. We are the largest fund company and one of thelargest money managers in Canada, with a 15 per cent marketshare as measured by assets under management (AUM).Additionally, we provide discretionary investmentmanagement and estate and trust services to our clientsacross Canada. We were recognized for having the bestprivate banking services in Canada (Euromoney), and RBCGlobal Asset Management’s PH&N fund family was awardedthe Best Overall Fund Group and Bond Fund Family in Canada(Lipper Inc.).
We have the largest bank-owned insurance company inCanada with a strong and growing position in new sales. Ourinsurance business complements our retail banking offeringand contributes considerable and stable earnings to RBC. Wecontinued to improve our profitability through shared andstreamlined processes, and we deepened our client
(1) Excluding a $116 million loss on the announced sale of Liberty Life Insurance Company (Liberty Life) in 2010 and a $1 billion goodwill impairment charge in 2009, we had net income of$5.3 billion in 2010 and $4.9 billion in 2009, respectively. For more information relating to non-GAAP measures, refer to the Key performance and non-GAAP measures section of ourManagement’s Discussion and Analysis.
Chief Executive Officer’s message Royal Bank of Canada: Annual Report 2010 1

CHIEF EXECUTIVE OFFICER’S MESSAGE
relationships and simplified the way we do business. We alsoexpanded our retail insurance network to 52 branches,providing clients with more access to insurance services.
This year, we maintained our position as Canada’s leadingglobal investment bank, providing corporate, public sectorand institutional clients with a wide range of products andservices. We were named Dealmaker of the Year in Canada(Financial Post), named Best Investment Bank in Canada(Euromoney), recognized for excellence in Canadian equityresearch (Brendan Wood International), and ranked numberone in debt, equity and M&A in Canada (Bloomberg).
Outside Canada, our global expansion provided RBC with newopportunities to diversify our revenue streams, grow ourearnings base and build our wealth management and capitalmarkets businesses. Our capital markets capabilities are byfar the most global of any Canadian bank.
We are also the only Canadian bank with a global wealthmanagement capability. RBC provides customized trust,banking, credit and investment solutions to high-net-worthclients in 21 countries around the world. We are now the sixth-largest full-service brokerage firm in the U.S., servingcorrespondent clients and individual investors directly withover 2,100 financial consultants through a national network in42 states.
In 2010, we were recognized as a top 10 global wealthmanager in Scorpio Partnership’s Global Private Banking KPIBenchmark. Our announced intention to acquire BlueBayAsset Management will further expand our global capability2.
In Capital Markets, we significantly deepened our U.S.franchise, resulting in market share increases and winning uskey mandates for both mid-cap and large-cap companies. Weexpanded our New York trading floor, now one of the largeston Wall Street. In Europe, we broadened our investmentbanking, equity and research businesses and now haveprimary dealer status in France and Germany, in addition tothe U.S., Canada, the U.K. and Australia.
In the U.K., we continued to extend our capabilities in fixedincome and currency, and are a top five Gilt-edged marketmaker. Our credit trading business in Europe received toprankings from institutional investors in several categories,including the Best Bank for Fixed Income, e-Trading and
Non-Core Currency Bonds (Credit Magazine). We continued tomethodically build out our global capital markets platform inall major geographies including Asia, through strategic hiresand a new trading floor in Hong Kong.
Our International Banking segment includes our bankingbusinesses in the U.S. and Caribbean, as well as our 50 percent interest in RBC Dexia Investor Services.
RBC Bank in the U.S. provides a comprehensive line ofproducts and services through 426 banking centres andapproximately 480 ATMs. In 2010, we were ranked among thetop five deposit holders in North Carolina and ranked seventhoverall as measured by deposits in our southeastern U.S.footprint. Throughout the year, we continued to focus onmanaging our loan portfolio and restructuring our retailoperations. While weak economic, credit and marketconditions remain challenges, we are committed to restoringour operating performance.
RBTT is one of the largest banking networks in the Caribbean,serving nearly 700,000 clients in 12 countries through 85branches. We made solid progress in implementing a newtechnology infrastructure and leveraging the capabilities ofthe broader RBC network to enhance the client experience.
RBC Dexia Investor Services, our global custody and investorservices joint venture, is a top 10 global custodian and wasawarded Top-Rated status across the categories of LeadingClients, Cross-Border/Non-Affiliated and Domestic, asreported in Global Custodian Magazine’s 2010 Agent Banks inMajor Markets Survey.
Across all these businesses and geographies, RBC is, at itscore, a people business. To deliver value to clients andsustain top quartile results for shareholders, we makesustaining a high-performance, high-employee engagementculture a priority. This year we were recognized as one ofCanada’s Top 100 employers (Mediacorp Canada Inc.), a TopEmployer in London, England (City of London Corporation) andone of the best places to work in the U.S. (Human RightsCampaign). In addition, we received the prestigious CatalystAward for our achievements and longstanding commitment todiversity and inclusion.
Our employees helped build, strengthen and connect thecommunities we serve through our leading corporatecitizenship program, the Vancouver 2010 Olympic Torch Relay
(2) The BlueBay acquisition is subject to the satisfaction of all customary closing conditions and is expected to close by the end of December 2010.
2 Royal Bank of Canada: Annual Report 2010 Chief Executive Officer’s message
CHIEF EXECUTIVE OFFICER’S MESSAGE
and the RBC Foundation. These programs, grants anddonations are a great source of pride for everyone at RBC.
OutlookLooking ahead, the global economy and the global bankingindustry will continue to undergo a significant amount ofchange. An extended period of slower economic growth in alow interest rate environment will make revenue growth morechallenging. Increased regulation of financial institutions’capital and liquidity requirements will add more complexityand higher operating costs and make generating reasonablerates of return on investments more difficult.
In this environment, well-capitalized, stable financialinstitutions will be positioned to take advantage of emergingopportunities and to differentiate themselves in themarketplace. At RBC, our performance history, diversifiedbusiness mix and long-term strategy provide us with a widerange of strategic opportunities.
2011 Strategic goalsAs a result of changes in the financial services industry overthe past few years and the opportunities for growth theypresent both in Canada and globally, we have refined ourstrategic goals, while retaining our vision of Always earningthe right to be our clients’ first choice. Our goals are:• In Canada, to be the undisputed leader in financial
services;• Globally, to be a leading provider of capital markets and
wealth management solutions; and• In targeted markets, to be a leading provider of select
financial services complementary to our core strengths.
Seizing opportunities for long-term growthRBC is well positioned for long-term growth and success. Wehave a proven track record of excellence in execution, and thisstrength will continue to drive our success. In the face ofscarce capital, our commitment to disciplined capitaldeployment for long-term business-building opportunities willdifferentiate us from our peers. And as other financialinstitutions remain challenged by regulatory requirements, wewill invest in our businesses, attract expert advisors and makeselective acquisitions to enhance our capabilities.
In Canadian Banking, we will extend our leading positionthrough a best-in-class customer experience differentiated onadvice, convenience, service and value for money.
Our focus on establishing Wealth Management as a globalleader in both asset and wealth management will be a keydriver for long-term growth.
In Insurance, we plan to enhance client attraction and loyalty,efficiency and employee engagement through cross-platformcollaboration.
Our success in Capital Markets will come from maintaining ourleading position in Canada and growing client relationships inthe U.S. and Europe through enhanced product capabilities,investment banking coverage and prudent management of ourbalance sheet. We intend to strengthen our position in selectindustry sectors in the U.S. and U.K. and broaden ourEuropean fixed income and equities product offering.
In Asia, we will focus on building on our existing capabilitiesin Capital Markets and Wealth Management throughcollaboration across both platforms, strategic hires, anenhanced distribution presence and product capabilities.
Improving the operating performance of our InternationalBanking portfolio remains a priority. We will achieve this byexecuting transformational initiatives that improve ourdistribution footprint and drive efficiency enhancements.
Our confidence in our long-term growth comes from more than140 years of experience in serving clients well. We arecommitted to finding new ways to innovate, be efficient andproactive, and better serve our clients. We will work diligentlyto remain a leading corporate citizen, helping to build andstrengthen the communities we serve. We will rely on thestrengths that have made RBC what it is today: our core valuesof service, teamwork, responsibility, diversity and integrity;our commitment to strong risk management; and our vision ofalways earning the right to be our clients’ first choice.
I would like to take this opportunity to thank our employeesaround the world, who are without a doubt the driving forcebehind all our achievements. Their continued commitment toour values, to our clients and to one another is a source ofpersonal pride to me and I thank them all sincerely for theirprofessionalism and integrity.
Finally, I thank our clients and shareholders for choosing RBC.
Gordon M. NixonPresident and Chief Executive Officer
Chief Executive Officer’s message Royal Bank of Canada: Annual Report 2010 3

CHAIRMAN’S MESSAGE
While the past few years have been transformative andchallenging for the global financial system, RBC has continuedto demonstrate the strength, stability and prudentmanagement that shareholders have come to expect.
As steward of this dynamic enterprise, the Board of Directorsof RBC takes its role seriously. We have long been committedto continuous improvement of our leading governancepractices, which are carefully designed to support our abilityto advise and supervise management. Your independentBoard of Directors does not hesitate to test management andchallenge its approach, and we are able to do so because ofan environment of confidence and mutual trust, created fromclear demarcation of roles and transparency between theboard and the senior management team.
Over the 2010 fiscal year, your board has continued to focuson overseeing the strategic direction for the organization. Withregulatory and economic uncertainties continuing throughoutthe international marketplace, our challenge has been tobalance our strategic role with thorough oversight of riskmanagement while paying careful attention to the changingregulatory landscape. In this environment, the board’sindependent insights, diverse areas of expertise andcollective business experience are especially critical tostrategic planning. Our strong foundation of corporategovernance enables us to oversee management in a mannerthat prudently assesses and mitigates risk without stiflinginnovation and the ability to grow shareholder value.
As global capital markets remained volatile over the pastyear, this emphasis on oversight of key risks has taken onadded significance. The board attentively reviews theenterprise stress testing program, and we actively engage indefining the organization’s risk appetite and assessing its riskprofile against that risk appetite. To focus management onachieving success within an effective risk controlenvironment, business opportunities are considered in thecontext of associated risks.
The board discusses key risk issues as they arise and seeks toanticipate trends that may impact the risk profile of RBC. Inassessing strategy, we endeavour to ensure there will beappropriate returns for the risks assumed. Our regular reviewsof the quality and adequacy of risk controls position the Boardof Directors to assess management’s ability to executebusiness strategy effectively in this rapidly changing businessand regulatory environment.
Over the past year, your Board of Directors has also paidparticular attention to the governance and controls in place forexecutive compensation, giving careful oversight to thealignment of compensation programs to performance andsound risk management. We have remained at the forefront ofbest practices, seeking to ensure that our compensationstructure and design continue to result in incentive awardsthat are symmetric with risk outcomes. Our approach tocompensation begins with the recognition that compensationprograms must be designed to attract and retain the talentneeded for the organization’s continued success in a highlycompetitive global marketplace. These programs are alignedwith performance goals that motivate executives to achievestrategic goals prudently and within acceptable risktolerances. Our compensation programs are designed toreward individual contribution to superior financialperformance and sustainable long-term shareholder value.
I wish to express my appreciation to all board members for theleadership and commitment they demonstrate in providingRBC with an independent, balanced and value-addedperspective and supervising and guiding management inenhancing the stability and strength of the enterprise andcreating long-term value for shareholders. Your Board ofDirectors is proud to be actively engaged in the achievementsof the organization. We thank management and employeesaround the world for their contributions to the continuingsuccess of RBC.
On behalf of the Board of Directors,
David P. O’BrienChairman of the Board
4 Royal Bank of Canada: Annual Report 2010 Chairman’s message

MANAGEMENT’S DISCUSSION AND ANALYSIS
Management’s Discussion and Analysis (MD&A) is provided to enable a reader to assess our results of operations and financial condition forthe fiscal year ended October 31, 2010, compared to the preceding two years. This MD&A should be read in conjunction with ourConsolidated Financial Statements and related notes and is dated December 2, 2010. All amounts are in Canadian dollars, unless otherwisespecified, and are based on financial statements prepared in accordance with Canadian generally accepted accounting principles (GAAP),unless otherwise noted.
Additional information about us, including our 2010 Annual Information Form, is available free of charge on our website at rbc.com/investorrelations, on the Canadian Securities Administrators’ website at sedar.com and on the EDGAR section of the United States Securities andExchange Commission’s (SEC) website at sec.gov.
6 Overview and outlook6 Selected financial and other
highlights7 About Royal Bank of Canada7 Vision and strategic goals7 Economic, market and
regulatory review and outlook
9 Financial performance9 Overview
12 Business segment results12 Results by business segment12 How we measure and report
our business segments13 Canadian Banking16 Wealth Management20 Insurance23 International Banking26 Capital Markets29 Corporate Support
30 Quarterly financial information30 Fourth quarter 2010
performance31 Results and trend analysis
32 Results by geographic segment
33 Financial condition33 Condensed balance sheet33 Off-balance sheet
arrangements
37 Risk management37 Overview39 Credit risk42 Credit quality performance43 Market risk45 Liquidity and funding
management
48 Overview of other risks48 Operational risk48 Strategic risk
48 Regulatory and legal risk48 Reputation risk48 Insurance risk49 Environmental risk49 Other risk factors
50 Capital management
54 Additional financial information54 Total RBC available-for-sale
portfolio
56 Accounting and control matters
63 Key performance and non-GAAPmeasures
64 Related party transactions
65 Supplemental information
See our Glossary for definitions of terms usedthroughout this document.
Caution regarding forward-looking statementsFrom time to time, we make written or oral forward-looking statementswithin the meaning of certain securities laws, including the “safeharbour” provisions of the United States Private Securities LitigationReform Act of 1995 and any applicable Canadian securities legislation.We may make forward-looking statements in this 2010 Annual Reportto Shareholders, in other filings with Canadian regulators or the SEC, inreports to shareholders and in other communications. Forward-lookingstatements in this document include, but are not limited to, state-ments relating to our financial performance objectives, our vision andstrategic goals, the Economic, market and regulatory review andoutlook for Canadian, U.S. and global economies, the outlook andpriorities for each of our business segments, and the risk environmentincluding our liquidity and funding management. The forward-lookinginformation contained in this document is presented for the purpose ofassisting the holders of our securities and financial analysts inunderstanding our financial position and results of operations as atand for the periods ended on the dates presented and our vision andstrategic goals and financial performance objectives, and may not beappropriate for other purposes. Forward-looking statements aretypically identified by words such as “believe”, “expect”, “foresee”,“forecast”, “anticipate”, “intend”, “estimate”, “goal”, “plan” and“project” and similar expressions of future or conditional verbs suchas “will”, “may”, “should”, “could” or “would”.
By their very nature, forward-looking statements require us tomake assumptions and are subject to inherent risks anduncertainties, which give rise to the possibility that our predictions,forecasts, projections, expectations or conclusions will not prove tobe accurate, that our assumptions may not be correct and that ourfinancial performance objectives, vision and strategic goals will notbe achieved. We caution readers not to place undue reliance on thesestatements as a number of risk factors could cause our actual resultsto differ materially from the expectations expressed in such forward-looking statements. These factors – many of which are beyond ourcontrol and the effects of which can be difficult to predict – include:credit, market, operational, and liquidity and funding risks, and other
risks discussed in the Risk management and Overview of other riskssections; general business, economic and financial market conditionsin Canada, the United States and certain other countries in which weconduct business, including the effects of the European sovereigndebt crisis; changes in accounting standards, policies and estimates,including changes in our estimates of provisions, allowances andvaluations; the effects of changes in government fiscal, monetary andother policies; the effects of competition in the markets in which weoperate; the impact of changes in laws and regulations, including taxlaws, changes to and new interpretations of risk-based capitalguidelines, and reporting instructions and liquidity regulatoryguidance, and the Dodd-Frank Wall Street Reform and ConsumerProtection Act and the regulations to be issued thereunder; judicial orregulatory judgments and legal proceedings; the accuracy andcompleteness of information concerning our clients and counter-parties; our ability to successfully execute our strategies and tocomplete and integrate strategic acquisitions and joint venturessuccessfully; and development and integration of our distributionnetworks.
We caution that the foregoing list of risk factors is not exhaustiveand other factors could also adversely affect our results. When relyingon our forward-looking statements to make decisions with respect tous, investors and others should carefully consider the foregoingfactors and other uncertainties and potential events. Except asrequired by law, we do not undertake to update any forward-lookingstatement, whether written or oral, that may be made from time totime by us or on our behalf.
Additional information about these and other factors can befound in the Risk management and Overview of other risks sections.
Information contained in or otherwise accessible through thewebsites mentioned does not form part of this document. Allreferences in this document to websites are inactive textual refer-ences and are for your information only.
Management’s Discussion and Analysis Royal Bank of Canada: Annual Report 2010 5
Overview and outlook
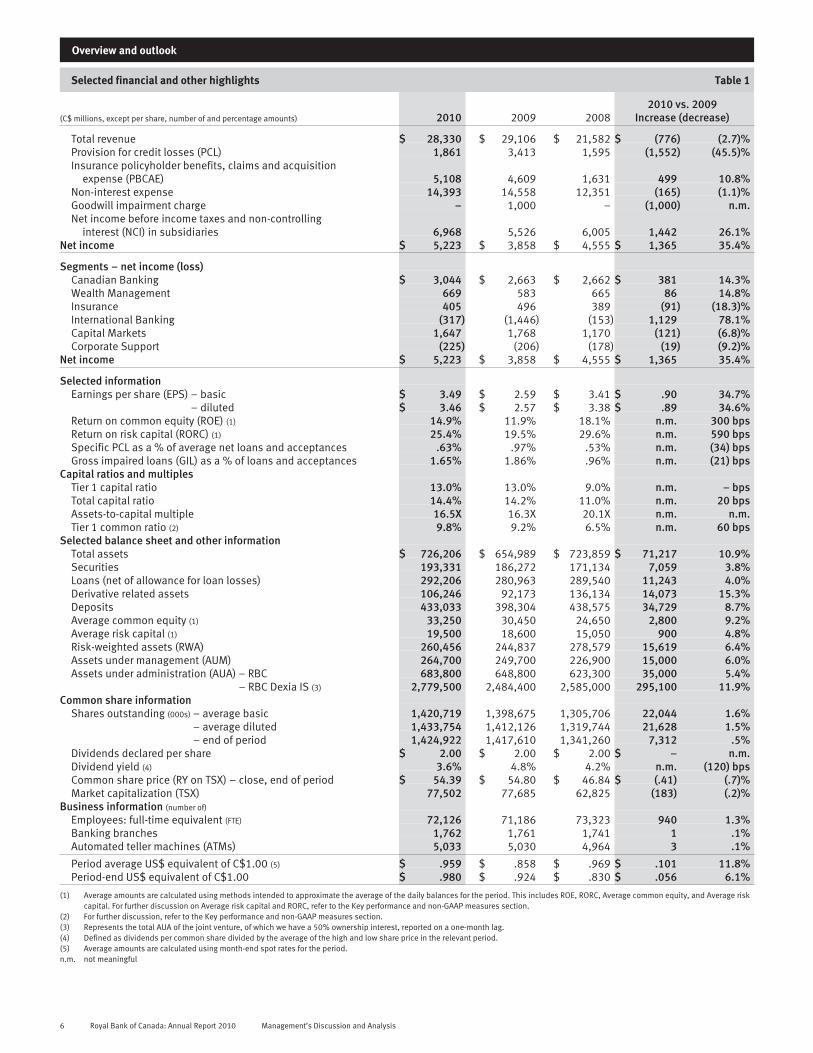
Selected financial and other highlights Table 1
(C$ millions, except per share, number of and percentage amounts) 2010 2009 20082010 vs. 2009
Increase (decrease)
Total revenue $ 28,330 $ 29,106 $ 21,582 $ (776) (2.7)%Provision for credit losses (PCL) 1,861 3,413 1,595 (1,552) (45.5)%Insurance policyholder benefits, claims and acquisition
expense (PBCAE) 5,108 4,609 1,631 499 10.8%Non-interest expense 14,393 14,558 12,351 (165) (1.1)%Goodwill impairment charge – 1,000 – (1,000) n.m.Net income before income taxes and non-controlling
interest (NCI) in subsidiaries 6,968 5,526 6,005 1,442 26.1%Net income $ 5,223 $ 3,858 $ 4,555 $ 1,365 35.4%
Segments – net income (loss)Canadian Banking $ 3,044 $ 2,663 $ 2,662 $ 381 14.3%Wealth Management 669 583 665 86 14.8%Insurance 405 496 389 (91) (18.3)%International Banking (317) (1,446) (153) 1,129 78.1%Capital Markets 1,647 1,768 1,170 (121) (6.8)%Corporate Support (225) (206) (178) (19) (9.2)%
Net income $ 5,223 $ 3,858 $ 4,555 $ 1,365 35.4%
Selected informationEarnings per share (EPS) – basic $ 3.49 $ 2.59 $ 3.41 $ .90 34.7%
– diluted $ 3.46 $ 2.57 $ 3.38 $ .89 34.6%Return on common equity (ROE) (1) 14.9% 11.9% 18.1% n.m. 300 bpsReturn on risk capital (RORC) (1) 25.4% 19.5% 29.6% n.m. 590 bpsSpecific PCL as a % of average net loans and acceptances .63% .97% .53% n.m. (34) bpsGross impaired loans (GIL) as a % of loans and acceptances 1.65% 1.86% .96% n.m. (21) bps
Capital ratios and multiplesTier 1 capital ratio 13.0% 13.0% 9.0% n.m. – bpsTotal capital ratio 14.4% 14.2% 11.0% n.m. 20 bpsAssets-to-capital multiple 16.5X 16.3X 20.1X n.m. n.m.Tier 1 common ratio (2) 9.8% 9.2% 6.5% n.m. 60 bps
Selected balance sheet and other informationTotal assets $ 726,206 $ 654,989 $ 723,859 $ 71,217 10.9%Securities 193,331 186,272 171,134 7,059 3.8%Loans (net of allowance for loan losses) 292,206 280,963 289,540 11,243 4.0%Derivative related assets 106,246 92,173 136,134 14,073 15.3%Deposits 433,033 398,304 438,575 34,729 8.7%Average common equity (1) 33,250 30,450 24,650 2,800 9.2%Average risk capital (1) 19,500 18,600 15,050 900 4.8%Risk-weighted assets (RWA) 260,456 244,837 278,579 15,619 6.4%Assets under management (AUM) 264,700 249,700 226,900 15,000 6.0%Assets under administration (AUA) – RBC 683,800 648,800 623,300 35,000 5.4%
– RBC Dexia IS (3) 2,779,500 2,484,400 2,585,000 295,100 11.9%Common share information
Shares outstanding (000s) – average basic 1,420,719 1,398,675 1,305,706 22,044 1.6%Shares outstanding (000s) – average diluted 1,433,754 1,412,126 1,319,744 21,628 1.5%Shares outstanding (000s) – end of period 1,424,922 1,417,610 1,341,260 7,312 .5%Dividends declared per share $ 2.00 $ 2.00 $ 2.00 $ – n.m.Dividend yield (4) 3.6% 4.8% 4.2% n.m. (120) bpsCommon share price (RY on TSX) – close, end of period $ 54.39 $ 54.80 $ 46.84 $ (.41) (.7)%Market capitalization (TSX) 77,502 77,685 62,825 (183) (.2)%
Business information (number of)
Employees: full-time equivalent (FTE) 72,126 71,186 73,323 940 1.3%Banking branches 1,762 1,761 1,741 1 .1%Automated teller machines (ATMs) 5,033 5,030 4,964 3 .1%
Period average US$ equivalent of C$1.00 (5) $ .959 $ .858 $ .969 $ .101 11.8%Period-end US$ equivalent of C$1.00 $ .980 $ .924 $ .830 $ .056 6.1%
(1) Average amounts are calculated using methods intended to approximate the average of the daily balances for the period. This includes ROE, RORC, Average common equity, and Average riskcapital. For further discussion on Average risk capital and RORC, refer to the Key performance and non-GAAP measures section.
(2) For further discussion, refer to the Key performance and non-GAAP measures section.(3) Represents the total AUA of the joint venture, of which we have a 50% ownership interest, reported on a one-month lag.(4) Defined as dividends per common share divided by the average of the high and low share price in the relevant period.(5) Average amounts are calculated using month-end spot rates for the period.n.m. not meaningful
6 Royal Bank of Canada: Annual Report 2010 Management’s Discussion and Analysis

About Royal Bank of Canada
Royal Bank of Canada (RY on TSX and NYSE) and its subsidiariesoperate under the master brand name RBC. We are Canada’s largestbank as measured by assets and market capitalization, and amongthe largest banks in the world, based on market capitalization. Weare one of North America’s leading diversified financial servicescompanies, and provide personal and commercial banking, wealth
management services, insurance, corporate and investment bankingand transaction processing services on a global basis. We employapproximately 79,000 full- and part-time employees who serve closeto 18 million personal, business, public sector and institutionalclients through offices in Canada, the U.S. and 50 other countries. Formore information, please visit rbc.com.
Vision and strategic goals
Our business strategies and actions are guided by our vision ofAlways earning the right to be our clients’ first choice. In 2010, ourstrategic goals were:• In Canada, to be the undisputed leader in financial services;• In the U.S., to be a leading provider of capital markets, wealth
management and banking services by building on andleveraging our considerable capabilities; and
• Outside North America, to be a premier provider of select capitalmarkets, wealth management and banking services in marketsof choice.
For our progress in 2010 against these objectives, refer to theBusiness segment results section.
Effective Q1, 2011, we refined our strategic goals to addresschanges in the external environment including increased regulation,and to capitalize on opportunities in the financial services industry byincluding a focus on target markets and further global expansion. Weaspire to be a top performing diversified financial institution thatdelivers sustainable, profitable growth and top quartile results for ourshareholders. The following 2011 strategic goals reflect thisaspiration:• In Canada, to be the undisputed leader in financial services;• Globally, to be a leading provider of capital markets and wealth
management solutions; and• In targeted markets, to be a leading provider of select financial
services complementary to our core strengths.
Overview and outlook
Economic, market and regulatory review and outlook – data as atDecember 2, 2010
CanadaThe Canadian economy grew at an estimated 3.1% during 2010, upfrom our estimate of 2.6% as at December 3, 2009. This mainlyreflected gains in the first half of the year driven by increased levels ofconsumer, government and business spending. Strong housingactivity in the first half of 2010, largely reflecting the low interest rateenvironment, slowed significantly in the latter part of the year with theintroduction of the Harmonized Sales Tax (HST) in British Columbiaand Ontario in July 2010. GDP growth also moderated in the secondhalf of the year, in part due to a decrease in net exports.Unemployment of 8.1% in the third quarter was down slightly from ayear ago. The Bank of Canada increased the overnight rate to 1%reflecting increased domestic demand in the first half of the year.
The Canadian economy is expected to grow by 2.9% in 2011reflecting moderate consumer and business spending supported by acontinued low interest rate environment. The Bank of Canada isexpected to hold overnight rates steady at 1% in the first quarter of2011. Rates are expected to increase to 2.0% by the end of the year,reflecting expected mild inflationary pressure. While labour marketsare expected to strengthen, improvement will be gradual, which mayput pressure on credit quality.
United StatesThe U.S. economy grew at an estimated 2.7% during 2010, up fromthe estimated rate of 2.5% projected as at December 3, 2009, largelyin response to government stimulus programs and business spendingon previously deferred inventory purchases in the first half of 2010.Growth slowed in the second half of the year as the effects of thestimulus faded and consumer confidence deteriorated. Weakening inthe housing and labour markets during mid 2010 raised concernsthat the U.S. economic recovery would be slower than expected. Inresponse, the Federal Reserve maintained the target range for thefederal funds rate at 0% to .25%.
In 2011, the U.S. economy is projected to grow by 2.8%reflecting moderate consumer and business spending. The U.S.Federal Reserve continues to apply policy stimulus through itsquantitative easing program. We anticipate that the Federal Reservewill maintain the federal funds rate in the 0% to .25% range until themiddle of 2012 in order to provide continued economic stimulus.
Other global economiesMost global economies experienced overall improvement in 2010.However, growth tempered in the latter part of the year due to the
European sovereign debt crisis and fiscal austerity measures in Europe.The second quarter of 2010 reflected better than expected growth in theU.K. and Germany offset by continued weakness in Greece and Portugal.The European Central Bank (ECB) maintained its policy rate at 1% givenrenewed concerns about the global economic recovery. The Euro-zone isexpected to moderately grow at 1.7% in 2011 reflecting recent sovereigncredit rating downgrades, fiscal austerity measures and persistentweakness in domestic demand. As a result, the ECB is likely to maintainits policy rate steady at 1% until early 2012.
Globally, the world economy grew at an estimated 4.6%reflecting solid growth in the first half of the year. Growth in Chinaremained strong, reflecting solid domestic demand. We expectmoderation in 2011 with world economic growth tempering to 4.25%.
Financial marketsGlobal capital markets improved in early 2010; however were volatilein the latter half of the year. The European sovereign debt crisis putpressure on global financial markets particularly in the second half ofthe year. As well, uncertainty over U.S. regulatory reform and globalcapital requirements for financial institutions persisted. This resultedin increased investor caution and reduced client trading volumeswhich negatively impacted certain of our capital markets tradingbusinesses.
In 2011, we expect global capital markets to remain underpressure until the sustainability of economic recovery becomesevident.
Effective for the first quarter of 2010, we no longer consideredgains and losses on certain securities to be as a result of the volatilemarket environment that prevailed in 2008 and 2009. Certain ofthese securities continued to be impacted by accounting volatilityand we disclose the respective gains and losses separately as certainmarket and credit related items when material.
The predictions and forecasts in this section are based oninformation and assumptions from sources we consider reliable. Ifthis information or these assumptions are not accurate, actualeconomic outcomes may differ materially from the outlook presentedin this section.
Regulatory environmentIn September 2010, the Basel Committee on Banking Supervision(Basel Committee) announced amendments to the capital proposalsinitially published in December 2009. The Basel Committee’s reformschanged the definition of capital, recalibrated minimum regulatorycapital requirements and introduced new capital buffers aimed toensure that banks are better able to withstand future periods of
Management’s Discussion and Analysis Royal Bank of Canada: Annual Report 2010 7

economic and financial stress. These reforms will likely result inhigher capital and liquidity requirements with phased-inimplementation from 2013 to 2019.
Based on our current strong capital position, we expect to meetthe Basel III requirements within the established timelines. We willcontinue to be proactive and make the optimal decisions to mitigatethe impact these requirements will have on our business.
In November 2010, the group of 20 industrial and emergingeconomies (G20) endorsed the Basel Committee’s proposedtimelines. In addition, they committed to identify by the middle of2011, financial institutions considered systematically important tothe global financial system. These companies would be held toenhanced regulatory supervision and stricter standards on capital,liquidity and risk assessment.
In the U.S., the Dodd-Frank Wall Street Reform and ConsumerProtection Act (the Dodd-Frank Act) was enacted in July 2010 andcontains financial reforms including increased consumer protection,regulation of the over-the-counter derivatives markets, heightenedcapital and other prudential standards, restrictions on proprietarytrading and investments and sponsorships in hedge funds andprivate equity funds by foreign banking organizations with U.S.operations. We continue to assess the potential impact as inter-pretation and implementation of the Dodd-Frank Act’s provisions aredeveloped by U.S. regulators.
In the U.K., an overhaul of the system of financial regulationcontinues as significant regulatory powers are transferred from theFinancial Services Authority to the Bank of England. We continue toassess the potential impact of these and other U.K. reforms, such asthe introduction of bank levies.
We monitor the evolving market and regulatory environment onan ongoing basis and reflect these changes through enhancements toour risk management framework. Our ability to manage these risks isa key competency within the organization, and is supported by astrong risk culture and an effective risk management approach. Forfurther details on our risk management framework and our activitiesto manage risks, refer to the Risk management, Overview of otherrisks and Capital management sections.
Defining and measuring success through Total Shareholder ReturnsOur focus is to maximize shareholder returns through theachievement of top quartile Total Shareholder Returns (TSR) over themedium term (3-5 years) which reflects a longer term view of strongand consistent financial performance.
TSR aligns to our three strategic goals and we believe representsthe most appropriate measure of shareholder value creation. TSR is aconcept used to compare the performance of our common sharesover a period of time, reflecting share price appreciation anddividends paid to common shareholders. The absolute size of the TSRwill vary depending on market conditions and the relative positionreflects the market’s perception of our overall performance relative toour peers over a period of time.
Financial performance objectives are annual metrics used toassess overall performance and measure progress against ourmedium term TSR objective. We review and revise these metrics asthe economic, market and regulatory environment change.
Our financial objectives are diluted EPS growth of 7%+, ROE of16% – 20% and strong capital ratios. The outcome of these financialobjectives is the dividend payout ratio targeted at 40% – 50%.Defined operating leverage is no longer a suitable metric given ourdiversified business mix and the lack of comparability against ourpeer group.
By focusing on these financial performance objectives in ourdecision-making, we believe we will be well positioned to providesustainable earnings growth and solid returns to our shareholders.
Our three- and five-year average annual TSR of 3% and 10%respectively, ranked us in the first quartile within our global peergroup for both periods. The three-year and five-year average annualTSR for our global peer group was negative 9% and 0% respectively.
Three- and five-year TSR vs. peer group average Table 2
3-Year TSR (1) 5-Year TSR (1)
Royal Bank of Canada 3% 10%
Top Quartile Top Quartile
Peer Group Average (2) (9)% 0%(1) The three- and the five-year average annual TSR are calculated based on our common
share price appreciation plus reinvested dividend income for the period October 31,2007 to October 31, 2010 and October 31, 2005 to October 31, 2010 respectively,based on information as disclosed by Bloomberg L.P.
(2) We are part of a global peer group consisting of 20 financial institutions (seven largeCanadian financial institutions in addition to us (Bank of Montreal, Canadian ImperialBank of Commerce, Manulife Financial Corporation, National Bank of Canada, PowerFinancial Corporation, The Bank of Nova Scotia and The Toronto-Dominion Bank), fiveU.S. financial institutions (Bank of America Corporation, JPMorgan Chase & Co., TheBank of New York Mellon Corporation, U.S. Bancorp and Wells Fargo & Company), fiveEuropean financial institutions (Banco Bilbao Vizcaya Argentaria Group (BBVA), BarclaysPLC, BNP Paribas, Credit Suisse Group AG and Deutsche Bank Group) and two Australianfinancial institutions (National Australia Bank and Westpac Banking Corporation).
Common share and dividend information Table 3
For the year ended October 31 2010 2009 2008 2007 2006
Common share price (RY on TSX) – close, end of period $ 54.39 $ 54.80 $ 46.84 $ 56.04 $ 49.80Dividends paid per share 2.00 2.00 2.00 1.72 1.32Increase (decrease) in share price (.7)% 17.0% (16.4)% 12.5% 19.5%Total shareholder return 2.9% 22.7% (12.8)% 16.2% 23.2%
Estimated impact of foreign currency translation on our consolidatedfinancial resultsOur foreign currency-denominated results are impacted by exchangerate fluctuations. Revenue, provision for credit losses (PCL), Insurancepolicyholder benefits, claims and acquisitions expense (PBCAE),non-interest expense and income denominated in foreign currencyare translated at the average rate of exchange for the year.
In 2010, foreign currency translation of our earnings had asignificant impact on our consolidated financial results due to theconsiderable strengthening of the Canadian dollar relative to othercurrencies. The translation approximately reduced revenue by$1.2 billion, net income by $150 million and diluted EPS by $.10.
The following table reflects the estimated impact of foreigncurrency translation on key income statement items:
Table 4
(C$ millions, except per share amounts)
2010 vs.2009
2009 vs.2008
Impact on income increase (decrease):Total revenue $ (1,180) $ 745PCL 95 (95)PBCAE 235 (150)Non-interest expense 680 (485)Net income (150) 10
Impact on EPS:Basic $ (.11) $ .01Diluted $ (.10) $ .01
8 Royal Bank of Canada: Annual Report 2010 Management’s Discussion and Analysis

Changes in the average exchange rates are shown in the followingtable:
Table 5
(Average foreign currency equivalent of C$1.00) (1) 2010 2009
U.S. dollar .959 .858British pound .617 .556Euro .713 .627TTD (2) 6.085 5.354
(1) Average amounts are calculated using month-end spot rates for the period.(2) TTD represents the Trinidad and Tobago dollar. The TTD fluctuates within a narrow band
of the U.S. dollar.
Certain of our business segment results are impacted by fluctuationsin the U.S. dollar, Euro, British pound and the TTD exchange ratesrelative to the Canadian dollar. Wealth Management, Insurance,International Banking and Capital Markets each have significant U.S.dollar-denominated exposure, Insurance has significant Britishpound-denominated exposure and Capital Markets also hassignificant Euro and British pound-denominated exposure. Inaddition, International Banking has TTD denominated exposure. Forfurther details on the impact to our segments, refer to the Businesssegment results section.
Financial performance
Overview
2010 vs. 2009We reported net income of $5,223 million for the year endedOctober 31, 2010, up $1,365 million or 35% from the prior year.Diluted earnings per share (EPS) of $3.46 increased $.89 and returnon common equity (ROE) of 14.9% was up 300 basis points (bps)from the prior year. Our Tier 1 capital ratio of 13.0% was unchangedfrom the prior year. Our current year results included a loss on LibertyLife Insurance Company (Liberty Life) of $116 million on a before-andafter-tax basis. Our prior year results reflected a goodwill impairmentcharge of $1 billion on a before-and after-tax basis.
Excluding these items above, net income increased $481million, or 10%, diluted EPS increased $.26 and ROE increased40 bps compared to prior year. Our results reflected solid businessgrowth in Canadian Banking, our wealth management businesses andInsurance as economic conditions improved, particularly in the firsthalf of the year. In addition, PCL decreased reflecting stabilizing assetquality. These factors were offset by lower trading revenues in CapitalMarkets reflecting unfavourable trading conditions. The prior yearreflected strong trading results from favourable market opportunities.
Canadian Banking net income was $3,044 million, up $381million or 14% from last year, reflecting revenue growth in allbusinesses and lower PCL. These results were driven by strongvolume growth in home equity and personal deposit products,increased credit card transaction volumes and higher mutual funddistribution fees. Higher pension and performance-relatedcompensation expense and increased costs supporting businessgrowth partially offset the increase.
Wealth Management net income was $669 million, up$86 million, or 15% from a year ago mainly due to higher averagefee-based client assets and higher transaction volumes reflectingimproved market conditions. Favourable income tax adjustments inthe current year also contributed to the increase. These factors werepartially offset by spread compression and the impact of the strongerCanadian dollar.
Insurance net income was $405 million, down $91 million or18%, from last year largely reflecting the $116 million loss on LibertyLife. Excluding the loss on Liberty Life, net income was $521 million,up $25 million, or 5%, mainly due to favourable actuarial adjust-ments, higher net investment gains, our ongoing focus on costmanagement and volume growth. These factors were partially offsetby higher disability and auto claims costs and unfavourable lifepolicyholder experience. For further details on the loss on Liberty Liferefer to the Insurance segment.
International Banking net loss of $317 million compared to a netloss of $1,446 million from a year ago, mainly reflecting the prior yeargoodwill impairment charge. Lower provisions in our U.S. bankingloan portfolio and the impact of the stronger Canadian dollar alsocontributed to the lower loss. These factors were partially offset byhigher losses on our available for sale (AFS) securities.
Capital Markets net income of $1,647 million, decreased$121 million or 7% from a year ago as trading revenue was impacted
by lower client volumes and tighter credit spreads. Our results werealso unfavourably impacted by the stronger Canadian dollar. Losseson certain market and credit related items this year were significantlylower than market environment-related losses of $1.5 billion ($648million after tax and compensation adjustments) in the prior year. Thedecrease was also partially offset by lower PCL and strong growth inour investment banking businesses.
Corporate Support net loss was $225 million compared to a netloss of $206 million a year ago. The current year net loss mainlyreflected net unfavourable tax and accounting adjustments. Our prioryear results included a general provision for credit losses of $589million ($391 million after tax), losses on certain AFS securities of$419 million ($287 million after tax), losses on fair value adjustmentsof $217 million ($151 million after tax) on certain RBC debtdesignated as held-for-trading (HFT), and securitization gainsinclusive of new and re-investment related activity, net of economichedging activity of $918 million ($630 million after tax).
For a detailed discussion on measures excluding the goodwillimpairment charge and the loss on Liberty Life, refer to the Keyperformance and non-GAAP measures section. For a furtherdiscussion on our treatment of market environment-related losses,refer to the Economic market and regulatory review and outlooksection.
Medium-term objectivesIn 2010, we compared favourably to our medium-term objective forTier 1 capital ratio and compared unfavourably to our diluted EPSgrowth, ROE and dividend payout ratio objectives. We also comparedunfavourably to our defined operating leverage objective.
Summary of 2009 and 2008In 2009, net income was $3,858 million, down 15% from 2008 mainlyreflecting the goodwill impairment charge. Excluding the goodwillimpairment charge, net income was $4,858 million, an increase of$303 million, or 7%. This increase was driven by stronger tradingresults in Capital Markets, which included lower market environment-related losses, and higher net securitization gains. Solid growth in ourbanking-related businesses, partly reflecting our 2008 acquisitions,and volume growth in our insurance businesses also contributed tothe increase. These factors were partially offset by net losses on fairvalue adjustments on certain RBC debt designated as Held-for-trading(HFT) and losses on credit default swaps used to economically hedgethe corporate lending portfolio and higher provision for credit losses.
In 2008, net income was $4,555 million, down 17% from 2007.Our results included higher market environment-related net lossesand higher PCL, partially offset by the favourable impact of$542 million ($252 million after tax and related compensationadjustments) related to the reduction of the Enron Corp-relatedlitigation provision. Our 2007 results also included a gain of$326 million ($269 million after tax) relating to the Visa Inc.restructuring.
Management’s Discussion and Analysis Royal Bank of Canada: Annual Report 2010 9

Total revenue Table 6
(C$ millions) 2010 2009 (1) 2008 (1)
Interest income $ 18,673 $ 20,578 $ 25,038Interest expense 7,696 9,037 15,984
Net interest income $ 10,977 $ 11,541 $ 9,054
Investments (2) $ 4,620 $ 4,377 $ 4,697Insurance (3) 6,174 5,718 2,609Trading 1,315 2,750 (81)Banking (4) 3,218 3,349 3,076Underwriting and other
advisory 1,193 1,050 875Other (5) 833 321 1,352
Non-interest income $ 17,353 $ 17,565 $ 12,528
Total revenue $ 28,330 $ 29,106 $ 21,582
Additional informationTotal trading revenue (6)
Net interest income $ 1,443 $ 2,316 $ 680Non-interest income 1,315 2,750 (81)
Total $ 2,758 $ 5,066 $ 599
Total trading revenue byproductInterest rate and credit $ 1,992 $ 3,405 $ (250)Equities 351 1,008 265Foreign exchange and
commodities 415 653 584
Total $ 2,758 $ 5,066 $ 599
(1) We reclassified certain amounts in Corporate Support which were previously reported intrading revenue to the Other revenue to better reflect the nature of the amounts.
(2) Includes securities brokerage commissions, investment management and custodialfees, and mutual funds.
(3) Includes premiums, investment and fee income. Investment income includes thechange in fair value of investments backing policyholder liabilities and is largely offsetin PBCAE.
(4) Includes service charges, foreign exchange revenue other than trading, card servicerevenue and credit fees.
(5) Includes other non-interest income, net gain (loss) on available-for-sale (AFS) securities(other-than-temporary impairment and realized gain/loss), fair value adjustments oncertain RBC debt designated as HFT, the change in fair value of certain derivativesrelated to economic hedges and securitization revenue.
(6) Total trading revenue comprises trading-related revenue recorded in Net interest incomeand Non-interest income.
Total revenue2010 vs. 2009Total revenue decreased $776 million, or 3%, from a year agoprimarily attributable to significantly lower Total trading revenue. Theimpact of the stronger Canadian dollar which reduced revenue by anestimated $1.2 billion and lower securitization gains also contributedto the decrease. These factors were partially offset by solid volumegrowth in our Canadian banking businesses, higher averagefee-based client assets and higher transaction volumes in our wealthmanagement businesses, strong growth in our investment bankingbusinesses, and higher insurance-related revenue. Certain marketand credit related losses this year were significantly lower than ourmarket environment-related losses in the prior year. For a discussionon market environment-related losses, refer to the Economic marketand regulatory review and outlook section.
Total trading revenue, comprised of trading related revenuerecorded in Net interest income and Non-interest income, decreased$2.3 billion mainly due to weaker trading revenues in our fixedincome and currency, money market and U.S. global equitybusinesses, which were impacted by lower client volumes and tightercredit spreads reflecting less favourable trading conditions in thecurrent year.
Net interest income decreased $564 million, or 5%, primarily asa result of lower trading-related net interest income as discussedabove. Non-trading net interest income was up $309 million, or 3%,largely due to volume growth in our Canadian banking businesses,partially offset by spread compression in our banking-related andwealth management businesses.
Investments-related revenue increased $243 million, or 6%,mainly due to higher average fee-based client assets resulting fromcapital appreciation and higher transaction volumes in our wealthmanagement businesses reflecting improved market conditions andinvestor confidence.
Insurance-related revenue increased $456 million or 8%, mainlydue to volume growth across all businesses, including annuity growthin our U.S. and International businesses and higher net investmentgains. These factors were partially offset by the change in fair value ofinvestments backing our life and health policyholder liabilities, andthe impact of the stronger Canadian dollar. The annuity volumes andthe change in fair value of investments were largely offset in PBCAE.The loss on Liberty Life was recorded in Non-interest revenue – Other.
Banking revenue was down $131 million, or 4%, largelyreflecting a portion of our credit card interchange fees, previouslyrecorded in Banking revenue, now being included with our credit cardsecuritization in Other revenue, and a favourable adjustment in theprior year related to our credit card customer loyalty reward programliability. These factors were partially offset by higher syndicatedfinance activity and higher credit card service revenue in the currentyear.
Underwriting and other advisory revenue increased $143 million,or 14% , mainly due to higher debt origination activity and merger andacquisition (M&A) activity.
Other revenue increased $512 million mainly due to gains ascompared to losses last year on certain AFS securities, gains on thefair value adjustments on certain RBC debt designated as HFT inCapital Markets and Corporate Support, lower losses on credit defaultswaps recorded at fair value used to economically hedge ourcorporate loan portfolio in Capital Markets, and the inclusion of creditcard interchange fees, as noted above. These factors were partiallyoffset by lower securitization gains in the current year due to a higherthan historical level of securitization activity in the prior year, highernet losses on instruments related to funding, and the loss on LibertyLife.
2009 vs. 2008Total revenue increased $7,524 million, or 35%, from 2008.
Net interest income increased $2,487 million, or 27%, largelydue to lower funding costs on certain trading positions in our capitalmarkets businesses. Loan and deposit growth, largely due to solidvolume growth in our Canadian banking businesses, and a full year ofrevenue from our 2008 acquisitions in Wealth Management andInternational Banking also contributed to the increase. These factorswere partially offset by spread compression in our banking-relatedand wealth management businesses.
Investments-related revenue decreased $320 million, or 7%,mainly due to lower fee-based client assets and lower mutual funddistribution fees, partially offset by higher transaction volumes.
Insurance-related revenue increased $3,109 million, largely dueto the change in fair value of investments backing our life and healthpolicyholder liabilities and increased annuity volumes, both of whichwere largely offset by higher related PBCAE. Volume growth across allbusinesses also contributed to the increase.
Trading revenue in Non-interest income increased $2,831million. Total trading revenue, which comprises trading-relatedrevenue recorded in Net interest income and Non-interest income,was $5,066 million, up $4,467 million. Stronger trading revenue,which included lower market-environment related losses on HFTinstruments, benefited from favourable market opportunities,including a historically low interest rate environment, and increasedclient activity. Gains on credit valuation adjustments on certainderivative contracts as compared to losses in 2008 also contributedto the increase.
Banking revenue was up $273 million, or 9%, mainly due toimproved results in our client-based securitization activity andlending businesses in Capital Markets, higher service fee revenueacross banking-related businesses, and a favourable adjustmentrelated to our credit card customer loyalty reward program liability.
Underwriting and other advisory revenue increased $175 million,or 20%, mainly due to higher equity and debt origination activities,partially offset by lower M&A activity.
10 Royal Bank of Canada: Annual Report 2010 Management’s Discussion and Analysis

Other revenue was down $1,031 million, primarily due to losseson the fair value adjustments on certain RBC debt designated as HFTas compared to gains in 2008 in Capital Markets and CorporateSupport, reflecting the tightening of our credit spreads. Losses oncredit default swaps recorded at fair value used to economicallyhedge certain corporate loan portfolios as compared to gains in 2008in Capital Markets also contributed to the decrease. These factorswere partially offset by higher securitization revenue reflecting ahigher than historical level of securitization activity from our partic-ipation in government-sponsored funding programs.
Our revenue for 2009 was favourably impacted by the weakerCanadian dollar.
Provision for credit lossesCredit quality has generally improved from the prior year reflectingstabilizing asset quality due to the general improvement in the globaleconomic environment. For further details on our PCL, refer to theCredit quality performance section.
2010 vs. 2009Total PCL in 2010 was $1.9 billion, down $1.6 billion from last year.Specific PCL of $1.8 billion decreased $1 billion mainly due to lowerprovisions in our corporate loan portfolio and residential builderfinance portfolio in U.S. banking. We incurred a general provision of$26 million during the current year as compared to $589 million inthe prior year, reflecting improved credit quality in our commercialU.S. banking and Canadian retail portfolios.
2009 vs. 2008Total PCL of $3.4 billion increased $1.8 billion from 2008, largelyreflecting increased specific provisions of $1.4 billion, mainly in ourcorporate loan portfolio, and in our U.S. banking and our Canadianunsecured retail and business lending portfolios. An increase in thegeneral provision of $424 million, mainly in U.S. banking and to alesser extent, our U.S. corporate lending and Canadian retail andbusiness lending portfolios, also contributed to the increase.
Insurance policyholder benefits, claims and acquisition expense2010 vs. 2009PBCAE increased $499 million, or 11%, primarily reflecting highercosts commensurate with volume growth, partially offset by thechange in fair value of investments backing our life and healthpolicyholder liabilities and the impact of the stronger Canadian dollar.The increase in PBCAE from annuity volumes and the change in fairvalue of investments was largely offset in revenue. For further details,refer to the Insurance segment section.
2009 vs. 2008PBCAE increased $2,978 million from 2008, largely reflecting thechange in fair value of investments and higher costs commensuratewith the increased annuity volumes, largely offset in revenue.
Non-interest expense2010 vs. 2009Non-interest expense decreased $165 million, or 1%, mainly due tothe favourable impact of the stronger Canadian dollar which reducednon-interest expense by approximately $680 million. Lower variablecompensation reflecting lower trading results and our continuedfocus on cost management also contributed to the decrease. Thesefactors were largely offset by higher costs in support of our businessgrowth, an increase in marketing costs largely for our Olympicsponsorship, higher professional fees, and higher stock-basedcompensation partly reflecting the increase in fair value of our earnedcompensation liability related to the Wealth Management stock-based compensation plan.
2009 vs. 2008Non-interest expense increased $2,207 million, or 18% from 2008,largely due to increased variable compensation driven by highertrading results. Increased costs in support of business growth, whichincluded acquisition-related staff and occupancy costs, reflecting afull year of expenses from our 2008 acquisitions, the impact of theweaker Canadian dollar, and the favourable impact of $542 million in2008 related to the reduction of the Enron-related litigation provisionalso contributed to the increase. These factors were partially offset byour ongoing focus on cost management.
Non-interest expense Table 7
(C$ millions) 2010 2009 2008
Salaries $ 4,023 $ 4,146 $ 3,845Variable compensation 3,384 3,561 2,689Benefits and retention
compensation 1,216 1,189 1,168Stock-based compensation 201 82 77
Human resources $ 8,824 $ 8,978 $ 7,779Equipment 1,000 1,025 934Occupancy 1,053 1,045 926Communications 813 761 749Professional and other
external services 934 860 903Other expenses 1,769 1,889 1,060
Non-interest expense $ 14,393 $ 14,558 $ 12,351
Goodwill impairmentIn 2009, we recorded a goodwill impairment charge in InternationalBanking of $1 billion on both a before-and after-tax basis. For furtherdetails, refer to Note 10 to our 2010 Annual Consolidated FinancialStatements.
TaxesOur operations are subject to a variety of taxes, including taxes onincome and capital assessed by Canadian federal and provincialgovernments and taxes on income assessed by the governments ofinternational jurisdictions where we operate. Taxes are also assessedon expenditures and supplies consumed in support of our operations.
2010 vs. 2009Income tax expense increased $78 million, or 5%, from a year agodue to higher earnings before income taxes in 2010. The effective taxrate of 23.6% decreased 4.8% from 28.4% a year ago, largely due tothe goodwill impairment charge reported in the prior year, which wasnot deductible for tax purposes. Excluding the goodwill impairmentcharge, the effective tax rate decreased .4%, mainly due to areduction in Canadian corporate income tax rates. For further detailson the 2009 effective income tax rate, excluding the goodwillimpairment charge, refer to the Key performance and non-GAAPmeasures section.
Other taxes increased by $38 million from 2009, due to theintroduction of the HST in Ontario and British Columbia in the currentyear and the favourable resolution of a goods and services tax auditin the prior year, partially offset by lower capital taxes, reflectinglower capital tax rates. In addition to the income and other taxesreported in our Consolidated Statements of Income, we recordedincome taxes of $685 million in 2010 (2009 – $1,706 million) inshareholders’ equity, a decrease of $1,021 million, primarilyreflecting decreased unrealized foreign currency translation gains, netof hedging activities, unrealized losses in our derivatives designatedas cash flow hedges, and lower unrealized gains in our AFS portfolio.
The effective total tax rate of 31.6% decreased 5.5% from a yearago primarily reflecting the goodwill impairment charge discussedabove.
Management’s Discussion and Analysis Royal Bank of Canada: Annual Report 2010 11
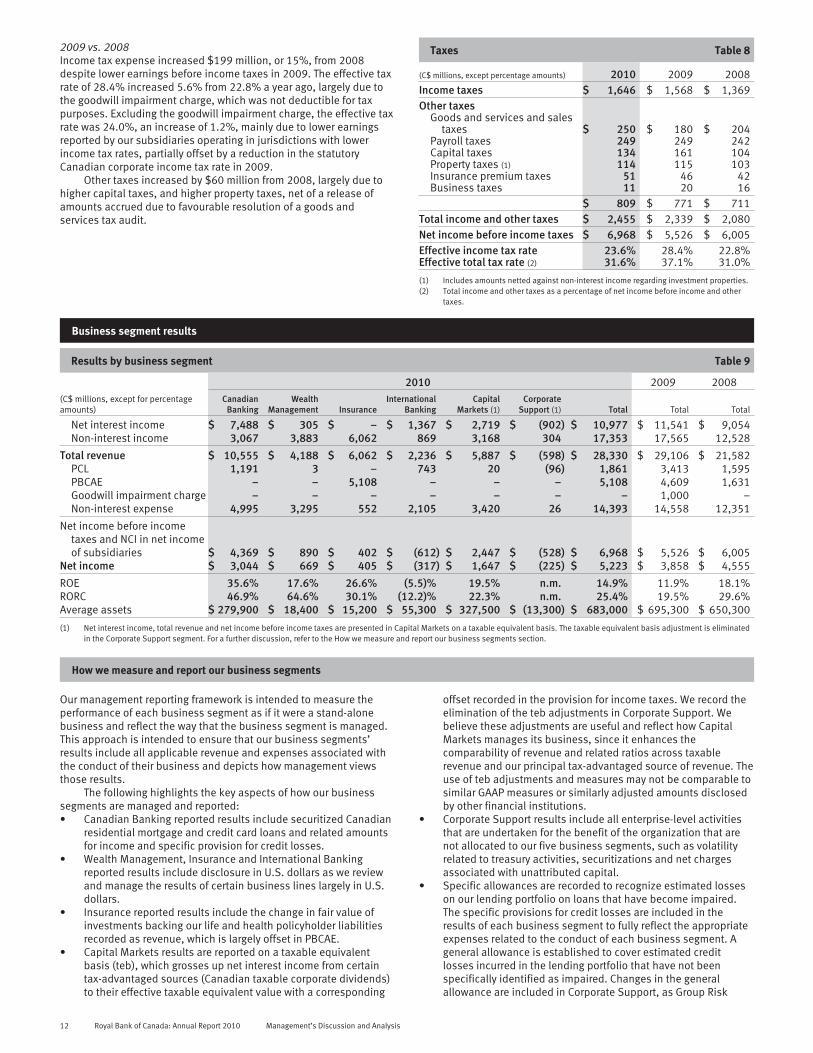
2009 vs. 2008Income tax expense increased $199 million, or 15%, from 2008despite lower earnings before income taxes in 2009. The effective taxrate of 28.4% increased 5.6% from 22.8% a year ago, largely due tothe goodwill impairment charge, which was not deductible for taxpurposes. Excluding the goodwill impairment charge, the effective taxrate was 24.0%, an increase of 1.2%, mainly due to lower earningsreported by our subsidiaries operating in jurisdictions with lowerincome tax rates, partially offset by a reduction in the statutoryCanadian corporate income tax rate in 2009.
Other taxes increased by $60 million from 2008, largely due tohigher capital taxes, and higher property taxes, net of a release ofamounts accrued due to favourable resolution of a goods andservices tax audit.
Taxes Table 8
(C$ millions, except percentage amounts) 2010 2009 2008Income taxes $ 1,646 $ 1,568 $ 1,369Other taxes
Goods and services and salestaxes $ 250 $ 180 $ 204
Payroll taxes 249 249 242Capital taxes 134 161 104Property taxes (1) 114 115 103Insurance premium taxes 51 46 42Business taxes 11 20 16
$ 809 $ 771 $ 711Total income and other taxes $ 2,455 $ 2,339 $ 2,080Net income before income taxes $ 6,968 $ 5,526 $ 6,005Effective income tax rate 23.6% 28.4% 22.8%Effective total tax rate (2) 31.6% 37.1% 31.0%
(1) Includes amounts netted against non-interest income regarding investment properties.(2) Total income and other taxes as a percentage of net income before income and other
taxes.
Business segment results
Results by business segment Table 9
2010 2009 2008(C$ millions, except for percentageamounts)
CanadianBanking
WealthManagement Insurance
InternationalBanking
CapitalMarkets (1)
CorporateSupport (1) Total Total Total
Net interest income $ 7,488 $ 305 $ – $ 1,367 $ 2,719 $ (902) $ 10,977 $ 11,541 $ 9,054Non-interest income 3,067 3,883 6,062 869 3,168 304 17,353 17,565 12,528
Total revenue $ 10,555 $ 4,188 $ 6,062 $ 2,236 $ 5,887 $ (598) $ 28,330 $ 29,106 $ 21,582PCL 1,191 3 – 743 20 (96) 1,861 3,413 1,595PBCAE – – 5,108 – – – 5,108 4,609 1,631Goodwill impairment charge – – – – – – – 1,000 –Non-interest expense 4,995 3,295 552 2,105 3,420 26 14,393 14,558 12,351
Net income before incometaxes and NCI in net incomeof subsidiaries $ 4,369 $ 890 $ 402 $ (612) $ 2,447 $ (528) $ 6,968 $ 5,526 $ 6,005
Net income $ 3,044 $ 669 $ 405 $ (317) $ 1,647 $ (225) $ 5,223 $ 3,858 $ 4,555
ROE 35.6% 17.6% 26.6% (5.5)% 19.5% n.m. 14.9% 11.9% 18.1%RORC 46.9% 64.6% 30.1% (12.2)% 22.3% n.m. 25.4% 19.5% 29.6%Average assets $ 279,900 $ 18,400 $ 15,200 $ 55,300 $ 327,500 $ (13,300) $ 683,000 $ 695,300 $ 650,300
(1) Net interest income, total revenue and net income before income taxes are presented in Capital Markets on a taxable equivalent basis. The taxable equivalent basis adjustment is eliminatedin the Corporate Support segment. For a further discussion, refer to the How we measure and report our business segments section.
How we measure and report our business segments
Our management reporting framework is intended to measure theperformance of each business segment as if it were a stand-alonebusiness and reflect the way that the business segment is managed.This approach is intended to ensure that our business segments’results include all applicable revenue and expenses associated withthe conduct of their business and depicts how management viewsthose results.
The following highlights the key aspects of how our businesssegments are managed and reported:• Canadian Banking reported results include securitized Canadian
residential mortgage and credit card loans and related amountsfor income and specific provision for credit losses.
• Wealth Management, Insurance and International Bankingreported results include disclosure in U.S. dollars as we reviewand manage the results of certain business lines largely in U.S.dollars.
• Insurance reported results include the change in fair value ofinvestments backing our life and health policyholder liabilitiesrecorded as revenue, which is largely offset in PBCAE.
• Capital Markets results are reported on a taxable equivalentbasis (teb), which grosses up net interest income from certaintax-advantaged sources (Canadian taxable corporate dividends)to their effective taxable equivalent value with a corresponding
offset recorded in the provision for income taxes. We record theelimination of the teb adjustments in Corporate Support. Webelieve these adjustments are useful and reflect how CapitalMarkets manages its business, since it enhances thecomparability of revenue and related ratios across taxablerevenue and our principal tax-advantaged source of revenue. Theuse of teb adjustments and measures may not be comparable tosimilar GAAP measures or similarly adjusted amounts disclosedby other financial institutions.
• Corporate Support results include all enterprise-level activitiesthat are undertaken for the benefit of the organization that arenot allocated to our five business segments, such as volatilityrelated to treasury activities, securitizations and net chargesassociated with unattributed capital.
• Specific allowances are recorded to recognize estimated losseson our lending portfolio on loans that have become impaired.The specific provisions for credit losses are included in theresults of each business segment to fully reflect the appropriateexpenses related to the conduct of each business segment. Ageneral allowance is established to cover estimated creditlosses incurred in the lending portfolio that have not beenspecifically identified as impaired. Changes in the generalallowance are included in Corporate Support, as Group Risk
12 Royal Bank of Canada: Annual Report 2010 Management’s Discussion and Analysis
Management effectively controls this through its monitoring andoversight of various portfolios of loans throughout the enter-prise.
Key methodologiesThe following outlines the key methodologies and assumptions usedin our management reporting framework. These are periodicallyreviewed by management to ensure they remain valid.
Expense allocationTo ensure that our business segments’ results include expensesassociated with the conduct of their business, we allocate costsincurred or services provided by Operations, Technology andFunctions, which were directly undertaken or provided on thebusiness segments’ behalf. For other costs not directly attributable toour business segments, including overhead costs and other indirectexpenses, we use our management reporting framework for allocatingthese costs to each business segment in a manner that reflects theunderlying benefits.
Capital attributionOur framework also determines the attribution of capital to ourbusiness segments in a manner that is intended to consistentlymeasure and align economic costs with the underlying benefits andrisks associated with the activities of each business segment. Theamount of capital assigned to each business segment is referred to asattributed capital. Unattributed capital and associated net chargesare reported in Corporate Support. For further information, refer to theCapital management and Key performance and non-GAAP measuressections.
Funds transfer pricingA funds transfer pricing methodology is used to allocate interestincome and expense by product to each business segment. Thisallocation considers the interest rate risk, liquidity and funding riskand regulatory requirements of each of our business segments. Webase transfer pricing on external market costs and each businesssegment fully absorbs the costs of running its business. Our businesssegments may retain certain interest rate exposures subject tomanagement approval that would be expected in the normal courseof operations.
Changes made in 2010We reclassified certain amounts in Corporate Support which werepreviously reported primarily in Trading revenue, to the Other categoryof non-interest income to better reflect the nature of these amounts.Certain comparative amounts have been reclassified to conform tothe current period’s presentation.
Securitization reportingThe gains/losses on the sale of and hedging activities related to ourCanadian originated mortgage securitizations and our securitizedcredit card loans are recorded in Corporate Support. Hedging activ-ities include current net mark-to-market movement of the relatedinstruments and the amortization gains/losses of cash flow hedgesthat were previously terminated. As the securitization activitiesrelated to our Canadian originated mortgages and credit card loans isdone for funding purposes, Canadian Banking recognizes themortgage and credit card loan related income and provision for creditlosses, as if balances had not been securitized, with thecorresponding offset recorded in Corporate Support.
Canadian Banking
Canadian Banking comprises our domestic personal and businessbanking operations and certain retail investment businesses and isoperated through three business lines: Personal Financial Services,Business Financial Services, and Cards and Payment Solutions.Canadian Banking provides a broad suite of financial products andservices to over 10 million individual and business clients throughour extensive branch, automated teller machines (ATMs), online andtelephone banking networks, as well as through a large number ofproprietary sales professionals. The competitive landscape of ourbanking-related operations in the Canadian financial servicesindustry consists of other Schedule I banks, independent trustcompanies, foreign banks, credit unions and caisses populaires. Inthis competitive environment, we have top rankings in market sharefor most retail financial product categories, the largest branchnetwork, the most ATMs and the largest mobile sales network acrossCanada.
Year in review• We became the first Canadian issuer of both Visa and
MasterCard with the launch of Westjet MasterCard co-brand cardin March; a travel rewards card offering Westjet travel creditrewards to clients. We also launched our new Cash back creditcard in June which rewards our clients a portion of theirpurchases in the form of cash back.
• We made significant investments in technology for the benefit ofour clients, including a new commercial sales platform and a
new online banking website. Our newly designed online bankingwebsite includes myFinanceTrackerTM, Canada’s first onlinefinancial management tool integrated into an online bankingsystem. myFinanceTracker will automatically categorize trans-actions, track expenses and provide advanced budgetingcapabilities for all personal banking and credit card accounts.
• We launched the $6 low fee small business account providingvalue conscious business clients with the most competitiveproduct available in the industry.
• We opened our new RBC retail store concept, a dramatically newretail banking environment with merchandising areas andinteractive digital technologies which will redesign and simplifythe customer shopping experience.
Economic and market reviewContinued improvement in the Canadian economy in the first half ofthe year, drove volume growth in our home equity products, personallending, and personal and business deposits. Volume growthmoderated in the latter part of the year due to the effects of a slowingCanadian economy. The improvement in global capital marketscontributed to higher mutual fund revenue from overall capitalappreciation and net sales of long-term funds as retail investorconfidence returned. Stabilizing asset quality and the continuedrecovery of the Canadian labour market resulted in lower PCL. Forfurther details on our general economic review, refer to the Economic,market and regulatory review and outlook section.
Management’s Discussion and Analysis Royal Bank of Canada: Annual Report 2010 13
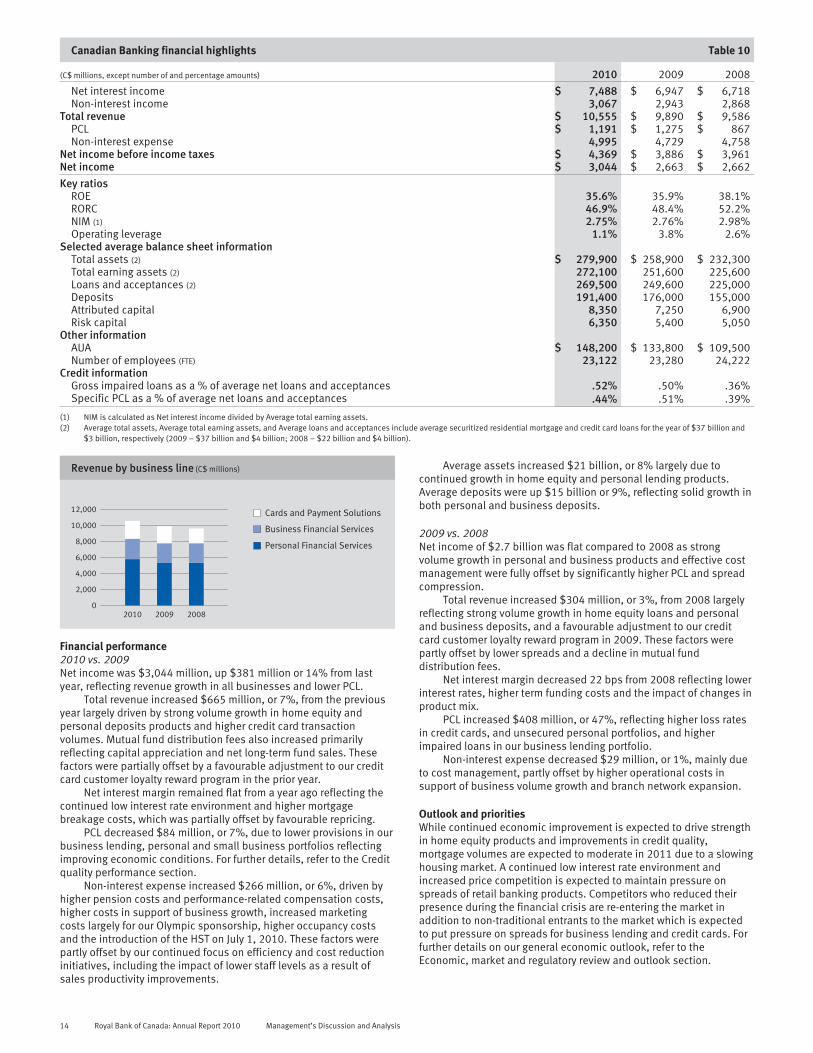
Canadian Banking financial highlights Table 10
(C$ millions, except number of and percentage amounts) 2010 2009 2008
Net interest income $ 7,488 $ 6,947 $ 6,718Non-interest income 3,067 2,943 2,868
Total revenue $ 10,555 $ 9,890 $ 9,586PCL $ 1,191 $ 1,275 $ 867Non-interest expense 4,995 4,729 4,758
Net income before income taxes $ 4,369 $ 3,886 $ 3,961Net income $ 3,044 $ 2,663 $ 2,662
Key ratiosROE 35.6% 35.9% 38.1%RORC 46.9% 48.4% 52.2%NIM (1) 2.75% 2.76% 2.98%Operating leverage 1.1% 3.8% 2.6%
Selected average balance sheet informationTotal assets (2) $ 279,900 $ 258,900 $ 232,300Total earning assets (2) 272,100 251,600 225,600Loans and acceptances (2) 269,500 249,600 225,000Deposits 191,400 176,000 155,000Attributed capital 8,350 7,250 6,900Risk capital 6,350 5,400 5,050
Other informationAUA $ 148,200 $ 133,800 $ 109,500Number of employees (FTE) 23,122 23,280 24,222
Credit informationGross impaired loans as a % of average net loans and acceptances .52% .50% .36%Specific PCL as a % of average net loans and acceptances .44% .51% .39%
(1) NIM is calculated as Net interest income divided by Average total earning assets.(2) Average total assets, Average total earning assets, and Average loans and acceptances include average securitized residential mortgage and credit card loans for the year of $37 billion and
$3 billion, respectively (2009 – $37 billion and $4 billion; 2008 – $22 billion and $4 billion).
Revenue by business line (C$ millions)
2010 2009 20080
2,000
4,000
6,000
8,000
10,000
12,000
Business Financial Services
Personal Financial Services
Cards and Payment Solutions
Financial performance2010 vs. 2009Net income was $3,044 million, up $381 million or 14% from lastyear, reflecting revenue growth in all businesses and lower PCL.
Total revenue increased $665 million, or 7%, from the previousyear largely driven by strong volume growth in home equity andpersonal deposits products and higher credit card transactionvolumes. Mutual fund distribution fees also increased primarilyreflecting capital appreciation and net long-term fund sales. Thesefactors were partially offset by a favourable adjustment to our creditcard customer loyalty reward program in the prior year.
Net interest margin remained flat from a year ago reflecting thecontinued low interest rate environment and higher mortgagebreakage costs, which was partially offset by favourable repricing.
PCL decreased $84 million, or 7%, due to lower provisions in ourbusiness lending, personal and small business portfolios reflectingimproving economic conditions. For further details, refer to the Creditquality performance section.
Non-interest expense increased $266 million, or 6%, driven byhigher pension costs and performance-related compensation costs,higher costs in support of business growth, increased marketingcosts largely for our Olympic sponsorship, higher occupancy costsand the introduction of the HST on July 1, 2010. These factors werepartly offset by our continued focus on efficiency and cost reductioninitiatives, including the impact of lower staff levels as a result ofsales productivity improvements.
Average assets increased $21 billion, or 8% largely due tocontinued growth in home equity and personal lending products.Average deposits were up $15 billion or 9%, reflecting solid growth inboth personal and business deposits.
2009 vs. 2008Net income of $2.7 billion was flat compared to 2008 as strongvolume growth in personal and business products and effective costmanagement were fully offset by significantly higher PCL and spreadcompression.
Total revenue increased $304 million, or 3%, from 2008 largelyreflecting strong volume growth in home equity loans and personaland business deposits, and a favourable adjustment to our creditcard customer loyalty reward program in 2009. These factors werepartly offset by lower spreads and a decline in mutual funddistribution fees.
Net interest margin decreased 22 bps from 2008 reflecting lowerinterest rates, higher term funding costs and the impact of changes inproduct mix.
PCL increased $408 million, or 47%, reflecting higher loss ratesin credit cards, and unsecured personal portfolios, and higherimpaired loans in our business lending portfolio.
Non-interest expense decreased $29 million, or 1%, mainly dueto cost management, partly offset by higher operational costs insupport of business volume growth and branch network expansion.
Outlook and prioritiesWhile continued economic improvement is expected to drive strengthin home equity products and improvements in credit quality,mortgage volumes are expected to moderate in 2011 due to a slowinghousing market. A continued low interest rate environment andincreased price competition is expected to maintain pressure onspreads of retail banking products. Competitors who reduced theirpresence during the financial crisis are re-entering the market inaddition to non-traditional entrants to the market which is expectedto put pressure on spreads for business lending and credit cards. Forfurther details on our general economic outlook, refer to theEconomic, market and regulatory review and outlook section.
14 Royal Bank of Canada: Annual Report 2010 Management’s Discussion and Analysis

Key strategic priorities for 2011• Continue to deliver superior client experience and advice to drive
industry leading volume growth.• Continue to simplify our end-to-end processes to reduce
complexity and improve efficiency.
• Enable collaboration and convergence of people and channels toincrease employee engagement and productivity and strengthenour distribution capabilities.
Business line review
Personal Financial Services
Personal Financial Services focuses on meeting the needs of ourindividual clients at every stage of their lives through a wide range offinancing and investment products and services, including homeequity financing, personal lending, deposit accounts, mutual fundsand self-directed brokerage accounts, GICs and Canadian privatebanking. We rank first or second in market share for most personalbanking products and our retail banking network is the largest inCanada with 1,209 branches and 4,227 ATMs.
Financial performanceTotal revenue increased $455 million, or 9%, compared to the prioryear reflecting strong volume growth in residential mortgages,personal loans and personal deposits. Mutual fund distribution feesalso increased on solid balance growth reflecting capital appreciationand net sales of long-term funds.
Average residential mortgages were up 7% over last year,supported by continued low interest rates and a solid housingmarket. Average personal deposits grew by 14% from last year, drivenby the continued success of our key savings products and customerpreference for reduced risk.
Selected highlights Table 11
(C$ millions except number of) 2010 2009 2008
Total revenue $ 5,760 $ 5,305 $ 5,315Other information (average)
Residential mortgages 151,000 141,800 129,800Personal loans 63,700 53,000 43,700Personal deposits 56,100 49,000 41,200Personal GICs 55,500 58,000 55,600Branch mutual fund balances (1) 70,100 63,300 58,000AUA – Self-directed brokerage (1) 42,400 35,500 26,500New deposit accounts
opened (thousands) 968 990 1,129Number of:
Branches 1,209 1,197 1,174ATMs 4,227 4,214 4,149
(1) Represents year-end spot balances.
Average residential mortgages, personal loans and deposits (C$ millions)
Personal loans
Residential mortgages
Personal deposits
0
30,000
60,000
90,000
150,000
120,000
0
13,000
26,000
39,000
65,000
52,000
2010 2009 2008 2010 2009 2008
Business Financial Services
Business Financial Services offers a wide range of lending, leasing,deposit, investment, foreign exchange, cash management and tradeproducts and services to small-and medium-sized businesses andcommercial, agriculture and agribusiness clients across Canada. Ourextensive business banking network includes over 100 businessbanking centres and over 2,000 business account managers. Ourstrong commitment to our clients has resulted in leading marketshare in business loans and deposits.
Financial performanceTotal revenue increased $100 million or 4%, compared to the prioryear largely reflecting volume growth in business deposits.
Over the course of the year, businesses have continued toincrease their liquidity levels, leading to solid growth of 6% inbusiness deposits; however this resulted in reduced demand forcredit, limiting our business loan growth, which was flat compared tothe prior year.
Selected highlights Table 12
(C$ millions) 2010 2009 2008
Total revenue $ 2,557 $ 2,457 $ 2,441Other information (average)
Business loans (1) 42,400 42,400 39,900Business deposits (2) 69,400 65,400 58,000
(1) Includes small business loans treated as retail and wholesale loans.(2) Includes GIC balances.
Average business loans and deposits (C$ millions)
Business deposits
Business loans
0
9,000
18,000
27,000
36,000
45,000
0
14,000
28,000
42,000
56,000
70,000
2010 20082009 2010 20082009
Management’s Discussion and Analysis Royal Bank of Canada: Annual Report 2010 15
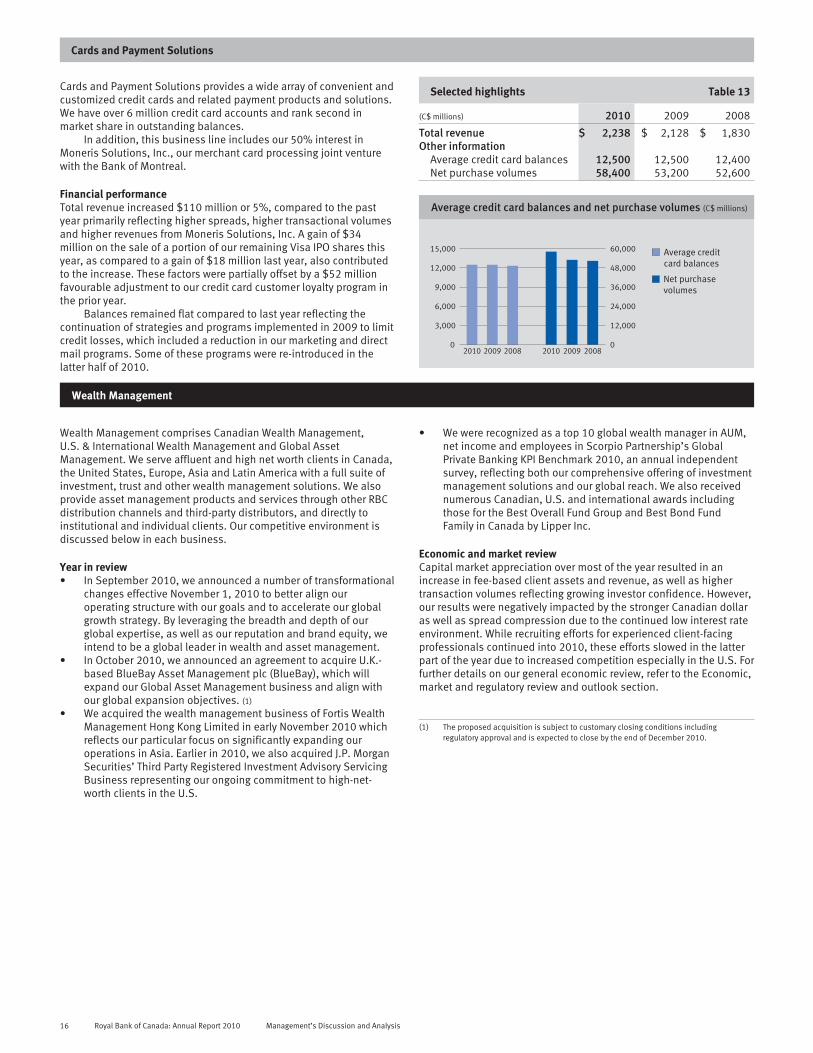
Cards and Payment Solutions
Cards and Payment Solutions provides a wide array of convenient andcustomized credit cards and related payment products and solutions.We have over 6 million credit card accounts and rank second inmarket share in outstanding balances.
In addition, this business line includes our 50% interest inMoneris Solutions, Inc., our merchant card processing joint venturewith the Bank of Montreal.
Financial performanceTotal revenue increased $110 million or 5%, compared to the pastyear primarily reflecting higher spreads, higher transactional volumesand higher revenues from Moneris Solutions, Inc. A gain of $34million on the sale of a portion of our remaining Visa IPO shares thisyear, as compared to a gain of $18 million last year, also contributedto the increase. These factors were partially offset by a $52 millionfavourable adjustment to our credit card customer loyalty program inthe prior year.
Balances remained flat compared to last year reflecting thecontinuation of strategies and programs implemented in 2009 to limitcredit losses, which included a reduction in our marketing and directmail programs. Some of these programs were re-introduced in thelatter half of 2010.
Selected highlights Table 13
(C$ millions) 2010 2009 2008
Total revenue $ 2,238 $ 2,128 $ 1,830Other information
Average credit card balances 12,500 12,500 12,400Net purchase volumes 58,400 53,200 52,600
Average credit card balances and net purchase volumes (C$ millions)
Net purchasevolumes
Average creditcard balances
0
3,000
6,000
9,000
12,000
15,000
0
12,000
24,000
36,000
48,000
60,000
2010 20082009 2010 20082009
Wealth Management
Wealth Management comprises Canadian Wealth Management,U.S. & International Wealth Management and Global AssetManagement. We serve affluent and high net worth clients in Canada,the United States, Europe, Asia and Latin America with a full suite ofinvestment, trust and other wealth management solutions. We alsoprovide asset management products and services through other RBCdistribution channels and third-party distributors, and directly toinstitutional and individual clients. Our competitive environment isdiscussed below in each business.
Year in review• In September 2010, we announced a number of transformational
changes effective November 1, 2010 to better align ouroperating structure with our goals and to accelerate our globalgrowth strategy. By leveraging the breadth and depth of ourglobal expertise, as well as our reputation and brand equity, weintend to be a global leader in wealth and asset management.
• In October 2010, we announced an agreement to acquire U.K.-based BlueBay Asset Management plc (BlueBay), which willexpand our Global Asset Management business and align withour global expansion objectives. (1)
• We acquired the wealth management business of Fortis WealthManagement Hong Kong Limited in early November 2010 whichreflects our particular focus on significantly expanding ouroperations in Asia. Earlier in 2010, we also acquired J.P. MorganSecurities’ Third Party Registered Investment Advisory ServicingBusiness representing our ongoing commitment to high-net-worth clients in the U.S.
• We were recognized as a top 10 global wealth manager in AUM,net income and employees in Scorpio Partnership’s GlobalPrivate Banking KPI Benchmark 2010, an annual independentsurvey, reflecting both our comprehensive offering of investmentmanagement solutions and our global reach. We also receivednumerous Canadian, U.S. and international awards includingthose for the Best Overall Fund Group and Best Bond FundFamily in Canada by Lipper Inc.
Economic and market reviewCapital market appreciation over most of the year resulted in anincrease in fee-based client assets and revenue, as well as highertransaction volumes reflecting growing investor confidence. However,our results were negatively impacted by the stronger Canadian dollaras well as spread compression due to the continued low interest rateenvironment. While recruiting efforts for experienced client-facingprofessionals continued into 2010, these efforts slowed in the latterpart of the year due to increased competition especially in the U.S. Forfurther details on our general economic review, refer to the Economic,market and regulatory review and outlook section.
(1) The proposed acquisition is subject to customary closing conditions includingregulatory approval and is expected to close by the end of December 2010.
16 Royal Bank of Canada: Annual Report 2010 Management’s Discussion and Analysis

Wealth Management financial highlights Table 14
(C$ millions, except number of and percentage amounts) 2010 2009 2008
Net interest income $ 305 $ 397 $ 468Non-interest income
Fee-based revenue 2,362 2,154 2,276Transaction and other revenue 1,521 1,529 1,243
Total revenue $ 4,188 $ 4,080 $ 3,987PCL $ 3 $ – $ 1Non-interest expense 3,295 3,262 3,038
Net income before income taxes $ 890 $ 818 $ 948Net income $ 669 $ 583 $ 665
Key ratiosROE 17.6% 14.2% 23.3%RORC 64.6% 49.2% 64.9%Pre-tax margin (1) 21.3% 20.0% 23.8%
Selected average balance sheet informationTotal assets $ 18,400 $ 20,500 $ 16,900Loans and acceptances 6,800 5,800 5,200Deposits 29,000 31,500 26,900Attributed capital 3,650 3,900 2,800Risk capital 1,000 1,100 1,000
Other informationRevenue per advisor (000s) (2) $ 703 $ 670 $ 731AUA 521,600 502,300 495,100AUM 261,800 245,700 222,600Number of employees (FTE) 10,677 10,818 10,954Number of advisors (3) 4,299 4,504 4,346
Estimated impact of US$ translation on key income statement items 2010 vs. 2009
Impact on income increase (decrease):Total revenue $ (200)Non-interest expense 160Net income (35)
Percentage change in average US$ equivalent of C$1.00 12%
(1) Pre-tax margin is defined as net income before income taxes divided by total revenue.(2) Represents investment advisors and financial consultants of our Canadian and U.S. full-service brokerage businesses.(3) Represents client-facing advisors across all our wealth management businesses.
Revenue by business line (C$ millions)
2010 2009 20080
1,000
2,000
3,000
4,000
5,000
Canadian Wealth Management
U.S. & InternationalWealth Management
Global Asset Management
Financial performance2010 vs. 2009Net income increased $86 million, or 15%, from a year ago, primarilydue to higher average fee-based client assets and higher transactionvolumes as well as favourable income tax adjustments recorded inthe current year. These factors were partially offset by spreadcompression and the impact of the stronger Canadian dollar.
Total revenue increased $108 million, or 3%, largely reflectinghigher average fee-based client assets resulting from capitalappreciation and higher transaction volumes reflecting improvedmarket conditions and investor confidence. These factors werepartially offset by the impact of the stronger Canadian dollar, lowerspreads on client cash deposits and higher fee waivers largely onU.S. money market funds resulting from the continued low interestrate environment.
Non-interest expense increased $33 million, or 1%, primarilydue to higher variable compensation driven by higher commission-based revenue, and the increase in fair value of our earnedcompensation liability related to our stock-based compensation plan.These factors were largely offset by the impact of the strongerCanadian dollar and the reversal of the remaining provision related tothe Reserve Primary Fund. For further details refer to the 2009 vs 2008discussion below.
2009 vs. 2008Net income decreased $82 million, or 12%, from 2008, mainlyreflecting lower average fee-based client assets and spreadcompression. These factors were partially offset by a gain, ascompared to a loss in 2008, on our stock-based compensation plan,the provisions related to the Reserve Primary Fund and auction ratesecurities in 2008, the impact of the weaker Canadian dollar and thefull year of results from our Phillips, Hager & North InvestmentManagement Ltd. (PH&N) acquisition.
Total revenue increased $93 million, or 2%, mainly due to theimpact of the weaker Canadian dollar. A gain, as compared to a lossin 2008, on our stock-based compensation plan in our U.S. brokeragebusiness and higher transaction volumes reflecting a full year ofrevenue from Ferris, Baker Watts Inc. (FBW) also contributed to theincrease. These factors were largely offset by lower average fee-basedclient assets, which was only partially offset by the inclusion of a fullyear of revenue from PH&N, as well as spread compression.
Non-interest expense was up $224 million, or 7%, mainly due tothe impact of the weaker Canadian dollar as well as higher infra-structure and staff costs in support of business growth. These factorswere partially offset by our focus on cost management, the provisionsrelated to our support agreement for clients of FBW invested in theReserve Primary Fund in 2008 and Wealth Management’s share of thesettlement with U.S. regulators relating to auction rate securities.
Management’s Discussion and Analysis Royal Bank of Canada: Annual Report 2010 17
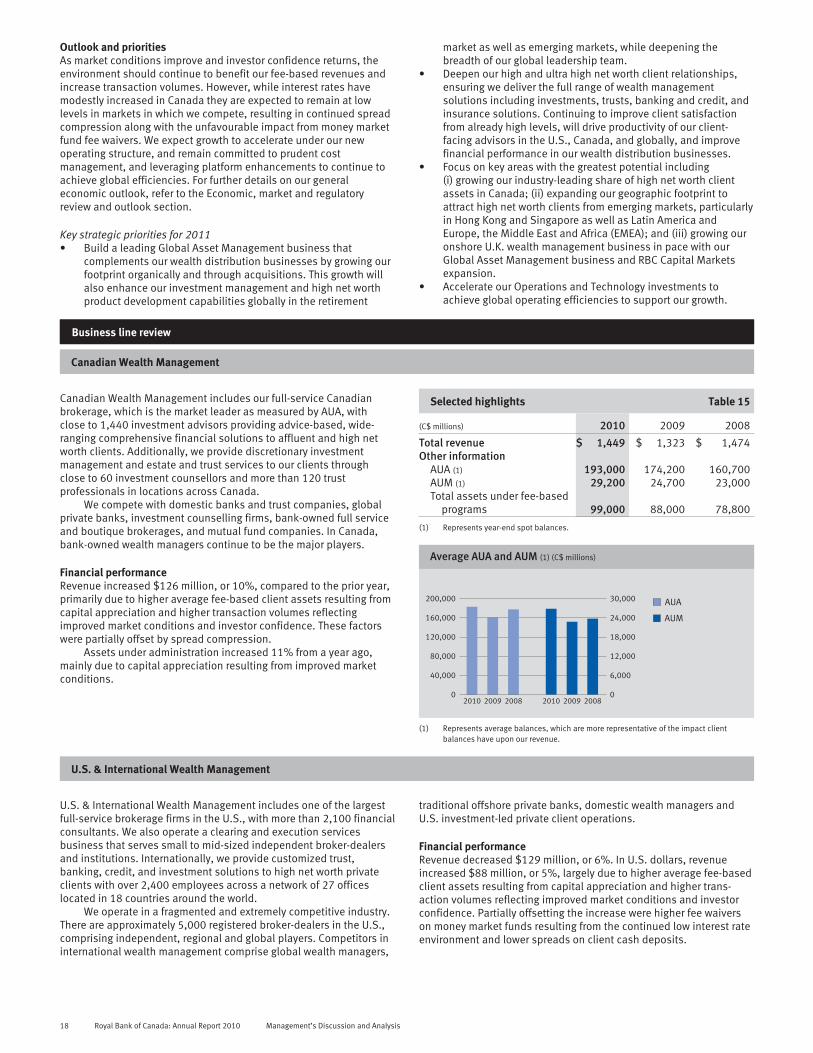
Outlook and prioritiesAs market conditions improve and investor confidence returns, theenvironment should continue to benefit our fee-based revenues andincrease transaction volumes. However, while interest rates havemodestly increased in Canada they are expected to remain at lowlevels in markets in which we compete, resulting in continued spreadcompression along with the unfavourable impact from money marketfund fee waivers. We expect growth to accelerate under our newoperating structure, and remain committed to prudent costmanagement, and leveraging platform enhancements to continue toachieve global efficiencies. For further details on our generaleconomic outlook, refer to the Economic, market and regulatoryreview and outlook section.
Key strategic priorities for 2011• Build a leading Global Asset Management business that
complements our wealth distribution businesses by growing ourfootprint organically and through acquisitions. This growth willalso enhance our investment management and high net worthproduct development capabilities globally in the retirement
market as well as emerging markets, while deepening thebreadth of our global leadership team.
• Deepen our high and ultra high net worth client relationships,ensuring we deliver the full range of wealth managementsolutions including investments, trusts, banking and credit, andinsurance solutions. Continuing to improve client satisfactionfrom already high levels, will drive productivity of our client-facing advisors in the U.S., Canada, and globally, and improvefinancial performance in our wealth distribution businesses.
• Focus on key areas with the greatest potential including(i) growing our industry-leading share of high net worth clientassets in Canada; (ii) expanding our geographic footprint toattract high net worth clients from emerging markets, particularlyin Hong Kong and Singapore as well as Latin America andEurope, the Middle East and Africa (EMEA); and (iii) growing ouronshore U.K. wealth management business in pace with ourGlobal Asset Management business and RBC Capital Marketsexpansion.
• Accelerate our Operations and Technology investments toachieve global operating efficiencies to support our growth.
Business line review
Canadian Wealth Management
Canadian Wealth Management includes our full-service Canadianbrokerage, which is the market leader as measured by AUA, withclose to 1,440 investment advisors providing advice-based, wide-ranging comprehensive financial solutions to affluent and high networth clients. Additionally, we provide discretionary investmentmanagement and estate and trust services to our clients throughclose to 60 investment counsellors and more than 120 trustprofessionals in locations across Canada.
We compete with domestic banks and trust companies, globalprivate banks, investment counselling firms, bank-owned full serviceand boutique brokerages, and mutual fund companies. In Canada,bank-owned wealth managers continue to be the major players.
Financial performanceRevenue increased $126 million, or 10%, compared to the prior year,primarily due to higher average fee-based client assets resulting fromcapital appreciation and higher transaction volumes reflectingimproved market conditions and investor confidence. These factorswere partially offset by spread compression.
Assets under administration increased 11% from a year ago,mainly due to capital appreciation resulting from improved marketconditions.
Selected highlights Table 15
(C$ millions) 2010 2009 2008
Total revenue $ 1,449 $ 1,323 $ 1,474Other information
AUA (1) 193,000 174,200 160,700AUM (1) 29,200 24,700 23,000Total assets under fee-based
programs 99,000 88,000 78,800
(1) Represents year-end spot balances.
Average AUA and AUM (1) (C$ millions)
AUM
AUA
2010 2009 2008 2010 2009 20080
40,000
80,000
120,000
160,000
200,000
0
6,000
12,000
18,000
24,000
30,000
(1) Represents average balances, which are more representative of the impact clientbalances have upon our revenue.
U.S. & International Wealth Management
U.S. & International Wealth Management includes one of the largestfull-service brokerage firms in the U.S., with more than 2,100 financialconsultants. We also operate a clearing and execution servicesbusiness that serves small to mid-sized independent broker-dealersand institutions. Internationally, we provide customized trust,banking, credit, and investment solutions to high net worth privateclients with over 2,400 employees across a network of 27 officeslocated in 18 countries around the world.
We operate in a fragmented and extremely competitive industry.There are approximately 5,000 registered broker-dealers in the U.S.,comprising independent, regional and global players. Competitors ininternational wealth management comprise global wealth managers,
traditional offshore private banks, domestic wealth managers andU.S. investment-led private client operations.
Financial performanceRevenue decreased $129 million, or 6%. In U.S. dollars, revenueincreased $88 million, or 5%, largely due to higher average fee-basedclient assets resulting from capital appreciation and higher trans-action volumes reflecting improved market conditions and investorconfidence. Partially offsetting the increase were higher fee waiverson money market funds resulting from the continued low interest rateenvironment and lower spreads on client cash deposits.
18 Royal Bank of Canada: Annual Report 2010 Management’s Discussion and Analysis

In U.S. dollars, assets under administration increased 6% from ayear ago, mainly due to capital appreciation resulting from improvedmarket conditions.
Selected highlights Table 16
(C$ millions) 2010 2009 2008
Total revenue $ 2,003 $ 2,132 $ 1,869Other information (US$ millions)
Total revenue 1,927 1,839 1,812Total loans, guarantees and
letters of credit (1), (2) 6,700 5,500 5,200Total deposits (1), (2) 18,200 18,700 18,500AUA (3) 322,100 303,300 277,600AUM (3) 22,900 19,700 16,200Total assets under fee-based
programs (4) 39,200 31,000 21,300
(1) Represents amounts related to our international wealth management businesses.(2) Represents an average amount, which is calculated using methods intended to
approximate the average of the daily balances for the period.(3) Represents year end spot balances.(4) Represents amounts related to our U.S. wealth management businesses.
Average AUA and AUM (1) (US$ millions)
AUM
AUA
2010 2009 2008 2010 2009 20080
70,000
140,000
210,000
280,000
350,000
0
5,000
10,000
15,000
20,000
25,000
(1) Represents average balances, which are more representative of the impact clientbalances have upon our revenue.
Global Asset Management
Global Asset Management is responsible for our proprietary assetmanagement business. We provide a broad range of investmentmanagement services through mutual and pooled funds, fee-basedaccounts and separately managed portfolios. We distribute ourinvestment solutions through a broad network of our bank branches,our discount and full-service brokerage businesses, independentadvisors and directly to consumers. We also provide investmentsolutions directly to institutional clients, including pension plans,endowments and foundations. We are the largest fund company andone of the largest money managers in Canada, with a 15% marketshare as measured by AUM as recognized by the Investment FundsInstitute of Canada.
As discussed above, in October 2010 we announced ourintention to acquire BlueBay, which is one of Europe’s largestindependent managers of fixed income funds and products. BlueBaywill enable a broader product offering and distribution presence, andcoupled with its strong management, is capable of leading assetmanagement growth across the U.K., EMEA, Latin America and Asianmarkets.
We face competition in Canada from major banks, insurancecompanies, asset management organizations and boutique firms. TheCanadian fund management industry is large, and mature, but still arelatively fragmented industry. Our U.S. asset manager competes withindependent asset management firms, as well as those that are partof national and international banks, insurance companies andboutique asset managers.
Financial performanceRevenue increased $111 million, or 18%, from a year ago, mainlydue to higher average fee-based client assets resulting from capitalappreciation, and clients’ preference for higher-yielding long-termfunds.
AUM increased 5% from a year ago, mainly due to capitalappreciation from improved market conditions and increased long-term mutual fund sales, partially offset by the impact of the strongerCanadian dollar and increased Canadian money market fund netredemptions.
Selected highlights Table 17
(C$ millions) 2010 2009 2008
Total revenue $ 736 $ 625 $ 644Other information
Canadian net long-term mutualfund sales 6,400 2,100 600
Canadian net money marketmutual fund (redemptions)sales (8,700) (2,000) 8,200
AUM (1) 209,200 199,700 180,100
(1) Represents year end spot balances.
Average AUM (1) (C$ millions)
2010 2009 20080
50,000
100,000
150,000
200,000
250,000 AUM
(1) Represents average balances, which are more representative of the impact clientbalances have upon our revenue.
Management’s Discussion and Analysis Royal Bank of Canada: Annual Report 2010 19

Insurance
Insurance comprises Canadian Insurance, U.S. Insurance, andInternational & Other. In Canada, we offer our products and servicesthrough our growing proprietary channels including retail insurancebranches, call centres, and our career sales force, as well as throughindependent insurance advisors and travel agencies. Outside NorthAmerica, we operate in reinsurance markets globally. Our competitiveenvironment is discussed in each business.
Divestiture of Liberty LifeIn October 2010, we announced our intention to sell Liberty Life, ourU.S. life insurance business, to Athene Holding Ltd., for US$628million. The transaction is subject to regulatory approvals andcustomary closing conditions, and is expected to close in early 2011.As a result of this transaction, we recorded a loss of $116 million(US$114 million) in the fourth quarter of 2010 on both a before- andafter-tax basis. For further details, refer to Note 11 and Note 31 to our2010 Annual Consolidated Financial Statements.
Subsequent to the completion of the divestiture, we will realignInsurance into two lines of business, Canadian Insurance andInternational & Other. The travel insurance businesses in the U.S. willbe included in International & Other.
Year in review• In Canada, we continued to improve our distribution economics
through shared and streamlined processes, while deepening ourclient relationships and simplifying the way we do business.
• We continued to expand and improve our Canadian retailinsurance network to 52 branches in 2010, from 49 branches in2009 giving our clients more convenient access to insuranceservices.
• We launched an improved Universal Life product, with a newsupporting team working across all channels to efficiently delivera better product to our clients.
• Internationally, we have continued to develop our reinsurancebusinesses with solid business growth during the year.
Economic and market reviewImproved market conditions contributed to higher investment returnsin the current year as well as annuity growth in our International andother businesses. During the year, we experienced higher disabilityand auto claims costs. The higher auto claims cost partly resultedfrom higher auto claim activity in advance of the Ontario autoinsurance reform which was passed in late 2010. For further detailson our general economic review, refer to the Economic, market andregulatory review and outlook section.
Insurance financial highlights Table 18
(C$ millions, except number of and percentage amounts) 2010 2009 2008
Non-interest incomeNet earned premiums $ 4,484 $ 3,889 $ 2,864Investment income (1) 1,443 1,579 (458)Fee income 251 247 204Other (2) (116) – –
Total revenue $ 6,062 $ 5,715 $ 2,610Insurance policyholder benefits and claims (1) $ 4,421 $ 3,975 $ 1,029Insurance policyholder acquisition expense 687 634 602Non-interest expense 552 559 576
Net income before income taxes $ 402 $ 547 $ 403Net income $ 405 $ 496 $ 389
Key ratiosROE 26.6% 37.0% 32.8%RORC 30.1% 42.9% 37.1%
Selected average balance sheet informationTotal assets $ 15,200 $ 13,100 $ 12,600Attributed capital 1,500 1,300 1,150Risk capital 1,300 1,150 1,050
Other informationPremiums and deposits (3) $ 5,704 $ 4,970 $ 3,861Insurance claims and policy benefit liabilities $ 10,750 $ 8,922 $ 7,385Fair value changes on investments backing policyholder liabilities (1) 662 917 (870)Embedded value (4) 6,427 5,924 4,919AUM 300 200 400Number of employees (FTE) (5) 2,957 2,777 2,939
Estimated impact of US$ and British pound translation on key income statement items 2010 vs. 2009
Impact on income increase (decrease):Total revenue $ (250)PBCAE 235Non-interest expense 10Net income (5)
Percentage change in average US$ equivalent of C$1.00 12%Percentage change in average British pound equivalent of C$1.00 11%
(1) Investment income can experience volatility arising from fluctuation in the fair value of HFT assets. The investments which support actuarial liabilities are predominantly fixed income assetsdesignated as HFT. Consequently changes in fair values of these assets are recorded in investment income in the consolidated statements of income and are largely offset by changes in thefair value of the actuarial liabilities, the impact of which is reflected in insurance policyholder benefits and claims.
(2) Relates to loss on Liberty Life.(3) Premiums and deposits include premiums on risk-based insurance and annuity products, and individual and group segregated fund deposits, consistent with insurance industry practices.(4) Embedded value is defined as the value of equity held in our Insurance segment and the value of in-force business (existing policies). For further details, refer to the Key performance and non
GAAP measures section.(5) 2009 and 2008 amounts have been restated to reflect the realignment of our insurance operations and technology teams in 2009.
20 Royal Bank of Canada: Annual Report 2010 Management’s Discussion and Analysis

Revenue by business line (C$ millions)
2010 2009 20080
1,400
2,800
4,200
5,600
7,000
International & OtherInsurance
Canadian Insurance
U.S. Insurance
Premiums and deposits by business line (C$ millions)
2010 2009 20080
1,400
2,800
4,200
5,600
7,000
International & OtherInsurance
Canadian Insurance
U.S. Insurance
Financial performance2010 vs. 2009Net income decreased $91 million or 18%, compared to the prioryear. Excluding the loss on Liberty Life, net income increased$25 million, or 5%, mainly due to favourable actuarial adjustmentsreflecting management actions and assumption changes, higher netinvestment gains, our ongoing focus on cost management andvolume growth. These factors were partially offset by higher disabilityand auto claims costs, and unfavourable life policyholder experience.
Total revenue increased $347 million, compared to the prioryear. Excluding the loss on Liberty Life, total revenue increased$463 million, or 8%, mainly reflecting volume growth across allbusinesses, including annuity growth in our U.S. and Internationalbusinesses, and higher net investment gains. These factors werepartially offset by the change in fair value of investments backing ourlife and health policyholder liabilities, and the impact of the strongerCanadian dollar. The annuity volumes and the change in fair value ofinvestments were largely offset in PBCAE. Results excluding the losson Liberty Life are non-GAAP measures. Refer to the Key performanceand non-GAAP measures section.
PBCAE increased $499 million, or 11%, primarily reflectinghigher costs commensurate with volume growth across allbusinesses, including annuity growth in our U.S. and Internationalbusinesses, higher disability and auto claims costs, and unfavourablelife policyholder experience. These factors were partially offset by thechange in fair value of investments, the impact of the strongerCanadian dollar, and favourable actuarial adjustments.
Non-interest expense was down $7 million, or 1%, mainly due toour ongoing focus on cost management and the impact of thestronger Canadian dollar. These factors were largely offset by highercosts in support of volume growth.
Premiums and deposits were up $734 million, or 15%, reflectingvolume growth in all business lines due to strong sales and clientretention, partially offset by the impact of the stronger Canadiandollar.
Embedded value increased $503 million, or 8%, largelyreflecting growth from new sales and favourable experienceadjustments. These items were partially offset by the impact of thetransfer of capital from our Insurance businesses and the impact ofthe stronger Canadian dollar. For further details, refer to the Keyperformance and non-GAAP measures section.
2009 vs. 2008Net income increased by $107 million, or 28%, compared to 2008, as2008 included investment losses of $110 million ($80 million after-tax). Volume growth in all businesses, new U.K. annuity reinsurance
arrangements, lower allocated funding costs on capital, and ourongoing focus on cost management also contributed to the increase.These factors were partially offset by unfavourable actuarialadjustments.
Total revenue increased $3,105 million, mainly due to thechange in fair value of investments and volume growth across allbusinesses, including annuity growth in our U.S. and International &Other insurance businesses. The impact of the weaker Canadiandollar and the 2008 investment losses on disposals and impairmentsalso contributed to the increase. The change in fair value ofinvestments and the annuity volumes were largely offset in PBCAE.
PBCAE increased $2,978 million, primarily reflecting the changein fair value of investments backing our life and health policyholderliabilities and higher costs commensurate with the increased annuityvolumes. The unfavourable actuarial adjustments and the impact ofthe weaker Canadian dollar also contributed to the increase.
Non-interest expense decreased $17 million, or 3%, reflectingour ongoing focus on cost management, largely offset by the impactof the weaker Canadian dollar and higher costs in support of volumegrowth, including the addition of new Canadian retail insurancebranches.
Outlook and prioritiesWe expect continued volume growth driven by new and improvedclient focused products delivered through our growing proprietarychannels. Our investment returns are expected to continue to improvewith stabilized market conditions. The recent Ontario auto reform isanticipated to have a favourable impact on auto claims experience.For further details on our general economic outlook, refer to theEconomic, market and regulatory review and outlook section.
Key strategic priorities for 2011• Increase sales through low cost distribution channels.• Deepen our relationships with clients by providing customers
with a comprehensive suite of RBC Insurance products andservices based on their needs.
• Simplify the way we do business by enhancing and streamliningall business processes to ensure that clients find it easy andsimple to do business with us, while managing our expenses.
• Pursue selected international niche opportunities with the aim ofgrowing our reinsurance business.
Management’s Discussion and Analysis Royal Bank of Canada: Annual Report 2010 21

Business line review
Canadian Insurance
We offer life and health, property and casualty insurance products aswell as wealth accumulation solutions, to individual and group clientsacross Canada. Our life and health portfolio includes universal life,critical illness, disability, long-term care insurance and groupbenefits. We offer a wide range of property and casualty productsincluding home, auto and travel insurance. Our travel productsinclude out of province/country medical coverage, trip cancellationinsurance and interruption insurance. We also offer commercialinsurance through our partnership with Aon Reed Stenhouse Inc.
In Canada, we compete against approximately 250 insurancecompanies, with the bulk of the organizations specializing in eitherlife and health, or property and casualty products. We hold a leadingmarket position in travel insurance products, have a significantpresence in life and health products, and a growing presence in thehome and auto markets.
Financial performanceTotal revenue increased $81 million, or 3%, compared to the prioryear, mainly due to volume growth in auto, home and life and healthproducts. These factors were partially offset by the change in fairvalue of investments backing our life and health policyholderliabilities, largely offset in PBCAE.
Premiums and deposits increased $206 million, or 10%,reflecting sales growth in home, auto and life and health productsand continued strong client retention.
Selected highlights Table 19
(C$ millions) 2010 2009 2008
Total revenue $ 2,735 $ 2,654 $ 1,400Other information
Premiums and depositsLife and health 1,249 1,210 1,188Property and casualty 838 708 643Annuity and segregated fund
deposits 83 46 84Fair value changes on investments
backing policyholder liabilities 382 452 (524)
Premiums and deposits (C$ millions)
2010 2009 20080
500
1,500
1,000
2,000
2,500 Premiums and deposits
U.S. Insurance
In 2010, we offered life and health insurance, annuities and travelinsurance to clients across the United States. Life and healthproducts include term, indexed universal life, whole life, accidentaldeath and critical illness protection. We also offered traditional fixedand fixed-indexed annuities. Travel insurance products include tripcancellation, interruption insurance and emergency medicalcoverage.
In October 2010, we announced our intention to sell Liberty Life.Refer to Notes 11 and 31 to our 2010 Annual Consolidated FinancialStatements. While we grew our U.S. life insurance business under ourbrand, it lacks the scale required to build and maintain a significantportfolio of insurance products in a very competitive market place. Wewill retain our U.S. travel business as this business is separate anddistinct from the other U.S. Insurance businesses (life and annuity).The U.S. travel business is a strategic extension of our Canadiantravel operations allowing us to leverage the existing scale andexpertise built over the years.
Financial performanceTotal revenue decreased $60 million, or 4%, compared to the prioryear. In U.S. dollars, total revenue increased $83 million, or 6%.Excluding the loss on Liberty Life, total revenue in U.S. dollarsincreased $197 million, or 14%, mainly due to an increase in annuityvolumes and lower investment losses. These factors were partiallyoffset by the change in fair value of investments backing our life andannuity policyholder liabilities. The annuity volumes and the changein fair value of investments were largely offset in PBCAE. Totalrevenue excluding the loss on Liberty Life is a non-GAAP measure.Refer to the Key performance and non-GAAP measures section.
Premiums and deposits increased $165 million. In U.S. dollars,premiums and deposits increased $255 million, reflecting theincrease in annuity volumes.
Selected highlights Table 20
(C$ millions) 2010 2009 2008
Total revenue $ 1,602 $ 1,662 $ 146Fair value changes on investments
backing policyholder liabilities 274 458 (346)Other information (US$ millions)
Total revenue 1,531 1,448 166Premiums and deposits
Life and health 244 247 263Property and casualty 21 11 4Annuity 952 704 115
Fair value changes on investmentsbacking policyholder liabilities 259 400 (313)
Premiums and deposits (US$ millions)
2010 2009 20080
300
600
1,500
1,200
900
Premiums and deposits
22 Royal Bank of Canada: Annual Report 2010 Management’s Discussion and Analysis
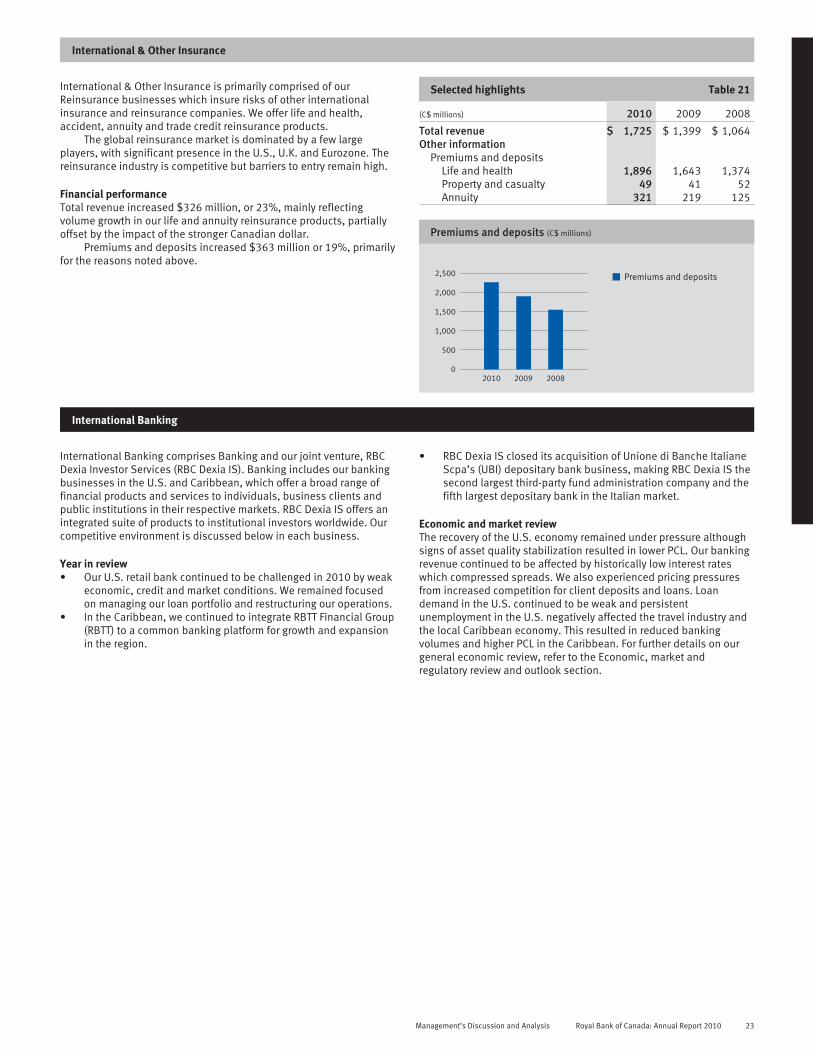
International & Other Insurance
International & Other Insurance is primarily comprised of ourReinsurance businesses which insure risks of other internationalinsurance and reinsurance companies. We offer life and health,accident, annuity and trade credit reinsurance products.
The global reinsurance market is dominated by a few largeplayers, with significant presence in the U.S., U.K. and Eurozone. Thereinsurance industry is competitive but barriers to entry remain high.
Financial performanceTotal revenue increased $326 million, or 23%, mainly reflectingvolume growth in our life and annuity reinsurance products, partiallyoffset by the impact of the stronger Canadian dollar.
Premiums and deposits increased $363 million or 19%, primarilyfor the reasons noted above.
Selected highlights Table 21
(C$ millions) 2010 2009 2008
Total revenue $ 1,725 $ 1,399 $ 1,064Other information
Premiums and depositsLife and health 1,896 1,643 1,374Property and casualty 49 41 52Annuity 321 219 125
Premiums and deposits (C$ millions)
2010 2009 20080
500
1,000
1,500
2,500
2,000
Premiums and deposits
International Banking
International Banking comprises Banking and our joint venture, RBCDexia Investor Services (RBC Dexia IS). Banking includes our bankingbusinesses in the U.S. and Caribbean, which offer a broad range offinancial products and services to individuals, business clients andpublic institutions in their respective markets. RBC Dexia IS offers anintegrated suite of products to institutional investors worldwide. Ourcompetitive environment is discussed below in each business.
Year in review• Our U.S. retail bank continued to be challenged in 2010 by weak
economic, credit and market conditions. We remained focusedon managing our loan portfolio and restructuring our operations.
• In the Caribbean, we continued to integrate RBTT Financial Group(RBTT) to a common banking platform for growth and expansionin the region.
• RBC Dexia IS closed its acquisition of Unione di Banche ItalianeScpa’s (UBI) depositary bank business, making RBC Dexia IS thesecond largest third-party fund administration company and thefifth largest depositary bank in the Italian market.
Economic and market reviewThe recovery of the U.S. economy remained under pressure althoughsigns of asset quality stabilization resulted in lower PCL. Our bankingrevenue continued to be affected by historically low interest rateswhich compressed spreads. We also experienced pricing pressuresfrom increased competition for client deposits and loans. Loandemand in the U.S. continued to be weak and persistentunemployment in the U.S. negatively affected the travel industry andthe local Caribbean economy. This resulted in reduced bankingvolumes and higher PCL in the Caribbean. For further details on ourgeneral economic review, refer to the Economic, market andregulatory review and outlook section.
Management’s Discussion and Analysis Royal Bank of Canada: Annual Report 2010 23

International Banking financial highlights Table 22
(C$ millions, except number of and percentage amounts) 2010 2009 2008
Net interest income $ 1,367 $ 1,687 $ 1,330Non-interest income 869 903 771
Total revenue $ 2,236 $ 2,590 $ 2,101PCL $ 743 $ 980 $ 497Non-interest expense 2,105 2,346 1,876Goodwill impairment charge – 1,000 –
Net (loss) before income taxes and NCI in subsidiaries $ (612) $ (1,736) $ (272)Net (loss) $ (317) $ (1,446) $ (153)
Key ratiosROE (5.5)% (19.4)% (3.4)%RORC (12.2)% (49.1)% (8.1)%
Selected average balance sheet informationTotal assets $ 55,300 $ 63,700 $ 51,300Loans and acceptances 29,600 35,800 27,000Deposits 45,800 51,600 42,500Attributed capital 6,650 7,750 5,200Risk capital 3,000 3,050 2,150
Other informationAUA – RBC (1) $ 7,800 $ 7,700 $ 11,200
– RBC Dexia IS (2) $ 2,779,500 $ 2,484,400 $ 2,585,000AUM – RBC (1) $ 2,600 $ 3,800 $ 3,900Number of employees (FTE) 11,174 11,462 12,335
Credit informationGross impaired loans as a % of average net loans and acceptances 10.32% 8.80% 5.97%Specific PCL as a % of average net loans and acceptances 2.51% 2.74% 1.84%
Estimated impact of US$, Euro and TTD translation on key income statement items 2010 vs. 2009
Impact on income increase (decrease):Total revenue $ (250)PCL 80Non-interest expense 225Net income 20
Percentage change in average US$ equivalent of C$1.00 12%Percentage change in average Euro equivalent of C$1.00 14%Percentage change in average TTD equivalent of C$1.00 14%
(1) These represent the AUA and AUM of RBTT, reported on a one-month lag.(2) Represents the total AUA of the joint venture, of which we have a 50% ownership interest, reported on a one-month lag.
Revenue by business line (C$ millions)
2010 2009 20080
500
1,000
1,500
2,000
3,000
2,500 Banking
RBC Dexia IS
Financial performance2010 vs. 2009Net loss of $317 million compares to a net loss of $1,446 million ayear ago, mainly reflecting the prior year goodwill impairment chargeof $1 billion on both a before-and after-tax basis. Our lower loss alsoreflected reduced provisions in our U.S. banking loan portfolio, andthe impact of the stronger Canadian dollar. These factors werepartially offset by higher losses on our AFS securities.
Total revenue decreased $354 million, or 14%, primarilyreflecting the impact of the stronger Canadian dollar. The decreasewas also due to higher losses on our AFS securities and foreclosedassets, as well as a strategic reduction in our U.S. banking portfolio.These factors were partially offset by a $52 million ($39 million aftertax) provision recorded in the prior year related to the restructuring ofcertain Caribbean banking mutual funds of which $11 million ($8million after tax) was reversed in the current year.
PCL decreased $237 million, or 24%, largely as a result of lowerprovisions in U.S. banking, primarily due to our residential builderfinance loans and AFS securities reclassified to loans. These factorswere partially offset by higher provisions in our commercial portfolioin the Caribbean. For further details, refer to the Credit qualityperformance section.
Non-interest expense was down $241 million, or 10%, primarilydue to the impact of the stronger Canadian dollar. Our continuedfocus on cost management, including the ongoing restructuring of ourU.S. banking business, also contributed to the decrease.
24 Royal Bank of Canada: Annual Report 2010 Management’s Discussion and Analysis

2009 vs. 2008Net loss of $1,446 million compares to a net loss of $153 million in2008, reflecting the goodwill impairment charge and higher PCL.These factors were partially offset by the decrease in losses on ourAFS securities of $272 million ($184 million after tax), and a full yearof results from our acquisition of RBTT in 2008.
Total revenue increased $489 million, or 23%, mainly due to afull year of revenue from RBTT, and to a lesser extent from AlabamaNational BanCorporation (ABN) acquired in 2008. Lower losses on ourAFS securities and the impact of the weaker Canadian dollar relativeto the U.S. dollar also contributed to the increase. These factors werepartially offset by lower revenue at RBC Dexia IS and spreadcompression, primarily in U.S. banking.
PCL was up $483 million, mainly attributable to U.S. banking,reflecting impaired loans in commercial, residential builder finance,lot loan, home equity and residential mortgage portfolios. The impactof the weaker Canadian dollar on the translation of U.S. specific PCL,higher provisions of $59 million resulting from reclassification ofcertain AFS securities to loans due to our adoption of the amend-ments to Canadian Institute of Chartered Accountants (CICA) section3855 and a full year of results from RBTT also contributed to theincrease.
Non-interest expense increased $470 million, or 25%, primarilyreflecting higher staff and occupancy costs mainly related to a fullyear of expenses from RBTT, and to a lesser extent ANB. The impact ofthe weaker Canadian dollar relative to the U.S. dollar and therestructuring of our U.S. banking business also contributed to theincrease.
Outlook and prioritiesThe economic outlook for the U.S. remains weak, with high levels ofunemployment, low absolute home values, soft demand for creditand low interest rates anticipated to continue for some time. Earningsgenerated from our U.S. banking operations will continue to bechallenged in 2011 by difficult economic conditions, increasingregulatory costs and elevated levels of PCL.
In the Caribbean, low economic growth will place continuedpressure on loan portfolios and PCL.
RBC Dexia IS is expected to see returns improve with new clientmandates, the demand for outsourcing continuing to grow and marketvalues continuing to increase, all driving the expansion of assetsunder administration. For further details on our general economicoutlook, refer to the Economic, market and regulatory review andoutlook section.
Key strategic priorities for 2011• Continue to strengthen our operating performance by improving
product and distribution capabilities in order to deliver adifferentiated client experience and value proposition.
• Build upon the productivity and efficiency enhancementsgenerated by the integration of our Caribbean bankingbusinesses to leverage our sales force capabilities and deliverdistinctive relationship-based financial advice to our Caribbeanclients.
• Enhance and broaden our suite of products and services at RBCDexia IS to maximize client and revenue growth opportunitiesacross our geographic footprint and deliver a globally integratedand differentiated client experience.
Business line review
Banking
Banking consists of our banking operations in the U.S. andCaribbean. Our U.S. banking business provides a complete line ofbanking products and services through 426 banking centres,476 ATMs and online banking. Our Caribbean banking business offersa comprehensive suite of banking products and services, as well asinternational financing and trade promotion services through anextensive branch and ATM network, and online banking.
In the southeastern U.S., we compete against approximately1,100 other banks, savings banks, and thrifts as well as a largenumber of credit unions. Deteriorating economic and marketconditions in 2009 led to significant consolidation in the U.S. retailbanking industry, with numerous bank failures and some acquis-itions. During 2010, the industry continued to experience a number ofbank failures. In this environment, we are among the top five depositholders in North Carolina and rank seventh overall as measured bydeposits in our southeastern U.S. footprint (1).
In the Caribbean, we compete against banks, trust companiesand investment companies serving retail, corporate and institutionalcustomers. We are the second largest bank, by assets, in the EnglishCaribbean, with 127 branches in 16 countries.
Financial performanceTotal revenue decreased $301 million, or 16%, from the prior year. InU.S. dollars, total revenue decreased $97 million, or 6%. Thedecrease primarily reflects higher losses on our AFS securities andhigher losses on foreclosed assets. These factors were partially offsetby a provision related to the restructuring of certain Caribbeanbanking mutual funds in the prior year.
In U.S. dollars, average loans and acceptances decreased$2 billion, or 7% and average deposits decreased $500 million, or2%, mainly due to the strategic reduction in our U.S. bankingportfolio, partially offset by business growth in Caribbean banking.
(1) Our southeastern U.S. banking footprint comprises North Carolina, South Carolina,Virginia, Alabama, Florida, and Georgia.
Selected highlights (1) Table 23
(C$ millions, except number of andpercentage amounts) 2010 2009 2008
Total revenue $ 1,579 $ 1,880 $ 1,246Other information (US$ millions)
Total revenue 1,515 1,612 1,221Net interest margin 3.72% 3.56% 3.63%Average loans and
acceptances $ 27,800 $ 30,000 $ 24,100Average deposits 29,800 30,300 24,100AUA 7,600 7,100 9,300AUM 2,500 3,500 3,300
Number of:Branches 553 563 566ATMs 806 816 815
(1) RBTT reports on a one-month lag. For 2008, our results included RBTT results fromJune 16 to September 30.
Average loans and deposits (US$ millions)
Deposits
Loans and acceptances
0
35,000
2010 20082009 2010 20082009
7,000
14,000
21,000
28,000
Management’s Discussion and Analysis Royal Bank of Canada: Annual Report 2010 25

RBC Dexia IS
RBC Dexia IS, of which we have a 50% ownership interest, offersglobal custody, fund and pension administration, securities lending,shareholder services, analytics and other related services to institu-tional investors.
RBC Dexia IS, with offices in 15 countries on four continents,competes against the world’s largest global custodians and, incertain markets, against select local financial institutions providinginvestor services. Although competition continues to be intense, RBCDexia IS ranks among the top 10 global custodians and consistentlyachieves top quartile standing in leading industry surveys.
Financial performanceTotal revenue decreased by $53 million, or 7%, compared to last year,mainly due to the impact of the stronger Canadian dollar, and lowerspreads on client cash deposits due to the continued low interest rate
environment, partially offset by higher transaction volumes, andhigher fee-based client assets as a result of capital appreciation.
Assets under administration increased 12%, largely reflectingimproved market conditions, and business growth. These factorswere partially offset by the impact of the stronger Canadian dollar.
Selected highlights Table 24
(C$ millions) 2010 2009 2008Total revenue 657 710 855Other information
AUA (1) 2,779,500 2,484,400 2,585,000
(1) Represents the total AUA of the joint venture, of which we have a 50% ownershipinterest, reported on a one-month lag.
Capital Markets
Capital Markets comprises our global wholesale banking businessesproviding corporate, public sector and institutional clients with a widerange of products and services. In North America, we offer a full suiteof products and service capabilities and have long-standing and deeprelationships with our clients. Outside North America, we have aselect but diversified set of global capabilities, which includes fixedincome origination and distribution, structuring and trading, foreignexchange, commodities and investment banking. Capital Markets iscomprised of two primary businesses: Capital Markets Sales andTrading and Corporate and Investment Banking. Our competitiveenvironment is discussed below in each business.
Year in review• We continued to win significant mandates throughout the year
and remained Canada’s leading global investment bank. Inrecognition of our ongoing success, we were named BestInvestment Bank in Canada by Euromoney Magazine for the thirdyear in a row and Dealmaker of the Year in Canada (FinancialPost) for this year and for six of the last seven years. We werealso ranked number one in debt, equity and M&A in Canada(Bloomberg).
• Outside Canada, we have continued to invest in our keybusinesses, extending our capabilities, adding new clients andexpanding our market share. As a result of our strategic growthinitiatives, we now generate approximately 60% of our revenuesoutside Canada.
• We made significant progress in expanding our business in theU.S., reflecting our investments in top talent, the build-out of ourinfrastructure and the strength of our brand. This has resulted inmarket share increases across several businesses including U.S.dollar fixed income and currency trading, debt and equityorigination.
• In the U.K., we continued to extend our capabilities in fixedincome and currency, and are a top five Gilt-edged MarketMaker. We acted as the joint bookrunner and hedge manager tothe largest ever U.K. Gilt offering of £8 billion. Our credit tradingbusiness in Europe received top rankings in several categories,including the Best Bank for Fixed Income, e-Trading and Non-Core Currency bonds, by institutional investors in Creditmagazine’s 2010 European Credit awards.
• In Europe, we became a European Primary Dealer in Germanyand France. In our investment banking, equity and researchbusinesses, we have broadened our sector focus beyond oil andgas and mining to growth industries where we have wellestablished North American capabilities. We also acted as solesponsor, joint global coordinator and joint bookrunner in a£2.0 billion equity offering for Resolution plc, underpinning ourrole as a top tier investment bank in Europe.
Economic and market reviewGlobal capital markets continued to improve in early 2010 reflectinggeneral economic recovery. However, trading conditions were volatilein the latter half of 2010 largely due to uncertainty over the Europeansovereign debt crisis, U.S. regulatory reform and evolving globalcapital and liquidity requirements. Most of our trading businesseswere negatively impacted in the second half of 2010 by investoruncertainty which reduced client volumes across all geographies. Wewere also impacted by tightening credit spreads and narrow bid/askspreads. Investment banking activities demonstrated strong growth,particularly in debt origination, M&A and loan syndication, as a resultof overall improved economic conditions. For further details on ourgeneral economic outlook, refer to the Economic, market andregulatory review and outlook.
26 Royal Bank of Canada: Annual Report 2010 Management’s Discussion and Analysis

Capital Markets financial highlights Table 25
(C$ millions, except number of and percentage amounts) 2010 2009 2008
Net interest income (1) $ 2,719 $ 3,399 $ 1,527Non-interest income 3,168 3,524 2,408
Total revenue (1) $ 5,887 $ 6,923 $ 3,935PCL $ 20 $ 702 $ 183Non-interest expense 3,420 3,628 2,121
Net income before income taxes and NCI in subsidiaries $ 2,447 $ 2,593 $ 1,631Net income $ 1,647 $ 1,768 $ 1,170
Key ratiosROE 19.5% 21.0% 20.5%RORC 22.3% 24.3% 24.5%
Selected average balance sheet informationTotal assets $ 327,500 $ 347,900 $ 340,300Trading securities 130,700 121,100 140,200Loans and acceptances 29,600 39,500 38,300Deposits 94,800 108,100 132,600Attributed capital 8,100 8,100 5,600Risk capital 7,100 7,000 4,700
Other informationNumber of employees (FTE) 3,399 3,097 3,296
Credit informationGross impaired loans as a % of average net loans and acceptances 1.38% 2.32% 1.30%Specific PCL as a % of average net loans and acceptances .07% 1.78% .48%
Estimated impact of US$, British pound and Euro translation on key income statement items (1) 2010 vs. 2009
Impact on income increase (decrease):Total revenue $ (450)Non-interest expense 220Net income (130)
Percentage change in average US$ equivalent of C$1.00 12%Percentage change in average British pound equivalent of C$1.00 11%Percentage change in average Euro equivalent of C$1.00 14%
(1) Taxable equivalent basis. The teb adjustment for 2010 was $489 million (2009 – $366 million, 2008 – $410 million). For further discussion, refer to the How we measure and report ourbusiness segments section.
Revenue by business line (C$ millions)
2010 2009 20080
1,400
2,800
4,200
5,600
7,000
Corporate andInvestment Banking
Capital MarketsSales and Trading
Revenue by geography (C$ millions)
2010 2009 20080
1,400
2,800
4,200
5,600
7,000
U.S.
Canada
Other International
Financial performance2010 vs. 2009Net income decreased $121 million or 7% from a year ago, mainlydue to lower trading revenues resulting from lower client volumes andtighter credit spreads reflecting less favourable trading conditions.Our results were also unfavourably impacted by the strongerCanadian dollar. These factors were partially offset by losses oncertain market and credit related items this year that weresignificantly lower than market environment-related losses in theprior year. Lower PCL and strong growth in our investment bankingbusiness also partially offset the decrease.
Total revenue decreased $1,036 million or 15%, mainlyreflecting weaker trading revenues in our fixed income businessparticularly in the latter part of the year and primarily in the U.S. andEurope. Our revenues were also unfavourably impacted by thestronger Canadian dollar. This was partially offset by strong revenuegrowth in our investment banking business across all products andgeographies. Certain market and credit related losses this year weresignificantly lower than market environment-related losses recordedin the prior year.
PCL decreased $682 million, primarily reflecting a number ofprovisions in our portfolio in the prior period and recoveries of a fewlarge accounts in the current period. For further details, refer to theCredit quality performance section.
Non-interest expense decreased $208 million, or 6%, mainly dueto lower variable compensation reflecting lower trading results andthe favourable impact of the stronger Canadian dollar. This waspartially offset by higher costs in support of business growth and newregulatory requirements.
For a further discussion on our treatment of market environment-related losses, refer to the Economic market and regulatory reviewand outlook section.
2009 vs. 2008Net income increased $598 million or 51% compared to 2008,primarily due to stronger trading revenue, improved results in ourcorporate and investment banking businesses, and decreased totalmarket environment-related net losses. The increase was partiallyoffset by higher PCL and the reduction of the Enron-related litigationprovision recorded in the prior year.
Management’s Discussion and Analysis Royal Bank of Canada: Annual Report 2010 27

Total revenue increased $3 billion or 76%, mainly reflectingstronger trading revenue, which included decreased marketenvironment-related losses on HFT instruments. These factors werepartially offset by losses on the fair value adjustment of certain RBCdebt designated as HFT and losses on credit default swaps used toeconomically hedge the corporate lending portfolio as compared togains in 2008.
PCL increased $519 million reflecting a number of impairedloans in our corporate lending portfolio.
Non-interest expense increased $1.5 billion largely due toincreased variable compensation driven by higher trading results andthe impact of the weaker Canadian dollar relative to the U.S. dollar. In2008, the reduction of the Enron-related litigation provisionfavourably impacted non-interest expense.
Outlook and prioritiesAs the economic, market and regulatory environments stabilize, weexpect continued growth in our global equity and debt origination,and M&A activities as a result of our strategic investments in the U.S.and Europe. We anticipate moderate improvement in our 2011trading revenues driven by growth in our sovereign and agency debt-related activities, and increased client volumes due to a stabilizingmarket environment, partially offset by narrow bid/ask spreads.However, our trading revenue may be impacted by evolving regulatorycapital rules in which stricter risk and liquidity requirements willincrease our funding costs. Our lending businesses will likely benegatively impacted by narrower credit spreads. We expect PCL toremain at moderate levels given the current economic environment.For further details on our general economic outlook, refer to theEconomic, market and regulatory review and outlook section.
Key strategic priorities for 2011• Remain the undisputed market leader in Canada with a leading
global franchise as a market-maker, originator and distributor ofa select but diversified set of products and currencies.
• Sustain the momentum we have achieved in our U.S. investmentbanking business through ongoing investment in our brand anda focus on clients in industry sectors that match our product anddistribution strengths.
• Extend our European investment banking, equity sales andtrading, and research business and make further investments tobroaden our sector focus and enhance our product capabilities.
• Leverage our U.S. and European primary dealer status to growour fixed income and currency trading, and investment bankingbusinesses. We will continue to expand our global capabilities ininfrastructure finance, energy, mining, and structured productsbusinesses in the U.S., Europe and Asia.
• Further invest in our commodities business to establish aleading energy trading platform in North America.
• Continue to follow our disciplined approach to growth, managingour balance sheet within our established risk and returnparameters and diversifying our operations to support stableearnings over the long term.
• Continue to make the requisite investments in our risk andcontrol infrastructure to support our growth across allbusinesses.
Business line review
Capital Markets Sales and Trading
Capital Markets Sales and Trading comprises our trading anddistribution operations largely related to fixed income, foreignexchange, equities, commodities and derivative products for institu-tional, public sector and corporate clients and our proprietary tradingoperations.
Our Capital Markets Sales and Trading businesses compete withglobal and regional investment banks. Over the last year, we havestrategically expanded our investments in talent and businessesmainly in the U.S. and Europe to provide broader product capabilitiesand leverage relationships between our market making and origi-nation activities.
Financial performanceCapital Markets Sales and Trading revenue of $3,743 million,decreased $1,504 million, or 29%, as compared to prior year.
Our trading revenues decreased $2,074 million, or 39%, largelyin our fixed income and currency, money market and U.S. globalequity businesses, particularly in the U.S. and Europe. Tradingrevenue was significantly impacted by lower client volumes in thelatter half of 2010, resulting from sovereign debt concerns andregulatory uncertainty, in addition to the unfavourable impact oftightening credit and bid/ask spreads. Trading revenue was alsounfavourably impacted by the stronger Canadian dollar. Losses oncertain market and credit related items were significantly lower thanour market environment-related losses in the prior year. Our revenuefrom commissions and non-trading related items increased $570million, mainly due to gains instead of losses on the fair valueadjustment of certain RBC debt designated as HFT and an accountingadjustment recorded in the prior year which reduced prior yearrevenue. This was partially offset by lower commissions, reflecting theimpact of reduced client volumes.
Selected highlights Table 26
(C$ millions, except number of amounts) 2010 2009 2008
Total revenue $3,743 $5,247 $1,824Breakdown of revenue
Trading (1) 3,186 5,260 1,028Commissions and non-trading
related items 557 (13) 796Other information
Average assets 305,000 315,700 309,700FTE 1,606 1,493 1,595
(1) Taxable equivalent basis. The teb adjustment for 2010 was $465 million (2009 – $353million, 2008 – $394 million). For further discussion, refer to the How we measure andreport our business segments section.
Breakdown of total revenue (C$ millions)
0
5,500
1,100
2,200
3,300
4,400
Commissions andnon-trading related items
Trading revenue
2010 2009 2008
28 Royal Bank of Canada: Annual Report 2010 Management’s Discussion and Analysis

Corporate and Investment Banking
Corporate and Investment Banking comprises our investmentbanking, debt and equity origination, advisory services, corporatelending, private equity, and client securitization businesses. It alsoincludes our global credit business, which oversees the managementof our lending portfolios and global financial institutions business.Our Research group offers economic and securities research toinstitutional and retail clients globally.
Our Corporate and Investment Banking businesses primarilycompete with global investment banks, commercial banks andboutique firms. We have an established reputation as a premierglobal investment bank with a strategic presence in virtually all linesof wholesale business in Canada and the U.S., and a select set ofcapabilities in Europe and Asia. We are also now ranked as one of thetop 15 global investment banks (Thomson Reuters).
Financial performanceCorporate and Investment Banking revenue of $2,144 millionincreased $468 million, or 28% as compared to the prior year.
Gross underwriting and advisory fees increased $106 million, or13% reflecting growth in all geographies, particularly in the U.S.Growth was driven by higher debt origination mainly due to increasedactivity in high yield debt. Revenues from M&A activity increased,largely reflecting solid growth primarily in the U.S. and Europe. Otherrevenues increased due to lower losses on credit default swaps usedto economically hedge our corporate loan portfolio, and gains,instead of losses, on our municipal banking business. We also sawstrong growth in our syndicated finance business in the U.S. andEurope. Revenues from our corporate lending portfolio remained flatas volume and pricing improvements were mostly offset by decreasedcorporate loan utilization. The increase in revenue was partially offsetby losses primarily relating to U.S. commercial mortgagebacked securities.
Selected highlights Table 27
(C$ millions, except number of amounts) 2010 2009 2008
Total revenue $ 2,144 $ 1,676 $ 2,111Breakdown of revenue
Gross underwriting andadvisory fees 895 789 650
Other revenue (1) 1,249 887 1,461Other Information
Average assets 22,500 32,200 30,600FTE 1,793 1,604 1,701
(1) Other revenue includes revenue associated with our core lending portfolio andsyndicated finance, private equity distributions and gains/losses on private equityinvestments. It also includes losses mainly relating to commercial mortgage backedsecurities of $67 million (2009 – $55 million, 2008 – $61 million).
Breakdown of total revenue (C$ millions)
2010 200820090
2,200
Gross underwritingand advisory fees
Other revenue
440
880
1,320
1,760
Corporate Support
Corporate Support comprises Operations, Technology and Functions.Our Operations and Technology teams provide the operational andtechnological foundation required to effectively deliver products andservices to our clients, while Functions includes our corporatetreasury, finance, human resources, risk management, internal auditand other functional groups. The associated costs are largelyallocated to the business segments, although certain activitiesrelated to monitoring and oversight of the enterprise reside withinthis segment.
Reported results for Corporate Support mainly reflect activitiesthat are undertaken for the enterprise, and which are not allocated tothe business segments. For further details, refer to the How wemeasure and report our business segments section.
Due to the nature of activities and consolidated adjustmentsreported in this segment, we believe that a year-over-year analysis isnot relevant. The following identifies the significant items affectingthe reported results in each year.
Corporate Support financial highlights Table 28
(C$ millions, except number of employees) 2010 2009 (1) 2008 (1)
Net interest loss (2) $ (902) $ (889) $ (989)Non-interest income 304 797 352
Total revenue (2) $ (598) $ (92) $ (637)PCL (3) $ (96) $ 456 $ 47Non-interest expense 26 34 (18)
Net loss before income taxes and NCI in subsidiaries (2) $ (528) $ (582) $ (666)Net loss $ (225) $ (206) $ (178)
SecuritizationTotal securitizations sold and outstanding (4) $ 31,503 $ 32,685 $ 19,316New securitization activity in the period (5) 5,818 18,689 6,482
Other informationNumber of employees (FTE) (6) 20,797 19,752 19,577
(1) Certain amounts have been reclassified. For further details, refer to the How we measure and report our business segments section.(2) Taxable equivalent basis. For further discussion, refer to the How we measure and report our business segments section. These amounts included the elimination of the adjustments related
to the gross-up of income from Canadian taxable corporate dividends recorded in Capital Markets of $489 million in 2010 (2009 – $366 million, 2008 – $410 million).(3) PCL in Corporate Support primarily comprises the general provision, an adjustment related to PCL on securitized credit card loans managed by Canadian Banking and an amount related to the
reclassification of certain AFS securities to loans in 2009. For further information, refer to the How we measure and report our business segments section.(4) Total securitizations sold and outstanding comprises credit card loans and residential mortgages.(5) New securitization activity comprises Canadian residential mortgages and credit card loans securitized and sold in the year. For further details, refer to Note 5 to our 2010 Annual
Consolidated Financial Statements. This amount does not include Canadian residential mortgage and commercial mortgage securitization activity of Capital Markets.(6) 2009 and 2008 amounts have been restated to reflect the realignment of our insurance operations and technology teams in 2009.
Management’s Discussion and Analysis Royal Bank of Canada: Annual Report 2010 29

2010Net loss of $225 million largely reflected net unfavourable tax andaccounting adjustments, including cumulative accounting adjust-ments of $51 million ($36 million after tax) related to securitizationactivity. Losses of $21 million on both a before-and after-tax basisattributed to an equity accounted for investment and a generalprovision for credit losses of $26 million ($18 million after tax) alsoincreased our net loss.
2009Net loss of $206 million included a general provision for credit lossesof $589 million ($391 million after tax), losses on certain AFSsecurities of $419 million ($390 million of market environment-related losses), including a loss of $144 million ($99 million after tax)on certain Canadian bank common shares. Losses on fair valueadjustments of $217 million ($151 million after tax) on certain RBCdebt designated as HFT, reflecting the tightening of our credit spreadsalso contributed to the loss. These factors were partially offset by
securitization gains inclusive of new and re-investment relatedactivity, net of economic hedging activities, totalling $918 million($630 million after tax), mainly due to a higher than historical level ofsecuritization activity from our participation in government-sponsoredfunding programs.
2008Net loss of $178 million included losses of $268 million ($210 millionafter tax) on certain AFS securities and $129 million ($87 million aftertax) on certain HFT securities. The net loss also reflected an increasein the general allowance of $145 million ($98 million after tax) and aforeign currency translation adjustment related to our U.S. dollar-denominated deposits used to fund certain U.S. dollar-denominatedAFS securities. These factors were partially offset by income taxamounts largely related to enterprise funding activities that were notallocated to the segments, the gain on fair value adjustments oncertain RBC debt designated as HFT of $190 million ($129 millionafter tax), gains related to the change in fair value of certainderivatives used to economically hedge our funding activities andgains related to securitization activity.
Quarterly financial information
Fourth quarter 2010 performance
Q4 2010 vs. Q4 2009Fourth quarter net income of $1,121 million was down $116 million,or 9% from the prior year. Excluding the $116 million loss on LibertyLife, earnings of $1,237 million were flat. We had solid volume growthin Canadian Banking, favourable actuarial adjustments in Insurance,higher average fee-based client assets in Wealth Management andlower PCL. Losses on certain market and credit related items this yearwere significantly lower than our market environment-related lossesin the prior year. These factors were offset by lower tradingrevenue, higher costs in support of our business growth, the impactof the stronger Canadian dollar and an adjustment in the prior yearwhich reduced variable compensation expense in Capital Markets. Fora further discussion on our treatment of market environment-relatedlosses, refer to the Economic market and regulatory review andoutlook section.
Total revenue decreased $257 million, or 3%. Excluding the losson Liberty Life, revenue decreased $141 million, or 2% mainly due tolower trading revenue reflecting less favourable trading conditionsand the impact of the stronger Canadian dollar. These factors werepartially offset by lower losses on AFS securities, volume growth inCanadian banking-related businesses, higher average fee-basedclient assets in Wealth Management, and higher insurance-relatedrevenue.
Total PCL decreased by $451 million, or 51% from a year ago,mainly reflecting lower provisions in our corporate lending portfoliomainly in the U.S. and lower loss rates in our Canadian credit cardand unsecured personal portfolios. Several large corporate provisionsin the prior year also contributed to the decrease. We incurred a lowergeneral provision of $4 million in the current period as compared to$156 million in the prior period reflecting generally improved creditquality in our commercial U.S. banking and Canadian retail portfolios.
PBCAE increased $101 million, or 8%, mainly reflecting thechange in fair value of investments and higher costs commensuratewith volume growth. These factors were partially offset by favourableactuarial adjustments and the impact of the stronger Canadian dollar.
Non-interest expense increased $212 million, or 6%, mainlyreflecting higher costs in support of our business growth and a fullquarter impact of the HST. Also contributing to the increase was anadjustment to variable compensation in the prior year which loweredthe expense. These factors were partially offset by our ongoing focuson cost management and the impact of the stronger Canadian dollarin the current quarter.
For a detailed discussion on measures excluding the loss onLiberty Life, refer to the Key performance and non-GAAP measuressection.
30 Royal Bank of Canada: Annual Report 2010 Management’s Discussion and Analysis
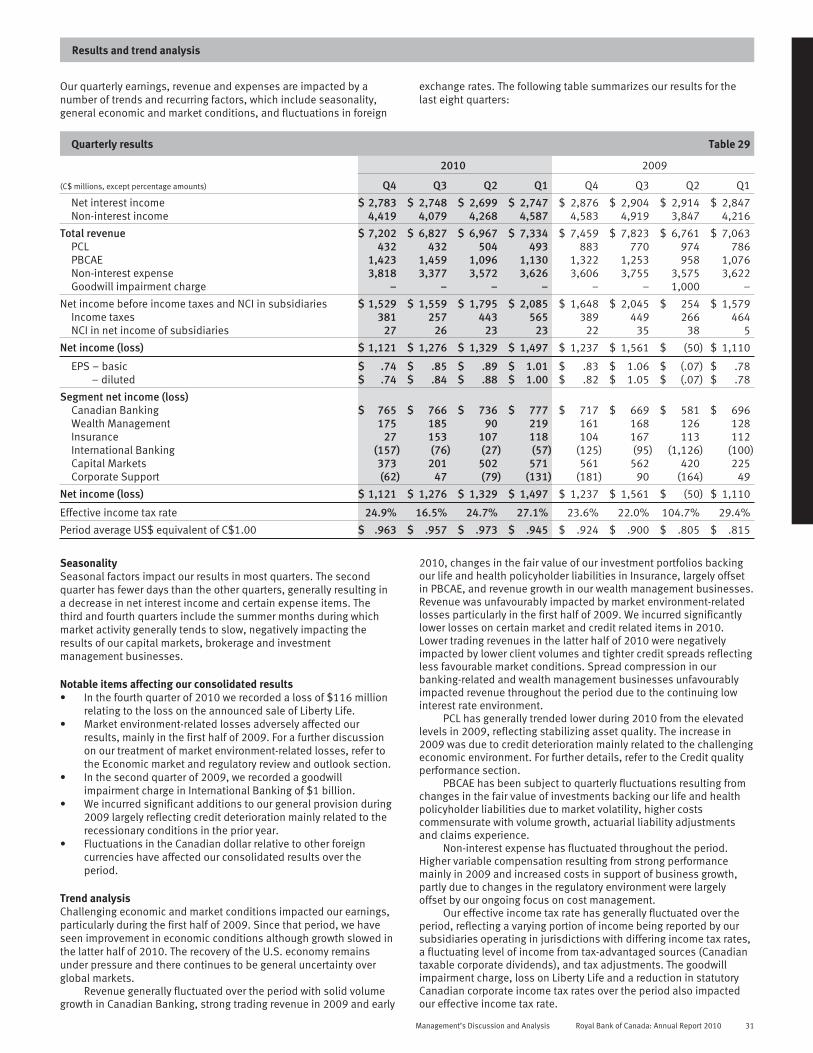
Results and trend analysis
Our quarterly earnings, revenue and expenses are impacted by anumber of trends and recurring factors, which include seasonality,general economic and market conditions, and fluctuations in foreign
exchange rates. The following table summarizes our results for thelast eight quarters:
Quarterly results Table 29
2010 2009
(C$ millions, except percentage amounts) Q4 Q3 Q2 Q1 Q4 Q3 Q2 Q1
Net interest income $ 2,783 $ 2,748 $ 2,699 $ 2,747 $ 2,876 $ 2,904 $ 2,914 $ 2,847Non-interest income 4,419 4,079 4,268 4,587 4,583 4,919 3,847 4,216
Total revenue $ 7,202 $ 6,827 $ 6,967 $ 7,334 $ 7,459 $ 7,823 $ 6,761 $ 7,063PCL 432 432 504 493 883 770 974 786PBCAE 1,423 1,459 1,096 1,130 1,322 1,253 958 1,076Non-interest expense 3,818 3,377 3,572 3,626 3,606 3,755 3,575 3,622Goodwill impairment charge – – – – – – 1,000 –
Net income before income taxes and NCI in subsidiaries $ 1,529 $ 1,559 $ 1,795 $ 2,085 $ 1,648 $ 2,045 $ 254 $ 1,579Income taxes 381 257 443 565 389 449 266 464NCI in net income of subsidiaries 27 26 23 23 22 35 38 5
Net income (loss) $ 1,121 $ 1,276 $ 1,329 $ 1,497 $ 1,237 $ 1,561 $ (50) $ 1,110
EPS – basic $ .74 $ .85 $ .89 $ 1.01 $ .83 $ 1.06 $ (.07) $ .78– diluted $ .74 $ .84 $ .88 $ 1.00 $ .82 $ 1.05 $ (.07) $ .78
Segment net income (loss)Canadian Banking $ 765 $ 766 $ 736 $ 777 $ 717 $ 669 $ 581 $ 696Wealth Management 175 185 90 219 161 168 126 128Insurance 27 153 107 118 104 167 113 112International Banking (157) (76) (27) (57) (125) (95) (1,126) (100)Capital Markets 373 201 502 571 561 562 420 225Corporate Support (62) 47 (79) (131) (181) 90 (164) 49
Net income (loss) $ 1,121 $ 1,276 $ 1,329 $ 1,497 $ 1,237 $ 1,561 $ (50) $ 1,110
Effective income tax rate 24.9% 16.5% 24.7% 27.1% 23.6% 22.0% 104.7% 29.4%
Period average US$ equivalent of C$1.00 $ .963 $ .957 $ .973 $ .945 $ .924 $ .900 $ .805 $ .815
SeasonalitySeasonal factors impact our results in most quarters. The secondquarter has fewer days than the other quarters, generally resulting ina decrease in net interest income and certain expense items. Thethird and fourth quarters include the summer months during whichmarket activity generally tends to slow, negatively impacting theresults of our capital markets, brokerage and investmentmanagement businesses.
Notable items affecting our consolidated results• In the fourth quarter of 2010 we recorded a loss of $116 million
relating to the loss on the announced sale of Liberty Life.• Market environment-related losses adversely affected our
results, mainly in the first half of 2009. For a further discussionon our treatment of market environment-related losses, refer tothe Economic market and regulatory review and outlook section.
• In the second quarter of 2009, we recorded a goodwillimpairment charge in International Banking of $1 billion.
• We incurred significant additions to our general provision during2009 largely reflecting credit deterioration mainly related to therecessionary conditions in the prior year.
• Fluctuations in the Canadian dollar relative to other foreigncurrencies have affected our consolidated results over theperiod.
Trend analysisChallenging economic and market conditions impacted our earnings,particularly during the first half of 2009. Since that period, we haveseen improvement in economic conditions although growth slowed inthe latter half of 2010. The recovery of the U.S. economy remainsunder pressure and there continues to be general uncertainty overglobal markets.
Revenue generally fluctuated over the period with solid volumegrowth in Canadian Banking, strong trading revenue in 2009 and early
2010, changes in the fair value of our investment portfolios backingour life and health policyholder liabilities in Insurance, largely offsetin PBCAE, and revenue growth in our wealth management businesses.Revenue was unfavourably impacted by market environment-relatedlosses particularly in the first half of 2009. We incurred significantlylower losses on certain market and credit related items in 2010.Lower trading revenues in the latter half of 2010 were negativelyimpacted by lower client volumes and tighter credit spreads reflectingless favourable market conditions. Spread compression in ourbanking-related and wealth management businesses unfavourablyimpacted revenue throughout the period due to the continuing lowinterest rate environment.
PCL has generally trended lower during 2010 from the elevatedlevels in 2009, reflecting stabilizing asset quality. The increase in2009 was due to credit deterioration mainly related to the challengingeconomic environment. For further details, refer to the Credit qualityperformance section.
PBCAE has been subject to quarterly fluctuations resulting fromchanges in the fair value of investments backing our life and healthpolicyholder liabilities due to market volatility, higher costscommensurate with volume growth, actuarial liability adjustmentsand claims experience.
Non-interest expense has fluctuated throughout the period.Higher variable compensation resulting from strong performancemainly in 2009 and increased costs in support of business growth,partly due to changes in the regulatory environment were largelyoffset by our ongoing focus on cost management.
Our effective income tax rate has generally fluctuated over theperiod, reflecting a varying portion of income being reported by oursubsidiaries operating in jurisdictions with differing income tax rates,a fluctuating level of income from tax-advantaged sources (Canadiantaxable corporate dividends), and tax adjustments. The goodwillimpairment charge, loss on Liberty Life and a reduction in statutoryCanadian corporate income tax rates over the period also impactedour effective income tax rate.
Management’s Discussion and Analysis Royal Bank of Canada: Annual Report 2010 31
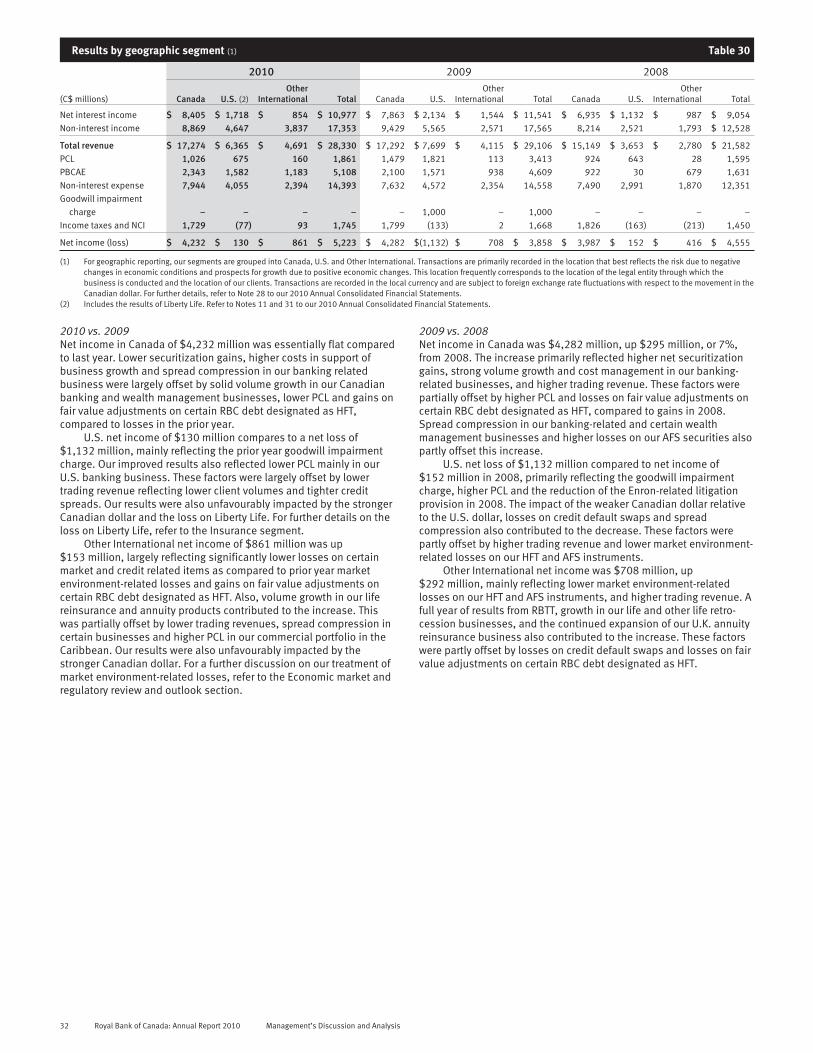
Results by geographic segment (1) Table 30
2010 2009 2008
(C$ millions) Canada U.S. (2)Other
International Total Canada U.S.Other
International Total Canada U.S.Other
International Total
Net interest income $ 8,405 $ 1,718 $ 854 $ 10,977 $ 7,863 $ 2,134 $ 1,544 $ 11,541 $ 6,935 $ 1,132 $ 987 $ 9,054
Non-interest income 8,869 4,647 3,837 17,353 9,429 5,565 2,571 17,565 8,214 2,521 1,793 $ 12,528
Total revenue $ 17,274 $ 6,365 $ 4,691 $ 28,330 $ 17,292 $ 7,699 $ 4,115 $ 29,106 $ 15,149 $ 3,653 $ 2,780 $ 21,582
PCL 1,026 675 160 1,861 1,479 1,821 113 3,413 924 643 28 1,595
PBCAE 2,343 1,582 1,183 5,108 2,100 1,571 938 4,609 922 30 679 1,631
Non-interest expense 7,944 4,055 2,394 14,393 7,632 4,572 2,354 14,558 7,490 2,991 1,870 12,351
Goodwill impairment
charge – – – – – 1,000 – 1,000 – – – –
Income taxes and NCI 1,729 (77) 93 1,745 1,799 (133) 2 1,668 1,826 (163) (213) 1,450
Net income (loss) $ 4,232 $ 130 $ 861 $ 5,223 $ 4,282 $(1,132) $ 708 $ 3,858 $ 3,987 $ 152 $ 416 $ 4,555
(1) For geographic reporting, our segments are grouped into Canada, U.S. and Other International. Transactions are primarily recorded in the location that best reflects the risk due to negativechanges in economic conditions and prospects for growth due to positive economic changes. This location frequently corresponds to the location of the legal entity through which thebusiness is conducted and the location of our clients. Transactions are recorded in the local currency and are subject to foreign exchange rate fluctuations with respect to the movement in theCanadian dollar. For further details, refer to Note 28 to our 2010 Annual Consolidated Financial Statements.
(2) Includes the results of Liberty Life. Refer to Notes 11 and 31 to our 2010 Annual Consolidated Financial Statements.
2010 vs. 2009Net income in Canada of $4,232 million was essentially flat comparedto last year. Lower securitization gains, higher costs in support ofbusiness growth and spread compression in our banking relatedbusiness were largely offset by solid volume growth in our Canadianbanking and wealth management businesses, lower PCL and gains onfair value adjustments on certain RBC debt designated as HFT,compared to losses in the prior year.
U.S. net income of $130 million compares to a net loss of$1,132 million, mainly reflecting the prior year goodwill impairmentcharge. Our improved results also reflected lower PCL mainly in ourU.S. banking business. These factors were largely offset by lowertrading revenue reflecting lower client volumes and tighter creditspreads. Our results were also unfavourably impacted by the strongerCanadian dollar and the loss on Liberty Life. For further details on theloss on Liberty Life, refer to the Insurance segment.
Other International net income of $861 million was up$153 million, largely reflecting significantly lower losses on certainmarket and credit related items as compared to prior year marketenvironment-related losses and gains on fair value adjustments oncertain RBC debt designated as HFT. Also, volume growth in our lifereinsurance and annuity products contributed to the increase. Thiswas partially offset by lower trading revenues, spread compression incertain businesses and higher PCL in our commercial portfolio in theCaribbean. Our results were also unfavourably impacted by thestronger Canadian dollar. For a further discussion on our treatment ofmarket environment-related losses, refer to the Economic market andregulatory review and outlook section.
2009 vs. 2008Net income in Canada was $4,282 million, up $295 million, or 7%,from 2008. The increase primarily reflected higher net securitizationgains, strong volume growth and cost management in our banking-related businesses, and higher trading revenue. These factors werepartially offset by higher PCL and losses on fair value adjustments oncertain RBC debt designated as HFT, compared to gains in 2008.Spread compression in our banking-related and certain wealthmanagement businesses and higher losses on our AFS securities alsopartly offset this increase.
U.S. net loss of $1,132 million compared to net income of$152 million in 2008, primarily reflecting the goodwill impairmentcharge, higher PCL and the reduction of the Enron-related litigationprovision in 2008. The impact of the weaker Canadian dollar relativeto the U.S. dollar, losses on credit default swaps and spreadcompression also contributed to the decrease. These factors werepartly offset by higher trading revenue and lower market environment-related losses on our HFT and AFS instruments.
Other International net income was $708 million, up$292 million, mainly reflecting lower market environment-relatedlosses on our HFT and AFS instruments, and higher trading revenue. Afull year of results from RBTT, growth in our life and other life retro-cession businesses, and the continued expansion of our U.K. annuityreinsurance business also contributed to the increase. These factorswere partly offset by losses on credit default swaps and losses on fairvalue adjustments on certain RBC debt designated as HFT.
32 Royal Bank of Canada: Annual Report 2010 Management’s Discussion and Analysis

Financial condition
Condensed balance sheet (1) (2) Table 31
As at October 31 (C$ millions) 2010 2009
AssetsCash and due from banks $ 9,330 $ 8,353Interest-bearing deposits with banks 13,252 8,923Securities 193,331 186,272Assets purchased under reverse repurchase
agreements and securities borrowed 72,698 41,580Loans (net of allowance for loan losses)
Retail loans 220,321 203,856Wholesale loans 71,885 77,107
Other – Derivatives 106,246 92,173– Other 39,143 36,725
Total assets $ 726,206 $ 654,989
Liabilities and shareholders’ equityDeposits $ 433,033 $ 398,304Other – Derivatives 108,910 84,390
– Other 135,648 125,462Subordinated debentures 6,681 6,461Trust capital securities 727 1,395NCI in subsidiaries 2,256 2,071
Total liabilities $ 687,255 $ 618,083Total shareholders’ equity 38,951 36,906
Total liabilities and shareholders’ equity $ 726,206 $ 654,989
(1) Foreign currency denominated assets and liabilities are translated to Canadian dollars.Refer to Note 1 to our 2010 Annual Consolidated Financial Statements.
(2) Refer to Table 1 for period-end Canadian/U.S. dollar spot exchange rates.
Our consolidated balance sheet was impacted by foreign currencytranslation which reduced our total assets by approximately$16 billion due to the strengthening of the Canadian dollar comparedto last year.
2010 vs. 2009Total assets were up $71 billion, or 11%, from the prior year.
Interest bearing deposits with banks increased $4 billion, or49%, largely reflecting higher collateral requirements.
Securities were up $7 billion, or 4%, primarily due to increasedpositions in government debt instruments in support of increasedbusiness activity from our newly formed European Government Bond(EGB) trading business and increased holdings of our securitizedresidential mortgages. These factors were partially offset by theimpact of the stronger Canadian dollar.
Assets purchased under reverse repurchase agreements (reverserepos) and securities borrowed increased $31 billion, or 75% mainlyattributable to higher market activity from the EGB trading businessand increased volume from our primary dealer activities. This waspartially offset by the impact of the stronger Canadian dollar.
Loans were up $11 billion, or 4%, predominantly due to solidretail lending growth mainly as a result of volume growth in Canadianhome equity and personal lending products. This was partially offsetby a decrease in our wholesale loans due to a strategic reduction inour U.S. loan portfolio, maturity and repayments and the impact ofthe stronger Canadian dollar particularly on our wholesale loans.
Derivative assets increased $14 billion, or 15%, mainlyattributable to the higher fair values as a result of the impact ofincreased interest rate and foreign exchange contract positions drivenby higher client activity and the impact of decreasing interest rates onreceive fixed rate positions partially offset by the impact of thestronger Canadian dollar.
Other assets were up $2 billion, or 7%, primarily due toincreased business activity.
Total liabilities were up $69 billion, or 11%.Deposits increased $35 billion, or 9%, mainly reflecting an
increase in corporate deposits due to an increase in our internalfunding requirements and demand for our high-yield savings andother product offerings. This was partially offset by the impact of thestronger Canadian dollar.
Derivative liabilities increased $25 billion, or 29%, mainlyattributable to higher fair values resulting primarily from the impact ofan increasing interest rate and foreign exchange contract positionsdriven by higher client activity and the impact of decreasing interestrates on pay fixed rate positions.
Other liabilities increased by $10 billion, or 8% mainly resultingfrom an increase in obligations related to securities sold short and anincrease in repurchase agreements, largely due to increased volumefrom our primary dealer activities and from the EGB trading business.
Shareholders’ equity increased $2 billion, or 6%, largelyreflecting earnings, net of dividends.
Off-balance sheet arrangements
In the normal course of business, we engage in a variety of financialtransactions that, under GAAP, are not recorded on our balance sheet.Off-balance sheet transactions are generally undertaken for risk,capital and/or funding management purposes which benefit us andour clients. These include transactions with special-purpose entities(SPEs) and may include issuance of guarantees and give rise to,among other risks, varying degrees of market, credit, liquidity andfunding risk, which are discussed in the Risk management section.
SPEs are typically created for a single, discrete purpose, have alimited life and serve to legally isolate the financial assets held by theSPE from the selling organization. They are not operating entities andusually have no employees. SPEs may be variable interest entities(VIEs) as defined by CICA Accounting Guideline 15, Consolidation ofVariable Interest Entities (AcG-15). Refer to the Critical accountingpolicies and estimates section and Notes 1, 6 and 31 to our 2010Annual Consolidated Financial Statements for our consolidationpolicy and information about the VIEs that we have consolidated(on-balance sheet) or in which we have significant variable interests,but have not consolidated (off-balance sheet). Pursuant to CICA
Accounting Guideline 12, Transfers of Receivables (AcG-12),Qualifying SPEs (QSPEs) are legal entities that are demonstrablydistinct from the transferor, have limited and specified permittedactivities, have defined asset holdings and may only sell or dispose ofselected assets in automatic response to specified conditions. Wemanage and monitor our involvement with SPEs through ourReputation Risk Oversight Committee.
Securitization of our financial assetsWe periodically securitize portions of our credit card receivables andresidential mortgage loans primarily to diversify our funding sourcesand enhance our liquidity position. We also securitize residential andcommercial mortgage loans for sales and trading activities. Inaddition, we participate in bond securitization activities primarily todiversify our funding sources. Gains and losses on securitizations areincluded in Non-interest income. Refer to Note 1 to our 2010 AnnualConsolidated Financial Statements for our accounting policy forsecuritizations, and to Note 5 for a description of our securitizationactivities by major product types.
Management’s Discussion and Analysis Royal Bank of Canada: Annual Report 2010 33

The following table provides details of our securitized assetssold and the assets retained on our balance sheet as a result of oursecuritization activities.
Our financial asset securitizations Table 32
As at October 31 (C$ millions) 2010 2009
Securitized assetsCredit cards $ 3,265 $ 3,870Commercial and residential mortgages 39,962 39,796Bond participation certificates (1) 935 1,105
Total $ 44,162 $ 44,771
RetainedResidential mortgages
Mortgage-backed securities retained (2) $ 10,687 $ 8,920Retained rights to future excess interest 1,397 1,497
Credit cardsAsset-backed securities purchased (3) 421 981Retained rights to future excess interest 15 33Subordinated loan receivables 9 5
Commercial mortgagesAsset-backed securities purchased (3) 2 2
Bond participation certificates retained 19 55
Total $ 12,550 $ 11,493
(1) Includes securitization activities prior to the acquisition of RBTT.(2) All residential mortgages securitized are Canadian mortgages and are government
guaranteed.(3) Securities purchased during the securitization process.
Securitization activities during 2010During the year, we securitized $17.7 billion of residential mortgages,of which $6.0 billion were sold and the remaining $11.7 billion(notional value) were retained. Our securitization activity this yearwas lower compared to the prior year primarily because we have notparticipated in the Government of Canada’s Insured MortgagePurchase Program subsequent to September 2009. We also securi-tized and sold $1.3 billion in credit card receivables. We did notsecuritize bond participation certificates or commercial mortgages
during the year. Refer to Note 5 to our 2010 Annual ConsolidatedFinancial Statements for further details including the amounts ofimpaired loans past due that we manage, and any gains recognizedon securitization activities during the year.
Capital trustsIn prior periods we issued innovative capital instruments, RBC TrustCapital Securities (RBC TruCS) and RBC Trust Subordinated Notes(RBC TSNs), through three SPEs: RBC Capital Trust (Trust), RBC CapitalTrust II (Trust II) and RBC Subordinated Notes Trust (Trust III). Weconsolidate Trust but do not consolidate Trust II or Trust III becausewe are not the Primary Beneficiary since we are not exposed to themajority of the expected losses and we do not have a significantinterest in these trusts. As at October 31, 2010 and October 31, 2009,we held residual interests of $1 million in each of Trust II and Trust III.We had loan receivables of $3 million (2009 – $3 million) and$30 million (2009 – $30 million) from Trust II and Trust III,respectively, and reported in our deposit liabilities the senior depositnotes of $900 million and $1,000 million (2009 – $900 million and$1,000 million) that we issued to Trust II and Trust III, respectively.Under certain circumstances, RBC TruCS of Trust II will be automati-cally exchanged for our preferred shares and RBC TSNs exchanged forour subordinated notes without prior consent of the holders. Inaddition, RBC TruCS holders of Trust II have the right to exchangetheir securities for our preferred shares as outlined in Note 17 to our2010 Annual Consolidated Financial Statements.
Interest expenses on the senior deposit notes issued to Trust IIand Trust III amounted to $52 million and $47 million, respectively(2009 – $52 million and $47 million), during the year. For furtherdetails on the capital trusts and the terms of the RBC TruCS andRBC TSNs issued and outstanding, refer to the Capital managementsection and Note 17 to our 2010 Annual Consolidated FinancialStatements.
Special purpose entitiesThe following table provides information on our VIEs in addition to thedisclosures and detailed description of VIEs provided in Notes 1, 6and 31 to our 2010 Annual Consolidated Financial Statements.
Variable interest entities Table 33
2010 2009
Total assets by credit ratings (3) Total assets by average maturitiesTotal assets by geographic
location of borrowers
As at October 31(C$ millions)
Totalassets (1)
Maximumexposure
(1),(2)Investment
grade (4)
Non-investment
grade (4)Not
ratedUnder1 year
1-5years
Over5 years
Notapplicable Canada U.S.
OtherInternational
Totalassets (1)
Maximumexposure
(1),(2)
Unconsolidated VIEsin which we havesignificant variableinterests:Multi-seller
conduits (5) $ 21,847 $ 22,139 $ 21,679 $ 168 $ – $ 4,302 $ 14,795 $ 2,750 $ – $ 3,845 $ 15,997 $ 2,005 $ 26,181 $ 26,550Structured finance
VIEs (6) 4,669 2,030 4,549 – 120 – – 4,669 – – 4,669 – 5,907 2,527Credit investment
product VIEs 502 19 50 452 – – – 502 – – – 502 930 505Third-party
conduits – – – – – – – – – – – – 575 250Investment funds 249 61 – – 249 – – – 249 26 15 208 84 28Other 165 39 – – 165 – – – 165 31 130 4 340 103
$ 27,432 $ 24,288 $ 26,278 $ 620 $ 534 $ 4,302 $ 14,795 $ 7,921 $ 414 $ 3,902 $ 20,811 $ 2,719 $ 34,017 $ 29,963
Consolidated VIEs:Structured finance
VIEs $ 2,998 $ 2,982 $ – $ 16 $ – $ – $ 2,998 $ – $ – $ 2,998 $ – $ 2,620Investment funds 1,012 – – 1,012 – – – 1,012 210 166 636 588Compensation
vehicles 53 – – 53 – – – 53 53 – – 64Other 3 – – 3 – – 3 – – 3 – 3
$ 4,066 $ 2,982 $ – $1,084 $ – $ – $ 3,001 $ 1,065 $ 263 $ 3,167 $ 636 $ 3,275
(1) Total assets and maximum exposure to loss correspond to disclosures provided in Note 6 to our 2010 Annual Consolidated Financial Statements.(2) The maximum exposure to loss resulting from significant variable interests in these VIEs consists mostly of investments, loans, liquidity facilities and fair value of derivatives. The maximum
exposure to loss may exceed the total assets in the multi-seller conduits, as our liquidity facilities may sometimes be extended for up to 102% of the total value of the assets in the conduits.(3) The risk rating distribution of assets within the VIEs is indicative of the credit quality of the collateral underlying those assets. Certain assets, such as derivatives, mutual fund or hedge fund
units and personal loans, or underlying collateral are not rated in the categories disclosed in the table.(4) Our internal risk ratings for major counterparty types approximate those of public rating agencies. Ratings of AAA, AA, A and BBB represent investment grade ratings and ratings of BB or lower
represent non-investment grade ratings.(5) Represents multi-seller conduits administered by us.(6) Our October 31, 2009 comparatives have been revised to present information related to a certain entity on a net basis that was previously presented on a gross basis. The total gross and net
assets related to this entity as at October 31, 2009 were $4,177 million and $471 million, respectively.
34 Royal Bank of Canada: Annual Report 2010 Management’s Discussion and Analysis
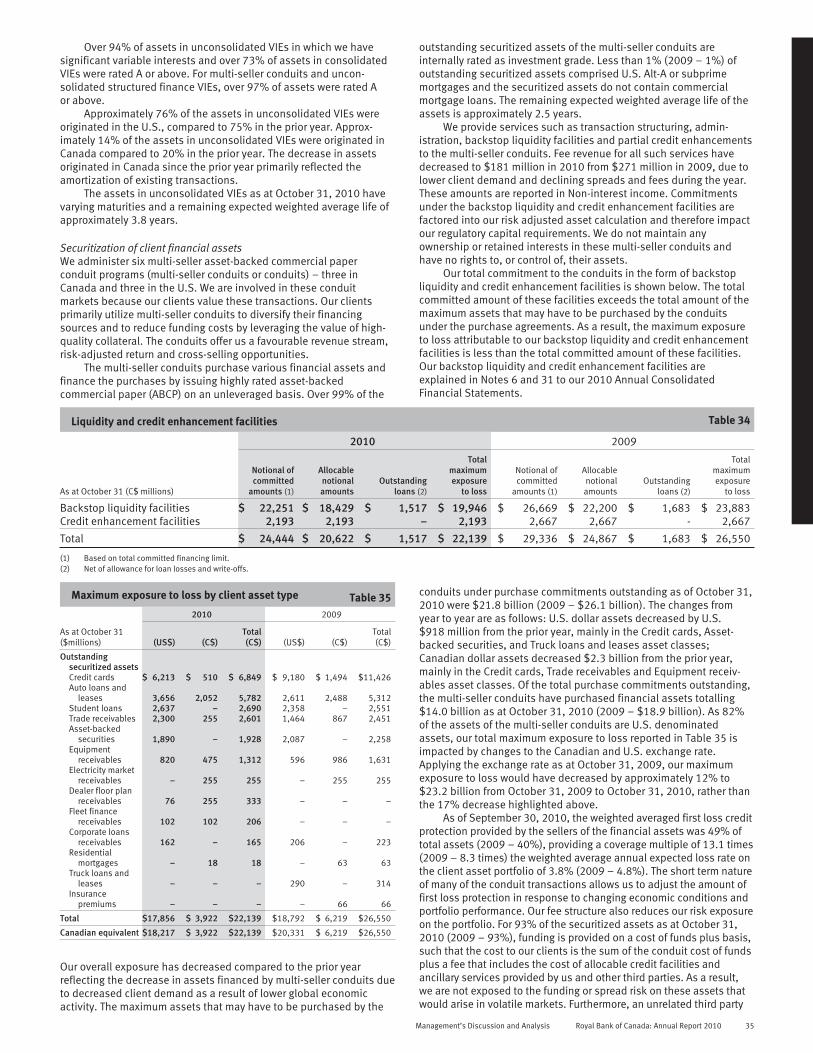
Over 94% of assets in unconsolidated VIEs in which we havesignificant variable interests and over 73% of assets in consolidatedVIEs were rated A or above. For multi-seller conduits and uncon-solidated structured finance VIEs, over 97% of assets were rated Aor above.
Approximately 76% of the assets in unconsolidated VIEs wereoriginated in the U.S., compared to 75% in the prior year. Approx-imately 14% of the assets in unconsolidated VIEs were originated inCanada compared to 20% in the prior year. The decrease in assetsoriginated in Canada since the prior year primarily reflected theamortization of existing transactions.
The assets in unconsolidated VIEs as at October 31, 2010 havevarying maturities and a remaining expected weighted average life ofapproximately 3.8 years.
Securitization of client financial assetsWe administer six multi-seller asset-backed commercial paperconduit programs (multi-seller conduits or conduits) – three inCanada and three in the U.S. We are involved in these conduitmarkets because our clients value these transactions. Our clientsprimarily utilize multi-seller conduits to diversify their financingsources and to reduce funding costs by leveraging the value of high-quality collateral. The conduits offer us a favourable revenue stream,risk-adjusted return and cross-selling opportunities.
The multi-seller conduits purchase various financial assets andfinance the purchases by issuing highly rated asset-backedcommercial paper (ABCP) on an unleveraged basis. Over 99% of the
outstanding securitized assets of the multi-seller conduits areinternally rated as investment grade. Less than 1% (2009 – 1%) ofoutstanding securitized assets comprised U.S. Alt-A or subprimemortgages and the securitized assets do not contain commercialmortgage loans. The remaining expected weighted average life of theassets is approximately 2.5 years.
We provide services such as transaction structuring, admin-istration, backstop liquidity facilities and partial credit enhancementsto the multi-seller conduits. Fee revenue for all such services havedecreased to $181 million in 2010 from $271 million in 2009, due tolower client demand and declining spreads and fees during the year.These amounts are reported in Non-interest income. Commitmentsunder the backstop liquidity and credit enhancement facilities arefactored into our risk adjusted asset calculation and therefore impactour regulatory capital requirements. We do not maintain anyownership or retained interests in these multi-seller conduits andhave no rights to, or control of, their assets.
Our total commitment to the conduits in the form of backstopliquidity and credit enhancement facilities is shown below. The totalcommitted amount of these facilities exceeds the total amount of themaximum assets that may have to be purchased by the conduitsunder the purchase agreements. As a result, the maximum exposureto loss attributable to our backstop liquidity and credit enhancementfacilities is less than the total committed amount of these facilities.Our backstop liquidity and credit enhancement facilities areexplained in Notes 6 and 31 to our 2010 Annual ConsolidatedFinancial Statements.
Liquidity and credit enhancement facilities Table 34
2010 2009
As at October 31 (C$ millions)
Notional ofcommitted
amounts (1)
Allocablenotionalamounts
Outstandingloans (2)
Totalmaximumexposure
to loss
Notional ofcommitted
amounts (1)
Allocablenotionalamounts
Outstandingloans (2)
Totalmaximumexposure
to loss
Backstop liquidity facilities $ 22,251 $ 18,429 $ 1,517 $ 19,946 $ 26,669 $ 22,200 $ 1,683 $ 23,883Credit enhancement facilities 2,193 2,193 – 2,193 2,667 2,667 - 2,667
Total $ 24,444 $ 20,622 $ 1,517 $ 22,139 $ 29,336 $ 24,867 $ 1,683 $ 26,550
(1) Based on total committed financing limit.(2) Net of allowance for loan losses and write-offs.
Maximum exposure to loss by client asset type Table 352010 2009
As at October 31($millions) (US$) (C$)
Total(C$) (US$) (C$)
Total(C$)
Outstandingsecuritized assetsCredit cards $ 6,213 $ 510 $ 6,849 $ 9,180 $ 1,494 $11,426Auto loans and
leases 3,656 2,052 5,782 2,611 2,488 5,312Student loans 2,637 – 2,690 2,358 – 2,551Trade receivables 2,300 255 2,601 1,464 867 2,451Asset-backed
securities 1,890 – 1,928 2,087 – 2,258Equipment
receivables 820 475 1,312 596 986 1,631Electricity market
receivables – 255 255 – 255 255Dealer floor plan
receivables 76 255 333 – – –Fleet finance
receivables 102 102 206 – – –Corporate loans
receivables 162 – 165 206 – 223Residential
mortgages – 18 18 – 63 63Truck loans and
leases – – – 290 – 314Insurance
premiums – – – – 66 66
Total $17,856 $ 3,922 $22,139 $18,792 $ 6,219 $26,550
Canadian equivalent $18,217 $ 3,922 $22,139 $20,331 $ 6,219 $26,550
Our overall exposure has decreased compared to the prior yearreflecting the decrease in assets financed by multi-seller conduits dueto decreased client demand as a result of lower global economicactivity. The maximum assets that may have to be purchased by the
conduits under purchase commitments outstanding as of October 31,2010 were $21.8 billion (2009 – $26.1 billion). The changes fromyear to year are as follows: U.S. dollar assets decreased by U.S.$918 million from the prior year, mainly in the Credit cards, Asset-backed securities, and Truck loans and leases asset classes;Canadian dollar assets decreased $2.3 billion from the prior year,mainly in the Credit cards, Trade receivables and Equipment receiv-ables asset classes. Of the total purchase commitments outstanding,the multi-seller conduits have purchased financial assets totalling$14.0 billion as at October 31, 2010 (2009 – $18.9 billion). As 82%of the assets of the multi-seller conduits are U.S. denominatedassets, our total maximum exposure to loss reported in Table 35 isimpacted by changes to the Canadian and U.S. exchange rate.Applying the exchange rate as at October 31, 2009, our maximumexposure to loss would have decreased by approximately 12% to$23.2 billion from October 31, 2009 to October 31, 2010, rather thanthe 17% decrease highlighted above.
As of September 30, 2010, the weighted averaged first loss creditprotection provided by the sellers of the financial assets was 49% oftotal assets (2009 – 40%), providing a coverage multiple of 13.1 times(2009 – 8.3 times) the weighted average annual expected loss rate onthe client asset portfolio of 3.8% (2009 – 4.8%). The short term natureof many of the conduit transactions allows us to adjust the amount offirst loss protection in response to changing economic conditions andportfolio performance. Our fee structure also reduces our risk exposureon the portfolio. For 93% of the securitized assets as at October 31,2010 (2009 – 93%), funding is provided on a cost of funds plus basis,such that the cost to our clients is the sum of the conduit cost of fundsplus a fee that includes the cost of allocable credit facilities andancillary services provided by us and other third parties. As a result,we are not exposed to the funding or spread risk on these assets thatwould arise in volatile markets. Furthermore, an unrelated third party
Management’s Discussion and Analysis Royal Bank of Canada: Annual Report 2010 35
(expected loss investor) agreed to absorb credit losses, up to amaximum contractual amount, that may occur in the future on theassets in the multi-seller conduits before us and the multi-sellerconduit’s debt holders.
Multiple independent debt rating agencies review all of thetransactions in the multi-seller conduits. Transactions financed in ourU.S. multi-seller conduits are reviewed by Moody’s Investors Service(Moody’s), Standard & Poor’s (S&P) and Fitch Ratings (Fitch).Transactions in our Canadian multi-seller conduits are also reviewedby Dominion Bond Rating Services (DBRS). Each applicable ratingagency also reviews ongoing transaction performance on a monthlybasis and may publish reports detailing portfolio and programinformation related to the conduits.
The total ABCP issued by the conduits amounted to$14.0 billion, a decrease of $4.9 billion or 26% since the prior yeardue to the amortization of existing transactions and decreased clientusage. The rating agencies that rate the ABCP rated 67% (2009 –70%) of the total amount issued within the top ratings category and
the remaining amount in the second highest ratings category. Theweighted average maturities (U.S. conduits 30.1 and 45.3 days andCanadian conduits 38.2 and 31.3 days as at October 31, 2010 andOctober 31, 2009, respectively) remain longer than historicalaverages, providing well balanced maturity profiles and assisting inmitigating funding risks associated with market disruptions. Wesometimes purchase the ABCP issued by the multi-seller conduits inour capacity as a placement agent in order to facilitate overallprogram liquidity. As at October 31, 2010, the fair value of ourinventory was $4 million (2009 – $4 million), classified asSecurities – Trading.
The U.S. multi-seller conduits include $2 billion of asset-backedsecurities (ABS). There are no ABS in the Canadian multi-sellerconduits and there have been no new ABS in the U.S. multi-sellerconduits since 2007. The existing ABS transactions are amortizingand building first loss protection. In 2008 and 2009, certain U.S.multi-seller conduits drew down some of our backstop liquidityfacilities to fund a portion of the ABS. These loans, net of write offsand allowances, amounted to $1.5 billion (2009 – $ 1.7 billion), andare included in Loans – Wholesale. We continue to receive principalrepayments on these loans.
Creation of credit investment productsWe use SPEs to generally transform credit derivatives into cashinstruments to distribute credit risk and to create customized creditproducts to meet the needs of investors with specific requirements.These SPEs issue funded and unfunded notes. In some instances, weinvest in these notes. The funded notes may be rated by externalrating agencies, as well as listed on a stock exchange. While themajority of the funded notes are expected to be sold on a “buy andhold” basis, we may occasionally act as market maker. Forinformation on unfunded notes, refer to Notes 6 and 31 to our 2010Annual Consolidated Financial Statements.
As with all our derivatives, the derivatives with these SPEs arecarried at fair value in derivative-related assets and liabilities. Ourexposure to these SPEs has decreased from the prior year due tocertain entities winding down. The assets in these SPEs amounted to$1.5 billion as at October 31, 2010 (2009 – $2.9 billion), of whichnone were consolidated as at October 31, 2010 and October 31,2009. As at October 31, 2010, our investments in the funded notes,the derivative-related receivables, and the notional amounts of theunfunded notes related to the unconsolidated SPEs were $19 million(2009 – $18 million), $nil (2009 – $317 million) and $nil (2009 –$170 million), respectively.
Structured financeIn 2008, we purchased U.S. auction rate securities (ARS) from entitieswhich funded their long-term investments in student loans by issuingshort-term senior and subordinated notes. As at October 31, 2010,the total assets of the unconsolidated ARS VIEs in which we havesignificant investments were $3.5 billion (2009 – $4.7 billion). Ourmaximum exposure to loss in these ARS VIEs was $834 million(2009 – $1.3 billion). Our maximum exposure to loss has decreasedfrom 2009 primarily reflecting of the sale of our investments in one ofthese entities. As a result of no longer being involved in this ARS VIE,
the total assets of the unconsolidated ARS VIEs in which we havesignificant interest have also decreased. As at October 31, 2010,approximately 92% of these investments were AAA rated. Interestincome from the ARS investments, which is reported in Net-interestincome, amounted to $36 million during the year (2009 –$78 million, 2008 – $93 million).
We also sell ARS into Tender Option Bond (ARS TOB) programs.We are the remarketing agent for the floating-rate certificates issuedby the ARS TOB programs and we provide liquidity facilities andletters of credit to each of the ARS TOB programs. The liquidityfacilities and letters of credit are included in our disclosure onguarantees in Note 25 to our 2010 Annual Consolidated FinancialStatements. As at October 31, 2010, the total assets of uncon-solidated ARS TOB programs in which we have significantinvestments were $743 million (2009 – $791 million). We did nothold any floating-rate certificates as market maker for the ARS TOBprograms as at October 31, 2010 or October 31, 2009. Fee revenuefor the remarketing services and the provision for the letters of creditand liquidity facilities, which is reported in Non-interest income,amounted to $1 million during the year (2009 – $3 million, 2008 –$3 million).
In 2008, we also sold ARS to an unaffiliated and unconsolidatedentity at fair market value. The purchase of the ARS by this entity wasfinanced by a loan from us, and the loan is secured by various assetsof the entity. As at October 31, 2010, total assets of this entityand our maximum exposure to loss were $450 million (2009 –$471 million) and $426 million (2009 – $449 million), respectively.
Fee revenue from this entity, resulting from the credit facility,administrative services and guarantees that we provide to the entity,as well as our role as remarketing agent for the ARS held by the entity,amounted to $3 million during the year (2009 – $ 4 million,2008 – $4 million). This amount is reported in Non-interest income.The interest income from the loan and the credit facility, which isreported in Net interest income, totalled $5 million for the year(2009 – $7 million, 2008 – $7 million).
Investment fundsWe enter into fee-based equity derivative transactions with thirdparties including mutual funds, unit investment trusts and otherinvestment funds. These transactions provide their investors with thedesired exposure to the referenced funds, and we hedge our exposurefrom these derivatives by investing in those referenced funds. Ourtotal exposure, which is primarily related to our investments in thereferenced funds, increased by $33 million to $61 million as atOctober 31, 2010. In addition, the total assets held in the uncon-solidated referenced funds also increased by $165 million to$249 million as at October 31, 2010 due to overall redemptions in thereferenced funds by third party investors of the funds, resulting in ourinvestments in certain of these referenced funds becomingsignificant.
Trusts, mutual and pooled fundsWhere RBC Dexia IS acts as trustee, it has a fiduciary responsibility toact in the best interests of the beneficiaries of the trusts. 50% of thefees earned by RBC Dexia IS are included in our revenue, representingour interest in the joint venture. Refer to Note 9 to our 2010 AnnualConsolidated Financial Statements for more details.
We manage assets in mutual and pooled funds and earn fees atmarket rates from these funds, but do not guarantee either principalor returns to investors in any of these funds.
Guarantees, retail and commercial commitmentsWe issue guarantee products, as described in Note 25 to our 2010Annual Consolidated Financial Statements, in return for fees whichare recorded in Non-interest income. Our maximum potential amountof future payments in relation to our guarantee products as atOctober 31, 2010, amounted to $73.5 billion (2009 – $88.9 billion).The decline compared to the prior year relates primarily to fewer creditderivatives and backstop liquidity facilities. In addition, as atOctober 31, 2010, RBC Dexia IS securities lending indemnificationstotalled $52.1 billion (2009 – 34.7 billion); we are exposed to 50% ofthis amount. The maximum potential amount of future paymentsrepresents the maximum risk of loss if there was a total default by the
36 Royal Bank of Canada: Annual Report 2010 Management’s Discussion and Analysis

guaranteed parties, without consideration of possible recoveriesunder recourse provisions, insurance policies or collateral held orpledged. As of October 31, 2010, our maximum potential amount offuture payments for our backstop liquidity facilities related to ABCPprograms were $19.1 billion (2009 – $22.6 billion) of which 96%(2009 – 98%) was committed to RBC-administered multi-sellerconduits.
We also provide commitments to our clients to help them meettheir financing needs. These guarantees and commitments expose usto liquidity and funding risks. The following is a summary of ouroff-balance sheet commitments. Refer to Note 25 to our 2010 AnnualConsolidated Financial Statements for details regarding ourguarantees and commitments.
Retail and commercial commitments (1) Table 36
(C$ millions)Within1 year
1 to3 years
Over 3 to5 years
Over5 years Total
Documentary andcommercial letters of credit $ 255 $ – $ – $ – $ 255
Commitments to extendcredit and liquidityfacilities 7,998 63,113 8,463 6,826 86,400
Uncommitted amounts (2) 17 166,963 – – 166,980
$ 8,270 $230,076 $ 8,463 $ 6,826 $253,635
(1) Based on remaining term to maturity.(2) Uncommitted amounts represent amounts for which we retain the option to extend
credit to a borrower.
Risk management
Overview
Our business activities expose us to a wide variety of risks in virtuallyall aspects of our operations. Our ability to manage these risks is akey competency within the organization, and is supported by a strongrisk culture and an effective risk management approach.
We manage our risks by seeking to ensure that business activ-ities and transactions provide an appropriate balance of return for therisks assumed and remain within our Risk Appetite, which is collec-tively managed throughout the organization, through adherence toour Enterprise Risk Appetite Framework.
Risk AppetiteOur Risk Appetite is the amount and type of risk we are willing toaccept in the pursuit of our business objectives. Our Risk AppetiteFramework provides a structured approach to:
Risk Capacity
Risk Appetite
Self-Imposed Constraints & Drivers
Risk Limits & Tolerances
Risk Profile
Regulatory Constraints
1. Define our Risk Capacity by identifying regulatory constraintsthat restrict our ability to accept risk.
2. Establish and regularly confirm our Risk Appetite, defined bySelf-Imposed Constraints and Drivers in which we have chosento limit or otherwise influence the amount of risk undertaken.They include:• maintaining an “AA” rating or better,• ensuring capital adequacy by maintaining capital ratios in
excess of rating agency and regulatory thresholds,• maintaining low exposure to “stress events”,• maintaining stability of earnings,• ensuring sound management of liquidity and funding risk,• maintaining a generally acceptable regulatory risk and
compliance control environment, and• maintaining a Risk Profile that is no riskier than that of our
average peer.
3. Translate our Risk Appetite into Risk Limits and Tolerances thatguide businesses in their risk taking activities.
4. Regularly measure and evaluate our Risk Profile against RiskLimits and Tolerances ensuring appropriate action is taken inadvance of Risk Profile surpassing Risk Appetite.
We apply our Risk Appetite Framework at an enterprise-wide level, aswell as at the business segment, Corporate Support, and line ofbusiness levels. Risk Appetite is integrated into our businessstrategies and our planning process.
Risk management principlesThe following principles guide our enterprise-wide management ofrisk:
1. Effective balancing of risk and reward by aligning risk appetitewith business strategy, diversifying risk, pricing appropriately forrisk, mitigating risk through preventive and detective controlsand transferring risk to third parties.
2. Shared responsibility for risk management as businesssegments are responsible for active management of their risks,with direction and oversight provided by Group RiskManagement and other corporate support groups.
3. Business decisions are based on an understanding of risk as weperform rigorous assessment of risks in relationships, products,transactions and other business activities.
4. Avoid activities that are not consistent with our Values, Code ofConduct or Policies, which contributes to the protection of ourreputation.
5. Proper focus on clients reduces our risks by knowing our clientsand ensuring that the services we provide are suitable for andunderstood by our clients.
6. Use of judgment and common sense in order to manage riskthroughout the organization.
Risk governanceOur overall risk governance structure shown below illustrates theroles and responsibilities of the various stakeholders in our enter-prise risk management program. Our risk governance structure isreviewed regularly against best practices as set out in industry andregulatory guidance.
Board ofDirectors
Risk and otherBoard Committees
Group Executive
Group Risk Committee
Chief Risk Officer + Group Head Strategy,Treasury & Corporate Services
Group Risk Management + Global Compliance + Corporate Treasury
Risk Committees
Business Segments
Corporate Support
CanadianBanking
Insurance InternationalBanking
CapitalMarkets
WealthManagementOw
ners
hip
– M
onito
ring
– Es
cala
tion
– Ove
rsig
ht
Culture – Framew
ork – Delegation – Accountability
Management’s Discussion and Analysis Royal Bank of Canada: Annual Report 2010 37

The Board of Directors provides oversight and carries out its riskmanagement mandate primarily through its Risk and other BoardCommittees, consisting of the Audit Committee, Corporate Gover-nance and Public Policy Committee (CG&PPC) and Human ResourcesCommittee. The Group Executive (GE) is responsible for our strategyand its execution by establishing the “tone at the top”. GE’s riskoversight role is executed primarily through the mandate of the GroupRisk Committee (GRC). GRC, with the assistance of its supporting RiskCommittees, is the senior management risk committee responsiblefor ensuring that our overall risk profile is consistent with strategicobjectives and there are ongoing, appropriate and effective riskmanagement processes. In addition, our risk governance structure issupported by:• The Chief Risk Officer (CRO) and Group Risk Management (GRM)
which have overall responsibility for the promotion of our riskculture; and maintain our enterprise-wide program foridentifying, measuring, controlling and reporting the significantrisks that face the organization;
• The Chief Compliance Officer and Global Compliance which areresponsible for our compliance policies and processes designedto mitigate and manage regulatory risk;
• Corporate Treasury which manages and oversees our capitalposition, structural interest rate risk and liquidity and fundingrisks; and
• The business segments which are responsible for specific risks,alignment of business strategies with risk appetite, and identi-fication, control and management of their risks.
The roles of the various stakeholders in our enterprise riskmanagement program are described further in the discussion ofspecific risks below.
Risk measurementOur ability to measure risks is a key component of our enterprise-widerisk and capital management processes. Certain measurementmethodologies are common to a number of risk types, while othersonly apply to a single risk type. While quantitative risk measurementis important, we also place reliance on qualitative factors. Ourmeasurement models and techniques are continually subject toindependent assessment for appropriateness and reliability. Forthose risk types that are difficult to quantify, we place greateremphasis on qualitative risk factors and assessment of activities togauge the overall level of risk to ensure that they are within our riskappetite.
Expected lossExpected loss represents losses that are statistically expected tooccur in the normal course of business in a given period of time.
Unexpected loss and economic capitalUnexpected loss is a statistical estimate of the amount by whichactual losses can exceed expected loss over a specified time horizon,measured at a specified level of confidence. We hold economiccapital to offset these unexpected losses, should they occur. Forfurther information, refer to the Capital management section.
Sensitivity analysis and stress testingSensitivity analysis and stress testing are risk measurementtechniques that help us ensure that risks we take remain within ourrisk appetite and our level of capital remains adequate.
Sensitivity analysis involves varying a single factor (e.g., a modelinput or specific assumption) to assess the impact on various riskmeasures.
Stress testing generally involves consideration of the simulta-neous movements in a number of risk factors. It is used to measurethe potential impacts on the organization of Credit, Market, Liquidityand Funding and Operational risks under adverse conditions. Stresstesting plays an important role in supporting overall capitalmanagement and adequacy assessment processes. Our enterprise-wide stress testing program utilizes stress scenarios featuring a rangeof severities based on possible adverse market and economic events.These stress scenarios are evaluated across the organization, andresults are integrated to develop an enterprise-wide view of theimpacts on our financial results and capital requirements. Thisprogram uses macroeconomic projections that are then transformed
into stress impacts on various types of risk across the organization.Macroeconomic scenarios evaluated this year include mild recession,prolonged recession, real estate weakness, crisis in China, andsovereign debt crisis. Our evaluations indicate that the resultingcapital and financial impacts of these stress scenarios are within ourability to manage.
Model validationWe use models to measure and manage different types of risk. Weemploy a holistic process whereby a model, its inputs and outputs arereviewed. This includes the data used, the logic and theoreticalunderpinnings of the model, the processing component, the inter-pretation of the output and the strategic use of the model results. Ourmodel validation process is designed to ensure that all underlyingmodel risk factors are identified and successfully mitigated. To ensurerobustness of our measurement techniques, model validation iscarried out by our risk professionals independent of those respon-sible for the development and use of the models and assumptions. Incases where independent validation is not internally possible (e.g.,exceptionally specialized models) outside experts are hired tovalidate the model. Validation activities, results and conclusions arealso reviewed by Internal Audit Services on a regular basis.
Risk controlOur enterprise-wide risk management approach is supported by acomprehensive set of risk controls. The controls are anchored by ourEnterprise Risk Management, Risk Specific, Liquidity, Compliance andCapital Management Frameworks. These frameworks lay thefoundation for the development and communication of policies,establishment of formal risk review and approval processes, and theestablishment of delegated authorities and limits. Theimplementation of robust risk controls enables the optimization ofrisk and return on both a portfolio and a transactional basis.
Our risk management frameworks and policies are organizedinto the following five levels:
Level 1: Enterprise Risk Management Framework provides anoverview of our enterprise-wide program for identifying, measuring,controlling and reporting on the significant risks we face. The RiskAppetite Framework underpins this Framework.
Level 2: Risk-Specific Frameworks elaborate on each specific risktype and the mechanisms for identifying, measuring, monitoring andreporting of risks, key policies and responsibilities.
Level 3: Enterprise Risk Policies articulate minimum requirementswithin which businesses and employees must operate.
Level 4: “Multi-risk” Enterprise Risk Policies govern activities such asproduct risk review and approval, stress testing, risk limits, riskapproval authorities and model risk management.
Level 5: Business Segments and Corporate Support Specific Policies& Procedures are established to manage the risks that are unique totheir operations.
Risk review and approval processesRisk review and approval processes are established by GRM based onthe nature, size, and complexity of risk involved. In general, the riskreview and approval process involves a formal review and approval byan individual, group or committee that is independent from theoriginator. The approval responsibilities are governed by delegatedauthorities based on the following categories: transactions, struc-tured credit, projects and initiatives, and new products and services.
Authorities and limitsThe Risk Committee of the Board of Directors delegates Credit,Market, and Insurance risk authorities to the President and ChiefExecutive Officer and CRO. These delegated authorities allow theseofficers to approve single name, geographic (country and region) andindustry sector exposures within defined parameters, establishunderwriting and inventory limits for trading and investment bankingactivities and set market risk tolerances.
38 Royal Bank of Canada: Annual Report 2010 Management’s Discussion and Analysis

ReportingEnterprise level risk monitoring and reporting are critical componentsof our enterprise risk management program and support the ability ofsenior management and the Board of Directors to effectively performtheir risk management and oversight responsibilities. On a quarterlybasis, the Enterprise Risk Report which includes a range of risksfacing the organization along with analysis of related issues andtrends is provided to senior management and the Board of Directors.This report includes a comprehensive review of our risk profile relativeto our risk appetite and the identification of emerging risks. Inaddition to regular risk monitoring, ad-hoc risk reporting is providedto senior management and the Board of Directors as warranted fornew or emerging risk issues or significant changes in our level of risk.
The shaded texts along with the tables specifically marked with anasterisk(*) in the following sections of the MD&A represent ourdisclosures on credit, market and liquidity and funding risks inaccordance with CICA Handbook Section 3862, Financial Instru-ments – Disclosures, and include discussion on how we measure ourrisks and the objectives, policies and methodologies for managingthese risks. Therefore, these shaded texts and tables represent anintegral part of our audited 2010 Annual Consolidated FinancialStatements for the years ended October 31, 2010 and October 31,2009.
Credit risk
Credit risk is the risk of loss associated with an obligor’s inability orunwillingness to fulfill its contractual obligations. Credit risk mayarise directly from the risk of default of a primary obligor (e.g. issuer,debtor, counterparty, borrower or policyholder), or indirectly from asecondary obligor (e.g. guarantor, reinsurer).
The failure to effectively manage credit risk across theorganization and all products, services and activities can have adirect, immediate and material impact on our earnings and reputa-tion.
We balance our risk and return by:• Ensuring that credit quality is not compromised for growth.• Diversifying credit risks in transactions, relationships and
portfolios.• Using our credit risk rating and scoring systems, policies and
tools.• Pricing appropriately for the credit risk taken.• Applying consistent credit risk exposure measurements• Mitigating credit risk through preventive and detective controls.• Transferring credit risk to third parties where appropriate
through approved credit risk mitigation techniques, includinghedging activities and insurance coverage.
• Avoiding business activities that are not consistent with ourValues, Code of Conduct or policies.
Risk measurementWe quantify credit risk, at both the individual obligor and portfoliolevels, to estimate expected credit losses and minimize unexpectedlosses in order to limit earnings volatility.
We employ different risk measurement processes for ourwholesale and retail credit portfolios. The wholesale portfoliocomprises business, sovereign and bank exposures, which includemid-size to large corporations and certain small businesses that aremanaged on an individual client basis. The retail portfolio iscomprised of residential mortgages and personal, credit card andsmall business loans, which are managed on a pooled basis. Creditrisk rating systems are designed to assess and quantify the riskinherent in credit activities in an accurate and consistent manner.
In measuring credit risk under Basel II, two principalapproaches are available: Advanced Internal Ratings Based (AIRB)and Standardized. Most of our credit risk exposure is measuredunder the AIRB Approach.
Economic capital, which represents our internal estimate ofunexpected loss, is used extensively for performance measurement,limit setting and internal capital adequacy.
The key parameters that form the basis of our credit riskmeasures for both regulatory and economic capital are:• Probability of default (PD): An estimated percentage that
represents the likelihood of default within a one-year period ofan obligor for a specific rating grade or for a particular pool ofexposures.
• Exposure at default (EAD): An amount expected to be owed byan obligor at the time of default.
• Loss given default (LGD): An estimated percentage of EAD thatis not expected to be recovered during the collections andrecoveries process.These parameters are determined based on historical
experience from internal credit risk rating systems in accordancewith supervisory standards, and are independently validated andupdated on a regular basis.
Under the Standardized Approach, used primarily for RBCDexia IS, RBC Bank (USA) and our Caribbean banking operations,risk weights prescribed by the Office of the Superintendent ofFinancial Institutions (OSFI) are used to calculate risk-weightedassets (RWA) for credit risk exposure. To determine the appropriaterisk weight, credit assessments by OSFI-recognized external creditrating agencies of S&P, Moody’s, Fitch and DBRS are used. For ratedexposures, primarily in the sovereign and bank classes, we assignthe risk weight corresponding to OSFI’s standard mapping. Forunrated exposures, mainly in the business and retail classes, wegenerally apply prescribed risk weights in accordance with OSFI’sstandards and guidelines taking into consideration certainexposure specific factors including counterparty type, exposure typeand credit risk mitigation technique employed.
Wholesale credit portfolioThe wholesale credit risk rating system is designed to measure thecredit risk inherent in our wholesale lending activities along twodimensions.
First, each obligor is assigned a borrower risk rating (BRR),reflecting an assessment of the credit quality of the obligor. EachBRR has a PD assigned to it. The BRR differentiates the riskiness ofobligors and represents our evaluation of the obligor’s ability andwillingness to meet its contractual obligations despite adverse orstressed business conditions, troughs in the business cycle,economic downturns or unexpected events that may occur. Theassignment of BRRs is based on the evaluation of obligors’ businessrisk and financial risk based on fundamental credit analysissupplemented by quantitative models.
Our rating system is largely consistent with that of external ratingagencies. The following table maps our 22-grade internal risk ratingscompared to ratings by external rating agencies.
Internal ratings map Table 37
RatingsStandard &
Poor’s (S&P)Moody’s InvestorService (Moody’s) Description
1 to 4 AAA to AA- Aaa to Aa3Investment Grade5 to 7 A+ to A- A1 to A3
8 to 10 BBB+ to BBB- Baa1 to Baa311 to 13 BB+ to BB- Ba1 to Ba3
Non-investment Grade14 to 16 B+ to B- B1 to B317 to 20 CCC+ to CC Caa1 to Ca21 to 22 C to D C to Bankruptcy Impaired/Default
Second, each credit facility is assigned an LGD rate. LGD rates arelargely driven by factors such as seniority of debt, collateral security,product type, and the industry in which the obligor operates andmarket environment.
EAD is estimated based on the current exposure to the obligorand the possible future changes of that exposure driven by factorssuch as credit quality of the obligor and type of credit commitment.
Management’s Discussion and Analysis Royal Bank of Canada: Annual Report 2010 39

Retail credit portfolioCredit scoring is the primary risk rating system for assessing obligorand transaction risk for retail exposures. Credit scoring is employedin the acquisition of new clients (acquisition scoring) andmanagement of existing clients (behavioural scoring).
Acquisition scoring models, which are used for underwritingpurposes, utilize established statistical methods of analyzing newapplicant characteristics and past performance to estimate futurecredit performance. In model development, sources of data are usedand include information obtained from the client such asemployment status, data from our internal systems such as loaninformation and information from external sources such as creditbureaus.
Behavioural scoring is used in the ongoing management of retailclients with whom we have an established relationship. It utilizesstatistical techniques that capture past performance to predict futurebehaviour and incorporate information, such as cash flow andborrowing trends, as well as the extent of our relationship with theclient. The behavioural risk score is dynamic and is generally updatedon a monthly basis to continually re-evaluate the risk. Characteristicsused in behavioural scoring models are based on information fromexisting accounts and lending products for each client, and frominformation obtained from external sources, such as credit bureaus.
For overall portfolio management, retail exposures are assessedon a pooled basis, with each pool consisting of exposures withsimilar homogeneous characteristics. We believe pooling allows formore precise, accurate and consistent estimates of default and losscharacteristics at the pool level.
Criteria used to pool exposures for risk quantification includebehavioural score, product type (mortgage, credit cards, lines ofcredit and instalment loans), collateral type (chattel, liquid assetsand real estate), the length of time that the account has been on ourbooks, and the delinquency status (performing, delinquent anddefault) of the exposure. Regular monitoring and periodic adjust-ments and alignments are conducted to ensure that this processprovides for a meaningful differentiation of risk. Migration betweenthe pools is considered when assessing credit quality.
The pools are also assessed based on PD, EAD and LGD whichconsider borrower and transaction characteristics, includingbehavioural credit score, product type and delinquency status. TheLGD is estimated based on transaction specific factors, includingproduct, loan to value and collateral types. Our risk ratings arereviewed and updated on a regular basis.
The following table maps PD bands to various risk levels:
Internal ratings map Table 38
PD bands Description
.0% - 1.0% Low Risk
1.1% - 6.4% Medium Risk
6.5% - 99.99% High Risk
100.00% Impaired/Default
Risk Control
The Board of Directors and its Committees, Group Executive, GroupRisk Committee (GRC) and other management risk committees workin combination to approve credit risk limits and ensure thatmanagement has in place frameworks, policies, processes andprocedures to manage credit risk. Reports are distributed to theBoard of Directors, GRC, and senior executives to keep theminformed of our risk profile, including trending information andsignificant credit risk issues and shifts in exposures to ensureappropriate actions can be taken where necessary. Our enterprise-wide credit risk policies set out the minimum requirements for themanagement of credit risk in a variety of borrower, transactionaland portfolio management contexts.
Credit policies are an integral component of our Credit RiskManagement Framework and set out the minimum requirements forthe management of credit risk as follows:
Credit risk assessment• Mandatory use of credit risk rating and scoring systems.• Consistent credit risk assessment criteria.• Standard content requirements in credit application
documents.
Credit risk mitigationStructuring of transactions• Includes the use of guarantees, security, seniority and
covenants. Product-specific guidelines set out appropriateproduct structuring as well as client and guarantor criteria.The third-party guarantors that we deal with are primarilysovereign-sponsored agencies.
Collateral• We often require obligors to pledge collateral as security
when we advance credit. The extent of risk mitigationprovided by collateral depends on the amount, type andquality of the collateral taken.
Credit derivatives• Used as a tool to mitigate industry sector concentration and
single-name exposure. The counterparties that we transactwith are typically investment-grade banks and broker/dealers. As with other derivatives, we use collateral andmaster netting agreements for managing counterparty creditrisk and these contracts are subject to the same creditapproval, limit and monitoring standards used for managingcredit risk. For a more detailed description of the types ofcredit derivatives we enter into and how we manage relatedcredit risk, refer to Note 7 to our 2010 Annual ConsolidatedFinancial Statements.
Product approval• Proposals for credit products and services are compre-
hensively reviewed and approved under a risk assessmentframework.
Credit portfolio management• Limits are used to ensure our portfolio is well diversified,
reduce concentration risk and remain within our risk appetite.• Our credit limits are established at the following levels: single
name limits (notional and economic capital), underwritingrisk limits, geographic (country and region) limits, industrysector limits (notional and economic capital), and productand portfolio limits, where deemed necessary.
Gross credit risk exposureGross credit risk exposure is categorized into Lending-related andother, and Trading-related. In the table below, Other exposure,under Lending-related and other credit exposure, includescontingent liabilities such as letters of credit and guarantees, andavailable-for sale debt securities. For undrawn commitments andcontingent liabilities, gross exposure represents an estimatedportion of the contractual amount that is expected to be drawn uponat the time of default of an obligor.
Repo-style transactions include repurchase and reverserepurchase agreements and securities lending and borrowingtransactions. For repurchase and reverse repurchase agreements,gross exposure represents the amount at which securities wereinitially sold or acquired. For securities lending and borrowingtransactions, gross exposure is the amount at which securities wereinitially loaned or borrowed. For over-the-counter derivatives (OTC),the gross exposure amount represents the credit equivalent amountafter factoring in master netting agreements, which is defined byOSFI as the replacement cost plus an add-on amount for potentialfuture credit exposure.
Our credit risk objectives, policies, and methodologies have notchanged materially from 2009.
40 Royal Bank of Canada: Annual Report 2010 Management’s Discussion and Analysis

Gross credit risk exposure by portfolio and sector* (2) Table 39
2010 2009Lending-related and other Trading-related Lending-related and other Trading-related
Loans and acceptances
OtherRepo-style
transactions
Over-the-counter
derivatives (1)
Loans and acceptancesOver-the-
counterderivatives (1)
Totalexposure (2)
As at October 31(C$ millions) Outstanding
Undrawncommitments
Totalexposure (2) Outstanding
Undrawncommitments Other
Repo-styletransactions
Residentialmortgages $ 128,832 $ 12 $ 160 $ – $ – $ 129,004 $ 122,130 $ 11 $ – $ – $ – $ 122,141
Personal 80,174 61,181 59 – – 141,414 71,542 51,132 47 – – 122,721Credit cards 10,110 30,144 – – – 40,254 8,701 20,113 – – – 28,814Small business (3) 2,712 3,136 45 – – 5,893 2,851 2,382 48 – – 5,281
Retail $ 221,828 $ 94,473 $ 264 $ – $ – $ 316,565 $ 205,224 $ 73,638 $ 95 $ – $ – $ 278,957
Business (3)Agriculture $ 4,815 $ 504 $ 24 $ – $ 7 $ 5,350 $ 5,090 $ 396 $ 23 $ – $ 8 $ 5,517Automotive 3,527 1,747 142 – 321 5,737 3,657 1,608 144 12 248 5,669Consumer
goods 5,912 2,358 483 – 224 8,977 6,141 2,284 435 – 234 9,094Energy 5,945 9,942 2,173 – 1,429 19,489 7,055 8,302 2,241 18 1,411 19,027Non-bank
financialservices 4,769 5,973 6,487 81,008 10,123 108,360 3,541 6,738 6,569 49,837 7,771 74,456
Forest products 792 371 87 – 17 1,267 830 453 89 – 15 1,387Industrial
products 3,731 2,387 426 – 147 6,691 3,972 2,307 340 – 198 6,817Mining & metals 635 1,565 637 – 198 3,035 1,774 1,275 543 2 335 3,929Real estate &
related 18,358 2,701 1,292 – 275 22,626 21,049 2,853 1,259 – 320 25,481Technology &
media 2,569 3,241 322 – 528 6,660 2,562 2,730 293 – 768 6,353Transportation
andenvironment 3,759 1,658 483 – 582 6,482 4,413 1,791 419 – 459 7,082
Other 20,253 4,894 6,862 9,625 5,840 47,474 22,572 4,962 6,884 9,835 6,686 50,939Sovereign (3) 3,765 3,580 28,123 3,770 8,322 47,560 2,779 2,145 20,937 2,830 8,178 36,869Bank (3) 1,916 622 46,093 58,587 30,908 138,126 2,516 763 37,316 63,514 27,678 131,787
Wholesale $ 80,746 $ 41,543 $ 93,634 $ 152,990 $ 58,921 $ 427,834 $ 87,951 $ 38,607 $77,492 $ 126,048 $ 54,309 $ 384,407
Total exposure $ 302,574 $ 136,016 $ 93,898 $ 152,990 $ 58,921 $ 744,399 $ 293,175 $ 112,245 $77,587 $ 126,048 $ 54,309 $ 663,364
* This table represents an integral part of our 2010 Annual Consolidated Financial Statements.(1) Credit equivalent amount after factoring in master netting agreements.(2) Gross credit risk exposure is before allowance for loan losses. Exposure under Basel II asset classes of qualifying revolving retail and other retail are largely included within Personal and
Credit cards, while home equity lines of credit are included in Personal.(3) Refer to Note 4 to our 2010 Annual Consolidated Financial Statements for the definition of these terms.
2010 vs. 2009Total gross credit risk exposure increased $81 billion, or 12%, from ayear ago, reflecting increases in both retail and wholesale portfolios.
Retail exposure increased $38 billion, or 14%, primarily drivenby the implementation of updated risk parameters for undrawncommitments and the realignment of the retail risk rating systemreflecting recent credit experience. Retail exposure also increased asa result of solid volume growth in Canadian home equity and personallending products. The use of guarantees and collateral represents anintegral part of our credit risk mitigation in the retail portfolio. Insuredmortgages accounted for 20% of our residential mortgage portfolio in2010 as compared to 24% in 2009. Secured personal lendingrepresented 56% of personal loans outstanding in 2010 as comparedto 54% in 2009.
Wholesale exposure increased $43 billion, or 11%, mainlyreflecting increases in most exposure types. Repo-style transactionsincreased $27 billion, primarily in non-bank financial services, due tohigher market activity from the European Government Bond businessand increased volume for our primary dealer activities, partially offsetby the impact of the stronger Canadian dollar. Other exposureincreased $16 billion in bank and sovereign, largely due to higherguarantees and securities exposures. Loans and acceptancesdecreased $7 billion, mainly in the business portfolio across mostsectors largely due to a strategic reduction in our U.S. loan portfolio,maturity and repayments and the impact of the stronger Canadiandollar. Most of the decrease in business exposure was in real estateand related, mining and metals, energy and other services within theother category. The decrease was partially offset by increases in non-bank financial services and sovereign. The loan utilization rateremained stable at 42%.
Loans and acceptances
Loans and acceptances by portfolio and sector (1) Table 40
(C$ millions) 2010 2009Residential mortgages $ 128,832 $ 122,130Personal 80,174 71,542Credit cards 10,110 8,701Small business 2,712 2,851
Retail $ 221,828 $ 205,224
BusinessAgriculture 4,815 5,090Automotive 3,527 3,657Consumer goods 5,912 6,141Energy 5,945 7,055Non-bank financial services 4,769 3,541Forest products 792 830Industrial products 3,731 3,972Mining & metals 635 1,774Real estate & related 18,358 21,049Technology & media 2,569 2,562Transportation & environment 3,759 4,413Other (2) 20,253 22,572
Sovereign 3,765 2,779Bank 1,916 2,516
Wholesale $ 80,746 $ 87,951Total loans and acceptances $ 302,574 $ 293,175Total allowance for loan losses (2,997) (3,188)
Total loans and acceptances, net of allowancefor loan losses $ 299,577 $ 289,987
(1) Total loans and acceptances do not reflect the impact of credit risk mitigation.(2) 2010 relates to Other services – $8.1 billion, Financing products – $5.1 billion, Holding
and investments – $4.0 billion, Health – $2.7 billion and Other – $.4 billion. Other in2009 relates to Other services – $10 billion, Financing products – $5.7 billion, Holdingand investments – $3.9 billion, Health – $2.4 billion, and Other – $.6 billion.
Management’s Discussion and Analysis Royal Bank of Canada: Annual Report 2010 41
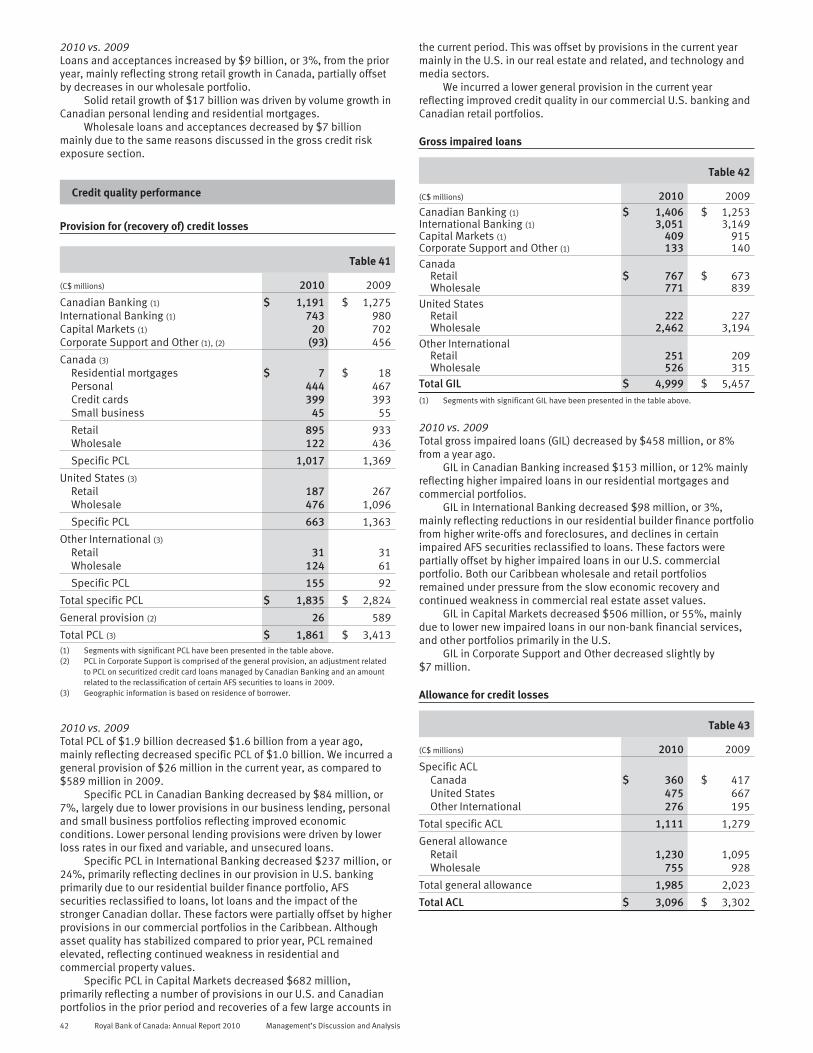
2010 vs. 2009Loans and acceptances increased by $9 billion, or 3%, from the prioryear, mainly reflecting strong retail growth in Canada, partially offsetby decreases in our wholesale portfolio.
Solid retail growth of $17 billion was driven by volume growth inCanadian personal lending and residential mortgages.
Wholesale loans and acceptances decreased by $7 billionmainly due to the same reasons discussed in the gross credit riskexposure section.
Credit quality performance
Provision for (recovery of) credit losses
Table 41
(C$ millions) 2010 2009
Canadian Banking (1) $ 1,191 $ 1,275International Banking (1) 743 980Capital Markets (1) 20 702Corporate Support and Other (1), (2) (93) 456
Canada (3)
Residential mortgages $ 7 $ 18Personal 444 467Credit cards 399 393Small business 45 55
Retail 895 933Wholesale 122 436
Specific PCL 1,017 1,369
United States (3)
Retail 187 267Wholesale 476 1,096
Specific PCL 663 1,363
Other International (3)
Retail 31 31Wholesale 124 61
Specific PCL 155 92
Total specific PCL $ 1,835 $ 2,824
General provision (2) 26 589
Total PCL (3) $ 1,861 $ 3,413(1) Segments with significant PCL have been presented in the table above.(2) PCL in Corporate Support is comprised of the general provision, an adjustment related
to PCL on securitized credit card loans managed by Canadian Banking and an amountrelated to the reclassification of certain AFS securities to loans in 2009.
(3) Geographic information is based on residence of borrower.
2010 vs. 2009Total PCL of $1.9 billion decreased $1.6 billion from a year ago,mainly reflecting decreased specific PCL of $1.0 billion. We incurred ageneral provision of $26 million in the current year, as compared to$589 million in 2009.
Specific PCL in Canadian Banking decreased by $84 million, or7%, largely due to lower provisions in our business lending, personaland small business portfolios reflecting improved economicconditions. Lower personal lending provisions were driven by lowerloss rates in our fixed and variable, and unsecured loans.
Specific PCL in International Banking decreased $237 million, or24%, primarily reflecting declines in our provision in U.S. bankingprimarily due to our residential builder finance portfolio, AFSsecurities reclassified to loans, lot loans and the impact of thestronger Canadian dollar. These factors were partially offset by higherprovisions in our commercial portfolios in the Caribbean. Althoughasset quality has stabilized compared to prior year, PCL remainedelevated, reflecting continued weakness in residential andcommercial property values.
Specific PCL in Capital Markets decreased $682 million,primarily reflecting a number of provisions in our U.S. and Canadianportfolios in the prior period and recoveries of a few large accounts in
the current period. This was offset by provisions in the current yearmainly in the U.S. in our real estate and related, and technology andmedia sectors.
We incurred a lower general provision in the current yearreflecting improved credit quality in our commercial U.S. banking andCanadian retail portfolios.
Gross impaired loans
Table 42
(C$ millions) 2010 2009Canadian Banking (1) $ 1,406 $ 1,253International Banking (1) 3,051 3,149Capital Markets (1) 409 915Corporate Support and Other (1) 133 140Canada
Retail $ 767 $ 673Wholesale 771 839
United StatesRetail 222 227Wholesale 2,462 3,194
Other InternationalRetail 251 209Wholesale 526 315
Total GIL $ 4,999 $ 5,457(1) Segments with significant GIL have been presented in the table above.
2010 vs. 2009Total gross impaired loans (GIL) decreased by $458 million, or 8%from a year ago.
GIL in Canadian Banking increased $153 million, or 12% mainlyreflecting higher impaired loans in our residential mortgages andcommercial portfolios.
GIL in International Banking decreased $98 million, or 3%,mainly reflecting reductions in our residential builder finance portfoliofrom higher write-offs and foreclosures, and declines in certainimpaired AFS securities reclassified to loans. These factors werepartially offset by higher impaired loans in our U.S. commercialportfolio. Both our Caribbean wholesale and retail portfoliosremained under pressure from the slow economic recovery andcontinued weakness in commercial real estate asset values.
GIL in Capital Markets decreased $506 million, or 55%, mainlydue to lower new impaired loans in our non-bank financial services,and other portfolios primarily in the U.S.
GIL in Corporate Support and Other decreased slightly by$7 million.
Allowance for credit losses
Table 43
(C$ millions) 2010 2009
Specific ACLCanada $ 360 $ 417United States 475 667Other International 276 195
Total specific ACL 1,111 1,279
General allowanceRetail 1,230 1,095Wholesale 755 928
Total general allowance 1,985 2,023
Total ACL $ 3,096 $ 3,302
42 Royal Bank of Canada: Annual Report 2010 Management’s Discussion and Analysis

2010 vs. 2009Total allowance for credit losses (ACL) decreased $206 million, or 6%,from a year ago, mainly due to a $168 million decrease in the specificallowance, reflecting the same factors as previously discussed. It alsoincludes a $38 million decrease in the general allowance largely as aresult of the impact of a stronger Canadian dollar. This was offset byan increased provision relating to our U.S. banking business. Refer tothe Supplemental information section for further details.
Market risk
Market risk is the risk of loss that may arise from changes in marketfactors such as interest rates, foreign exchange rates, equity orcommodity prices, and credit spreads. We are exposed to marketrisk in our trading activity and our asset/liability managementactivities. The level to which we are exposed varies depending onmarket conditions, expectations of future price and yield movementsand the composition of our trading portfolio.
Market volatility dissipated in the early part of the year, butincreased gradually in the latter half of 2010 due to the Europeansovereign debt crisis and fiscal austerity measures in Europe.
Trading market riskTrading market risks associated with securities and relatedderivatives trading activities are a result of market-making, propri-etary, and sales and arbitrage activities in the interest rate, credit,foreign exchange, equity, and commodities markets. Trading marketrisk reflects the potential adverse impact on our earnings andeconomic value and is comprised of the following components:• Interest rate risk arises from the changes in interest rates and is
composed of directional risk, yield curve risk, basis risk andoption risk. Interest rate risk also captures credit spread riskarising from the changes in issuer spreads.
• Credit specific risk arises from the change in thecreditworthiness and default of issuers of our holdings in fixedincome products.
• Foreign exchange rate risk arises from the change in currencyrates and precious metals price movements and volatilities. Inour proprietary positions, we are exposed to the spot, forwardand derivative markets.
• Equity risk arises from the movements in individual equityprices or movements in the level of stock market indices.
• Commodities risk arises from commodities price movementsand volatilities.
• Market illiquidity risk arises from the inability to liquidate ourpositions or acquire hedges to neutralize our trading positions.
We conduct trading activities over-the-counter and on exchanges inthe spot, forward, futures and options markets, and we offerstructured derivative transactions. Our trading operations primarilyact as a market maker, executing transactions that meet thefinancial requirements of our clients and transferring the marketrisks to the broad financial market. We also act as principal and takeproprietary market risk positions within the authorized limitsdetermined by the Board of Directors. The trading book, as definedby OSFI, consists of cash and derivative positions that are held forshort-term resale, taken on with the intent of benefiting in the shortterm from actual or expected differences between their buying andselling prices or to lock in arbitrage profits. The breadth of ourtrading activities is designed to diversify market risk to any particularstrategy, and to reduce trading revenue volatility.
Risk measurementWe employ risk measurement tools such as Value-at-Risk (VaR),sensitivity analysis and stress testing to assess global risk-returntrends and to alert senior management to adverse trends orpositions.
The majority of trading positions in foreign exchange, interestrate, equity, commodity and credit trading have capital requirementscalculated under an Internal Models Approach (VaR based), whilesome structured credit derivatives, structured rate products includingbank-owned life insurance stable value contracts (BOLI), mortgage-
backed securities, and equity derivatives have capital requirementscalculated under the Standardized Approach prescribed by OSFI. Alsocalculated under the Standardized Approach for credit specific riskare a limited set of interest rate products. These products and risksunder the standardized approach are not included in our VaR, asdiscussed below.
Refer to Table 51 for market risk RWA under the internal models andstandardized approaches. For management purposes, we calculateVaR for all of our trading positions, including those under thestandardized approach.
Value-at-RiskVaR is a statistical technique that measures the worst-case lossexpected over a one-day period within a 99% confidence level.Larger losses are possible, but with low probability. For example,based on a 99% confidence interval, a portfolio with a VaR of $20million held over one day would have a one in one hundred chanceof suffering a loss greater than $20 million in that day.
We measure VaR by major risk category on a discrete basis. Wealso measure and monitor the effects of correlation in themovements of interest rates, credit specific risk, exchange rates,equity and commodity prices and highlight the benefit ofdiversification within our trading portfolio. This is then quantified inthe diversification effect shown in our VaR table.
As with any modeled risk measure, there are certain limitationsthat arise from the assumptions used in VaR. Historical VaR assumesthat the future will behave like the past. The historical scenarios usedto calculate VaR may not capture extreme market volatility. As aresult, historical scenarios may not reflect the next market cycle.Furthermore, the use of a one-day horizon VaR for risk measurementimplies that positions could be unwound or hedged within a day butthis may not be a realistic assumption if the market becomes largelyor completely illiquid. The VaR scenario model has incorporatedmarket events from much of 2010, while the higher volatility levelswitnessed during late 2008 and early 2009 remain in the model.
ValidationTo ensure VaR effectively captures our market risk, we continuouslymonitor and enhance our methodology. Daily back-testing serves tocompare hypothetical profit or loss against the VaR to monitor thestatistical validity of 99% confidence level of the daily VaR measure.Back-testing is calculated by holding position levels constant andisolating the effect of the movement of actual market rates over thenext day and over the next 10 days on the market value of theportfolios. Intra-day position changes account for most of thedifference between theoretical back-testing and actual profit andloss. VaR models and market risk factors are independently reviewedperiodically to further ensure accuracy and reliability.
Sensitivity analysis and stress testingSensitivity analysis is used to measure the impact of small changes inindividual risk factors such as interest rates and foreign exchangerates and is designed to isolate and quantify exposure to theunderlying risk.
In order to address more extreme market events, stress testing isused to measure and alert senior management to our exposure topotential political, economic or other disruptive events. We runseveral types of stress tests, including historical stress events suchas the 1987 stock market crash, and the unprecedented marketvolatility in 2008 and early 2009, as well as hypothetical “what-if”stress events that represent potential future events that are plausiblebut have a very low probability of occurring. In light of the currentmarket environment, we supplemented existing market risk measuresby frequent updates to the historical scenario window used in VaRand risk factors were refined to accurately reflect the current marketconditions in the calculations. Our stress scenarios are reviewed andupdated as required to reflect relevant events and hypotheticalsituations. While we endeavour to be conservative in our stresstesting, there can be no assurance that our stress testing assump-tions will cover every market scenario that may unfold.
Management’s Discussion and Analysis Royal Bank of Canada: Annual Report 2010 43
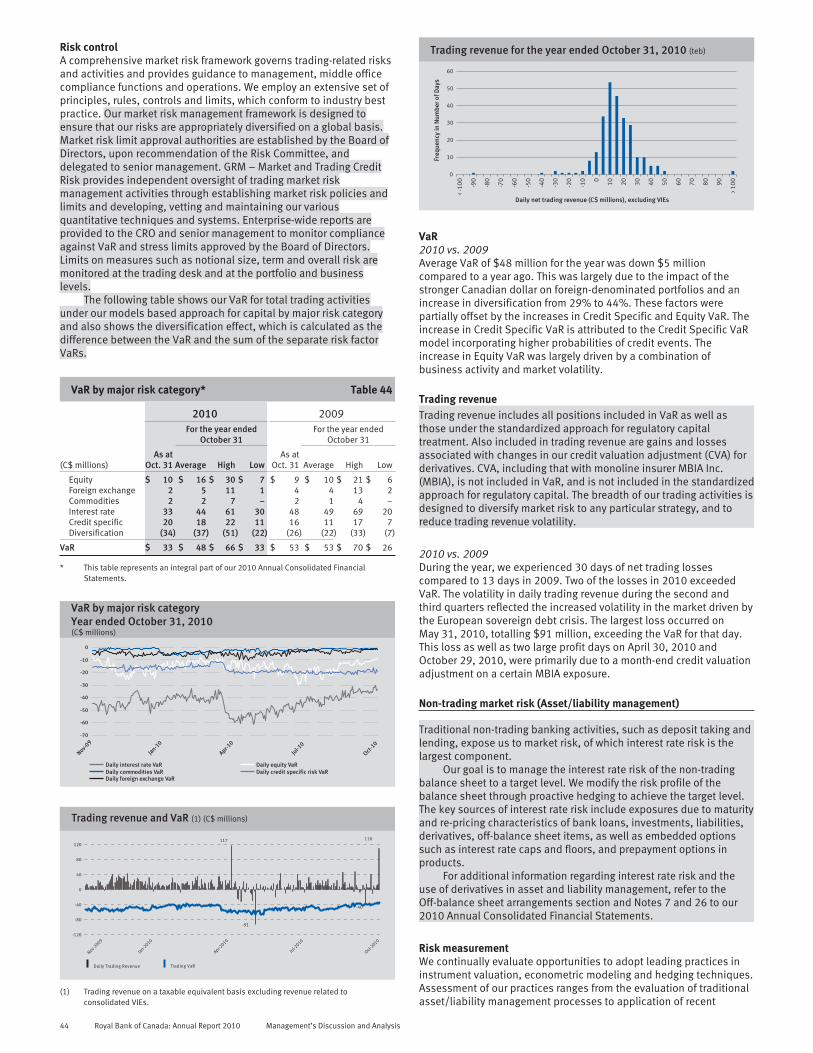
Risk controlA comprehensive market risk framework governs trading-related risksand activities and provides guidance to management, middle officecompliance functions and operations. We employ an extensive set ofprinciples, rules, controls and limits, which conform to industry bestpractice. Our market risk management framework is designed toensure that our risks are appropriately diversified on a global basis.Market risk limit approval authorities are established by the Board ofDirectors, upon recommendation of the Risk Committee, anddelegated to senior management. GRM – Market and Trading CreditRisk provides independent oversight of trading market riskmanagement activities through establishing market risk policies andlimits and developing, vetting and maintaining our variousquantitative techniques and systems. Enterprise-wide reports areprovided to the CRO and senior management to monitor complianceagainst VaR and stress limits approved by the Board of Directors.Limits on measures such as notional size, term and overall risk aremonitored at the trading desk and at the portfolio and businesslevels.
The following table shows our VaR for total trading activitiesunder our models based approach for capital by major risk categoryand also shows the diversification effect, which is calculated as thedifference between the VaR and the sum of the separate risk factorVaRs.
VaR by major risk category* Table 44
2010 2009For the year ended
October 31For the year ended
October 31
(C$ millions)As at
Oct. 31 Average High LowAs at
Oct. 31 Average High Low
Equity $ 10 $ 16 $ 30 $ 7 $ 9 $ 10 $ 21 $ 6Foreign exchange 2 5 11 1 4 4 13 2Commodities 2 2 7 – 2 1 4 –Interest rate 33 44 61 30 48 49 69 20Credit specific 20 18 22 11 16 11 17 7Diversification (34) (37) (51) (22) (26) (22) (33) (7)
VaR $ 33 $ 48 $ 66 $ 33 $ 53 $ 53 $ 70 $ 26
* This table represents an integral part of our 2010 Annual Consolidated FinancialStatements.
VaR by major risk categoryYear ended October 31, 2010(C$ millions)
-70
-60
-50
-40
-30
-20
-10
0
Nov-09
Jan-10
Apr-10
Jul-10
Oct-10
Daily interest rate VaR Daily equity VaRDaily commodities VaR Daily credit specific risk VaRDaily foreign exchange VaR
Trading revenue and VaR (1) (C$ millions)
Daily Trading Revenue Trading VaR
Nov-2009
Jan-2010
Apr-2010
Jul-2
010
Oct-2010
120
80
40
0
-40
-80
-120
117
-91
-40
110
(1) Trading revenue on a taxable equivalent basis excluding revenue related toconsolidated VIEs.
Trading revenue for the year ended October 31, 2010 (teb)
Daily net trading revenue (C$ millions), excluding VIEs
0
10
20
30
40
50
60
< -1
00
-90
-80
-70
-60
-50
-40
-30
-20
-10 0
10
20
30
40
50
60
70
80
90
> 10
0
Freq
uenc
y in
Num
ber o
f Day
s
VaR2010 vs. 2009Average VaR of $48 million for the year was down $5 millioncompared to a year ago. This was largely due to the impact of thestronger Canadian dollar on foreign-denominated portfolios and anincrease in diversification from 29% to 44%. These factors werepartially offset by the increases in Credit Specific and Equity VaR. Theincrease in Credit Specific VaR is attributed to the Credit Specific VaRmodel incorporating higher probabilities of credit events. Theincrease in Equity VaR was largely driven by a combination ofbusiness activity and market volatility.
Trading revenueTrading revenue includes all positions included in VaR as well asthose under the standardized approach for regulatory capitaltreatment. Also included in trading revenue are gains and lossesassociated with changes in our credit valuation adjustment (CVA) forderivatives. CVA, including that with monoline insurer MBIA Inc.(MBIA), is not included in VaR, and is not included in the standardizedapproach for regulatory capital. The breadth of our trading activities isdesigned to diversify market risk to any particular strategy, and toreduce trading revenue volatility.
2010 vs. 2009During the year, we experienced 30 days of net trading lossescompared to 13 days in 2009. Two of the losses in 2010 exceededVaR. The volatility in daily trading revenue during the second andthird quarters reflected the increased volatility in the market driven bythe European sovereign debt crisis. The largest loss occurred onMay 31, 2010, totalling $91 million, exceeding the VaR for that day.This loss as well as two large profit days on April 30, 2010 andOctober 29, 2010, were primarily due to a month-end credit valuationadjustment on a certain MBIA exposure.
Non-trading market risk (Asset/liability management)
Traditional non-trading banking activities, such as deposit taking andlending, expose us to market risk, of which interest rate risk is thelargest component.
Our goal is to manage the interest rate risk of the non-tradingbalance sheet to a target level. We modify the risk profile of thebalance sheet through proactive hedging to achieve the target level.The key sources of interest rate risk include exposures due to maturityand re-pricing characteristics of bank loans, investments, liabilities,derivatives, off-balance sheet items, as well as embedded optionssuch as interest rate caps and floors, and prepayment options inproducts.
For additional information regarding interest rate risk and theuse of derivatives in asset and liability management, refer to theOff-balance sheet arrangements section and Notes 7 and 26 to our2010 Annual Consolidated Financial Statements.
Risk measurementWe continually evaluate opportunities to adopt leading practices ininstrument valuation, econometric modeling and hedging techniques.Assessment of our practices ranges from the evaluation of traditionalasset/liability management processes to application of recent
44 Royal Bank of Canada: Annual Report 2010 Management’s Discussion and Analysis
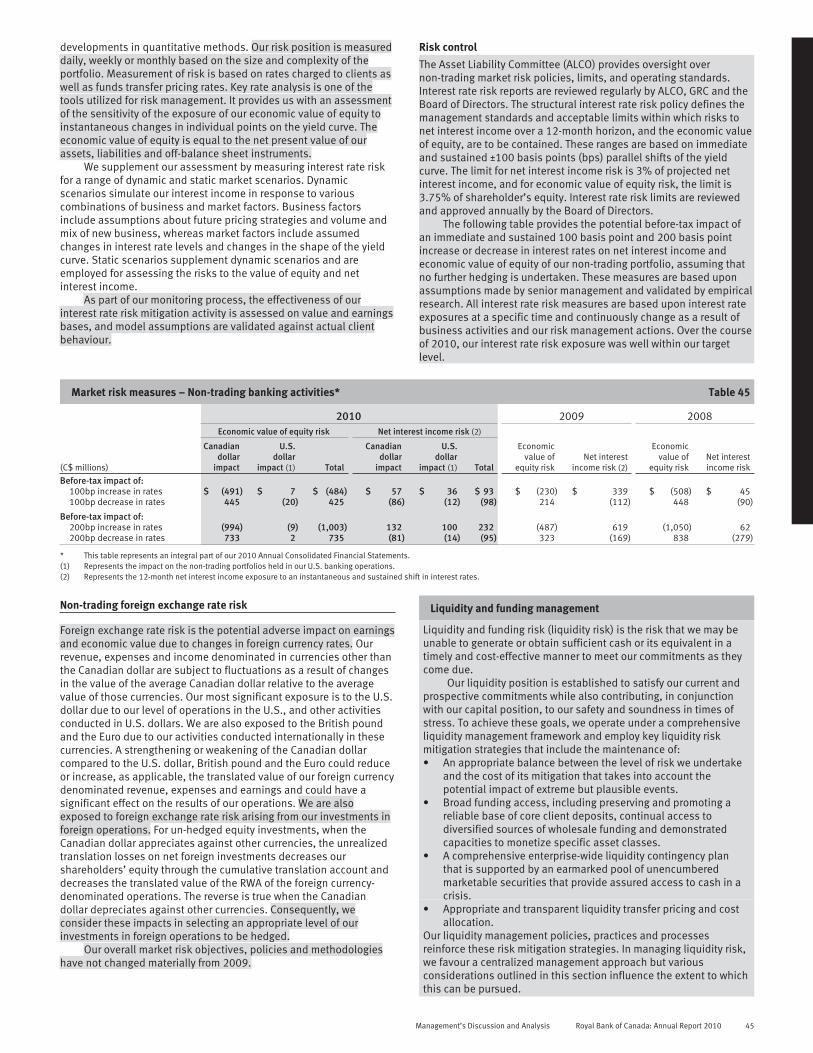
developments in quantitative methods. Our risk position is measureddaily, weekly or monthly based on the size and complexity of theportfolio. Measurement of risk is based on rates charged to clients aswell as funds transfer pricing rates. Key rate analysis is one of thetools utilized for risk management. It provides us with an assessmentof the sensitivity of the exposure of our economic value of equity toinstantaneous changes in individual points on the yield curve. Theeconomic value of equity is equal to the net present value of ourassets, liabilities and off-balance sheet instruments.
We supplement our assessment by measuring interest rate riskfor a range of dynamic and static market scenarios. Dynamicscenarios simulate our interest income in response to variouscombinations of business and market factors. Business factorsinclude assumptions about future pricing strategies and volume andmix of new business, whereas market factors include assumedchanges in interest rate levels and changes in the shape of the yieldcurve. Static scenarios supplement dynamic scenarios and areemployed for assessing the risks to the value of equity and netinterest income.
As part of our monitoring process, the effectiveness of ourinterest rate risk mitigation activity is assessed on value and earningsbases, and model assumptions are validated against actual clientbehaviour.
Risk control
The Asset Liability Committee (ALCO) provides oversight overnon-trading market risk policies, limits, and operating standards.Interest rate risk reports are reviewed regularly by ALCO, GRC and theBoard of Directors. The structural interest rate risk policy defines themanagement standards and acceptable limits within which risks tonet interest income over a 12-month horizon, and the economic valueof equity, are to be contained. These ranges are based on immediateand sustained ±100 basis points (bps) parallel shifts of the yieldcurve. The limit for net interest income risk is 3% of projected netinterest income, and for economic value of equity risk, the limit is3.75% of shareholder’s equity. Interest rate risk limits are reviewedand approved annually by the Board of Directors.
The following table provides the potential before-tax impact ofan immediate and sustained 100 basis point and 200 basis pointincrease or decrease in interest rates on net interest income andeconomic value of equity of our non-trading portfolio, assuming thatno further hedging is undertaken. These measures are based uponassumptions made by senior management and validated by empiricalresearch. All interest rate risk measures are based upon interest rateexposures at a specific time and continuously change as a result ofbusiness activities and our risk management actions. Over the courseof 2010, our interest rate risk exposure was well within our targetlevel.
Market risk measures – Non-trading banking activities* Table 45
2010 2009 2008Economic value of equity risk Net interest income risk (2)
(C$ millions)
Canadiandollar
impact
U.S.dollar
impact (1) Total
Canadiandollar
impact
U.S.dollar
impact (1) Total
Economicvalue of
equity riskNet interest
income risk (2)
Economicvalue of
equity riskNet interestincome risk
Before-tax impact of:100bp increase in rates $ (491) $ 7 $ (484) $ 57 $ 36 $ 93 $ (230) $ 339 $ (508) $ 45100bp decrease in rates 445 (20) 425 (86) (12) (98) 214 (112) 448 (90)
Before-tax impact of:200bp increase in rates (994) (9) (1,003) 132 100 232 (487) 619 (1,050) 62200bp decrease in rates 733 2 735 (81) (14) (95) 323 (169) 838 (279)
* This table represents an integral part of our 2010 Annual Consolidated Financial Statements.(1) Represents the impact on the non-trading portfolios held in our U.S. banking operations.(2) Represents the 12-month net interest income exposure to an instantaneous and sustained shift in interest rates.
Non-trading foreign exchange rate risk
Foreign exchange rate risk is the potential adverse impact on earningsand economic value due to changes in foreign currency rates. Ourrevenue, expenses and income denominated in currencies other thanthe Canadian dollar are subject to fluctuations as a result of changesin the value of the average Canadian dollar relative to the averagevalue of those currencies. Our most significant exposure is to the U.S.dollar due to our level of operations in the U.S., and other activitiesconducted in U.S. dollars. We are also exposed to the British poundand the Euro due to our activities conducted internationally in thesecurrencies. A strengthening or weakening of the Canadian dollarcompared to the U.S. dollar, British pound and the Euro could reduceor increase, as applicable, the translated value of our foreign currencydenominated revenue, expenses and earnings and could have asignificant effect on the results of our operations. We are alsoexposed to foreign exchange rate risk arising from our investments inforeign operations. For un-hedged equity investments, when theCanadian dollar appreciates against other currencies, the unrealizedtranslation losses on net foreign investments decreases ourshareholders’ equity through the cumulative translation account anddecreases the translated value of the RWA of the foreign currency-denominated operations. The reverse is true when the Canadiandollar depreciates against other currencies. Consequently, weconsider these impacts in selecting an appropriate level of ourinvestments in foreign operations to be hedged.
Our overall market risk objectives, policies and methodologieshave not changed materially from 2009.
Liquidity and funding management
Liquidity and funding risk (liquidity risk) is the risk that we may beunable to generate or obtain sufficient cash or its equivalent in atimely and cost-effective manner to meet our commitments as theycome due.
Our liquidity position is established to satisfy our current andprospective commitments while also contributing, in conjunctionwith our capital position, to our safety and soundness in times ofstress. To achieve these goals, we operate under a comprehensiveliquidity management framework and employ key liquidity riskmitigation strategies that include the maintenance of:• An appropriate balance between the level of risk we undertake
and the cost of its mitigation that takes into account thepotential impact of extreme but plausible events.
• Broad funding access, including preserving and promoting areliable base of core client deposits, continual access todiversified sources of wholesale funding and demonstratedcapacities to monetize specific asset classes.
• A comprehensive enterprise-wide liquidity contingency planthat is supported by an earmarked pool of unencumberedmarketable securities that provide assured access to cash in acrisis.
• Appropriate and transparent liquidity transfer pricing and costallocation.
Our liquidity management policies, practices and processesreinforce these risk mitigation strategies. In managing liquidity risk,we favour a centralized management approach but variousconsiderations outlined in this section influence the extent to whichthis can be pursued.
Management’s Discussion and Analysis Royal Bank of Canada: Annual Report 2010 45

Risk measurementA variety of limit-based measures and metrics have been estab-lished to monitor and control risk within appropriate tolerancesusing a variety of time horizons and severity of stress levels. Riskmethodologies and underlying assumptions are periodicallyreviewed and validated to ensure alignment with our operatingenvironment, expected economic and market conditions, ratingagency preferences, regulatory requirements and acceptedpractices. We measure and manage our liquidity position from threerisk perspectives as follows:
Structural (longer-term) liquidity riskWe use cash capital and other structural metrics, which focus onmismatches in effective maturity between all assets and liabilities,to measure and control balance sheet risk and to assist in thedetermination of our term funding strategy. Stressed conditions areconsidered, including a protracted loss of unsecured wholesaledeposits that fund illiquid assets.
Tactical (shorter-term) liquidity riskWe apply net cash flow limits in Canadian dollar and foreigncurrencies for key short-term time horizons (overnight to nineweeks) under various stages of stress and assign a risk-adjustedlimit to our aggregate pledging exposure and individual limits bytypes of pledging activities to measure our shorter-term liquidityexposures. Net cash flow positions reflect known and anticipatedcash flows for all material unencumbered assets, liabilities andoff-balance sheet activities. Pledged assets are not considered asource of available liquidity. We also control this risk by adhering tovarious prescribed regulatory standards.
Contingency liquidity riskContingency liquidity risk management assesses the impact of andour intended responses to sudden stressful events. Our liquiditycontingency plan, maintained and administered by CorporateTreasury, guides our actions and responses to liquidity crises. TheLiquidity Crisis Team, consisting of senior representatives withrelevant subject matter expertise from key business segments andCorporate Support, contributes to the development of stress tests andfunding plans and meets regularly to conduct stress tests and reviewliquidity contingency preparedness.
Our stress testing exercises, which include elements of scenarioand sensitivity testing, are based on models that measure ourpotential exposure to global, country-specific or RBC-specific events(or a combination thereof), consider both historical and hypotheticalevents and cover a nine week period consistent with our key tacticalliquidity risk measure and our view of the most critical time span forsuch events. Different levels of severity are considered for each typeof crisis. Key tests are run monthly, while others are run quarterly.Frequency is determined by considering a combination of likelihoodand impact. After reviewing test results, the liquidity contingency planand other liquidity and funding risk management practices and limitsmay be modified. The risk of more prolonged crises is addressedthrough our measures of structural liquidity risk that assume astressed environment.
Our liquid assets are primarily a diversified pool of highly ratedand liquid marketable securities and include segregated portfolios (inboth Canadian and U.S. dollars) of contingency liquidity assets toaddress potential on- and off-balance sheet liquidity exposures (suchas deposit erosion, loan drawdowns and higher collateral demands),that have been sized through models we have developed or by thescenario analyses and stress tests we conduct periodically. Theseportfolios are subject to minimum asset levels and strict eligibilityguidelines to ensure ready access to cash in emergencies, includingtheir eligibility for central bank advances.
Risk governance and controlThe Board of Directors approves delegation of liquidity risk approvalauthorities annually to senior management. The Audit Committee andthe Conduct Review and Risk Policy Committee of the Board annuallyapprove the liquidity management framework and are responsible forits oversight. The Board of Directors and these committees alsoreview, on a regular basis, reporting on RBC’s enterprise-wideliquidity position and status. Group Risk Committee (GRC) and ALCOshare management oversight responsibility and review all liquiditydocuments prepared for the Board of Directors or its committees.ALCO annually approves the liquidity management framework’s keysupporting documents and provides strategic direction and primarymanagement oversight to Corporate Treasury, other functions andbusiness platforms in the area of liquidity risk management. Tomaximize funding and operational efficiencies, we monitor andmanage our liquidity position on a consolidated basis and for keyunits and consider market, legal, regulatory, tax, operational and anyother applicable restrictions. This includes analyzing our ability tolend or borrow funds between branches, branches and subsidiaries,and subsidiaries, and converting funds between currencies.
PoliciesOur principal liquidity policies define risk tolerance parameters. Theyauthorize senior management committees or Corporate Treasury toapprove more detailed policies and limits that govern management,measurement and reporting requirements for specific businesses andproducts.
Authorities and limitsLimits for our structural liquidity risk positions are approved at leastannually and measured and monitored, monthly or quarterly. Netcash flow limits are approved at least annually. Depending on themateriality of each reporting entity, net cash flow limits are monitoreddaily or weekly by major currency, branches, subsidiaries andgeographic locations. Any potential exceptions to established limitsare reported immediately to Corporate Treasury, which provides orarranges for approval after reviewing a remedial action plan.
The liquidity factors for cash flow assets and liabilities undervarying conditions are reviewed periodically by Corporate Treasury inconcert with GRM and the business segments to determine if theyremain valid or changes to assumptions and limits are required.Through this process, we ensure that a close link is maintainedbetween the management of liquidity and funding risk, marketliquidity risk and credit risk, including GRM approval of credit linesbetween entities. In response to our experience during the volatilemarkets of the past two years, we have modified the liquiditytreatment of certain asset classes to reflect our expectations thatmarket liquidity for these products will remain impaired for sometime. Where required, limits have been reduced in consideration ofthe results of updated stress tests. During the fiscal year, OSFIintroduced a regulatory enterprise liquidity metric, which we formallyreport to OSFI on a monthly basis and monitor intra-month.
FundingFunding strategyCore funding, comprising capital, longer-term liabilities and adiversified pool of personal and, to a lesser extent, commercial andinstitutional deposits, is the foundation of our structural liquidityposition. Our wholesale funding activities are well diversified bygeographic origin, investor segment, instrument, currency, structureand maturity. We maintain an ongoing presence in different fundingmarkets, which allows us to constantly monitor market developmentsand trends, identify opportunities and risks and take appropriate andtimely actions. We operate longer-term debt issuance programs inCanada, the U.S., Europe, Australia and Japan. Expansion into newmarkets and untapped investor segments is constantly evaluatedagainst relative issuance costs since diversification expands ourwholesale funding flexibility and minimizes funding concentrationand dependency, and generally reduces financing costs. Maintainingcompetitive credit ratings is also critical to cost-effective funding.
46 Royal Bank of Canada: Annual Report 2010 Management’s Discussion and Analysis

Credit ratingsOur ability to access unsecured funding markets and to engage incertain collateralized business activities on a cost-effective basis isprimarily dependent upon maintaining competitive credit ratings. Ourcredit ratings are largely determined by the quality of our earnings,the adequacy of our capital and the effectiveness of our riskmanagement programs. There can be no assurance that our creditratings and rating outlooks will not be lowered or that rating agencieswill not issue adverse commentaries about us, potentially resulting inadverse consequences for our funding capacity or access to capitalmarkets. A lowering of our credit ratings may also affect our ability,and the cost, to enter into normal course derivative or hedgingtransactions and may require us to post additional collateral undercertain contracts. However, we estimate, based on periodic reviews ofratings triggers embedded in our existing businesses and of ourfunding capacity sensitivity, that a minor downgrade would notmaterially influence our liability composition, funding access,collateral usage and associated costs. For a discussion on thepotential impact of a downgrade on certain derivative instruments,see Note 31, Reconciliation of the application of Canadian and UnitedStates generally accepted accounting principles – Fair value ofderivatives by major types of products.
On September 14, 2010 we were placed on review for possibledowngrade by Moody’s. During its review Moody’s will focus ongaining a better understanding of our capital markets business andour growth plans for the business. Moody’s is expected to announcethe results of its review in mid-December 2010.
The following table presents our major credit ratings and outlookas at December 2, 2010:
Credit ratings* Table 46
As at December 2, 2010 (1)
Short-term debt
Senior long-term debt Outlook
Moody’s P-1 Aaa UR (neg)S&P A-1+ AA- positiveFitch F1+ AA stableDBRS R-1(high) AA stable
* This table represents an integral part of our 2010 Annual Consolidated FinancialStatements.
(1) Credit ratings are not recommendations to purchase, sell or hold a financial obligationinasmuch as they do not comment on market price or suitability for a particular investor.Ratings are subject to revision or withdrawal at any time by the rating organization.
Deposit profileOur personal deposit franchise constitutes the principal source ofreliable funding while certain commercial and institutional clientgroups also maintain relational balances with low volatility profiles.Taken together, these clients represent a highly stable supply of coredeposits in most conceivable environments as they typically are lessresponsive to market developments than transactional lenders andinvestors due to the impact of deposit insurance and extensive and,at times, exclusive relationships with us. Core deposits, consisting ofour own statistically derived estimates of the highly stable portions ofall of our relational personal, commercial and institutional balances(demand, notice and fixed-term) together with wholesale fundsmaturing beyond one year were unchanged during the year at 63% ofour total deposits.
Term funding sources* Table 47
(C$ millions) 2010 2009 2008
Long-term funding outstanding $ 61,224 $58,831 $ 70,906Total mortgage-backed securities sold 28,238 28,815 15,196Commercial mortgage-backed securities sold 1,705 1,916 2,159Credit card receivables financed through
notes issued by a securitization specialpurpose entity 2,850 2,913 3,163
* This table represents an integral part of our 2010 Annual Consolidated FinancialStatements.
During 2010, we continued to expand our long-term funding base byselectively issuing, either directly or through our subsidiaries,$21.5 billion of senior deposit notes in various currencies andmarkets. Total long-term funding outstanding increased by$3.2 billion. Outstanding senior debt containing ratings triggers,which would accelerate repayment, constitutes a very smallproportion of our overall outstanding debt of $62 billion.
Other liquidity and funding sourcesWe use residential mortgage, commercial mortgage and credit cardreceivable-backed securitization programs as alternative sources offunding and for liquidity and asset/liability management purposes.We hold retained interests in our residential mortgage and credit cardsecuritization programs. Our total outstanding mortgage backedsecurities sold decreased year over year by $577 million. Our creditcard receivables, which are financed through notes issued by asecuritization special purpose entity, decreased year over year by$63 million. For further details, refer to the Off-balance sheetarrangements section and Note 5 to our 2010 Annual ConsolidatedFinancial Statements.
Impact of global market developments on liquidity managementDuring 2010, public sector initiatives introduced to facilitate bankfinancing requirements during late 2008 and 2009 that were relevantto our funding activities were all discontinued as term market accessfor non-government guaranteed bank names improved materially.While bank financing markets generally improved, we continued toexperience more favourable wholesale funding access and pricingcompared both to peers and to the prior year and opportunisticallyexecuted longer-term issues into this much better funding environ-ment. We also continued to focus on aggressively building our coredeposit base. Regulatory reforms, including global minimum liquiditystandards, directed at strengthening the global banking system wereannounced and refined during the year and will be implemented overthe coming years. The liquidity measures are subject to monitoring orobservation periods prior to becoming minimum standards.
We maintained a liquidity and funding position that we continueto believe is appropriate to execute our strategy, and levels ofliquidity and funding risk remain well within our risk appetite.
Our liquidity and funding risk objectives, policies and methodologieshave not changed materially from 2009. However, certain limits andstrategies have been revised as a result of the market conditions andevolving regulatory standards.
Contractual obligationsIn the normal course of business, we enter into contracts that giverise to commitments of future minimum payments that affect ourliquidity. Depending on the nature of these commitments, theobligation may be recorded on- or off-balance sheet. The followingtable provides a summary of our future contractual fundingcommitments.
Contractual obligations* Table 48
2010 2009 2008
As at October 31(C$ millions) (1)
Within 1year
1 to 3years
3 to 5years
Over 5years Total Total Total
Unsecured long-term funding $17,563 $18,222 $ 8,789 $ 9,469 $54,043 $52,416 $58,615Covered bonds 207 3,025 3,334 1,890 8,456 5,740 5,248Subordinated debentures 108 – 199 6,482 6,789 6,564 8,258Obligations under leases (2) 572 965 700 1,123 3,360 3,362 3,196
$18,450 $22,212 $13,022 $18,964 $72,648 $68,082 $75,317
* This table represents an integral part of our 2010 Annual Consolidated Financial Statements.(1) The amounts presented above exclude accrued interest except for the category “Within 1 year.”(2) Substantially all of our lease commitments are operating.
Management’s Discussion and Analysis Royal Bank of Canada: Annual Report 2010 47
Overview of other risks
Operational risk
Operational risk is the risk of loss or harm resulting from inadequateor failed internal processes, people and systems or from externalevents.
Operational risk is embedded in all our activities, including thepractices and controls used to manage other risks. Failure to manageoperational risk can result in direct or indirect financial loss, reputa-tional impact, regulatory censure, or failure in the management ofother risks such as credit or market risk.
Operational risk is difficult to measure in a complete and precisemanner, given that exposure to operational risk is often implicit,bundled with other risks, or otherwise not taken on intentionally. Inthe banking industry, measurement tools and methodologiescontinue to evolve. The two options available to us under Basel II arethe Advanced Measurement Approach (AMA) and the StandardizedApproach. We continued to adopt the Standardized Approach foroperational risk and expect to implement the Advanced MeasurementApproach in 2013.
Operational risk is managed through our infrastructure, controls,systems and people, complemented by central groups focusing onenterprise-wide management of specific operational risks such asfraud, privacy, outsourcing, and business disruption, as well aspeople and systems risks. Specific programs, policies, standards andmethodologies have been developed to support the management ofOperational risk. These programs are (i) Risk and control assessment,(ii) Operational event data collection and analysis, (iii) Industry lossanalysis, and (iv) Key risk indicators.
Strategic risk
Strategic risk is the risk that the enterprise or particular businessareas will make inappropriate strategic choices, or will be unable tosuccessfully implement selected strategies or related plans anddecisions. For example, failure to successfully integrate and retainclients and key employees from our strategic acquisitions or jointventures may adversely affect our financial performance.
Oversight of strategic risk is the responsibility of the heads ofthe business segments, the Enterprise Strategy Office, GroupExecutive, and the Board of Directors. Management of strategic risk issupported by the Enterprise Strategy Group through the use of anenterprise strategy framework that synthesizes business portfoliostrategies with the enterprise vision.
Regulatory and legal risk
Regulatory and legal risk is the risk of negative impact to businessactivities, earnings or capital, regulatory relationships or reputationas a result of failure to comply with or a failure to adapt to current andchanging regulations, law, industry codes or rules, regulatoryexpectations, or ethical standards.
Laws and regulations are in place to protect the financial andother interests of our clients, investors and the public. Changes tolaws, including tax laws, regulations or regulatory policies, as well asthe changes in how they are interpreted, implemented or enforced,could adversely affect us, for example by lowering barriers to entry inthe businesses in which we operate or increasing our costs ofcompliance. Further, there is no assurance that we always will be orwill be deemed to be in compliance with laws, regulations orregulatory policies. Accordingly, it is possible that we could receive ajudicial or regulatory judgment or decision that results in fines,damages, and other costs or injunctions or loss of licenses orregistrations that would damage our reputation and negatively impacton our earnings. In addition, we are subject to litigation arising in theordinary course of our business and the adverse resolution of anylitigation could have a material adverse effect on our results or couldgive rise to significant reputational damage, which in turn couldimpact our future business prospects.
Global Compliance has developed a comprehensive enterprisecompliance management (ECM) framework that is consistent with -regulatory guidance from OSFI and other regulators. The framework isdesigned to promote the proactive, risk-based management ofcompliance and regulatory risk. It applies to all of our businesses andoperations, legal entities and employees globally, and confirms theshared accountability of all our employees for ensuring we maintainrobust and effective regulatory risk and compliance controls. Withinthe ECM framework there are five elements that drive themanagement of regulatory risk. The first element sets the cycle inmotion by defining the nature of our business activities andoperations. The second element ensures compliance programs aredesigned in a manner to most effectively meet regulatory require-ments. The third and fourth elements relate to the design andimplementation of specific controls and the associated monitoringand oversight of the effectiveness of those controls. This approachallows us to take an enterprise-wide and holistic view of allcompliance programs. The fifth element ensures the timely escalationand resolution of issues, and clear and transparent reporting. This is acritical step in enabling senior management and the Board ofDirectors to effectively perform their management and oversightresponsibilities.
We have a strong ethical and compliance culture grounded in ourCode of Conduct which broadly addresses a variety of ethical andlegal concerns that face our employees on a day-to-day basis. Weregularly review and update the Code to ensure that it continues tomeet the expectations of regulators and other stakeholders. All ouremployees must reconfirm their understanding of and commitment tocomply with the Code of Conduct at least every two years, andemployees in certain key roles, such as Group Executive and others infinancial oversight roles, must do so annually.
Our Code of Conduct is supported by a number of global andregional compliance policies, training programs, online tools, jobaids, and new employee orientation materials. We also have severalother core ethics and compliance courses that apply enterprise wideor to a significant number of businesses globally including anti-money laundering and anti-terrorist financing, anti-bribery and anti-corruption, privacy and information risk management.
Reputation risk
Reputation risk is the risk that an activity undertaken by anorganization or its representatives will impair its image in thecommunity or lower public confidence in it, resulting in the loss ofbusiness, legal action or increased regulatory oversight.
Reputation risk can arise from a number of events and primarilyoccurs in connection with regulatory, legal and operational risks.Operational failures and non-compliance with laws and regulationscan have a significant reputational impact on us.
The following principles guide our management of reputationrisk:• We must operate with integrity at all times in order to sustain a
strong and positive reputation.• Protecting our reputation is the responsibility of all our
employees, including senior management and extends to allmembers of the Board of Directors.
Insurance risk
Insurance risk is the exposure to potential financial loss arising frompayments that are different than anticipated (e.g. number, amount ortiming) under an insurance policy or reinsurance treaty. Insurance riskis primarily associated with adverse experience with respect tomortality, morbidity, longevity, claim frequency, claim severity,policyholder behaviour, and expense. Insurance risk is furthercategorized into the following sub-risks:
Claims RiskClaims risk represents the risk that the actual severity, frequency ortiming of claims differs from the levels assumed in pricing calcu-
48 Royal Bank of Canada: Annual Report 2010 Management’s Discussion and Analysis

lations or reserves. Claims risk may be realized in two ways: 1) Pricingrisk – the mis-estimation of expected claims activities relative toactual activities or, 2) Underwriting risk – the strategy and/or criteriafor underwriting the risk are not aligned with the estimate for theamount, frequency, and/or timing of claims. Types of claims riskinclude mortality risk, longevity risk, morbidity risk, home and autorisk, and travel risk.
Policyholder Behaviour Risk (Lapse Risk)The risk that the actual behaviour of policyholders relating topremium payments, policy withdrawals or loans, policy lapses,surrenders, and the exercise of other policy options differ from thebehaviour assumed in pricing calculations or reserves.
Expense RiskThe risk that the expense of acquiring or administering policies, or ofprocessing claims, exceeds the costs assumed in pricing calculations.
We have policies and procedures that support the managementof insurance risk through the establishment of risk approval author-ities and limits, independent risk oversight and approval byGRM-Insurance and risk mitigation, which include identifying,assessing and managing insurance risk through a risk review andapproval process.
Environmental risk
Environmental risk is the risk of loss to financial, operational orreputational value resulting from the impact of environmental issues.Environmental risk arises from our business activities and ouroperations. For example, the environmental issues associated withour clients’ purchase and sale of contaminated property ordevelopment of large-scale projects may give rise to credit andreputation risk. Operational and legal risks may arise from environ-mental issues at our branches, offices or data processing centres.
Corporate Environmental Affairs (CEA) sets enterprise-widepolicy requirements for the identification, assessment, control,monitoring and reporting of environmental risk. Oversight is providedby Group Executive and the Corporate Governance and Public PolicyCommittee of the Board of Directors. Business segments andCorporate Support groups are responsible for incorporatingenvironmental risk management requirements and controls withintheir operations. The CEA Group also provides advisory services andsupport to business segments on the management of specificenvironmental risks in business transactions.
The magnitude of environmental risk associated with businessactivities is a function of several factors including: the industry sector,the type and size of the transaction, the ability of the borrower tomanage environmental matters, and whether real property is taken ascollateral. We manage environmental risk by maintaining anenvironmental management system, including policies, managementand mitigation strategies, training, communication, and reporting.Our Corporate Environmental Policy articulates our overarchingenvironmental commitments.
We maintain a suite of environmental credit risk managementpolicies including sector-specific and business-segment-specificpolicies and guidelines. For example, we have a Policy on Social andEnvironmental Review in Project Finance to reflect our commitment tothe Equator Principles. Periodically, we verify that our environmentalrisk management policies and processes are operating as intended.On an annual basis, and more frequently as required, environmentalrisk management activities, issues, and trends are reported to GE andto the CG&PPC of the Board of Directors. In addition, CEA maintainsongoing communication on environmental risk management issueswith stakeholders, both internal and external to the organization. Wereport on the full extent of environmental management annually inthe Corporate Responsibility Report and Public AccountabilityStatements.
Other risk factors
In addition to the risks described above, there are numerous otherrisk factors as described below, that could cause our results to differsignificantly from our plans, objectives and estimates. Forward-looking statements in this document include, but are not limited to,statements relating to our financial performance objectives, ourvision and strategic goals, the Economic, market and regulatoryreview and outlook for the Canadian, U.S. and global economies, theoutlook and priorities for each of our business segments and in ourLiquidity and funding risk section, and are presented for the purposeof assisting the holders of our securities and financial analysts inunderstanding our financial position and results of operations as atand for the periods ended on the dates presented and our vision andstrategic goals and objectives, and may not be appropriate for otherpurposes.
We caution that the discussion of risk factors, many of which arebeyond our control, is not exhaustive and other factors could alsoadversely affect our results. When relying on our forward-lookingstatements to make decisions with respect to us, investors and othersshould carefully consider the foregoing and following factors, otheruncertainties and potential events, and other industry- and bank-specific factors that may adversely affect our future results and themarket valuation placed on our common shares. Unless required bylaw, we do not undertake to update any forward-looking statement,whether written or oral, that may be made from time to time by us oron our behalf.
General business and economic conditions in Canada, the U.S. andother countries in which we conduct businessOur earnings are significantly affected by the general business andeconomic conditions in the geographic regions in which we operate.These conditions include consumer saving and spending habits aswell as consumer borrowing and repayment patterns, businessinvestment, government spending, the level of activity and volatilityof the capital markets and inflation. For example, an economicdownturn in a country may result in high unemployment and lowerfamily income, corporate earnings, business investment andconsumer spending, and could adversely affect the demand for ourloan and other products. In addition, our provision for credit losseswould likely increase, resulting in lower earnings.
Changes in accounting standards and accounting policies andestimatesFrom time to time, the Accounting Standards Board (AcSB) changesthe financial accounting and reporting standards that govern thepreparation of our financial statements. These changes can bedifficult to anticipate and can materially impact how we record andreport our financial condition and results of operations. In someinstances, we may be required to retroactively apply a new or revisedstandard that results in our restating prior period financial state-ments. Significant accounting policies are described in Note 1 to our2010 Annual Consolidated Financial Statements.
We are required to adopt International Financial ReportingStandards (IFRS) commencing November 1, 2011. For further detailson our future adoption of IFRS refer to the Accounting and controlmatters section.
Government fiscal, monetary and other policiesOur businesses and earnings are affected by the fiscal, monetary orother policies that are adopted by the Bank of Canada and variousother Canadian regulatory authorities, the Board of Governors of theFederal Reserve System in the U.S. and other U.S. governmentauthorities, as well as those adopted by international regulatoryauthorities and agencies, in jurisdictions in which we operate. Aswell, such policies can adversely affect our clients and counterpartiesin Canada, the United States and internationally, which may increasethe risk of default by such clients and counterparties.
Management’s Discussion and Analysis Royal Bank of Canada: Annual Report 2010 49

Level of competitionThe competition for clients among financial services companies in themarkets in which we operate is intense. Client loyalty and retentioncan be influenced by a number of factors, including relative servicelevels, the prices and attributes of our products or services, ourreputation and actions taken by our competitors. Other financialservices companies, such as insurance companies and non-financialcompanies, are increasingly offering services traditionally provided bybanks. Such competition could also reduce net interest income, feerevenue and adversely affect our earnings.
Ability to attract and to retain employeesCompetition for qualified employees is intense within the financialservices industry and from non-financial industries looking to recruit.If we are unable to retain and attract qualified employees, our resultsof operations and financial condition, including our competitiveposition, may be materially adversely affected.
Accuracy and completeness of information on clients andcounterpartiesWhen deciding to extend credit or enter into other transactions withclients and counterparties, we may rely on information provided by oron behalf of clients and counterparties, including audited financialstatements and other financial information. We also may rely onrepresentations of clients and counterparties as to the completenessand accuracy of that information. Our financial results could beadversely impacted if the financial statements and other financial
information relating to clients and counterparties on whom we rely donot comply with GAAP or are materially misleading.
Development and integration of our distribution networksAlthough we regularly explore opportunities to expand ourdistribution networks, either through acquisitions or organically byadding, for example, new bank branches, insurance offices, onlinesavings accounts and ATMs in high-growth, receptive markets inCanada, the U.S. and internationally, if we are not able to develop orintegrate these distribution networks effectively, our results ofoperations and financial condition may be negatively affected.
Other factorsOther factors that may affect actual results include changes ingovernment trade policy, the timely and successful development ofnew products and services, our ability to cross-sell more products tocustomers, technological changes and our reliance on third parties toprovide components of our business infrastructure, the failure of thirdparties to comply with their obligations to us and our affiliates assuch obligations relate to the handling of personal information, fraudby internal or external parties, the possible impact on our businessfrom disease or illness that affects local, national or globaleconomies, disruptions to public infrastructure, including trans-portation, communication, power and water, international conflictsand other political developments including those relating to the waron terrorism, and our success in anticipating and managing theassociated risks.
Capital management
We actively manage our capital to maintain strong capital ratios andhigh ratings while providing high returns to our shareholders. Weconsider the requirements of regulators, rating agencies, depositorsand shareholders, our business plans, peer comparisons and ourinternal capital ratio targets. Our goal is to optimize our capital usageand structure, and provide support for our business segments andclients and better returns for our shareholders, while protectingdepositors and senior creditors.
Capital management frameworkOur capital management framework provides the policies andprocesses for defining, measuring, raising and investing all types ofcapital in a co-ordinated and consistent manner. We manage andmonitor capital from several perspectives, including regulatorycapital, economic capital and subsidiary capital.
Within our capital management framework, we have an internalcapital adequacy assessment process (ICAAP) that sets internalcapital targets and defines strategies for achieving those targetsconsistent with our Risk Appetite, business plans and operatingenvironment.
As part of this process, we have implemented a program ofenterprise-wide stress testing to evaluate the income and capital(economic and regulatory) impacts of several potential stress events.This exercise involves various teams, including GRM, CorporateTreasury, Finance and Economics. Results are a key input into ourcapital planning process and are used in setting appropriate internalcapital targets.
The Board of Directors is responsible for ultimate oversight ofcapital management, including the annual review and approval of ourCapital Plan and ICAAP. The Audit Committee is responsible for thegovernance of capital management, which includes; approval ofcapital management policies, regular review of our capital positionand management processes, approval of ICAAP, and ongoing reviewof internal controls over financial reporting.
The ALCO and Group Executive share management oversightresponsibility for capital management and receive regular reportsdetailing compliance with established limits and guidelines.
Basel IIThe top corporate entity to which Basel II applies at the consolidatedlevel is Royal Bank of Canada.
Under Basel II, banks select from among alternative approachesto calculate their minimum regulatory capital required to underpincredit, market and operational risks.
Effective November 1, 2007, we adopted the Basel II AdvancedInternal Ratings Based (AIRB) approach to calculate credit risk capitalfor consolidated regulatory reporting purposes.
While the majority of our exposures are reported under the AIRBApproach, certain portfolios considered non-material from aconsolidated perspective continue to use the Basel II StandardizedApproach for credit risk (for example, our Caribbean Bankingoperations). In addition, the Standardized Approach will continue tobe used for specific portfolios until fiscal 2012 for RBC Bank (USA),and RBC Dexia IS, of which we have a 50% ownership interest.
We continue to use the Standardized Approach for consolidatedregulatory reporting of capital for operational risk.
For consolidated regulatory reporting of market risk capital, weuse both Internal Model and Standardized Approaches.
Regulatory capital, risk weighted assetsand capital ratios
Table 49
As at October 31 (C$ millions, except percentage andmultiple amounts) 2010 2009
CapitalTier 1 capital $ 33,972 $ 31,774Total capital 37,625 34,881
Risk-weighted assetsCredit risk $ 197,195 $ 185,051Market risk 24,828 23,321Operational risk 38,433 36,465
Total risk-weighted assets $ 260,456 $ 244,837
Capital ratiosTier 1 capital 13.0% 13.0%Total capital 14.4% 14.2%Assets-to-capital multiple 16.5X 16.3X
50 Royal Bank of Canada: Annual Report 2010 Management’s Discussion and Analysis

Regulatory capital and capital ratiosCapital levels for Canadian banks are regulated pursuant to guide-lines issued by OSFI, based on standards issued by the Bank forInternational Settlements, Basel Committee on Banking Supervision.Regulatory capital is allocated to two tiers: Tier 1 and Tier 2. Tier 1capital comprises the highest quality capital and is a core measure ofa bank’s financial strength. Tier 1 capital consists of more permanentcomponents of capital, is free of mandatory fixed charges againstearnings and has a subordinate legal position to the rights ofdepositors and other creditors of the financial institution. Tier 2capital is composed of supplementary capital instruments thatcontribute to the overall strength of a financial institution as a goingconcern. Total capital is defined as the sum of Tier 1 and Tier 2capital. The components of Tier 1 and Tier 2 capital are listed inTable 50. For further details on the terms and conditions of thevarious capital components, refer to the Selected share data sectionand Notes 16, 17 and 18 to our 2010 Annual Consolidated FinancialStatements.
Regulatory capital ratios are calculated by dividing Tier 1 andTotal capital by RWA. OSFI formally establishes risk-based capitaltargets for deposit-taking institutions in Canada. These targets arecurrently a Tier 1 capital ratio greater than or equal to 7% and a Totalcapital ratio of greater than or equal to 10%. Canadian banks are alsorequired to ensure that their assets-to-capital multiple, which iscalculated by dividing gross adjusted assets by Total capital, does notexceed a maximum level prescribed by OSFI.
Basel III regulatory capital and capital ratiosAs noted in the Economic, market and regulatory review and outlooksection, the capital reforms known as Basel III will redefine Tier 1capital to consist of predominantly common shares and retainedearnings. There will be new deductions from common equity –including intangible assets, defined benefit pension fund assets andinvestments in common equity of other financial institutions. Alsochanges in counterparty credit risk and treatment of securitizationrelated exposures will result in higher RWA.
Further, the Basel Committee proposes to increase the minimumcapital requirements for common equity and Tier 1 capital from 2% to4.5% and 4% to 6% respectively.
In addition, banks will be required to hold capital buffers to helpwithstand future periods of stress. A capital conservation buffer of2.5% (to be met with common equity) will bring total common equityrequirements to 7%. A countercyclical buffer of up to 2.5% ofcommon equity or other fully loss absorbing capital may also berequired in periods of excess aggregated credit growth. This bufferwill be implemented according to national circumstances and subjectto national supervisory discretion. The minimum Total capitalrequirement will be 8%, with a capital conservation buffer of 2.5%.
A framework requiring systemically important financialinstitutions to have additional loss absorption capacity beyond theBasel III standards has also been proposed.
The common equity and Tier 1 capital rules are expected to bephased-in from January 2013, with the capital conservation bufferphased-in between January 2016 and January 2019.
Based on our current strong capital position, we expect to meetthe Basel III requirements within the established timelines. We willcontinue to be proactive and make the optimal decisions to mitigatethe impact these requirements will have on our business.
Capital Table 50
As at October 31 (C$ millions) 2010 2009Tier 1 regulatory capital
Common shares $ 13,287 $ 12,959Contributed surplus 236 246Retained earnings 22,706 20,585Net after tax fair value losses arising from
changes in institutions’ own credit risk (17) (9)Foreign currency translation adjustments (1,685) (1,374)Net after tax unrealized holding loss on available-
for-sale equity securities – (68)Non-cumulative preferred shares 4,810 4,811Innovative capital instruments 3,327 3,991Other non-controlling interests in subsidiaries 351 353Goodwill (8,064) (8,368)Substantial investments (101) (148)Securitization-related deductions (810) (1,172)Investment in insurance subsidiaries (29) (13)Expected loss in excess of allowances – AIRB
Approach (39) (19)
Total Tier 1 capital $ 33,972 $ 31,774
Tier 2 regulatory capitalPermanent subordinated debentures $ 863 $ 878Non-permanent subordinated debentures (1) 5,778 5,583Net after tax unrealized gain on available-for-sale
equity securities 12 –Trust subordinated notes 1,023 1,017General allowance 517 575Substantial investments (101) (147)Investment in insurance subsidiaries (3,607) (3,628)Securitization-related deductions (792) (1,150)Expected loss in excess of allowances – AIRB
Approach (39) (20)Other (1) (1)
Total Tier 2 capital $ 3,653 $ 3,107
Total regulatory capital $ 37,625 $ 34,881
(1) Subordinated debentures that are within five years of maturity are subject to straight-line amortization to zero during their remaining term and, accordingly, are included attheir amortized value.
Tier 1 capital ratio (1)
2010 2009 2008 200620070%
15%
12%
9%
6%
3%
Basel IBasel II
9.6%9.4%9.0%
13.0%13.0%
(1) Basel I and Basel II Tier 1 capital ratios are not directly comparable.
Our capital position remained strong in 2010 primarily throughinternal capital generation from earnings and the issuance ofadditional regulatory capital for general business purposes. Ourcapital ratios remain well above OSFI regulatory capital targets.
As at October 31, 2010, our Tier 1 capital ratio was 13.0% andour Total capital ratio was 14.4%.
Our Tier 1 capital ratio was unchanged from the previous year, asadditional capital from earnings generation and lower securitizationrelated deductions were largely offset by higher RWA and theredemption of innovative Tier 1 capital instruments.
Our Total capital ratio was up 20bps primarily due to the factorsdiscussed under Tier 1 capital and the net issuance of subordinateddebentures.
As at October 31, 2010, our assets-to-capital multiple was16.5 times compared to 16.3 times a year ago. Our assets-to-capitalmultiple remains below the maximum level prescribed by OSFI.
Management’s Discussion and Analysis Royal Bank of Canada: Annual Report 2010 51
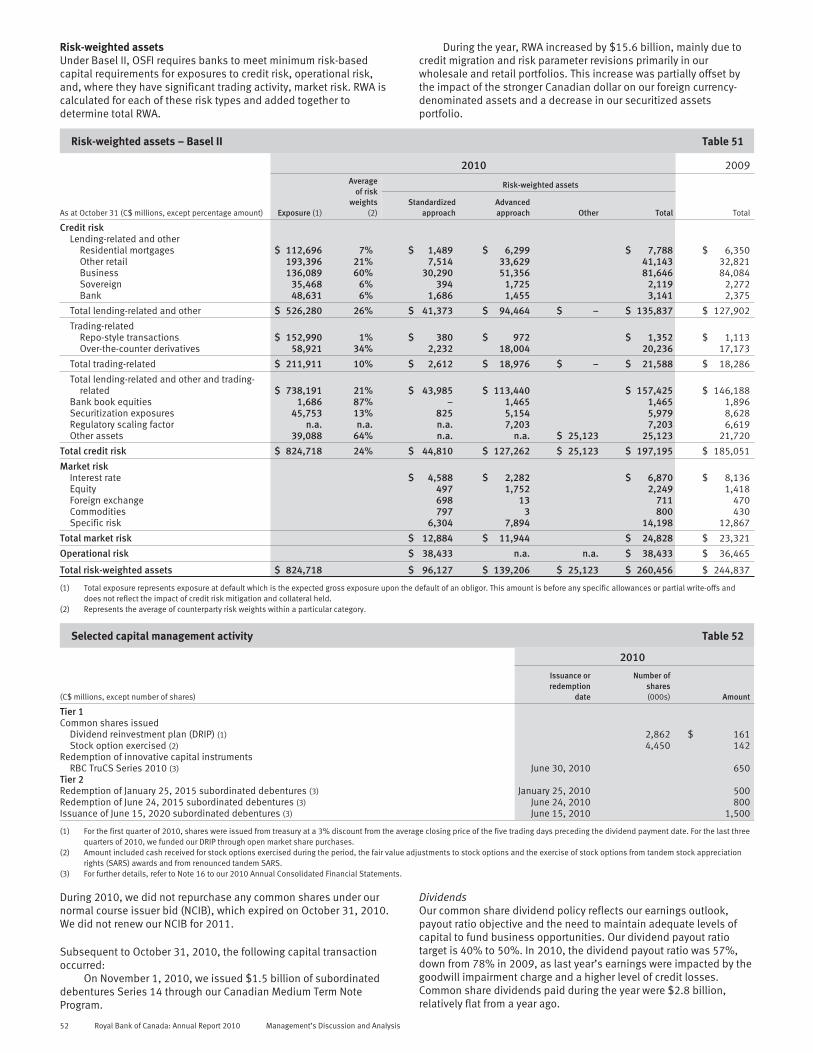
Risk-weighted assetsUnder Basel II, OSFI requires banks to meet minimum risk-basedcapital requirements for exposures to credit risk, operational risk,and, where they have significant trading activity, market risk. RWA iscalculated for each of these risk types and added together todetermine total RWA.
During the year, RWA increased by $15.6 billion, mainly due tocredit migration and risk parameter revisions primarily in ourwholesale and retail portfolios. This increase was partially offset bythe impact of the stronger Canadian dollar on our foreign currency-denominated assets and a decrease in our securitized assetsportfolio.
Risk-weighted assets – Basel II Table 51
2010 2009
Exposure (1)
Averageof risk
weights(2)
Risk-weighted assets
TotalAs at October 31 (C$ millions, except percentage amount)Standardized
approachAdvancedapproach Other Total
Credit riskLending-related and other
Residential mortgages $ 112,696 7% $ 1,489 $ 6,299 $ 7,788 $ 6,350Other retail 193,396 21% 7,514 33,629 41,143 32,821Business 136,089 60% 30,290 51,356 81,646 84,084Sovereign 35,468 6% 394 1,725 2,119 2,272Bank 48,631 6% 1,686 1,455 3,141 2,375
Total lending-related and other $ 526,280 26% $ 41,373 $ 94,464 $ – $ 135,837 $ 127,902
Trading-relatedRepo-style transactions $ 152,990 1% $ 380 $ 972 $ 1,352 $ 1,113Over-the-counter derivatives 58,921 34% 2,232 18,004 20,236 17,173
Total trading-related $ 211,911 10% $ 2,612 $ 18,976 $ – $ 21,588 $ 18,286
Total lending-related and other and trading-related $ 738,191 21% $ 43,985 $ 113,440 $ 157,425 $ 146,188
Bank book equities 1,686 87% – 1,465 1,465 1,896Securitization exposures 45,753 13% 825 5,154 5,979 8,628Regulatory scaling factor n.a. n.a. n.a. 7,203 7,203 6,619Other assets 39,088 64% n.a. n.a. $ 25,123 25,123 21,720
Total credit risk $ 824,718 24% $ 44,810 $ 127,262 $ 25,123 $ 197,195 $ 185,051
Market riskInterest rate $ 4,588 $ 2,282 $ 6,870 $ 8,136Equity 497 1,752 2,249 1,418Foreign exchange 698 13 711 470Commodities 797 3 800 430Specific risk 6,304 7,894 14,198 12,867
Total market risk $ 12,884 $ 11,944 $ 24,828 $ 23,321
Operational risk $ 38,433 n.a. n.a. $ 38,433 $ 36,465
Total risk-weighted assets $ 824,718 $ 96,127 $ 139,206 $ 25,123 $ 260,456 $ 244,837
(1) Total exposure represents exposure at default which is the expected gross exposure upon the default of an obligor. This amount is before any specific allowances or partial write-offs anddoes not reflect the impact of credit risk mitigation and collateral held.
(2) Represents the average of counterparty risk weights within a particular category.
Selected capital management activity Table 52
2010
(C$ millions, except number of shares)
Issuance orredemption
date
Number ofshares(000s) Amount
Tier 1Common shares issued
Dividend reinvestment plan (DRIP) (1) 2,862 $ 161Stock option exercised (2) 4,450 142
Redemption of innovative capital instrumentsRBC TruCS Series 2010 (3) June 30, 2010 650
Tier 2Redemption of January 25, 2015 subordinated debentures (3) January 25, 2010 500Redemption of June 24, 2015 subordinated debentures (3) June 24, 2010 800Issuance of June 15, 2020 subordinated debentures (3) June 15, 2010 1,500
(1) For the first quarter of 2010, shares were issued from treasury at a 3% discount from the average closing price of the five trading days preceding the dividend payment date. For the last threequarters of 2010, we funded our DRIP through open market share purchases.
(2) Amount included cash received for stock options exercised during the period, the fair value adjustments to stock options and the exercise of stock options from tandem stock appreciationrights (SARS) awards and from renounced tandem SARS.
(3) For further details, refer to Note 16 to our 2010 Annual Consolidated Financial Statements.
During 2010, we did not repurchase any common shares under ournormal course issuer bid (NCIB), which expired on October 31, 2010.We did not renew our NCIB for 2011.
Subsequent to October 31, 2010, the following capital transactionoccurred:
On November 1, 2010, we issued $1.5 billion of subordinateddebentures Series 14 through our Canadian Medium Term NoteProgram.
DividendsOur common share dividend policy reflects our earnings outlook,payout ratio objective and the need to maintain adequate levels ofcapital to fund business opportunities. Our dividend payout ratiotarget is 40% to 50%. In 2010, the dividend payout ratio was 57%,down from 78% in 2009, as last year’s earnings were impacted by thegoodwill impairment charge and a higher level of credit losses.Common share dividends paid during the year were $2.8 billion,relatively flat from a year ago.
52 Royal Bank of Canada: Annual Report 2010 Management’s Discussion and Analysis

Selected share data (1) Table 53
2010 2009 2008
(C$ millions, except number of shares and per share amounts)
Numberof shares
(000s) Amount
Dividendsdeclared
per share
Numberof shares
(000s) Amount
Dividendsdeclared
per share
Numberof shares
(000s) Amount
Dividendsdeclared
per share
Common shares outstanding 1,424,922 $ 13,378 $ 2.00 1,417,610 $ 13,075 $ 2.00 1,341,260 $ 10,384 $ 2.00First preferred shares outstanding
Non-cumulative Series N – $ – $ – – $ – $ – – $ – $ .88Non-cumulative Series W (2) 12,000 300 1.23 12,000 300 1.23 12,000 300 1.23Non-cumulative Series AA 12,000 300 1.11 12,000 300 1.11 12,000 300 1.11Non-cumulative Series AB 12,000 300 1.18 12,000 300 1.18 12,000 300 1.18Non-cumulative Series AC 8,000 200 1.15 8,000 200 1.15 8,000 200 1.15Non-cumulative Series AD 10,000 250 1.13 10,000 250 1.13 10,000 250 1.13Non-cumulative Series AE 10,000 250 1.13 10,000 250 1.13 10,000 250 1.13Non-cumulative Series AF 8,000 200 1.11 8,000 200 1.11 8,000 200 1.11Non-cumulative Series AG 10,000 250 1.13 10,000 250 1.13 10,000 250 1.13Non-cumulative Series AH 8,500 213 1.41 8,500 213 1.41 8,500 213 .81Non-cumulative Series AJ (3) 16,000 400 1.25 16,000 400 1.49 16,000 400 –Non-cumulative Series AL (3) 12,000 300 1.40 12,000 300 1.48Non-cumulative Series AN (3) 9,000 225 1.56 9,000 225 1.50Non-cumulative Series AP (3) 11,000 275 1.56 11,000 275 1.34Non-cumulative Series AR (3) 14,000 350 1.56 14,000 350 1.27Non-cumulative Series AT (3) 11,000 275 1.56 11,000 275 1.11Non-cumulative Series AV (3) 16,000 400 1.56 16,000 400 1.01Non-cumulative Series AX (3) 13,000 325 1.53 13,000 325 .87
Treasury shares – preferred (86) (2) (65) (2) (260) (5)Treasury shares – common (1,719) (81) (2,127) (95) (2,258) (104)Exchangeable shares of
RBC PH&N Holdings Inc. 6,413 324 6,413 324 6,750 324Stock options
Outstanding 15,659 17,877 21,773Exercisable 10,170 12,806 17,247
DividendsCommon 2,843 2,819 2,624Preferred 258 233 101
(1) For further details about our capital management activity, refer to Note 18 to our 2010 Annual Consolidated Financial Statements.(2) Effective February 24, 2010, we have the right to convert into common shares at our option, subject to certain restrictions.(3) Dividend rate will reset every five years.
As at November 29, 2010, the number of outstanding common sharesand stock options were 1,425,184,000 and 15,487,000, respectively.As at November 29, 2010, the number of Treasury shares – preferredand Treasury shares – common were 131,000 and 1,532,000,respectively. For further information about our share capital, refer toNotes 18 and 21 to our 2010 Annual Consolidated FinancialStatements.
Economic capitalEconomic capital is our internal quantification of risks associatedwith business activities which is the capital required to remainsolvent under extreme market conditions, reflecting our objective tomaintain a debt rating of at least AA. Economic capital is attributed toeach business segment in proportion to management’s assessmentof the risks. It allows for comparable performance measurementsamong our business segments through ROE and RORC as described inthe Key performance and non-GAAP measures section and also aidssenior management in determining resource allocation in conjunctionwith other factors.
Economic capital is also used to assess the adequacy of ourcapital base. Our policy is to maintain a level of available capital,defined as common equity and other capital instruments with equity-like permanence and loss absorption features such as preferredshares and Innovative Tier 1 instruments that exceed economiccapital with a comfortable cushion.
Economic capital is calculated and attributed on a wider array ofrisks than is Basel II Pillar I regulatory capital, which is calibratedpredominantly to target credit, market (trading) and operational riskmeasures. Economic capital is calculated based on credit, market(trading and non-trading), operational, business and fixed asset, andinsurance risks and includes capital attribution for goodwill and otherintangibles.• Business risk is the risk of loss or harm due to variances in
volumes, prices and costs caused by competitive forces,regulatory changes, reputation and strategic risks.
• Fixed asset risk is defined as the risk that the value of fixedassets will be less than their book value at a future date.
For further discussion on credit, market, operational andinsurance risks, refer to the relevant Risk management, and Overviewof other risks sections.
The calculation and attribution of economic capital involves a numberof assumptions and judgments by management which are monitoredto ensure that the economic capital framework remains compre-hensive and consistent. The models are benchmarked to leadingindustry practices via participation in surveys, reviews of method-ologies and ongoing interaction with external risk managementindustry professionals.
Economic capital Table 54
(C$ millions, average balances) 2010 2009
Credit risk $ 9,950 $ 10,100Market risk (trading and non-trading) 3,400 2,450Operational risk 3,350 3,550Business and fixed asset risk 2,400 2,350Insurance risk 400 150
Risk capital $ 19,500 $ 18,600Goodwill and intangibles 10,100 11,250
Economic capital $ 29,600 $ 29,850Under attribution of capital 3,650 600
Average common equity $ 33,250 $ 30,450
Economic capital decreased $250 million from a year ago mainly dueto lower goodwill and intangibles reflecting the impact of the goodwillimpairment charge in the prior year and the stronger Canadian dollaron the translation of foreign currency-denominated goodwill. Loweroperational risk due to lower revenue also contributed to thedecrease. These factors were partially offset by higher market riskreflecting methodology changes for both credit valuation adjustmentsand modeled market risk, and higher insurance specific risk resultingfrom methodology changes and a lower diversification factor.
Management’s Discussion and Analysis Royal Bank of Canada: Annual Report 2010 53
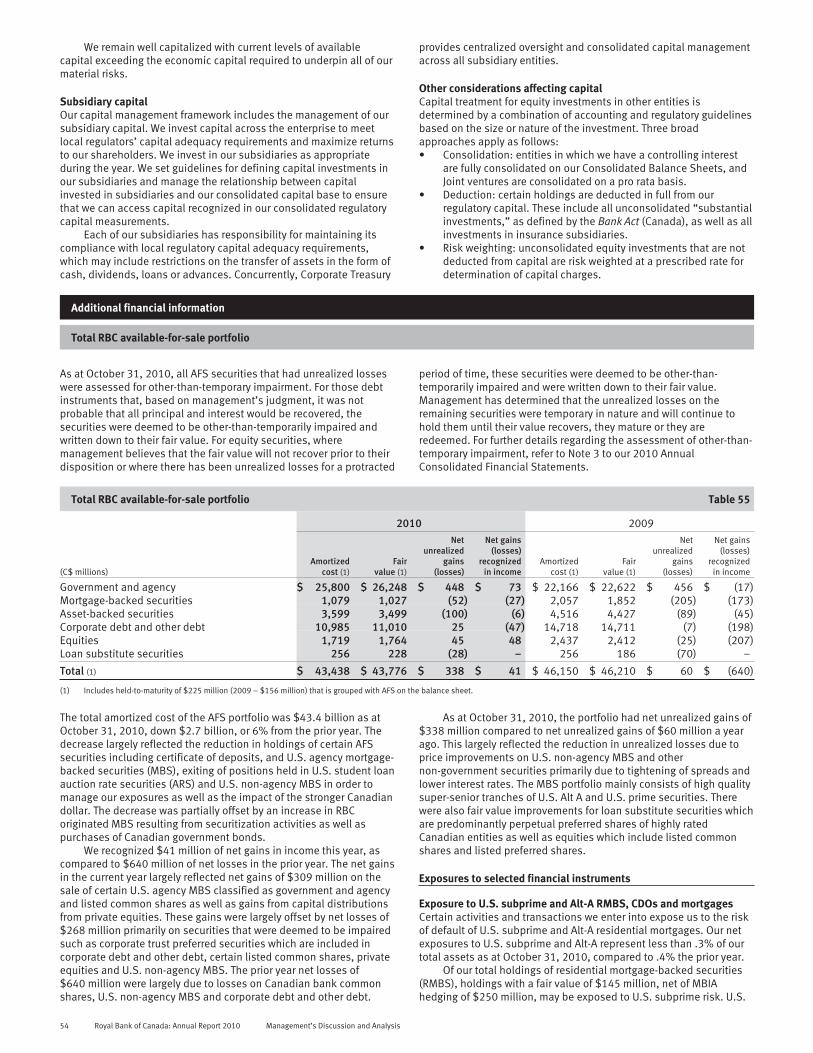
We remain well capitalized with current levels of availablecapital exceeding the economic capital required to underpin all of ourmaterial risks.
Subsidiary capitalOur capital management framework includes the management of oursubsidiary capital. We invest capital across the enterprise to meetlocal regulators’ capital adequacy requirements and maximize returnsto our shareholders. We invest in our subsidiaries as appropriateduring the year. We set guidelines for defining capital investments inour subsidiaries and manage the relationship between capitalinvested in subsidiaries and our consolidated capital base to ensurethat we can access capital recognized in our consolidated regulatorycapital measurements.
Each of our subsidiaries has responsibility for maintaining itscompliance with local regulatory capital adequacy requirements,which may include restrictions on the transfer of assets in the form ofcash, dividends, loans or advances. Concurrently, Corporate Treasury
provides centralized oversight and consolidated capital managementacross all subsidiary entities.
Other considerations affecting capitalCapital treatment for equity investments in other entities isdetermined by a combination of accounting and regulatory guidelinesbased on the size or nature of the investment. Three broadapproaches apply as follows:• Consolidation: entities in which we have a controlling interest
are fully consolidated on our Consolidated Balance Sheets, andJoint ventures are consolidated on a pro rata basis.
• Deduction: certain holdings are deducted in full from ourregulatory capital. These include all unconsolidated “substantialinvestments,” as defined by the Bank Act (Canada), as well as allinvestments in insurance subsidiaries.
• Risk weighting: unconsolidated equity investments that are notdeducted from capital are risk weighted at a prescribed rate fordetermination of capital charges.
Additional financial information
Total RBC available-for-sale portfolio
As at October 31, 2010, all AFS securities that had unrealized losseswere assessed for other-than-temporary impairment. For those debtinstruments that, based on management’s judgment, it was notprobable that all principal and interest would be recovered, thesecurities were deemed to be other-than-temporarily impaired andwritten down to their fair value. For equity securities, wheremanagement believes that the fair value will not recover prior to theirdisposition or where there has been unrealized losses for a protracted
period of time, these securities were deemed to be other-than-temporarily impaired and were written down to their fair value.Management has determined that the unrealized losses on theremaining securities were temporary in nature and will continue tohold them until their value recovers, they mature or they areredeemed. For further details regarding the assessment of other-than-temporary impairment, refer to Note 3 to our 2010 AnnualConsolidated Financial Statements.
Total RBC available-for-sale portfolio Table 55
2010 2009
(C$ millions)Amortized
cost (1)Fair
value (1)
Netunrealized
gains(losses)
Net gains(losses)
recognizedin income
Amortizedcost (1)
Fairvalue (1)
Netunrealized
gains(losses)
Net gains(losses)
recognizedin income
Government and agency $ 25,800 $ 26,248 $ 448 $ 73 $ 22,166 $ 22,622 $ 456 $ (17)Mortgage-backed securities 1,079 1,027 (52) (27) 2,057 1,852 (205) (173)Asset-backed securities 3,599 3,499 (100) (6) 4,516 4,427 (89) (45)Corporate debt and other debt 10,985 11,010 25 (47) 14,718 14,711 (7) (198)Equities 1,719 1,764 45 48 2,437 2,412 (25) (207)Loan substitute securities 256 228 (28) – 256 186 (70) –
Total (1) $ 43,438 $ 43,776 $ 338 $ 41 $ 46,150 $ 46,210 $ 60 $ (640)
(1) Includes held-to-maturity of $225 million (2009 – $156 million) that is grouped with AFS on the balance sheet.
The total amortized cost of the AFS portfolio was $43.4 billion as atOctober 31, 2010, down $2.7 billion, or 6% from the prior year. Thedecrease largely reflected the reduction in holdings of certain AFSsecurities including certificate of deposits, and U.S. agency mortgage-backed securities (MBS), exiting of positions held in U.S. student loanauction rate securities (ARS) and U.S. non-agency MBS in order tomanage our exposures as well as the impact of the stronger Canadiandollar. The decrease was partially offset by an increase in RBCoriginated MBS resulting from securitization activities as well aspurchases of Canadian government bonds.
We recognized $41 million of net gains in income this year, ascompared to $640 million of net losses in the prior year. The net gainsin the current year largely reflected net gains of $309 million on thesale of certain U.S. agency MBS classified as government and agencyand listed common shares as well as gains from capital distributionsfrom private equities. These gains were largely offset by net losses of$268 million primarily on securities that were deemed to be impairedsuch as corporate trust preferred securities which are included incorporate debt and other debt, certain listed common shares, privateequities and U.S. non-agency MBS. The prior year net losses of$640 million were largely due to losses on Canadian bank commonshares, U.S. non-agency MBS and corporate debt and other debt.
As at October 31, 2010, the portfolio had net unrealized gains of$338 million compared to net unrealized gains of $60 million a yearago. This largely reflected the reduction in unrealized losses due toprice improvements on U.S. non-agency MBS and othernon-government securities primarily due to tightening of spreads andlower interest rates. The MBS portfolio mainly consists of high qualitysuper-senior tranches of U.S. Alt A and U.S. prime securities. Therewere also fair value improvements for loan substitute securities whichare predominantly perpetual preferred shares of highly ratedCanadian entities as well as equities which include listed commonshares and listed preferred shares.
Exposures to selected financial instruments
Exposure to U.S. subprime and Alt-A RMBS, CDOs and mortgagesCertain activities and transactions we enter into expose us to the riskof default of U.S. subprime and Alt-A residential mortgages. Our netexposures to U.S. subprime and Alt-A represent less than .3% of ourtotal assets as at October 31, 2010, compared to .4% the prior year.
Of our total holdings of residential mortgage-backed securities(RMBS), holdings with a fair value of $145 million, net of MBIAhedging of $250 million, may be exposed to U.S. subprime risk. U.S.
54 Royal Bank of Canada: Annual Report 2010 Management’s Discussion and Analysis

subprime RMBS exposures increased $59 million from last year. Ofthis potential exposure, over 55% of our related holdings are rated Aand above, compared to over 66% in the prior year. As at October 31,2010, U.S. subprime RMBS holdings rated AAA, on a net basis,comprised 17% of total U.S. subprime RMBS holdings, compared to37% in 2009. Exposure to U.S. subprime loans was $319 million as atOctober 31, 2010, representing .04% of total assets, $170 millionlower than last year, partly due to principal pay downs and thestronger Canadian dollar.
Of our total holdings of RMBS, holdings with a fair value of $557million, net of hedging, may be exposed to U.S. Alt-A risk. U.S. Alt-Aexposures decreased $431 million from the prior year mainly due tothe sale of holdings. Less than 49% of these RMBS were issuedduring 2006 and onwards. Our exposure to U.S. Alt-A loans was $973million as at October 31, 2010, representing .1% of total assets and adecrease of $314 million from the prior year partly due to principalpay downs and the stronger Canadian dollar.
Of our total holdings of collateralized debt obligations (CDOs),holdings of $21 million, net of MBIA hedging of $4 million, may beexposed to U.S. subprime or Alt-A risk, a decrease of $1 million from2009. The fair value of our Corporate CDOs, net of hedging of $312million as at October 31, 2010, increased $34 million from last year.
Net exposure to U.S. subprime and Alt-A throughRMBS, CDOs and mortgages
Table 56
2010
As at October 31 (C$ millions)Subprime
RMBSAlt-A
RMBS
CDOs thatmay containsubprime or
Alt-A Total
Fair value of securities beforehedging $ 395 $ 557 $ 25 $ 977
Fair value of securities net ofhedging by ratingAAA $ 24 $ 53 $ –AA 56 46 –A – 26 –BBB 13 73 –Below BBB- (1) 52 359 21
Total $ 145 $ 557 $ 21 $ 723
Fair value of securities net ofhedging by vintage
2003 (or before) $ 29 $ 32 $ –2004 43 49 –2005 29 204 212006 33 92 –2007 and greater 11 180 –
Total $ 145 $ 557 $ 21 $ 723
Amortized cost of subprime/Alt-Amortgages (whole loans) $ 180 $ 722 $ – $ 902
Amortized cost of subprime/Alt-ARMBS securities transferred toloans under Section 3855 $ 139 $ 251 $ – $ 390
Total subprime and Alt-Aexposures, net of hedging $ 464 $ 1,530 $ 21 $ 2,015
Sensitivities of fair value ofsecurities, net of hedging, tochanges in assumptions:
100bp increase in credit spread $ (4) $ (35)100bp increase in interest rates (4) (38)20% increase in default rates (4) (38)25% decrease in pre-payment
rates (2) (32)
(1) The subprime RMBS exposures rated below BBB- represents our net bought protectionposition.
Off-balance sheet arrangementsFor our off-balance sheet arrangements including multi-sellerconduits, structured investment vehicles and other variable interestentities as at October 31, 2010, refer to the Off-balance sheetarrangements section.
Leveraged financeLeveraged finance comprises infrastructure finance, essentialservices and other types of finance. It excludes investment gradefinancing and non-investment grade financing where there is noprivate equity sponsor involvement. Our total commitments,combined funded and unfunded, as at October 31, 2010 were $4,343million which was .6% of our total assets, unchanged from prior year.
Direct and indirect monoline insuranceWe have direct and indirect monoline insurance on subprime andnon-subprime assets as presented below:
Direct monoline insurance Table 57
As at October 31, 2010
(C$ millions)Principal/notional Fair value
MBIA $ 3,656 $ 327Assured Guaranty Municipal Corp.
(Formerly FSA) 270 14Syncora Holdings Ltd. (Formerly XL Capital Ltd.) 244 11AMBAC Financial Group (AMBAC) 102 –
Total $ 4,272 $ 352
As at October 31, 2010, we held monoline insurance protection of$4,272 million against default of the issuer or counterparty on bothsubprime and non-subprime trading assets with a recorded fair valueof $352 million, net of credit valuation adjustments. Our valuationmethodology related to our MBIA exposure is consistent with the prioryear while we have updated our parameter estimates to reflect currentmarket conditions.
We also have indirect monoline insurance exposure throughassets that we hold and liquidity facilities that we provide. Monolineinsurers provide bond insurance for third-party originated assets thatwe hold, such as U.S. municipal bonds, ARS, interest rate swaps, andpublic infrastructure bonds. In these cases, we obtain a benefit fromthe insurance protection. The principal/notional value of these assetsas at October 31, 2010 is $1,605 million. The majority of these assetsare held in our trading book, with changes in fair value reflected inNon-interest income – Trading revenue, and the implied value of theinsurance is reflected in the fair value of the asset. In addition, weprovide liquidity facilities of $295 million to certain of our customersin respect of their bond issuance programs where monoline insurancewas purchased as part of that program of which $nil was drawn as ofOctober 31, 2010.
Commercial mortgage-backed securities disclosureThe fair value of our total direct holdings of CMBS was $316 millionas at October 31, 2010.
Assets and liabilities measured at fair valueThere were no material transfers in or out of levels 1, 2 or 3 in thecurrent year, as classified by the fair value hierarchy set out inSection 3862, Financial Instruments – Disclosures. For furtherdetails, refer to Note 2 to our 2010 Annual Consolidated FinancialStatements.
Management’s Discussion and Analysis Royal Bank of Canada: Annual Report 2010 55

Accounting and control matters
Critical accounting policies and estimates
Application of critical accounting policies and estimates
Our significant accounting policies are described in Note 1 to our2010 Annual Consolidated Financial Statements. Certain of thesepolicies, as well as estimates made by management in applying suchpolicies, are recognized as critical because they require us to makeparticularly subjective or complex judgment about matters that areinherently uncertain and because of the likelihood that significantlydifferent amounts could be reported under different conditions orusing different assumptions. Our critical accounting policies andestimates relate to the fair value of financial instruments, other-than-temporary impairment of available-for-sale (AFS) and held-to-maturity(HTM) securities, securitization, allowance for credit losses, variableinterest entities, goodwill and other intangible assets, pensions andother post-employment benefits and income taxes. Our criticalaccounting policies and estimates have been reviewed and approvedby our Audit Committee, in consultation with management, as part oftheir review and approval of our significant accounting policies andestimates.
Financial instruments – recognition and measurement
Fair value of financial instrumentsAll financial instruments are required to be measured at fair value oninitial recognition except for certain related party transactions.Measurement in subsequent periods depends on whether thefinancial instruments have been classified or designated asheld-for-trading (HFT), AFS, HTM, loans and receivables or otherfinancial liabilities. A financial instrument can be designated as HFT(the fair value option (FVO)) on its initial recognition, provided itmeets certain criteria, even if it was not acquired or incurred princi-pally for the purpose of selling or repurchasing in the near term.
Financial assets and financial liabilities HFT, including derivativeinstruments, are measured at fair value with changes in the fairvalues recognized in net income, except for derivatives designated ineffective cash flow hedges or hedges of foreign currency exposure ofa net investment in a self-sustaining foreign operation; the changes inthe fair values of those derivatives are recognized in other compre-hensive income (OCI). AFS financial assets are also measured at fairvalue with unrealized gains and losses, including changes in foreignexchange rates, being recognized in OCI except for investments inequity instruments classified as AFS that do not have a quoted marketprice in an active market, which are measured at cost. Financialassets HTM, loans and receivables, and other financial liabilities aremeasured at amortized cost using the effective interest method.
As at October 31, 2010, approximately $353 billion, or 52%, ofour financial assets and $257 billion, or 38%, of our financialliabilities were carried at fair value ($299 billion, or 48%, of financialassets and $202 billion, or 34%, of financial liabilities as atOctober 31, 2009).
CICA Section 3862, Financial Instruments – Disclosures,establishes a three-level hierarchy for disclosure of financialinstruments measured at fair value, which is essentially the same asthe hierarchy under U.S. GAAP. The classification of assets andliabilities within the hierarchy is based on whether the inputs to themeasurement valuation methodology are observable orunobservable. Observable inputs reflect market-derived or market-based information obtained from independent sources, whileunobservable inputs reflect our estimates about market data. Thefollowing three-level fair value hierarchy is based on the transparencyof the inputs used to measure the fair value of the financial instru-ments:• Level 1 – inputs are unadjusted quoted prices of identical
instruments in active markets.• Level 2 – inputs other than quoted prices included in Level 1 that
are observable for the asset or liability, either directly orindirectly.
• Level 3 – one or more significant inputs used in a valuationtechnique are unobservable in determining fair values of theinstruments.
Note 2 to our 2010 Annual Consolidated Financial Statementsdiscloses the fair values of our financial instruments as at October 31,2010.
Fair value is defined as the amount at which a financialinstrument could be bought or sold in a current transaction, otherthan in a forced or liquidation sale, between knowledgeable andwilling parties in an arm’s-length transaction under no compulsion toact. The best evidence of fair value is quoted bid or ask price, asappropriate, in an active market. Where bid and ask prices areunavailable, we use the closing price of the most recent transaction ofthat instrument. Where quoted prices are not available for a particularfinancial instrument, we use the quoted price of a financialinstrument with similar characteristics and risk profile, or use internalor external valuation models using observable market-based inputsto estimate the fair value.
The determination of fair value for actively traded financialinstruments that have quoted market prices or readily observablemodel input parameters requires minimal subjectivity. Management’sjudgment is required, however, when the observable market pricesand parameters do not exist. In addition, management exercisesjudgment when establishing market valuation adjustments thatwould be required to determine the fair values. These includevaluation adjustments for liquidity for financial instruments that arenot quoted in an active market, when we believe that the amountrealized on sale may be less than the estimated fair value due toinsufficient liquidity over a short period of time. They also includevaluation adjustments calculated when market prices are notobservable due to insufficient trading volume or a lack of recenttrades in a less active or inactive market.
The majority of our financial instruments classified as HFT, otherthan derivatives and financial assets classified as AFS, comprise orrelate to actively traded debt and equity securities, which are carriedat fair value based on available quoted prices. As few derivatives andfinancial instruments designated as HFT using the FVO are activelyquoted, we rely primarily on internally developed pricing models andestablished industry standard pricing models, such as Black-Schöles,to determine their fair value. In determining the assumptions to beused in our pricing models, we look primarily to external readilyobservable market inputs including factors such as G7 interest-rate-yield curves, currency rates and volatility of certain prices or rates.However, certain derivative financial instruments are valued usingsignificant unobservable market inputs such as default correlations,among others. These inputs are subject to significantly morequantitative analysis and management judgment. Where significantinput parameters are not based on market observable data, we deferthe initial trading profit or loss until the amounts deferred becomerealized through the receipt and/or payment of cash or once the inputparameters are observable in the market. We also record fair valueadjustments to account for measurement uncertainty due to modelrisk and parameter uncertainty when valuing complex or less activelytraded financial instruments. For further information on our derivativeinstruments, refer to Note 7 to our 2010 Annual ConsolidatedFinancial Statements.
To determine the fair value adjustments on RBC debt designatedas HFT, we calculate the present value of the instruments based onthe contractual cash flows over the term of the arrangement by usingthe RBC effective funding rates at the beginning and end of theperiod, with the unrealized change in the present value recorded innet income.
The determination of fair value where quoted prices are notavailable and the identification of appropriate valuation adjustmentsrequire management judgment and are based on quantitativeresearch and analysis. Group Risk Management and Finance are
56 Royal Bank of Canada: Annual Report 2010 Management’s Discussion and Analysis

responsible for establishing our valuation methodologies andpolicies, which address the use and calculation of valuationadjustments. These methodologies are reviewed on an ongoing basisto ensure that they remain appropriate. Group Risk Management’soversight in the valuation process also includes ensuring allsignificant financial valuation models are strictly controlled andregularly recalibrated and vetted to provide an independentperspective. Refer to the Risk, capital and liquidity managementsection for further details on the sensitivity of financial instrumentsused in trading and non-trading activities.
Controls over valuations of financial instrumentsAn independent control infrastructure is critical to ensure that ourfinancial instruments fair value measurements are reliable,consistently determined and appropriately valued at market exit pricelevels. Our valuation control infrastructure has senior managementoversight and is independent of business functions that trade orinvest in financial instruments. Valuations are governed by policiesand controls, including independent price verification, review of dailyprofit and loss, and determination of valuation adjustments fornon-readily observable market prices or parameters, by staff withappropriate knowledge and expertise of the instruments and marketsin which we transact. These policies and controls include a review ofall new business initiatives to ensure minimum standards are metprior to approval.
Other-than-temporary impairment of available-for-sale andheld-to-maturity securitiesAFS securities with unrealized losses are assessed for impairment ateach reporting date and more frequently when conditions warrant.When the fair value of any security has declined below its amortizedcost, management is required to assess whether the decline is other-than-temporary. In making this assessment for AFS securities, weconsider several factors including: (i) the length of time and extent towhich the fair value has been less than its amortized cost; (ii) theseverity of the impairment; (iii) the cause of the impairment and thefinancial condition and near-term prospects of the issuer; and (iv) ourintent and ability to hold the investment for a period of time sufficientto allow for any anticipated recovery of fair value. The decision torecord a writedown, its amount and the period in which it is recordedcould change based on management’s judgment. If the decline invalue based on management’s judgment is considered to be other-than-temporary, the cumulative changes in the fair values of AFSsecurities previously recognized in accumulated other comprehensiveincome (AOCI) are reclassified to net income during that period. Weassess our HTM securities for impairment using the same impairmentmodel for Loans. For further details, refer to Notes 1 and 3 to our 2010Annual Consolidated Financial Statements.
SecuritizationWe periodically securitize Canadian residential mortgages, credit cardreceivables and commercial mortgage loans by selling them tospecial purpose entities (SPEs) or trusts that issue securities toinvestors. Some of the key accounting determinations in asecuritization of our loans are whether the transfer of the loans meetsthe criteria required to be treated as a sale and, if so, the valuation ofour retained interests in the securitized loans. Refer to Note 1 to our2010 Annual Consolidated Financial Statements for a detaileddescription of the accounting policy for loan securitization.
When we securitize loans and retain an interest in the securi-tized loans, it is a matter of judgment whether the loans have beenlegally isolated. We obtain legal opinions where required to give uscomfort that legal isolation of the transferred loans has beenachieved. We often retain interests in securitized loans such asinterest-only strips, servicing rights or cash reserve accounts. Wherequoted market prices are not available, the valuation of retainedinterests in sold assets is based on our best estimate of several keyassumptions such as the payment rate of the transferred loans,weighted average life of the prepayable receivables, excess spread,expected credit losses and discount rate. The fair value of suchretained interests calculated using these assumptions affects the
gain or loss that is recognized from the sale of the loans. Refer toNote 5 to our 2010 Annual Consolidated Financial Statements for thevolume of securitization activities of our loans, the gain or lossrecognized on sale and a sensitivity analysis of the key assumptionsused in valuing our retained interests.
Another key accounting determination is whether the SPE that isused to securitize and sell our loans is required to be consolidated.As described in Note 6 to our 2010 Annual Consolidated FinancialStatements, we concluded that none of the SPEs used to securitizeour financial assets should be consolidated.
Allowance for credit lossesThe allowance for credit losses is maintained at levels thatmanagement considers appropriate to cover estimated identifiedcredit related losses in the portfolio as well as losses that have beenincurred, but are not yet identifiable as at the balance sheet date. Theallowance relates to on-balance sheet exposures, such as loans andacceptances, and off-balance sheet items such as letters of credit,guarantees and unfunded commitments.
The allowance is determined based on management’s identi-fication and evaluation of problem accounts for estimated losses thatexist on the remaining portfolio, and on other factors including thecomposition and credit quality of the portfolio, and changes ineconomic and business conditions. The allowance for credit lossesconsists of specific allowances and the general allowance.
The process for determining the allowances involves quantitativeand qualitative assessments using current and historical creditinformation. Our lending portfolio is reviewed on an ongoing basis toassess whether any borrowers should be classified as impaired andwhether an allowance or write-off is required. The process inherentlyrequires the use of certain assumptions and judgments including:(i) assessing the impaired status and risk ratings of loans;(ii) estimating cash flows and collateral values; (iii) developingdefault and loss rates based on historical and industry data;(iv) adjusting loss rates and risk parameters based on the relevanceof historical data given changes in credit strategies, processes andpolicies; (v) assessing the current credit quality of the portfolio basedon credit quality trends in relation to impairments, write-offs andrecoveries, portfolio characteristics and composition; and(vi) determining the current position in the economic and creditcycles. Changes in these assumptions or using other reasonablejudgments can materially affect the allowance level and thereby ournet income.
Specific allowancesSpecific allowances are recorded to recognize estimated losses onboth retail and wholesale loans that have become impaired. Thelosses relating to retail portfolios are managed on a pooled basis andare based on net write-off experience. For credit cards, no specificallowance is maintained as balances are written off when a paymentis 180 days in arrears. Personal loans are generally written off at 150days past due. Write-offs for other loans are generally recorded whenthere is no realistic prospect of full recovery. The losses relating towholesale borrowers are estimated using management’s judgmentrelating to the timing of future cash flow amounts that can bereasonably expected from the borrowers, financially responsibleguarantors and the realization of collateral. The amounts expected tobe recovered are reduced by estimated collection costs anddiscounted at the effective interest rate of the obligation.
General allowanceA general allowance is established to cover estimated credit lossesincurred in the lending portfolio that have not yet been specificallyidentified as impaired. For wholesale portfolios the determination ofthe general allowance is based on the application of estimatedprobability of default, gross exposure at default and loss factors,which are determined by historical loss experience and delineated byloan type and rating. For retail portfolios the determination of thegeneral allowance is based on the application of historical loss rates.In determining the general allowance level, management alsoconsiders the current portfolio credit quality trends, business andeconomic conditions, the impact of policy and process changes, andother supporting factors.
Management’s Discussion and Analysis Royal Bank of Canada: Annual Report 2010 57

Total allowance for credit lossesBased on the procedures discussed above, management believesthat the total allowance for credit losses of $3,096 million isadequate to absorb estimated credit losses incurred in the lendingportfolio as at October 31, 2010. This amount includes $99 millionclassified in other liabilities, which relates to letters of credit andguarantees and unfunded commitments.
Variable interest entities
AcG-15 provides guidance on applying the principles of consolidationto certain entities defined as variable interest entities (VIEs). Wherean entity is considered a VIE, the Primary Beneficiary is required toconsolidate the assets, liabilities and results of operations of the VIE.The Primary Beneficiary is the entity that is exposed, through variableinterests, to a majority of the VIE’s expected losses (as defined inAcG-15) or is entitled to a majority of the VIE’s expected residualreturns (as defined in AcG-15), or both.
We use a variety of complex estimation processes involving bothqualitative and quantitative factors to determine whether an entity isa VIE and, if required, to analyze and calculate the expected lossesand the expected residual returns. These processes involveestimating the future cash flows and performance of the VIE,analyzing the variability in those cash flows, and allocating the cashflows among the identified parties holding variable interests todetermine who is the Primary Beneficiary. In addition, there is asignificant amount of judgment exercised in interpreting the provi-sions of AcG-15 and applying them to our specific transactions.
AcG-15 applies to a variety of our businesses, including ourinvolvement with multi-seller conduits that we administer, creditinvestment products and structured finance transactions. For furtherdetails on our involvement with VIEs, refer to the Off-balance sheetarrangements section and Note 6 to our 2010 Annual ConsolidatedFinancial Statements.
Goodwill and other intangible assets
Under GAAP, goodwill is not amortized and is generally allocated toreporting units which are one level below our operating segments.Goodwill is tested for impairment on an annual basis or morefrequently if an event occurs or circumstances change such that thefair value of a reporting unit may be reduced to less than its bookvalue.
Testing goodwill begins with determining the fair value of eachreporting unit and comparing it to its carrying amount, includinggoodwill. If the carrying value of a reporting unit exceeds its fair value,the fair value of the reporting unit’s goodwill must be determined andcompared to its carrying value. The fair value of the goodwill isimputed by determining the fair value of the assets and liabilities ofthe reporting unit. Goodwill is deemed to be impaired if its carryingvalue exceeds the fair value. That excess is the quantum of theimpairment which must be charged to income in the period it isidentified. Subsequent reversals of impairment are prohibited.
Management applies significant judgment in estimating the fairvalue of our reporting units which is accomplished primarily using anearnings-based approach which incorporates each reporting unit’sinternal forecasts of revenues and expenses. The use of this modeland, more generally, our impairment assessment process require the
use of estimates and assumptions, including discount rates, growthrates, and terminal growth rates. Changes in one or more of theestimates or assumptions could have an impact on the determinationof the fair value of our reporting units and thus, the results of theimpairment test. In addition to the earnings-based approach, wherepossible, we use a market-based approach to assess what theappropriate fair value of each reporting unit may be in the currentmarket based on actual market events and comparable companies.
Other intangibles with a finite life are amortized on a straight-linebasis over their estimated useful lives, generally not exceeding 20years. These are also tested for impairment when an event occurs or acondition arises that indicates that the estimated future net cash flowsfrom the asset may be insufficient to recover its carrying amount. Theidentification of such events or conditions may be subject tomanagement’s judgment. Estimating the fair value of a finite-lifeintangible for purposes of determining whether it is impaired alsorequires management to make estimates and assumptions, changes inwhich could have an impact on the determination of the fair value ofthe intangible and thus, the results of the impairment test. We do nothave any intangibles with indefinite lives.
For further details, refer to Notes 1 and 10 to our 2010 AnnualConsolidated Financial Statements. Also refer to the “GoodwillImpairment Assessment” later in this section.
Pensions and other post-employment benefits
We sponsor a number of defined benefit and defined contributionplans that provide pension and other benefits to eligible employeesafter retirement. These plans include registered pension plans,supplemental pension plans, and health, dental, disability and lifeinsurance plans. The pension plans provide benefits based on yearsof service, contributions and average earnings at retirement.
Due to the long-term nature of these plans, the calculation ofbenefit expenses and obligations depends on various assumptionssuch as discount rates, expected rates of return on assets, healthcarecost trend rates, projected salary increases, retirement age, andmortality and termination rates. Discount rate assumption isdetermined using a yield curve of AA corporate debt securities. Allother assumptions are determined by management and are reviewedannually by the actuaries. Actual experience that differs from theactuarial assumptions will affect the amounts of benefit obligationand expense. The weighted average assumptions used and thesensitivity of key assumptions are presented in Note 20 to our 2010Annual Consolidated Financial Statements.
Income taxes
Management exercises judgment in estimating the provision forincome taxes. We are subject to income tax laws in various juris-dictions where we operate. These complex tax laws are potentiallysubject to different interpretations by us and the relevant taxauthority. The provision for income taxes represents management’sinterpretation of the relevant tax laws and its estimate of current andfuture income tax implications of transactions and events during theperiod. A future income tax asset or liability is determined for eachtemporary difference based on the future tax rates that are expectedto be in effect and management’s assumptions regarding theexpected timing of the reversal of such temporary differences.
58 Royal Bank of Canada: Annual Report 2010 Management’s Discussion and Analysis

Changes in accounting policies
Significant changes in accounting policies and disclosures during2010Canadian GAAPWe did not adopt any new significant accounting policies during theyear.
U.S. GAAPFair value measurement and disclosures on non-financial assets andliabilitiesGuidance on fair value measurement and disclosures (Topic 820, FairValue Measurements and Disclosures) for nonfinancial assets andliabilities became effective for us on November 1, 2009. The newstandards require additional disclosure on inputs and valuationtechniques used to measure assets and liabilities that are measuredat fair value on a nonrecurring basis in periods subsequent to initialrecognition. Refer to the section entitled “Framework on fair valuemeasurement” in Note 31 to our 2010 Annual Consolidated FinancialStatements for expanded disclosures.
Investments in Certain Entities that Calculate Net Asset Value PerShareFinancial Accounting Standard Board (FASB) issued AccountingStandards Update (ASU) 2009-12, Fair Value Measurements andDisclosures (ASC Topic 820) – Investments in Certain Entities thatCalculate Net Asset Value Per Share (or its Equivalent), which providesguidance on measuring fair value of certain alternative investments,and permits entities to use net asset value as a practical expedient tomeasure the fair value of its investments in certain investment funds.We adopted this standard on November 1, 2009.
Our alternative investments primarily include hedge funds heldin connection with hedging of exposure related to fee-based equityderivative transactions with third parties. Fair value of theseinvestments are based on the net asset value of the hedge funds.Refer to Note 31 to our 2010 Annual Consolidated FinancialStatements for additional disclosures and information.
Improving Disclosures about Fair Value MeasurementsFASB issued ASU 2010-06, Fair Value Measurements and Disclosureswhich amends and adds new disclosure requirements to Topic 820Fair Value Measurement and Disclosures – Overall. New requirementsare applicable for transfers into and out of Levels 1 and 2 andseparate disclosures are required for purchases, sales, issuances,and settlements relating to Level 3 financial instruments.Clarifications are also provided on existing fair value disclosures onlevel of disaggregation and on inputs and valuation techniques usedto measure fair value. This guidance became effective for us onFebruary 1, 2010. Refer to Note 2 to our 2010 Annual ConsolidatedFinancial Statements for the expanded fair value hierarchydisclosures. Additional disclosures are also required regarding thenature and risk of such investments; these are provided in the“Framework on fair value measurement section” of Note 2 to our 2010Annual Consolidated Financial Statements.
Non-controlling interestIn December 2007, the FASB issued guidance under ASC Topic 810,Consolidation, which was effective for us on November 1, 2009.Significant requirements include:• Ownership interests in subsidiaries held by parties other than
the parent must be reclassified to equity and presentedseparately from the parent’s equity;
• The amount of consolidated net income attributable to theparent and to the non-controlling interest must be clearlyidentified and presented on the consolidated statement ofincome;
• Non-controlling interest should continue to be attributed itsshare of losses even if that attribution results in a deficitnon-controlling interest balance;
• After control is obtained, a change in ownership interests thatdoes not result in a loss of control should be accounted for as anequity transaction; and
• A change in ownership of a consolidated subsidiary that resultsin a loss of control and deconsolidation will trigger recognition ofa gain or loss and any retained non-controlling equity investmentin the former subsidiary will be initially measured at fair value.
Business combinationsFASB issued guidance under Topic 805, Business Combinations(Statement No. 141 (revised 2007), Business Combinations), whichreplaces previous guidance under Topic 805 (Statement No. 141,Business Combinations ). The new guidance includes the followingchanges in requirements: more assets acquired and liabilitiesassumed must be measured at fair value at the acquisition date,liabilities related to contingent consideration must be remeasured atfair value and each subsequent reporting period, and all acquisitionrelated costs must be expensed.
There is no impact to our 2010 Annual Consolidated FinancialStatements as we did not close any acquisitions during the year.
In addition, several new U.S. GAAP accounting pronouncementsissued by FASB became effective for us on November 1, 2009 but theimpact of adopting these pronouncements is not material to ourconsolidated financial position or results of operations. For furtherdetails about the new U.S. GAAP pronouncements, refer to Note 31 toour 2010 Annual Consolidated Financial Statements.
Future changes in accounting policies and disclosureCanadian GAAPThere is no significant future accounting change applicable for us.
U.S. GAAPAmendments to Guidance on Accounting for Transfers of FinancialAssetsIn June 2009, the FASB issued Statement No. 166, Accounting forTransfers of Financial Assets – an amendment of FASB StatementNo. 140 (FAS 166), which will be effective for us prospectively onNovember 1, 2010. FAS 166 eliminates the concept of qualifyingspecial purpose entities (QSPEs) and provides additional criteria andclarifies certain principles of the derecognition requirement in FAS140 that the transferor must use to assess transfers of financialassets. It also eliminates the exception that permitted saleaccounting for certain mortgage securitizations when control has notbeen completely surrendered by the transferor.
Amendments to Consolidation GuidanceIn June 2009, the FASB issued Statement No. 167, Amendments toFASB Interpretation No. 46(R) (FAS167) which will be effective for usretrospectively on November 1, 2010. FAS167 modifies the character-istics that identify a variable interest entity, provides new criteria fordetermining the primary beneficiary and increases the frequency ofrequired assessments to determine whether an entity is the primarybeneficiary of a variable interest entity. We are currently in theprocess of assessing the impact of adopting this new standard on ourconsolidated financial position and results of operations.
Refer to Note 31 to our 2010 Annual Consolidated FinancialStatements for more information about these and other futureaccounting standards.
Management’s Discussion and Analysis Royal Bank of Canada: Annual Report 2010 59
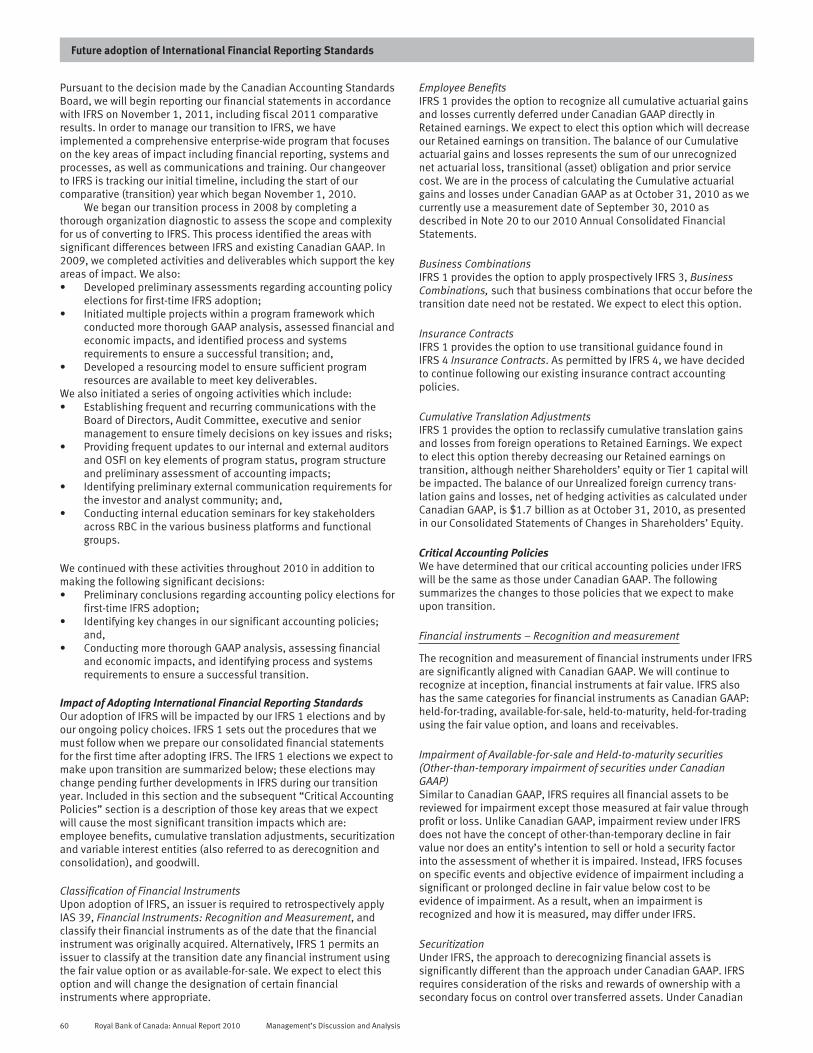
Future adoption of International Financial Reporting Standards
Pursuant to the decision made by the Canadian Accounting StandardsBoard, we will begin reporting our financial statements in accordancewith IFRS on November 1, 2011, including fiscal 2011 comparativeresults. In order to manage our transition to IFRS, we haveimplemented a comprehensive enterprise-wide program that focuseson the key areas of impact including financial reporting, systems andprocesses, as well as communications and training. Our changeoverto IFRS is tracking our initial timeline, including the start of ourcomparative (transition) year which began November 1, 2010.
We began our transition process in 2008 by completing athorough organization diagnostic to assess the scope and complexityfor us of converting to IFRS. This process identified the areas withsignificant differences between IFRS and existing Canadian GAAP. In2009, we completed activities and deliverables which support the keyareas of impact. We also:• Developed preliminary assessments regarding accounting policy
elections for first-time IFRS adoption;• Initiated multiple projects within a program framework which
conducted more thorough GAAP analysis, assessed financial andeconomic impacts, and identified process and systemsrequirements to ensure a successful transition; and,
• Developed a resourcing model to ensure sufficient programresources are available to meet key deliverables.
We also initiated a series of ongoing activities which include:• Establishing frequent and recurring communications with the
Board of Directors, Audit Committee, executive and seniormanagement to ensure timely decisions on key issues and risks;
• Providing frequent updates to our internal and external auditorsand OSFI on key elements of program status, program structureand preliminary assessment of accounting impacts;
• Identifying preliminary external communication requirements forthe investor and analyst community; and,
• Conducting internal education seminars for key stakeholdersacross RBC in the various business platforms and functionalgroups.
We continued with these activities throughout 2010 in addition tomaking the following significant decisions:• Preliminary conclusions regarding accounting policy elections for
first-time IFRS adoption;• Identifying key changes in our significant accounting policies;
and,• Conducting more thorough GAAP analysis, assessing financial
and economic impacts, and identifying process and systemsrequirements to ensure a successful transition.
Impact of Adopting International Financial Reporting StandardsOur adoption of IFRS will be impacted by our IFRS 1 elections and byour ongoing policy choices. IFRS 1 sets out the procedures that wemust follow when we prepare our consolidated financial statementsfor the first time after adopting IFRS. The IFRS 1 elections we expect tomake upon transition are summarized below; these elections maychange pending further developments in IFRS during our transitionyear. Included in this section and the subsequent “Critical AccountingPolicies” section is a description of those key areas that we expectwill cause the most significant transition impacts which are:employee benefits, cumulative translation adjustments, securitizationand variable interest entities (also referred to as derecognition andconsolidation), and goodwill.
Classification of Financial InstrumentsUpon adoption of IFRS, an issuer is required to retrospectively applyIAS 39, Financial Instruments: Recognition and Measurement, andclassify their financial instruments as of the date that the financialinstrument was originally acquired. Alternatively, IFRS 1 permits anissuer to classify at the transition date any financial instrument usingthe fair value option or as available-for-sale. We expect to elect thisoption and will change the designation of certain financialinstruments where appropriate.
Employee BenefitsIFRS 1 provides the option to recognize all cumulative actuarial gainsand losses currently deferred under Canadian GAAP directly inRetained earnings. We expect to elect this option which will decreaseour Retained earnings on transition. The balance of our Cumulativeactuarial gains and losses represents the sum of our unrecognizednet actuarial loss, transitional (asset) obligation and prior servicecost. We are in the process of calculating the Cumulative actuarialgains and losses under Canadian GAAP as at October 31, 2010 as wecurrently use a measurement date of September 30, 2010 asdescribed in Note 20 to our 2010 Annual Consolidated FinancialStatements.
Business CombinationsIFRS 1 provides the option to apply prospectively IFRS 3, BusinessCombinations, such that business combinations that occur before thetransition date need not be restated. We expect to elect this option.
Insurance ContractsIFRS 1 provides the option to use transitional guidance found inIFRS 4 Insurance Contracts. As permitted by IFRS 4, we have decidedto continue following our existing insurance contract accountingpolicies.
Cumulative Translation AdjustmentsIFRS 1 provides the option to reclassify cumulative translation gainsand losses from foreign operations to Retained Earnings. We expectto elect this option thereby decreasing our Retained earnings ontransition, although neither Shareholders’ equity or Tier 1 capital willbe impacted. The balance of our Unrealized foreign currency trans-lation gains and losses, net of hedging activities as calculated underCanadian GAAP, is $1.7 billion as at October 31, 2010, as presentedin our Consolidated Statements of Changes in Shareholders’ Equity.
Critical Accounting PoliciesWe have determined that our critical accounting policies under IFRSwill be the same as those under Canadian GAAP. The followingsummarizes the changes to those policies that we expect to makeupon transition.
Financial instruments – Recognition and measurement
The recognition and measurement of financial instruments under IFRSare significantly aligned with Canadian GAAP. We will continue torecognize at inception, financial instruments at fair value. IFRS alsohas the same categories for financial instruments as Canadian GAAP:held-for-trading, available-for-sale, held-to-maturity, held-for-tradingusing the fair value option, and loans and receivables.
Impairment of Available-for-sale and Held-to-maturity securities(Other-than-temporary impairment of securities under CanadianGAAP)Similar to Canadian GAAP, IFRS requires all financial assets to bereviewed for impairment except those measured at fair value throughprofit or loss. Unlike Canadian GAAP, impairment review under IFRSdoes not have the concept of other-than-temporary decline in fairvalue nor does an entity’s intention to sell or hold a security factorinto the assessment of whether it is impaired. Instead, IFRS focuseson specific events and objective evidence of impairment including asignificant or prolonged decline in fair value below cost to beevidence of impairment. As a result, when an impairment isrecognized and how it is measured, may differ under IFRS.
SecuritizationUnder IFRS, the approach to derecognizing financial assets issignificantly different than the approach under Canadian GAAP. IFRSrequires consideration of the risks and rewards of ownership with asecondary focus on control over transferred assets. Under Canadian
60 Royal Bank of Canada: Annual Report 2010 Management’s Discussion and Analysis

GAAP, the derecognition model follows the legal form of the trans-action and the ability to shield assets from bankruptcy. We havedetermined that most of our securitizations will not qualify forderecognition under IAS 39; this will result in the associated assets,namely, mortgages and credit card receivables, being recognized onour consolidated balance sheets and the gains previously recognizedwill be included in the transition adjustment as a reduction toretained earnings. Although the initial impact of this policy changewill be significant, including a decrease to Retained earnings, we willrecognize the net income they generate over their remaining lives.Information regarding our securitization activities as at October 31,2010 is presented in Note 5 to our 2010 Annual ConsolidatedFinancial Statements.
Loans – Allowance for credit losses
IFRS and Canadian GAAP are significantly aligned in this area with anentity recognizing incurred losses that have been identified and yet tobe specifically identified. The grouping of these allowances will differunder IFRS as they will now be grouped into loans where theallowance is determined individually (wholesale loan allowance) andthose that were determined collectively (allowances based on poolsof loans or portfolios, i.e. specific retail loan allowances and ourgeneral allowance).
Special Purpose Entities (Variable Interest Entities under CanadianGAAP)
Under IFRS, consolidation of an entity is determined on the basis ofcontrol which is broader than the concepts of voting control andexposure to variable interests that are applied under Canadian GAAP.We have determined that as a result of this change in policy, we willnow consolidate certain entities and not consolidate others. We willcontinue to monitor our structures for changes in business activitiesthat may impact our initial consolidation decisions. The full impact ofthis policy change upon adoption of IFRS will depend on the assetsand liabilities in the structures on the transition date. Informationregarding entities in which we have a significant variable interest andthose we consolidate under Canadian GAAP as at October 31, 2010 isin Note 6 to our 2010 Annual Consolidated Financial Statements.
Goodwill and Intangibles
IFRS and Canadian GAAP both require goodwill and intangibles to beassessed for impairment. Under IFRS, impairment testing is required tobe performed at the level of cash generating units (CGU) which in somecases is lower than that of reporting units used for Canadian GAAP.IFRS and Canadian GAAP both use discounted cash flow models indetermining fair value, but IFRS has specific guidance regarding theuse of forecasted cash flows. We have eight reporting units underCanadian GAAP and we expect to have nine CGUs under IFRS.
The goodwill that is attributable to a CGU is generally that whicharose upon the acquisition of the entities that comprise that CGU. OurInternational Banking reporting unit will reside in two CGUs, U.S.
Banking and Caribbean Banking. The goodwill that arose upon theacquisition of RBTT will be attributed to the Caribbean Banking CGUwith the remainder residing in the U.S. Banking CGU, resulting inapproximately equal balances.
Our current goodwill allocation, which is presented in Note 10 toour 2010 Annual Consolidated Financial Statements, will be realignedto the new CGUs for impairment testing; the first such assessmentmust be completed as of November 1, 2010. Any resultingimpairment will be recorded as a transition adjustment but it will haveno impact on our Tier 1 ratio.
Employee Benefits – Actuarial Gains and Losses (Pensions and post-employment benefits under Canadian GAAP)
IFRS provides four alternatives for accounting for changes in ourdefined benefit liability. We may elect any one of the following:• Apply the corridor approach, which we currently apply under
Canadian GAAP, and continue to recognize a portion of ouractuarial gains and losses as income or expense;
• Recognize actuarial gains and losses related to benefit plansover the expected average remaining working lives of theemployees participating in that plan;
• Recognize actuarial gains and losses in the period in which theyoccur in the Consolidated Statements of Income; or
• Recognize actuarial gains and losses in Other ComprehensiveIncome (OCI).
We have elected to continue applying the corridor approach underIFRS.
Income Taxes
Under both IFRS and Canadian GAAP, income taxes are assessedbased on the balance sheet approach; however, differences exist inthe detailed application of the guidance related to the recognitionand measurement of deferred taxes. With respect to the areas withsignificant judgment, primarily uncertain tax positions and therecognition of deferred tax assets, we believe that there is nosignificant change required in how we recognize and measure theseitems.
Other Significant Accounting PoliciesWe will continue to monitor changes in IFRS to determine theimplications on our current accounting policies as well as ourbusiness and capital position. In addition to the critical accountingpolicies described above, the following change in accounting policy isexpected to have an impact upon transition.
Interests in Joint Ventures
Under IFRS, jointly controlled entities may be accounted for using theproportionate consolidation or the equity method. We have elected touse the equity method for measurement of investments whereas weare currently applying proportionate consolidation under CanadianGAAP.
Goodwill Impairment Assessment
GAAP requires us to test goodwill for impairment at least annually ormore often if events or circumstances indicate that it may be impaired.For further details, refer to ‘Goodwill and other intangible assets’ in theCritical accounting policies and estimates section described aboveand to Note 1 to our 2010 Annual Consolidated Financial Statements.The results of our annual test for possible impairment of goodwill as atAugust 1, 2010, indicated that the fair values of all of our reportingunits except International Banking exceeded their carrying values. As aresult, further analysis was required to determine if the $2.9 billion ofgoodwill allocated to the International Banking reporting unit, of whichapproximately half relates to our U.S. banking operations and theremainder to our Caribbean banking operations, was impaired. Thisfurther analysis compares the fair value of goodwill to its carryingvalue, with any shortfall indicating impairment. The fair value ofgoodwill is imputed by reference to the fair value of the reporting unitover the fair value of its net identifiable assets.
The fair value of our International Banking reporting unit wasestimated using an earnings-based approach which incorporatedinternal forecasts of revenues and expenses. Given the inability torely on recent performance as evidence supporting the probabilitythat our U.S. banking operations will achieve its forecast under theearnings based approach, which is exacerbated by the uncertaintiesand challenges created by the current market environment, wemodelled various scenarios reflecting different reasonably possibleoutcomes within the current market environment. The estimated fairvalue of the reporting unit also contains other significant judgmentsand assumptions, one of the most significant of which is the discountrate applied to the cash flows supporting our earnings basedvaluation approach. In determining the range of possible discountrates, we considered various factors including our ability to raisecapital in the current market, the risk premium associated with thespecific entities, and the potential impact of the Dodd-Frank Wall
Management’s Discussion and Analysis Royal Bank of Canada: Annual Report 2010 61

Street Reform and Consumer Protection Act on interchange revenue.We decided that the appropriate range was between 10.5% and11.5%, reflecting our internally generated cost of equity, uncertaintyin achieving forecasted results and our ability to raise capital relativeto our peers. We also considered the impact of higher marketobservable discount rates within our U.S. Banking peer group whichwe determined to be of lower relevance as most of these discountrates reflected some level of TARP financing, which we had notreceived.
The outcome of our analysis was also highly sensitive to thevaluation of the loan portfolios, which required significantmanagement judgement regarding key assumptions including theprobability of default, liquidity premiums, and exit prices indistressed markets. The selection of these assumptions was partic-ularly challenging in the current market conditions, given the relativelack of market-observable data in the U.S. and Caribbean.
After considering the weight of evidence available to us, ourconclusion regarding the goodwill of our International Bankingreporting unit was that it was not impaired. This conclusion wasbased on our review of various scenarios where we adjusted certainfactors to identify the range of reasonably possible outcomes. Giventhat the goodwill testing process is a complex one, requiringmanagement to make numerous assumptions and judgments, basedin many cases on uncertain information about future periods, theultimate margin between a decision of impairment and non-impairment could change significantly if any one of theseassumptions or judgments changes. Prolonged weakness or deterio-ration in economic market conditions, or additional regulatorychanges, may result in declines in business performance beyondmanagement expectations, which could lead to a significantlydifferent outcome, including a material impairment charge toearnings, in a future period related to some portion of the associatedgoodwill.
Pension obligations
Through a number of defined benefit and defined contribution planswe provide pension and post-employment benefits to eligibleemployees. Our defined benefit pension plans provide benefits basedon years of service, contributions and average earnings at retirement.Our other post-employment benefits include health, dental, disabilityand life insurance coverage.
We measured our benefit obligations and pension plan assets asat September 30, 2010. During the year, corporate bond yields, whichimpact the selection of a discount rate we use to measure our benefitobligations, have decreased across all maturities, mainly in the midand long ranges of the curve. This has resulted in an actuarial loss of$1,118 million in our benefit obligation, which more than offsets ourpension plan asset gains of $644 million and increased our overallpension liability. Gains and losses on our pension plan assets areamortized over the estimated average remaining service life of the
plan, which decreases the volatility to our expenses recognized everyyear. The strengthening of the Canadian dollar at year end resulted ina decrease of our pension liability for our U.S. and internationalplans. We fund our registered defined benefit pension plans inaccordance with actuarially determined amounts required to satisfyemployee benefit obligations under current pension regulations. Wecontinue to fund our pension plans in accordance with federal andprovincial regulations. For our principal pension plans, the mostrecent actuarial valuation performed for funding purposes wascompleted on January 1, 2010. Based on the result of this valuation,we increased our pension plan contributions for 2010 for an amountthat is in excess of the minimum funding requirement set by pensionregulators. Total contributions to our defined benefit pension plansfor 2010 were $1,288 million. For further information, refer to Note 20to our 2010 Annual Consolidated Financial Statements.
Controls and procedures
Disclosure controls and proceduresOur disclosure controls and procedures are designed to providereasonable assurance that information required to be disclosed by usin reports filed or submitted under Canadian and U.S. securities lawsis recorded, processed, summarized and reported within the timeperiods specified under those laws and include controls andprocedures that are designed to ensure that information is accumu-lated and communicated to management, including the President andChief Executive Officer, and the Chief Administrative Officer and ChiefFinancial Officer, to allow timely decisions regarding requireddisclosure.
As of October 31, 2010, management evaluated, under thesupervision of and with the participation of the President and ChiefExecutive Officer and the Chief Administrative Officer and ChiefFinancial Officer, the effectiveness of our disclosure controls andprocedures as defined under rules adopted by the United StatesSecurities and Exchange Commission. Based on that evaluation, thePresident and Chief Executive Officer and the Chief Administrative
Officer and Chief Financial Officer concluded that our disclosurecontrols and procedures were effective as of October 31, 2010.
Internal control over financial reportingManagement is responsible for establishing and maintainingadequate internal control over financial reporting. Internal controlover financial reporting is designed to provide reasonable assuranceregarding the reliability of financial reporting and the preparation offinancial statements for external purposes in accordance with GAAP.However, because of its inherent limitations, internal control overfinancial reporting may not prevent or detect misstatements on atimely basis. See Management’s Report on Internal Control overFinancial Reporting and the Report of Independent RegisteredChartered Accountants.
No changes were made in our internal control over financialreporting during the year ended October 31, 2010, that havematerially affected, or are reasonably likely to materially affect, ourinternal control over financial reporting.
62 Royal Bank of Canada: Annual Report 2010 Management’s Discussion and Analysis

Key performance and non-GAAP measures
Performance measures
Tier 1 common ratioWe use the Tier 1 common ratio in conjunction with regulatory capitalratios to evaluate our capital adequacy specifically related to commonequity. We believe that it is a useful supplemental measure of capitaladequacy. The Tier 1 common ratio does not have a standardizedmeaning under GAAP and may not be comparable to similar measuresdisclosed by other financial institutions. The following table providesa calculation of our Tier 1 common ratio:
Tier 1 common ratio Table 58
(C$ millions, except percentageamounts) 2010 2009 2008
Tier 1 capital $ 33,972 $ 31,774 $ 25,031Less:
Qualifying other NCI insubsidiaries 351 353 357
Innovative Tier 1 capitalinstruments (1) 3,327 3,991 3,857
Non-cumulative FirstPreferred shares (1) 4,810 4,811 2,657
Tier 1 common capital $ 25,484 $ 22,619 $ 18,160Risk-weighted assets $ 260,456 $ 244,837 $ 278,579
Tier 1 common ratio 9.8% 9.2% 6.5%
(1) Net of treasury shares.
Return on common equity and Return on risk capitalWe measure and evaluate the performance of our consolidatedoperations and each business segment using a number of financialmetrics such as net income, ROE and return on risk capital (RORC). Weuse ROE and RORC, at both the consolidated and business segmentlevels, as measures of return on total capital invested in ourbusinesses. The business segment ROE and RORC measures areviewed as useful measures by management for supporting
investment and resource allocation decisions because they adjust forcertain items that may affect comparability between businesssegments and certain competitors. RORC does not have standardizedmeaning under GAAP and may not be comparable to similar measuresdisclosed by other financial institutions.
Our consolidated ROE calculation is based on net incomeavailable to common shareholders divided by total average commonequity for the period. Business segment ROE calculations are basedon net income available to common shareholders divided by averageattributed capital for the period. For each segment, average attributedcapital, or economic capital, includes attributed risk capital requiredto underpin various risks as described in the Capital Managementsection and amounts invested in goodwill and intangibles (1).
RORC is used to measure returns on capital required to supportthe risks related to ongoing operations. Our RORC calculations arebased on net income available to common shareholders divided byattributed risk capital (which excludes goodwill and intangibles andunattributed capital).
The attribution of capital and risk capital involves the use ofassumptions, judgments and methodologies that are regularlyreviewed and revised by management as necessary. Changes to suchassumptions, judgments and methodologies can have a materialeffect on the segment ROE and RORC information that we report.Other companies that disclose information on similar attributions andrelated return measures may use different assumptions, judgmentsand methodologies.
The following table provides a summary of our ROE and RORCcalculations:
(1) For internal allocation and measurement purposes, total attributed capital is deemed bymanagement to comprise amounts necessary to support the risks inherent in thebusinesses (risk capital) and amounts related to historical investments (goodwill andintangibles). The difference between total average common equity and averageattributed capital is classified as Unattributed capital, which is reported in CorporateSupport for segment reporting purposes
Calculation of Return on equity and Return on risk capital Table 59
2010 2009 2008
(C$ millions, except percentage amounts) (1)Canadian
BankingWealth
Management InsuranceInternational
BankingCapital
MarketsCorporate
Support Total Total Total
Net income (loss) available tocommon shareholders $ 2,979 $ 640 $ 393 $ (369) $ 1,584 $ (262) $ 4,965 $ 3,625 $ 4,454
Average risk capital (2) $ 6,350 $ 1,000 $ 1,300 $ 3,000 $ 7,100 $ 750 $19,500 $18,600 $15,050add: Under/(over) attribution of capital – – – – – 3,650 3,650 600 1,900add: Goodwill and intangible capital 2,000 2,650 200 3,650 1,000 600 10,100 11,250 7,700
Average common equity (3) $ 8,350 $ 3,650 $ 1,500 $ 6,650 $ 8,100 $ 5,000 $33,250 $30,450 $24,650add: Impact of goodwill impairment charge – – – – – – – 550 –
Average common equity, excluding goodwill $ 8,350 $ 3,650 $ 1,500 $ 6,650 $ 8,100 $ 5,000 $33,250 $31,000 $24,650
ROE 35.6% 17.6% 26.6% (5.5)% 19.5% n.m. 14.9% 11.9% 18.1%add: Impact of goodwill impairment charge – – – – – – – 3.0% –
ROE 35.6% 17.6% 26.6% (5.5)% 19.5% n.m. 14.9% 14.9% 18.1%
RORC 46.9% 64.6% 30.1% (12.2)% 22.3% n.m. 25.4% 19.5% 29.6%
(1) Average risk capital, Goodwill and intangible capital, and Average common equity represent rounded figures. ROE and RORC are based on actual balances before rounding. These arecalculated using methods intended to approximate the average of the daily balances for the period.
(2) Average risk capital includes Credit, Market (trading and non-trading), Operational and Business and fixed assets, and Insurance risk capital. For further details, refer to the Capitalmanagement section.
(3) The amounts for the segments are referred to as attributed capital or economic capital.n.m. not meaningful
Management’s Discussion and Analysis Royal Bank of Canada: Annual Report 2010 63
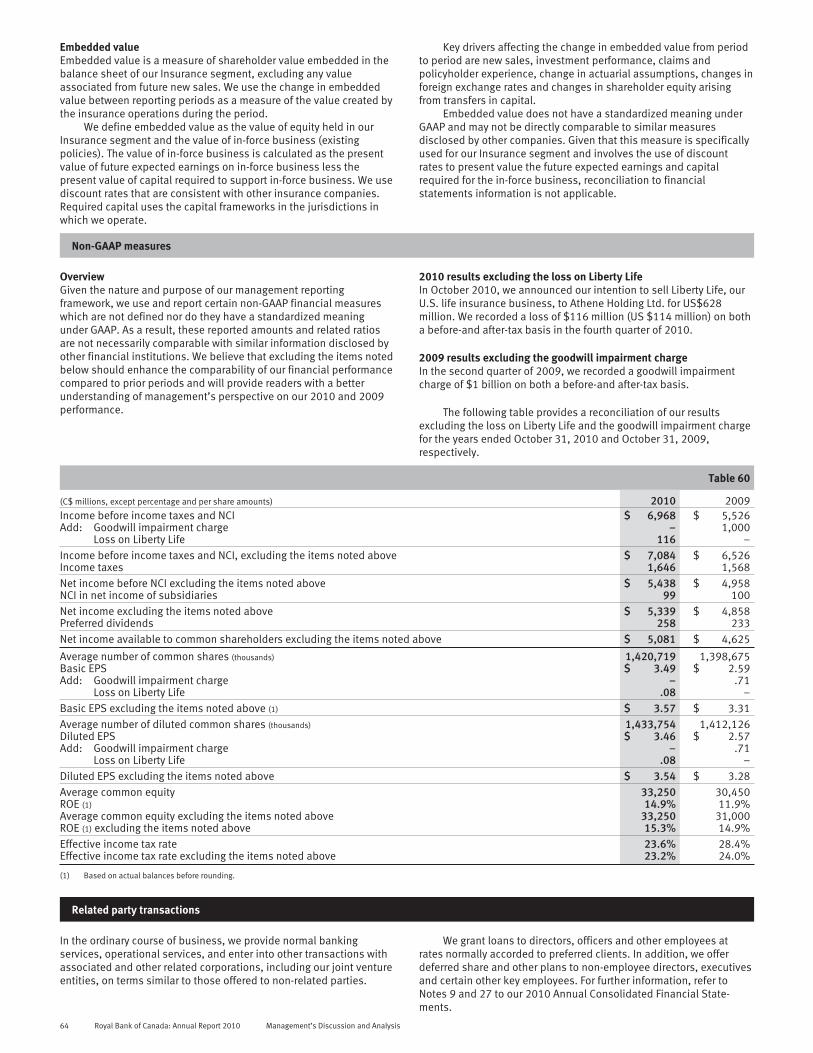
Embedded valueEmbedded value is a measure of shareholder value embedded in thebalance sheet of our Insurance segment, excluding any valueassociated from future new sales. We use the change in embeddedvalue between reporting periods as a measure of the value created bythe insurance operations during the period.
We define embedded value as the value of equity held in ourInsurance segment and the value of in-force business (existingpolicies). The value of in-force business is calculated as the presentvalue of future expected earnings on in-force business less thepresent value of capital required to support in-force business. We usediscount rates that are consistent with other insurance companies.Required capital uses the capital frameworks in the jurisdictions inwhich we operate.
Key drivers affecting the change in embedded value from periodto period are new sales, investment performance, claims andpolicyholder experience, change in actuarial assumptions, changes inforeign exchange rates and changes in shareholder equity arisingfrom transfers in capital.
Embedded value does not have a standardized meaning underGAAP and may not be directly comparable to similar measuresdisclosed by other companies. Given that this measure is specificallyused for our Insurance segment and involves the use of discountrates to present value the future expected earnings and capitalrequired for the in-force business, reconciliation to financialstatements information is not applicable.
Non-GAAP measures
OverviewGiven the nature and purpose of our management reportingframework, we use and report certain non-GAAP financial measureswhich are not defined nor do they have a standardized meaningunder GAAP. As a result, these reported amounts and related ratiosare not necessarily comparable with similar information disclosed byother financial institutions. We believe that excluding the items notedbelow should enhance the comparability of our financial performancecompared to prior periods and will provide readers with a betterunderstanding of management’s perspective on our 2010 and 2009performance.
2010 results excluding the loss on Liberty LifeIn October 2010, we announced our intention to sell Liberty Life, ourU.S. life insurance business, to Athene Holding Ltd. for US$628million. We recorded a loss of $116 million (US $114 million) on botha before-and after-tax basis in the fourth quarter of 2010.
2009 results excluding the goodwill impairment chargeIn the second quarter of 2009, we recorded a goodwill impairmentcharge of $1 billion on both a before-and after-tax basis.
The following table provides a reconciliation of our resultsexcluding the loss on Liberty Life and the goodwill impairment chargefor the years ended October 31, 2010 and October 31, 2009,respectively.
Table 60
(C$ millions, except percentage and per share amounts) 2010 2009Income before income taxes and NCI $ 6,968 $ 5,526Add: Goodwill impairment charge – 1,000Add: Loss on Liberty Life 116 –Income before income taxes and NCI, excluding the items noted above $ 7,084 $ 6,526Income taxes 1,646 1,568Net income before NCI excluding the items noted above $ 5,438 $ 4,958NCI in net income of subsidiaries 99 100Net income excluding the items noted above $ 5,339 $ 4,858Preferred dividends 258 233Net income available to common shareholders excluding the items noted above $ 5,081 $ 4,625
Average number of common shares (thousands) 1,420,719 1,398,675Basic EPS $ 3.49 $ 2.59Add: Goodwill impairment charge – .71Add: Loss on Liberty Life .08 –Basic EPS excluding the items noted above (1) $ 3.57 $ 3.31Average number of diluted common shares (thousands) 1,433,754 1,412,126Diluted EPS $ 3.46 $ 2.57Add: Goodwill impairment charge – .71Add: Loss on Liberty Life .08 –Diluted EPS excluding the items noted above $ 3.54 $ 3.28Average common equity 33,250 30,450ROE (1) 14.9% 11.9%Average common equity excluding the items noted above 33,250 31,000ROE (1) excluding the items noted above 15.3% 14.9%Effective income tax rate 23.6% 28.4%Effective income tax rate excluding the items noted above 23.2% 24.0%
(1) Based on actual balances before rounding.
Related party transactions
In the ordinary course of business, we provide normal bankingservices, operational services, and enter into other transactions withassociated and other related corporations, including our joint ventureentities, on terms similar to those offered to non-related parties.
We grant loans to directors, officers and other employees atrates normally accorded to preferred clients. In addition, we offerdeferred share and other plans to non-employee directors, executivesand certain other key employees. For further information, refer toNotes 9 and 27 to our 2010 Annual Consolidated Financial State-ments.
64 Royal Bank of Canada: Annual Report 2010 Management’s Discussion and Analysis

Supplemental information
Net interest income on average assets and liabilities Table 61
Average balances Interest (1) Average rate
(C$ millions, except percentage amounts) 2010 2009 2008 2010 2009 2008 2010 2009 2008
AssetsDeposits with other banks
Canada $ 1,060 $ 2,692 $ 1,837 $ 14 $ 37 $ 45 1.32% 1.37% 2.45%United States 4,167 4,674 4,168 12 11 137 0.29 .24 3.29Other International 4,846 3,976 7,802 33 114 316 0.68 2.87 4.05
10,073 11,342 13,807 59 162 498 0.59 1.43 3.61
SecuritiesTrading (3) 151,724 136,963 149,098 3,729 4,041 4,862 2.46 2.95 3.26Available–for–sale 42,589 50,686 39,626 1,041 1,905 1,800 2.44 3.76 4.54
194,313 187,649 188,724 4,770 5,946 6,662 2.45 3.17 3.53
Asset purchased under reverse repurchaseagreements and securities borrowed 57,508 44,476 68,356 474 931 2,889 0.82 2.09 4.23
LoansCanada
Retail (3) 204,592 185,318 170,300 9,138 8,660 7,446 4.47 4.67 4.37Wholesale 30,716 35,074 38,558 1,035 1,179 2,443 3.37 3.36 6.34
235,308 220,392 208,858 10,173 9,839 9,889 4.32 4.46 4.73
United States 34,739 42,227 35,096 1,376 1,777 2,161 3.96 4.21 6.16Other International 15,243 17,559 15,623 1,821 1,923 2,939 11.95 10.95 18.81
285,290 280,178 259,577 13,370 13,539 14,989 4.69 4.83 5.77
Total interest–earning assets 547,184 523,645 530,464 18,673 20,578 25,038 3.41 3.93 4.72Non–interest–bearing deposits with other
banks 5,923 5,895 3,702 – – – – – –Customers’ liability under acceptances 7,984 10,247 11,274 – – – – – –Other assets 121,909 155,513 104,860 – – – – – –
Total assets $683,000 $695,300 $650,300 $18,673 $20,578 $25,038 2.73% 2.96% 3.85%
Liabilities and shareholders’ equityDeposits (2), (3)
Canada $177,830 $172,736 $165,400 $ 2,646 $ 2,946 $ 4,423 1.49% 1.71% 2.67%United States 54,483 58,679 56,234 334 778 1,758 0.61 1.33 3.13Other International 126,460 143,736 150,564 2,111 3,038 5,977 1.67 2.11 3.97
358,773 375,151 372,198 5,091 6,762 12,158 1.42 1.80 3.27
Obligations related to securities sold short 47,689 37,597 45,367 1,749 1,286 1,525 3.67 3.42 3.36Obligations related to assets sold under
repurchase agreements and securitiesloaned 42,941 36,647 36,558 374 409 1,613 0.87 1.12 4.41
Subordinated debentures 6,321 7,377 7,183 307 350 354 4.86 4.74 4.93Other interest–bearing liabilities 1,849 3,943 3,962 175 230 334 9.46 5.83 8.43
Total interest–bearing liabilities 457,573 460,715 465,268 7,696 9,037 15,984 1.68 1.96 3.44Non–interest–bearing deposits (3) 51,906 46,807 38,843 – – – – – –Acceptances 7,984 10,247 11,274 – – – – – –Other liabilities 127,578 142,964 108,116 – – – – – –
Total liabilities $645,041 $660,733 $623,501 $ 7,696 $ 9,037 $15,984 1.19% 1.37% 2.56%
Shareholders’ EquityPreferred 4,718 4,130 1,795 – – – – – –Common 33,241 30,437 25,004 – – – – – –
Total liabilities and shareholders’ equity $683,000 $695,300 $650,300 $ 7,696 $ 9,037 $15,984 1.13% 1.30% 2.46%
Net interest income and margin $683,000 $695,300 $650,300 $10,977 $11,541 $ 9,054 1.61% 1.66% 1.39%
Net interest income and margin (averageearning assets)Canada $333,546 $311,715 $308,574 $ 8,405 $ 7,863 $ 6,935 2.52% 2.52% 2.25%United States 98,193 107,131 108,733 1,718 2,134 1,132 1.75 1.99 1.04Other International 115,445 104,799 113,157 854 1,544 987 0.74 1.47 .87
Total $547,184 $523,645 $530,464 $10,977 $11,541 $ 9,054 2.01% 2.20% 1.71%
(1) Interest income includes loan fees of $410 million (2009 – $398 million; 2008 – $343 million).(2) Deposits include savings deposits with average balances of $90 billion (2009 – $72 billion; 2008 – $56 billion), interest expense of $.4 billion (2009 – $.4 billion; 2008 – $.6 billion) and
average rates of .5% (2009 – .5%; 2008 – 1.0%). Deposits also include term deposits with average balances of $236 billion (2009 – $271 billion; 2008 – $287 billion), interest expense of$3.9 billion (2009 – $5.6 billion; 2008 – $10.1 billion) and average rates of 1.65% (2009 – 2.07%; 2008 – 3.53%).
(3) Comparative amounts have been reclassified from those previously reported.
Management’s Discussion and Analysis Royal Bank of Canada: Annual Report 2010 65

Change in net interest income (1) Table 62
2010 vs. 2009 2009 vs. 2008Increase (decrease) due
to changes inIncrease (decrease) due
to changes in
(C$ millions)Average
volume (2)Averagerate (2)
Netchange
Averagevolume (2)
Averagerate (2)
Netchange
AssetsDeposits with other banks
Canada $ (22) $ (1) $ (23) $ 16 $ (24) $ (8)U.S. (1) 2 1 15 (141) (126)Other international 21 (102) (81) (127) (75) (202)
SecuritiesTrading (3) 407 (719) (312) (378) (443) (821)Available-for-sale (272) (592) (864) 448 (343) 105
Asset purchased under reverse repurchase agreements andsecurities borrowed 219 (676) (457) (801) (1,157) (1,958)
LoansCanada
Retail (3) 873 (395) 478 682 532 1,214Wholesale (147) 3 (144) (204) (1,060) (1,264)
U.S. (301) (100) (401) 385 (769) (384)Other international (267) 165 (102) 330 (1,346) (1,016)
Total interest income $ 510 $(2,415) $(1,905) $ 366 $(4,826) $ (4,460)
LiabilitiesDeposits (3)
Canada $ 85 $ (385) $ (300) $ 188 $(1,665) $ (1,477)U.S. (52) (392) (444) 73 (1,053) (980)Other international (337) (590) (927) (260) (2,679) (2,939)
Obligations related to securities sold short 365 98 463 (265) 26 (239)Obligations related to assets sold under repurchase agreements
and securities loaned 64 (99) (35) 4 (1,208) (1,204)Subordinated debentures (51) 8 (43) 9 (13) (4)Other interest-bearing liabilities (158) 103 (55) – (104) (104)
Total interest expense $ (84) $(1,257) $(1,341) $ (251) $(6,696) $ (6,947)
Net interest income $ 594 $(1,158) $ (564) $ 617 $ 1,870 $ 2,487
(1) Geographic classification for selected assets and liabilities is based on the domicile of the booking point of the subject assets and liabilities.(2) Volume/rate variance is allocated on the percentage relationship of changes in balances and changes in rates to the total net change in net interest income.(3) Comparative amounts have been reclassified from those previously reported.
Loans and acceptances by geography Table 63
As at October 31 (C$ millions) 2010 2009 2008 2007 2006
CanadaResidential mortgages $124,064 $117,292 $117,690 $107,453 $ 94,272Personal 69,291 60,493 48,780 42,506 37,946Credit cards 9,704 8,285 8,538 8,142 6,966Small business 2,712 2,851 2,804 2,652 2,318
Retail 205,771 188,921 177,812 160,753 141,502
Business $ 45,217 $ 47,110 $ 53,775 $ 51,237 $ 44,353Sovereign 2,785 1,394 1,544 585 553Bank 808 1,096 978 521 160
Wholesale 48,810 49,600 56,297 52,343 45,066
$254,581 $238,521 $234,109 $213,096 $186,568
United StatesRetail $ 11,121 $ 11,678 $ 12,931 $ 6,804 $ 7,652Wholesale 20,852 25,387 30,943 18,548 13,847
31,973 37,065 43,874 25,352 21,499
Other InternationalRetail $ 4,936 $ 4,625 $ 4,712 $ 1,905 $ 1,896Wholesale 11,084 12,964 20,345 10,862 9,084
16,020 17,589 25,057 12,767 10,980
Total loans and acceptances $302,574 $293,175 $303,040 $251,215 $219,047
Total allowance for loan losses (2,997) (3,188) (2,215) (1,493) (1,409)
Total loans and acceptances, net of allowance for loan losses $299,577 $289,987 $300,825 $249,722 $217,638
66 Royal Bank of Canada: Annual Report 2010 Management’s Discussion and Analysis

Loans and acceptances by portfolio and sector Table 64
As at October 31 (C$ millions) 2010 2009 2008 2007 2006
Residential mortgages $ 128,832 $ 122,130 $ 122,991 $ 109,745 $ 96,675Personal 80,174 71,542 60,727 48,743 44,902Credit cards 10,110 8,701 8,933 8,322 7,155Small business 2,712 2,851 2,804 2,652 2,318
Retail 221,828 205,224 195,455 169,462 151,050
BusinessAgriculture $ 4,815 $ 5,090 $ 5,305 $ 5,367 $ 5,435Automotive 3,527 3,657 3,999 3,285 2,958Consumer goods 5,912 6,141 7,389 5,206 4,553Energy 5,945 7,055 8,146 7,632 6,010Non-bank financial services 4,769 3,541 8,788 6,959 4,459Forest products 792 830 1,152 1,349 1,126Industrial products 3,731 3,972 5,033 4,119 3,659Mining & metals 635 1,774 3,947 2,301 1,072Real estate & related 18,358 21,049 22,978 19,187 16,145Technology & media 2,569 2,562 3,206 2,423 2,326Transportation & environment 3,759 4,413 4,239 2,656 2,400Other (1) 20,253 22,572 25,623 17,583 15,586Sovereign 3,765 2,779 2,496 932 887Bank 1,916 2,516 5,284 2,754 1,381
Wholesale 80,746 87,951 107,585 81,753 67,997
Total loans and acceptances $ 302,574 $ 293,175 $ 303,040 $ 251,215 $ 219,047
Total allowance for loan losses (2,997) (3,188) (2,215) (1,493) (1,409)
Total loans and acceptances, net of allowance for loan losses $ 299,577 $ 289,987 $ 300,825 $ 249,722 $ 217,638
(1) Other in 2010 related to other services, $8.1 billion; financing products, $5.1 billion; holding and investments, $4.0 billion; health, $2.7 billion; and other, $.4 billion.
Management’s Discussion and Analysis Royal Bank of Canada: Annual Report 2010 67
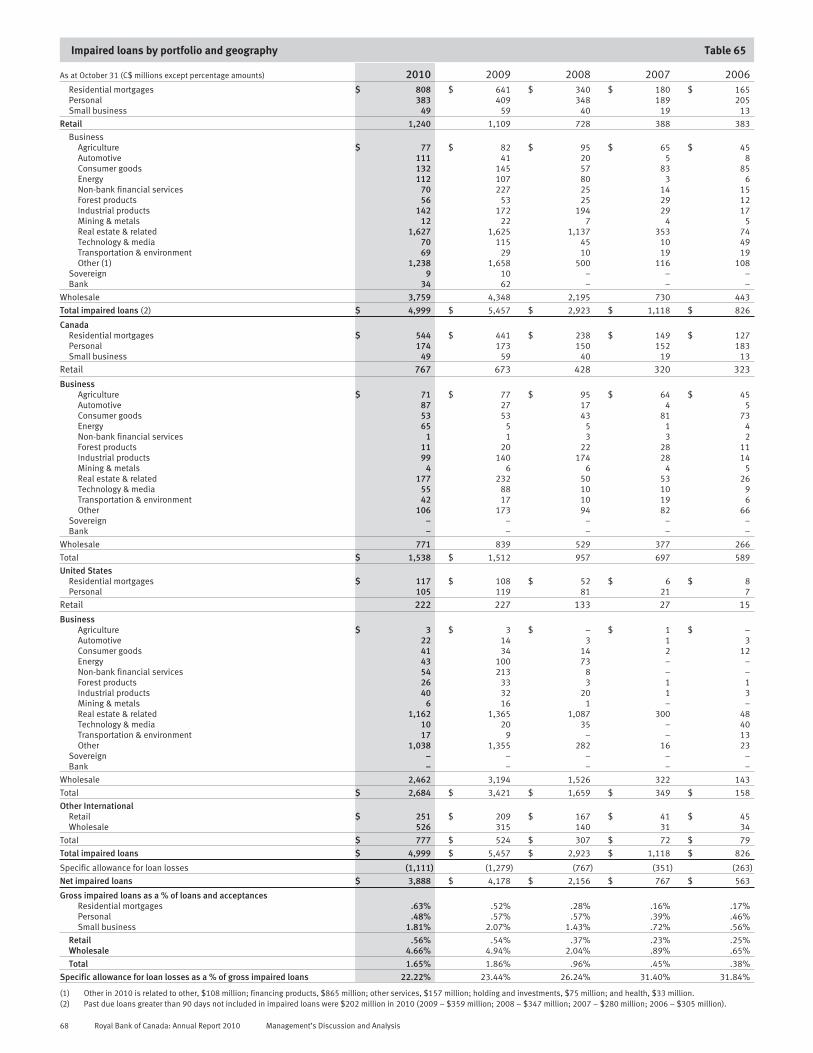
Impaired loans by portfolio and geography Table 65
As at October 31 (C$ millions except percentage amounts) 2010 2009 2008 2007 2006Residential mortgages $ 808 $ 641 $ 340 $ 180 $ 165Personal 383 409 348 189 205Small business 49 59 40 19 13
Retail 1,240 1,109 728 388 383
BusinessAgriculture $ 77 $ 82 $ 95 $ 65 $ 45Automotive 111 41 20 5 8Consumer goods 132 145 57 83 85Energy 112 107 80 3 6Non-bank financial services 70 227 25 14 15Forest products 56 53 25 29 12Industrial products 142 172 194 29 17Mining & metals 12 22 7 4 5Real estate & related 1,627 1,625 1,137 353 74Technology & media 70 115 45 10 49Transportation & environment 69 29 10 19 19Other (1) 1,238 1,658 500 116 108
Sovereign 9 10 – – –Bank 34 62 – – –
Wholesale 3,759 4,348 2,195 730 443
Total impaired loans (2) $ 4,999 $ 5,457 $ 2,923 $ 1,118 $ 826
CanadaResidential mortgages $ 544 $ 441 $ 238 $ 149 $ 127Personal 174 173 150 152 183Small business 49 59 40 19 13
Retail 767 673 428 320 323
BusinessAgriculture $ 71 $ 77 $ 95 $ 64 $ 45Automotive 87 27 17 4 5Consumer goods 53 53 43 81 73Energy 65 5 5 1 4Non-bank financial services 1 1 3 3 2Forest products 11 20 22 28 11Industrial products 99 140 174 28 14Mining & metals 4 6 6 4 5Real estate & related 177 232 50 53 26Technology & media 55 88 10 10 9Transportation & environment 42 17 10 19 6Other 106 173 94 82 66
Sovereign – – – – –Bank – – – – –
Wholesale 771 839 529 377 266
Total $ 1,538 $ 1,512 957 697 589
United StatesResidential mortgages $ 117 $ 108 $ 52 $ 6 $ 8Personal 105 119 81 21 7
Retail 222 227 133 27 15
BusinessAgriculture $ 3 $ 3 $ – $ 1 $ –Automotive 22 14 3 1 3Consumer goods 41 34 14 2 12Energy 43 100 73 – –Non-bank financial services 54 213 8 – –Forest products 26 33 3 1 1Industrial products 40 32 20 1 3Mining & metals 6 16 1 – –Real estate & related 1,162 1,365 1,087 300 48Technology & media 10 20 35 – 40Transportation & environment 17 9 – – 13Other 1,038 1,355 282 16 23
Sovereign – – – – –Bank – – – – –
Wholesale 2,462 3,194 1,526 322 143
Total $ 2,684 $ 3,421 $ 1,659 $ 349 $ 158
Other InternationalRetail $ 251 $ 209 $ 167 $ 41 $ 45Wholesale 526 315 140 31 34
Total $ 777 $ 524 $ 307 $ 72 $ 79
Total impaired loans $ 4,999 $ 5,457 $ 2,923 $ 1,118 $ 826
Specific allowance for loan losses (1,111) (1,279) (767) (351) (263)
Net impaired loans $ 3,888 $ 4,178 $ 2,156 $ 767 $ 563
Gross impaired loans as a % of loans and acceptancesResidential mortgages .63% .52% .28% .16% .17%Personal .48% .57% .57% .39% .46%Small business 1.81% 2.07% 1.43% .72% .56%
Retail .56% .54% .37% .23% .25%Wholesale 4.66% 4.94% 2.04% .89% .65%
Total 1.65% 1.86% .96% .45% .38%
Specific allowance for loan losses as a % of gross impaired loans 22.22% 23.44% 26.24% 31.40% 31.84%
(1) Other in 2010 is related to other, $108 million; financing products, $865 million; other services, $157 million; holding and investments, $75 million; and health, $33 million.(2) Past due loans greater than 90 days not included in impaired loans were $202 million in 2010 (2009 – $359 million; 2008 – $347 million; 2007 – $280 million; 2006 – $305 million).
68 Royal Bank of Canada: Annual Report 2010 Management’s Discussion and Analysis

Provision for (recovery of) credit losses by portfolio and geography (1) Table 66
(C$ millions, except percentage amounts) 2010 2009 2008 2007 2006Residential mortgages $ 60 $ 73 $ 16 $ 5 $ 6Personal 595 701 445 364 306Credit cards 413 402 270 223 163Small business 45 55 46 34 29
Retail 1,113 1,231 777 626 504
BusinessAgriculture $ 19 $ 20 $ 5 $ 2 $ (1)Automotive 21 21 10 2 4Consumer goods 37 61 19 27 7Energy (6) 16 21 (7) (53)Non–bank financial services (30) 266 – – 4Forest products 5 13 2 10 2Industrial products 3 67 95 10 4Mining & metals – 7 2 1 –Real estate & related 512 587 345 78 1Technology & media 5 96 21 (2) (5)Transportation & environment 12 11 3 7 1Other 129 408 130 28 14
Sovereign – – – – –Bank 15 20 – – –
Wholesale 722 1,593 653 156 (22)
Total specific provision $ 1,835 $ 2,824 $ 1,430 $ 782 $ 482
CanadaResidential mortgages $ 7 $ 18 $ 8 $ 5 $ 6Personal 444 467 352 334 296Credit cards 399 393 266 220 161Small business 45 55 46 34 29
Retail 895 933 672 593 492
BusinessAgriculture 18 18 5 2 (1)Automotive 15 17 10 2 4Consumer goods 17 26 13 26 6Energy 3 (4) (3) (4) (10)Non–bank financial services (1) 36 – – –Forest products 3 9 2 10 1Industrial products (4) 36 78 10 4Mining & metals 2 2 1 1 –Real estate & related 35 52 12 15 2Technology & media (6) 33 4 4 1Transportation & environment 10 7 3 8 2Other (1) 30 204 27 28 6
Sovereign – – – – –Bank – – – – –
Wholesale 122 436 152 102 15
Total $ 1,017 $ 1,369 $ 824 $ 695 $ 507
United StatesResidential mortgages $ 35 $ 51 $ 6 $ 1 $ –Personal 138 207 74 22 10Credit cards 14 9 4 3 2Small business – – – – –
Retail 187 267 84 26 12
BusinessAgriculture $ 1 $ 2 $ – $ – $ –Automotive 6 4 – – –Consumer goods 8 23 6 1 1Energy (7) 20 24 (3) (43)Non–bank financial services (29) 230 – – 4Forest products 2 4 – – 1Industrial products 7 31 17 – –Mining & metals (2) 5 1 – –Real estate & related 419 527 333 63 –Technology & media 11 60 17 (6) (6)Transportation & environment 2 3 – – (1)Other 58 187 96 3 6
Sovereign – – – – –Bank – – – – –
Wholesale 476 1,096 494 58 (38)
Total $ 663 $ 1,363 $ 578 $ 84 $ (26)
Other InternationalRetail $ 31 $ 31 $ 21 $ 7 $ –Wholesale 124 61 7 (4) 1
Total 155 92 28 3 1
Total specific provision $ 1,835 $ 2,824 $ 1,430 $ 782 $ 482
Total general provision 26 589 165 9 (53)
Total provision for credit losses $ 1,861 $ 3,413 $ 1,595 $ 791 $ 429
Specific provision as a % of average net loans and acceptances .63% .97% .53% .33% .23%
(1) Other in 2010 is related to financing products, nil; other services, $50 million; health, $8 million; holdings and investments, $28 million; and other, $43 million.
Management’s Discussion and Analysis Royal Bank of Canada: Annual Report 2010 69

Allowance for credit losses by portfolio and geography Table 67
(C$ millions, except percentage amounts) 2010 2009 (1) 2008 2007 2006Allowance at beginning of year $ 3,302 $ 2,438 $ 1,572 $ 1,486 $ 1,568Provision for credit losses 1,861 3,413 1,595 791 429Write–offs by portfolio
Residential mortgages (46) (52) (9) (5) (5)Personal (690) (732) (504) (446) (379)Credit cards (477) (455) (319) (268) (204)Small business (56) (54) (44) (42) (36)
Retail (1,269) (1,293) (876) (761) (624)
Business $ (949) $ (1,373) $ (435) $ (107) $ (89)Sovereign – – – – –Bank – – – – –
Wholesale (949) (1,373) (435) (107) (89)Total write–offs by portfolio $ (2,218) $ (2,666) $ (1,311) $ (868) $ (713)
Recoveries by portfolioResidential mortgages $ 2 $ 1 $ 1 $ 1 $ –Personal 91 74 76 75 64Credit cards 64 53 49 46 41Small business 7 5 7 7 7
Retail 164 133 133 129 112Business $ 72 $ 140 $ 29 $ 41 $ 93Sovereign – – – – –Bank – – – – –
Wholesale 72 140 29 41 93Total recoveries by portfolio $ 236 $ 273 $ 162 $ 170 $ 205
Net write–offs $ (1,982) $ (2,393) $ (1,149) $ (698) $ (508)Adjustments (2) (85) (156) 281 (7) (3)
Total allowance for credit losses at end of year $ 3,096 $ 3,302 $ 2,299 $ 1,572 $ 1,486
Specific allowance for loan lossesCanada
Residential mortgages $ 47 $ 39 $ 23 $ 13 $ 11Personal 88 94 79 79 88Small business 18 22 17 9 9
Retail 153 155 119 101 108
BusinessAgriculture $ 14 $ 10 $ 13 $ 9 $ 8Automotive 27 6 5 2 3Consumer goods 20 18 12 45 32Energy 10 1 2 – 2Non–bank financial services 1 – 9 9 10Forest products 4 8 4 10 2Industrial products 36 63 49 9 8Mining & metals 1 1 1 1 1Real estate & related 36 44 9 18 10Technology & media 12 32 6 5 5Transportation & environment 6 7 5 7 7Other 40 72 23 38 24
Sovereign – – – – –Bank – – – – –
Wholesale 207 262 138 153 112$ 360 $ 417 $ 257 $ 254 $ 220
United StatesResidential mortgages $ 12 $ 10 $ 5 $ 1 $ 1Personal 29 34 16 5 2Small business – – – – –
Retail 41 44 21 6 3
BusinessAgriculture $ 1 $ 1 $ – $ – $ 1Automotive 8 5 – – 2Consumer goods 8 9 6 – 3Energy 12 42 27 – –Non–bank financial services 5 62 – – 1Forest products 2 2 – – –Industrial products 8 17 8 – –Mining & metals – 5 1 – –Real estate & related 162 241 241 56 1Technology & media 6 3 13 – –Transportation & environment 2 3 – – –Other 220 233 79 6 4
Sovereign – – – – –Bank – – – – –
Wholesale 434 623 375 62 12$ 475 $ 667 $ 396 $ 68 $ 15
Other InternationalRetail $ 83 $ 74 $ 68 $ 13 $ 12Wholesale 193 121 46 16 16
276 195 114 29 28Total specific allowance for loan losses $ 1,111 $ 1,279 $ 767 $ 351 $ 263General allowance
Residential mortgages $ 77 $ 50 $ 20 $ 16 $ 19Personal 709 671 461 349 365Credit cards 384 327 270 193 195Small business 60 47 47 37 37
Retail 1,230 1,095 798 595 616Wholesale 656 814 650 370 349General allowance for off–balance sheet items and other items 99 114 84 256 258Total general allowance $ 1,985 $ 2,023 $ 1,532 $ 1,221 $ 1,223Total allowance for credit losses $ 3,096 $ 3,302 $ 2,299 $ 1,572 $ 1,486Key ratios
Allowance for credit losses as a % of loans and acceptances 1.02% 1.13% .76% .63% .68%Net write–offs as a % of average net loans and acceptances .68% .82% .42% .30% .25%
(1) Opening allowance for credit losses as at November 1, 2008 has been restated due to the implementation of amendments to CICA section 3855.(2) Other adjustments include primarily foreign exchange translations on non–Canadian dollar–denominated allowance for credit losses and acquisition adjustments for RBTT $25 million in
2008; ANB $50 million in 2008; and Flag Bank $21 million in 2007.
70 Royal Bank of Canada: Annual Report 2010 Management’s Discussion and Analysis

Credit quality information by Canadian province Table 68
(C$ millions) 2010 2009 2008 2007 2006
Loans and acceptancesAtlantic provinces (1) $ 13,942 $ 12,709 $ 11,446 $ 11,556 $ 10,256Quebec 31,396 28,739 32,908 35,168 32,723Ontario 112,559 106,957 105,410 90,242 81,968Prairie provinces (2) 51,563 47,654 43,884 40,956 32,598B.C. and territories (3) 45,121 42,462 40,461 35,174 29,023
Total loans and acceptances in Canada $ 254,581 $ 238,521 $ 234,109 $ 213,096 $ 186,568
Gross impaired loansAtlantic provinces (1) $ 72 $ 57 $ 66 $ 53 $ 53Quebec 162 190 122 118 68Ontario 598 647 504 322 286Prairie provinces (2) 429 300 158 112 107B.C. and territories (3) 277 318 107 92 75
Total gross impaired loans in Canada $ 1,538 $ 1,512 $ 957 $ 697 $ 589
Specific provisionAtlantic provinces (1) $ 50 $ 56 $ 43 $ 40 $ 33Quebec 85 90 63 66 47Ontario 659 942 610 490 344Prairie provinces (2) 146 138 60 51 38B.C. and territories (3) 77 143 48 48 45
Total specific provision for credit losses in Canada $ 1,017 $ 1,369 $ 824 $ 695 $ 507
(1) Comprises Newfoundland and Labrador, Prince Edward Island, Nova Scotia and New Brunswick.(2) Comprises Manitoba, Saskatchewan and Alberta.(3) Comprises British Columbia, Nunavut, Northwest Territories and Yukon.
Small business loans and acceptances in Canada by sector Table 69
As at October 31 (C$ millions) 2010 2009 2008 2007 2006
Agriculture $ 332 $ 304 $ 261 $ 271 $ 248Automotive 643 666 636 650 601Consumer goods 2,367 2,261 2,234 2,350 2,043Energy 393 367 384 370 284Non-bank financial services 73 66 84 88 73Forest products 305 316 346 351 366Industrial products 1,712 1,696 1,672 1,543 1,377Mining & metals 113 102 100 98 88Real estate & related 3,205 3,053 3,052 2,822 2,565Technology & media 318 318 316 314 300Transportation & environment 941 961 940 901 774Other (1) 5,360 5,013 4,687 4,488 4,098
Total small business loans $ 15,762 $ 15,123 $ 14,712 $ 14,246 $ 12,817
(1) Other sector in 2010 related primarily to other services, $3.2 billion; health, $1.6 billion; holding and investment, $474 million; financing products, $73 million; and other, $46 million.
Management’s Discussion and Analysis Royal Bank of Canada: Annual Report 2010 71

72 Royal Bank of Canada: Annual Report 2010

REPORTS AND CONSOLIDATED FINANCIAL STATEMENTS
74 Reports
74 Management’s Responsibilityfor Financial Reporting
74 Report of IndependentRegistered CharteredAccountants
74 Comments by IndependentRegistered CharteredAccountants on Canada-UnitedStates of America ReportingDifference
75 Management’s Report onInternal Control over FinancialReporting
75 Report of IndependentRegistered CharteredAccountants
76 Consolidated Financial Statements
76 Consolidated Balance Sheets
77 Consolidated Statements ofIncome
78 Consolidated Statements ofComprehensive Income andChanges in Shareholders’Equity
79 Consolidated Statements ofCash Flows
80 Notes to the Consolidated FinancialStatements
80 Note 1 Significantaccountingpolicies andestimates
85 Note 2 Fair value offinancialinstruments
95 Note 3 Securities
98 Note 4 Loans
100 Note 5 Securitizations
103 Note 6 Variable interestentities
104 Note 7 Derivativeinstruments andhedging activities
109 Note 8 Premises andequipment
109 Note 9 RBC Dexia InvestorServices jointventure
109 Note 10 Goodwill and otherIntangibles
110 Note 11 Significant acquis-itions anddispositions
110 Note 12 Other assets
111 Note 13 Deposits
111 Note 14 Insurance
112 Note 15 Other liabilities
112 Note 16 Subordinateddebentures
113 Note 17 Trust capitalsecurities
114 Note 18 Preferred shareliabilities and sharecapital
116 Note 19 Non-controllinginterest insubsidiaries
116 Note 20 Pensions and otherpost-employmentbenefits
119 Note 21 Stock-basedcompensation
121 Note 22 Revenue fromtrading andselected non-trading financialinstruments
122 Note 23 Income taxes
123 Note 24 Earnings per share
123 Note 25 Guarantees,commitments andcontingencies
126 Note 26 Contractualrepricing andmaturity schedule
127 Note 27 Related partytransactions
128 Note 28 Results by businessand geographicsegment
130 Note 29 Nature and extentof risks arising fromfinancial instru-ments
130 Note 30 Capitalmanagement
131 Note 31 Reconciliationof the application ofCanadian andUnited Statesgenerally acceptedaccountingprinciples
150 Note 32 Parent companyinformation
Consolidated Financial Statements Royal Bank of Canada: Annual Report 2010 73
Management’s Responsibility for Financial Reporting
The accompanying consolidated financial statements of Royal Bank ofCanada (RBC) were prepared by management, which is responsiblefor the integrity and fairness of the information presented, includingthe many amounts that must of necessity be based on estimates andjudgments. These consolidated financial statements were prepared inaccordance with the Bank Act (Canada) and Canadian generallyaccepted accounting principles (GAAP). Financial informationappearing throughout our Management’s Discussion and Analysis isconsistent with these consolidated financial statements.
RBC’s internal controls are designed to provide reasonableassurance that transactions are authorized, assets are safeguardedand proper records are maintained. These controls include qualitystandards in hiring and training of employees, policies and proce-dures manuals, a corporate code of conduct and accountability forperformance within appropriate and well-defined areas of responsi-bility.
The system of internal controls is further supported by acompliance function, which is designed to ensure that we and ouremployees comply with securities legislation and conflict of interestrules, and by an internal audit staff, which conducts periodic audits ofall aspects of our operations.
The Board of Directors oversees management’s responsibilitiesfor financial reporting through an Audit Committee, which iscomposed entirely of independent directors. This Committee reviewsour consolidated financial statements and recommends them to theBoard for approval. Other key responsibilities of the Audit Committee
include reviewing our existing internal control procedures andplanned revisions to those procedures, and advising the directors onauditing matters and financial reporting issues. Our Chief ComplianceOfficer and Chief Internal Auditor have full and unrestricted access tothe Audit Committee.
The Office of the Superintendent of Financial Institutions Canada(OSFI) examines and inquires into the business and affairs of RBC asdeemed necessary to determine whether the provisions of the BankAct are being complied with, and that RBC is in sound financialcondition. In carrying out its mandate, OSFI strives to protect therights and interests of depositors and creditors of RBC.
Deloitte & Touche LLP, Independent Registered CharteredAccountants appointed by the shareholders of RBC upon therecommendation of the Audit Committee and Board, have performedan independent audit of the consolidated financial statements andtheir report follows. The auditors have full and unrestricted access tothe Audit Committee to discuss their audit and related findings.
Gordon M. NixonPresident and Chief Executive Officer
Janice R. FukakusaChief Administrative Officer and Chief Financial Officer
Toronto, December 2, 2010
Report of Independent Registered Chartered Accountants
To the Shareholders of Royal Bank of Canada
We have audited the consolidated balance sheets of Royal Bank ofCanada (the “Bank”) as at October 31, 2010 and 2009 and theconsolidated statements of income, comprehensive income, changesin shareholders’ equity and cash flows for each of the years in thethree year period ended October 31, 2010. These financial state-ments are the responsibility of the Bank’s management. Ourresponsibility is to express an opinion on these financial statementsbased on our audits.
We conducted our audits in accordance with Canadian generallyaccepted auditing standards and the standards of the PublicCompany Accounting Oversight Board (United States). Thesestandards require that we plan and perform an audit to obtainreasonable assurance whether the financial statements are free ofmaterial misstatement. An audit includes examining, on a test basis,evidence supporting the amounts and disclosures in the financialstatements. An audit also includes assessing the accountingprinciples used and significant estimates made by management, aswell as evaluating the overall financial statement presentation. Webelieve that our audits provide a reasonable basis for our opinion.
In our opinion, these consolidated financial statements presentfairly, in all material respects, the financial position of the Bank as atOctober 31, 2010 and 2009 and the results of its operations and itscash flows for each of the years in the three year period endedOctober 31, 2010 in accordance with Canadian generally acceptedaccounting principles.
We have also audited, in accordance with the standards of thePublic Company Accounting Oversight Board (United States), theBank’s internal control over financial reporting as of October 31, 2010based on the criteria established in Internal Control – IntegratedFramework issued by the Committee of Sponsoring Organizations ofthe Treadway Commission and our report dated December 2, 2010expressed an unqualified opinion on the Bank’s internal control overfinancial reporting.
Deloitte & Touche LLPIndependent Registered Chartered AccountantLicensed Public Accountants
Toronto, CanadaDecember 2, 2010
Comments by Independent Registered Chartered Accountants on Canada-United States of America Reporting Difference
The standards of the Public Company Accounting Oversight Board(United States) require the addition of an explanatory paragraph(following the opinion paragraph) when there is a change inaccounting principles that has a material effect on the comparabilityof the Bank’s financial statements, such as the changes described inNotes 1, 2, 19, 20, and 31 to the consolidated financial statements.Although we conducted our audits in accordance with both Canadiangenerally accepted auditing standards and the standards of thePublic Company Accounting Oversight Board (United States), ourreport to the shareholders dated December 2, 2010, is expressed in
accordance with Canadian reporting standards which do not require areference to such a change in accounting principles in the auditors’report when the change is properly accounted for and adequatelydisclosed in the financial statements.
Deloitte & Touche LLPIndependent Registered Chartered AccountantsLicensed Public Accountants
Toronto, CanadaDecember 2, 2010
74 Royal Bank of Canada: Annual Report 2010 Consolidated Financial Statements

Management’s Report on Internal Control over Financial Reporting
Management of Royal Bank of Canada (RBC) is responsible forestablishing and maintaining adequate internal control over financialreporting. Internal control over financial reporting is a processdesigned by, or under the supervision of, the President and ChiefExecutive Officer and the Chief Administrative Officer and ChiefFinancial Officer and effected by the Board of Directors, managementand other personnel to provide reasonable assurance regarding thereliability of financial reporting and the preparation of financialstatements for external purposes in accordance with generallyaccepted accounting principles. It includes those policies andprocedures that:• Pertain to the maintenance of records that, in reasonable detail,
accurately and fairly reflect the transactions related to anddispositions of our assets
• Provide reasonable assurance that transactions are recorded asnecessary to permit preparation of financial statements inaccordance with generally accepted accounting principles, andRBC receipts and expenditures are made only in accordance withauthorizations of management and directors of RBC
• Provide reasonable assurance regarding prevention or timelydetection of unauthorized acquisition, use, or disposition of RBCassets that could have a material effect on our financialstatements.
Due to its inherent limitations, internal control over financial reportingmay not prevent or detect misstatements on a timely basis. Also,projections of any evaluation of the effectiveness of internal controlover financial reporting to future periods are subject to the risk thatthe controls may become inadequate because of changes inconditions, or that the degree of compliance with the policies or
procedures may deteriorate.Management evaluated, under the supervision of and with the
participation of the President and Chief Executive Officer and theChief Administrative Officer and Chief Financial Officer, theeffectiveness of the internal control over financial reporting of RBC asof October 31, 2010, based on the criteria set forth in Internal Control– Integrated Framework issued by the Committee of SponsoringOrganizations of the Treadway Commission. Based on that evalua-tion, management concluded that, as of October 31, 2010, internalcontrol over financial reporting was effective based on the criteriaestablished in the Internal Control – Integrated Framework. Also,based on the results of our evaluation, management concluded thatthere were no material weaknesses that have been identified ininternal control over financial reporting as of October 31, 2010.
The internal control over financial reporting of RBC as ofOctober 31, 2010 has been audited by Deloitte & Touche LLP,Independent Registered Chartered Accountants, who also audited ourConsolidated Financial Statements for the year ended October 31,2010, as stated in the Report of Independent Registered CharteredAccountants, which report expressed an unqualified opinion on theeffectiveness of our internal control over financial reporting.
Gordon M. NixonPresident and Chief Executive Officer
Janice R. FukakusaChief Administrative Officer and Chief Financial Officer
Toronto, December 2, 2010
Report of Independent Registered Chartered Accountants
To the Shareholders of Royal Bank of Canada
We have audited the internal control over financial reporting of RoyalBank of Canada (the “Bank”) as of October 31, 2010 based on thecriteria established in Internal Control – Integrated Framework issuedby the Committee of Sponsoring Organizations of the TreadwayCommission. The Bank’s management is responsible for maintainingeffective internal control over financial reporting and for itsassessment of the effectiveness of internal control over financialreporting, included in the accompanying Management’s Report onInternal Control over Financial Reporting. Our responsibility is toexpress an opinion on the Bank’s internal control over financialreporting based on our audit.
We conducted our audit in accordance with the standards of thePublic Company Accounting Oversight Board (United States). Thosestandards require that we plan and perform the audit to obtainreasonable assurance about whether effective internal control overfinancial reporting was maintained in all material respects. Our auditincluded obtaining an understanding of internal control over financialreporting, assessing the risk that a material weakness exists, testingand evaluating the design and operating effectiveness of internalcontrol based on the assessed risk, and performing such otherprocedures as we considered necessary in the circumstances. Webelieve that our audit provides a reasonable basis for our opinion.
A company’s internal control over financial reporting is a processdesigned by, or under the supervision of, the company’s principalexecutive and principal financial officers, or persons performingsimilar functions, and effected by the company’s board of directors,management, and other personnel to provide reasonable assuranceregarding the reliability of financial reporting and the preparation offinancial statements for external purposes in accordance withgenerally accepted accounting principles. A company’s internalcontrol over financial reporting includes those policies and proce-dures that (1) pertain to the maintenance of records that, inreasonable detail, accurately and fairly reflect the transactions anddispositions of the assets of the company; (2) provide reasonableassurance that transactions are recorded as necessary to permit
preparation of financial statements in accordance with generallyaccepted accounting principles and that receipts and expenditures ofthe company are being made only in accordance with authorizationsof management and directors of the company; and (3) providereasonable assurance regarding prevention or timely detection ofunauthorized acquisition, use or disposition of the company’s assetsthat could have a material effect on the financial statements.
Because of the inherent limitations of internal control overfinancial reporting, including the possibility of collusion or impropermanagement override of controls, material misstatements due toerror or fraud may not be prevented or detected on a timely basis.Also, projections of any evaluation of the effectiveness of the internalcontrol over financial reporting to future periods are subject to therisk that the controls may become inadequate because of changes inconditions, or that the degree of compliance with the policies orprocedures may deteriorate.
In our opinion, the Bank maintained, in all material respects,effective internal control over financial reporting as of October 31,2010 based on the criteria established in Internal Control – IntegratedFramework issued by the Committee of Sponsoring Organizations ofthe Treadway Commission.
We have also audited, in accordance with Canadian generallyaccepted auditing standards and the standards of the PublicCompany Accounting Oversight Board (United States), theconsolidated financial statements as at and for the year endedOctober 31, 2010 of the Bank and our report dated December 2, 2010expressed an unqualified opinion on those consolidated financialstatements and includes a separate report titled Comments byIndependent Registered Chartered Accountants on Canada-UnitedStates of America Reporting Difference referring to changes inaccounting principles.
Deloitte & Touche LLPIndependent Registered Chartered AccountantsLicensed Public Accountants
Toronto, CanadaDecember 2, 2010
Consolidated Financial Statements Royal Bank of Canada: Annual Report 2010 75

Consolidated Balance Sheets
As of October 31 (C$ millions) 2010 2009
Assets
Cash and due from banks $ 9,330 $ 8,353
Interest-bearing deposits with banks 13,252 8,923
Securities (Note 3)
Trading 149,555 140,062Available-for-sale 43,776 46,210
193,331 186,272
Assets purchased under reverse repurchase agreements and securities borrowed 72,698 41,580
Loans (Note 4 and 5)
Retail 221,828 205,224Wholesale 73,375 78,927
295,203 284,151
Allowance for loan losses (2,997) (3,188)
292,206 280,963
OtherCustomers’ liability under acceptances 7,371 9,024Derivatives (Note 7) 106,246 92,173Premises and equipment, net (Note 8) 2,503 2,367Goodwill (Note 10) 8,064 8,368Other intangibles (Note 10) 1,930 2,033Other assets (Note 12) 19,275 14,933
145,389 128,898
$ 726,206 $ 654,989
Liabilities and shareholders’ equity
Deposits (Note 13)
Personal $ 161,693 $ 152,328Business and government 247,197 220,772Bank 24,143 25,204
433,033 398,304
OtherAcceptances 7,371 9,024Obligations related to securities sold short 46,597 41,359Obligations related to assets sold under repurchase agreements and securities loaned 41,582 35,150Derivatives (Note 7) 108,910 84,390Insurance claims and policy benefit liabilities (Note 14) 10,750 8,922Other liabilities (Note 15) 29,348 31,007
244,558 209,852
Subordinated debentures (Note 16) 6,681 6,461
Trust capital securities (Note 17) 727 1,395
Non-controlling interest in subsidiaries (Note 19) 2,256 2,071
Shareholders’ equity (Note 18)
Preferred shares 4,813 4,813Common shares (shares issued – 1,424,921,817 and 1,417,609,720) 13,378 13,075Contributed surplus 236 246Treasury shares – preferred (shares held – 86,400 and 64,600) (2) (2)Treasury shares – common (shares held – 1,719,092 and 2,126,699) (81) (95)Retained earnings 22,706 20,585Accumulated other comprehensive (loss) (2,099) (1,716)
38,951 36,906
$ 726,206 $ 654,989
Gordon M. Nixon Victor L. YoungPresident and Chief Executive Officer Director
76 Royal Bank of Canada: Annual Report 2010 Consolidated Financial Statements
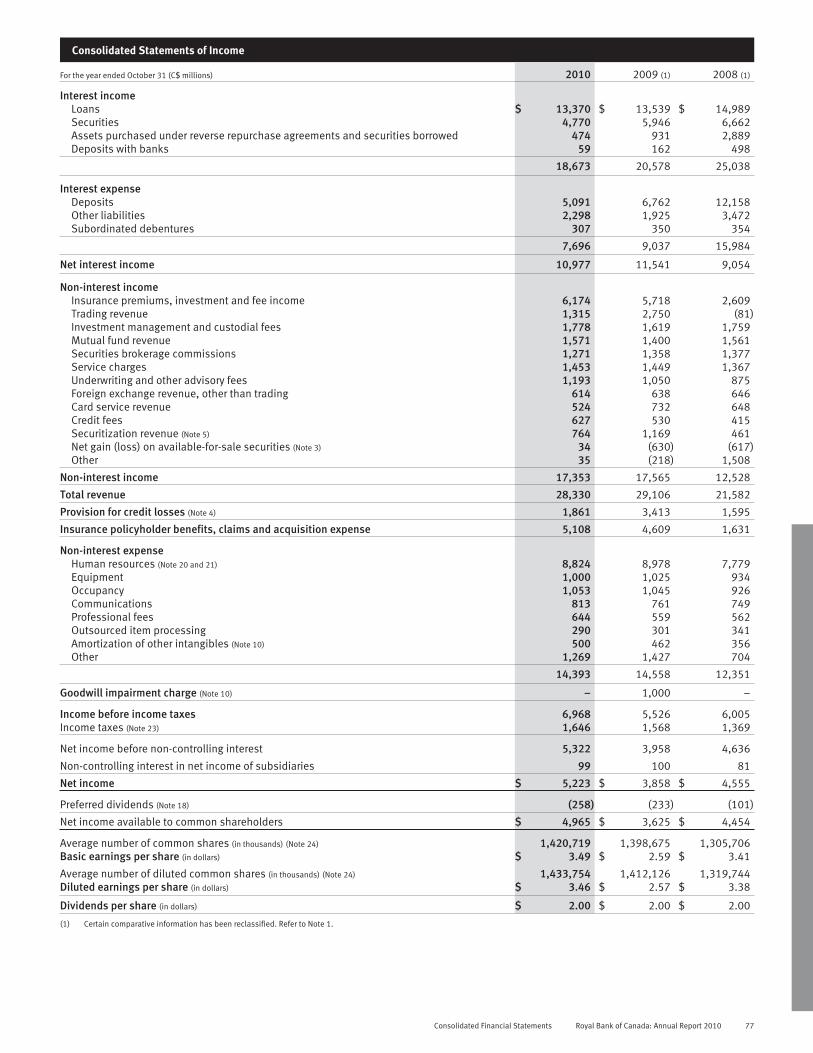
Consolidated Statements of Income
For the year ended October 31 (C$ millions) 2010 2009 (1) 2008 (1)
Interest incomeLoans $ 13,370 $ 13,539 $ 14,989Securities 4,770 5,946 6,662Assets purchased under reverse repurchase agreements and securities borrowed 474 931 2,889Deposits with banks 59 162 498
18,673 20,578 25,038
Interest expenseDeposits 5,091 6,762 12,158Other liabilities 2,298 1,925 3,472Subordinated debentures 307 350 354
7,696 9,037 15,984
Net interest income 10,977 11,541 9,054
Non-interest incomeInsurance premiums, investment and fee income 6,174 5,718 2,609Trading revenue 1,315 2,750 (81)Investment management and custodial fees 1,778 1,619 1,759Mutual fund revenue 1,571 1,400 1,561Securities brokerage commissions 1,271 1,358 1,377Service charges 1,453 1,449 1,367Underwriting and other advisory fees 1,193 1,050 875Foreign exchange revenue, other than trading 614 638 646Card service revenue 524 732 648Credit fees 627 530 415Securitization revenue (Note 5) 764 1,169 461Net gain (loss) on available-for-sale securities (Note 3) 34 (630) (617)Other 35 (218) 1,508
Non-interest income 17,353 17,565 12,528
Total revenue 28,330 29,106 21,582
Provision for credit losses (Note 4) 1,861 3,413 1,595
Insurance policyholder benefits, claims and acquisition expense 5,108 4,609 1,631
Non-interest expenseHuman resources (Note 20 and 21) 8,824 8,978 7,779Equipment 1,000 1,025 934Occupancy 1,053 1,045 926Communications 813 761 749Professional fees 644 559 562Outsourced item processing 290 301 341Amortization of other intangibles (Note 10) 500 462 356Other 1,269 1,427 704
14,393 14,558 12,351
Goodwill impairment charge (Note 10) – 1,000 –
Income before income taxes 6,968 5,526 6,005Income taxes (Note 23) 1,646 1,568 1,369
Net income before non-controlling interest 5,322 3,958 4,636
Non-controlling interest in net income of subsidiaries 99 100 81
Net income $ 5,223 $ 3,858 $ 4,555
Preferred dividends (Note 18) (258) (233) (101)
Net income available to common shareholders $ 4,965 $ 3,625 $ 4,454
Average number of common shares (in thousands) (Note 24) 1,420,719 1,398,675 1,305,706Basic earnings per share (in dollars) $ 3.49 $ 2.59 $ 3.41
Average number of diluted common shares (in thousands) (Note 24) 1,433,754 1,412,126 1,319,744Diluted earnings per share (in dollars) $ 3.46 $ 2.57 $ 3.38
Dividends per share (in dollars) $ 2.00 $ 2.00 $ 2.00
(1) Certain comparative information has been reclassified. Refer to Note 1.
Consolidated Financial Statements Royal Bank of Canada: Annual Report 2010 77

Consolidated Statements of Comprehensive Income
For the year ended October 31 (C$ millions) 2010 2009 2008
Comprehensive incomeNet income $ 5,223 $ 3,858 $ 4,555
Other comprehensive income, net of taxesNet unrealized gains (losses) on available-for-sale securities 441 662 (1,376)Reclassification of (gains) losses on available-for-sale securities to income (261) 330 373
Net change in unrealized gains (losses) on available-for-sale securities 180 992 (1,003)
Unrealized foreign currency translation (losses) gains (1,785) (2,973) 5,080Reclassification of (gains) losses on foreign currency translation to income (5) 2 (3)Net foreign currency translation gains (losses) from hedging activities 1,479 2,399 (2,672)
Foreign currency translation adjustments (311) (572) 2,405
Net (losses) gains on derivatives designated as cash flow hedges (334) 156 (603)Reclassification of losses (gains) on derivatives designated as cash flow hedges to income 82 (38) 49
Net change in cash flow hedges (252) 118 (554)
Other comprehensive (loss) income (383) 538 848
Total comprehensive income $ 4,840 $ 4,396 $ 5,403
Consolidated Statements of Changes in Shareholders’ Equity
For the year ended October 31 (C$ millions) 2010 2009 2008
Preferred shares (Note 18)
Balance at beginning of year $ 4,813 $ 2,663 $ 2,050Issued – 2,150 613
Balance at end of year 4,813 4,813 2,663
Common shares (Note 18)
Balance at beginning of year 13,075 10,384 7,300Issued 303 2,691 3,090Purchased for cancellation – – (6)
Balance at end of year 13,378 13,075 10,384
Contributed surplusBalance at beginning of year 246 242 235Renounced stock appreciation rights – (7) (5)Stock-based compensation awards (9) (11) 14Other (1) 22 (2)
Balance at end of year 236 246 242
Treasury shares – preferred (Note 18)
Balance at beginning of year (2) (5) (6)Sales 8 13 23Purchases (8) (10) (22)
Balance at end of year (2) (2) (5)
Treasury shares – common (Note 18)
Balance at beginning of year (95) (104) (101)Sales 64 59 51Purchases (50) (50) (54)
Balance at end of year (81) (95) (104)
Retained earningsBalance at beginning of year 20,585 19,816 18,047Transition adjustment – Financial instruments (1) – 66 –Net income 5,223 3,858 4,555Preferred share dividends (Note 18) (258) (233) (101)Common share dividends (Note 18) (2,843) (2,819) (2,624)Premium paid on common shares purchased for cancellation – – (49)Issuance costs and other (1) (103) (12)
Balance at end of year 22,706 20,585 19,816
Accumulated other comprehensive (loss) incomeTransition adjustment – Financial instruments (1) 59 59 (45)Unrealized gains and losses on available-for-sale securities 104 (76) (1,068)Unrealized foreign currency translation gains and losses, net of hedging activities (1,685) (1,374) (802)Gains and losses on derivatives designated as cash flow hedges (577) (325) (443)
Balance at end of year (2,099) (1,716) (2,358)
Retained earnings and Accumulated other comprehensive income 20,607 18,869 17,458
Shareholders’ equity at end of year $ 38,951 $ 36,906 $ 30,638
(1) Transition adjustment relates to amendments to CICA Handbook Section 3855 that were effective November 1, 2008. Refer to Note 1 to our 2009 Annual Consolidated Financial Statementsfor details.
78 Royal Bank of Canada: Annual Report 2010 Consolidated Financial Statements

Consolidated Statements of Cash Flows
For the year ended October 31 (C$ millions) 2010 2009 2008
Cash flows from operating activitiesNet income $ 5,223 $ 3,858 $ 4,555Adjustments to determine net cash from (used in) operating activities
Provision for credit losses 1,861 3,413 1,595Depreciation 410 389 318Future income taxes 77 (97) (455)Impairment of goodwill and amortization of other intangibles 500 1,462 356Loss (gain) on sale of premises and equipment 125 5 (17)Gain on securitizations (163) (934) (207)(Gain) loss on available-for-sale securities (308) (17) 1Writedown of available-for-sale securities 267 657 631Changes in operating assets and liabilities
Insurance claims and policy benefit liabilities 1,828 1,537 102Net change in accrued interest receivable and payable (44) (147) 164Current income taxes (1,789) 3,546 (2,705)Derivative assets (14,073) 43,961 (69,527)Derivative liabilities 24,520 (44,315) 56,685Trading securities (4,124) (11,382) 24,966Net change in brokers and dealers receivable and payable (2,592) 2,396 (552)Other (424) 3,071 (4,529)
Net cash from operating activities 11,294 7,403 11,381
Cash flows from investing activitiesChange in interest-bearing deposits with banks (4,330) 11,118 (8,160)Change in loans, net of securitizations (29,345) (17,854) (62,725)Proceeds from securitizations 8,473 21,788 10,047Proceeds from sale of available-for-sale securities 11,620 12,515 8,885Proceeds from maturity of available-for-sale securities 34,143 18,108 14,804Purchases of available-for-sale securities (39,863) (32,268) (24,864)Net acquisitions of premises and equipment and software (1,072) (700) (1,265)Change in assets purchased under reverse repurchase agreements and securities borrowed (31,118) 3,238 19,650Net cash used in acquisitions (82) (27) (974)
Net cash (used in) from investing activities (51,574) 15,918 (44,602)
Cash flows from financing activitiesChange in deposits 34,729 (40,742) 61,271Issue of RBC Trust capital Securities (RBC TruCS) – – 500Redemption of RBC Trust Capital securities (RBC TruCS) (650) – –Issue of subordinated debentures 1,500 – 2,000Repayment of subordinated debentures (1,305) (1,659) (500)Issue of preferred shares – 2,150 613Redemption of preferred shares for cancellation – – (300)Issue of common shares 125 2,439 149Purchase of common shares for cancellation – – (55)Sales of treasury shares 72 72 74Purchase of treasury shares (58) (60) (76)Dividends paid (2,934) (2,744) (2,688)Issuance costs – (77) (11)Dividends/distributions paid by subsidiaries to non-controlling interests (93) (4) (33)Change in obligations related to assets sold under repurchase agreements and securities
loaned 6,432 3,097 (6,172)Change in obligations related to securities sold short 5,238 13,852 (17,192)Redemption of trust preferred notes – (140) –Change in short-term borrowings of subsidiaries (1,631) (1,967) 1,618
Net cash from (used in) financing activities 41,425 (25,783) 39,198
Effect of exchange rate changes on cash and due from banks (168) (271) 883
Net change in cash and due from banks 977 (2,733) 6,860Cash and due from banks at beginning of year 8,353 11,086 4,226
Cash and due from banks at end of period $ 9,330 $ 8,353 $ 11,086
Supplemental disclosure of cash flow informationAmount of interest paid in year $ 7,790 $ 9,910 $ 15,967Amount of income taxes (recovery) paid in year $ 4,654 $ (102) $ 2,025
Consolidated Financial Statements Royal Bank of Canada: Annual Report 2010 79
Note 1 Significant accounting policies and estimates
The accompanying Consolidated Financial Statements have beenprepared in accordance with Subsection 308 of the Bank Act (Canada)(the Act), which states that, except as otherwise specified by theOffice of the Superintendent of Financial Institutions Canada (OSFI),our Consolidated Financial Statements are to be prepared inaccordance with Canadian generally accepted accounting principles(GAAP). The significant accounting policies used in the preparation ofthese financial statements, including the accounting requirements ofOSFI, are summarized below. These accounting policies conform, inall material respects, to Canadian GAAP.
GeneralBasis of consolidationOur Consolidated Financial Statements include the assets andliabilities and results of operations of all subsidiaries and variableinterest entities (VIEs) where we are the Primary Beneficiary afterelimination of intercompany transactions and balances. The equitymethod is used to account for investments in associated corporationsand limited partnerships in which we have significant influence.These investments are reported in Other assets. Our share ofearnings, gains and losses realized on dispositions and writedownsto reflect other-than-temporary impairment in the value of theseinvestments is recorded as Other Non-interest income. The propor-tionate consolidation method is used to account for investments injoint ventures in which we exercise joint control, whereby our pro ratashare of assets, liabilities, income and expenses is consolidated.
Use of estimates and assumptionsIn preparing our Consolidated Financial Statements, management isrequired to make estimates and assumptions that affect the reportedamounts of assets, liabilities, net income and related disclosures.Certain estimates, including the allowance for credit losses, the fairvalue of financial instruments, accounting for securitizations,litigation provisions, VIEs, insurance claims and policy benefitliabilities, pensions and other post-employment benefits, the carryingvalue of goodwill and finite lived intangible assets, credit cardcustomer loyalty reward program liability and income taxes, requiremanagement to make subjective or complex judgments. Accordingly,actual results could differ from these and other estimates therebyimpacting our future Consolidated Financial Statements.
Change in financial statement presentationDuring the year, we reclassified the income statement impact ofcertain financial instruments held by Corporate Support for fundingpurposes in order to better reflect management’s intention for thoseinstruments. The following table presents the increase (decrease) tothe line items affected by the reclassification:
2009 2008
Interest income – Loans $ 35 $ 6Non-interest income – Trading revenue 79 15Non-interest income – Other (114) (21)
Significant accounting changesNo significant accounting changes were effective for us in 2010.
Financial Instruments – Recognition and measurementSecuritiesSecurities are classified, based on management’s intentions, asheld-for-trading, available-for-sale, held-to-maturity or loans andreceivables.
Held-for-trading securities include securities purchased for salein the near term and securities designated as held-for-trading underthe fair value option and are reported at fair value. Obligations todeliver trading securities sold but not yet purchased are recorded asliabilities and carried at fair value. Realized and unrealized gains andlosses on these securities are recorded as Trading revenue inNon-interest income. Dividend and interest income accruing on
trading securities is recorded in Interest income. Interest anddividends accrued on interest-bearing and equity securities sold shortare recorded in Interest expense.
Available-for-sale securities include: (i) securities which may besold in response to or in anticipation of changes in interest rates andresulting prepayment risk, changes in foreign currency risk, changesin funding sources or terms, or to meet liquidity needs; (ii) loansubstitute securities which are client financings that have beenstructured as after-tax investments rather than conventional loans inorder to provide the clients with a borrowing rate advantage, and(iii) loans and receivables for which we may not recover substantiallyall of our initial investment, other than because of credit deterio-ration. Available-for-sale securities are measured at fair value with thedifference between the fair value and its amortized cost, includingchanges in foreign exchange rates, recognized in Othercomprehensive income (OCI), net of tax. Purchase premiums ordiscounts on available-for-sale debt securities are amortized over thelife of the security using the effective interest method and arerecognized in Net interest income. Investments in equity instrumentsclassified as available-for-sale that do not have a quoted market pricein an active market are measured at cost.
At each reporting date, and more frequently when conditionswarrant, we evaluate our available-for-sale securities with unrealizedlosses to determine whether those unrealized losses are other-than-temporary. This determination is based on consideration of severalfactors including: (i) the length of time and extent to which the fairvalue has been less than its amortized cost; (ii) the severity of theimpairment; (iii) the cause of the impairment and the financialcondition and near-term prospects of the issuer, and (iv) our intentand ability to hold the investment for a period of time sufficient toallow for any anticipated recovery of fair value. If our assessmentindicates that the impairment in value is other-than-temporary, or wedo not have the intent or ability to hold the security until its fair valuerecovers, the security is written down to its current fair value, and aloss is recognized in net income.
Gains and losses realized on disposal of available-for-salesecurities and losses related to other-than-temporary impairment invalue of available-for-sale securities are included in Non-interestincome as net gains or losses on available-for-sale securities.
Held-to-maturity securities are debt securities where we have theintention and ability to hold the investment until its maturity date.These securities are carried at amortized cost using the effectiveinterest method. Interest income and amortization of premiums anddiscounts on debt securities are recorded in Net interest income. Wehold a nominal amount of held-to-maturity securities in our normalcourse of business. All held-to-maturity securities have been includedwith Available-for-sale securities on our Consolidated BalanceSheets. Impairments are assessed using the same impairment modelfor loans in accordance with the Canadian Institute of CharteredAccountant’s (CICA) Handbook Section 3855. Refer to the Loanssection for details.
We account for all of our securities using settlement dateaccounting except that changes in fair value between the trade dateand settlement date are reflected in income for securities classified ordesignated as held-for-trading while changes in the fair value ofavailable-for-sale securities between the trade and settlement datesare recorded in OCI.
Fair value optionA financial instrument can be designated as held-for-trading (the fairvalue option) on its initial recognition even if the financial instrumentwas not acquired or incurred principally for the purpose of selling orrepurchasing it in the near term. An instrument that is classified asheld-for-trading by way of this fair value option must have a reliablymeasurable fair value and satisfy one of the following criteriaestablished by OSFI: (i) it eliminates or significantly reduces ameasurement or recognition inconsistency that would otherwise arisefrom measuring assets or liabilities, or recognizing gains and losseson them on a different basis; (ii) it belongs to a group of financialassets or financial liabilities or both that are managed and evaluated
80 Royal Bank of Canada: Annual Report 2010 Consolidated Financial Statements

on a fair value basis in accordance with our risk management orinvestment strategy, and are reported to senior management on thatbasis; or (iii) there is an embedded derivative in the financial ornon-financial host contract and the derivative is not closely related tothe host contract.
Financial instruments designated as held-for-trading using thefair value option are recorded at fair value and any gain or loss arisingdue to changes in fair value are included in income. These instru-ments cannot be reclassified out of held-for-trading category whilethey are held or issued.
To determine the fair value adjustments on our debt designatedas held-for-trading, we calculate the present value of the instrumentsbased on the contractual cash flows over the term of the arrangementby using RBC’s effective funding rate at the beginning and end of theperiod with the unrealized change in present value recorded in Netincome.
Transaction costsTransaction costs are expensed as incurred for financial instrumentsclassified or designated as held-for-trading. For other financialinstruments, transaction costs are capitalized on initial recognition.
Assets purchased under reverse repurchase agreements and soldunder repurchase agreementsWe purchase securities under agreements to resell (reverserepurchase agreements) and take possession of these securities.Reverse repurchase agreements are treated as collateralized lendingtransactions whereby we monitor the market value of the securitiespurchased and additional collateral is obtained when appropriate. Wehave the right to liquidate the collateral held in the event ofcounterparty default. We also sell securities under agreements torepurchase (repurchase agreements), which are treated ascollateralized borrowing transactions.
Reverse repurchase agreements and repurchase agreements arecarried on our Consolidated Balance Sheets at the amounts at whichthe securities were initially acquired or sold plus accrued interest,respectively, except when they are designated using the fair valueoption as held-for-trading and are recorded at fair value. Interestearned on reverse repurchase agreements is included in Interestincome, and interest incurred on repurchase agreements is includedin Interest expense, respectively, in our Consolidated Statements ofIncome. Changes in fair value for reverse repurchase agreements andrepurchase agreements carried at fair value under the fair valueoption are included in Trading revenue in Non-interest income.
SecuritizationsOur various securitization activities generally consist of the transfer offinancial assets to independent special purpose entities (SPEs) ortrusts that issue securities to investors. SPEs may be a VIE as definedby CICA Accounting Guideline (AcG) 15, Consolidation of VariableInterest Entities (AcG-15) or a Qualifying SPE (QSPE) as defined underAcG-12, Transfer of Receivables.
These transactions are accounted for as sales and the trans-ferred assets are removed from our Consolidated Balance Sheetswhen we are deemed to have surrendered control over such assetsand have received consideration other than beneficial interests inthese transferred assets. For control to be surrendered, all of thefollowing must occur: (i) the transferred assets must be isolated fromthe seller, even in bankruptcy or other receivership; (ii) the purchasermust have the legal right to sell or pledge the transferred assets or, ifthe purchaser is a QSPE, its investors have the right to sell or pledgetheir ownership interest in the entity; and (iii) the seller must notcontinue to control the transferred assets through an agreement torepurchase them or have a right to cause the assets to be returned. Ifany one of these conditions is not met, the transfer is considered tobe a secured borrowing for accounting purposes and the assetsremain on our Consolidated Balance Sheets, with the net proceedsrecognized as a liability.
In the case of with loan securitizations, we generally sell loans orpackage mortgage-backed securities (MBS) to SPEs or trusts thatissue securities to investors, but occasionally sell to third-partyinvestors through dealers.
When MBS are created, we reclassify the loans at their carryingcosts into MBS and retained interests on our Consolidated BalanceSheets. The retained interest largely represents the excess spread ofloan interest over the MBS rate of return. The initial carrying value ofthe MBS and the related retained interests are determined based ontheir relative fair value on the date of securitization. MBS areclassified as held-for-trading or available-for-sale securities, based onmanagement’s intent. Retained interests are classified asavailable-for-sale or as held-for-trading using the fair value option.Both MBS and retained interests classified as available-for-sale aresubject to periodic impairment review.
Gains on the sale of loans or MBS are recognized in Non-interestincome and are dependent on the previous carrying amount of theloans or MBS involved in the transfer. To obtain fair values, quotedmarket prices are used, if available. When quotes are not available forretained interests, we generally determine fair value based on thepresent value of expected future cash flows using management’s bestestimates of key assumptions such as payment rates, weightedaverage life of the pre-payable receivables, excess spread, expectedcredit losses and discount rates commensurate with the risksinvolved.
For each securitization transaction where we have retained theservicing rights, we assess whether the benefits of servicing representadequate compensation. When the benefits of servicing are morethan adequate, a servicing asset is recognized in Other – Otherassets. When the benefits of servicing are not expected to beadequate, we recognize a servicing liability in Other – Otherliabilities. Neither an asset nor a liability is recognized when we havereceived adequate compensation. A servicing asset or liability isamortized in proportion to and over the period of estimated netservicing income.
In the case of bond securitizations, we purchase municipalgovernment, government-related and corporate bonds, and issuesecurities that are sold to third-party investors. We do not retain anybeneficial interest unless we purchase some of the certificatesissued.
AcceptancesAcceptances are short-term negotiable instruments issued by ourclients to third parties which we guarantee. The potential liabilityunder acceptances is reported in Other – Acceptance on ourConsolidated Balance Sheets. The recourse against our clients in thecase of a call on these commitments is reported as a correspondingasset of the same amount in Other – Customers’ liability underacceptances. Fees earned are reported in Non-interest income.
DerivativesDerivatives are primarily used in sales and trading activities.Derivatives are also used to manage our exposures to interest rate,currency, credit and other market risks. The most frequently usedderivative products are interest rate swaps, interest rate futures,forward rate agreements, interest rate options, foreign exchangeforward contracts, currency swaps, foreign currency futures, foreigncurrency options, equity swaps and credit derivatives. All derivativeinstruments are recorded on our Consolidated Balance Sheets at fairvalue, including those derivatives that are embedded in financial ornon-financial contracts that are not closely related to the hostcontracts. An embedded derivative is a component of a hybridinstrument that includes a non-derivative host contract, with theeffect that some of the cash flows of the hybrid instrument vary in away similar to a stand-alone derivative. When an embeddedderivative is separated, the host contract is accounted for based onGAAP applicable to a contract of that type without the embeddedderivative. All embedded derivatives are presented on a combinedbasis with the host contracts although they are separated formeasurement purposes when conditions requiring separation aremet.
When derivatives are used in sales and trading activities, therealized and unrealized gains and losses on derivatives are recog-nized in Non-interest income – Trading revenue. Derivatives with apositive fair value are reported as Derivative assets and derivativeswith a negative fair value are reported as Derivative liabilities. Where
Consolidated Financial Statements Royal Bank of Canada: Annual Report 2010 81

Note 1 Significant accounting policies and estimates (continued)
we have both the legal right and intent to settle derivative assets andliabilities simultaneously with a counterparty, the net fair value of thederivative positions is reported as an asset or liability, as appropriate.Market and credit valuation adjustments, and premiums paid are alsoincluded in Derivative assets, while premiums received are shown inDerivative liabilities.
When derivatives are used to manage our own exposures, wedetermine for each derivative whether hedge accounting can beapplied, as discussed in the Hedge accounting section below.
Hedge accountingWe use derivatives and non-derivatives in our hedging strategies tomanage our exposure to interest rate, currency, credit and othermarket risks. Where hedge accounting can be applied, a hedgerelationship is designated and documented at inception to detail theparticular risk management objective and the strategy for undertakingthe hedge transaction. The documentation identifies the specificasset, liability or anticipated cash flows being hedged, the risk that isbeing hedged, the type of hedging instrument used and howeffectiveness will be assessed. The hedging instrument must behighly effective in accomplishing the objective of offsetting eitherchanges in the fair value or anticipated cash flows attributable to therisk being hedged both at inception and throughout the life of thehedge. Hedge accounting is discontinued prospectively when it isdetermined that the hedging instrument is no longer effective as ahedge, the hedging instrument is terminated or sold, or upon the saleor early termination of the hedged item. Refer to Note 7 for the fairvalue of the derivatives and non-derivative instruments categorizedby their hedging relationships, as well as derivatives that are notdesignated in hedging relationships.
Fair value hedgesIn a fair value hedging relationship, the carrying value of the hedgeditem is adjusted for changes in fair value attributable to the hedgedrisk and recognized in Non-interest income. Changes in the fair valueof the hedged item, to the extent that the hedging relationship iseffective, are offset by changes in the fair value of the hedgingderivative, which are also recognized in Non-interest income. Whenhedge accounting is discontinued, the carrying value of the hedgeditem is no longer adjusted and the cumulative fair value adjustmentsare amortized to net income over the remaining life of the hedgeditems.
We predominantly use interest rate swaps to hedge our exposureto the changes in a fixed interest rate instrument’s fair value causedby changes in interest rates. We also use, in limited circumstances,certain cash instruments to hedge our exposure to the changes in fairvalue of monetary assets attributable to changes in foreign currencyexchange rates.
Cash flow hedgesIn a cash flow hedging relationship, the effective portion of thechange in the fair value of the hedging derivative, net of taxes, isrecognized in OCI while the ineffective portion is recognized inNon-interest income. When hedge accounting is discontinued, theamounts accumulated in Accumulated other comprehensive income(AOCI) are reclassified to Net interest income during the periods whenthe variability in the cash flows of the hedged item affects Net interestincome. Gains and losses on derivatives are reclassified immediatelyto Net income when the hedged item is sold or terminated early. Wepredominantly use interest rate swaps to hedge the variability in cashflows related to a variable rate asset or liability.
Net investment hedgesIn hedging a foreign currency exposure of a net investment in a self-sustaining foreign operation, the effective portion of foreign exchangegains and losses on the hedging instruments, net of applicable taxes,is recognized in OCI and the ineffective portion is recognized inNon-interest income. The amounts accumulated in AOCI are recog-nized in Net income when there is a reduction in the hedged netinvestment as a result of a dilution or sale of the net investment, or
reduction in equity of the foreign operation as a result of dividenddistributions. We use foreign currency-denominated liabilities andforeign exchange contracts to manage our foreign currency exposuresto net investments in self-sustaining foreign operations having afunctional currency other than the Canadian dollar.
LoansLoans are generally recorded at amortized cost net of an allowance forloan losses and unearned income which comprises unearned interestand unamortized loan fees. Loans for which we have elected the fairvalue option or which we intend to sell immediately or in the nearterm must be classified as held-for-trading and carried at fair value.Non-derivative financial assets with fixed or determinable paymentsthat are not quoted in an active market may also be classified asloans and receivables.
Loans recorded at amortized cost are subject to periodicimpairment review and are classified as impaired when, inmanagement’s opinion, there is no longer reasonable assurance ofthe timely collection of the full amount of principal or interest.Whenever a payment is 90 days past due, loans other than credit cardbalances and loans guaranteed or insured by a Canadian government(federal or provincial) or a Canadian government agency (collectively,Canadian government) are classified as impaired unless they are fullysecured and collection efforts are reasonably expected to result inrepayment of debt within 180 days of the loan becoming past due.Credit card balances are written off when a payment is 180 days inarrears. Loans guaranteed by a Canadian government are classifiedas impaired when the loan is contractually 365 days in arrears. Whena loan is identified as impaired, the accrual of interest is discontinuedand any previously accrued but unpaid interest on the loan is chargedto the Provision for credit losses. Interest received on impaired loansis credited to the carrying value of the loan. If the loan is completelywritten off, subsequent payments are credited to the Provision forcredit losses. Impaired loans are returned to performing status whenall past due amounts, including interest, have been collected, loanimpairment charges have been reversed, and the credit quality hasimproved such that timely collection of principal and interest isreasonably assured.
When an impaired loan is identified, the carrying amount of theloan is reduced to its estimated realizable amount, which ismeasured by discounting the expected future cash flows at theeffective interest rate inherent in the loan. In subsequent periods,recoveries of amounts previously written off and any increase in thecarrying value of the loan are credited to the Allowance for creditlosses on our Consolidated Balance Sheets. Where a portion of a loanis written off and the remaining balance is restructured, the new loanis carried on an accrual basis when there is no longer any reasonabledoubt regarding the collectability of principal or interest, andpayments are not 90 days past due.
Assets acquired in respect of problem loans are recorded at theirfair value less costs of disposition. Fair value is determined based oneither current market value where available or discounted cash flows.Any excess of the carrying value of the loan over the recorded fairvalue of the assets acquired is recognized by a charge to theProvision for credit losses.
Fees that relate to activities such as originating, restructuring orrenegotiating loans are deferred and recognized as Interest incomeover the expected term of such loans using the effective interestmethod. Where there is reasonable expectation that a loan will result,commitment and standby fees are also recognized as Interest incomeover the expected term of the resulting loan using the effectiveinterest method. Otherwise, such fees are recorded as other liabilitiesand amortized to non-interest income over the commitment orstandby period.
Allowance for credit lossesThe allowance for credit losses is maintained at levels thatmanagement considers appropriate to cover estimated identifiedcredit related losses in the portfolio as well as losses that have beenincurred, but are not yet identifiable as at the balance sheet date. The
82 Royal Bank of Canada: Annual Report 2010 Consolidated Financial Statements

allowance relates to on-balance sheet exposures, such as loans andacceptances, and off-balance sheet items such as letters of credit,guarantees and unfunded commitments.
The allowance is increased by a charge to the provision for creditlosses and decreased by the amount of write-offs, net of recoveries.The allowance for credit losses for on-balance sheet items is includedas a reduction to assets, and the allowance relating to off-balancesheet items is included in Other liabilities.
The allowance is determined based on management’s identi-fication and evaluation of problem accounts for estimated losses thatexist on the remaining portfolio, and on other factors including thecomposition and credit quality of the portfolio, and changes ineconomic and business conditions. The allowance for credit lossesconsists of specific allowances and the general allowance.
Specific allowancesSpecific allowances are recorded to recognize estimated losses onboth retail and wholesale loans that have become impaired. Thelosses relating to wholesale borrowers, including small businessloans individually managed, are estimated using management’sjudgment relating to the timing of future cash flow amounts that canbe reasonably expected from the borrowers, financially responsibleguarantors and the realization of collateral. The amounts expected tobe recovered are reduced by estimated collection costs anddiscounted at the effective interest rate of the obligation. The lossesrelating to retail portfolios, including residential mortgages, andpersonal and small business loans managed on a pooled basis arebased on net write-off experience. For credit cards, no specificallowance is maintained as balances are written off when a paymentis 180 days in arrears. Personal loans are generally written off at150 days past due. Write-offs for other loans are generally recordedwhen there is no realistic prospect of full recovery.
General allowanceA general allowance is established to cover estimated credit lossesincurred in the lending portfolio that have not yet been specificallyidentified as impaired. For heterogeneous loans (wholesale loansincluding small business loans individually managed), the determi-nation of the general allowance is based on the application ofestimated probability of default, gross exposure at default and lossfactors, which are determined by historical loss experience anddelineated by loan type and rating. For homogeneous portfolios (retailloans) including residential mortgages, credit cards, as well aspersonal and small business loans that are managed on a pooledbasis, the determination of the general allowance is based on theapplication of historical loss rates. In determining the generalallowance level, management also considers the current portfoliocredit quality trends, business and economic conditions, the impactof policy and process changes, and other supporting factors.
GuaranteesIn the normal course of our business, we enter into numerousagreements that may contain features that meet the definition of aguarantee pursuant to AcG-14, Disclosure of Guarantees. AcG-14defines a guarantee to be a contract (including an indemnity) thatcontingently requires us to make payments (in cash, other assets, ourown shares or provision of services) to a third party based on:(i) changes in an underlying interest rate, foreign exchange rate,equity or commodity instrument, index or other variable, that isrelated to an asset, a liability or an equity security of the counterparty;(ii) failure of another party to perform under an obligating agreement;or (iii) failure of another third party to pay its indebtedness when due.Liabilities are recognized on our Consolidated Balance Sheets at theinception of a guarantee for the fair value of the obligation under-taken in issuing the guarantee. No subsequent remeasurement at fairvalue is required unless the financial guarantee qualifies as aderivative. If the financial guarantee meets the definition of aderivative, it is remeasured at fair value at each balance sheet dateand reported as a derivative in Other assets or Other liabilities asappropriate.
Offsetting financial assets and financial liabilitiesFinancial assets and financial liabilities are presented net when wehave a legally enforceable right to set off the recognized amounts andintend to settle on a net basis or to realize the asset and settle theliability simultaneously.
InsurancePremiums from long-duration contracts, primarily life insurance, arerecognized when due in Non-interest income – Insurance premiums,investment and fee income. Premiums from short-duration contracts,primarily property and casualty, and fees for administrative servicesare recognized in Insurance premiums, investment and fee incomeover the related contract period. Unearned premiums of the short-duration contracts, representing the unexpired portion of premiums,are reported in Other liabilities. Investments made by our insuranceoperations are classified as available-for-sale or loans and receiv-ables, except for investments supporting the policy benefit liabilitieson life and health insurance contracts and a portion of property andcasualty contracts. These are designated as held-for-trading under thefair value option with changes in fair value reported in Insurancepremiums, investment and fee income.
Insurance claims and policy benefit liabilities represent currentclaims and estimates for future insurance policy benefits. Liabilitiesfor life insurance contracts are determined using the Canadian AssetLiability Method (CALM), which incorporates assumptions formortality, morbidity, policy lapses and surrenders, investment yields,policy dividends, operating and policy maintenance expenses, andprovisions for adverse deviation. These assumptions are reviewed atleast annually and updated in response to actual experience andmarket conditions. Liabilities for property and casualty insurancerepresent estimated provisions for reported and unreported claims.Liabilities for life and property and casualty insurance are included inInsurance claims and policy benefit liabilities. Changes in Insuranceclaims and policy benefit liabilities are included in the Insurancepolicyholder benefits, claims and acquisition expense in ourConsolidated Statements of Income in the period in which theestimates changed.
Reinsurance recoverables related to property and casualtyinsurance business, which are included in Other assets, includeamounts related to paid benefits and unpaid claims. Reinsurancerecoverables related to our life insurance business are included inInsurance claims and policy benefit liabilities to offset the relatedliabilities.
Acquisition costs for new insurance business consist ofcommissions, premium taxes, certain underwriting costs and othercosts that vary with the acquisition of new business. Deferredacquisition costs for life insurance products are implicitly recognizedin Insurance claims and policy benefit liabilities by CALM. For propertyand casualty insurance, these costs are classified as Other assets andamortized over the policy term.
Segregated funds are lines of business in which we issue acontract where the benefit amount is directly linked to the marketvalue of the investments held in the underlying fund. The contractualarrangement is such that the underlying assets are registered in ourname but the segregated fund policyholders bear the risk andrewards of the fund’s investment performance. We provide minimumdeath benefit and maturity value guarantees on segregated funds.The liability associated with these minimum guarantees is recorded inInsurance claims and policy benefit liabilities. Segregated funds arenot included in our Consolidated Financial Statements. We deriveonly fee income from segregated funds, which is reflected inInsurance premiums, investment and fee income. Fee incomeincludes management fees, mortality, policy, administration andsurrender charges.
Pensions and other post-employment benefits and stock-basedcompensationPensions and other post-employment benefitsWe offer a number of benefit plans which provide pension and otherbenefits to eligible employees. Refer to Note 20. These plans include
Consolidated Financial Statements Royal Bank of Canada: Annual Report 2010 83
Note 1 Significant accounting policies and estimates (continued)
registered defined benefit pension plans, supplemental pensionplans, defined contribution plans and health, dental, disability andlife insurance plans.
Investments held by the pension funds primarily comprise equityand fixed income securities. Pension fund assets are valued at fairvalue. For the principal defined benefit plans, the expected return onplan assets, which is reflected in the pension benefit expense, iscalculated using a market-related value approach. Under thisapproach, assets are valued at an adjusted market value, wherebyrealized and unrealized capital gains and losses are amortized over3 years on a straight-line basis. For the majority of the non-principaland supplemental defined benefit pension plans, the expected returnon plan assets is calculated based on fair value of assets.
Actuarial valuations for the defined benefit plans are performedon a regular basis to determine the present value of the accruedpension and other post-employment benefits, based on projectionsof employees’ compensation levels to the time of retirement and thecosts of health, dental, disability and life insurance, respectively.
Our defined benefit pension expense, which is included inNon-interest expense – Human resources, consists of the cost ofemployee pension benefits for the current year’s service, interest coston the liabilities, expected investment return on the market-relatedvalue or market value of plan assets and the amortization of priorservice costs, net actuarial gains or losses and transitional assets orobligations. For some of our defined benefit plans, including theprincipal defined benefit plans, actuarial gains or losses aredetermined each year and amortized over the expected averageremaining service life of employee groups covered by the plans. Forthe remaining defined benefit plans, net accumulated actuarial gainsor losses in excess of 10% of the greater of the plan assets or thebenefit obligation at the beginning of the year are amortized over theexpected average remaining service life of employee groups coveredby the plan.
Gains and losses on settlements of defined benefit plans arerecognized in Non-interest expense – Human Resources whensettlement occurs. Curtailment gains and losses are recognized in theperiod when the curtailment becomes probable and the impact canbe reasonably estimated.
The cumulative excess of pension fund contributions over theamounts recorded as expenses is reported as a Prepaid pensionbenefit cost in Other assets. The cumulative excess of expense overfund contributions is reported as Accrued pension and other post-employment benefit expense in Other liabilities.
Our defined contribution plan expense is included inNon-interest expense – Human resources for services rendered byemployees during the period.
Stock-based compensationWe offer stock-based compensation plans to certain key employeesand to our non-employee directors as described in Note 21.
We use the fair value method to account for stock optionsgranted to employees whereby compensation expense is recognizedover the applicable vesting period with a corresponding increase incontributed surplus. When the options are exercised, the exerciseprice proceeds together with the amount initially recorded incontributed surplus are credited to common shares. Stockappreciation rights (SARs) obligations that are fully vested give rise tocompensation expense as a result of changes in the market price ofour common shares. These expenses, net of related hedges, arerecorded as Non-interest expense – Human resources in ourConsolidated Statements of Income with a corresponding increase inOther liabilities on our Consolidated Balance Sheets.
Our other compensation plans include performance deferredshare plans and deferred share unit plans for key employees (thePlans). The deferred share plans are settled in our common shares orcash and the deferred share unit plans are settled in cash. Theobligations for the Plans are accrued over their vesting period. Forshare-settled awards, our accrued obligations are based on themarket price of our common shares at the date of grant. For cash-
settled awards, our accrued obligations are periodically adjusted forfluctuations in the market price of our common shares and dividendsaccrued. Changes in our obligations under the Plans, net of relatedhedges, are recorded as Non-interest expense – Human resources inour Consolidated Statements of Income with a correspondingincrease in Other liabilities or Contributed surplus on ourConsolidated Balance Sheets.
The compensation cost attributable to options and awards,granted to employees who are eligible to retire or will become eligibleto retire during the vesting period, is recognized immediately if theemployee is eligible to retire on the grant date or over the periodbetween the grant date and the date the employee becomes eligibleto retire.
Our contributions to the employee savings and share ownershipplans are expensed as incurred.
Income taxesWe use the asset and liability method whereby income taxes reflectthe expected future tax consequences of temporary differencesbetween the carrying amounts of assets or liabilities for accountingpurposes compared with tax purposes. A future income tax asset orliability is determined for each temporary difference based on the taxrates that are expected to be in effect when the underlying items ofincome and expense are expected to be realized, except for earningsrelated to our foreign operations where repatriation of such amountsis not contemplated in the foreseeable future. Income taxes reportedon our Consolidated Statements of Income include the current andfuture portions of the expense. Income taxes applicable to itemscharged or credited to Shareholders’ equity are netted with suchitems. Changes in future income taxes related to a change in tax ratesare recognized in the period when the tax rate change is substantivelyenacted. Our Consolidated Statements of Income include items thatare non-taxable or non-deductible for income tax purposes and,accordingly, causing the income tax provision to be different fromwhat it would be if based on statutory rates.
Net future income taxes accumulated as a result of temporarydifferences and tax loss carryforwards are included in Other assets.On a quarterly basis, we review our future tax assets to determinewhether it is more likely than not that the benefits associated withthese assets will be realized; this review involves evaluating bothpositive and negative evidence. A valuation allowance is establishedto reduce future income tax assets to the amount that we believe ismore likely than not to be realized.
Business combinations, goodwill and other intangiblesAll business combinations are accounted for using the purchasemethod. Identifiable intangible assets are recognized separately fromGoodwill and included in Other intangibles. Goodwill represents theexcess of the price paid for the business acquired over the fair valueof the net identifiable assets acquired, and is assigned to reportingunits of a business segment. A reporting unit comprises businessoperations with similar economic characteristics and strategies, andis defined by GAAP as the level of reporting at which goodwill istested for impairment and is either a business segment or one levelbelow. Upon disposal of a portion of a reporting unit, goodwill isallocated to the disposed portion based on the fair value of thatportion relative to the total reporting unit. The goodwill allocated tothe portion of the reporting unit to be retained is tested for impair-ment.
Goodwill is evaluated for impairment annually as at August 1 ormore often if events or circumstances indicate there may be animpairment. We test our goodwill by first determining the fair value ofeach reporting unit and comparing it to its carrying value, includingthe allocated goodwill. If the carrying value of a reporting unitexceeds its fair value, the fair value of the reporting unit’s goodwillmust be determined and compared to its carrying value. The fair valueof the goodwill is imputed by determining the fair value of assets andliabilities of the reporting unit. Goodwill impairment is measured asthe excess of the carrying amount of the reporting unit’s allocated
84 Royal Bank of Canada: Annual Report 2010 Consolidated Financial Statements

goodwill over the implied fair value of the goodwill, and is charged toIncome in the period in which the impairment is identified.Subsequent reversals of impairment are prohibited.
The fair value of each reporting unit is determined primarilyusing an earnings-based approach which incorporates each reportingunit’s internal forecasts of revenue and expenses. Estimates andassumptions of discount rates, growth rates, and terminal growthrates are incorporated in this approach. Changes to these estimatesor assumptions could have an impact on the determination of the fairvalue of our reporting units and thus, the results of the impairmenttest. In addition to the earnings-based approach, where possible, weuse a market-based approach to estimate the fair value of eachreporting unit based on actual market events and comparablecompanies.
Other intangibles with a finite life are amortized on a straight-line basis over their estimated useful lives, generally not exceeding20 years, and are also tested for impairment when conditions existwhich may indicate that the estimated future net cash flows from theasset will be insufficient to recover its carrying amount.
OtherTranslation of foreign currenciesMonetary assets and liabilities denominated in foreign currencies aretranslated into Canadian dollars at rates prevailing at the balancesheet date. Non-monetary assets and liabilities are translated intoCanadian dollars at historical rates. Income and expenses denomi-nated in foreign currencies are translated at average rates ofexchange for the year.
Assets and liabilities of our self-sustaining operations withfunctional currencies other than the Canadian dollar are translatedinto Canadian dollars at rates prevailing at the balance sheet date,and income and expenses of these foreign operations are translatedat average rates of exchange for the year.
Unrealized gains or losses arising as a result of the translation ofour foreign self-sustaining operations along with the effective portionof related hedges are reported as a component of OCI on an after-taxbasis. Upon disposal or dilution of our interest in such investments,an appropriate portion of the accumulated net translation gains orlosses is included in Non-interest income.
Other foreign currency translation gains and losses are includedin Non-interest income.
Premises and equipmentPremises and equipment are stated at cost less accumulateddepreciation. Depreciation is recorded principally on a straight-linebasis over the estimated useful lives of the assets, which are 25 to 50years for buildings, 3 to 10 years for computer equipment, and 7 to10 years for furniture, fixtures and other equipment. The amortizationperiod for leasehold improvements is the lesser of the useful life ofthe leasehold improvements or the lease term plus the first renewal
period, if reasonably assured of renewal, up to a maximum of 10years. Gains and losses on disposal are recorded in Non-interestincome. Premises and equipment are tested for recoverabilitywhenever changes in circumstances indicate that a potentialimpairment has occurred. An impairment loss is recorded when theprojected discounted cash flows from the use of premises andequipment is less than their carrying value.
Earnings per shareEarnings per share is computed by dividing Net income available tocommon shareholders by the weighted average number of commonshares outstanding for the period, net of treasury shares. Net incomeavailable to common shareholders is determined after deductingdividend entitlements of preferred shareholders and any gain (loss)on redemption of preferred shares net of related income taxes.Diluted earnings per share reflects the potential dilution that couldoccur if additional common shares are assumed to be issued undersecurities or contracts that entitle their holders to obtain commonshares in the future, to the extent such entitlement is not subject tounresolved contingencies. The number of additional shares forinclusion in diluted earnings per share calculations is determinedusing the treasury stock method. Under this method, stock optionswhose exercise price is less than the average market price of ourcommon shares are assumed to be exercised and the proceeds areused to repurchase common shares at the average market price forthe period. The incremental number of common shares issued understock options and repurchased from proceeds is included in thecalculation of diluted earnings per share.
Future accounting changesEmbedded Prepayment Option – Amendments to: FinancialInstruments – Recognition and Measurement, Section 3855.In June 2009, the CICA provided clarification to Section 3855 withrespect to the accounting for embedded prepayment option. Anembedded prepayment option in an interest-only or principal-onlystrip is closely related to the host contract, provided the host contractinitially resulted from separating the right to receive contractual cashflows of a financial instrument, that, in and of itself, did not containan embedded derivative; and does not contain any terms not presentin the original host debt contract. This new standard will be appli-cable to us on November 1, 2011. We are currently assessing theimpact of adopting this amendment on our consolidated financialposition and results of operations.
International Financial Reporting StandardsThe CICA has announced that Canadian GAAP for publicly accountableenterprises companies will be replaced with International FinancialReporting Standards (IFRS) over a transition period expected to end in2011. We will begin reporting our financial statements in accordancewith IFRS on November 1, 2011.
Note 2 Fair value of financial instruments
The fair value of a financial instrument is the amount at which thefinancial instrument could be exchanged in an arm’s-length trans-action between knowledgeable and willing parties under nocompulsion to act. Fair values of identical instruments traded inactive markets are determined by reference to last quoted prices, inthe most advantageous active market for that instrument. Forfinancial assets and liabilities on our Consolidated Balance Sheets,we use current bid or asking price, respectively, as the quoted price.For financial assets and liabilities to be acquired, we use currentasking or bid price, respectively, to value them. In the absence of anactive market, we determine fair values based on quoted prices forinstruments with similar characteristics and risk profiles or whereappropriate a valuation model. Fair values of financial instrumentsdetermined using valuation models require the use of inputs. In
determining those inputs, we look primarily to external, readilyobservable market inputs, when available, including factors such asinterest rate yield curves, currency rates, and price and ratevolatilities, as applicable. In some circumstances, we use inputparameters that are not based on observable market data. In thesecases, we may adjust model values to reflect the valuationuncertainty (model and parameter valuation adjustments) in order todetermine what the fair value would be based on the assumptionsthat market participants would use in pricing the financial instrument.
Valuation adjustments are required to be made in certaincircumstances to determine fair value of the financial instrument. Forsome securities, we may record valuation adjustments for liquidity forfinancial instruments that are not quoted in an active market when webelieve that the amount realized on sale may be less than the
Consolidated Financial Statements Royal Bank of Canada: Annual Report 2010 85

Note 2 Fair value of financial instruments (continued)
estimated fair value due to insufficient liquidity in the market over ashort period of time.
We make valuation adjustments for the credit risk of ourderivative portfolios in order to arrive at their fair values. Theseadjustments take into account the creditworthiness of our counter-parties, the current and potential future mark-to-market of thetransactions, and the effects of credit mitigants such as masternetting agreements and collateral agreements. Credit valuationadjustments are frequently updated due to the changes in derivativevalues and counterparty performance risk. Changes to creditvaluation adjustments are recorded in current period income.
We have documented our internal policies that detail ourprocesses for determining fair value, including the methodologiesused in establishing our valuation adjustments. These methodologiesare consistently applied and periodically reviewed by Group RiskManagement and Finance.
Valuation techniques and inputsTrading and available-for-sale securities and derivative-related assetsrepresent 84% of the total fair-value assets, and deposits designatedas held-for-trading and derivative-related liabilities represent 72% ofthe total fair-value liabilities.
The majority of our financial instruments classified asheld-for-trading (other than derivatives) and as available-for-salecomprise debt and equity securities.
For debt securities, equity securities and exchange tradedderivatives, the fair value of these instruments is based on quotedmarket prices from an exchange, dealer, broker, industry group orpricing service, when available. When quoted market prices are notavailable, the fair value is determined by reference to quoted marketprices for similar instruments, adjusted as appropriate for the specificcircumstances of the instruments.
When quoted market prices for identical or similar instrumentsare not available, instrument fair value is determined using valuationmodels based on the calculation of the present value of theinstrument’s expected future cash flows. The inputs to thesevaluation models are derived from observable market data and,where relevant, assumptions in respect of unobservable inputs.
All of our derivatives transactions are accounted for on a fairvalue basis. Over-the-counter (non-exchange traded) derivatives arevalued using valuation models. Valuation models calculate thepresent value of expected future cash flows using an arbitrage-freeprinciple. The modeling approaches for most vanilla derivativeproducts are standard in the industry. When possible, inputs tovaluation models are determined from observable market data,including prices available from exchanges, dealers, brokers or pricingservices.
Certain inputs may not be directly observable and these may bederived from observable prices using model calibration techniques,historical data or other sources. Examples of observable inputsinclude foreign exchange spot and forward rates, benchmark interestrate curves and volatilities for commonly traded option products.Examples of inputs that may be unobservable include some or all ofthe volatility surfaces of option products, and correlations of or
between market factors such as foreign exchange rates, interest ratesand equity prices.
Certificates of deposits, term deposits, bearer deposit notes andGICs designated as held-for-trading are valued by discounting futurecontractual cash flows at the discount rates. Discount rates arederived from our observed liability issuance and trading, and tradingof comparable banks’ liabilities and issuance auctions. Valuationmethods and inputs used in measuring changes in fair valueattributable to changes in our credit spreads are described in theCarrying value and fair value of selected financial instruments sectionbelow.
Deferred unrealized gains or losses at inceptionAn unrealized gain or loss at inception for financial instruments is thedifference between the transaction price and its fair value on thetrade date. Unrealized gains or losses at inception are recognized inNet income only if the fair value of the instrument is: (i) evidenced bya quoted market price in an active market or observable currentmarket transactions that are substantially the same; (ii) based on avaluation technique that uses all significant observable marketinputs, or (iii) the risks associated with the derivative contract arefully offset by another contract(s) with a third party(ies). For financialinstruments where the fair value is not evidenced by the above-mentioned criteria or the risks associated with the original contractare not fully transferred to a third party, the unrealized gain or loss atinception is deferred and is included in Other – Derivatives. Thedeferred gain or loss is recognized only when: (i) unobservablemarket inputs become observable to support the fair value of thetransaction; (ii) the risks associated with the original contract aresubstantially offset by another contract(s) with a third party(ies);(iii) the gain or loss is realized through receipt or payment of cash, or(iv) the transaction is terminated early or on maturity.
Deferred unrealized gains at inception primarily arise in equityand interest rate structured notes. The following table summarizeschanges in the aggregate amount of deferred unrealized gains atinception for our financial instruments.
Deferred unrealized gains or losses at inception
2010 2009 2008Deferred unrealized gains not yet recognized in net
income, as at beginning of period $ 46 $ 198 $ 186Less: Adjustments (1) – (130) –
Adjusted balance, as at beginning of the year $ 46 $ 68 $ 186Add: Deferred unrealized gains (losses) arising
during the period 15 (5) 24Less: Deferred gains reclassified to net income
during the period 5 17 12
Deferred unrealized gains, as at end of period $ 56 $ 46 $ 198
(1) During 2009, we revised the valuation model that we use to fair value the stable valuecontracts on bank-owned life insurance policies and 401(k) plans, as a result of newlyavailable data and information. The new valuation model eliminates the requirement fordeferred unrealized gains or losses at inception on these instruments which is reflectedin the table above. There was no material impact on the results of operation for 2009due to this change in accounting estimate.
86 Royal Bank of Canada: Annual Report 2010 Consolidated Financial Statements

Carrying value and fair value of the selected financial instrumentsThe following tables provide a comparison of the carrying and fair values for each classification of financial instruments.
2010
Carrying value and fair value ofCarrying
value Fair value
Financialinstruments
required tobe classified
as held-for-trading
Financialinstrumentsdesignatedas held-for-
trading
Available-for-sale
instrumentsmeasured
at fair value
Loans andreceivables
and non-trading
liabilities
Loans andreceivables
and non-trading
liabilities
Available-for-sale
instrumentsmeasuredat cost (1)
Totalcarryingamount
Total fairvalue
Financial assetsSecurities
Trading $ 131,211 $ 18,344 $ – $ – $ – $ – $149,555 $149,555Available-for-sale – – 42,467 – – 1,309 43,776 43,776Total securities $ 131,211 $ 18,344 $ 42,467 $ – $ – $ 1,309 $193,331 $193,331
Assets purchased under reverse repurchaseagreements and securities borrowed $ – $ 51,713 $ – $ 20,985 $ 20,985 $ – $ 72,698 $ 72,698
LoansRetail $ – $ – $ – $ 220,321 $ 218,477 $ – $220,321 $218,477Wholesale – 2,899 – 68,986 67,544 – 71,885 70,443Total loans $ – $ 2,899 $ – $ 289,307 $ 286,021 $ – $292,206 $288,920
OtherDerivatives $ 106,246 $ – $ – $ – $ – $ – $106,246 $106,246Other assets – 296 – 19,585 19,585 – 19,881 19,881
Financial liabilitiesDeposits
Personal $ – $ 3,237 $ – $ 158,456 $ 159,255 $ – $161,693 $162,492Business and government (2) – 62,654 – 184,543 183,892 – 247,197 246,546Bank (3) – 9,479 – 14,664 14,664 – 24,143 24,143Total deposits $ – $ 75,370 $ – $ 357,663 $ 357,811 $ – $433,033 $433,181
OtherObligations related to securities sold short $ 46,597 $ – $ – $ – $ – $ – $ 46,597 $ 46,597Obligations related to assets sold under
repurchase agreements and securitiesloaned – 26,242 – 15,340 15,340 – 41,582 41,582
Derivatives (4) 108,910 – – – – – 108,910 108,910Other liabilities (509) 127 – 30,598 30,833 – 30,216 30,451
Subordinated debentures – 119 – 6,562 6,488 – 6,681 6,607Trust capital securities – – – 727 753 – 727 753
(1) Includes $225 million of our held-to-maturity investments which are carried at amortized cost.(2) Business and government includes deposits from regulated deposit-taking institutions other than regulated banks.(3) Bank refers to regulated banks.(4) Includes stable value contracts on $170 million of bank-owned life insurance policies and $2 million of 401(k) plans.
Consolidated Financial Statements Royal Bank of Canada: Annual Report 2010 87

Note 2 Fair value of financial instruments (continued)
2009
Carrying value and fair value ofCarrying
value Fair value
Financialinstrumentsrequired to
be classifiedas held-for-
trading
Financialinstrumentsdesignatedas held-for-
trading
Available-for-sale
instrumentsmeasured
at fair value
Loans andreceivables
and non-trading
liabilities
Loans andreceivables
and non-trading
liabilities
Available-for-sale
instrumentsmeasuredat cost (1)
Totalcarryingamount
Totalfair
value
Financial assetsSecurities
Trading $ 127,394 $ 12,668 $ – $ – $ – $ – $140,062 $140,062Available-for-sale – – 44,850 – – 1,360 46,210 46,210
Total securities $ 127,394 $ 12,668 $ 44,850 $ – $ – $ 1,360 $186,272 $186,272
Assets purchased under reverse repurchaseagreements and securities borrowed $ – $ 18,911 $ – $ 22,669 $ 22,669 $ – $ 41,580 $ 41,580
LoansRetail $ – $ – $ – $ 203,856 $ 201,166 $ – $203,856 $201,166Wholesale – 2,818 – 74,289 69,712 – 77,107 72,530
Total loans $ – $ 2,818 $ – $ 278,145 $ 270,878 $ – $280,963 $273,696
OtherDerivatives $ 92,173 $ – $ – $ – $ – $ – $ 92,173 $ 92,173Other assets – 244 – 18,590 18,590 – 18,834 18,834
Financial liabilitiesDeposits
Personal $ – $ 2,605 $ – $ 149,723 $ 151,051 $ – $152,328 $153,656Business and government (2) – 40,335 – 180,437 180,354 – 220,772 220,689Bank (3) – 10,880 – 14,324 14,324 – 25,204 25,204
Total deposits $ – $ 53,820 $ – $ 344,484 $ 345,729 $ – $398,304 $399,549
OtherObligations related to securities sold short $ 41,359 $ – $ – $ – $ – $ – $ 41,359 $ 41,359Obligations related to assets sold under repurchase
agreements and securities loaned – 21,628 – 13,522 13,522 – 35,150 35,150Derivatives (4) 84,390 – – – – – 84,390 84,390Other liabilities – 240 – 33,757 33,757 – 33,997 33,997
Subordinated debentures – 110 – 6,351 6,262 – 6,461 6,372Trust capital securities – – – 1,395 1,482 – 1,395 1,482
(1) Includes $156 million of our held-to-maturity investments which are carried at amortized cost.(2) Business and government includes deposits from regulated deposit-taking institutions other than regulated banks.(3) Bank refers to regulated banks.(4) Includes stable value contracts on $257 million of bank-owned life insurance policies and $3 million of 401(k) plans.
Financial instruments designated as held-for-trading using the fairvalue optionThe following table presents information on loans and receivablesdesignated as held-for-trading using the fair value option, themaximum exposure to credit risk, the extent to which the risk ismitigated by credit derivatives and similar instruments, and changes
in the fair value of these assets. We measure the change in the fairvalue of loans and receivables designated as held-for-trading due tochanges in credit risk as the difference between the total change inthe fair value of the instrument during the period and the change infair value calculated using the appropriate risk-free yield curves.
2010
Loans and receivables designated as held-for-trading
Carryingvalue of
loans andreceivablesdesignatedas held-for-
trading
Maximumexposure to
credit risk
Change in fairvalue since
November 1,2009
attributable tochanges incredit risk
Cumulativechange in fair
value sinceinitial
recognitionattributable to
changes incredit risk
Extent towhichcredit
derivativesor similar
instrumentsmitigate
credit risk
Change infair value of
creditderivatives
or similarinstruments
sinceNovember 1,
2009
Cumulativechange in fair
value of creditderivatives
or similarinstruments (1)
Interest-bearing deposits with banks $ 6,193 $ 6,193 $ – $ – $ – $ – $ –Assets purchased under reverse repurchase
agreements and securities borrowed 51,713 51,713 – – – – –Loans – Wholesale 2,899 2,899 (51) (180) 346 (4) (2)
Total $ 60,805 $ 60,805 $ (51) $ (180) $ 346 $ (4) $ (2)
(1) The cumulative change is measured from the later of November 1, 2006, or the initial recognition of the credit derivative or similar instruments.
88 Royal Bank of Canada: Annual Report 2010 Consolidated Financial Statements

2009
Loans and receivables designated as held-for-trading
Carryingvalue of
loans andreceivablesdesignatedas held-for-
trading
Maximumexposure to
credit risk
Change in fairvalue since
November 1,2008
attributable tochanges incredit risk
Cumulativechange in fair
value sinceinitial
recognitionattributable to
changes incredit risk
Extent towhichcredit
derivativesor similar
instrumentsmitigate
credit risk
Change infair value of
creditderivatives
or similarinstruments
sinceNovember 1,
2008
Cumulativechange in fair
value of creditderivatives
or similarinstruments (1)
Interest-bearing deposits with banks $ 2,773 $ 2,773 $ – $ – $ – $ – $ –Assets purchased under reverse repurchase
agreements and securities borrowed 18,911 18,911 – – – – –Loans – Wholesale 2,818 2,818 27 (75) 428 (52) 10
Total $ 24,502 $ 24,502 $ 27 $ (75) $ 428 $ (52) $ 10
(1) The cumulative change is measured from the later of November 1, 2006, or the initial recognition of the credit derivative or similar instruments.
The following tables present the changes in the fair value of ourfinancial liabilities designated as held-for-trading using the fair valueoption as well as their contractual maturity and carrying amounts. Thecarrying values (fair values) of these liabilities are based on presentvalues of the instruments’ contractual cash flows discounted at theappropriate market interest rates. Appropriate market rates compriseobservable benchmark interest rates and our credit spreads which areeither observable or unobservable. In order to determine the changes
in fair value attributable to changes in our credit spreads aspresented in the table below, we first calculate the difference inpresent values of the instruments’ contractual cash flows by includingand excluding our credit spreads in the discount rate as at thebeginning of the year. We then re-perform the same calculationsusing the end-of-the-year rates. The difference between those valuesrepresents the changes in fair value attributable to changes in ourcredit spreads.
2010
Liabilities designated as held-for-trading
Contractualmaturityamount
Carryingvalue
Differencebetweencarrying
value andcontractual
maturityamount
Changes in fairvalue since
November 1, 2009attributable to
changes in RBCcredit spread
Cumulativechange in fair
value attributableto changes in
RBC creditspread (1)
Term depositsPersonal $ 3,300 $ 3,237 $ (63) $ (13) $ (19)Business and government (2) 62,597 62,654 57 (20) (77)Bank (3) 9,479 9,479 – 1 –
Total term deposits $ 75,376 $ 75,370 $ (6) $ (32) $ (96)Obligations related to assets sold under repurchase
agreements and securities loaned 26,243 26,242 (1) – –Other liabilities 127 127 – – –Subordinated debentures 127 119 (8) (6) (18)
Total $ 101,873 $ 101,858 $ (15) $ (38) $ (114)
(1) The cumulative change attributable to changes in our credit spreads is measured from the later of November 1, 2006, or the initial recognition of the liabilities designated as held-for-trading.(2) Business and government includes deposits from regulated deposit-taking institutions other than regulated banks.(3) Bank refers to regulated banks.
2009
Liabilities designated as held-for-trading
Contractualmaturityamount
Carryingvalue
Differencebetweencarrying
value andcontractual
maturityamount
Changes in fairvalue since
November 1, 2008attributable to
changes in RBCcredit spread
Cumulativechange in fair
value attributableto changes in
RBC creditspread (1)
Term depositsPersonal $ 2,605 $ 2,605 $ – $ 40 $ (6)Business and government (2) 40,167 40,335 168 507 (57)Bank (3) 10,880 10,880 – 3 (1)
Total term deposits $ 53,652 $ 53,820 $ 168 $ 550 $ (64)Obligations related to assets sold under repurchase
agreements and securities loaned 21,626 21,628 2 – –Other liabilities 240 240 – – –Subordinated debentures 120 110 (10) 36 (12)
Total $ 75,638 $ 75,798 $ 160 $ 586 $ (76)
(1) The cumulative change attributable to changes in our credit spreads is measured from the later of November 1, 2006, or the initial recognition of the liabilities designated as held-for-trading.(2) Business and government includes deposits from regulated deposit-taking institutions other than regulated banks.(3) Bank refers to regulated banks.
Consolidated Financial Statements Royal Bank of Canada: Annual Report 2010 89

Note 2 Fair value of financial instruments (continued)
Fair value of assets and liabilities classified using the fair valuehierarchyThe following table presents the financial instruments measured atfair value classified by the fair value hierarchy set out inSection 3862, Financial Instruments – Disclosures. Section 3862requires that all financial instruments measured at fair value becategorized into one of three hierarchy levels, described below, fordisclosure purposes. Each level is based on the transparency of theinputs used to measure the fair values of assets and liabilities:• Level 1 – inputs are unadjusted quoted prices of identical
instruments in active markets.
• Level 2 – inputs other than quoted prices included in Level 1 thatare observable for the asset or liability, either directly orindirectly.
• Level 3 – one or more significant inputs used in a valuationtechnique are unobservable in determining fair values of theinstruments.
Determination of fair value and the resulting hierarchy requires theuse of observable market data whenever available. The classificationof a financial instrument in the hierarchy is based upon the lowestlevel of input that is significant to the measurement of fair value.
As at October 31, 2010 As at October 31, 2009
Fair valuemeasurements using (1)
Totalgross fair
valueNetting
adjustments (2)
Assets/liabilities
at fairvalue
Fair valuemeasurements using (1)
Totalgross fair
valueNetting
adjustments (2)
Assets/liabilities
at fairvalueLevel 1 Level 2 Level 3 Level 1 Level 2 Level 3
Financial assetsInterest bearing deposits with banks $ – $ 6,193 $ – $ 6,193 $ – $ 6,193 $ – $ 2,773 $ – $ 2,773 $ – $ 2,773Securities
TradingCanadian government debt (3)
Federal – 29,337 14 29,351 – 29,351 – 25,269 5 25,274 – 25,274Provincial and municipal – 7,243 5 7,248 – 7,248 – 5,073 54 5,127 – 5,127
U.S. state, municipal and agenciesdebt (3) – 13,637 41 13,678 – 13,678 – 13,289 9 13,298 – 13,298
Other OECD government debt (4) – 12,114 42 12,156 – 12,156 – 8,033 – 8,033 – 8,033Mortgage–backed securities (3) – 10 975 985 – 985 – 20 1,052 1,072 – 1,072Asset–backed securities
CDOs (5) – – 2,460 2,460 – 2,460 – – 3,074 3,074 – 3,074Non–CDO securities – 276 541 817 – 817 – 211 321 532 – 532
Corporate debt and other debt 30 43,529 771 44,330 – 44,330 – 46,015 303 46,318 – 46,318Equities 35,767 221 2,542 38,530 – 38,530 34,313 119 2,902 37,334 – 37,334
$35,797 $106,367 $ 7,391 $149,555 $ – $149,555 $ 34,313 $ 98,029 $ 7,720 $ 140,062 $ – $140,062Available–for–sale (6)
Canadian government debt (3)Federal – 14,685 – 14,685 – 14,685 – 12,161 – 12,161 – 12,161Provincial and municipal – 1,536 – 1,536 – 1,536 237 897 – 1,134 – 1,134
U.S. state, municipal and agenciesdebt (3) – 3,246 1,697 4,943 – 4,943 – 3,435 2,358 5,793 – 5,793
Other OECD government debt (4) 1,450 3,630 – 5,080 – 5,080 908 2,622 – 3,530 – 3,530Mortgage–backed securities (3) – – 1,027 1,027 – 1,027 – 4 1,848 1,852 – 1,852Asset–backed securities
CDOs (5) – 9 215 224 – 224 – – 222 222 – 222Non–CDO securities – 2,379 896 3,275 – 3,275 – 3,050 1,155 4,205 – 4,205
Corporate debt and other debt 378 7,776 2,635 10,789 – 10,789 177 10,802 3,580 14,559 – 14,559Equities 173 144 399 716 – 716 537 147 560 1,244 – 1,244Loan substitute securities – 192 – 192 – 192 – 150 – 150 – 150
$ 2,001 $ 33,597 $ 6,869 $ 42,467 $ – $ 42,467 $ 1,859 $ 33,268 $ 9,723 $ 44,850 $ – $ 44,850Assets purchased under reverse
repurchase agreements andsecurities borrowed – 51,713 – 51,713 – 51,713 – 18,911 – 18,911 – 18,911
Loans – 2,307 592 2,899 – 2,899 – 2,441 377 2,818 – 2,818Other
DerivativesInterest rate contracts 3 66,803 780 67,586 24 53,070 842 53,936Foreign exchange contracts – 29,619 101 29,720 1 25,331 236 25,568Credit derivatives – 965 1,038 2,003 – 2,865 2,455 5,320Other contracts 1,960 2,207 3,743 7,910 3,394 2,869 1,987 8,250Valuation adjustments determined
on a pooled basis (1) (228) (490) (719) (6) (396) (231) (633)Total gross derivative 1,962 99,366 5,172 106,500 3,413 83,739 5,289 92,441Netting adjustments (2) (254) (268)Total derivatives 1,962 99,366 5,172 106,500 (254) 106,246 3,413 83,739 5,289 92,441 (268) 92,173
Other assets 286 10 – 296 – 296 244 – – 244 – 244$40,046 $299,553 $20,024 $359,623 $ (254) $359,369 $ 39,829 $ 239,161 $ 23,109 $ 302,099 $ (268) $301,831
(1) There were no significant transfers between Levels 1 and 2.(2) The netting adjustments represent the impact of offsetting derivative credit exposures on contracts where we have both a legally enforceable netting agreement in place and we intend to
settle the contracts on either a net basis or simultaneously. Hence, some of the derivative related assets and liabilities are reported on a net basis.(3) As at October 31, 2010 residential and commercial MBS included in Trading securities were $11,995 million and $194 million, respectively (2009 – $12,414 million and $185 million,
respectively), and in Available-for-sale securities, $8,720 million and $152 million, respectively (2009 – $8,454 million and $213 million, respectively).(4) OECD stands for Organisation for Economic Co-operation and Development.(5) CDOs stand for Collateralized Debt Obligations.(6) Excludes $1,309 million of Available-for-sale and held-to-maturity securities (2009 – $1,360 million) that are carried at cost.
90 Royal Bank of Canada: Annual Report 2010 Consolidated Financial Statements

As at October 31, 2010 As at October 31, 2009
Fair valuemeasurements using (1)
Totalgross fair
valueNetting
adjustments (2)
Assets/liabilities
at fairvalue
Fair valuemeasurements using (1)
Totalgross fair
valueNetting
adjustments (2)
Assets/liabilities
at fairvalueLevel 1 Level 2 Level 3 Level 1 Level 2 Level 3
Financial LiabilitiesDeposits
Personal $ – $ – $ 3,237 $ 3,237 $ – $ 3,237 $ – $ – $ 2,605 $ 2,605 $ – $ 2,605Business and government – 59,510 3,144 62,654 – 62,654 – 35,994 4,341 40,335 – 40,335Bank – 9,479 – 9,479 – 9,479 – 10,880 – 10,880 – 10,880
OtherObligations related to securities sold
short 14,780 31,577 240 46,597 – 46,597 14,006 27,203 150 41,359 – 41,359Obligations related to assets sold
under repurchase agreements andsecurities loaned – 26,242 – 26,242 – 26,242 – 21,628 – 21,628 – 21,628
DerivativesInterest rate contracts 1 61,683 415 62,099 18 47,688 423 48,129Foreign exchange contracts – 34,960 27 34,987 – 23,983 16 23,999Credit derivatives – 1,112 606 1,718 – 2,863 1,555 4,418Other contracts 1,203 3,742 5,415 10,360 1,350 3,290 3,472 8,112Total gross derivative 1,204 101,497 6,463 109,164 1,368 77,824 5,466 84,658Netting adjustments (2) (254) (268)Total derivatives 1,204 101,497 6,463 109,164 (254) 108,910 1,368 77,824 5,466 84,658 (268) 84,390
Other liabilities – – (382) (382) – (382) – – 240 240 – 240Subordinated debentures – – 119 119 – 119 – – 110 110 – 110
$15,984 $228,305 $12,821 $257,110 $ (254) $256,856 $ 15,374 $173,529 $ 12,912 $201,815 $ (268) $201,547
(1) There were no significant transfers between Levels 1 and 2.(2) The netting adjustments represent the impact of offsetting derivative credit exposures on contracts where we have both a legally enforceable netting agreement in place and we intend to
settle the contracts on either a net basis or simultaneously. Hence, some of the derivative related assets and liabilities are reported on a net basis.
Consolidated Financial Statements Royal Bank of Canada: Annual Report 2010 91

Note 2 Fair value of financial instruments (continued)
Changes in fair value measurement for instruments categorized in Level 3The following table presents the changes in fair value measurements for instruments included in Level 3 of the fair value hierarchy set out inSection 3862:
2010
Fair valueNovember 1,
2009
Totalrealized/
unrealizedgains
(losses)included in
earnings (1)
Totalunrealized
gains (losses)included in
othercomprehensive
income (2)
Purchasesof assets/
issuances ofliabilities
Sales ofassets/
settlementsof liabilities
andothers (3)
Transfersinto
Level 3 (1)
Transfersout of
Level 3 (1)
Fair valueOctober 31,
2010
Changes inunrealized gains(losses) included
in earnings forassets and
liabilities for theyear ended
October 31, 2010for positions
still held
Assets
SecuritiesTrading
Canadian government debtFederal $ 5 $ – $ – $ 24 $ (1) $ 4 $ (18) $ 14 $ –Provincial and municipal 54 1 – 12 5 – (67) 5 –
U.S. state, municipal and agencies debt 9 15 (8) 70 (32) – (13) 41 8Other OECD government debt – – – 42 – – – 42 –Mortgage-backed securities 1,052 199 (59) 2,253 (2,458) 21 (33) 975 91Asset-backed securities
CDOs 3,074 (467) (166) 36 (67) 50 – 2,460 (24)Non-CDO securities 321 22 (9) 4,838 (4,618) – (13) 541 6
Corporate debt and other debt 303 269 (33) 3,639 (3,757) 512 (162) 771 336Equities 2,902 182 (137) 714 (1,114) – (5) 2,542 124
$ 7,720 $ 221 $ (412) $ 11,628 $ (12,042) $ 587 $ (311) $ 7,391 $ 541
Available-for-saleU.S. state, municipal and agencies debt $ 2,358 $ (9) $ (75) $ 191 $ (768) $ – $ – $ 1,697 $ –Other OECD government debt – – – – 1 112 (113) – –Mortgage-backed securities 1,848 23 66 18 (928) – – 1,027 –Asset-backed securities
CDOs 222 – (6) – (1) – – 215 –Non-CDO securities 1,155 (22) (75) 60 (222) – – 896 –
Corporate debt and other debt 3,580 (22) (122) 486 (970) 218 (535) 2,635 –Equities 560 – (31) 45 (179) 4 – 399 –
$ 9,723 $ (30) $ (243) $ 800 $ (3,067) $ 334 $ (648) $ 6,869 $ –
Loans – Wholesale $ 377 $ (32) $ (17) $ 155 $ (244) $ 467 $ (114) $ 592 $ (33)Other
Derivatives, net of derivative relatedliabilities (4) (177) (1,057) 78 62 (114) (35) (48) (1,291) (1,172)
$ 17,643 $ (898) $ (594) $ 12,645 $ (15,467) $ 1,353 $ (1,121) $ 13,561 $ (664)
Liabilities
DepositsPersonal $ (2,605) $ (358) $ 61 $ (3,295) $ 2,960 $ – $ – $ (3,237) $ (143)Business and government (4,341) 207 212 (1,407) 2,185 – – (3,144) 50
OtherObligations related to securities sold short (150) 83 2 (1,265) 1,108 (18) – (240) (4)Other liabilities (240) 469 13 (1) 141 – – 382 622Subordinated debentures (110) (2) (8) – 1 – – (119) (2)
$ (7,446) $ 399 $ 280 $ (5,968) $ 6,395 $ (18) $ – $ (6,358) $ 523
(1) Transfers in and out of Level 3 are assumed to occur at the end of the period. For an asset or a liability that transfers into Level 3 during the period, the entire change in fair value for theperiod is excluded from the “Total realized/unrealized gains (losses) included in earnings” column of the reconciliation, whereas for transfers out of Level 3 during the period, the entirechange in fair value for the period is included in the same column of the reconciliation. During the year ended October 31, 2010, there were no significant transfers into or out of Level 3.
(2) Includes the foreign currency translation gains or losses arising on consolidation of foreign subsidiaries relating to the Level 3 instruments, where applicable. The unrealized gains or (losses)on Available-for-sale securities were $253 million for the year, excluding the translation gains or losses.
(3) Other includes amortization of premiums or discounts recognized in net income.(4) Net derivatives as at October 31, 2010 included derivative assets of $5,172 million and derivative liabilities of $6,463 million.
92 Royal Bank of Canada: Annual Report 2010 Consolidated Financial Statements
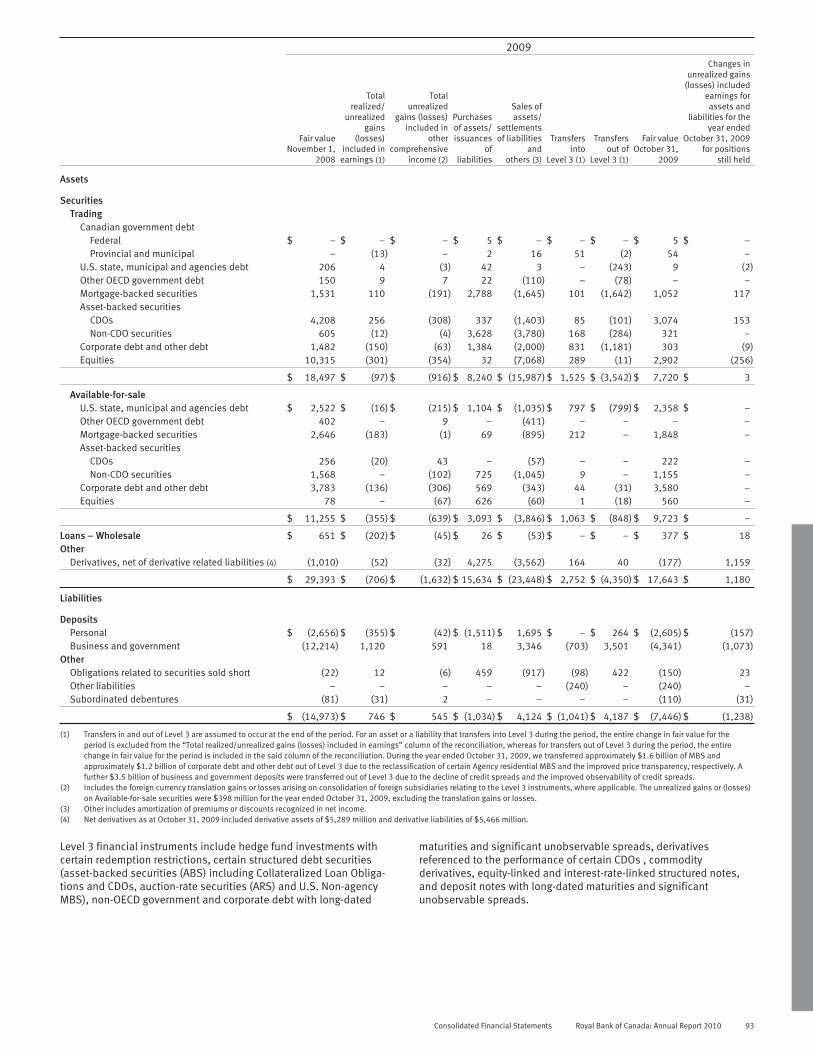
2009
Fair valueNovember 1,
2008
Totalrealized/
unrealizedgains
(losses)included in
earnings (1)
Totalunrealized
gains (losses)included in
othercomprehensive
income (2)
Purchasesof assets/issuances
ofliabilities
Sales ofassets/
settlementsof liabilities
andothers (3)
Transfersinto
Level 3 (1)
Transfersout of
Level 3 (1)
Fair valueOctober 31,
2009
Changes inunrealized gains
(losses) includedearnings forassets and
liabilities for theyear ended
October 31, 2009for positions
still held
Assets
SecuritiesTrading
Canadian government debtFederal $ – $ – $ – $ 5 $ – $ – $ – $ 5 $ –Provincial and municipal – (13) – 2 16 51 (2) 54 –
U.S. state, municipal and agencies debt 206 4 (3) 42 3 – (243) 9 (2)Other OECD government debt 150 9 7 22 (110) – (78) – –Mortgage-backed securities 1,531 110 (191) 2,788 (1,645) 101 (1,642) 1,052 117Asset-backed securities
CDOs 4,208 256 (308) 337 (1,403) 85 (101) 3,074 153Non-CDO securities 605 (12) (4) 3,628 (3,780) 168 (284) 321 –
Corporate debt and other debt 1,482 (150) (63) 1,384 (2,000) 831 (1,181) 303 (9)Equities 10,315 (301) (354) 32 (7,068) 289 (11) 2,902 (256)
$ 18,497 $ (97) $ (916) $ 8,240 $ (15,987) $ 1,525 $ (3,542) $ 7,720 $ 3
Available-for-saleU.S. state, municipal and agencies debt $ 2,522 $ (16) $ (215) $ 1,104 $ (1,035) $ 797 $ (799) $ 2,358 $ –Other OECD government debt 402 – 9 – (411) – – – –Mortgage-backed securities 2,646 (183) (1) 69 (895) 212 – 1,848 –Asset-backed securities
CDOs 256 (20) 43 – (57) – – 222 –Non-CDO securities 1,568 – (102) 725 (1,045) 9 – 1,155 –
Corporate debt and other debt 3,783 (136) (306) 569 (343) 44 (31) 3,580 –Equities 78 – (67) 626 (60) 1 (18) 560 –
$ 11,255 $ (355) $ (639) $ 3,093 $ (3,846) $ 1,063 $ (848) $ 9,723 $ –
Loans – Wholesale $ 651 $ (202) $ (45) $ 26 $ (53) $ – $ – $ 377 $ 18Other
Derivatives, net of derivative related liabilities (4) (1,010) (52) (32) 4,275 (3,562) 164 40 (177) 1,159
$ 29,393 $ (706) $ (1,632) $ 15,634 $ (23,448) $ 2,752 $ (4,350) $ 17,643 $ 1,180
Liabilities
DepositsPersonal $ (2,656) $ (355) $ (42) $ (1,511) $ 1,695 $ – $ 264 $ (2,605) $ (157)Business and government (12,214) 1,120 591 18 3,346 (703) 3,501 (4,341) (1,073)
OtherObligations related to securities sold short (22) 12 (6) 459 (917) (98) 422 (150) 23Other liabilities – – – – – (240) – (240) –Subordinated debentures (81) (31) 2 – – – – (110) (31)
$ (14,973) $ 746 $ 545 $ (1,034) $ 4,124 $ (1,041) $ 4,187 $ (7,446) $ (1,238)
(1) Transfers in and out of Level 3 are assumed to occur at the end of the period. For an asset or a liability that transfers into Level 3 during the period, the entire change in fair value for theperiod is excluded from the “Total realized/unrealized gains (losses) included in earnings” column of the reconciliation, whereas for transfers out of Level 3 during the period, the entirechange in fair value for the period is included in the said column of the reconciliation. During the year ended October 31, 2009, we transferred approximately $1.6 billion of MBS andapproximately $1.2 billion of corporate debt and other debt out of Level 3 due to the reclassification of certain Agency residential MBS and the improved price transparency, respectively. Afurther $3.5 billion of business and government deposits were transferred out of Level 3 due to the decline of credit spreads and the improved observability of credit spreads.
(2) Includes the foreign currency translation gains or losses arising on consolidation of foreign subsidiaries relating to the Level 3 instruments, where applicable. The unrealized gains or (losses)on Available-for-sale securities were $398 million for the year ended October 31, 2009, excluding the translation gains or losses.
(3) Other includes amortization of premiums or discounts recognized in net income.(4) Net derivatives as at October 31, 2009 included derivative assets of $5,289 million and derivative liabilities of $5,466 million.
Level 3 financial instruments include hedge fund investments withcertain redemption restrictions, certain structured debt securities(asset-backed securities (ABS) including Collateralized Loan Obliga-tions and CDOs, auction-rate securities (ARS) and U.S. Non-agencyMBS), non-OECD government and corporate debt with long-dated
maturities and significant unobservable spreads, derivativesreferenced to the performance of certain CDOs , commodityderivatives, equity-linked and interest-rate-linked structured notes,and deposit notes with long-dated maturities and significantunobservable spreads.
Consolidated Financial Statements Royal Bank of Canada: Annual Report 2010 93
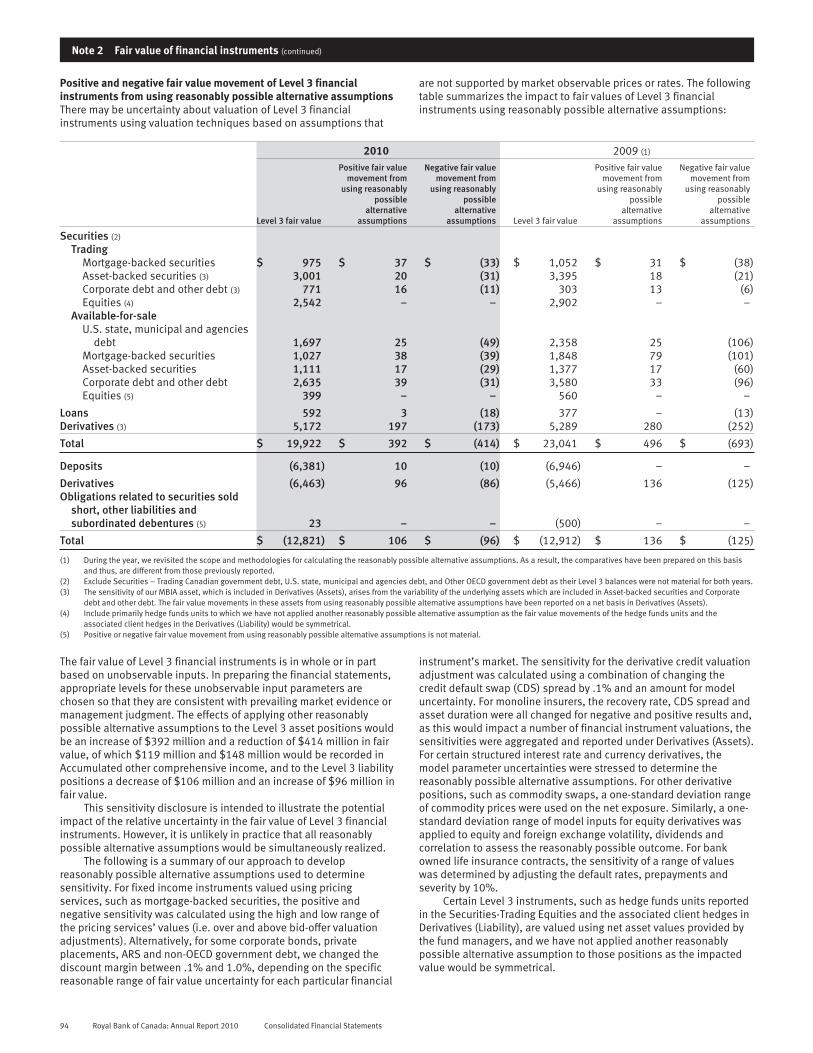
Note 2 Fair value of financial instruments (continued)
Positive and negative fair value movement of Level 3 financialinstruments from using reasonably possible alternative assumptionsThere may be uncertainty about valuation of Level 3 financialinstruments using valuation techniques based on assumptions that
are not supported by market observable prices or rates. The followingtable summarizes the impact to fair values of Level 3 financialinstruments using reasonably possible alternative assumptions:
2010 2009 (1)
Level 3 fair value
Positive fair valuemovement from
using reasonablypossible
alternativeassumptions
Negative fair valuemovement from
using reasonablypossible
alternativeassumptions Level 3 fair value
Positive fair valuemovement from
using reasonablypossible
alternativeassumptions
Negative fair valuemovement from
using reasonablypossible
alternativeassumptions
Securities (2)
TradingMortgage-backed securities $ 975 $ 37 $ (33) $ 1,052 $ 31 $ (38)Asset-backed securities (3) 3,001 20 (31) 3,395 18 (21)Corporate debt and other debt (3) 771 16 (11) 303 13 (6)Equities (4) 2,542 – – 2,902 – –
Available-for-saleU.S. state, municipal and agencies
debt 1,697 25 (49) 2,358 25 (106)Mortgage-backed securities 1,027 38 (39) 1,848 79 (101)Asset-backed securities 1,111 17 (29) 1,377 17 (60)Corporate debt and other debt 2,635 39 (31) 3,580 33 (96)Equities (5) 399 – – 560 – –
Loans 592 3 (18) 377 – (13)Derivatives (3) 5,172 197 (173) 5,289 280 (252)
Total $ 19,922 $ 392 $ (414) $ 23,041 $ 496 $ (693)
Deposits (6,381) 10 (10) (6,946) – –
Derivatives (6,463) 96 (86) (5,466) 136 (125)Obligations related to securities sold
short, other liabilities andsubordinated debentures (5) 23 – – (500) – –
Total $ (12,821) $ 106 $ (96) $ (12,912) $ 136 $ (125)
(1) During the year, we revisited the scope and methodologies for calculating the reasonably possible alternative assumptions. As a result, the comparatives have been prepared on this basisand thus, are different from those previously reported.
(2) Exclude Securities – Trading Canadian government debt, U.S. state, municipal and agencies debt, and Other OECD government debt as their Level 3 balances were not material for both years.(3) The sensitivity of our MBIA asset, which is included in Derivatives (Assets), arises from the variability of the underlying assets which are included in Asset-backed securities and Corporate
debt and other debt. The fair value movements in these assets from using reasonably possible alternative assumptions have been reported on a net basis in Derivatives (Assets).(4) Include primarily hedge funds units to which we have not applied another reasonably possible alternative assumption as the fair value movements of the hedge funds units and the
associated client hedges in the Derivatives (Liability) would be symmetrical.(5) Positive or negative fair value movement from using reasonably possible alternative assumptions is not material.
The fair value of Level 3 financial instruments is in whole or in partbased on unobservable inputs. In preparing the financial statements,appropriate levels for these unobservable input parameters arechosen so that they are consistent with prevailing market evidence ormanagement judgment. The effects of applying other reasonablypossible alternative assumptions to the Level 3 asset positions wouldbe an increase of $392 million and a reduction of $414 million in fairvalue, of which $119 million and $148 million would be recorded inAccumulated other comprehensive income, and to the Level 3 liabilitypositions a decrease of $106 million and an increase of $96 million infair value.
This sensitivity disclosure is intended to illustrate the potentialimpact of the relative uncertainty in the fair value of Level 3 financialinstruments. However, it is unlikely in practice that all reasonablypossible alternative assumptions would be simultaneously realized.
The following is a summary of our approach to developreasonably possible alternative assumptions used to determinesensitivity. For fixed income instruments valued using pricingservices, such as mortgage-backed securities, the positive andnegative sensitivity was calculated using the high and low range ofthe pricing services’ values (i.e. over and above bid-offer valuationadjustments). Alternatively, for some corporate bonds, privateplacements, ARS and non-OECD government debt, we changed thediscount margin between .1% and 1.0%, depending on the specificreasonable range of fair value uncertainty for each particular financial
instrument’s market. The sensitivity for the derivative credit valuationadjustment was calculated using a combination of changing thecredit default swap (CDS) spread by .1% and an amount for modeluncertainty. For monoline insurers, the recovery rate, CDS spread andasset duration were all changed for negative and positive results and,as this would impact a number of financial instrument valuations, thesensitivities were aggregated and reported under Derivatives (Assets).For certain structured interest rate and currency derivatives, themodel parameter uncertainties were stressed to determine thereasonably possible alternative assumptions. For other derivativepositions, such as commodity swaps, a one-standard deviation rangeof commodity prices were used on the net exposure. Similarly, a one-standard deviation range of model inputs for equity derivatives wasapplied to equity and foreign exchange volatility, dividends andcorrelation to assess the reasonably possible outcome. For bankowned life insurance contracts, the sensitivity of a range of valueswas determined by adjusting the default rates, prepayments andseverity by 10%.
Certain Level 3 instruments, such as hedge funds units reportedin the Securities-Trading Equities and the associated client hedges inDerivatives (Liability), are valued using net asset values provided bythe fund managers, and we have not applied another reasonablypossible alternative assumption to those positions as the impactedvalue would be symmetrical.
94 Royal Bank of Canada: Annual Report 2010 Consolidated Financial Statements

Note 3 Securities
The following table presents the financial instruments we held at the end of the period, measured at carrying value:
Term to maturity (1)
Within 3months
3 monthsto 1 year
1 to 5years
Over 5 yearsto 10 years
Over10 years
With nospecific
maturity2010Total
2009Total
2008Total
Trading accountCanadian government debt $ 2,065 $ 5,346 $ 19,296 $ 5,195 $ 4,697 $ – $ 36,599 $ 30,401 $ 20,911U.S. government debt 948 1,193 3,876 2,539 5,122 – 13,678 13,298 8,728Other OECD government debt (2) 1,055 2,802 4,390 2,271 1,638 – 12,156 8,033 2,488Mortgage-backed securities (3) 7 20 337 205 617 – 1,186 1,310 2,476Asset-backed securities (3) 50 203 1,836 565 421 – 3,075 2,994 4,551Corporate debt and other debt (3)
Bankers’ acceptances 508 249 – – – – 757 428 13Certificates of deposit 1,645 1,906 500 15 43 – 4,109 1,866 2,174Other (4), (5) 2,569 5,098 19,860 5,139 6,717 82 39,465 44,398 39,063
Equities – – – – – 38,530 38,530 37,334 42,104
8,847 16,817 50,095 15,929 19,255 38,612 149,555 140,062 122,508
Available-for-sale securities (6)
Canadian government debtFederal
Amortized cost 145 4,331 9,231 534 64 – 14,305 11,764 13,123Fair value 145 4,374 9,562 540 64 – 14,685 12,161 13,544Yield (7) .8% 4.4% 2.5% 3.1% 3.9% – 3.1% 3.3% 3.6%
Provincial and municipalAmortized cost 22 144 1,148 32 147 – 1,493 1,104 674Fair value 22 144 1,179 34 157 – 1,536 1,134 678Yield (7) 1.6% 2.3% 3.7% 5.0% 4.3% – 3.6% 3.7% 4.8%
U.S. state, municipal and agencies debtAmortized cost 596 1,011 354 15 2,958 – 4,934 5,781 9,230Fair value 596 1,013 357 15 2,962 – 4,943 5,793 8,890Yield (7) .7% 1.0% 1.7% 5.0% 1.0% – 1.0% 2.4% 3.8%
Other OECD government debt (2)
Amortized cost 1,418 1,152 2,311 183 – – 5,064 3,513 1,267Fair value 1,418 1,152 2,326 184 – – 5,080 3,530 1,270Yield (7) .1% .6% 4.3% 3.9% – – 2.3% 1.6% 1.5%
Mortgage-backed securities (4)
Amortized cost 3 2 79 75 920 – 1,079 2,057 4,278Fair value 3 3 82 78 861 – 1,027 1,852 3,548Yield (7) 6.6% 5.1% 4.5% 4.7% 3.4% – 3.6% 4.6% 5.6%
Asset-backed securitiesAmortized cost 5 331 416 1,162 1,685 – 3,599 4,516 5,192Fair value 5 336 424 1,156 1,578 – 3,499 4,427 4,796Yield (7) 3.7% 4.6% 2.4% .7% 3.5% – 2.5% 1.9% 4.5%
Corporate debt and other debt (4)
Amortized cost 2,325 2,255 3,573 655 1,908 48 10,764 14,566 13,102Fair value 2,328 2,267 3,730 624 1,782 58 10,789 14,559 12,785Yield (7) 4.1% 2.2% 2.5% 5.7% 2.6% .1% 3.0% 2.5% 5.5%
Equities (8)
Cost – – – – – 1,719 1,719 2,437 3,057Fair value – – – – – 1,764 1,764 2,412 2,683
Loan substituteCost – – – – – 256 256 256 256Fair value – – – – – 228 228 186 227Yield (7) – – – – – 3.7% 3.7% 3.7% 5.6%
Amortized cost 4,514 9,226 17,112 2,656 7,682 2,023 42,213 45,994 50,179Fair value 4,517 9,289 17,660 2,631 7,404 2,050 43,551 46,054 48,421
Held-to-maturity securities (6)
Amortized cost 122 40 34 28 1 – 225 156 205Fair value 122 40 34 28 1 – 225 156 205
Total carrying value of securities (6) $ 13,486 $ 26,146 $ 67,789 $ 18,588 $ 26,660 $ 40,662 $ 193,331 $ 186,272 $ 171,134
(1) Actual maturities may differ from contractual maturities shown above since borrowers may have the right to prepay obligations with or without prepayment penalties.(2) OECD stands for Organisation for Economic Co-operation and Development.(3) Includes CDOs which are presented as Asset-backed securities – CDOs in the table entitled “Fair value of assets and liabilities classified using the fair value hierarchy” in Note 2.(4) 2008 balances include certain held-for-trading and available-for-sale securities that were subsequently reclassified to loans on November 1, 2008 in accordance with the CICA’s amendments
to Section 3855.(5) Primarily comprise corporate debt and floating rate notes, supra-national debt and floating rate notes, and commercial paper.(6) Available-for-sale securities, including loan substitutes, are carried at fair value and held-to-maturity securities are carried at amortized cost.(7) The weighted average yield is derived using the contractual interest rate and the carrying value at the end of the year for the respective securities.(8) Includes the value of the shares received in 2008 upon the Visa Inc. restructuring which are carried at cost.
Consolidated Financial Statements Royal Bank of Canada: Annual Report 2010 95

Note 3 Securities (continued)
Reclassification of financial instrumentsThe following table provides information regarding certain securities that we reclassified from held-for-trading to available-for-sale effectiveAugust 1, 2008, in accordance with amendments to Sections 3855, 3861 and 3862. Refer to Note 3 to our 2009 Annual Consolidated FinancialStatements for details.
As at and for the year ended October 31, 2010 As at and for the year ended October 31, 2009
Financial assets
Totalcarrying
value andfair value
Change infair value
during theyear (1)
Interestincome/gains
(losses)recognized
in net incomeduring the
year (2)
Totalcarrying
value andfair value
Change infair value
during theyear (1)
Interestincome/gains
(losses)recognized
in net incomeduring the
year (2)
U.S. state, municipal and agency debt $ 1,126 $ 64 $ (5) $ 1,904 $ 13 $ 54Mortgage-backed securities (MBS) 69 47 13 500 67 28Asset-backed securities 748 (16) 1 1,007 48 29Corporate debt and other debt 408 32 5 641 (2) 17
$ 2,351 $ 127 $ 14 $ 4,052 $ 126 $ 128
(1) This amount represents the change in fair value of securities we held at the end of the period and includes any principal draw downs or redemptions on these securities.(2) The total amount includes net gain of $4 million related to securities and debt redeemed or sold during the year ended October 31, 2010 (2009 – net gain of $27 million).
Unrealized gains and losses on available-for-sale securities (1), (2)
2010 2009
Amortizedcost
Grossunrealized
gains
Grossunrealized
lossesFair
valueAmortized
cost
Grossunrealized
gains
Grossunrealized
lossesFair
value
Canadian government debtFederal $ 14,305 $ 381 $ (1) $ 14,685 $ 11,764 $ 404 $ (7) $ 12,161Provincial and municipal 1,493 43 – 1,536 1,104 31 (1) 1,134
U.S. federal, state, municipal and agency debt 4,934 65 (56) 4,943 5,781 129 (117) 5,793Other OECD government debt 5,068 24 (8) 5,084 3,517 18 (1) 3,534Mortgage-backed securities 1,079 20 (72) 1,027 2,057 24 (229) 1,852Asset-backed securities
CDOs 220 12 (17) 215 234 11 (24) 222Non-CDO securities 3,379 37 (132) 3,284 4,282 67 (143) 4,205
Corporate debt and other debt 10,985 273 (248) 11,010 14,718 382 (389) 14,711Equities 1,719 58 (13) 1,764 2,437 45 (70) 2,412Loan substitute securities 256 – (28) 228 256 – (70) 186
$ 43,438 $ 913 $ (575) $ 43,776 $ 46,150 $ 1,111 $ (1,051) $ 46,210
(1) Includes $225 million (2009 – $156 million) held-to-maturity securities.(2) The majority of the MBS are residential. Amortized cost, gross unrealized gains, gross unrealized losses and fair value related to commercial MBS are $148 million, $4 million, $nil and $152
million, respectively for 2010 (2009 – $224 million, $1million, $(11) million and $213 million).
Realized gains and losses on available-for-sale securities (1), (2)
2010 2009 2008
Realized gains $ 440 $ 296 $ 99Realized losses and writedowns (399) (936) (731)
Net gains (losses) on available-for-sale securities $ 41 $ (640) $ (632)
(1) Available-for-sale securities, including loan substitutes, are carried at fair value and held-to-maturity securities are carried at amortized cost.(2) The following related to our insurance operations are included in the Insurance premiums, investment and fee income line on the Consolidated Statements of Income: Realized gains –
2010 – $12 million, 2009 – $12 million, and 2008 – $1 million; Realized losses and writedowns – 2010 – $5 million, 2009 – $22 million, and 2008 – $16 million.
96 Royal Bank of Canada: Annual Report 2010 Consolidated Financial Statements
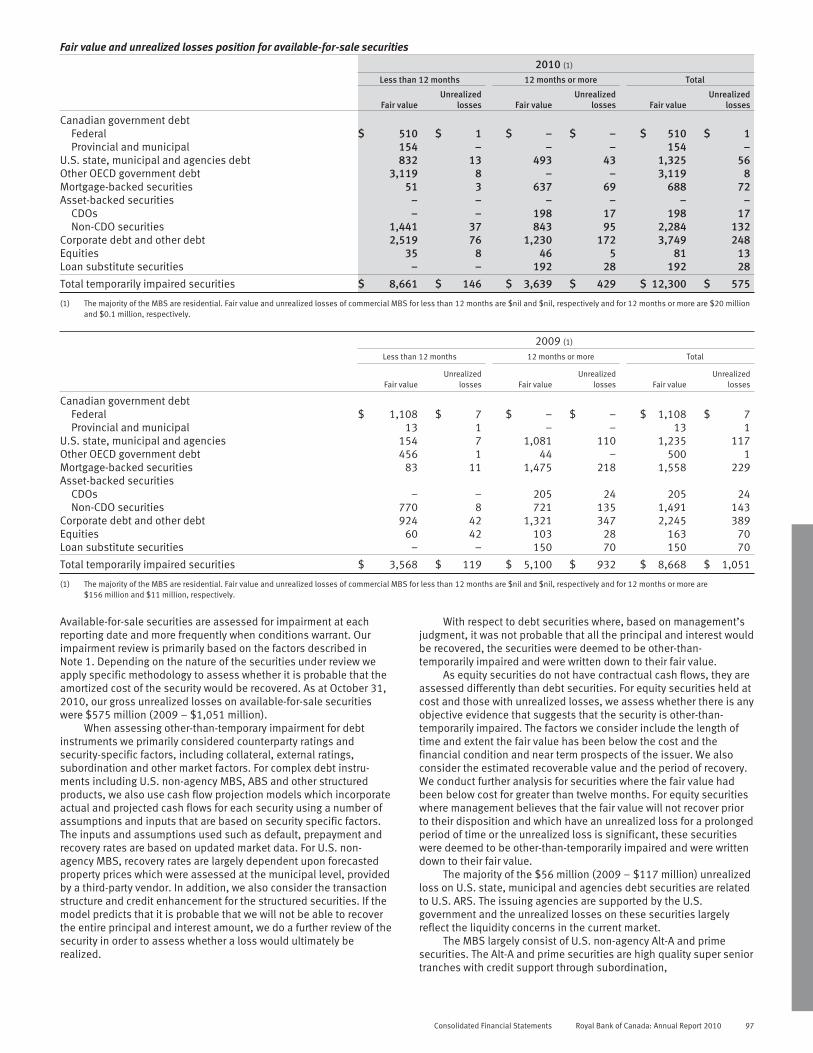
Fair value and unrealized losses position for available-for-sale securities
2010 (1)
Less than 12 months 12 months or more Total
Fair valueUnrealized
losses Fair valueUnrealized
losses Fair valueUnrealized
losses
Canadian government debtFederal $ 510 $ 1 $ – $ – $ 510 $ 1Provincial and municipal 154 – – – 154 –
U.S. state, municipal and agencies debt 832 13 493 43 1,325 56Other OECD government debt 3,119 8 – – 3,119 8Mortgage-backed securities 51 3 637 69 688 72Asset-backed securities – – – – – –
CDOs – – 198 17 198 17Non-CDO securities 1,441 37 843 95 2,284 132
Corporate debt and other debt 2,519 76 1,230 172 3,749 248Equities 35 8 46 5 81 13Loan substitute securities – – 192 28 192 28
Total temporarily impaired securities $ 8,661 $ 146 $ 3,639 $ 429 $ 12,300 $ 575
(1) The majority of the MBS are residential. Fair value and unrealized losses of commercial MBS for less than 12 months are $nil and $nil, respectively and for 12 months or more are $20 millionand $0.1 million, respectively.
2009 (1)
Less than 12 months 12 months or more Total
Fair valueUnrealized
losses Fair valueUnrealized
losses Fair valueUnrealized
losses
Canadian government debtFederal $ 1,108 $ 7 $ – $ – $ 1,108 $ 7Provincial and municipal 13 1 – – 13 1
U.S. state, municipal and agencies 154 7 1,081 110 1,235 117Other OECD government debt 456 1 44 – 500 1Mortgage-backed securities 83 11 1,475 218 1,558 229Asset-backed securities
CDOs – – 205 24 205 24Non-CDO securities 770 8 721 135 1,491 143
Corporate debt and other debt 924 42 1,321 347 2,245 389Equities 60 42 103 28 163 70Loan substitute securities – – 150 70 150 70
Total temporarily impaired securities $ 3,568 $ 119 $ 5,100 $ 932 $ 8,668 $ 1,051
(1) The majority of the MBS are residential. Fair value and unrealized losses of commercial MBS for less than 12 months are $nil and $nil, respectively and for 12 months or more are$156 million and $11 million, respectively.
Available-for-sale securities are assessed for impairment at eachreporting date and more frequently when conditions warrant. Ourimpairment review is primarily based on the factors described inNote 1. Depending on the nature of the securities under review weapply specific methodology to assess whether it is probable that theamortized cost of the security would be recovered. As at October 31,2010, our gross unrealized losses on available-for-sale securitieswere $575 million (2009 – $1,051 million).
When assessing other-than-temporary impairment for debtinstruments we primarily considered counterparty ratings andsecurity-specific factors, including collateral, external ratings,subordination and other market factors. For complex debt instru-ments including U.S. non-agency MBS, ABS and other structuredproducts, we also use cash flow projection models which incorporateactual and projected cash flows for each security using a number ofassumptions and inputs that are based on security specific factors.The inputs and assumptions used such as default, prepayment andrecovery rates are based on updated market data. For U.S. non-agency MBS, recovery rates are largely dependent upon forecastedproperty prices which were assessed at the municipal level, providedby a third-party vendor. In addition, we also consider the transactionstructure and credit enhancement for the structured securities. If themodel predicts that it is probable that we will not be able to recoverthe entire principal and interest amount, we do a further review of thesecurity in order to assess whether a loss would ultimately berealized.
With respect to debt securities where, based on management’sjudgment, it was not probable that all the principal and interest wouldbe recovered, the securities were deemed to be other-than-temporarily impaired and were written down to their fair value.
As equity securities do not have contractual cash flows, they areassessed differently than debt securities. For equity securities held atcost and those with unrealized losses, we assess whether there is anyobjective evidence that suggests that the security is other-than-temporarily impaired. The factors we consider include the length oftime and extent the fair value has been below the cost and thefinancial condition and near term prospects of the issuer. We alsoconsider the estimated recoverable value and the period of recovery.We conduct further analysis for securities where the fair value hadbeen below cost for greater than twelve months. For equity securitieswhere management believes that the fair value will not recover priorto their disposition and which have an unrealized loss for a prolongedperiod of time or the unrealized loss is significant, these securitieswere deemed to be other-than-temporarily impaired and were writtendown to their fair value.
The majority of the $56 million (2009 – $117 million) unrealizedloss on U.S. state, municipal and agencies debt securities are relatedto U.S. ARS. The issuing agencies are supported by the U.S.government and the unrealized losses on these securities largelyreflect the liquidity concerns in the current market.
The MBS largely consist of U.S. non-agency Alt-A and primesecurities. The Alt-A and prime securities are high quality super seniortranches with credit support through subordination,
Consolidated Financial Statements Royal Bank of Canada: Annual Report 2010 97

Note 3 Securities (continued)
overcollateralization, and excess spread. The unrealized losses of$72 million (2009 – $229 million) are primarily on Alt-A and primesecurities reflecting the impact of the current credit spreads. Thelosses on U.S. non-agency MBS are significantly lower compared tothe prior year as we exited certain positions in order to effectivelymanage our exposure
ABS mainly comprise U.S. insured and uninsured student loansU.S. ARS, CDOs and securities backed by credit card receivables. Themajority of these instruments are highly rated with significant creditsupport and have experienced significant price improvements overthe year. There are unrealized losses of $149 million (2009 – $167million) which primarily relate to U.S. ARS and uninsured studentloans.
Corporate and other debt mainly includes certificate of deposits,corporate debt and bonds, Non-Organization for Economic Co-operationand Development (OECD) government securities, tender option bondsand hybrid instruments. The Non-OECD government securities primarilyrelate to Caribbean countries where we have ongoing operations. Theunrealized losses of $248 million (2009 – $389 million) are significantlylower compared to a year ago and mainly reflect the decreasing interestrate environment along with improved credit spreads.
Equity holdings largely comprise publicly traded common andpreferred shares. To a lesser extent, we also hold investments inprivate and venture companies. As at October 31, 2010, there wereunrealized losses of $13 million, compared to unrealized losses of$70 million a year ago due to the impairment losses recognized in2010 in net income on certain common shares as well as fair valueimprovements on equities mainly for listed common and preferredshares. The loan substitute securities are predominantly perpetualpreferred shares of highly rated Canadian entities.
Management believes that the unrealized losses on the above-mentioned securities as at October 31, 2010, are temporary in natureand intends to hold them until recovery of their fair value which maybe on maturity of the debt securities.
Held-to-maturity securitiesHeld-to-maturity securities stated at amortized costs are subject toperiodic impairment review and are classified as impaired when, inmanagement’s opinion, there is no longer reasonable assurance ofthe timely collection of the full amount of principal and interest. The
impairment review of held-to-maturity securities is primarily based onthe impairment model for loans as described in Note 1 to the financialstatements. Management is of the view that there is no impairmenton held-to-maturity investments as at October 31, 2010.
Net gains/losses on Available-for-sale securitiesWhen we determine that a security is other-than-temporarilyimpaired, the amortized cost of the security is written down to its fairvalue and the previous loss in AOCI is reclassified to net income.During 2010, $41 million of net gains were recognized in net income(2009 – net losses of $640 million) on available-for sale securities.The net gains in the current year largely reflected net gains of$309 million on the sale of certain U.S. agency MBS classified asgovernment and agency and listed common shares as well as gainsfrom capital distributions from private equities. These gains weremainly offset by net losses of $268 million primarily on securities thatwere deemed to be impaired such as corporate trust preferreds whichare included in corporate debt and other debt, certain listed commonshares and private equities and U.S. non-agency MBS. Included inthis amount is $3 million of write-down for our available-for-salesecurities relating to our insurance operations which has beenreflected in the Insurance premiums, investment and fee income lineon our Consolidated Statements of Income (2009 – $21 million).
Interest and dividends on available-for-sale and held-to-maturitysecurities (1), (2)
2010 2009 2008
Taxable interest income $ 1,602 $ 2,362 $ 2,089Non-taxable interest income 97 110 99Dividends 35 82 110
$ 1,734 $ 2,554 $ 2,298
(1) Available-for-sale securities are carried at fair value and held-to-maturity securities arecarried at amortized cost.
(2) The following related to our insurance operations are included in the Insurancepremiums, investment and fee income line on the Consolidated Statements of Income:Taxable interest income – 2010 – $640 million, 2009 – $601 million, and 2008 –$452 million; Non-taxable interest income – 2010 – $39 million, 2009 – $33 million
and 2008 – $29 million; Dividends – 2010 – $14 million, 2009 – $15 million, and2008 – $17 million.
Note 4 Loans
2010 2009
CanadaUnitedStates
OtherInternational Total Canada
UnitedStates
OtherInternational Total
Retail (1)
Residential mortgages $ 124,064 $ 2,350 $ 2,418 $ 128,832 $ 117,292 $ 2,490 $ 2,348 $ 122,130Personal 69,291 8,551 2,332 80,174 60,493 8,975 2,074 71,542Credit cards 9,704 220 186 10,110 8,285 213 203 8,701Small business (2) 2,712 – – 2,712 2,851 – – 2,851
205,771 11,121 4,936 221,828 188,921 11,678 4,625 205,224
Wholesale (1)
Business (3), (4) 39,015 20,616 9,216 68,847 38,624 25,206 10,336 74,166Bank (5) 808 233 875 1,916 1,096 177 1,243 2,516Sovereign (6) 1,632 – 980 2,612 860 – 1,385 2,245
41,455 20,849 11,071 73,375 40,580 25,383 12,964 78,927
Total loans (7) 247,226 31,970 16,007 295,203 229,501 37,061 17,589 284,151Allowance for loan losses (1,490) (1,144) (363) (2,997) (1,474) (1,460) (254) (3,188)
Total loans net of allowance forloan losses $ 245,736 $ 30,826 $ 15,644 $ 292,206 $ 228,027 $ 35,601 $ 17,335 $ 280,963
(1) Geographic information is based on residence of borrower.(2) Includes small business exposure managed on a pooled basis.(3) Includes small business exposure managed on an individual client basis.(4) Included under Canada and U.S. for 2010 are loans totalling $nil (2009 – $1.0 billion) and $1.5 billion (2009 – $1.7 billion), respectively, to VIEs administered by us.(5) Bank refers primarily to regulated deposit-taking institutions and securities firms.(6) Sovereign refers to all central governments and agencies, central banks, as well as other qualifying public sector entities and multilateral development banks.(7) Loans are net of unearned income of $306 million (2009 – $229 million).
98 Royal Bank of Canada: Annual Report 2010 Consolidated Financial Statements

The principal collateral and other credit enhancements we hold assecurity for retail loans include: (i) mortgage insurance, mortgagesover residential real estate and properties, and (ii) recourse to thepersonal assets being financed such as automobiles, as well aspersonal guarantees, term deposits and securities. For wholesale
loans they include: (i) recourse to business assets such as realestate, equipment, inventory, accounts receivable, intangible assetsand securities, and (ii) recourse to the commercial real estateproperties being financed.
Loan maturities and rate sensitivity2010
Maturity term (1) Rate sensitivity
Under1 year (2), (3)
1 to 5years
Over 5years Total Floating
FixedRate
Non-rate-sensitive Total
Retail $ 95,579 $ 103,183 $ 23,066 $ 221,828 $ 112,263 $ 106,781 $ 2,784 $ 221,828Wholesale 39,351 20,818 13,206 73,375 40,101 32,778 496 73,375
Total loans $ 134,930 $ 124,001 $ 36,272 $ 295,203 $ 152,364 $ 139,559 $ 3,280 $ 295,203Allowance for loan losses – – – (2,997) – – – (2,997)
Total loans net of allowance for loan losses $ 134,930 $ 124,001 $ 36,272 $ 292,206 $ 152,364 $ 139,559 $ 3,280 $ 292,206
2009Maturity term (1) Rate sensitivity
Under1 year (2), (3)
1 to 5years
Over 5years Total Floating
FixedRate
Non-rate-sensitive Total
Retail $ 99,558 $ 87,956 $ 17,710 $ 205,224 $ 106,627 $ 96,175 $ 2,422 $ 205,224Wholesale 45,922 23,148 9,857 78,927 47,756 30,497 674 78,927
Total loans $ 145,480 $ 111,104 $ 27,567 $ 284,151 $ 154,383 $ 126,672 $ 3,096 $ 284,151Allowance for loan losses – – – (3,188) – – – (3,188)
Total loans net of allowance for loan losses $ 145,480 $ 111,104 $ 27,567 $ 280,963 $ 154,383 $ 126,672 $ 3,096 $ 280,963
(1) Generally, based on the earlier of contractual repricing or maturity date.(2) Included in Wholesale are loans totalling $1.5 billion (2009 – $2.7 billion) to variable interest entities administered by us. All of the loans reprice monthly or quarterly.(3) Includes variable rate loans that can be repriced at the clients’ discretion without penalty.
During the year ended October 31, 2010, we acquired $336 million of assets in respect of problem loans (2009 – $1,658 million). The relatedreduction in the Allowance for credit losses was $331 million (2009 – $156 million).
Allowance for loan losses and impaired loans2010 2009
Balance atbeginning
of yearWrite-
offs Recoveries
Provisionfor credit
lossesOther
adjustments (1)
Balanceat end
of year
Balanceat endof year
RetailResidential mortgages $ 54 $ (46) $ 2 $ 60 $ 7 $ 77 $ 54Personal 197 (690) 91 595 (11) 182 197Credit cards – (477) 64 413 – – –Small business (2) 22 (56) 7 45 – 18 22
$ 273 $(1,269) $ 164 $ 1,113 $ (4) $ 277 $ 273
WholesaleBusiness (3) $ 976 $ (949) $ 72 $ 707 $ (15) $ 791 $ 976Bank (4) 20 – – 15 (1) 34 20Sovereign (5) 10 – – – (1) 9 10
$ 1,006 $ (949) $ 72 $ 722 $ (17) $ 834 $1,006
Specific allowances $ 1,279 $(2,218) $ 236 $ 1,835 $ (21) $1,111 $1,279
RetailResidential mortgages $ 50 $ – $ – $ 30 $ (3) $ 77 $ 50Personal 671 – – 49 (11) 709 671Credit cards 327 – – 7 50 384 327Small business (2) 47 – – – 13 60 47
$ 1,095 $ – $ – $ 86 $ 49 $1,230 $1,095
WholesaleBusiness (3) $ 814 $ – $ – $ (58) $ (100) $ 656 $ 814Bank (4) – – – – – – –Sovereign (5) – – – – – – –
$ 814 $ – $ – $ (58) $ (100) $ 656 $ 814
Allowance for off-balance sheet and other items (6) $ 114 $ – $ – $ (2) $ (13) $ 99 $ 114
General allowance (6) $ 2,023 $ – $ – $ 26 $ (64) $1,985 $2,023
Total allowance for credit losses $ 3,302 $(2,218) $ 236 $ 1,861 $ (85) $3,096 $3,302Allowance for off-balance sheet and other items (7) (114) – – 2 13 (99) (114)
Total allowance for loan losses $ 3,188 $(2,218) $ 236 $ 1,863 $ (72) $2,997 $3,188
(1) Primarily represents; (i) the translation impact of foreign currency-denominated allowance for loan losses and (ii) a reclassification of $30 million of the general allowance to specificallowance to more appropriately reflect the nature of these provisions.
(2) Includes small business exposure managed on a pooled basis.(3) Includes small business exposure managed on an individual client basis. Includes $2 million (2009 – $2 million) of provisions related to loans extended under liquidity facilities drawn on by
RBC-administered multi-seller asset-backed commercial paper conduit programs.(4) Bank refers primarily to regulated deposit-taking institutions and securities firms.(5) Sovereign refers to all central governments and agencies, central banks, as well as other qualifying public sector entities and multilateral development banks.(6) Includes $99 million related to off-balance sheet and other items (2009 – $114 million).(7) The allowance for off-balance sheet is reported separately under Other liabilities.
Consolidated Financial Statements Royal Bank of Canada: Annual Report 2010 99

Note 4 Loans (continued)
Net interest income after provision for credit losses2010 2009 2008
Net interest income $ 10,977 $ 11,541 $ 9,054Provision for credit losses 1,861 3,413 1,595
Net interest income afterprovision for credit losses $ 9,116 $ 8,128 $ 7,459
A loan is considered past due when a counterparty has not made apayment by the contractual due date. The following table presents thecarrying value of loans that are past due but not classified asimpaired because they are either (i) less than 90 days past due, or(ii) fully secured and collection efforts are reasonably expected toresult in repayment. Credit card balances are written off when apayment is 180 days in arrears.
Loans past due but not impaired2010 2009
1-29 days 30-89 days90 days
and greater Total 1-29 days 30-89 days90 days
and greater Total
Retail $ 2,641 $ 1,239 $ 184 $ 4,064 $ 2,841 $ 1,359 $ 323 $ 4,523Wholesale 1,206 496 18 1,720 1,313 563 36 1,912
Total $ 3,847 $ 1,735 $ 202 $ 5,784 $ 4,154 $ 1,922 $ 359 $ 6,435
Impaired loans (1)
2010 2009
GrossSpecific
allowances Net Net
RetailResidential mortgages $ 808 $ (77) $ 731 $ 587Personal 383 (182) 201 212Small business (2) 49 (18) 31 37
$ 1,240 $ (277) $ 963 $ 836
WholesaleBusiness (3) $ 3,716 $ (791) $ 2,925 $ 3,300Sovereign (4) 9 (9) – –Bank (5) 34 (34) – 42
$ 3,759 $ (834) $ 2,925 $ 3,342Total $ 4,999 $ (1,111) $ 3,888 $ 4,178
(1) Average balance of gross impaired loans for the year was $5.1 billion (2009 – $4.6 billion).(2) Includes small business exposure managed on a pooled basis.(3) Includes small business exposure managed on an individual client basis. Includes gross and net impaired loans of $57 million (2009 – $65 million) and $55 million (2009 – $63 million),
respectively, related to loans extended under liquidity facilities drawn on by RBC-administered multi-seller asset-backed commercial paper conduit programs.(4) Sovereign refers to all central governments and agencies, central banks, as well as other qualifying public sector entities and multilateral development banks.(5) Bank refers primarily to regulated deposit-taking institutions and securities firms.
Note 5 Securitizations
Securitization activities by major product typeWe periodically securitize our credit card receivables, residentialmortgage loans and we participate in bond securitization primarily todiversify our funding sources, enhance our liquidity position and forcapital purposes. We also securitize residential and commercialmortgage loans for sales and trading activities.
Credit card receivablesWe securitize a portion of our credit card receivables through a SPE ona revolving basis. The SPE is financed through the issuance of seniorand subordinated notes collateralized by the underlying credit cardreceivables. The issuances are rated by at least two of Dominion BondRating Service (DBRS), Moody’s Investors Service (Moody’s) andStandard & Poor’s (S&P). This SPE meets the criteria for a QSPE and,accordingly, as the transferor of the credit card receivables, we areprecluded from consolidating it.
Our continuing involvement includes servicing the credit cardreceivables sold to the QSPE and performing an administrative rolefor the QSPE. We also provide first-loss protection to the QSPE in twoforms. First, we have an interest in the excess spread from the QSPEwhich is subordinate to the QSPE’s obligation to the holders of itsasset-backed securities. Excess spread is the residual net interestincome after all trust expenses have been paid. Our excess spreadserves to absorb losses with respect to the credit card receivablesbefore payments to the QSPE’s noteholders are affected. The presentvalue of this excess spread is reported as a retained interest within
our Available-for-sale (AFS) securities on our Consolidated BalanceSheets. In addition, we provide loans to the QSPE to pay upfrontexpenses. These loans rank subordinate to all notes issued by theQSPE.
We own all of the subordinated securities issued by the QSPEand report them within our AFS securities in our Consolidated BalanceSheets. We may own some senior securities as investments or formarket-making activities and retain a cash reserve account from timeto time. The subordinated securities and senior securities owned byus represent approximately 4.5% and 5.98% of the total securitiesissued by the QSPE as at October 31, 2010, respectively. Thesubordinated securities provide credit support for the seniorsecurities. We also act as counterparty in interest rate and crosscurrency swap agreements under which we pay the QSPE the interestdue to investors.
Canadian residential mortgage loansWe securitize insured Canadian residential mortgage loans throughthe creation of MBS pools under the NHA MBS program and sell themto third party investors, or pre-dominantly to a government sponsoredtrust under the Canada Mortgage Bond (CMB) program. The trustperiodically issues CMB, which are guaranteed by the government,and sells them to third-party investors. Proceeds of the CMBissuances are used by the trust to purchase the MBS pools fromeligible MBS issuers who participate in the issuance of a particularCMB series.
100 Royal Bank of Canada: Annual Report 2010 Consolidated Financial Statements
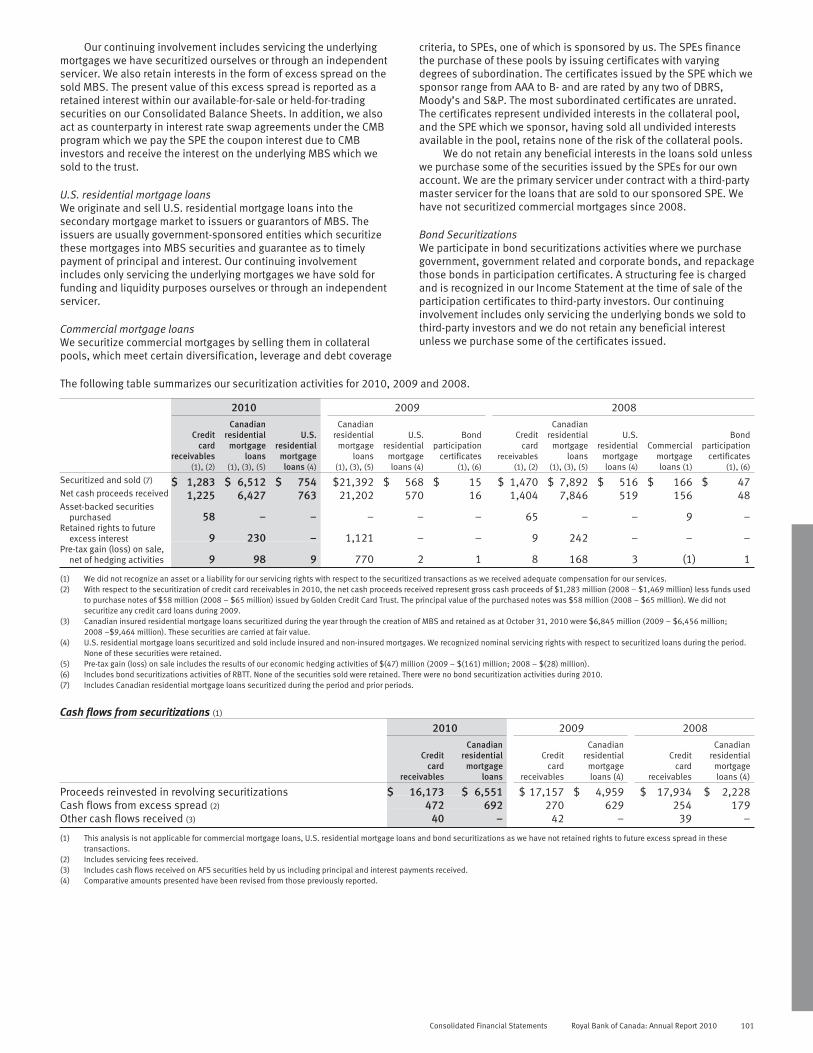
Our continuing involvement includes servicing the underlyingmortgages we have securitized ourselves or through an independentservicer. We also retain interests in the form of excess spread on thesold MBS. The present value of this excess spread is reported as aretained interest within our available-for-sale or held-for-tradingsecurities on our Consolidated Balance Sheets. In addition, we alsoact as counterparty in interest rate swap agreements under the CMBprogram which we pay the SPE the coupon interest due to CMBinvestors and receive the interest on the underlying MBS which wesold to the trust.
U.S. residential mortgage loansWe originate and sell U.S. residential mortgage loans into thesecondary mortgage market to issuers or guarantors of MBS. Theissuers are usually government-sponsored entities which securitizethese mortgages into MBS securities and guarantee as to timelypayment of principal and interest. Our continuing involvementincludes only servicing the underlying mortgages we have sold forfunding and liquidity purposes ourselves or through an independentservicer.
Commercial mortgage loansWe securitize commercial mortgages by selling them in collateralpools, which meet certain diversification, leverage and debt coverage
criteria, to SPEs, one of which is sponsored by us. The SPEs financethe purchase of these pools by issuing certificates with varyingdegrees of subordination. The certificates issued by the SPE which wesponsor range from AAA to B- and are rated by any two of DBRS,Moody’s and S&P. The most subordinated certificates are unrated.The certificates represent undivided interests in the collateral pool,and the SPE which we sponsor, having sold all undivided interestsavailable in the pool, retains none of the risk of the collateral pools.
We do not retain any beneficial interests in the loans sold unlesswe purchase some of the securities issued by the SPEs for our ownaccount. We are the primary servicer under contract with a third-partymaster servicer for the loans that are sold to our sponsored SPE. Wehave not securitized commercial mortgages since 2008.
Bond SecuritizationsWe participate in bond securitizations activities where we purchasegovernment, government related and corporate bonds, and repackagethose bonds in participation certificates. A structuring fee is chargedand is recognized in our Income Statement at the time of sale of theparticipation certificates to third-party investors. Our continuinginvolvement includes only servicing the underlying bonds we sold tothird-party investors and we do not retain any beneficial interestunless we purchase some of the certificates issued.
The following table summarizes our securitization activities for 2010, 2009 and 2008.
2010 2009 2008
Creditcard
receivables(1), (2)
Canadianresidential
mortgageloans
(1), (3), (5)
U.S.residential
mortgageloans (4)
Canadianresidential
mortgageloans
(1), (3), (5)
U.S.residential
mortgageloans (4)
Bondparticipation
certificates(1), (6)
Creditcard
receivables(1), (2)
Canadianresidential
mortgageloans
(1), (3), (5)
U.S.residential
mortgageloans (4)
Commercialmortgageloans (1)
Bondparticipation
certificates(1), (6)
Securitized and sold (7) $ 1,283 $ 6,512 $ 754 $21,392 $ 568 $ 15 $ 1,470 $ 7,892 $ 516 $ 166 $ 47Net cash proceeds received 1,225 6,427 763 21,202 570 16 1,404 7,846 519 156 48Asset-backed securities
purchased 58 – – – – – 65 – – 9 –Retained rights to future
excess interest 9 230 – 1,121 – – 9 242 – – –Pre-tax gain (loss) on sale,
net of hedging activities 9 98 9 770 2 1 8 168 3 (1) 1
(1) We did not recognize an asset or a liability for our servicing rights with respect to the securitized transactions as we received adequate compensation for our services.(2) With respect to the securitization of credit card receivables in 2010, the net cash proceeds received represent gross cash proceeds of $1,283 million (2008 – $1,469 million) less funds used
to purchase notes of $58 million (2008 – $65 million) issued by Golden Credit Card Trust. The principal value of the purchased notes was $58 million (2008 – $65 million). We did notsecuritize any credit card loans during 2009.
(3) Canadian insured residential mortgage loans securitized during the year through the creation of MBS and retained as at October 31, 2010 were $6,845 million (2009 – $6,456 million;2008 –$9,464 million). These securities are carried at fair value.
(4) U.S. residential mortgage loans securitized and sold include insured and non-insured mortgages. We recognized nominal servicing rights with respect to securitized loans during the period.None of these securities were retained.
(5) Pre-tax gain (loss) on sale includes the results of our economic hedging activities of $(47) million (2009 – $(161) million; 2008 – $(28) million).(6) Includes bond securitizations activities of RBTT. None of the securities sold were retained. There were no bond securitization activities during 2010.(7) Includes Canadian residential mortgage loans securitized during the period and prior periods.
Cash flows from securitizations (1)
2010 2009 2008
Creditcard
receivables
Canadianresidential
mortgageloans
Creditcard
receivables
Canadianresidential
mortgageloans (4)
Creditcard
receivables
Canadianresidential
mortgageloans (4)
Proceeds reinvested in revolving securitizations $ 16,173 $ 6,551 $ 17,157 $ 4,959 $ 17,934 $ 2,228Cash flows from excess spread (2) 472 692 270 629 254 179Other cash flows received (3) 40 – 42 – 39 –
(1) This analysis is not applicable for commercial mortgage loans, U.S. residential mortgage loans and bond securitizations as we have not retained rights to future excess spread in thesetransactions.
(2) Includes servicing fees received.(3) Includes cash flows received on AFS securities held by us including principal and interest payments received.(4) Comparative amounts presented have been revised from those previously reported.
Consolidated Financial Statements Royal Bank of Canada: Annual Report 2010 101

Note 5 Securitizations (continued)
The key assumptions used to value the retained interests at the date of the securitization activities are as follows:
Key assumptions (1), (2)
2010 2009 (3) 2008Credit
cardreceivables
Canadianresidential
mortgage loans
Canadianresidential
mortgage loans
Creditcard
receivables
Canadianresidential
mortgage loans
Expected weighted average life of prepayable receivables (in years) .25 3.53 2.70 .25 4.05Payment rate 38.00% 19.28% 26.76% 37.02% 27.55%Excess spread, net of credit losses 4.66 1.30 2.34 3.86 1.05Discount rate 10.50% .40% – 3.19% .40 – 3.07% 10.00% 2.22 – 4.77%Expected credit losses 3.88 – – 2.49 –
(1) All rates are annualized except the payment rate for credit card receivables which is monthly.(2) This analysis is not applicable for commercial mortgage loans, U.S. residential mortgage loans and bond securitizations as we have not retained rights to future excess spread in these
transactions(3) We did not securitize any credit card receivables during the period.
Sensitivity of key assumptionsKey assumptions are used to determine the fair value of our retainedinterests. The following table is a summary of the key assumptions
used as at October 31, 2010 and the sensitivity of the current fairvalue of our retained interests to immediate 10% and 20% adversechanges in these key assumptions.
Increase (decrease) in fair value of retained interests due to adverse changes in key assumptions (1), (2)
2010 2009Credit
cardreceivables
Canadian residentialmortgage loans
Creditcard
receivables
Canadianresidential mortgage
loans
Fair value of retained interests $ 15.3 $ 1,090.1 $ 33.5 $ 1,240.6Weighted average remaining service life (in years) .25 2.57 – 4.49 .25 2.90 – 3.77Payment rate 38.81% 16.07 – 23.74% 38.33% 9.00 – 28.00%
Impact on fair value of 10% adverse change $ (1.0) $ (27.4) $ (2.0) $ (35.0)Impact on fair value of 20% adverse change (1.9) (53.9) (4.1) (68.9)
Excess spread, net of credit losses 3.10% .97% – 1.87% 5.61% .8 – 1.98%Impact on fair value of 10% adverse change $ (3.8) $ (123.8) $ (6.1) $ (137.8)Impact on fair value of 20% adverse change (7.6) (247.4) (12.2) (296.1)
Expected credit losses 3.05% –% 3.86% –%Impact on fair value of 10% adverse change $ (1.5) $ – $ (2.3) $ –Impact on fair value of 20% adverse change (3.1) – (4.6) –
Discount rate 10.00% 1.19% – 2.04% 10.50% .4 – 2.76%Impact on fair value of 10% adverse change $ – $ (2.1) $ – $ (1.8)Impact on fair value of 20% adverse change – (3.9) (.1) (4.2)
(1) All rates are annualized except for the credit card receivables payment rate which is monthly.(2) This analysis is not applicable for commercial mortgage loans, U.S. residential mortgage loans and bond securitizations as we have not retained rights to future excess spread in these
transactions.
These sensitivities are hypothetical and should be used with caution.Changes in fair value based on a variation in assumptions generallycannot be extrapolated because the relationship of the change inassumptions to the change in fair value may not be linear. The effectof a variation in a particular assumption on the fair value of theretained interests is calculated without changing any other assump-tions. Generally, the changes in one factor may result in changes inanother, which may magnify or counteract the sensitivity.
Static pool credit losses provide a measure of the credit risk inour securitized assets and are calculated by totalling actual incurredand projected credit losses and dividing the result by the originalbalance of the loans securitized. The expected static pool credit lossratio for securitized credit card receivables at October 31, 2010 was.77% (2009 –.87%). Static pool credit losses are not applicable toresidential mortgages as substantially all the mortgages aregovernment guaranteed.
The following table summarizes the loan principal, past due and net write-offs for total loans reported on our Consolidated Balance Sheets andsecuritized loans that we manage.
Loans managed2010 2009
Loan principal Past due (1) Net write–offs Loan principal Past due (1) Net write–offs
Retail $ 262,601 $ 1,782 $ 1,234 $ 245,430 $ 1,746 $ 1,300Wholesale 73,375 3,777 877 78,927 4,384 1,233
Total loans managed (2) 335,976 5,559 2,111 324,357 6,130 2,533Less: Loans securitized and managed
Credit card receivables 3,265 50 129 3,870 57 140Canadian residential mortgage-backed securities
created and sold 28,238 232 – 28,815 204 –Canadian residential mortgage-backed securities
created and retained 9,270 76 – 7,521 53 –
Total loans reported on the Consolidated Balance Sheets $ 295,203 $ 5,201 $ 1,982 $ 284,151 $ 5,816 $ 2,393
(1) Includes impaired loans as well as loans that are contractually 90 days past due but are not considered impaired.(2) Excludes any assets we have temporarily acquired with the intent at acquisition to sell to SPEs.
102 Royal Bank of Canada: Annual Report 2010 Consolidated Financial Statements

In addition to the above securitization transactions, our loan sales activities are presented in the following table:
Loan sales (1)
2010 (2) 2009 2008
Wholesaleloans (3)
Commercialmortgage
loansWholesale
loans (3)
Residentialmortgage
loans
Commercialmortgage
loansWholesale
loans (3)
Residentialmortgage
loans
Commercialmortgage
loans
Sold $ 58 $ 129 $ 25 $ 1,021 $ 23 $ 31 $ 237 $ 70
(1) Gains on whole loan sales are nominal.(2) No residential mortgage loans were sold during the year.(3) Includes only the portions that are funded by Royal Bank of Canada.
Note 6 Variable interest entities (VIEs)
The following table provides information about VIEs as at October 31, 2010 and 2009, in which we have significant variable interests, and thosewe consolidate under AcG-15 because we are the Primary Beneficiary.
2010 2009
Totalassets
Maximumexposure
to lossTotal
assets
Maximumexposure
to loss
Unconsolidated VIEs in which we have significant variable interests (1)
Multi-seller conduits (2) $ 21,847 $ 22,139 $ 26,181 $ 26,550Structured finance VIEs (3) 4,669 2,030 5,907 2,527Credit investment product VIEs 502 19 930 505Third-party conduits – – 575 250Investment funds 249 61 84 28Other 165 39 340 103
$ 27,432 $ 24,288 $ 34,017 $ 29,963
Consolidated VIEs (4), (5)
Structured finance VIEs $ 2,998 $ 2,620Investment funds 1,012 588Compensation vehicles 53 64Other 3 3
$ 4,066 $ 3,275
(1) The maximum exposure to loss resulting from our significant variable interests in these VIEs consists mostly of investments, loans, liquidity facilities and fair value of derivatives. We haverecognized $2,918 million (2009 – $4,020 million) of this exposure on our Consolidated Balance Sheets.
(2) Total assets represent maximum assets that may have to be purchased by the conduits under purchase commitments outstanding as at October 31, 2010. Actual assets held by theseconduits as at October 31, 2010, were $13,969 million (2009 – $18,908 million).
(3) Our October 31, 2009 comparatives have been revised to present information related to a certain entity on a net basis that was previously presented on a gross basis. The total gross and netassets related to this entity as at October 31, 2009 were $4,177 million and $471 million, respectively.
(4) The assets that support the obligations of the consolidated VIEs are reported on our Consolidated Balance Sheets primarily as follows: Interest-bearing deposits with banks of $76 million(2009 – $120 million), Trading securities of $740 million (2009 – $272 million), Available-for-sale securities of $1,786 million (2009 – $1,234 million), Loans of $1,346 million (2009 –$1,496 million) and Other assets of $65 million (2009 – $91 million). The compensation vehicles hold $53 million (2009 – $64 million) of our common shares, which are reported as
Treasury shares. The obligation to provide our common shares to employees is recorded as an increase to Contributed surplus as the expense for the corresponding stock-basedcompensation plan is recognized.
(5) Investors of a consolidated VIE have recourse only to the assets of that VIE and do not have recourse to our general assets unless we breach our contractual obligations relating to that VIE,provide liquidity facilities or credit enhancement facilities to, or enter into derivative transactions with, that VIE.
Multi-seller and third-party conduitsWe administer six multi-seller asset-backed commercial paperconduit programs (multi-seller conduits). These conduits primarilypurchase financial assets from clients and finance those purchasesby issuing asset-backed commercial paper. Our clients primarilyutilize multi-seller conduits to diversify their financing sources and toreduce funding costs.
An unrelated third party (expected loss investor) absorbs creditlosses, up to a maximum contractual amount, that may occur in thefuture on the assets in the multi-seller conduits (multi-seller conduitfirst-loss position) before the multi-seller conduits’ debt holders andus. In return for assuming this multi-seller conduit first-loss position,each multi-seller conduit pays the expected loss investor a returncommensurate with its risk position. The expected loss investorabsorbs a majority (greater than fifty percent) of each multi-sellerconduit’s expected losses; therefore, we are not the Primary Benefi-ciary and do not consolidate these conduits. However, we continue tohold a significant variable interest in these multi-seller conduitsresulting from our provision of backstop liquidity and partial creditenhancement facilities and entitlement to residual fees.
We held significant variable interests in third-party asset-backedsecurity conduits primarily through providing liquidity support andcredit enhancement facilities. However, we are not the PrimaryBeneficiary and do not consolidate these conduits.
The liquidity and credit enhancement facilities are described inNote 25.
Structured finance VIEsIn 2008, we purchased U.S. ARS from entities which funded theirlong-term investments in student loans by issuing short-term seniorand subordinated notes. Certain of these entities are VIEs (U.S. ARSVIEs). We are subject to losses on these U.S. ARS VIEs if defaults areexperienced on the underlying student loans; however, the principaland accrued interest on the student loans are largely guaranteed byU.S. government agencies. In our role as auction remarketing agentfor some of these entities, we are under no legal obligation topurchase the notes issued by these entities in the auction process.We hold significant variable interests in certain unconsolidatedentities. We consolidate certain of these U.S. ARS VIEs where ourexpected loss calculations indicate that we are exposed to a majorityof the expected loss through our note holdings in these entities.
Consolidated Financial Statements Royal Bank of Canada: Annual Report 2010 103

Note 6 Variable interest entities (VIEs) (continued)
We also sold ARS into Tender Option Bond (TOB) programs,where each ARS TOB program consists of a credit enhancement (CE)trust and a TOB trust. Each ARS sold to the TOB program is supportedby a letter of credit issued by us, which requires us to extend fundingif there are any credit losses on the ARS, and is financed by theissuance of floating-rate certificates to short-term investors and aresidual certificate to a single third-party investor. We are theremarketing agent for the floating-rate certificates and we provideliquidity facilities to each of the ARS TOB programs to purchase anyfloating-rate certificates that have been tendered but not successfullyremarketed. We receive market-based fees for acting as theremarketing agent and providing the letters of credit and liquidityfacilities. Both the CE and the TOB trusts are VIEs. We consolidatecertain of these ARS TOB programs where our expected loss calcu-lations indicate that we are exposed to a majority of the expected lossthrough our letters of credit and liquidity facilities. We continue tohold significant variable interests through the provision of thefacilities in other unconsolidated ARS TOB programs where theresidual certificate holder is exposed to a majority of the expectedlosses in these trusts. The liquidity facilities and letters of credit aredescribed in Note 25.
The structure of other non-ARS TOB programs that we areinvolved with is similar to the structure of the ARS TOB programdescribed above. We also hold the residual certificates issued bythese non-ARS TOB programs which exposes us to interest rate basisrisk and may provide liquidity facilities and/or credit enhancementsto these non-ARS TOB programs. We consolidate the non-ARS TOBprograms where we are exposed to a majority of the expected lossesas a result of our continuing involvement with the non-ARS TOBprograms.
Creation of credit investment productsWe use VIEs to generally transform credit derivatives into cashinstruments, to distribute credit risk and to create customized creditproducts to meet investors’ specific requirements. We enter intoderivative contracts, including credit derivatives, to purchaseprotection from these VIEs (credit protection) in order to convertvarious risk factors such as yield, currency or credit risk of underlyingassets to meet the needs of the investors. We transfer assets to theseVIEs as collateral for notes issued but the transfer of assets does notmeet sale recognition criteria under AcG-12.
These VIEs issue funded notes. In certain instances, we invest inthe funded notes issued by these VIEs. Some of the VIEs also issueunfunded notes in the form of senior credit derivatives or funding
commitments and we may be an investor of these unfunded notes.The investors in the funded and unfunded notes ultimately bear thecost of any payments made by the VIEs as a result of the creditprotection provided to us. We may hold significant variable interestsin VIEs as a result of our investment in the notes.
Investment fundsWe enter into fee-based equity derivative transactions with thirdparties including mutual funds, unit investment trusts and otherinvestment funds. These transactions provide their investors with thedesired exposure to the referenced funds, and we hedge our exposurefrom these derivatives by investing in those referenced funds. Weconsolidate the referenced funds when we are exposed to a majorityof the expected losses of the funds.
Compensation vehiclesWe use compensation trusts, which primarily hold our own commonshares, to economically hedge our obligation to certain employeesunder some of our stock-based compensation programs. Weconsolidate the trusts in which we are the Primary Beneficiary.
Capital trustsRBC Subordinated Notes Trust (Trust III) and RBC Capital Trust II (TrustII) were created to issue innovative capital instruments, the proceedsof which were used to purchase senior deposit notes from us.Although we own the common equity and voting control of thesetrusts, we are not the Primary Beneficiary since we are not exposed tothe majority of the expected losses, and we do not have a significantvariable interest in these trusts. For details on the senior depositnotes and innovative capital instruments, refer to Notes 13 and 17,respectively.
Securitization of our financial assetsWe employ VIEs in the process of securitizing our assets, none of whichare consolidated under AcG-15. One entity is a QSPE, which is specificallyexempt from consolidation, and our level of participation in each of theremaining VIEs relative to others does not expose us to a majority of theexpected losses. We also do not have significant variable interests inthese VIEs. For details on our securitization activities, refer to Note 5.
Additional information about our VIEs are provided in Note 31.
Note 7 Derivative instruments and hedging activities
Derivative instruments are categorized as either financial ornon-financial derivatives. Financial derivatives are financial contractswhose value is derived from an underlying interest rate, foreignexchange rate, credit risk, and equity or equity index. Non-financialderivatives are contracts whose value is derived from a preciousmetal, commodity instrument or index. Notional amount ofderivatives represents the contract amount used as a reference pointto calculate payments. Notional amounts are generally not exchangedby counterparties, and do not reflect our exposure at default.
Financial derivativesForwards and futuresForward contracts are effectively tailor-made agreements that aretransacted between counterparties in the over-the-counter market,whereas futures are standardized contracts with respect to amountsand settlement dates, and are traded on regular futures exchanges.Examples of forwards and futures are described below:
Interest rate forwards (forward rate agreements) and futures arecontractual obligations to buy or sell an interest-rate sensitivefinancial instrument on a predetermined future date at a specifiedprice.
Foreign exchange forwards and futures are contractualobligations to exchange one currency for another at a specified pricefor settlement at a predetermined future date.
Equity forwards and futures are contractual obligations to buy orsell at a fixed value (the contracted price) of an equity index, a basketof stocks or a single stock at a predetermined future date.
SwapsSwaps are over-the-counter contracts in which two counterpartiesexchange a series of cash flows based on agreed upon rates to anotional amount. The various swap agreements that we enter into areas follows:
Interest rate swaps are agreements where two counterpartiesexchange a series of payments based on different interest ratesapplied to a notional amount in a single currency. Cross currencyswaps involve the exchange of payments in one currency for thereceipt of payments in another currency. Cross currency interest rateswaps may involve the exchange of both interest and principalamounts in two different currencies.
104 Royal Bank of Canada: Annual Report 2010 Consolidated Financial Statements

Equity swaps are contracts in which one counterparty agrees topay or receive from the other cash flows based on changes in thevalue of an equity index, a basket of stocks or a single stock.
OptionsOptions are contractual agreements under which the seller (writer)grants the purchaser the right, but not the obligation, either to buy(call option) or sell (put option), a security, exchange rate, interestrate, or other financial instrument or commodity at a predeterminedprice, at or by a specified future date. The seller (writer) of an optioncan also settle the contract by paying the cash settlement value of thepurchaser’s right. The seller (writer) receives a premium from thepurchaser for this right. The various option agreements that we enterinto include interest rate options, foreign currency options, equityoptions and index options.
Credit derivativesCredit derivatives are over-the-counter contracts that transfer creditrisk related to an underlying financial instrument (referenced asset)from one counterparty to another. Examples of credit derivativesinclude credit default swaps, credit default baskets and total returnswaps.
Credit default swaps provide protection against the decline invalue of the referenced asset as a result of specified credit eventssuch as default or bankruptcy. It is similar in structure to an optionwhereby the purchaser pays a premium to the seller of the creditdefault swap in return for payment contingent on a credit eventaffecting the referenced asset.
Credit default baskets are similar to credit default swaps exceptthat the underlying referenced financial instrument is a group ofassets instead of a single asset.
Total return swaps are contracts where one counterparty agreesto pay or receive from the other cash flows based on changes in thevalue of the referenced asset.
Other derivative productsCertain warrants and loan commitments that meet the definition ofderivative are also included as derivative instruments.
Non-financial derivativesWe also transact in non-financial derivative products includingprecious metal and commodity derivative contracts in both theover-the-counter and exchange markets.
Derivatives issued for trading purposesMost of our derivative transactions relate to sales and trading activ-ities. Sales activities include the structuring and marketing ofderivative products to clients to enable them to transfer, modify orreduce current or expected risks. Trading involves market-making,positioning and arbitrage activities. Market-making involves quotingbid and offer prices to other market participants with the intention of
generating revenue based on spread and volume. Positioninginvolves managing market risk positions with the expectation ofprofiting from favourable movements in prices, rates or indices.Arbitrage activities involve identifying and profiting from pricedifferentials between markets and products.
Derivatives issued for other-than-trading purposesWe also use derivatives for purposes other than trading, primarily forhedging, in conjunction with the management of interest rate, credit,equity and foreign exchange risk related to our funding, lending,investment activities and asset/liability management.
Interest rate swaps are used to manage our exposure to interestrate risk by modifying the repricing or maturity characteristics ofexisting and/or anticipated assets and liabilities, including fundingand investment activities. Purchased interest rate options are used tohedge redeemable deposits and other options embedded inconsumer products. We manage our exposure to foreign currency riskwith cross currency swaps and foreign exchange forward contracts.We predominantly use credit derivatives to manage our creditexposures. We mitigate industry sector concentrations and single-name exposures related to our credit portfolio by purchasing creditderivatives to transfer credit risk to third parties.
Certain derivatives and cash instruments are specificallydesignated and qualify for hedge accounting. We apply hedgeaccounting to minimize volatility in earnings caused by changes ininterest rates or foreign exchange rates. Interest rate and currencyfluctuations will either cause assets and liabilities to appreciate ordepreciate in market value or cause variability in anticipated cashflows. When a hedging instrument functions effectively, gains, losses,revenue and expenses of the hedging instrument will offset the gains,losses, revenue and expenses of the hedged item. We largely assessand measure the effectiveness of a derivative that is designated as ahedging instrument based on the change in its fair value. When cashinstruments are designated as hedges of currency risks, only changesin their value due to currency risk are included in the assessment andmeasurement of hedge effectiveness. We applied hedge accountingto anticipated transactions and firm commitments during the year.
From time to time, we also enter into derivative transactions toeconomically hedge certain exposures that do not otherwise qualifyfor hedge accounting, or where hedge accounting is not consideredeconomically feasible to implement. In such circumstances, changesin fair value are reflected in Non-interest income.
As at October 31, 2010, after-tax net unrealized losses of$334 million (2009 – after-tax net unrealized gain of $156 million)were recognized in AOCI, representing the cumulative effectiveportions of our cash flow hedges.
After-tax unrealized losses relating to de-designated hedges of$386 million (before-tax unrealized losses of $269 million) includedin AOCI as at October 31, 2010 are expected to be reclassified to Netinterest income within the next 12 months.
The following table presents the fair values of the derivative and non-derivative instruments categorized by their hedging relationships, as wellas derivatives that are not designated in hedging relationships.
Derivatives and non-derivative instruments2010 (1) 2009 (1)
Designated as hedginginstruments in hedging
relationships
Designated as hedginginstruments in hedging
relationships
Cashflow
hedges
Fairvalue
hedges
Netinvestment
hedges
Not designatedin a hedging
relationship (2)
Cashflow
hedges
Fairvalue
hedges
Netinvestment
hedges
Not designatedin a hedging
relationship (2)
AssetsDerivative instruments $ 505 $ 2,059 $ 307 $ 103,375 $ 1,130 $ 2,107 $ 139 $ 88,797
LiabilitiesDerivative instruments $ 812 $ 60 $ 119 $ 107,919 $ 1,493 $ 82 $ 327 $ 82,488Non-derivative instruments – 1,002 8,732 n.a. – 278 5,233 n.a.
(1) All derivative instruments are carried at fair value while all non-derivative instruments are carried at amortized cost.(2) Derivative liabilities include stable value contracts on $170 million (2009 – $257 million) of bank-owned life insurance policies and $2 million (2009 – $3 million) of 401(k) plans.n.a. not applicable
Consolidated Financial Statements Royal Bank of Canada: Annual Report 2010 105

Note 7 Derivative instruments and hedging activities (continued)
Results of hedge activities recorded in Net income and OCI2010 2009
Net gains(losses)
included inNon–interest
income
Net gains(losses)
included inNet interest
income
After-taxunrealized
gains(losses)
included inOCI
Net gains(losses)
included inNon-interest
income
Net gains(losses)
included inNet interest
income
After-taxunrealized
gains(losses)
included inOCI
Fair value hedgesIneffective portion $ (5) $ n.a. $ n.a. $ 9 $ n.a. $ n.a.
Cash flow hedgesIneffective portion (20) n.a. n.a. 9 n.a. n.a.Effective portion n.a. n.a. (334) n.a. n.a. 156Reclassified to income during the period (1) n.a. (118) n.a. n.a. 56 n.a.
Net investment hedgesForeign currency (losses) n.a. n.a. (1,785) n.a. n.a. (2,973)Gains (losses) from hedges n.a. n.a. 1,479 n.a. n.a. 2,399
$ (25) $ (118) $ (639) $ 18 $ 56 $ (418)
(1) After-tax losses of $82 million were reclassified from AOCI to income for the year ended October 31, 2010 (2009 – gains of $38 million).n.a. not applicable
Notional amount of derivatives by term to maturity (absolute amounts)2010 2009
Term to maturity
Within1 year
1 to5 years
Over 5years (1) Total Trading
Other thanTrading Trading
Other thanTrading
Over-the-counter contractsInterest rate contracts
Forward rate agreements $ 560,552 $ 188,012 $ – $ 748,564 $ 748,564 $ – $ 356,064 $ –Swaps 1,316,860 1,645,185 829,809 3,791,854 3,585,016 206,838 2,467,890 208,104Options purchased 21,888 32,555 31,801 86,244 86,244 – 113,067 324Options written 23,560 48,037 84,429 156,026 156,026 – 176,826 –
Foreign exchange contractsForward contracts 860,528 31,738 579 892,845 821,974 70,871 585,913 58,583Cross currency swaps 6,029 6,881 12,056 24,966 24,789 177 25,198 288Cross currency interest
rate swaps 94,034 241,216 114,243 449,493 414,750 34,743 315,253 36,854Options purchased 29,947 7,996 2,456 40,399 40,392 7 38,399 3Options written 29,935 7,969 2,004 39,908 39,908 – 37,746 1
Credit derivatives (2) 8,026 57,273 24,252 89,551 88,072 1,479 127,012 2,173Other contracts (3) 41,275 39,962 11,466 92,703 90,946 1,757 85,248 1,216
Exchange–traded contractsInterest rate contracts
Futures – long positions 34,281 18,314 42,655 95,250 95,241 9 91,133 48Futures – short positions 39,135 18,212 56,372 113,719 113,719 – 98,490 –Options purchased 32,205 4,557 97 36,859 36,859 – 25,666 –Options written 19,149 3,572 – 22,721 22,721 – 28,602 –
Foreign exchange contractsFutures – long positions 140 – – 140 140 – 14 –Futures – short positions 28 – – 28 28 – 32 –
Other contracts (3) 92,507 36,990 9,503 139,000 139,000 – 119,625 –
$ 3,210,079 $ 2,388,469 $ 1,221,722 $ 6,820,270 $ 6,504,389 $ 315,881 $ 4,692,178 $307,594
(1) Includes contracts maturing in over 10 years with a notional value of $337.9 billion (2009 – $287.0 billion). The related gross positive replacement cost is $21.7 billion (2009 –$14.1 billion).
(2) Comprises credit default swaps, total return swaps and credit default baskets, including credit derivatives given guarantee treatment for OSFI regulatory reporting purposes. Credit derivativeswith a notional value of $1.5 billion (2009 – $2.2 billion) are economic hedges. Trading credit derivatives comprise protection purchased of $48.0 billion (2009 – $68.6 billion) andprotection sold of $40.1 billion (2009 – $58.4 billion); other–than-trading credit derivatives comprise protection purchased of $1.5 billion (2009 –$2.2 billion) and protection sold of $nil(2009 – $10 million).
(3) Comprises precious metal, commodity, stable value and equity derivative contracts.
106 Royal Bank of Canada: Annual Report 2010 Consolidated Financial Statements

Fair value of derivative instruments2010 2009
Average fair valuefor year ended (1)
Year-endfair value
Average fair valuefor year ended (1)
Year-endfair value
Positive Negative Positive Negative Positive Negative Positive Negative
Held or issued for trading purposesInterest rate contracts
Forward rate agreements $ 288 $ 245 $ 316 $ 286 $ 336 $ 274 $ 221 $ 196Swaps 52,912 48,114 62,197 57,351 56,487 51,138 47,660 43,119Options purchased 1,601 – 2,099 – 1,744 – 1,712 –Options written – 2,009 – 2,486 – 2,353 – 2,007
54,801 50,368 64,612 60,123 58,567 53,765 49,593 45,322
Foreign exchange contractsForward contracts 9,988 9,820 12,201 12,134 17,465 17,631 8,790 8,923Cross currency swaps 2,001 1,690 1,902 1,540 2,004 1,665 2,219 1,614Cross currency interest rate swaps 11,128 13,838 12,211 17,797 13,787 12,725 10,846 9,993Options purchased 1,266 – 1,421 – 1,685 – 1,377 –Options written – 1,110 – 1,190 – 1,591 – 1,385
24,383 26,458 27,735 32,661 34,941 33,612 23,232 21,915
Credit derivatives (2) 2,943 2,500 1,996 1,690 11,739 10,343 5,192 4,398Other contracts (3) 7,081 8,400 7,769 10,360 12,298 10,774 8,148 8,112
$ 89,208 $ 87,726 $ 102,112 $ 104,834 $ 117,545 $ 108,494 $ 86,165 $ 79,747
Held or issued for other than trading purposesInterest rate contracts
Swaps $ 2,974 $ 1,976 $ 4,334 $ 2,807Options purchased – – 9 –
2,974 1,976 4,343 2,807
Foreign exchange contractsForward contracts 533 480 466 490Cross currency swaps 2 3 4 7Cross currency interest rate swaps 1,450 1,843 1,866 1,587
1,985 2,326 2,336 2,084
Credit derivatives (2) 7 28 128 20Other contracts (3) 141 – 102 –
5,107 4,330 6,909 4,911
Total gross fair values before netting (4) 107,219 109,164 93,074 84,658Valuation adjustments determined on a pooled basis (719) – (633) –Impact of master netting agreements
With intent to settle net or simultaneously (5) (254) (254) (268) (268)
$ 106,246 $ 108,910 $ 92,173 $ 84,390
Impact of master netting agreementsWithout intent to settle net or simultaneously (6) (76,383) (76,383) (62,868) (62,868)
$ 29,863 $ 32,527 $ 29,305 $ 21,522
(1) Average fair value amounts are calculated based on monthly balances.(2) Comprises credit default swaps, total return swaps and credit default baskets, including credit derivatives given guarantee treatment for OSFI regulatory reporting purposes.(3) Comprises precious metal, commodity, stable value and equity derivative contracts.(4) Total gross fair values before netting include market and credit valuation adjustments that are determined on an instrument-specific basis. Certain warrants and loan commitments that meet
the definition of derivatives are also included.(5) Impact of offsetting credit exposures on contracts where we have both a legally enforceable netting agreement in place and we intend to settle the contracts on either a net basis or
simultaneously.(6) Additional impact of offsetting credit exposures on contracts where we have a legally enforceable netting agreement in place but do not intend to settle the contracts on a net basis or
simultaneously.
Fair value of derivative instruments by term to maturity2010 2009
Less than1 year
1 to5 years
Over5 years Total Total
Derivative assets (1) $ 22,213 $38,485 $45,548 $106,246 $92,173Derivative liabilities (2) 23,662 40,635 44,613 108,910 84,390
(1) Market and credit valuation adjustments that are determined on an instrument-specificbasis and on a pooled basis are included.
(2) Includes stable value contracts on $170 million (2009 – $257 million) of bank-ownedlife insurance policies and $2 million (2009 – $3 million) of 401(k) plans.
Consolidated Financial Statements Royal Bank of Canada: Annual Report 2010 107

Note 7 Derivative instruments and hedging activities (continued)
Derivative-related credit riskCredit risk from derivative transactions is generated by the potentialfor the counterparty to default on its contractual obligations when oneor more transactions have a positive market value to us. Therefore,derivative-related credit risk is represented by the positive fair valueof the instrument and is normally a small fraction of the contract’snotional amount.
We subject our derivative-related credit risk to the same creditapproval, limit and monitoring standards that we use for managingother transactions that create credit exposure. This includesevaluating the creditworthiness of counterparties, and managing thesize, diversification and maturity structure of the portfolio. Creditutilization for all products is compared with established limits on acontinual basis and is subject to a standard exception reportingprocess. We utilize a single internal rating system for all credit riskexposure. In most cases, these internal ratings approximate theexternal risk ratings of public rating agencies.
Netting is a technique that can reduce credit exposure fromderivatives and is generally facilitated through the use of masternetting agreements. A master netting agreement provides for a singlenet settlement of all financial instruments covered by the agreementin the event of default. However, credit risk is reduced only to theextent that our financial obligations to the same counterparty can beset off against obligations of the counterparty to us. We maximize theuse of master netting agreements to reduce derivative-related creditexposure. Our overall exposure to credit risk that is reduced through
master netting agreements may change substantially following thereporting date as the exposure is affected by each transaction subjectto the agreement as well as by changes in underlying market rates.Measurement of our credit exposure arising out of derivative trans-actions is reduced to reflect the effects of netting in cases where theenforceability of that netting is supported by appropriate legalanalysis as documented in our trading credit risk policies.
The use of collateral is another significant credit mitigationtechnique for managing derivative-related counterparty credit risk.Mark-to-market provisions in our agreements with some counter-parties, typically in the form of a Credit Support Annex, provide uswith the right to request that the counterparty pay down or collater-alize the current market value of its derivatives positions when thevalue passes a specified threshold amount.
Replacement cost represents the total fair value of alloutstanding contracts in a gain position after factoring in the masternetting agreements. The amounts in the table below exclude fairvalue of $2,278 million (2009 – $3,234 million) relating toexchange-traded instruments as they are subject to daily marginingand are deemed to have no credit risk.
The credit equivalent amount is defined as the sum of thereplacement cost plus an add-on amount for potential future creditexposure as defined by OSFI.
The risk weighted amount is determined by applying thestandard OSFI-defined measures of counterparty risk to the creditequivalent amount.
Derivative-related credit risk2010 (1) 2009 (1)
Replacementcost
Creditequivalentamount (2)
Risk-weighted
balance (3)Replacement
cost
Creditequivalentamount (2)
Risk-weighted
balance (3)
Interest rate contractsForward rate agreements $ 41 $ 479 $ 91 $ 152 $ 365 $ 352Swaps 14,081 17,693 6,577 11,794 15,773 5,485Options purchased 356 562 269 466 975 316
14,478 18,734 6,937 12,412 17,113 6,153
Foreign exchange contractsForward contracts 4,290 8,954 2,024 3,280 6,663 1,214Swaps 3,709 12,956 3,101 4,697 12,744 2,888Options purchased 1,035 1,716 583 892 1,504 346
9,034 23,626 5,708 8,869 20,911 4,448
Credit derivatives (4) 937 2,379 2,553 2,409 4,140 4,096Other contracts (5) 3,849 6,776 5,039 2,886 4,868 2,476Total $ 28,298 $ 51,515 $ 20,237 $ 26,576 $ 47,032 $ 17,173
(1) The amounts presented are net of master netting agreements.(2) The total credit equivalent amount includes collateral applied of $7.4 billion (2009 – $7.3 billion).(3) The risk-weighted balance was calculated in accordance with Basel II.(4) Comprises credit default swaps, total return swaps and credit default baskets. The above excludes credit derivatives issued for other-than-trading purposes related to bought and sold
protection with a replacement cost of $7 million (2009 – $128 million). Credit derivatives issued for other-than-trading purposes related to sold protection with a replacement cost of $nil(2009 – $nil), credit equivalent amount of $nil (2009 – $10 million) and risk-adjusted asset amount of $nil (2009 – $3 million) which were given guarantee treatment per OSFI guidance.
(5) Comprises precious metal, commodity and equity derivative contracts.
Replacement cost of derivative instruments by risk rating and by counterparty type2010
Risk rating (1) Counterparty type (2)
AAA, AA A BBB BB or lower Total BanksOECD
governments Other TotalGross positive replacement cost $ 31,724 $ 49,339 $ 16,544 $ 7,334 $ 104,941 $ 68,475 $ 11,118 $ 25,348 $ 104,941Impact of master netting agreements 24,228 38,862 10,889 2,658 76,637 55,638 8,141 12,858 76,637Replacement cost (after netting agreements) (3) $ 7,496 $ 10,477 $ 5,655 $ 4,676 $ 28,304 $ 12,837 $ 2,977 $ 12,490 $ 28,304Replacement cost (after netting agreements) – 2009 (3) $ 9,349 $ 9,991 $ 4,077 $ 3,287 $ 26,704 $ 11,166 $ 2,835 $ 12,703 $ 26,704
(1) Our internal risk ratings for major counterparty types approximate those of public rating agencies. Ratings of AAA, AA, A and BBB represent investment grade ratings and ratings of BB or lowerrepresent non-investment grade ratings.
(2) Counterparty type is defined in accordance with the capital adequacy requirements of OSFI.(3) Includes credit derivatives issued for other-than-trading purposes with a total replacement cost of $7 million (2009 – $128 million).
108 Royal Bank of Canada: Annual Report 2010 Consolidated Financial Statements

Note 8 Premises and equipment
2010 2009
CostAccumulateddepreciation
Net bookvalue Cost
Accumulateddepreciation
Net bookvalue
Land $ 236 $ – $ 236 $ 250 $ – $ 250Buildings 1,002 (498) 504 942 (479) 463Computer equipment 2,041 (1,512) 529 2,018 (1,537) 481Furniture, fixtures and other equipment 1,485 (993) 492 1,401 (972) 429Leasehold improvements 1,745 (1,003) 742 1,642 (898) 744
$ 6,509 $ (4,006) $ 2,503 $ 6,253 $ (3,886) $ 2,367
The depreciation expense for premises and equipment for 2010 was $410 million (2009 – $389 million; 2008 – $318 million).
Note 9 RBC Dexia Investor Services joint venture
RBC Dexia Investor ServicesWe operate our institutional and investor services business (IIS)through our joint venture, RBC Dexia Investor Services (RBC Dexia IS).
Assets and liabilities representing our interest in RBC Dexia ISand our proportionate share of its financial results before adjustingfor related party transactions are presented in the following tables:
2010 2009Consolidated Balance Sheets
Assets (1) $ 15,465 $ 15,502Liabilities 14,213 14,438
(1) Includes $107 million (2009 – $73 million) of goodwill and $154 million (2009 –$137 million) of intangible assets.
2010 2009 2008Consolidated Statements of
IncomeNet interest income $ 57 $ 152 $ 162Non-interest income 528 496 647Non-interest expense 541 593 602Net income 29 34 135
Consolidated Statements ofCash FlowsCash flows from (used in)
operating activities $ 1,916 $ 446 $ (1,433)Cash flows from (used in)
investing activities (1,594) 2,869 (2,158)Cash flows (used in) from
financing activities (260) (3,328) 3,713
We provide certain services to RBC Dexia IS, which includeadministrative and technology support, human resources, and creditand banking facilities to support its operations. RBC Dexia IS alsoprovides certain services to us, including custody and trusteeship,fund and investment administration, transfer agency and investorservices. These services and facilities are provided by the respectiveparties in the normal course of operations on terms similar to thoseoffered to non-related parties. The amount of income earned andexpenses incurred by RBC Dexia IS related to transactions with RoyalBank of Canada are as follows:
2010 2009 2008
Net interest income $ 11 $ 49 $ 145Non-interest income 28 25 28Non-interest expense 31 37 38
Note 10 Goodwill and other intangibles
GoodwillWe also completed our annual assessment for goodwill impairment inall reporting units and determined that there was no other goodwillimpairment for the year ended October 31, 2010 (2009 – $ 1 billion;2008 – $nil).
The following tables disclose the changes in goodwill during 2009and 2010.
CanadianBanking
WealthManagement Insurance (1)
InternationalBanking
CapitalMarkets Total
Balance at October 31, 2008 $ 1,919 $ 2,246 $ 153 $ 4,606 $ 1,053 $ 9,977Goodwill acquired during the year 15 20 – – 4 39Goodwill impairment charge – – – (1,000) – (1,000)Other adjustments (2) 2 (121) (13) (398) (118) (648)
Balance at October 31, 2009 $ 1,936 $ 2,145 $ 140 $ 3,208 $ 939 $ 8,368Goodwill acquired during the year – – – 35 2 37Other adjustments (2) (5) (79) (14) (203) (40) (341)
Balance at October 31, 2010 $ 1,931 $ 2,066 $ 126 $ 3,040 $ 901 $ 8,064
(1) Other adjustments for 2010 include $7 million of goodwill attributable to the sale of Liberty Life Insurance Company. Refer to Note 11.(2) Other adjustments primarily include the impact of foreign exchange translations on foreign currency-denominated goodwill.
Consolidated Financial Statements Royal Bank of Canada: Annual Report 2010 109

Note 10 Goodwill and other intangibles (continued)
Other intangibles2010 2009
Gross carryingamount
Accumulatedamortization (1)
Net carryingamount
Gross carryingamount
Accumulatedamortization (1)
Net carryingamount
Core deposit intangibles $ 648 $ (387) $ 261 $ 738 $ (378) $ 360Customer lists and relationships 1,074 (420) 654 1,121 (388) 733Computer software 2,482 (1,483) 999 2,136 (1,213) 923
$ 4,204 $ (2,290) $ 1,914 $ 3,995 $ (1,979) $ 2,016
(1) Total amortization expense for 2010 was $500 million (2009 – $462 million).
Other intangibles presented in the Consolidated Balance Sheetinclude $16 million of mortgage servicing rights that are carried at fairvalue (2009 – $17 million). The projected amortization of Otherintangibles for each of the years ending October 31, 2011 to
October 31, 2015 is approximately $146 million. There was $1 millionin writedowns of intangible assets due to impairment for the yearended October 31, 2010 (2009 – $nil).
Note 11 Significant acquisitions and dispositions
Pending acquisitionOn October 18, 2010, RBC Wealth Management and BlueBay AssetManagement plc (BlueBay) announced that they had reached anagreement on terms for a recommended acquisition of BlueBay.Under the terms of the acquisition, BlueBay shareholders will beentitled to receive 485 pence in cash for each BlueBay share, for atotal purchase price of approximately £963 million (C$1.56 billion).This transaction is subject to regulatory approval and other customaryclosing conditions and is expected to be completed by the end ofDecember 2010.
DispositionsOn October 22, 2010, we announced our intention to sell Liberty LifeInsurance Company (Liberty Life), our U.S. life insurance business, toAthene Holding Ltd. for US$628 million (C$641 million). The trans-action is expected to close in early 2011, and this is subject toregulatory approval and other customary closing conditions. Anestimated loss of $116 million, before and after-taxes, has beenrecorded in Non-interest income – Other. This amount includes awrite-off of $7 million of goodwill. Refer to Note 10.
Our consolidated financial statements include the results ofLiberty Life for the year ended October 31, 2010. Selected financialinformation for Liberty, including the loss on sale, is set out below.
2010 2009
Non interest income $ 1,581 $ 1,652Insurance policyholder benefits,
claims and actuarial expenses (1,562) (1,567)Net interest expense (85) (102)
Net loss before tax (66) (17)
Net loss $ (78) $ (30)
October 312010
October 312009
Total assets $ 5,366 $ 4,591
Total liabilities $ 4,638 $ 3,899
Note 12 Other assets
2010 2009
Receivable from brokers, dealers and clients $ 4,263 $ 3,185Accrued interest receivable 1,685 1,735Investment in associated corporations and limited partnerships 171 637Insurance-related assets (1) 1,563 1,297Net future income tax asset (refer to Note 23) 1,648 1,726Prepaid pension benefit cost (2) (refer to Note 20) 1,992 1,028Other 7,953 5,325
$ 19,275 $ 14,933
(1) Insurance-related assets include policy loan balances, premiums outstanding, amounts due from other insurers in respect of reinsurance contracts and pooling arrangements, and deferredacquisition costs.
(2) Prepaid pension benefit cost represents the cumulative excess of pension fund contributions over pension benefit expense.
110 Royal Bank of Canada: Annual Report 2010 Consolidated Financial Statements

Note 13 Deposits
The following table details our deposit liabilities.
2010 2009Demand (1) Notice (2) Term (3), (4), (5) Total Total
Personal $ 85,774 $ 12,206 $ 63,713 $ 161,693 $ 152,328Business and government (4), (5) 111,490 2,394 133,313 247,197 220,772Bank 3,607 11 20,525 24,143 25,204
$ 200,871 $ 14,611 $ 217,551 $ 433,033 $ 398,304
Non-interest-bearingCanada $ 47,337 $ 41,175United States 4,988 4,893Other International 3,639 3,041
Interest-bearingCanada (4), (5) 185,636 174,345United States 62,359 47,930Other International 129,074 126,920
$ 433,033 $ 398,304
(1) Deposits payable on demand include all deposits for which we do not have the right to notice of withdrawal. These deposits include both savings and chequing accounts.(2) Deposits payable after notice include all deposits for which we can legally require notice of withdrawal. These deposits are primarily savings accounts.(3) Term deposits include deposits payable on a fixed date. These deposits include term deposits, guaranteed investment certificates and similar instruments. At October 31, 2010, the balance
of term deposits also includes senior deposit Notes we have issued to provide long-term funding of $60 billion (2009 – $58 billion).(4) The senior deposit note of $900 million issued to Trust II (refer to Note 17) is included in Business and government deposits. This senior deposit note bears interest at an annual rate of
5.812% and will mature on December 31, 2053. The note is redeemable at our option, in whole or in part, on and after December 31, 2008, subject to the approval of OSFI. It may beredeemed earlier, at our option in certain specified circumstances, subject to the approval of OSFI. Each $1,000 of the note principal is convertible at any time into 40 of our Non-cumulativeredeemable First Preferred Shares Series U at the option of Trust II. Trust II will exercise this conversion right in circumstances in which holders of RBC Trust Capital Securities Series 2013(RBC TruCS 2013) exercise their holder exchange right. Refer to Note 17 for more information on RBC TruCS 2013.
(5) Business and government deposits also include a senior deposit note of $999.8 million issued to Trust III (refer to Note 17). This senior deposit note bears interest at an annual rate of 4.72%and will mature on April 30, 2017. Subject to OSFI’s approval, the note is redeemable at our option, in whole or in part, on or after April 30, 2012, at the Redemption Price and may also beredeemed earlier at our option at the Early Redemption Price. The Redemption Price is an amount equal to $1,000 plus the unpaid distributions to the redemption date. The Early RedemptionPrice is an amount equal to the greater of (i) the Redemption Price, and (ii) the price calculated to provide an annual yield, equal to the yield on Government of Canada bonds from theredemption date to April 30, 2012, plus 11 basis points.
The following table presents the contractual maturities of our demand,notice and term deposit liabilities. Included in “within 1 year” aredeposits payable on demand and deposits payable after notice.
Deposits (1)
2010 2009 (2)
Within 1 year $ 340,820 $ 295,9101 to 2 years 31,370 42,2772 to 3 years 26,585 27,7513 to 4 years 8,340 15,9164 to 5 years 11,992 6,194Over 5 years 13,926 10,256
$ 433,033 $ 398,304
(1) The aggregate amount of term deposits in denominations of 100,000 or more as atOctober 31, 2010 was $181 billion (2009 – $167 billion).
(2) Certain amounts have been reclassified from those previously reported.
The following table presents the average deposit balances andaverage rate of interest during 2010 and 2009.
Average deposit balances and average of interest paid ratesAverage balances Average rates
2010 2009 (1) 2010 2009 (1)
Canada $ 221,555 $ 210,873 1.19% 1.40%United States 59,364 63,507 0.56 1.23Other International 129,760 147,578 1.63 2.06
$ 410,679 $ 421,958 1.24% 1.60%
(1) Certain amounts have been reclassified from those previously reported.
Note 14 Insurance
Insurance claims and policy benefit liabilities2010 2009
Life and Health $ 9,842 $ 8,151Property and Casualty 675 532Reinsurance 233 239Total $ 10,750 $ 8,922
Future policy benefit liabilities 9,746 8,093Claims liabilities 1,004 829Total $ 10,750 $ 8,922
The net increase in Insurance claims and policy benefit liabilities overthe prior year comprised: (i) the net increase in life and healthinsurance as well as property and casualty insurance liabilitiesattributable to business growth; (ii) the increase due to marketmovements on assets backing life and health insurance, reinsuranceand property and casualty insurance liabilities, partially offset by(iii) the favourable impact of the appreciation of the Canadian dollaron U.S. dollar-denominated liabilities.
ReinsuranceIn the ordinary course of business, our insurance operations reinsurerisks to other insurance and reinsurance companies in order toprovide greater diversification, limit loss exposure to large risks, andprovide additional capacity for future growth. These cedingreinsurance arrangements do not relieve our insurance subsidiariesfrom their direct obligation to the insureds. We evaluate the financialcondition of the reinsurers and monitor our concentrations of creditrisks to minimize our exposure to losses from reinsurer insolvency.
Reinsurance amounts (ceded premiums) included inNon-interest income for the years ended October 31 are shown in thetable below.
Net premiums2010 2009 2008
Gross premiums $ 5,541 $4,884 $3,760Ceded premiums (1,057) (995) (896)
$ 4,484 $3,889 $2,864
Consolidated Financial Statements Royal Bank of Canada: Annual Report 2010 111

Note 15 Other liabilities
2010 2009
Short-term borrowings of subsidiaries $ 1,664 $ 3,295Payable to brokers, dealers and clients 3,408 4,922Accrued interest payable 1,958 2,052Accrued pension and other post-employment benefit expense (1) (refer to Note 20) 1,477 1,436Insurance-related liabilities 560 488Dividends payable 778 775Payroll and related compensation 5,357 5,010Trade payables and related accounts 1,893 1,500Taxes payable 109 1,946Cheques and other items in transit 2,675 2,099Other 9,469 7,484
$ 29,348 $ 31,007
(1) Accrued pension and other post-employment benefit expense represents the cumulative excess of pension and other post-employment benefit expense over pension and other post-employment fund contributions.
Note 16 Subordinated debentures
The debentures are unsecured obligations and are subordinated inright of payment to the claims of depositors and certain othercreditors. All redemptions, cancellations and exchanges of
subordinated debentures are subject to the consent and approval ofOSFI. All subordinated debentures are redeemable at our option.
The amounts presented below are net of our holdings in thesesecurities which have not been cancelled and are still outstanding.
Maturity Earliest par value redemption date Interest rate Denominated in foreign currency 2010 2009
November 14, 2014 10.00% 259 264January 25, 2015 January 25, 2010 (1) 7.10% (2) – 506June 24, 2015 June 24, 2010 (1) 3.70% (2) – 809April 12, 2016 April 12, 2011 (3) 6.30% (2) 405 403March 11, 2018 March 11, 2013 (4) 4.84% (5) 1,050 1,048June 6, 2018 June 6, 2013 (6) 5.00% (7) 1,002 1,013November 4, 2018 November 4, 2013 (8) 5.45% (2) 1,096 1,106June 15, 2020 June 15, 2015 (9) 4.35% (10) 1,562 –June 8, 2023 9.30% 110 110June 26, 2037 June 26, 2017 (11) 2.86% (12) JPY 10,000 120 110October 1, 2083 (13) (14) 224 224June 6, 2085 (13) (15) US$184 187 205June 18, 2103 June 18, 2009 (16) 5.95% (17) 676 673
$ 6,691 $ 6,471Deferred financing costs (10) (10)
$ 6,681 $ 6,461
The terms and conditions of the debentures are as follows:(1) Redeemed on the earliest par value redemption date at principal plus accrued interest
to the redemption date.(2) Interest at stated interest rate until earliest par value redemption date, and thereafter at
a rate of 1.00% above the 90-day Bankers’ Acceptance rate.(3) Redeemable at any time prior to the earliest par value redemption date at the greater of
(i) the fair value of the subordinated debentures based on the yield on Government ofCanada bonds plus 22 basis points and (ii) par value, and thereafter at any time at parvalue.
(4) Redeemable at any time prior to the earliest par value redemption date at the greater of(i) the fair value of the subordinated debentures based on the yield on Government ofCanada bonds plus 42.5 basis points and (ii) par value, and thereafter at any time at parvalue.
(5) Interest at stated interest rate until earliest par value redemption date, and thereafter ata rate of 2.00% above the 90-day Bankers’ Acceptance rate.
(6) Redeemable at any time prior to the earliest par value redemption date at the greater of(i) the fair value of the subordinated debentures based on the yield on Government ofCanada bonds plus 44 basis points and (ii) par value, and thereafter at any time at parvalue.
(7) Interest at stated interest rate until earliest par value redemption date, and thereafter ata rate of 2.15% above the 90-day Bankers’ Acceptance rate.
(8) Redeemable at any time prior to the earliest par value redemption date at the greater of(i) the fair value of the subordinated debentures based on the yield on Government ofCanada bonds plus 14 basis points and (ii) par value, and thereafter at any time at parvalue.
(9) Redeemable on or after June 15, 2015 at par value.(10) Interest at stated interest rate until earliest par value redemption date, and thereafter at
a rate of 1.41% above the 90-day Bankers’ Acceptance rate.(11) Redeemable on or after June 26, 2017 at par value.(12) Fixed interest rate at 2.86% per annum, payable semi-annually.(13) Redeemable on any interest payment date at par value.(14) Interest at a rate of 40 basis points above the 30-day Bankers’ Acceptance rate.
(15) Interest at a rate of 25 basis points above the U.S. dollar 3-month LIMEAN. In the eventof a reduction of the annual dividend we declare on our common shares, the interestpayable on the debentures is reduced pro rata to the dividend reduction and the interestreduction is payable with the proceeds from the sale of newly issued common shares.
(16) Redeemable on June 18, 2009, or every fifth anniversary of such date at par value.Redeemable on any other date at the greater of par and the yield on a non-callableGovernment of Canada bond plus 21 basis points if redeemed prior to June 18, 2014, or43 basis points if redeemed at any time after June 18, 2014.
(17) Interest at a rate of 5.95% until earliest par value redemption date and every 5 yearsthereafter at the 5-year Government of Canada yield plus 172 basis points.
On November 1, 2010 , we issued $1.5 billion of subordinateddebentures that bear interest at a fixed rate of 3.18% per annum(paid semi-annually) until November 2, 2015, and at the 90-dayBanker’s Acceptance rate plus 1.21% thereafter until their maturity onNovember 2, 2020 (paid quarterly).
Maturity scheduleThe aggregate maturities of subordinated debentures, based on thematurity dates under the terms of issue, are as follows:
2010
Within 1 year $ –1 to 5 years 2595 to 10 years 5,115Thereafter 1,317
$ 6,691
112 Royal Bank of Canada: Annual Report 2010 Consolidated Financial Statements

Note 17 Trust capital securities
In prior years, we issued innovative capital instruments, RBC TrustCapital Securities (RBC TruCS) and RBC Trust Subordinated Notes (RBCTSNs), through three SPEs: RBC Capital Trust (Trust), Trust II and Trust III.
We also issued non-voting RBC Trust Capital Securities Series2010, 2011, 2015 and 2008-1 (RBC TruCS 2010, 2011, 2015 and 2008-1) through the Trust. RBC TruCS 2010 were redeemed for cash, at aredemption price of $1,000 per unit for a total of $650 million onJune 30, 2010. RBC TruCS 2011 are classified as Trust capital securities.The proceeds of the RBC TruCS 2011 were used to fund the Trust’sacquisition of trust assets. Holders of RBC TruCS 2011 are eligible toreceive semi-annual non-cumulative fixed cash distributions.
Unlike the RBC TruCS 2011, the holders of RBC TruCS 2015 and2008-1 do not have any conversion rights or any other redemptionrights. As a result, upon consolidation of the Trust, RBC TruCS 2015and 2008-1 are classified as Non-controlling interest in subsidiaries(refer to Note 19). Holders of RBC TruCS 2015 and 2008-1 are eligibleto receive semi-annual non-cumulative fixed cash distributions untilDecember 31, 2015 and June 30, 2018, respectively, and a floating-rate cash distribution thereafter.
Trust II, an open-end trust, has issued non-voting RBC TruCS2013, the proceeds of which were used to purchase a senior depositnote from us. Trust II is a VIE under AcG-15 (refer to Note 6). We do notconsolidate Trust II as we are not the Primary Beneficiary; therefore,the RBC TruCS 2013 issued by Trust II are not reported on our
Consolidated Balance Sheets, but the senior deposit note is reportedin Business and government deposit liabilities (refer to Note 13).Holders of RBC TruCS 2013 are eligible to receive semi-annualnon-cumulative fixed cash distributions.
No cash distributions will be payable by the trusts on RBC TruCSif we fail to declare regular dividends (i) on our preferred shares, or(ii) on our common shares if no preferred shares are thenoutstanding. In this case, the net distributable funds of the trusts willbe distributed to us as holders of residual interest in the trusts.Should the trusts fail to pay the semi-annual distributions in full, wewill not declare dividends of any kind on any of our preferred orcommon shares for a specified period of time.
In 2007, we issued $1 billion innovative subordinateddebentures, RBC TSNs – Series A, through Trust III. Trust III is aclosed-end trust. The proceeds were used to purchase a seniordeposit note from us. Trust III is a VIE under AcG -15. We do notconsolidate Trust III as we are not the Primary Beneficiary (refer toNote 6); therefore, the RBC TSNs – Series A issued by Trust III are notreported on our Consolidated Balance Sheet but the senior depositnote issued by us to Trust III is reported in Business and governmentdeposit liabilities (refer to Note 13).
The table below presents the significant terms and conditions ofRBC TruCS and RBC TSNs as at October 31, 2010 and 2009.
Redemption date Conversion date 2010 2009
Issuer Issuance date Distribution datesAnnual
yieldAt the option of the
issuerAt the option of the
holderPrincipal
amountPrincipalamount
RBC Capital Trust (1),(2),(3),(4),(5),(6),(7)Included in Trust capital securities
650,000 Trust Capital Securities – Series2010 (8)
July 24, 2000 June 30, December 31 7.288% December 31, 2005 December 31,2010
$ – $ 650
750,000 Trust Capital Securities – Series2011
December 6, 2000 June 30, December 31 7.183% December 31, 2005 December 31,2011
750 750
$ 750 $ 1,400Included in Non-controlling interest in
subsidiaries1,200,000 Trust Capital Securities – Series
2015October 28, 2005 June 30, December 31 4.87% (9) December 31, 2010 Holder does not have
conversion option1,200 1,200
500,000 Trust Capital Securities – Series2008-1
April 28, 2008 June 30, December 31 6.821% (9) June 30, 2013 Holder does not haveconversion option
500 500
$ 2,450 $ 3,100
RBC Capital Trust II (2),(3),(4),(6),(7),(10)900,000 Trust Capital Securities – Series
2013July 23, 2003 June 30, December 31 5.812% December 31, 2008 Any time $ 900 $ 900
RBC Subordinated Notes Trust(3),(4),(5),(6),(7),(11),(12)$1 billion 4.58% Trust Subordinated
Notes – Series AApril 30, 2007 April 30, October 30 4.584% Any time Holder does not have
conversion option$ 1,000 $ 1,000
The significant terms and conditions of the RBC TruCS and RBC TSNs are as follows:(1) Subject to the approval of OSFI, the Trust may, in whole (but not in part), on the
Redemption date specified above, and on any Distribution date thereafter, redeem theRBC TruCS 2008-1, 2011 and 2015, without the consent of the holders.
(2) Subject to the approval of OSFI, upon occurrence of a special event as defined, prior tothe Redemption date specified above, the trusts may redeem all, but not part of, RBCTruCS 2008-1, 2011, 2013 or 2015 without the consent of the holders.
(3) Issuer Redemption Price: The RBC TruCS 2008-1 may be redeemed for cash equivalentto (i) the Early Redemption Price if the redemption occurs prior to June 30, 2018 or(ii) the Redemption Price if the redemption occurs on or after June 30, 2018. The RBCTruCS 2011 may be redeemed for cash equivalent to (i) the Early Redemption Price if theredemption occurs earlier than six months prior to the conversion date specified aboveor (ii) the Redemption Price if the redemption occurs on or after the date that is sixmonths prior to the conversion date as indicated above. The RBC TruCS 2013 and 2015may be redeemed for cash equivalent to (i) the Early Redemption Price if the redemptionoccurs prior to December 31, 2013 and 2015, respectively, or (ii) the Redemption Priceif the redemption occurs on or after December 31, 2013 and 2015, respectively. The RBCTSNs – Series A may be redeemed, in whole or in part, subject to the approval of OSFI,for cash equivalent to (i) the Early Redemption Price if the notes are redeemed prior toApril 30, 2012, or (ii) the Redemption Price if the notes are redeemed on or afterApril 30, 2012. Redemption Price refers to an amount equal to $1,000 plus the unpaiddistributions to the Redemption date. Early Redemption Price refers to an amount equalto the greater of (i) the Redemption Price and (ii) the price calculated to provide anannual yield, equal to the yield on a Government of Canada bond issued on theRedemption date with a maturity date of June 30, 2018, plus 77 basis points, for RBCTruCS 2008-1, a maturity date of June 30, 2011, plus 40 basis points, for RBC TruCS2011 and a maturity date of December 31, 2013 and 2015, plus 23 basis points and19.5 basis points, for RBC TruCS 2013 and 2015, respectively; and a maturity date ofApril 30, 2012, plus 11 basis points for RBC TSNs – Series A.
(4) Automatic Exchange Event: Without the consent of the holders, each RBC TruCS 2008-1will be exchanged automatically for 40 of our non-cumulative redeemable Bank
Preferred Shares Series AI, each RBC TruCS 2011, 2013 and 2015 will be exchangedautomatically for 40 of our non-cumulative redeemable First Preferred Shares Series R, Tand Z, respectively, and each RBC TSN-Series A will be exchanged automatically for anequal principal amount of Bank Series 10 Subordinated Notes upon occurrence of anyone of the following events: (i) proceedings are commenced for our winding-up; (ii) OSFItakes control of us; (iii) we have Tier 1 capital ratio of less than 5% or Total capital ratioof less than 8%; or (iv) OSFI has directed us to increase our capital or provide additionalliquidity and we elect such automatic exchange or we fail to comply with such direction.The Bank Preferred Shares Series AI and the First Preferred Shares Series T and Z paysemi-annual non-cumulative cash dividends and Series T is convertible at the option ofthe holder into a variable number of common shares.
(5) From time to time, we purchase some of the innovative capital instruments and holdthem temporarily. As at October 31, 2010, we held none of RBC TruCS 2008-1(2009 – $5 million), none of RBC TruCS 2010 (2009 – $2 million), $22 million of RBCTruCS 2011 (2009 – $2 million) and $4 million of RBC TSNs – Series A (2009 – $10million) as treasury holdings which were deducted from regulatory capital.
(6) Regulatory capital: According to OSFI guidelines, innovative capital instruments maycomprise up to 15% of net Tier 1 capital with an additional 5% eligible for Tier 2Bcapital. RBC TSN – Series A qualifies as Tier 2B capital. As at October 31, 2010, $3,327million represents Tier 1 capital (2009 – $3,991 million), $1,023 million represents Tier2B capital (2009 – $1,017 million) and $26 million of our treasury holdings ofinnovative capital is deducted for regulatory capital purposes (2009 – $19 million).
(7) Holder Exchange Right: Holders of RBC TruCS 2011 may exchange, on any distributiondate on or after the conversion date specified above, RBC TruCS 2011 for 40non-cumulative redeemable Bank First Preferred Shares, Series R. Holders of RBC TruCS2013 may, at any time, exchange all or part of their holdings for 40 non-cumulativeredeemable First Preferred Shares Series U, for each RBC TruCS 2013 held. The FirstPreferred Shares Series R and U pay semi-annual non-cumulative cash dividends as andwhen declared by our Board of Directors and are convertible at the option of the holderinto a variable number of common shares. Holders of RBC TruCS 2008-1, RBC TruCS2015 and RBC TSNs – Series A do not have similar exchange rights.
Consolidated Financial Statements Royal Bank of Canada: Annual Report 2010 113

Note 17 Trust capital securities (continued)
(8) On June 30, 2010, the Trust redeemed all issued and outstanding RBC TruCS 2010 forcash, at a redemption price of $1,000 per unit for a total of $650 million.
(9) The non-cumulative cash distribution on the RBC TruCS 2015 will be 4.87% paid semi-annually until December 31, 2015, and at one half of the sum of 180-day Bankers’Acceptance rate plus 1.5%, thereafter. The non-cumulative cash distribution on the RBCTruCS 2008-1 will be 6.821%, paid semi-annually in an amount of $34.105 on June 30and December 31 of each year until June 30, 2018, and floating distributions thereafterat the six-month Bankers’ Acceptance rate plus 350 basis points.
(10) Subject to the approval of OSFI, Trust II may, in whole or in part, on the Redemption date
specified above, and on any distribution date thereafter, redeem any outstanding RBCTruCS 2013 without the consent of the holders.
(11) The cash distribution on the RBC TSNs – Series A will be 4.58% paid semi-annually untilApril 30, 2012, and at 90-day Bankers’ Acceptance rate plus 1% thereafter paidquarterly until their maturity on April 30, 2017.
(12) We will guarantee the payment of principal, interest, the redemption price, if any, andany other amounts of the RBC TSNs – Series A when they become due and payable,whether at stated maturity, call for redemption, automatic exchange or otherwiseaccording to the terms of the Bank Subordinated Guarantee and the Trust Indenture.
Note 18 Preferred share liabilities and share capital
Authorized share capitalPreferred – An unlimited number of First Preferred Shares and SecondPreferred Shares without nominal or par value, issuable in series; theaggregate consideration for which all the First Preferred Shares and allthe Second Preferred Shares that may be issued may not exceed$20 billion and $5 billion, respectively.
Common – An unlimited number of shares without nominal orpar value may be issued.
Issued and outstanding shares (1)
2010 2009 2008Number of
shares(000s) Amount
Dividendsdeclared
per share
Number ofshares(000s) Amount
Dividendsdeclared
per share
Number ofshares(000s) Amount
Dividendsdeclared
per share
Preferred share liabilitiesFirst preferred
Non-cumulative Series N (2) – $ – $ – – $ – $ – – $ – $ .88
Preferred share liabilities, net of treasury holdings – $ – – $ – – $ –
Preferred sharesFirst preferred (3)
Non-cumulative Series W 12,000 $ 300 $ 1.23 12,000 $ 300 $ 1.23 12,000 $ 300 $ 1.23Non-cumulative Series AA 12,000 300 1.11 12,000 300 1.11 12,000 300 1.11Non-cumulative Series AB 12,000 300 1.18 12,000 300 1.18 12,000 300 1.18Non-cumulative Series AC 8,000 200 1.15 8,000 200 1.15 8,000 200 1.15Non-cumulative Series AD 10,000 250 1.13 10,000 250 1.13 10,000 250 1.13Non-cumulative Series AE 10,000 250 1.13 10,000 250 1.13 10,000 250 1.13Non-cumulative Series AF 8,000 200 1.11 8,000 200 1.11 8,000 200 1.11Non-cumulative Series AG 10,000 250 1.13 10,000 250 1.13 10,000 250 1.13Non-cumulative Series AH 8,500 213 1.41 8,500 213 1.41 8,500 213 .81Non-cumulative, 5-Year Rate Reset Series AJ 16,000 400 1.25 16,000 400 1.49 16,000 400 –Non-cumulative, 5-Year Rate Reset Series AL 12,000 300 1.40 12,000 300 1.48 – – –Non-cumulative, 5-Year Rate Reset Series AN 9,000 225 1.56 9,000 225 1.50 – – –Non-cumulative, 5-Year Rate Reset Series AP 11,000 275 1.56 11,000 275 1.34 – – –Non-cumulative, 5-Year Rate Reset Series AR 14,000 350 1.56 14,000 350 1.27 – – –Non-cumulative, 5-Year Rate Reset Series AT 11,000 275 1.56 11,000 275 1.11 – – –Non-cumulative, 5-Year Rate Reset Series AV 16,000 400 1.56 16,000 400 1.01 – – –Non-cumulative, 5-Year Rate Reset Series AX 13,000 325 1.53 13,000 325 .87 – – –
$ 4,813 $ 4,813 $ 2,663
Common sharesBalance at beginning of year 1,417,610 $ 13,075 1,341,260 $ 10,384 1,276,260 $ 7,300Issued on new acquisitions – – – – 59,675 2,937Issued for general business purpose – – 65,263 2,301 – –Issued under Dividend Reinvestment Plan 2,862 161 5,279 232 – –Issued under the stock option plan (4) 4,450 142 5,808 158 6,445 153Purchased for cancellation – – – – (1,120) (6)
Balance at end of year 1,424,922 $ 13,378 $ 2.00 1,417,610 $ 13,075 $ 2.00 1,341,260 $10,384 $ 2.00
Treasury shares – Preferred sharesBalance at beginning of year (65) $ (2) (260) $ (5) (249) $ (6)Sales 313 8 618 13 1,060 23Purchases (334) (8) (423) (10) (1,071) (22)
Balance at end of year (86) $ (2) (65) $ (2) (260) $ (5)
Treasury shares – Common sharesBalance at beginning of year (2,127) $ (95) (2,258) $ (104) (2,444) $ (101)Sales 1,262 64 1,364 59 1,269 51Purchases (854) (50) (1,233) (50) (1,083) (54)
Balance at end of year (1,719) $ (81) (2,127) $ (95) (2,258) $ (104)
(1) The 6.75 million exchangeable shares of a wholly owned subsidiary of Royal Bank of Canada issued for the acquisition of Phillips, Hager & North Investment Management Ltd. (PH&N) are notincluded in this table.
(2) On August 22, 2008, we redeemed Non-cumulative First Preferred Shares Series N at a redemption price equal to the carrying value.(3) First Preferred Shares Series were issued at $25 per share.(4) Includes fair value adjustments to stock options of $7 million (2009 – $6 million), the exercise of stock options from tandem stock appreciation rights (SARs) awards, resulting in a reversal of
the accrued liability, net of related income taxes, of $17 million (2009 – $13 million), and from renounced tandem SARs, net of related income taxes, which are nominal for the current period(2009 – $7 million).
114 Royal Bank of Canada: Annual Report 2010 Consolidated Financial Statements

Terms of preferred share liabilities and preferred shares
Dividendper share (1)
Initialperiodannual
yieldDividend
reset rate (6)Redemption
date (2)Issuedate
Redemptionprice (2), (3)
Conversion date (5)
At the option ofthe bank (2), (4)
At the option ofthe holder
Preferred sharesFirst preferred
Non-cumulative Series W $ .306250 4.90% February 24, 2010 January 31, 2005 $ 26.00 February 24, 2010 Not convertibleNon-cumulative Series AA .278125 4.45% May 24, 2011 April 4, 2006 26.00 Not convertible Not convertibleNon-cumulative Series AB .293750 4.70% August 24, 2011 July 20, 2006 26.00 Not convertible Not convertibleNon-cumulative Series AC .287500 4.60% November 24, 2011 November 1, 2006 26.00 Not convertible Not convertibleNon-cumulative Series AD .281250 4.50% February 24, 2012 December 13, 2006 26.00 Not convertible Not convertibleNon-cumulative Series AE .281250 4.50% February 24, 2012 January 19, 2007 26.00 Not convertible Not convertibleNon-cumulative Series AF .278125 4.45% May 24, 2012 March 14, 2007 26.00 Not convertible Not convertibleNon-cumulative Series AG .281250 4.50% May 24, 2012 April 26, 2007 26.00 Not convertible Not convertibleNon-cumulative Series AH .353125 5.65% May 24, 2013 April 29, 2008 26.00 Not convertible Not convertibleNon-cumulative, 5-Year Rate Reset Series AJ .312500 5.00% 1.93% February 24, 2014 September 16, 2008 25.00 Not convertible Not convertibleNon-cumulative, 5-Year Rate Reset Series AL .350000 5.60% 2.67% February 24, 2014 November 3, 2008 25.00 Not convertible Not convertibleNon-cumulative, 5-Year Rate Reset Series AN .390625 6.25% 3.50% February 24, 2014 December 8, 2008 25.00 Not convertible Not convertibleNon-cumulative, 5-Year Rate Reset Series AP .390625 6.25% 4.19% February 24, 2014 January 14, 2009 25.00 Not convertible Not convertibleNon-cumulative, 5-Year Rate Reset Series AR .390625 6.25% 4.50% February 24, 2014 January 29, 2009 25.00 Not convertible Not convertibleNon-cumulative, 5-Year Rate Reset Series AT .390625 6.25% 4.06% August 24, 2014 March 9, 2009 25.00 Not convertible Not convertibleNon-cumulative, 5-Year Rate Reset Series AV .390625 6.25% 4.42% August 24, 2014 April 1, 2009 25.00 Not convertible Not convertibleNon-cumulative, 5-Year Rate Reset Series AX .381250 6.10% 4.13% November 24, 2014 April 29, 2009 25.00 Not convertible Not convertible
(1) Non-cumulative preferential dividends on Series W, AA, AB, AC, AD, AE, AF, AG, AH, AJ,AL, AN, AP, AR, AT, AV and AX are payable quarterly, as and when declared by the Boardof Directors, on or about the 24th day of February, May, August and November.
(2) The redemption price represents the price as at October 31, 2010 or the contractualredemption price, whichever is applicable. Subject to the consent of OSFI and therequirements of the Act, we may, on or after the dates specified above, redeem FirstPreferred Shares. These may be redeemed for cash, in the case of Series W, at a priceper share of $26, if redeemed during the 12 months commencing February 24, 2010,and decreasing by $.25 each 12-month period thereafter to a price per share of $25 ifredeemed on or after February 24, 2014; and in the case of Series AA, at a price pershare of $26, if redeemed during the 12 months commencing May 24, 2011, anddecreasing by $.25 each 12- month period thereafter to a price per share of $25 ifredeemed on or after May 24, 2015; and in the case of Series AB, at a price per share of$26, if redeemed during the 12 months commencing August 24, 2011, and decreasingby $.25 each 12-month period thereafter to a price per share of $25 if redeemed on orafter August 24, 2015; and in the case of Series AC, at a price per share of $26, ifredeemed during the 12 months commencing November 24, 2011, and decreasing by$.25 each 12- month period thereafter to a price per share of $25 if redeemed on orafter November 24, 2015; and in the case of Series AD, at a price per share of $26, ifredeemed during the 12 months commencing February 24, 2012, and decreasing by$.25 each 12- month period thereafter to a price per share of $25 if redeemed on orafter February 24, 2016; and in the case of Series AE, at a price per share of $26, ifredeemed during the 12 months commencing February 24, 2012, and decreasing by$.25 each 12- month period thereafter to a price per share of $25 if redeemed on orafter February 24, 2016; and in the case of Series AF, at a price per share of $26, ifredeemed during the 12 months commencing May 24, 2012, and decreasing by $.25each 12- month period thereafter to a price per share of $25 if redeemed on or afterMay 24, 2016; and in the case of Series AG, at a price per share of $26, if redeemedduring the 12 months commencing May 24, 2012, and decreasing by $.25 each12-month period thereafter to a price per share of $25 if redeemed on or after May 24,2016; and in the case of Series AH, at a price per share of $26, if redeemed during the12 months commencing May 24, 2013, and decreasing by $.25 each 12- month period
thereafter to a price per share of $25 if redeemed on or after May 24, 2017; and in thecase of Series AJ, at a price per share of $25, if redeemed on February 24, 2014 and oneach February 24 every fifth year thereafter; and in the case of Series AL, at a price pershare of $25, if redeemed on February 24, 2014 and on each February 24 every fifth yearthereafter; and in the case of Series AN, at a price per share of $25, if redeemed onFebruary 24, 2014 and on each February 24 every fifth year thereafter; and in the case ofSeries AP, at a price per share of $25, if redeemed on February 24, 2014 and on eachFebruary 24 every fifth year thereafter; and in the case of Series AR, at a price per shareof $25, if redeemed on February 24, 2014 and on each February 24 every fifth yearthereafter; and in the case of Series AT, at a price per share of $25, if redeemed onAugust 24, 2014 and on each August 24 every fifth year thereafter; and in the case ofSeries AV, at a price per share of $25, if redeemed on August 24, 2014 and on eachAugust 24 every fifth year thereafter; and in the case of Series AX, at a price per share of$25, if redeemed on November 24, 2014 and on each November 24 every fifth yearthereafter.
(3) Subject to the consent of OSFI and the requirements of the Act, we may purchase theFirst Preferred Shares W, AA, AB, AC, AD, AE, AF, AG, AH, AJ, AL, AN, AP, AR, AT, AV andAX for cancellation at the lowest price or prices at which, in the opinion of the Board ofDirectors, such shares are obtainable.
(4) Subject to the approval of the Toronto Stock Exchange, we may, on or after the datesspecified above, convert First Preferred Shares Series W into our common shares. FirstPreferred Shares may be converted into that number of common shares determined bydividing the then-applicable redemption price by the greater of $2.50 and 95% of theweighted average trading price of common shares at such time.
(5) The conversion date refers to the date of conversion to common shares.(6) The dividend rate will reset on the earliest redemption date and every fifth year
thereafter at a rate equal to the 5-year Government of Canada bond yield plus thepremium indicated. The holders have the option to convert their shares intonon-cumulative floating rate First Preferred Shares subject to certain conditions on theearliest redemption date and every fifth year thereafter at a rate equal to the three-month Government of Canada Treasury Bill rate plus the premium indicated.
Restrictions on the payment of dividendsWe are prohibited by the Act from declaring any dividends on ourpreferred or common shares when we are, or would be placed as aresult of the declaration, in contravention of the capital adequacy andliquidity regulations or any regulatory directives issued under the Act.We may not pay dividends on our common shares at any time unlessall dividends to which preferred shareholders are then entitled havebeen declared and paid or set apart for payment.
We have agreed that if Trust or Trust II fail to pay any requireddistribution on the trust capital securities in full, we will not declaredividends of any kind on any of our preferred or common shares.Refer to Note 17.
Currently, these limitations do not restrict the payment ofdividends on our preferred or common shares.
We have also agreed that if, on any day we report financialresults for a quarter, (i) we report a cumulative consolidated net lossfor the immediately preceding four quarters; and (ii) during theimmediately preceding quarter we fail to declare any cash dividendson all of our outstanding preferred and common shares, we may deferpayments of interest on the Series 2014-1 Reset Subordinated Notes(matures on June 18, 2103). During any period while interest is beingdeferred, (i) interest will accrue on these notes but will notcompound; (ii) we may not declare or pay dividends (except by way ofstock dividend) on, or redeem or repurchase, any of our preferred orcommon shares; and (iii) we may not make any payment of interest,
principal or premium on any debt securities or indebtedness forborrowed money issued or incurred by us that rank subordinate tothese notes.
Dividend reinvestment planOur dividend reinvestment plan (plan) provides registered commonshareholders with a means to receive additional common sharesrather than cash dividends. The plan is only open to registeredshareholders residing in Canada or the United States.
Management has the flexibility to fund the plan through openmarket share purchases or treasury issuances.
Shares available for future issuancesAs at October 31, 2010, 57.5 million common shares are available forfuture issue relating to our dividend reinvestment plan and potentialexercise of stock options outstanding. In addition, we may issue up to40 million shares from treasury under the RBC Umbrella Savings andSecurities Purchase Plan that was approved by shareholders onFebruary 26, 2009.
Consolidated Financial Statements Royal Bank of Canada: Annual Report 2010 115

Note 18 Preferred share liabilities and share capital (continued)
Normal Course Issuer BidDetails of common shares repurchased under NCIBs during 2010, 2009 and 2008 are given below.
2010 2009 2008
NCIB period
Number ofshares
eligible forrepurchase
(000s)
Number ofshares
repurchased(000s)
Averagecost per
share Amount
Number ofshares
eligible forrepurchase
(000s)
Number ofshares
repurchased(000s)
Averagecost per
share Amount
Number ofshares
eligible forrepurchase
(000s)
Number ofshares
repurchased(000s)
Averagecost per
share AmountNovember 1, 2009 –
October 31, 2010 20,000 – $ – $ – – – $ – $ – – – $ – $ –November 1, 2008 –
October 31, 2009 – – – – 20,000 – – – – – – –November 1, 2007 –
October 31, 2008 – – – – – – – – 20,000 1,120 49.50 55
Note 19 Non-controlling interest in subsidiaries
2010 2009
RBC Trust Capital Securities (TruCS)– Series 2015 $ 1,219 $ 1,219– Series 2008-1 511 506
Consolidated VIEs 163 7Others 363 339
$ 2,256 $ 2,071
We consolidate VIEs in which we are the Primary Beneficiary. TheseVIEs include structured finance VIEs, investment funds, andcompensation vehicles as described in Note 6.
We issued RBC TruCS Series 2015 in 2005 and Series 2008-1 in2008 which are reported as Non-controlling interest in subsidiariesupon consolidation as discussed in Note 17. As at October 31, 2010,$20 million (2009 – $20 million) of accrued interest was included inRBC TruCS Series 2015. Series 2008-1 includes $11 million (2009 –$11 million) of accrued interest, net of $nil (2009 – $5 million) oftreasury holdings.
Note 20 Pensions and other post-employment benefits
We offer a number of defined benefit and defined contribution plans,which provide pension and post-employment benefits to eligibleemployees. Our defined benefit pension plans provide benefits basedon years of service, contributions and average earnings at retirement.Our other post-employment benefit plans include health, dental,disability and life insurance coverage.
We fund our registered defined benefit pension plans inaccordance with actuarially determined amounts required to satisfyemployee benefit obligations under current pension regulations. Forour principal pension plans, the most recent actuarial valuationperformed for funding purposes was completed on January 1, 2010.Based on the results of this valuation, we increased our pension plan
contributions for 2010 for an amount that is in excess of the minimumfunding requirement set by pension regulators.
For 2010, total contributions to our pension and other post-employment benefit plans were $1,318 million and $43 million(2009 – $757 million and $40 million), respectively. For 2011, totalcontributions to pension plans and other post-employment benefitplans are expected to be approximately $276 million and $51 million,respectively. For our principal pension plans, the next actuarialvaluation for funding purposes will be completed on January 1, 2011.
For financial reporting purposes, we measure our benefitobligations and pension plan assets as at September 30 each year.
116 Royal Bank of Canada: Annual Report 2010 Consolidated Financial Statements

The following tables present financial information related to all of our material pension and other post-employment plans worldwide, includingexecutive retirement arrangements.
Plan assets, benefit obligation and funded statusPension plans (1) Other post-employment plans (2)
2010 2009 2010 2009
Change in fair value of plan assetsOpening fair value of plan assets $ 6,343 $ 5,826 $ 26 $ 41Actual return on plan assets 644 272 1 1Company contributions (3) 1,288 610 43 40Plan participant contributions 33 31 8 7Benefits paid (369) (353) (66) (65)Other (3) 7 1 2Change in foreign currency exchange rate (39) (50) – –
Closing fair value of plan assets $ 7,897 $ 6,343 $ 13 $ 26
Change in benefit obligationOpening benefit obligation $ 6,783 $ 6,214 $ 1,324 $ 1,315Service cost 151 141 19 14Interest cost 425 413 83 87Plan participant contributions 33 31 8 7Actuarial (gain) loss 1,118 389 60 (27)Benefits paid (369) (353) (66) (65)Plan amendments and curtailments 1 (1) – –Other (7) 9 1 2Change in foreign currency exchange rate (51) (60) (5) (9)
Closing benefit obligation $ 8,084 $ 6,783 $ 1,424 $ 1,324
Funded statusExcess of benefit obligation over plan assets $ (187) $ (440) $ (1,411) $ (1,298)Unrecognized net actuarial loss 2,082 1,276 237 206Unrecognized transitional (asset) obligation (4) (6) 1 1Unrecognized prior service cost 27 44 (236) (259)Contributions between September 30 and October 31 (3) 3 65 3 3
Prepaid asset (accrued liability) as at October 31 $ 1,921 $ 939 $ (1,406) $ (1,347)
Amounts recognized in our Consolidated Balance Sheets consist of:Other assets $ 1,992 $ 1,028 $ – $ –Other liabilities (71) (89) (1,406) (1,347)
Net amount recognized as at October 31 $ 1,921 $ 939 $ (1,406) $ (1,347)
Weighted average assumptions to calculate benefit obligationDiscount rate 5.20% 6.40% 5.25% 6.39%Rate of increase in future compensation 3.30% 3.30% 3.30% 3.30%
(1) For pension plans with funding deficits, the benefit obligations and fair values of plan assets totalled $7.3 billion (2009 – $6.1 billion) and $7.0 billion (2009 – $5.4 billion), respectively.(2) For our other post-employment plans, the assumed healthcare cost trend rates for the next year used to measure the expected cost of benefits covered by the post-employment health and life
plans were 5.3% for medical decreasing to an ultimate rate of 3.3% in 2026 and 4.1% for dental decreasing to an ultimate rate of 4.0% in 2011.(3) As our measurement date of the pension and other post-employment plans is September 30, company contributions in the above table represent contributions from October 1, 2009 to
September 30, 2010. In order to arrive at the total contributions for the year ended October 31, 2010, this amount should be adjusted for the contributions made in the month of October aswell as the defined contribution pension expense presented in the Pension benefit expense table.
Benefits payment projection for defined benefit pension and otherpost-employment plans
Pension plansOther post-
employment plans
2011 400 702012 407 722013 418 752014 431 792015 444 822016-2020 2,395 462
Composition of defined benefit pension plan assetsThe defined benefit pension plan assets are composed of adiversified mix of equity, fixed income and alternative securitiesincluding investments in hedge fund of funds, multi-strategy hedgefunds and infrastructure. The equity securities include 1.2 million(2009 – 1.4 million) of our common shares having a fair value of
$67 million (2009 – $80 million). Dividends amounting to $3 million(2009 – $2 million) were received on our common shares held in theplan assets during the year.
The following table presents the allocation of the plan assets bysecurities category.
Asset allocations of defined benefit pension plans (1)
2010 2009Target Actual Target Actual
Equity securities 41% 44% 48% 49%Debt securities 41% 43% 47% 45%Other 18% 13% 5% 6%
Total 100% 100% 100% 100%
(1) Target asset allocation of the pension plans is based on the Canadian principal plans,the assets of which represent 88% of the total assets of all the plans.
Consolidated Financial Statements Royal Bank of Canada: Annual Report 2010 117
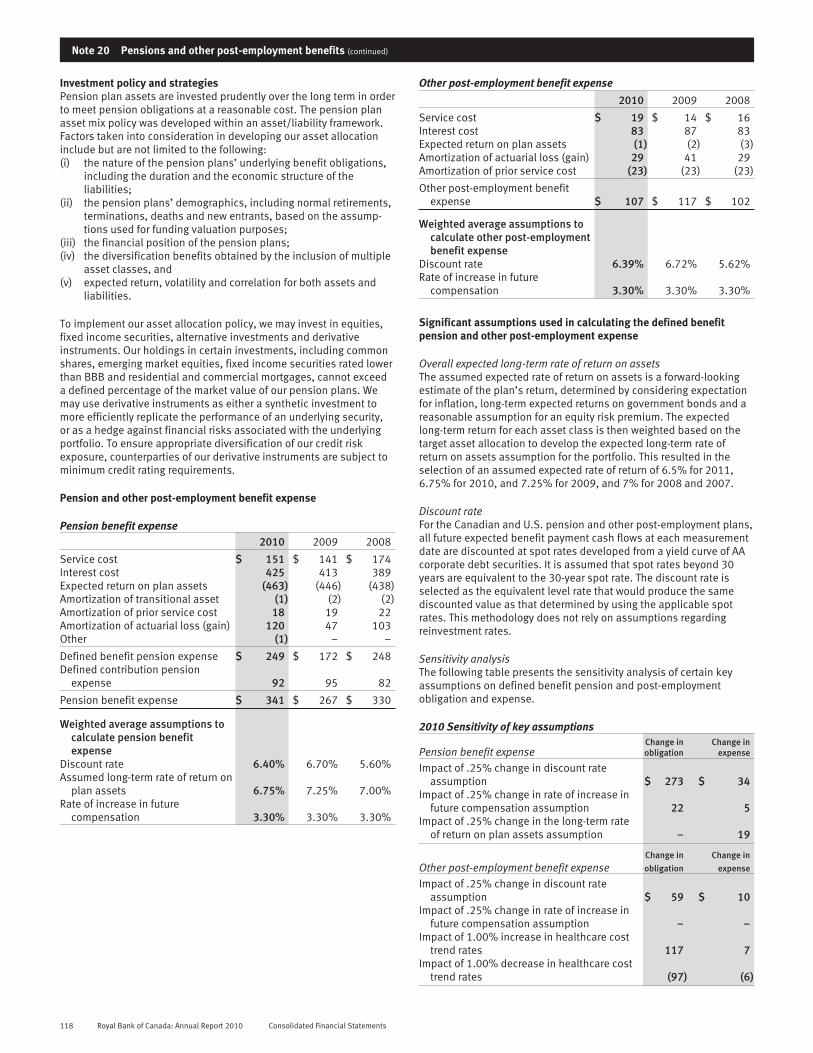
Note 20 Pensions and other post-employment benefits (continued)
Investment policy and strategiesPension plan assets are invested prudently over the long term in orderto meet pension obligations at a reasonable cost. The pension planasset mix policy was developed within an asset/liability framework.Factors taken into consideration in developing our asset allocationinclude but are not limited to the following:(i) the nature of the pension plans’ underlying benefit obligations,
including the duration and the economic structure of theliabilities;
(ii) the pension plans’ demographics, including normal retirements,terminations, deaths and new entrants, based on the assump-tions used for funding valuation purposes;
(iii) the financial position of the pension plans;(iv) the diversification benefits obtained by the inclusion of multiple
asset classes, and(v) expected return, volatility and correlation for both assets and
liabilities.
To implement our asset allocation policy, we may invest in equities,fixed income securities, alternative investments and derivativeinstruments. Our holdings in certain investments, including commonshares, emerging market equities, fixed income securities rated lowerthan BBB and residential and commercial mortgages, cannot exceeda defined percentage of the market value of our pension plans. Wemay use derivative instruments as either a synthetic investment tomore efficiently replicate the performance of an underlying security,or as a hedge against financial risks associated with the underlyingportfolio. To ensure appropriate diversification of our credit riskexposure, counterparties of our derivative instruments are subject tominimum credit rating requirements.
Pension and other post-employment benefit expense
Pension benefit expense2010 2009 2008
Service cost $ 151 $ 141 $ 174Interest cost 425 413 389Expected return on plan assets (463) (446) (438)Amortization of transitional asset (1) (2) (2)Amortization of prior service cost 18 19 22Amortization of actuarial loss (gain) 120 47 103Other (1) – –
Defined benefit pension expense $ 249 $ 172 $ 248Defined contribution pension
expense 92 95 82
Pension benefit expense $ 341 $ 267 $ 330
Weighted average assumptions tocalculate pension benefitexpense
Discount rate 6.40% 6.70% 5.60%Assumed long-term rate of return on
plan assets 6.75% 7.25% 7.00%Rate of increase in future
compensation 3.30% 3.30% 3.30%
Other post-employment benefit expense
2010 2009 2008
Service cost $ 19 $ 14 $ 16Interest cost 83 87 83Expected return on plan assets (1) (2) (3)Amortization of actuarial loss (gain) 29 41 29Amortization of prior service cost (23) (23) (23)
Other post-employment benefitexpense $ 107 $ 117 $ 102
Weighted average assumptions tocalculate other post-employmentbenefit expense
Discount rate 6.39% 6.72% 5.62%Rate of increase in future
compensation 3.30% 3.30% 3.30%
Significant assumptions used in calculating the defined benefitpension and other post-employment expense
Overall expected long-term rate of return on assetsThe assumed expected rate of return on assets is a forward-lookingestimate of the plan’s return, determined by considering expectationfor inflation, long-term expected returns on government bonds and areasonable assumption for an equity risk premium. The expectedlong-term return for each asset class is then weighted based on thetarget asset allocation to develop the expected long-term rate ofreturn on assets assumption for the portfolio. This resulted in theselection of an assumed expected rate of return of 6.5% for 2011,6.75% for 2010, and 7.25% for 2009, and 7% for 2008 and 2007.
Discount rateFor the Canadian and U.S. pension and other post-employment plans,all future expected benefit payment cash flows at each measurementdate are discounted at spot rates developed from a yield curve of AAcorporate debt securities. It is assumed that spot rates beyond 30years are equivalent to the 30-year spot rate. The discount rate isselected as the equivalent level rate that would produce the samediscounted value as that determined by using the applicable spotrates. This methodology does not rely on assumptions regardingreinvestment rates.
Sensitivity analysisThe following table presents the sensitivity analysis of certain keyassumptions on defined benefit pension and post-employmentobligation and expense.
2010 Sensitivity of key assumptions
Pension benefit expenseChange inobligation
Change inexpense
Impact of .25% change in discount rateassumption $ 273 $ 34
Impact of .25% change in rate of increase infuture compensation assumption 22 5
Impact of .25% change in the long-term rateof return on plan assets assumption – 19
Other post-employment benefit expenseChange inobligation
Change inexpense
Impact of .25% change in discount rateassumption $ 59 $ 10
Impact of .25% change in rate of increase infuture compensation assumption – –
Impact of 1.00% increase in healthcare costtrend rates 117 7
Impact of 1.00% decrease in healthcare costtrend rates (97) (6)
118 Royal Bank of Canada: Annual Report 2010 Consolidated Financial Statements
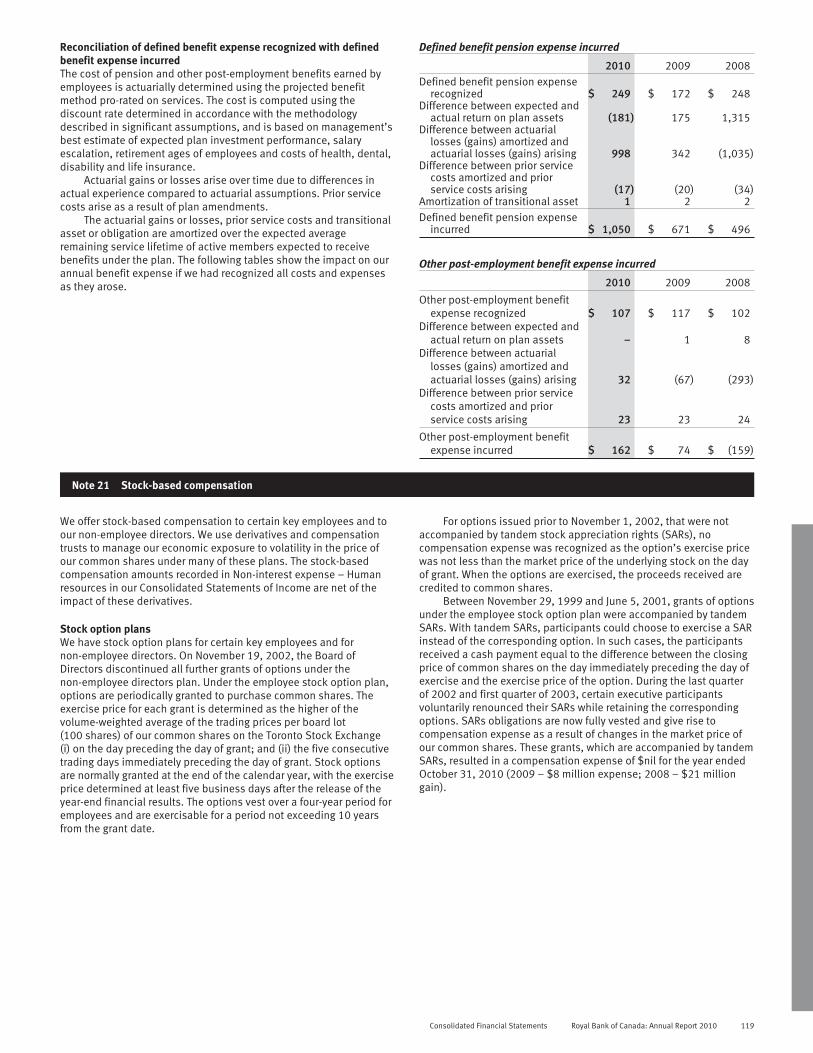
Reconciliation of defined benefit expense recognized with definedbenefit expense incurredThe cost of pension and other post-employment benefits earned byemployees is actuarially determined using the projected benefitmethod pro-rated on services. The cost is computed using thediscount rate determined in accordance with the methodologydescribed in significant assumptions, and is based on management’sbest estimate of expected plan investment performance, salaryescalation, retirement ages of employees and costs of health, dental,disability and life insurance.
Actuarial gains or losses arise over time due to differences inactual experience compared to actuarial assumptions. Prior servicecosts arise as a result of plan amendments.
The actuarial gains or losses, prior service costs and transitionalasset or obligation are amortized over the expected averageremaining service lifetime of active members expected to receivebenefits under the plan. The following tables show the impact on ourannual benefit expense if we had recognized all costs and expensesas they arose.
Defined benefit pension expense incurred
2010 2009 2008Defined benefit pension expense
recognized $ 249 $ 172 $ 248Difference between expected and
actual return on plan assets (181) 175 1,315Difference between actuarial
losses (gains) amortized andactuarial losses (gains) arising 998 342 (1,035)
Difference between prior servicecosts amortized and priorservice costs arising (17) (20) (34)
Amortization of transitional asset 1 2 2Defined benefit pension expense
incurred $ 1,050 $ 671 $ 496
Other post-employment benefit expense incurred
2010 2009 2008
Other post-employment benefitexpense recognized $ 107 $ 117 $ 102
Difference between expected andactual return on plan assets – 1 8
Difference between actuariallosses (gains) amortized andactuarial losses (gains) arising 32 (67) (293)
Difference between prior servicecosts amortized and priorservice costs arising 23 23 24
Other post-employment benefitexpense incurred $ 162 $ 74 $ (159)
Note 21 Stock-based compensation
We offer stock-based compensation to certain key employees and toour non-employee directors. We use derivatives and compensationtrusts to manage our economic exposure to volatility in the price ofour common shares under many of these plans. The stock-basedcompensation amounts recorded in Non-interest expense – Humanresources in our Consolidated Statements of Income are net of theimpact of these derivatives.
Stock option plansWe have stock option plans for certain key employees and fornon-employee directors. On November 19, 2002, the Board ofDirectors discontinued all further grants of options under thenon-employee directors plan. Under the employee stock option plan,options are periodically granted to purchase common shares. Theexercise price for each grant is determined as the higher of thevolume-weighted average of the trading prices per board lot(100 shares) of our common shares on the Toronto Stock Exchange(i) on the day preceding the day of grant; and (ii) the five consecutivetrading days immediately preceding the day of grant. Stock optionsare normally granted at the end of the calendar year, with the exerciseprice determined at least five business days after the release of theyear-end financial results. The options vest over a four-year period foremployees and are exercisable for a period not exceeding 10 yearsfrom the grant date.
For options issued prior to November 1, 2002, that were notaccompanied by tandem stock appreciation rights (SARs), nocompensation expense was recognized as the option’s exercise pricewas not less than the market price of the underlying stock on the dayof grant. When the options are exercised, the proceeds received arecredited to common shares.
Between November 29, 1999 and June 5, 2001, grants of optionsunder the employee stock option plan were accompanied by tandemSARs. With tandem SARs, participants could choose to exercise a SARinstead of the corresponding option. In such cases, the participantsreceived a cash payment equal to the difference between the closingprice of common shares on the day immediately preceding the day ofexercise and the exercise price of the option. During the last quarterof 2002 and first quarter of 2003, certain executive participantsvoluntarily renounced their SARs while retaining the correspondingoptions. SARs obligations are now fully vested and give rise tocompensation expense as a result of changes in the market price ofour common shares. These grants, which are accompanied by tandemSARs, resulted in a compensation expense of $nil for the year endedOctober 31, 2010 (2009 – $8 million expense; 2008 – $21 milliongain).
Consolidated Financial Statements Royal Bank of Canada: Annual Report 2010 119
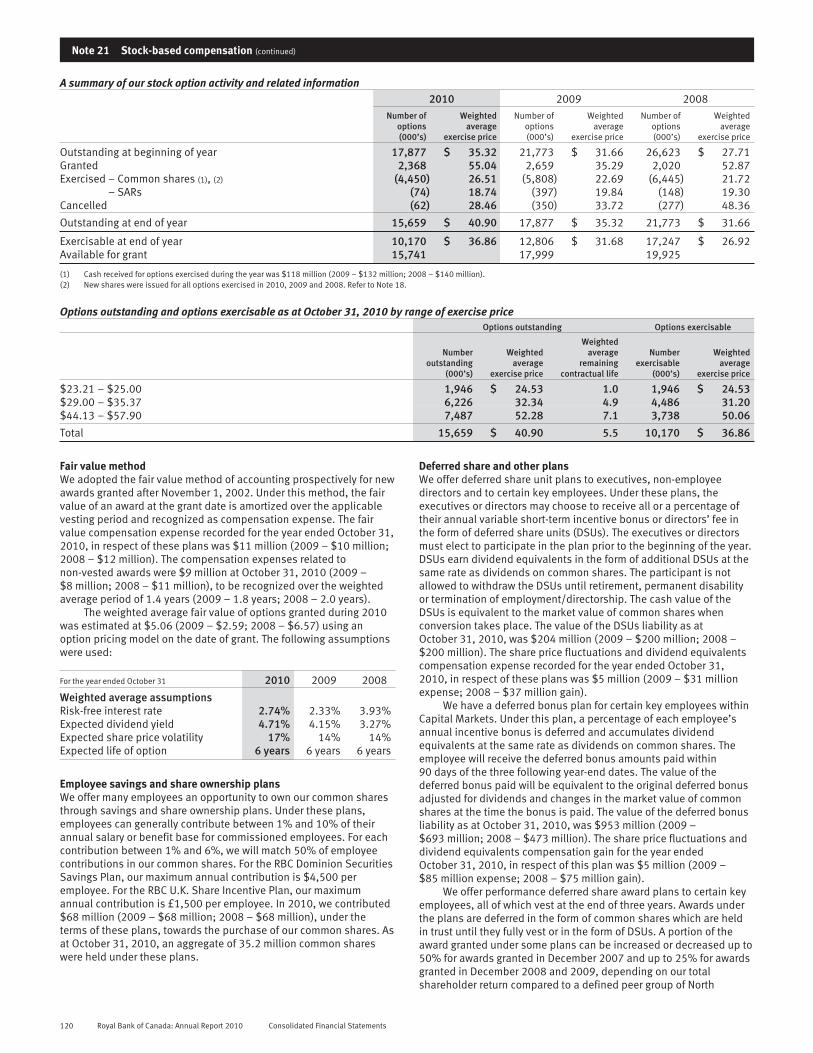
Note 21 Stock-based compensation (continued)
A summary of our stock option activity and related information2010 2009 2008
Number ofoptions(000’s)
Weightedaverage
exercise price
Number ofoptions(000’s)
Weightedaverage
exercise price
Number ofoptions(000’s)
Weightedaverage
exercise price
Outstanding at beginning of year 17,877 $ 35.32 21,773 $ 31.66 26,623 $ 27.71Granted 2,368 55.04 2,659 35.29 2,020 52.87Exercised – Common shares (1), (2) (4,450) 26.51 (5,808) 22.69 (6,445) 21.72
– SARs (74) 18.74 (397) 19.84 (148) 19.30Cancelled (62) 28.46 (350) 33.72 (277) 48.36
Outstanding at end of year 15,659 $ 40.90 17,877 $ 35.32 21,773 $ 31.66
Exercisable at end of year 10,170 $ 36.86 12,806 $ 31.68 17,247 $ 26.92Available for grant 15,741 17,999 19,925
(1) Cash received for options exercised during the year was $118 million (2009 – $132 million; 2008 – $140 million).(2) New shares were issued for all options exercised in 2010, 2009 and 2008. Refer to Note 18.
Options outstanding and options exercisable as at October 31, 2010 by range of exercise priceOptions outstanding Options exercisable
Numberoutstanding
(000’s)
Weightedaverage
exercise price
Weightedaverage
remainingcontractual life
Numberexercisable
(000’s)
Weightedaverage
exercise price
$23.21 – $25.00 1,946 $ 24.53 1.0 1,946 $ 24.53$29.00 – $35.37 6,226 32.34 4.9 4,486 31.20$44.13 – $57.90 7,487 52.28 7.1 3,738 50.06
Total 15,659 $ 40.90 5.5 10,170 $ 36.86
Fair value methodWe adopted the fair value method of accounting prospectively for newawards granted after November 1, 2002. Under this method, the fairvalue of an award at the grant date is amortized over the applicablevesting period and recognized as compensation expense. The fairvalue compensation expense recorded for the year ended October 31,2010, in respect of these plans was $11 million (2009 – $10 million;2008 – $12 million). The compensation expenses related tonon-vested awards were $9 million at October 31, 2010 (2009 –$8 million; 2008 – $11 million), to be recognized over the weightedaverage period of 1.4 years (2009 – 1.8 years; 2008 – 2.0 years).
The weighted average fair value of options granted during 2010was estimated at $5.06 (2009 – $2.59; 2008 – $6.57) using anoption pricing model on the date of grant. The following assumptionswere used:
For the year ended October 31 2010 2009 2008
Weighted average assumptionsRisk-free interest rate 2.74% 2.33% 3.93%Expected dividend yield 4.71% 4.15% 3.27%Expected share price volatility 17% 14% 14%Expected life of option 6 years 6 years 6 years
Employee savings and share ownership plansWe offer many employees an opportunity to own our common sharesthrough savings and share ownership plans. Under these plans,employees can generally contribute between 1% and 10% of theirannual salary or benefit base for commissioned employees. For eachcontribution between 1% and 6%, we will match 50% of employeecontributions in our common shares. For the RBC Dominion SecuritiesSavings Plan, our maximum annual contribution is $4,500 peremployee. For the RBC U.K. Share Incentive Plan, our maximumannual contribution is £1,500 per employee. In 2010, we contributed$68 million (2009 – $68 million; 2008 – $68 million), under theterms of these plans, towards the purchase of our common shares. Asat October 31, 2010, an aggregate of 35.2 million common shareswere held under these plans.
Deferred share and other plansWe offer deferred share unit plans to executives, non-employeedirectors and to certain key employees. Under these plans, theexecutives or directors may choose to receive all or a percentage oftheir annual variable short-term incentive bonus or directors’ fee inthe form of deferred share units (DSUs). The executives or directorsmust elect to participate in the plan prior to the beginning of the year.DSUs earn dividend equivalents in the form of additional DSUs at thesame rate as dividends on common shares. The participant is notallowed to withdraw the DSUs until retirement, permanent disabilityor termination of employment/directorship. The cash value of theDSUs is equivalent to the market value of common shares whenconversion takes place. The value of the DSUs liability as atOctober 31, 2010, was $204 million (2009 – $200 million; 2008 –$200 million). The share price fluctuations and dividend equivalentscompensation expense recorded for the year ended October 31,2010, in respect of these plans was $5 million (2009 – $31 millionexpense; 2008 – $37 million gain).
We have a deferred bonus plan for certain key employees withinCapital Markets. Under this plan, a percentage of each employee’sannual incentive bonus is deferred and accumulates dividendequivalents at the same rate as dividends on common shares. Theemployee will receive the deferred bonus amounts paid within90 days of the three following year-end dates. The value of thedeferred bonus paid will be equivalent to the original deferred bonusadjusted for dividends and changes in the market value of commonshares at the time the bonus is paid. The value of the deferred bonusliability as at October 31, 2010, was $953 million (2009 –$693 million; 2008 – $473 million). The share price fluctuations anddividend equivalents compensation gain for the year endedOctober 31, 2010, in respect of this plan was $5 million (2009 –$85 million expense; 2008 – $75 million gain).
We offer performance deferred share award plans to certain keyemployees, all of which vest at the end of three years. Awards underthe plans are deferred in the form of common shares which are heldin trust until they fully vest or in the form of DSUs. A portion of theaward granted under some plans can be increased or decreased up to50% for awards granted in December 2007 and up to 25% for awardsgranted in December 2008 and 2009, depending on our totalshareholder return compared to a defined peer group of North
120 Royal Bank of Canada: Annual Report 2010 Consolidated Financial Statements

American financial institutions for awards granted in December 2007and 2008 and to a defined peer group of global financial institutionsfor awards granted in December 2009. The value of the award paidwill be equivalent to the original award adjusted for dividends andchanges in the market value of common shares at the time the awardvests. The number of our common shares held in trust as atOctober 31, 2010, was 1.1 million (2009 – 1.5 million; 2008 –2.0 million). The value of the DSUs liability as at October 31, 2010was $225 million (2009 – $211 million; 2008 – $164 million). Thecompensation expense recorded for the year ended October 31,2010, in respect of these plans was $116 million (2009 –$140 million; 2008 – $96 million).
We maintain a non-qualified deferred compensation plan for keyemployees in the United States. This plan allows eligible employeesto make deferrals of a portion of their annual income and allocate thedeferrals among various fund choices, which include a share unit
fund that tracks the value of our common shares. Certain deferralsmay also be eligible for matching contributions, all of which areallocated to the RBC share unit fund. Our liability for the RBC shareunits held under the plan as at October 31, 2010, was $304 million(2009 – $304 million; 2008 – $244 million). The compensationexpense recorded for the year ended October 31, 2010, was$111 million (2009 – $157 million expense; 2008 – $123 milliongain).
For other stock-based plans, compensation expense of$13 million was recognized for the year ended October 31, 2010(2009 – $14 million; 2008 – $5 million). The liability for the shareunits held under these plans as at October 31, 2010, was $59 million(2009 – $60 million; 2008 – $35 million). The number of our commonshares held under these plans was 0.3 million (2009 – 0.1 million;2008 – 0.2 million).
Note 22 Revenue from trading and selected non-trading financial instruments
Held-for-trading financial instrumentsTotal Trading revenue includes both trading-related net interestincome and trading revenue reported in Non-interest income. Netinterest income arises from interest income and dividends recognizedon trading assets and liabilities. Non-interest income includes a$834 million increase in the fair values of our net financial assetsclassified as held-for-trading for the year ended October 31, 2010(2009 – increased by $2,099 million; 2008 – increased by$548 million).
2010 2009 (1) 2008
Net interest income $ 1,443 $ 2,316 $ 680Non-interest (loss) income 1,315 2,750 (81)
Total $ 2,758 $ 5,066 $ 599
By product lineInterest rate and credit $ 1,992 $ 3,405 $ (250)Equities 351 1,008 265Foreign exchange, commodities,
and precious metals 415 653 584
Total $ 2,758 $ 5,066 $ 599
(1) Certain amounts have been revised from results previously reported. Refer to Change infinancial statement presentation described in Note 1.
Financial instruments designated as held-for-tradingDuring the year, net gains or losses representing net changes in thefair value of financial assets and financial liabilities designated asheld-for-trading increased by $806 million (2009 – increased by$500 million; 2008 – decreased by $340 million).
Financial instruments measured at amortized costNon-interest income reflects the following for financial instrumentsmeasured amortized cost:
2010 2009 2008
Net fee income which does not form anintegral part of the effective interestrate of financial assets and liabilitiesother than held-for-trading $ 3,628 $ 3,505 $ 3,183
Net fee income arising from trust andother fiduciary activities 5,831 5,314 5,405
Net gains arising from financialinstruments measured at amortizedcost 8 7 –
Total $ 9,467 $ 8,826 $ 8,588
Consolidated Financial Statements Royal Bank of Canada: Annual Report 2010 121

Note 23 Income taxes
2010 2009 2008Income taxes (recoveries) in Consolidated
Statements of IncomeCurrent
Canada – Federal $ 829 $ 590 $ 1,350– Provincial 576 491 664
International 456 829 85
1,861 1,910 2,099
FutureCanada – Federal 124 153 (533)
– Provincial 65 90 (211)International (404) (585) 14
(215) (342) (730)
1,646 1,568 1,369
Income taxes (recoveries) in ConsolidatedStatements of Comprehensive Income andChanges in Shareholders’ EquityOther comprehensive income
Net unrealized gains (losses) onavailable-for-sale securities 150 330 (778)
Reclassification of (gains) losses onavailable-for-sale securities to income (55) 165 201
Net foreign currency translation gains(losses), net of hedging activities 676 1,102 (1,361)
Net unrealized (losses) gains onderivatives designated as cash flowhedges (144) 69 (304)
Reclassification of losses (gains) onderivatives designated as cash flowhedges to income 36 (17) 23
Issuance costs – (34) (6)Stock appreciation rights 17 7 2Other 5 84 (2)
685 1,706 (2,225)
Total income (recoveries) taxes $ 2,331 $ 3,274 $ (856)
Net future income tax assets are included in Other assets (refer toNote 12) and result from tax loss carryforwards and temporarydifferences between the tax basis of assets and liabilities and theircarrying amounts on our Consolidated Balance Sheets. The tax loss
carryforwards amount included in future income tax assets of $500million (2009 – $325 million) relates to losses in our Canadian,Japanese and U.S. operations which will expire in various years from2011 through 2030. In addition, we have capital losses included inthe tax loss carryforwards amount which will expire in various yearsfrom 2012 through 2016.
Our review regarding the realizability of our future tax assets asat October 31, 2010 included an assessment of the tax benefitassociated with our U.S. banking operations, which is currentlygenerating negative earnings and contributing to the body of negativeevidence. Based on our review, we concluded that there is sufficientpositive evidence to overcome the negative evidence that the futuretax asset associated with our U.S. banking operations is realizable.Overall, we believe that, based on all available evidence, it is morelikely than not that the future income tax assets will be realizedthrough a combination of future reversals of temporary differencesand taxable income.
Sources of future income taxes
2010 2009Future income tax asset
Allowance for credit losses $ 744 $ 871Deferred compensation 864 775Business realignment charges – 4Tax loss carryforwards 500 325Deferred income 67 112Enron-litigation provision – 26Other comprehensive income 52 112Other 426 565
2,653 2,790Valuation allowance (130) (87)
2,523 2,703
Future income tax liabilityPremises and equipment (187) (172)Deferred expense (61) (117)Pension related (144) (48)Intangibles (82) (196)Other (401) (444)
(875) (977)
Net future income tax asset $ 1,648 $ 1,726
Reconciliation to statutory tax rate
2010 2009 2008
Income taxes at Canadian statutory tax rate $ 2,111 30.3% $ 1,735 31.4% $ 1,952 32.5%(Decrease) increase in income taxes resulting from Lower average tax rate applicable
to subsidiaries (398) (5.7)% (359) (6.5)% (450) (7.5)%Goodwill impairment charge – –% 314 –% – –%Tax-exempt income from securities (369) (5.3)% (300) (5.4)% (326) (5.4)%Tax rate change – –% – –% 51 .8%Other 302 4.3% 178 3.2% 142 2.4%
Income taxes reported in Consolidated Statements of Income and effective tax rate $ 1,646 23.6% $ 1,568 28.4% $ 1,369 22.8%
International earnings of certain subsidiaries would be taxed onlyupon their repatriation to Canada. We have not recognized a futureincome tax liability for these undistributed earnings as we do notcurrently expect them to be repatriated. Taxes that would be payable
if all foreign subsidiaries’ accumulated unremitted earnings wererepatriated are estimated at $763 million as at October 31, 2010(2009 – $821 million; 2008 – $920 million).
122 Royal Bank of Canada: Annual Report 2010 Consolidated Financial Statements
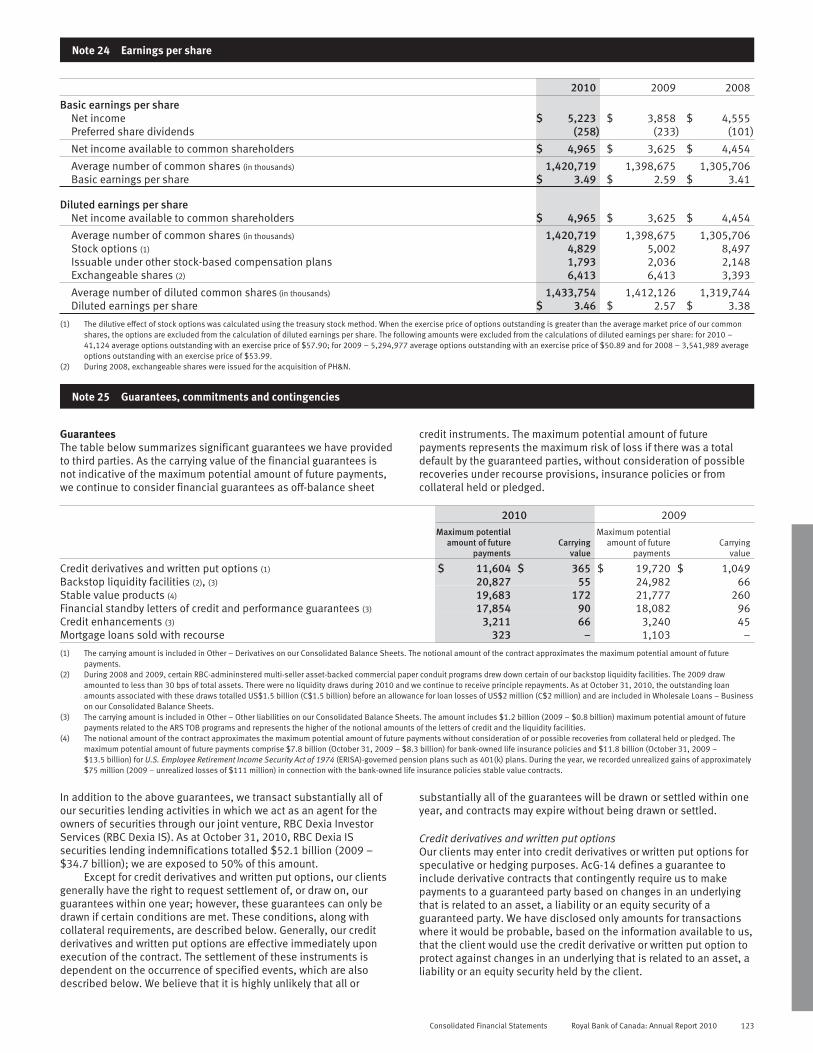
Note 24 Earnings per share
2010 2009 2008
Basic earnings per shareNet income $ 5,223 $ 3,858 $ 4,555Preferred share dividends (258) (233) (101)
Net income available to common shareholders $ 4,965 $ 3,625 $ 4,454
Average number of common shares (in thousands) 1,420,719 1,398,675 1,305,706Basic earnings per share $ 3.49 $ 2.59 $ 3.41
Diluted earnings per shareNet income available to common shareholders $ 4,965 $ 3,625 $ 4,454
Average number of common shares (in thousands) 1,420,719 1,398,675 1,305,706Stock options (1) 4,829 5,002 8,497Issuable under other stock-based compensation plans 1,793 2,036 2,148Exchangeable shares (2) 6,413 6,413 3,393
Average number of diluted common shares (in thousands) 1,433,754 1,412,126 1,319,744Diluted earnings per share $ 3.46 $ 2.57 $ 3.38
(1) The dilutive effect of stock options was calculated using the treasury stock method. When the exercise price of options outstanding is greater than the average market price of our commonshares, the options are excluded from the calculation of diluted earnings per share. The following amounts were excluded from the calculations of diluted earnings per share: for 2010 –41,124 average options outstanding with an exercise price of $57.90; for 2009 – 5,294,977 average options outstanding with an exercise price of $50.89 and for 2008 – 3,541,989 averageoptions outstanding with an exercise price of $53.99.
(2) During 2008, exchangeable shares were issued for the acquisition of PH&N.
Note 25 Guarantees, commitments and contingencies
GuaranteesThe table below summarizes significant guarantees we have providedto third parties. As the carrying value of the financial guarantees isnot indicative of the maximum potential amount of future payments,we continue to consider financial guarantees as off-balance sheet
credit instruments. The maximum potential amount of futurepayments represents the maximum risk of loss if there was a totaldefault by the guaranteed parties, without consideration of possiblerecoveries under recourse provisions, insurance policies or fromcollateral held or pledged.
2010 2009Maximum potential
amount of futurepayments
Carryingvalue
Maximum potentialamount of future
paymentsCarrying
value
Credit derivatives and written put options (1) $ 11,604 $ 365 $ 19,720 $ 1,049Backstop liquidity facilities (2), (3) 20,827 55 24,982 66Stable value products (4) 19,683 172 21,777 260Financial standby letters of credit and performance guarantees (3) 17,854 90 18,082 96Credit enhancements (3) 3,211 66 3,240 45Mortgage loans sold with recourse 323 – 1,103 –
(1) The carrying amount is included in Other – Derivatives on our Consolidated Balance Sheets. The notional amount of the contract approximates the maximum potential amount of futurepayments.
(2) During 2008 and 2009, certain RBC-admininstered multi-seller asset-backed commercial paper conduit programs drew down certain of our backstop liquidity facilities. The 2009 drawamounted to less than 30 bps of total assets. There were no liquidity draws during 2010 and we continue to receive principle repayments. As at October 31, 2010, the outstanding loanamounts associated with these draws totalled US$1.5 billion (C$1.5 billion) before an allowance for loan losses of US$2 million (C$2 million) and are included in Wholesale Loans – Businesson our Consolidated Balance Sheets.
(3) The carrying amount is included in Other – Other liabilities on our Consolidated Balance Sheets. The amount includes $1.2 billion (2009 – $0.8 billion) maximum potential amount of futurepayments related to the ARS TOB programs and represents the higher of the notional amounts of the letters of credit and the liquidity facilities.
(4) The notional amount of the contract approximates the maximum potential amount of future payments without consideration of or possible recoveries from collateral held or pledged. Themaximum potential amount of future payments comprise $7.8 billion (October 31, 2009 – $8.3 billion) for bank-owned life insurance policies and $11.8 billion (October 31, 2009 –$13.5 billion) for U.S. Employee Retirement Income Security Act of 1974 (ERISA)-governed pension plans such as 401(k) plans. During the year, we recorded unrealized gains of approximately$75 million (2009 – unrealized losses of $111 million) in connection with the bank-owned life insurance policies stable value contracts.
In addition to the above guarantees, we transact substantially all ofour securities lending activities in which we act as an agent for theowners of securities through our joint venture, RBC Dexia InvestorServices (RBC Dexia IS). As at October 31, 2010, RBC Dexia ISsecurities lending indemnifications totalled $52.1 billion (2009 –$34.7 billion); we are exposed to 50% of this amount.
Except for credit derivatives and written put options, our clientsgenerally have the right to request settlement of, or draw on, ourguarantees within one year; however, these guarantees can only bedrawn if certain conditions are met. These conditions, along withcollateral requirements, are described below. Generally, our creditderivatives and written put options are effective immediately uponexecution of the contract. The settlement of these instruments isdependent on the occurrence of specified events, which are alsodescribed below. We believe that it is highly unlikely that all or
substantially all of the guarantees will be drawn or settled within oneyear, and contracts may expire without being drawn or settled.
Credit derivatives and written put optionsOur clients may enter into credit derivatives or written put options forspeculative or hedging purposes. AcG-14 defines a guarantee toinclude derivative contracts that contingently require us to makepayments to a guaranteed party based on changes in an underlyingthat is related to an asset, a liability or an equity security of aguaranteed party. We have disclosed only amounts for transactionswhere it would be probable, based on the information available to us,that the client would use the credit derivative or written put option toprotect against changes in an underlying that is related to an asset, aliability or an equity security held by the client.
Consolidated Financial Statements Royal Bank of Canada: Annual Report 2010 123
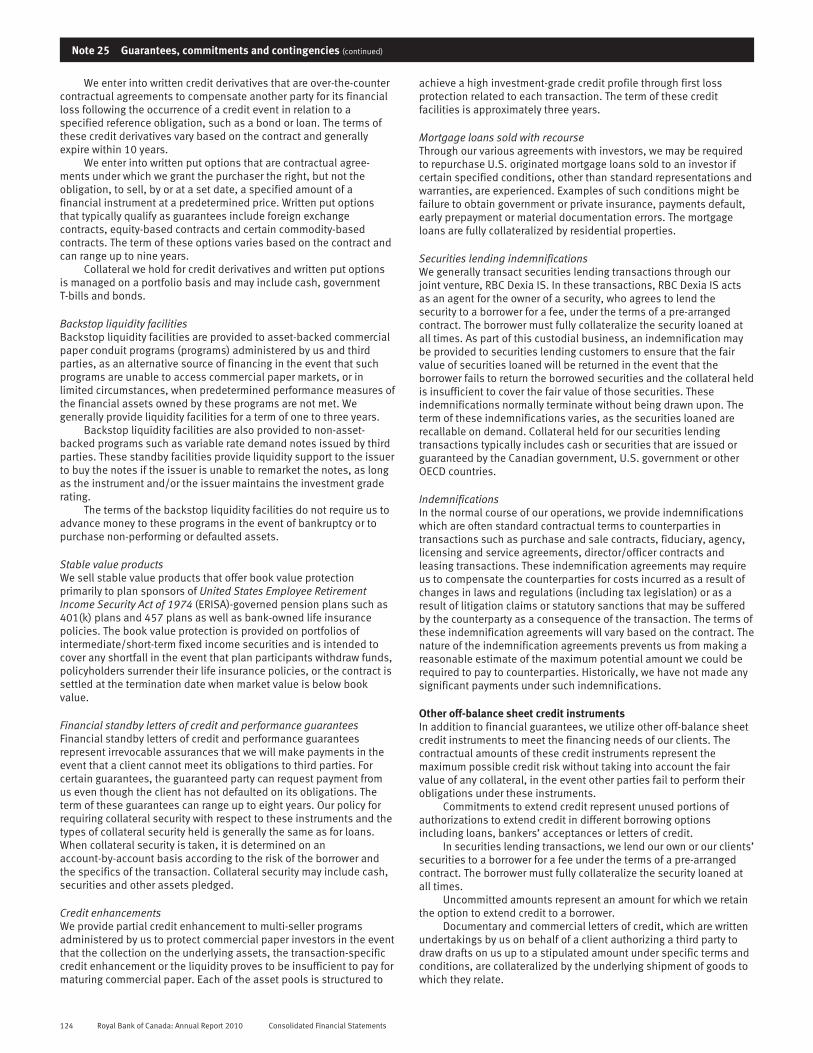
Note 25 Guarantees, commitments and contingencies (continued)
We enter into written credit derivatives that are over-the-countercontractual agreements to compensate another party for its financialloss following the occurrence of a credit event in relation to aspecified reference obligation, such as a bond or loan. The terms ofthese credit derivatives vary based on the contract and generallyexpire within 10 years.
We enter into written put options that are contractual agree-ments under which we grant the purchaser the right, but not theobligation, to sell, by or at a set date, a specified amount of afinancial instrument at a predetermined price. Written put optionsthat typically qualify as guarantees include foreign exchangecontracts, equity-based contracts and certain commodity-basedcontracts. The term of these options varies based on the contract andcan range up to nine years.
Collateral we hold for credit derivatives and written put optionsis managed on a portfolio basis and may include cash, governmentT-bills and bonds.
Backstop liquidity facilitiesBackstop liquidity facilities are provided to asset-backed commercialpaper conduit programs (programs) administered by us and thirdparties, as an alternative source of financing in the event that suchprograms are unable to access commercial paper markets, or inlimited circumstances, when predetermined performance measures ofthe financial assets owned by these programs are not met. Wegenerally provide liquidity facilities for a term of one to three years.
Backstop liquidity facilities are also provided to non-asset-backed programs such as variable rate demand notes issued by thirdparties. These standby facilities provide liquidity support to the issuerto buy the notes if the issuer is unable to remarket the notes, as longas the instrument and/or the issuer maintains the investment graderating.
The terms of the backstop liquidity facilities do not require us toadvance money to these programs in the event of bankruptcy or topurchase non-performing or defaulted assets.
Stable value productsWe sell stable value products that offer book value protectionprimarily to plan sponsors of United States Employee RetirementIncome Security Act of 1974 (ERISA)-governed pension plans such as401(k) plans and 457 plans as well as bank-owned life insurancepolicies. The book value protection is provided on portfolios ofintermediate/short-term fixed income securities and is intended tocover any shortfall in the event that plan participants withdraw funds,policyholders surrender their life insurance policies, or the contract issettled at the termination date when market value is below bookvalue.
Financial standby letters of credit and performance guaranteesFinancial standby letters of credit and performance guaranteesrepresent irrevocable assurances that we will make payments in theevent that a client cannot meet its obligations to third parties. Forcertain guarantees, the guaranteed party can request payment fromus even though the client has not defaulted on its obligations. Theterm of these guarantees can range up to eight years. Our policy forrequiring collateral security with respect to these instruments and thetypes of collateral security held is generally the same as for loans.When collateral security is taken, it is determined on anaccount-by-account basis according to the risk of the borrower andthe specifics of the transaction. Collateral security may include cash,securities and other assets pledged.
Credit enhancementsWe provide partial credit enhancement to multi-seller programsadministered by us to protect commercial paper investors in the eventthat the collection on the underlying assets, the transaction-specificcredit enhancement or the liquidity proves to be insufficient to pay formaturing commercial paper. Each of the asset pools is structured to
achieve a high investment-grade credit profile through first lossprotection related to each transaction. The term of these creditfacilities is approximately three years.
Mortgage loans sold with recourseThrough our various agreements with investors, we may be requiredto repurchase U.S. originated mortgage loans sold to an investor ifcertain specified conditions, other than standard representations andwarranties, are experienced. Examples of such conditions might befailure to obtain government or private insurance, payments default,early prepayment or material documentation errors. The mortgageloans are fully collateralized by residential properties.
Securities lending indemnificationsWe generally transact securities lending transactions through ourjoint venture, RBC Dexia IS. In these transactions, RBC Dexia IS actsas an agent for the owner of a security, who agrees to lend thesecurity to a borrower for a fee, under the terms of a pre-arrangedcontract. The borrower must fully collateralize the security loaned atall times. As part of this custodial business, an indemnification maybe provided to securities lending customers to ensure that the fairvalue of securities loaned will be returned in the event that theborrower fails to return the borrowed securities and the collateral heldis insufficient to cover the fair value of those securities. Theseindemnifications normally terminate without being drawn upon. Theterm of these indemnifications varies, as the securities loaned arerecallable on demand. Collateral held for our securities lendingtransactions typically includes cash or securities that are issued orguaranteed by the Canadian government, U.S. government or otherOECD countries.
IndemnificationsIn the normal course of our operations, we provide indemnificationswhich are often standard contractual terms to counterparties intransactions such as purchase and sale contracts, fiduciary, agency,licensing and service agreements, director/officer contracts andleasing transactions. These indemnification agreements may requireus to compensate the counterparties for costs incurred as a result ofchanges in laws and regulations (including tax legislation) or as aresult of litigation claims or statutory sanctions that may be sufferedby the counterparty as a consequence of the transaction. The terms ofthese indemnification agreements will vary based on the contract. Thenature of the indemnification agreements prevents us from making areasonable estimate of the maximum potential amount we could berequired to pay to counterparties. Historically, we have not made anysignificant payments under such indemnifications.
Other off-balance sheet credit instrumentsIn addition to financial guarantees, we utilize other off-balance sheetcredit instruments to meet the financing needs of our clients. Thecontractual amounts of these credit instruments represent themaximum possible credit risk without taking into account the fairvalue of any collateral, in the event other parties fail to perform theirobligations under these instruments.
Commitments to extend credit represent unused portions ofauthorizations to extend credit in different borrowing optionsincluding loans, bankers’ acceptances or letters of credit.
In securities lending transactions, we lend our own or our clients’securities to a borrower for a fee under the terms of a pre-arrangedcontract. The borrower must fully collateralize the security loaned atall times.
Uncommitted amounts represent an amount for which we retainthe option to extend credit to a borrower.
Documentary and commercial letters of credit, which are writtenundertakings by us on behalf of a client authorizing a third party todraw drafts on us up to a stipulated amount under specific terms andconditions, are collateralized by the underlying shipment of goods towhich they relate.
124 Royal Bank of Canada: Annual Report 2010 Consolidated Financial Statements
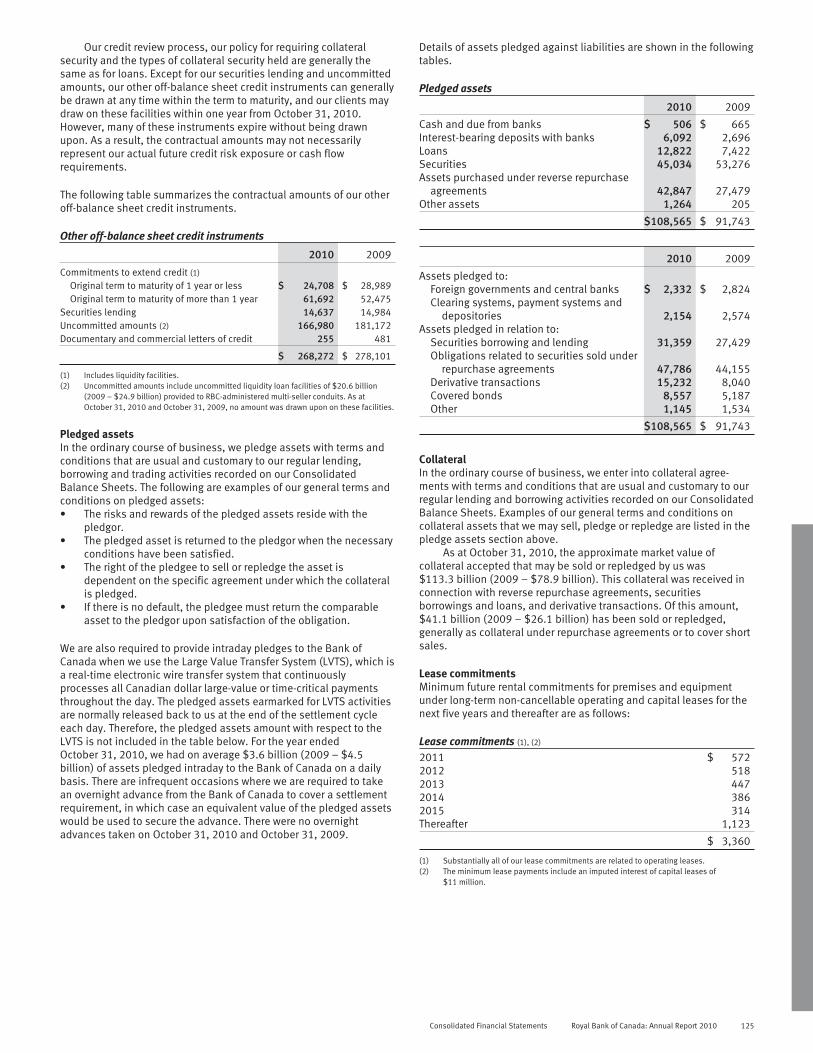
Our credit review process, our policy for requiring collateralsecurity and the types of collateral security held are generally thesame as for loans. Except for our securities lending and uncommittedamounts, our other off-balance sheet credit instruments can generallybe drawn at any time within the term to maturity, and our clients maydraw on these facilities within one year from October 31, 2010.However, many of these instruments expire without being drawnupon. As a result, the contractual amounts may not necessarilyrepresent our actual future credit risk exposure or cash flowrequirements.
The following table summarizes the contractual amounts of our otheroff-balance sheet credit instruments.
Other off-balance sheet credit instruments
2010 2009
Commitments to extend credit (1)
Original term to maturity of 1 year or less $ 24,708 $ 28,989Original term to maturity of more than 1 year 61,692 52,475
Securities lending 14,637 14,984Uncommitted amounts (2) 166,980 181,172Documentary and commercial letters of credit 255 481
$ 268,272 $ 278,101
(1) Includes liquidity facilities.(2) Uncommitted amounts include uncommitted liquidity loan facilities of $20.6 billion
(2009 – $24.9 billion) provided to RBC-administered multi-seller conduits. As atOctober 31, 2010 and October 31, 2009, no amount was drawn upon on these facilities.
Pledged assetsIn the ordinary course of business, we pledge assets with terms andconditions that are usual and customary to our regular lending,borrowing and trading activities recorded on our ConsolidatedBalance Sheets. The following are examples of our general terms andconditions on pledged assets:• The risks and rewards of the pledged assets reside with the
pledgor.• The pledged asset is returned to the pledgor when the necessary
conditions have been satisfied.• The right of the pledgee to sell or repledge the asset is
dependent on the specific agreement under which the collateralis pledged.
• If there is no default, the pledgee must return the comparableasset to the pledgor upon satisfaction of the obligation.
We are also required to provide intraday pledges to the Bank ofCanada when we use the Large Value Transfer System (LVTS), which isa real-time electronic wire transfer system that continuouslyprocesses all Canadian dollar large-value or time-critical paymentsthroughout the day. The pledged assets earmarked for LVTS activitiesare normally released back to us at the end of the settlement cycleeach day. Therefore, the pledged assets amount with respect to theLVTS is not included in the table below. For the year endedOctober 31, 2010, we had on average $3.6 billion (2009 – $4.5billion) of assets pledged intraday to the Bank of Canada on a dailybasis. There are infrequent occasions where we are required to takean overnight advance from the Bank of Canada to cover a settlementrequirement, in which case an equivalent value of the pledged assetswould be used to secure the advance. There were no overnightadvances taken on October 31, 2010 and October 31, 2009.
Details of assets pledged against liabilities are shown in the followingtables.
Pledged assets
2010 2009
Cash and due from banks $ 506 $ 665Interest-bearing deposits with banks 6,092 2,696Loans 12,822 7,422Securities 45,034 53,276Assets purchased under reverse repurchase
agreements 42,847 27,479Other assets 1,264 205
$108,565 $ 91,743
2010 2009
Assets pledged to:Foreign governments and central banks $ 2,332 $ 2,824Clearing systems, payment systems and
depositories 2,154 2,574Assets pledged in relation to:
Securities borrowing and lending 31,359 27,429Obligations related to securities sold under
repurchase agreements 47,786 44,155Derivative transactions 15,232 8,040Covered bonds 8,557 5,187Other 1,145 1,534
$108,565 $ 91,743
CollateralIn the ordinary course of business, we enter into collateral agree-ments with terms and conditions that are usual and customary to ourregular lending and borrowing activities recorded on our ConsolidatedBalance Sheets. Examples of our general terms and conditions oncollateral assets that we may sell, pledge or repledge are listed in thepledge assets section above.
As at October 31, 2010, the approximate market value ofcollateral accepted that may be sold or repledged by us was$113.3 billion (2009 – $78.9 billion). This collateral was received inconnection with reverse repurchase agreements, securitiesborrowings and loans, and derivative transactions. Of this amount,$41.1 billion (2009 – $26.1 billion) has been sold or repledged,generally as collateral under repurchase agreements or to cover shortsales.
Lease commitmentsMinimum future rental commitments for premises and equipmentunder long-term non-cancellable operating and capital leases for thenext five years and thereafter are as follows:
Lease commitments (1), (2)
2011 $ 5722012 5182013 4472014 3862015 314Thereafter 1,123
$ 3,360
(1) Substantially all of our lease commitments are related to operating leases.(2) The minimum lease payments include an imputed interest of capital leases of
$11 million.
Consolidated Financial Statements Royal Bank of Canada: Annual Report 2010 125

Note 25 Guarantees, commitments and contingencies (continued)
LitigationEnron Corp. (Enron) litigationRoyal Bank of Canada and certain related entities were defendants ina class action brought by the Regents of the University of SouthernCalifornia which was consolidated with the lead action entitledNewby v. Enron Corp., which was the main consolidated purportedEnron shareholder class action. This class action against Royal Bankof Canada and certain related entities was dismissed with prejudiceon December 2, 2009. As a result of this development, during the firstquarter we determined that the $60 million provision (US$50 millionor $53 million using the exchange rate at January 31, 2010) that wehad established for this particular litigation was no longer necessary;its reversal was recorded in Non-interest expense – Other in ourConsolidated Statement of Income where the provision was initiallyrecorded.
Royal Bank of Canada is also named as a defendant by oneindividual investor in respect of the losses suffered by that investoras a purchaser of Enron publicly traded equity and debt securities. Wehave not recorded a provision in respect of this lawsuit as it is notpossible to predict its ultimate outcome or when it will be resolved;however, we do not believe the ultimate resolution of this lawsuit willhave a significant adverse impact on our consolidated financialposition. We review the status of this matter on an ongoing basis andwill exercise our judgment in resolving it in such a manner as webelieve to be our best interests.
OtherVarious other legal proceedings are pending that challenge certain ofour practices or actions. We consider that the aggregate liabilityresulting from these other proceedings will not be material to ourfinancial position or results of operations.
Note 26 Contractual repricing and maturity schedule
The following table details our exposure to interest rate risk asdefined and prescribed by CICA Handbook Section 3862, FinancialInstruments-Disclosures. On- and off-balance sheet financialinstruments are reported based on the earlier of their contractualrepricing date or maturity date. Effective interest rates have beendisclosed where applicable. The effective rates shown representhistorical rates for fixed-rate instruments carried at amortized costand current market rates for floating-rate instruments or instrumentscarried at fair value. The following table does not incorporate
management’s expectation of future events where expected repricingor maturity dates differ significantly from the contractual dates. Weincorporate these assumptions in the management of interest raterisk exposure. These assumptions include expected repricing oftrading instruments and certain loans and deposits. Taking intoaccount these assumptions on the contractual repricing and maturityschedule as at October 31, 2010, would result in a change in theunder-one-year gap from $(70.4) billion to $(60.1) billion (2009 –$(70.5) billion to $(67.7) billion).
126 Royal Bank of Canada: Annual Report 2010 Consolidated Financial Statements
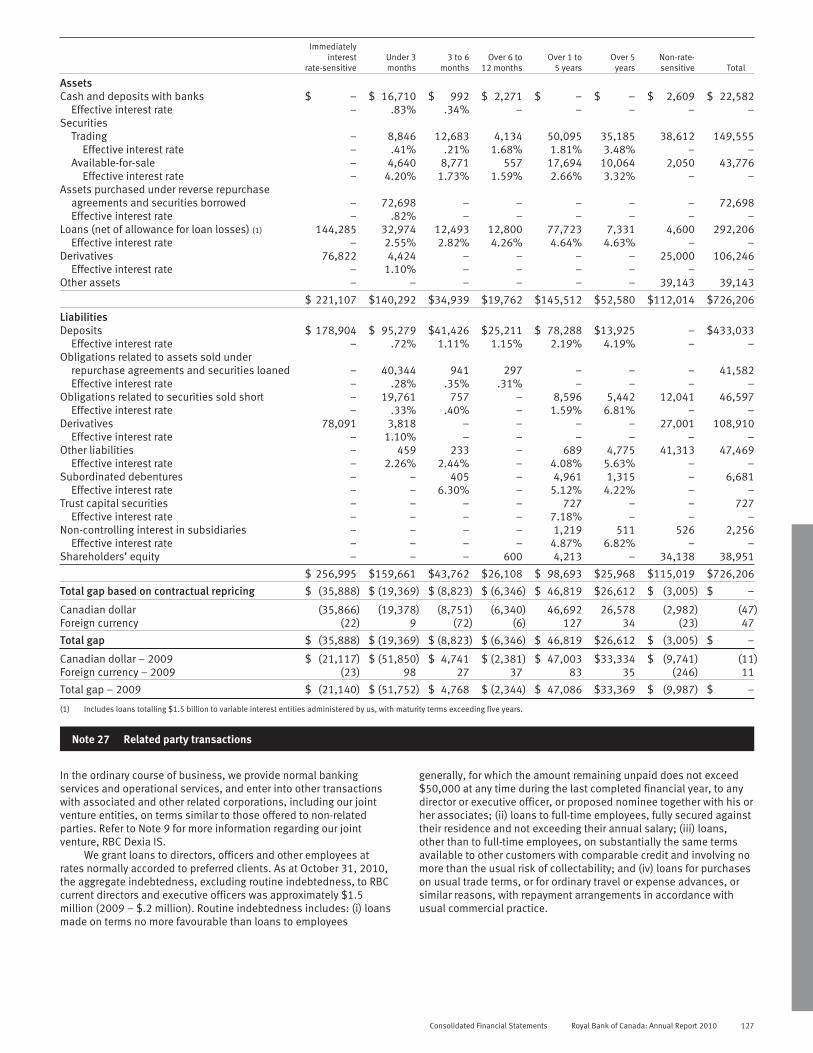
Immediatelyinterest
rate-sensitiveUnder 3months
3 to 6months
Over 6 to12 months
Over 1 to5 years
Over 5years
Non-rate-sensitive Total
AssetsCash and deposits with banks $ – $ 16,710 $ 992 $ 2,271 $ – $ – $ 2,609 $ 22,582
Effective interest rate – .83% .34% – – – – –Securities
Trading – 8,846 12,683 4,134 50,095 35,185 38,612 149,555Effective interest rate – .41% .21% 1.68% 1.81% 3.48% – –
Available-for-sale – 4,640 8,771 557 17,694 10,064 2,050 43,776Effective interest rate – 4.20% 1.73% 1.59% 2.66% 3.32% – –
Assets purchased under reverse repurchaseagreements and securities borrowed – 72,698 – – – – – 72,698Effective interest rate – .82% – – – – – –
Loans (net of allowance for loan losses) (1) 144,285 32,974 12,493 12,800 77,723 7,331 4,600 292,206Effective interest rate – 2.55% 2.82% 4.26% 4.64% 4.63% – –
Derivatives 76,822 4,424 – – – – 25,000 106,246Effective interest rate – 1.10% – – – – – –
Other assets – – – – – – 39,143 39,143
$ 221,107 $140,292 $34,939 $19,762 $145,512 $52,580 $112,014 $726,206
LiabilitiesDeposits $ 178,904 $ 95,279 $41,426 $25,211 $ 78,288 $13,925 – $433,033
Effective interest rate – .72% 1.11% 1.15% 2.19% 4.19% – –Obligations related to assets sold under
repurchase agreements and securities loaned – 40,344 941 297 – – – 41,582Effective interest rate – .28% .35% .31% – – – –
Obligations related to securities sold short – 19,761 757 – 8,596 5,442 12,041 46,597Effective interest rate – .33% .40% – 1.59% 6.81% – –
Derivatives 78,091 3,818 – – – – 27,001 108,910Effective interest rate – 1.10% – – – – – –
Other liabilities – 459 233 – 689 4,775 41,313 47,469Effective interest rate – 2.26% 2.44% – 4.08% 5.63% – –
Subordinated debentures – – 405 – 4,961 1,315 – 6,681Effective interest rate – – 6.30% – 5.12% 4.22% – –
Trust capital securities – – – – 727 – – 727Effective interest rate – – – – 7.18% – – –
Non-controlling interest in subsidiaries – – – – 1,219 511 526 2,256Effective interest rate – – – – 4.87% 6.82% – –
Shareholders’ equity – – – 600 4,213 – 34,138 38,951
$ 256,995 $159,661 $43,762 $26,108 $ 98,693 $25,968 $115,019 $726,206
Total gap based on contractual repricing $ (35,888) $ (19,369) $ (8,823) $ (6,346) $ 46,819 $26,612 $ (3,005) $ –
Canadian dollar (35,866) (19,378) (8,751) (6,340) 46,692 26,578 (2,982) (47)Foreign currency (22) 9 (72) (6) 127 34 (23) 47
Total gap $ (35,888) $ (19,369) $ (8,823) $ (6,346) $ 46,819 $26,612 $ (3,005) $ –
Canadian dollar – 2009 $ (21,117) $ (51,850) $ 4,741 $ (2,381) $ 47,003 $33,334 $ (9,741) (11)Foreign currency – 2009 (23) 98 27 37 83 35 (246) 11
Total gap – 2009 $ (21,140) $ (51,752) $ 4,768 $ (2,344) $ 47,086 $33,369 $ (9,987) $ –
(1) Includes loans totalling $1.5 billion to variable interest entities administered by us, with maturity terms exceeding five years.
Note 27 Related party transactions
In the ordinary course of business, we provide normal bankingservices and operational services, and enter into other transactionswith associated and other related corporations, including our jointventure entities, on terms similar to those offered to non-relatedparties. Refer to Note 9 for more information regarding our jointventure, RBC Dexia IS.
We grant loans to directors, officers and other employees atrates normally accorded to preferred clients. As at October 31, 2010,the aggregate indebtedness, excluding routine indebtedness, to RBCcurrent directors and executive officers was approximately $1.5million (2009 – $.2 million). Routine indebtedness includes: (i) loansmade on terms no more favourable than loans to employees
generally, for which the amount remaining unpaid does not exceed$50,000 at any time during the last completed financial year, to anydirector or executive officer, or proposed nominee together with his orher associates; (ii) loans to full-time employees, fully secured againsttheir residence and not exceeding their annual salary; (iii) loans,other than to full-time employees, on substantially the same termsavailable to other customers with comparable credit and involving nomore than the usual risk of collectability; and (iv) loans for purchaseson usual trade terms, or for ordinary travel or expense advances, orsimilar reasons, with repayment arrangements in accordance withusual commercial practice.
Consolidated Financial Statements Royal Bank of Canada: Annual Report 2010 127

Note 28 Results by business and geographic segment
2010Canadian
BankingWealth
Management Insurance (1)International
BankingCapital
Markets (2)Corporate
Support (2) Total CanadaUnitedStates
OtherInter-
nationalNet interest income $ 7,488 $ 305 $ – $ 1,367 $ 2,719 $ (902) $ 10,977 $ 8,405 $ 1,718 $ 854Non-interest income 3,067 3,883 6,062 869 3,168 304 17,353 8,869 4,647 3,837Total revenue 10,555 4,188 6,062 2,236 5,887 (598) 28,330 17,274 6,365 4,691Provision for credit
losses 1,191 3 – 743 20 (96) 1,861 1,026 675 160Insurance policyholder
benefits, claims andacquisition expense – – 5,108 – – – 5,108 2,343 1,582 1,183
Non-interest expense 4,995 3,295 552 2,105 3,420 26 14,393 7,944 4,055 2,394Net income (loss) before
income taxes 4,369 890 402 (612) 2,447 (528) 6,968 5,961 53 954Income taxes
(recoveries) 1,325 221 (3) (297) 795 (395) 1,646 1,633 (79) 92Non-controlling interest 2 5 92 99 96 2 1Net income (loss) $ 3,044 $ 669 $ 405 $ (317) $ 1,647 $ (225) $ 5,223 $ 4,232 $ 130 $ 861
Less: Preferreddividends 258
Net income (loss)available to commonshareholders $ 4,965
Total assets (4) $ 288,600 $ 19,600 $ 15,400 $ 56,700 $ 354,400 $ (8,500) $ 726,200 $ 404,000 $ 145,600 $ 176,400
2009Canadian
BankingWealth
Management InsuranceInternational
BankingCapital
Markets (2)Corporate
Support (2), (3) Total (3) CanadaUnitedStates
OtherInter-
nationalNet interest income $ 6,947 $ 397 $ - $ 1,687 $ 3,399 $ (889) $ 11,541 $ 7,863 $ 2,134 $ 1,544Non-interest income 2,943 3,683 5,715 903 3,524 797 17,565 9,429 5,565 2,571Total revenue 9,890 4,080 5,715 2,590 6,923 (92) 29,106 17,292 7,699 4,115Provision for credit
losses 1,275 – – 980 702 456 3,413 1,479 1,821 113Insurance policyholder
benefits, claims andacquisition expense – – 4,609 – – – 4,609 2,100 1,571 938
Non-interest expense 4,729 3,262 559 2,346 3,628 34 14,558 7,632 4,572 2,354Goodwill impairment
charge – – – 1,000 – – 1,000 – 1,000 –Net income (loss) before
income taxes 3,886 818 547 (1,736) 2,593 (582) 5,526 6,081 (1,265) 710Income taxes
(recoveries) 1,223 235 51 (299) 826 (468) 1,568 1,707 (132) (7)Non-controlling interest – – – 9 (1) 92 100 92 (1) 9Net income (loss) $ 2,663 $ 583 $ 496 $ (1,446) $ 1,768 $ (206) $ 3,858 $ 4,282 $ (1,132) $ 708
Less: Preferreddividends 233
Net income (loss)available to commonshareholders $ 3,625
Total assets (4) $ 271,000 $ 19,200 $ 13,400 $ 58,200 $ 306,500 $ (13,300) $ 655,000 $ 368,600 $ 127,000 $ 159,400
2008Canadian
BankingWealth
Management InsuranceInternational
BankingCapital
Markets (2)Corporate
Support (2), (3) Total (3) CanadaUnitedStates
OtherInter-
nationalNet interest income $ 6,718 $ 468 $ – $ 1,330 $ 1,527 $ (989) $ 9,054 $ 6,935 $ 1,132 $ 987Non-interest income 2,868 3,519 2,610 771 2,408 352 12,528 8,214 2,521 1,793Total revenue 9,586 3,987 2,610 2,101 3,935 (637) 21,582 15,149 3,653 2,780Provision for credit
losses 867 1 – 497 183 47 1,595 924 643 28Insurance policyholder
benefits, claims andacquisition expense – – 1,631 – – – 1,631 922 30 679
Non-interest expense 4,758 3,038 576 1,876 2,121 (18) 12,351 7,490 2,991 1,870Net income (loss) before
income taxes 3,961 948 403 (272) 1,631 (666) 6,005 5,813 (11) 203Income taxes 1,299 283 14 (128) 465 (564) 1,369 1,750 (159) (222)Non-controlling interest – – – 9 (4) 76 81 76 (4) 9Net income (loss) $ 2,662 $ 665 $ 389 $ (153) $ 1,170 $ (178) $ 4,555 $ 3,987 $ 152 $ 416
Less: Preferreddividends 101
Net income (loss)available to commonshareholders $ 4,454
Total assets (4) $ 204,900 $ 34,100 $ 7,800 $ 69,200 $ 324,700 $ 83,200 $ 723,900 $ 435,100 $ 126,600 $ 162,200
(1) Includes the loss on sale of Liberty Life. Refer to Notes 11 and 31.(2) Taxable equivalent basis (Teb). Teb adjustments gross up Net interest income from certain tax-advantaged sources (Canadian taxable corporate dividends) to their effective tax equivalent
value with the corresponding offset recorded in the provision for income taxes.(3) Certain amounts have been revised from results previously reported. Refer to the Change in financial statement presentation described in Note 1.(4) Includes spot balances and securitized mortgage amounts.
128 Royal Bank of Canada: Annual Report 2010 Consolidated Financial Statements
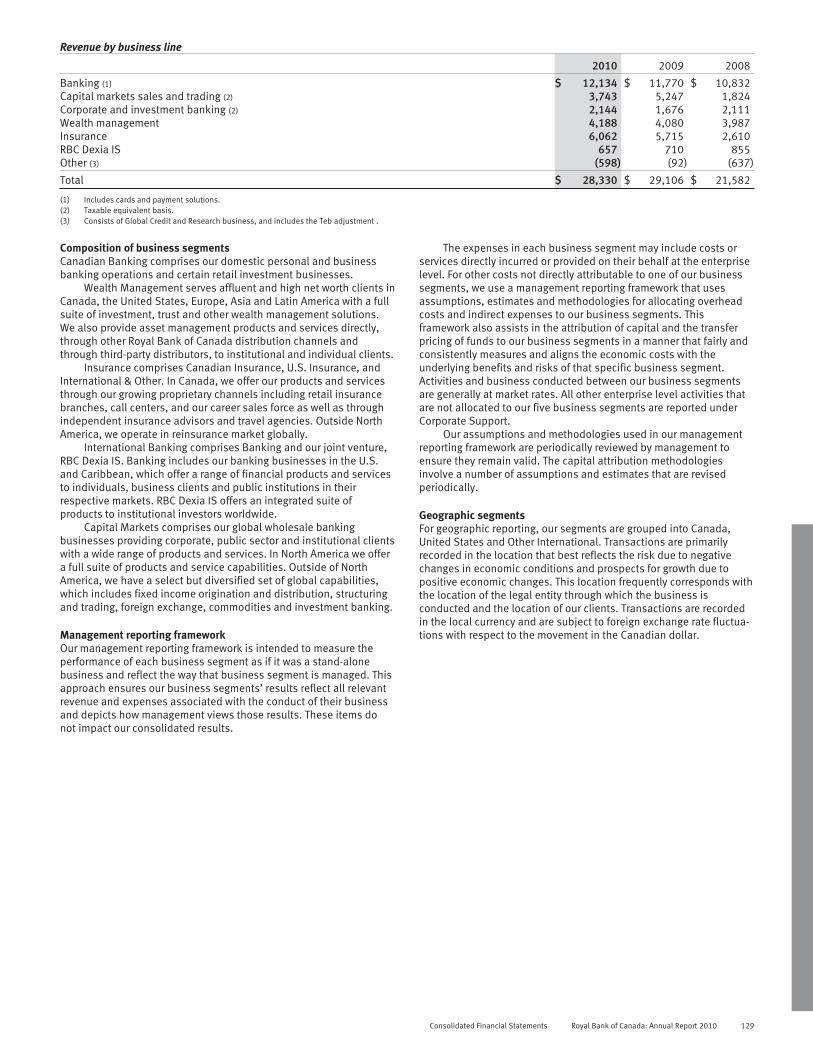
Revenue by business line
2010 2009 2008
Banking (1) $ 12,134 $ 11,770 $ 10,832Capital markets sales and trading (2) 3,743 5,247 1,824Corporate and investment banking (2) 2,144 1,676 2,111Wealth management 4,188 4,080 3,987Insurance 6,062 5,715 2,610RBC Dexia IS 657 710 855Other (3) (598) (92) (637)
Total $ 28,330 $ 29,106 $ 21,582
(1) Includes cards and payment solutions.(2) Taxable equivalent basis.(3) Consists of Global Credit and Research business, and includes the Teb adjustment .
Composition of business segmentsCanadian Banking comprises our domestic personal and businessbanking operations and certain retail investment businesses.
Wealth Management serves affluent and high net worth clients inCanada, the United States, Europe, Asia and Latin America with a fullsuite of investment, trust and other wealth management solutions.We also provide asset management products and services directly,through other Royal Bank of Canada distribution channels andthrough third-party distributors, to institutional and individual clients.
Insurance comprises Canadian Insurance, U.S. Insurance, andInternational & Other. In Canada, we offer our products and servicesthrough our growing proprietary channels including retail insurancebranches, call centers, and our career sales force as well as throughindependent insurance advisors and travel agencies. Outside NorthAmerica, we operate in reinsurance market globally.
International Banking comprises Banking and our joint venture,RBC Dexia IS. Banking includes our banking businesses in the U.S.and Caribbean, which offer a range of financial products and servicesto individuals, business clients and public institutions in theirrespective markets. RBC Dexia IS offers an integrated suite ofproducts to institutional investors worldwide.
Capital Markets comprises our global wholesale bankingbusinesses providing corporate, public sector and institutional clientswith a wide range of products and services. In North America we offera full suite of products and service capabilities. Outside of NorthAmerica, we have a select but diversified set of global capabilities,which includes fixed income origination and distribution, structuringand trading, foreign exchange, commodities and investment banking.
Management reporting frameworkOur management reporting framework is intended to measure theperformance of each business segment as if it was a stand-alonebusiness and reflect the way that business segment is managed. Thisapproach ensures our business segments’ results reflect all relevantrevenue and expenses associated with the conduct of their businessand depicts how management views those results. These items donot impact our consolidated results.
The expenses in each business segment may include costs orservices directly incurred or provided on their behalf at the enterpriselevel. For other costs not directly attributable to one of our businesssegments, we use a management reporting framework that usesassumptions, estimates and methodologies for allocating overheadcosts and indirect expenses to our business segments. Thisframework also assists in the attribution of capital and the transferpricing of funds to our business segments in a manner that fairly andconsistently measures and aligns the economic costs with theunderlying benefits and risks of that specific business segment.Activities and business conducted between our business segmentsare generally at market rates. All other enterprise level activities thatare not allocated to our five business segments are reported underCorporate Support.
Our assumptions and methodologies used in our managementreporting framework are periodically reviewed by management toensure they remain valid. The capital attribution methodologiesinvolve a number of assumptions and estimates that are revisedperiodically.
Geographic segmentsFor geographic reporting, our segments are grouped into Canada,United States and Other International. Transactions are primarilyrecorded in the location that best reflects the risk due to negativechanges in economic conditions and prospects for growth due topositive economic changes. This location frequently corresponds withthe location of the legal entity through which the business isconducted and the location of our clients. Transactions are recordedin the local currency and are subject to foreign exchange rate fluctua-tions with respect to the movement in the Canadian dollar.
Consolidated Financial Statements Royal Bank of Canada: Annual Report 2010 129

Note 29 Nature and extent of risks arising from financial instruments
We are exposed to credit, market and liquidity and funding risks as aresult of holding financial instruments. Our risk measurement andobjectives, policies and methodologies for managing these risks aredisclosed in the shaded text along with those tables specificallymarked with an asterisk (*) on pages 39 to 47 of the ManagementDiscussion and Analysis. These shaded text and tables are an integralpart of these Consolidated Financial Statements.
Concentrations of credit risk exist if a number of clients areengaged in similar activities, are located in the same geographic
region or have comparable economic characteristics such that theirability to meet contractual obligations would be similarly affected bychanges in economic, political or other conditions.
Concentrations of credit risk indicate the relative sensitivity ofour performance to developments affecting a particular industry orgeographic location. The amounts of credit exposure associated withour on- and off-balance sheet financial instruments are summarizedin the following table.
Concentration of credit risk2010 2009
Canada % United States % Europe %
OtherInter-
national % Total Canada % United States % Europe %
OtherInter-
national % Total
On-balance sheet assets other thanderivatives (1) $267,945 71% $ 51,147 14% $37,427 10% $18,753 5% $375,272 $245,193 73% $ 50,463 15% $28,778 9% $10,321 3% $334,755Derivatives before master netting
agreement (2), (3) 13,608 13 25,067 24 58,831 56 7,428 7 104,934 14,668 16 19,854 22 48,412 54 6,778 8 89,712
$281,553 13% $ 76,214 24% $96,258 56% $26,181 7% $480,206 $259,861 61% $ 70,317 17% $77,190 18% $17,099 4% $424,467
Off-balance sheet credit instruments (4)Committed and uncommitted (5) $180,894 71% $ 50,370 20% $13,451 5% $ 8,665 4% $253,380 $180,369 69% $ 47,227 18% $15,672 6% $19,368 7% $262,636Other 16,511 50 9,176 28 6,850 21 277 1 32,814 16,137 47 9,490 28 8,175 24 367 1 34,169
$197,405 69% $ 59,546 21% $20,301 7% $ 8,942 3% $286,194 $196,506 67% $ 56,717 18% $23,847 8% $19,735 7% $296,805
(1) Includes assets purchased under reverse repurchase agreements and securities borrowed, loans and customers’ liability under acceptances. The largest concentrations in Canada are Ontarioat 50% (2009 – 50%), the Prairies at 18% (2009 – 18%), British Columbia and the territories at 16% (2009 – 17%) and Quebec at 11% (2009 – 11%). No industry accounts for more than28% (2009 – 18%) of total on-balance sheet credit instruments.
(2) The largest concentration of credit exposure by counterparty type is banks at 65% (2009 – 67%).(3) Excludes credit derivatives classified as other than trading with a replacement cost of $7 million (2009 – $128 million).(4) Represents financial instruments with contractual amounts representing credit risk.(5) Retail and wholesale commitments comprise 46% (2009 – 39%) and 54% (2009 – 61%), respectively, of our total commitments. The largest sector concentration in the wholesale portfolio
relates to Non-bank financial services at 14% (2009 – 20%), Financing products at 17% (2009– 16%), Energy at 14% (2009 – 10%), Real estate and related at 8% (2009 – 7%), Otherservices at 4% (2009 – 7%), Bank at 2% (2009 – 3%), and Sovereign at 8% (2009 – 6%).
Note 30 Capital management
Regulatory capital and capital ratiosCapital levels for Canadian banks are regulated pursuant to guide-lines issued by OSFI, based on standards issued by the Bank forInternational Settlements, Basel Committee on Banking Supervision.Regulatory capital is allocated to two tiers: Tier 1 and Tier 2. Tier 1capital comprises the highest quality capital and is a core measure ofa bank’s financial strength. Tier 1 capital consists of more permanentcomponents of capital, is free of mandatory fixed charges againstearnings and has a subordinate legal position to the rights ofdepositors and other creditors of the financial institution. Tier 2capital is composed of supplementary capital instruments thatcontribute to the overall strength of a financial institution as a goingconcern. Total capital is defined as the sum of Tier 1 and Tier 2capital.
Regulatory capital ratios are calculated by dividing Tier 1 andTotal capital by risk-weighted assets (RWA). OSFI requires banks tomeet minimum risk-based capital requirements for exposures tocredit risk, operational risk, and where they have significant tradingactivity, market risk. RWA is calculated for each of these risk typesand added together to determine total RWA.
In addition, OSFI formally establishes risk-based capital targetsfor deposit-taking institutions in Canada. These targets are currently aTier 1 capital ratio of greater than or equal to 7% and a Total capital
ratio of greater than or equal to 10%. In addition to the Tier 1 andTotal capital ratios, Canadian banks are required to ensure that theirassets-to-capital multiple, which is calculated by dividing grossadjusted assets by Total capital, does not exceed a maximum levelprescribed by OSFI. Our assets-to-capital multiple remains below themaximum level prescribed by OSFI.
Regulatory capital, risk-weighted assets and capital ratios2010 2009
CapitalTier 1 capital $ 33,972 $ 31,774Total capital 37,625 34,881
Risk-weighted assetsCredit risk $ 197,195 $ 185,051Market risk 24,828 23,321Operational risk 38,433 36,465
Total risk-weighted assets $ 260,456 $ 244,837
Capital ratiosTier 1 capital 13.0% 13.0%Total capital 14.4% 14.2%Assets-to-capital multiple 16.5X 16.3X
130 Royal Bank of Canada: Annual Report 2010 Consolidated Financial Statements
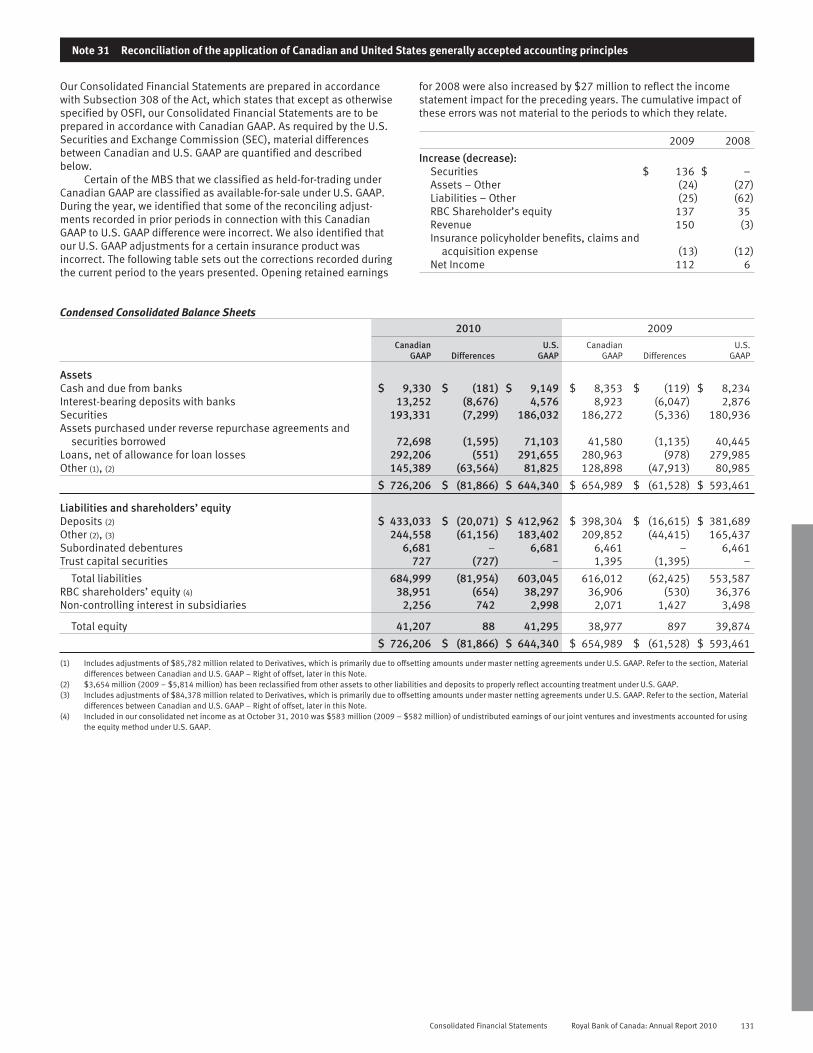
Note 31 Reconciliation of the application of Canadian and United States generally accepted accounting principles
Our Consolidated Financial Statements are prepared in accordancewith Subsection 308 of the Act, which states that except as otherwisespecified by OSFI, our Consolidated Financial Statements are to beprepared in accordance with Canadian GAAP. As required by the U.S.Securities and Exchange Commission (SEC), material differencesbetween Canadian and U.S. GAAP are quantified and describedbelow.
Certain of the MBS that we classified as held-for-trading underCanadian GAAP are classified as available-for-sale under U.S. GAAP.During the year, we identified that some of the reconciling adjust-ments recorded in prior periods in connection with this CanadianGAAP to U.S. GAAP difference were incorrect. We also identified thatour U.S. GAAP adjustments for a certain insurance product wasincorrect. The following table sets out the corrections recorded duringthe current period to the years presented. Opening retained earnings
for 2008 were also increased by $27 million to reflect the incomestatement impact for the preceding years. The cumulative impact ofthese errors was not material to the periods to which they relate.
2009 2008
Increase (decrease):Securities $ 136 $ –Assets – Other (24) (27)Liabilities – Other (25) (62)RBC Shareholder’s equity 137 35Revenue 150 (3)Insurance policyholder benefits, claims and
acquisition expense (13) (12)Net Income 112 6
Condensed Consolidated Balance Sheets2010 2009
CanadianGAAP Differences
U.S.GAAP
CanadianGAAP Differences
U.S.GAAP
AssetsCash and due from banks $ 9,330 $ (181) $ 9,149 $ 8,353 $ (119) $ 8,234Interest-bearing deposits with banks 13,252 (8,676) 4,576 8,923 (6,047) 2,876Securities 193,331 (7,299) 186,032 186,272 (5,336) 180,936Assets purchased under reverse repurchase agreements and
securities borrowed 72,698 (1,595) 71,103 41,580 (1,135) 40,445Loans, net of allowance for loan losses 292,206 (551) 291,655 280,963 (978) 279,985Other (1), (2) 145,389 (63,564) 81,825 128,898 (47,913) 80,985
$ 726,206 $ (81,866) $ 644,340 $ 654,989 $ (61,528) $ 593,461
Liabilities and shareholders’ equityDeposits (2) $ 433,033 $ (20,071) $ 412,962 $ 398,304 $ (16,615) $ 381,689Other (2), (3) 244,558 (61,156) 183,402 209,852 (44,415) 165,437Subordinated debentures 6,681 – 6,681 6,461 – 6,461Trust capital securities 727 (727) – 1,395 (1,395) –
Total liabilities 684,999 (81,954) 603,045 616,012 (62,425) 553,587RBC shareholders’ equity (4) 38,951 (654) 38,297 36,906 (530) 36,376Non-controlling interest in subsidiaries 2,256 742 2,998 2,071 1,427 3,498
Total equity 41,207 88 41,295 38,977 897 39,874
$ 726,206 $ (81,866) $ 644,340 $ 654,989 $ (61,528) $ 593,461
(1) Includes adjustments of $85,782 million related to Derivatives, which is primarily due to offsetting amounts under master netting agreements under U.S. GAAP. Refer to the section, Materialdifferences between Canadian and U.S. GAAP – Right of offset, later in this Note.
(2) $3,654 million (2009 – $5,814 million) has been reclassified from other assets to other liabilities and deposits to properly reflect accounting treatment under U.S. GAAP.(3) Includes adjustments of $84,378 million related to Derivatives, which is primarily due to offsetting amounts under master netting agreements under U.S. GAAP. Refer to the section, Material
differences between Canadian and U.S. GAAP – Right of offset, later in this Note.(4) Included in our consolidated net income as at October 31, 2010 was $583 million (2009 – $582 million) of undistributed earnings of our joint ventures and investments accounted for using
the equity method under U.S. GAAP.
Consolidated Financial Statements Royal Bank of Canada: Annual Report 2010 131

Note 31 Reconciliation of the application of Canadian and United States generally accepted accounting principles (continued)
Condensed Consolidated Statements of Income2010 2009 2008
Net income, Canadian GAAP $ 5,223 $ 3,858 $ 4,555Differences:Net interest income
Joint ventures (60) (153) (165)Liabilities and equity 85 101 112
Non-interest incomeInsurance accounting (2,219) (2,000) 289Derivative instruments and hedging activities (22) 31 (107)Reclassification of securities, impairment of available-for-sale securities and
application of the fair value option 66 (140) (509)Joint ventures (695) (646) (681)Other (1) (298) – –
Insurance policyholder benefits, claims and acquisition expense 1,834 1,930 (356)Non-interest expense
Insurance accounting 57 82 72Joint ventures 683 719 724
Other 112 116 (91)Income taxes and net difference in income taxes due to the above items (13) 48 339Non-controlling interest in net income of subsidiaries
Liabilities and equity (85) (101) (101)
Net income, U.S. GAAP $ 4,966 $ 3,845 $ 4,081
Basic earnings per share (2)
Canadian GAAP $ 3.49 $ 2.59 $ 3.41U.S. GAAP $ 3.41 $ 2.58 $ 3.03
Diluted earnings per share (2)
Canadian GAAP $ 3.46 $ 2.57 $ 3.38U.S. GAAP $ 3.38 $ 2.56 $ 3.00
(1) Relates to the loss on sale of Liberty Life. Refer to the subsection ‘Disposition of Liberty Life’ later in this Note.(2) The impact of calculating earnings per share using the two-class method reduced U.S. GAAP basic and diluted earnings per share for all periods presented by less than one cent. Please refer
to the section, Material differences between Canadian and U.S. GAAP later in this Note for details of this two-class method.
Condensed Consolidated Statements of Cash Flows2010 2009 2008
Cash flows from operating activities, Canadian GAAP $ 11,294 $ 7,403 $ 11,381U.S. GAAP adjustment for net income (257) (13) (474)Adjustments to determine net cash used in operating activities 4,141 (3,790) (5,119)
Net cash from operating activities, U.S. GAAP 15,178 3,600 5,788
Cash flows (used in) from investing activities, Canadian GAAP (51,574) 15,918 (44,602)Adjustments to determine net cash from investing activities (486) 2,009 5,059
Net cash (used in) from investing activities, U.S. GAAP (52,060) 17,927 (39,543)
Cash flows from (used in) financing activities, Canadian GAAP 41,425 (25,783) 39,198Adjustments to determine net cash from (used in) financing activities (3,460) 1,808 479
Net cash from (used in) financing activities, U.S. GAAP 37,965 (23,975) 39,677
Effect of exchange rate changes on cash and due from banks (168) (271) 883
Net change in cash and due from banks $ 915 $ (2,719)$ 6,805Cash and due from banks at beginning of year 8,234 10,953 4,148
Cash and due from banks at end of year, U.S. GAAP $ 9,149 $ 8,234 $ 10,953
132 Royal Bank of Canada: Annual Report 2010 Consolidated Financial Statements

Accumulated other comprehensive income (loss), net of income taxes2010 2009 2008
Canadian GAAP Differences U.S. GAAP Canadian GAAP Differences U.S. GAAP U.S. GAAP
Transition adjustments (1) $ 59 $ (80) $ (21) $ 59 $ (80) $ (21) $ –Unrealized (losses) gains on available-for-sale securities:
Transition adjustment and unrealized gains (losses) of other-than-temporarily-impaired debt securities (2), (3) – 83 83 – (39) (39) –
Net unrealized (losses) gains of other securities 104 704 808 (76) 432 356 (1,009)Unrealized foreign currency translation (losses), net of hedging
activities (1,685) 37 (1,648) (1,374) 45 (1,329) (757)(Losses) on derivatives designated as cash flow hedges (577) (56) (633) (325) (56) (381) (529)Additional pension obligation – (1,209) (1,209) – (956) (956) (523)
Accumulated other comprehensive (loss) income, net of incometaxes $ (2,099) $ (521) $(2,620) $ (1,716) $ (654) $(2,370) $(2,818)
(1) Transition adjustment differences consist of: (i) $(104) million related to the reclassification, as of November 1, 2008, of certain securities from available-for-sale to loans in accordance withthe CICA’s amendments to Section 3855; (ii) $(18) million related to the adoption of the fair value option standard in Accounting Standards Codification (ASC) Topic 825-10 (FAS 159); refer tothe section, Application of the fair value option, later in this Note; (iii) $(3) million related to the implementation of measurement date requirements in ASC Topic 715 (FAS 158); refer to thesection, Pensions and other post-employment benefits, later in this Note.
(2) For the debt securities that we do not intend to sell or it is more likely than not that we will not be required to sell before recovery of the amortized costs, the credit related portion of theunrealized loss was recognized in income and the non-credit related portion in OCI under U.S. GAAP.
(3) Transitional adjustment upon adoption of ASC Topic 320 (FSP FAS 115-2 and FAS 124-2) as at May 1, 2009 was a net unrealized loss of $225 million after taxes. Refer to the section, Other-than-temporary impairment of securities, later in this Note.
Consolidated Statements of Comprehensive Income2010 2009 2008
Canadian GAAP Differences U.S. GAAP Canadian GAAP Differences U.S. GAAP U.S. GAAP
Net income $ 5,223 $ (257) $ 4,966 $ 3,858 $ (13) $ 3,845 $ 4,081Other comprehensive income, net of taxes
Net unrealized gains (losses) on available-for-sale securities,net of reclassification adjustments:Unrealized gains of other-than-temporarily impaired debt
securities (1) – 122 122 – 186 186 –Net unrealized gains (losses) of other securities 180 272 452 992 373 1,365 (1,077)
Unrealized foreign currency translation (losses) (1,785) (13) (1,798) (2,973) 2 (2,971) 5,126Reclassification of (gains) losses on foreign currency
translation to income (5) 5 – 2 (2) – –Net foreign currency translation gains (losses) from hedging
activities 1,479 – 1,479 2,399 – 2,399 (2,672)Net gains (losses) on derivatives designated as cash flow
hedges (334) – (334) 156 29 185 (603)Reclassification of losses (gains) on derivatives designated as
cash flow hedges to income 82 – 82 (38) 1 (37) 54Additional pension obligation – (253) (253) – (433) (433) 18
Total comprehensive income $ 4,840 $ (124) $ 4,716 $ 4,396 $ 143 $ 4,539 $ 4,927
Income taxes (recovery) deducted from the above items:Net unrealized gains (losses) on available-for-sale securities $ 95 $ 146 $ 241 $ 495 $ 238 $ 733 $ (512)Net foreign currency translation gains (losses) from hedging
activities 676 – 676 1,102 – 1,102 (1,361)Net gains (losses) on derivatives designated as cash flow
hedges (144) – (144) 69 13 82 (304)Reclassification of losses (gains) on derivatives designated as
cash flow hedges to income 36 – 36 (17) 1 (16) 26Additional pension obligation – (110) (110) – (199) (199) 9
Total income taxes (recovery) $ 663 $ 36 $ 699 $ 1,649 $ 53 $ 1,702 $(2,142)
(1) Represents unrealized gains and losses of other-than-temporarily impaired debt securities since May 1, 2009, the adoption date of ASC Topic 320 (FSP FAS 115-2 and FAS 124-21); refer tothe section, Other-than-temporary impairment of securities, later in this Note.
Consolidated Financial Statements Royal Bank of Canada: Annual Report 2010 133

Note 31 Reconciliation of the application of Canadian and United States generally accepted accounting principles (continued)
Material balance sheet reconciling itemsThe following table presents the increases or (decreases) in assets, liabilities and shareholders’ equity by material differences betweenCanadian and U.S. GAAP.
2010
AssetsCash and due from banks $ 9,330 (181) – – – – – – – – – – (181) $ 9,149Interest-bearing deposits with banks 13,252 (4,189) – – – – – – – – (4,487) – (8,676) 4,576Securities 193,331 (4,468) – 155 (585) – – – 860 – (3,261) – (7,299) 186,032Assets purchased under reverse repurchase agreements
and securities borrowed 72,698 (1,595) – – – – – – – – – – (1,595) 71,103Loans 292,206 (624) – (629) – – – – – – 682 20 (551) 291,655Other assets 145,389 229 3,013 470 605 (14) – 249 9,771 7,575 (85,602) 140 (63,564) 81,825
Liabilities and shareholders’ equityDeposits 433,033 (10,846) – – – – – – – – (9,220) (5) (20,071) 412,962Other liabilities 244,558 21 2,651 3 – (27) (18) 1,475 10,631 7,575 (83,448) (19) (61,156) 183,402Subordinated debentures 6,681 – – – – – – – – – – – – 6,681Trust capital securities 727 – – – – – (727) – – – – – (727) –Non-controlling interest in subsidiaries 2,256 (3) – – – – 745 – – – – – 742 2,998Shareholders’ equity 38,951 – 362 (7) 20 13 – (1,226) – – – 184 (654) 38,297
2009
Assets432,8$)911(––––––––––)911(353,8$sknabmorfeuddnahsaC678,2)740,6(–)969,1(––––––––)870,4(329,8sknabhtiwstisopedgniraeb-tseretnI639,081)633,5(1)895,1(–981–––)332()072(–)524,3(272,681seitiruceS
Assets purchased under reverse repurchase agreements544,04)531,1(––––––––––)531,1(085,14deworrobseitirucesdna589,972)879(01966––––––)359(–)407(369,082snaoL589,08)319,74(751)767,07(049,8474,817–)81(552091,1341,3246898,821stessarehtO
Liabilities and shareholders’ equity986,183)516,61()7()998,7(––––––––)907,8(403,893stisopeD734,561)514,44(82)667,56(049,8366,8440,1)43()24(–74318,2)801(258,902seitilibailrehtO164,6––––––––––––164,6serutnebeddetanidrobuS–)593,1(–––––)593,1(–––––593,1seitiruceslatipactsurT894,3724,1–––––924,1––––)2(170,2seiraidisbusnitseretnignillortnoc-noN673,63)035(741–––)379(–4222)08(033–609,63ytiuqe’sredloherahS
Cana
dian
GA
AP
Join
tven
ture
s
Insu
ranc
eac
coun
ting
Clas
sific
atio
nan
dm
easu
rem
ent
ofce
rtai
nfin
anci
alin
stru
men
ts
Lim
ited
part
ners
hips
Sto
ckap
prec
iati
onri
ghts
Liab
iliti
esan
deq
uity
Add
itio
nalp
ensi
onob
ligat
ion
Trad
eda
teac
coun
ting
Non
-cas
hco
llate
ral
Righ
tofo
ffse
t
Gua
rant
ees,
loan
com
mit
men
tsan
dot
herm
inor
item
s
Diff
eren
ces
U.S
.GA
AP
Cana
dian
GAA
P
Join
tven
ture
s
Insu
ranc
eac
coun
ting
Clas
sific
atio
nan
dm
easu
rem
ent
ofce
rtai
nfin
anci
alin
stru
men
ts
Lim
ited
part
ners
hips
Stoc
kap
prec
iatio
nri
ghts
Liab
ilitie
san
deq
uity
Addi
tiona
lpen
sion
oblig
atio
n
Trad
eda
teac
coun
ting
Non
-cas
hco
llate
ral
Righ
tofo
ffse
t
Gua
rant
ees,
loan
com
mitm
ents
and
othe
rmin
orite
ms
Diff
eren
ces
U.S
.GAA
P
GAAP ReferencesThe GAAP references in the remainder of this note reflect the FinancialAccounting Standards Board (FASB) codification of standards whichbecame effective for us in 2009 (FAS Statement No.168, FASBAccounting Standards Codification and the Hierarchy of GenerallyAccepted Accounting Principles – a replacement of FASB StatementNo. 162 (FAS 168 or Codification). In certain cases, we have includedthe previous FASB references in parentheses.
Material differences between Canadian and U.S. GAAP
Joint venturesInvestments in joint ventures, other than VIEs, are accounted forusing the equity method under U.S. GAAP and are proportionatelyconsolidated under Canadian GAAP.
Insurance accountingClassification of securities: Under U.S. GAAP, fixed income and equityinvestments are included in available-for-sale securities and are
carried at estimated fair value. Unrealized gains and losses, net ofincome taxes, are reported in AOCI within Shareholders’ equity.Realized gains and losses are included in Non-interest income whenrealized. Under Canadian GAAP fixed income and equity investmentsare classified as available-for-sale securities except for thosesupporting the policy benefit liabilities of life and health insurancecontracts and a portion of property and casualty contracts which aredesignated as held-for-trading using the fair value option.Available-for-sale and held-for-trading securities are carried at fairvalue; however, the unrealized gains and losses for available-for-salesecurities are reported in AOCI, net of taxes, whereas held-for-tradinginvestments, which are designated using the fair value option, arereported in income. Refer to “Application of the fair value option”,later in this Note.
Insurance claims and policy benefit liabilities: Under U.S. GAAP,liabilities for life insurance contracts, except universal life andinvestment-type contracts, are determined using the net levelpremium method, which includes assumptions for mortality,
134 Royal Bank of Canada: Annual Report 2010 Consolidated Financial Statements

morbidity, policy lapses, surrenders, investment yields, policydividends and direct operating expenses. These assumptions are notrevised unless it is determined that existing deferred acquisitioncosts cannot be recovered. For universal life and investment-typecontracts, liabilities represent policyholder account balances andinclude a net level premium reserve for some contracts. The accountbalances represent an accumulation of gross deposits received pluscredited interest less withdrawals, expenses and mortality charges.Underlying reserve assumptions of these contracts are subject toreview at least annually. Property and casualty claim liabilitiesrepresent the estimated amounts required to settle all unpaid claims,and are recorded on an undiscounted basis. Under Canadian GAAP,liabilities for life insurance contracts are determined using the CALM,which incorporates assumptions for mortality, morbidity, policylapses, surrenders, investment yields, policy dividends andmaintenance expenses. To recognize the uncertainty in the assump-tions underlying the calculation of the liabilities, a margin for adversedeviations is added to each assumption. These assumptions arereviewed at least annually and updated in response to actualexperience and market conditions. Property and casualty claimliabilities represent the estimated amounts required to settle allunpaid claims, and are recorded on a discounted basis.
Insurance revenue: Under U.S. GAAP, amounts received for universallife and other investment-type contracts are not included as revenue,but are reported as deposits to policyholders’ account balances inInsurance claims and policy benefit liabilities. Revenue from thesecontracts are limited to amounts assessed against policyholders’account balances for mortality, policy administration and surrendercharges, and is included in Non-interest income when earned.Payments upon maturity or surrender are reflected as reductions inthe Insurance claims and policy benefit liabilities. Under CanadianGAAP, premiums for universal life and other investment-typecontracts are recorded as Non-interest income, and changes in theliabilities for future policy benefits are recorded in Insurance policyholder benefits, claims and acquisition expense.
Policy acquisition costs: Under U.S. GAAP, acquisition costs aredeferred in Other assets. The amortization method of the acquisitioncosts is dependent on the product to which the costs relate. For long-duration contracts, they are amortized in proportion to premiumrevenue. For universal life and investment-type contracts,amortization is based on a constant percentage of estimated grossprofits. Under Canadian GAAP, the costs of acquiring new lifeinsurance and annuity business are implicitly recognized as areduction in Insurance claims and policy benefit liabilities.
Value of business acquired: Under U.S. GAAP, the value of businessacquired (VOBA) is determined at the acquisition date and recordedas an asset. The VOBA asset is amortized and charged to incomeusing the same methodologies used for policy acquisition costamortization but reflects premiums or profit margins after the date ofacquisition only. Under Canadian GAAP, the value of life insurancein-force policies acquired in a business combination is implicitlyrecognized as a reduction in policy benefit liabilities.
Reinsurance: Under U.S. GAAP, reinsurance recoverables are recordedas an asset on our Consolidated Balance Sheets while underCanadian GAAP, reinsurance recoverables of life insurance businessrelated to the risks ceded to other insurance or reinsurancecompanies are recorded as an offset to Insurance claims and policybenefit liabilities.
Separate accounts: Separate accounts are recognized on ourConsolidated Balance Sheets under U.S. GAAP. Under CanadianGAAP, assets and liabilities of separate accounts (known as segre-gated funds in Canada) are not recognized on our ConsolidatedBalance Sheets.
Classification and measurement of certain financial instrumentsDifferences in presentation on the balance sheet: Certain investmentsin private equities measured at cost are included in Other assetsunder U.S. GAAP and presented under Securities under CanadianGAAP. In addition, certain MBS, where management intends to sellthem in the near term, are classified as available-for-sale under U.S.GAAP and as held-for-trading under Canadian GAAP.
Differences in reclassification of securities: As described in Note 3,pursuant to the CICA’s amendments to Sections 3855, 3861 and3862, we reclassified certain securities from held-for-trading toavailable-for-sale as of August 1, 2008 under Canadian GAAP. Forpurposes of our U.S. GAAP results, these were reclassified onOctober 1, 2008. Excluded from reclassification for U.S. GAAPpurposes were U.S. Municipal guaranteed investment contracts andU.S. MBS because the entities which hold those securities areprohibited from classifying securities as available-for-sale.
Under Canadian GAAP, as of November 1, 2008, certainheld-for-trading and available-for-sale securities were reclassified toloans, and certain loans were reclassified to held-for-trading. Suchreclassifications are not permitted under U.S. GAAP.
Differences in measurement of other-than-temporary impairmentlosses for available-for-sale debt securities: Under U.S. GAAP, theunrealized loss of an available-for-sale debt security is an other-than-temporary impairment when: (i) the entity has the intent to sell thesecurity; (ii) it is more likely than not that the entity will be required tosell the security before recovery of the amortized cost; or (iii) theentity does not expect to recover the entire amortized cost of thesecurity (credit loss) even though it will not sell the security. If one ofthe first two conditions is met, the full amount of the unrealized lossin AOCI should be recognized in income. If these two conditions arenot met but the entity has incurred a credit loss on the security, thecredit loss and the non-credit related loss are recognized in incomeand OCI, respectively. Under Canadian GAAP, if an impairment on anavailable-for-sale security is deemed to be other-than-temporary, thetotal unrealized losses are recognized in income.
Under U.S. GAAP, reversal of impairment losses is not permitted foravailable-for-sale debt securities. Under Canadian GAAP, animpairment loss on an available-for-sale debt security is reversed if,in a subsequent period, the fair value of the instrument increases andthe increase can be objectively related to an event occurring after theloss was recognized.
Application of the fair value optionBetween November 1, 2006 and November 1, 2008, U.S. GAAP onlyallowed the following financial instruments to be measured at fairvalue with changes in fair value to be recognized in net income:(i) any hybrid financial instrument that contains an embeddedderivative that requires bifurcation at its fair value; and (ii) servicingrights. Effective November 1, 2008, U.S. GAAP was revised to permitan entity to report additional financial assets and liabilities at fairvalue pursuant to Topic 825-10, Financial Instruments (Topic 825-10).As of November 1, 2006, Canadian GAAP permitted any financialinstrument to be designated as held-for-trading on its initial recog-nition (fair value option) (subject to certain restrictions imposed byOSFI), provided the fair value of the instrument is reliably measurable.Our GAAP difference arises primarily due to our application of the fairvalue option to: (i) our investments supporting the policy benefitliabilities on life and health insurance contracts issued by ourinsurance operations under Canadian GAAP but not U.S. GAAP, and(ii) certain U.S. residential mortgages under U.S. GAAP and notCanadian GAAP.
Limited partnershipsUnder U.S. GAAP, the equity method is used to account for invest-ments in limited partnerships that are non-VIEs or unconsolidatedVIEs, if we own at least 3% of the total ownership interest. UnderCanadian GAAP, we use the equity method for these investments if wehave the ability to exercise significant influence, generally indicatedby an ownership interest of 20% or more.
Consolidated Financial Statements Royal Bank of Canada: Annual Report 2010 135

Note 31 Reconciliation of the application of Canadian and United States generally accepted accounting principles (continued)
Stock appreciation rights (SARs)Between November 29, 1999, and June 5, 2001, options grantedunder the employee stock option plan were accompanied by tandemSARs, whereby participants could choose to exercise a SAR instead ofthe corresponding option. In such cases, the participants wouldreceive a cash payment equal to the difference between the closingprice of our common shares on the day immediately preceding theday of exercise and the exercise price of the option. Under U.S. GAAP,compensation expense would be measured using estimates based onpast experience of participants exercising SARs rather than thecorresponding options. On November 1, 2005, we adopted guidanceunder Topic 718, Compensation – Stock Compensation (Topic 718)(FASB Statement No. 123 (revised 2004), Share-Based Payment), andits related FSPs) which requires that the compensation expenseassociated with these awards be measured assuming that allparticipants will exercise SARs. Under the transition guidelines of theguidance, the requirements of Topic 718 are applicable to awardsgranted after the adoption. Since these SARs were awarded prior toadoption of the guidance, they continue to be accounted for underthe previous accounting guidance. Under Canadian GAAP, for stockoptions granted with SARs, a liability is recorded for the potentialcash payments to participants and compensation expense ismeasured assuming that all participants will exercise SARs.
Liabilities and equityUnder U.S. GAAP, shares issued with conversion or conditionalredemption features are classified as equity. Shares that aremandatorily redeemable, requiring the issuer to redeem theinstruments upon a specified date or upon an event that is certain tooccur are classified as liabilities. Under Canadian GAAP, financialinstruments that can be settled by a variable number of our commonshares upon their conversion by the holder are classified asliabilities. As a result, certain of our preferred shares and RBC TruCSare classified as liabilities under Canadian GAAP. Dividends and yielddistributions on these instruments are included in Interest expense inour Consolidated Statements of Income.
Pension and other post-employment benefitsTopic 715, Compensation – Retirement Benefits (Topic 715) (FASBStatement No. 158, Employers’ Accounting for Defined BenefitPension and Other Post-retirement Plans – an amendment of FASBStatements No. 87, 88, 106 and 132(R)) requires an entity to:(i) recognize the funded status of a benefit plan on the balance sheet;and (ii) recognize in OCI the existing unrecognized net actuarial gainsand losses, prior service costs and credits, and net transitional assetsor obligations. We are also required to measure defined benefit planassets and obligations as at the year-end date. We adopted theserequirements in 2009.
Canadian GAAP does not have the same requirements as Topic 715.For a defined benefit plan, the plan assets and the benefit obligationsmay be measured as of a date not more than three months prior tothe year end. We measure our benefit obligations and pension planassets as at September 30 each year.
Trade date accountingFor securities transactions, under U.S. GAAP, trade date basis ofaccounting is used for both our Consolidated Balance Sheets and ourConsolidated Statements of Income. Under Canadian GAAPsettlement date basis of accounting is used for our ConsolidatedBalance Sheets whereas trade date basis of accounting is used forour Consolidated Statements of Income.
Non-cash collateralUnder U.S. GAAP, non-cash collateral received in securities lendingtransactions is recorded on our Consolidated Balance Sheets as an asset
and a corresponding obligation to return it is recorded as a liability, if wehave the ability to sell or repledge it whereas under Canadian GAAP, it isnot recognized on our Consolidated Balance Sheets.
Right of offsetWhen financial assets and liabilities are subject to a legallyenforceable right of offset and we intend to settle these assets andliabilities with the same party either on a net basis or simultaneously,the financial assets and liabilities may be presented on a net basisunder U.S. GAAP and Canadian GAAP. As a result of recentamendments to U.S. GAAP, an entity is permitted to report on a netbasis the fair value of its derivative contracts and related cashcollateral with a counterparty with whom it has a master nettingagreement, regardless of whether there is intent to settle on a netbasis; however, this is not permitted under Canadian GAAP. Refer toSignificant accounting changes – Offsetting of amounts related tocertain contracts, later in this note for additional details on thisamendment. In addition, the netting criteria may be applied to atri-party transaction under Canadian GAAP.
Deferred unrealized gains or losses at inceptionAn unrealized gain or loss at inception for financial instruments is thedifference between the transaction price and its fair value on thetrade date. U.S. GAAP eliminates the deferral of unrealized gains orlosses at inception on derivative instruments whose fair value ismeasured using unobservable market inputs. Under Canadian GAAP,these unrealized gains or losses at inception are deferred.
Derivative instruments and hedging activities – non-derivativehedging instrumentCertain foreign currency-denominated available-for-sale assets havebeen hedged against foreign currency-denominated deposits. In orderto qualify for hedge accounting under U.S. GAAP, the hedginginstrument should be a derivative, unless it is a hedge of a foreignexchange exposure of a net investment in a self-sustaining foreignoperation or it relates to unrecognized firm commitments. Accord-ingly, the change in fair value of the available-for-sale assets,including the foreign exchange gain or loss, is recognized in OCI,whereas the change in translation gain or loss on the foreigncurrency-denominated deposits is recorded in income, resulting in amismatch. Under Canadian GAAP, a non-derivative hedginginstrument can be used to hedge any foreign currency risk exposure.
Two-class method of calculating earnings per shareWhen calculating earnings per share under U.S. GAAP, we arerequired to give effect to securities or other instruments or contractsthat entitle their holders to participate in undistributed earnings whensuch entitlement is nondiscretionary and objectively determinable.Canadian GAAP does not have such a requirement.
Cumulative translation adjustmentUnder U.S. GAAP, foreign currency translation gains and lossesrelating to our self-sustaining foreign operations that have beenaccumulated in AOCI can be recognized in income only when theforeign operation has been substantially or fully liquidated. UnderCanadian GAAP these gains and losses can be recognized in incomewhen there is a reduction in the net investment of our foreignoperations which may be even due to dividend distribution.
Loans held-for-saleUnder U.S. GAAP, loans held-for-sale are recorded at the lower of costor fair value. Under Canadian GAAP loans held-for-sale in the nearterm are measured at fair value.
136 Royal Bank of Canada: Annual Report 2010 Consolidated Financial Statements

Disposition of Liberty LifeAs stated in Note 11, we agreed to sell Liberty Life to Athene Holding Ltd.on October 22, 2010. Under U.S. GAAP, an estimated loss of$414 million, before and after-taxes, has been recorded in Non-interestincome – Other. The loss is higher under U.S. GAAP primarily due toaccounting differences in the valuation of actuarial liabilities. Thisamount includes a write-off of $5 million of goodwill. Our U.S. GAAPconsolidated financial statements include the results of Liberty Life forthe year ended October 31, 2010. Selected financial information forLiberty Life, including the loss on sale, is set out below.
2010 2009Non interest income $ 35 $ 411Insurance policyholder benefits, claims and
actuarial expenses (371) (366)Net interest expense (62) (76)
Net loss before tax (398) (31)Net loss (400) (39)
October 31 2010 October 31 2009Total assets $ 6,270 $ 5,426Total liabilities $ 5,262 $ 4,582
Restricted net assetsCertain of our subsidiaries and joint ventures are subject to regulatoryrequirements of the jurisdictions in which they operate. When thesesubsidiaries and joint ventures are subject to such requirements, theymay be restricted from transferring to us our share of their assets inthe form of cash dividends, loans or advances. At October 31, 2010,restricted net assets of these subsidiaries were $15.8 billion (2009 –$15.5 billion).
Pensions and other post-employment benefitsThe following information on our defined benefit plans is in additionto that disclosed in Note 20.
In 2009, we changed our measurement date from September 30to October 31 as described in the Material differences betweenCanadian and U.S. GAAP earlier in this note. The impact to RetainedEarnings and AOCI, net of taxes, of adopting this measurement daterequirement are presented in the following table:
2009Balance at the beginning of the year
Before adoptingmeasurement
requirements inTopic 715-20 Adjustments
After adoptingmeasurement
requirements inTopic 715-20
Retained earnings $ – $ (14) $ (14)Accumulated other
comprehensive loss $ 523 $ 3 $ 526
The funded status and discount rate using the October 31, 2010 measurement date are as follows:
2010 2009
Pension plans
Other post-employment
plans Total Pension plans
Other post-employment
plans Total
Other assetsPrepaid pension benefit cost $ 7,901 $ 12 $ 7,913 $ 6,268 $ 25 $ 6,293
Other liabilitiesAccrued pension and other post-employment benefit expense 7,833 1,409 9,242 6,810 1,340 8,150
Funded status – excess of benefit obligation over plan assets $ 68 $ (1,397) $(1,329) $ (542) $ (1,315) $(1,857)Weighted average assumptions to calculate benefit obligation
Discount rate 5.40% 5.34% 6.30% 6.32%
The (over)/under-funded status of the pension plans and other post-employment plans of $(68) million and $1,397 million (2009 –$542 million and $1,315 million), respectively, is recognized on our
Consolidated Balance Sheet in Other liabilities. The accumulatedbenefit obligations for the pension plans were $7,414 million as atOctober 31, 2010 (2009 – $6,451 million).
The pre-tax amounts included in AOCI are as follows:
2010 2009
Pension plans
Other post-employment
plans Total Pension plans
Other post-employment
plans Total
Net actuarial loss $ 1,793 $ 218 $2,011 $ 1,436 $ 221 $1,657Prior service cost (benefit) 26 (234) (208) 42 (258) (216)Transitional (asset) obligation (5) 1 (4) (6) 1 (5)Accumulated other comprehensive income (1) $ 1,814 $ (15) $1,799 $ 1,472 $ (36) $1,436
(1) Amount recognized in AOCI, net of tax, is $1.2 billion (2009 – $959 million).
The estimated net actuarial loss and prior service cost for the pensionplans that will be amortized from AOCI, on a pre-tax basis, intopension expense during 2011 are $291 million and $10 million,respectively, and pension expense will be reduced by $1 millionrelating to amortization of transitional assets. The estimated netactuarial loss and transitional obligation for Other post-employmentplans that will be amortized from AOCI, on a pre-tax basis, intopension expense during 2011 are $11 million and $nil, respectively,
and pension expense will be reduced by $23 million relating to theamortization of prior service benefit.
Fair value of pension plan assets and liabilitiesDefined benefit pension plan net assets are recorded at fair value andthe following is a description of the valuation methodologies used forour pension plan assets which are measured at fair value.
Consolidated Financial Statements Royal Bank of Canada: Annual Report 2010 137

Note 31 Reconciliation of the application of Canadian and United States generally accepted accounting principles (continued)
Cash and cash equivalents: Treasury Bills and short-term interestbearing notes are priced at face value due to the short-term nature ofthe instruments.
Federal, provincial and municipal bonds and corporate bonds anddebentures: Either an average of the bid and ask price or bid price isused for North American bonds.
Mortgages: Mortgages are valued by independent third-party pricingservices, based on current interest yields for similar mortgage loans.
Canadian and other corporate shares: For North American publiclytraded securities, current closing price from the exchange having thehighest volume traded for the valuation date is used. If there is nocurrent closing price, the current bid price or the next most recentlyavailable closing or bid is used. For international publicly tradedsecurities, closing price of the primary stock exchange is used. Fair
values of unlisted North American securities and warrants are basedon quoted prices from third-party pricing services.
Alternative investments and pooled funds: Fair value of pooled andhedge funds as well as hedge fund of funds is based on the net assetvalue of the funds.
Derivatives: Interest rate swaps are valued by model using interestrate swap curve based on mid prices. All futures, including such typeas interest rate, index and bond are valued at settlement price or lasttraded price if settlement price is not available. Exchange tradedequity options are valued using the mid price at closing for thevaluation date. Over-the-counter equity or bond options are valuedby model using a number of assumptions such as historical prices ofunderlying instrument, volatilities, dividend yields, repo rate,overnight and deposit rate. Currency forwards are priced byBloomberg and Reuters. Fair value of credit default swaps areprovided by pricing services and internal modelled values.
The following table presents the plan assets measured at fair value using the fair value hierarchy. Refer to Note 2 for the definition of the threelevels.
Defined benefit pension plansAs at October 31, 2010
Fair value measurements using Totalfair valueLevel 1 Level 2 Level 3
Cash and cash equivalents $ (26) $ 335 $ – $ 309Fixed income securities and mortgages (1)
Federal, provincial and municipal bonds $ 24 $ 2,007 $ – $ 2,031Corporate bonds and debentures 53 1,180 – $ 1,233Mortgages – 93 53 146
$ 77 $ 3,280 $ 53 $ 3,410Equity securities
Canadian corporate shares $ 1,353 $ – $ – $ 1,353Other Corporate shares 2,025 – – 2,025
$ 3,378 $ – $ – $ 3,378Alternative investments (2) $ – $ – $ 749 $ 749Derivative-related assets $ 338 $ 43 $ 2 $ 383Total assets at fair value $ 3,767 $ 3,658 $ 804 $ 8,229Derivative-related liabilities $ 222 $ 82 $ 12 $ 316Total liabilities at fair value $ 222 $ 82 $ 12 $ 316Net plan assets at fair value $ 3,545 $ 3,576 $ 792 $ 7,913
(1) Include pooled fund investments which are presented in the asset categories based on the nature of the underlying investments of the funds.(2) Alternative investments include hedge fund of funds of $225 million, multi-strategy hedge funds of $477 million and infrastructure funds of $47 million. The investment strategies of the
alternative investment funds are as follows:(i) Hedge fund of funds invest in a portfolio of underlying hedge funds, providing broad exposure to a mixture of hedge fund strategies and thus diversifying the risk associated with a
single hedge fund.(ii) Multi-strategy hedge funds comprise multiple underlying strategies, typically including Commodity Trading Advisor (CTA)/Managed Futures, Global Macro, Long/Short Equity and Long/
Short Credit hedge funds. CTA/Managed Futures hedge funds take both long and short positions in futures contracts and options on futures contracts in global commodity, interestrate, equity, and currency markets. Global Macro hedge funds take positions in financial derivatives and other securities on the basis of movements in global financial markets. Thestrategies may position their portfolios based on forecasts and analysis on global systemic factors. Long/Short Equity hedge funds involve simultaneous purchase and sale equitieswhere the long positions are perceived to be undervalued and the short positions perceived to be overvalued. Long/Short Credit hedge funds similarly invest in long credit positionsperceived to be undervalued and sell short credit positions that are perceived to be overvalued.
(iii) Infrastructure funds are private investments in essential assets that provide core services or facilities necessary for an economy to function including roads, water, sewers, power grids,telecommunications.
The following table presents the changes in fair value measurements for instruments included in Level 3 of the fair value hierarchy.
Net level 3 defined benefit pension plan assets2010
Fair valueNovember 1,
2009
Actual return of plan assets
Purchases, salesand settlements
Transfers intoand/or out of
Level 3 (1)
Fair valueOctober 31,
2010Realized gains
(losses) (1)Unrealized gains
(losses) (1)
Fixed income securities and mortgagesMortgages $ 57 $ – $ – $ (4) $ – $ 53
Alternative investments 441 (1) 33 276 – 749Derivatives, net of related liabilities (8) (3) (7) 8 – (10)Net pension plan assets at fair value $ 490 $ (4) $ 26 $ 280 $ – $ 792
(1) Transfers in or out of Level 3 are assumed to occur at the end of the period. For an asset or a liability that transfers into Level 3 during the period, the entire change in fair value for the periodis excluded from the Actual return of plan assets columns of the reconciliation, whereas for transfers out of Level 3 during the period, the entire change in fair value for the period is includedin the same columns of the reconciliation.
138 Royal Bank of Canada: Annual Report 2010 Consolidated Financial Statements

SecuritiesThe following table presents the duration of the unrealized losses onour available-for-sale securities. Refer to Note 3 for the reasons whythese securities are considered to be not other-than-temporarilyimpaired as at October 31, 2010. The gross unrealized losses of the
available-for-sale securities under U.S. GAAP are higher than thoseunder Canadian GAAP as disclosed in Note 3, primarily becausecertain of these securities were designated as held-for-trading usingthe fair value option and also due to the reclassification of certainavailable-for-sale securities to loans under Canadian GAAP.
Fair value and unrealized losses position for available-for-sale securities2010
Less than 12 months 12 months or more Total
Fair valueUnrealized
losses Fair valueUnrealized
losses Fair valueUnrealized
losses
Canadian government debtFederal $ 510 $ 1 $ – $ – $ 510 $ 1Provincial and municipal 17 1 10 – 27 1
U.S. state, municipal and agencies debt 748 3 42 1 790 4Other OECD government debt 774 3 16 1 790 4Mortgage-backed securities (1) 119 7 1,390 186 1,509 193Asset-backed securities – –
CDOs – – 198 17 198 17Non-CDO securities 1,099 6 508 29 1,607 35
Corporate debt and other debt 2,486 87 774 182 3,260 269Equities 26 6 45 5 71 11Loan substitute securities – – – – – –
$ 5,779 $ 114 2,983 $ 421 $ 8,762 $ 535
(1) The majority of the MBS are residential. Fair value and unrealized losses of commercial MBS for less than 12 months are $nil and $nil, respectively and for 12 months or more are $58 millionand $2 million, respectively.
2009Less than 12 months 12 months or more Total
Fair valueUnrealized
losses Fair valueUnrealized
losses Fair valueUnrealized
losses
Canadian government debtFederal $ 1,213 $ 8 $ – $ – $ 1,213 $ 8Provincial and municipal 148 4 93 2 241 6
U.S. state, municipal and agencies debt 162 1 487 27 649 28Other OECD government debt 503 2 74 2 577 4Mortgage-backed securities (1) 496 118 2,113 379 2,609 497Asset-backed securities
CDOs – – 205 24 205 24Non-CDO securities 724 15 275 68 999 83
Corporate debt and other debt 1,382 42 1,887 305 3,269 347Equities 59 40 97 23 156 63Loan substitute securities – – 150 70 150 70
$ 4,687 $ 230 $ 5,381 $ 900 $ 10,068 $ 1,130
(1) The majority of the MBS are residential. Fair value and unrealized losses of commercial MBS for less than 12 months are $nil and $nil, respectively and for 12 months or more are $197million and $23 million, respectively.
Average assets, U.S. GAAP2010 2009 (1) 2008 (1)
Average assets
% of totalaverage
assets Average assets
% of totalaverage
assets Average assets
% of totalaverage
assets
Canada $ 363,540 59% $ 380,065 61% $ 371,183 60%United States 139,189 22% 147,722 24% 147,233 24%Other International 116,217 19% 93,918 15% 100,266 16%
$ 618,946 100% $ 621,705 100% $ 618,682 100%
(1) Average assets have been revised due to the corrections explained at the beginning of this Note and the reclassification explained in footnote 2 to the Condensed Balance Sheets in this note.
Income taxesUnder Topic 740, Income Taxes (Topic 740), income tax benefits arerecognized and measured based on a two-step model: (i) a taxposition must be more-likely-than-not of being sustained where“more-likely-than-not” means a likelihood of more than 50%, and(ii) the benefit is measured as the dollar amount of the position that
is more-likely-than-not of being realized upon ultimate settlementwith a taxing authority. The difference between the tax benefitrecognized in accordance with this guidance and the tax benefitclaimed on a tax return is referred to as an unrecognized taxbenefit (UTB).
Consolidated Financial Statements Royal Bank of Canada: Annual Report 2010 139

Note 31 Reconciliation of the application of Canadian and United States generally accepted accounting principles (continued)
A reconciliation of the change in the UTB balance (excluding anyrelated accrual for interest and penalties) from October 31, 2009 toOctober 31, 2010 is as follows:
Reconciliation of the Change in Unrecognized Tax BenefitsBalance, October 31, 2009 $1,007Add: Increases related to positions taken during prior years 31Add: Increases related to positions taken during the current year 201Less: Expiration of statute of limitations (74)Less: Settlements (29)Less: Foreign exchange and other (4)Less: Decreases related to positions taken during prior years (123)
Balance, October 31, 2010 $1,009
As at October 31, 2010 and 2009, the balances of our UTBs,excluding any related accrual for interest and penalties, were $1,009million and $1,007 million, respectively, of which $1,005 million and$988 million, respectively, if recognized, would affect our effective taxrate. It is difficult to project how unrecognized tax benefits will changeover the next 12 months.
Under Topic 740, we continue our policy of accruing incometax-related interest and penalties within income tax expense. As atOctober 31, 2010 and 2009, our accrual for interest and penaltiesthat relate to income taxes, net of payments on deposit to taxingauthorities, were $53 million and $40 million, respectively. There wasa net increase of $13 million in the accrual for interest and penaltiesduring the year ended October 31, 2010.
RBC are subject to Canadian federal and provincial income tax,U.S. federal, state and local income tax, and income tax in otherforeign jurisdictions. The following are the major tax jurisdictions inwhich RBC operate and the earliest tax year subject to examination:Canada – 2006, United States – 2003 and United Kingdom – 2009.
Framework on fair value measurementTopic 820, Fair Value Measurements and Disclosures (Topic 820)(FASB Statement No. 157, Fair Value Measurements and relatedpronouncements), defines fair value as the price that would bereceived to sell an asset or paid to transfer a liability in an orderlytransaction between market participants at the measurement date.Topic 820 requires an entity to maximize the use of observable inputsand minimize the use of unobservable inputs to measure the fairvalues of its assets and liabilities and requires an entity to include theimpact of its own credit risk in measuring derivatives and otherliabilities measured at fair value. It also eliminates the deferral ofunrealized gains or losses at inception on derivative instrumentswhose fair value is measured using unobservable market inputs andprecludes the use of block discounts that were previously applied tolarge holdings of securities traded in an active market. On adoption,any unrealized gains or losses at inception and adjustments for blockdiscounts, if any, had been recognized as a transition adjustment inretained earnings.
With the adoption of Topic 820, deferral of inception gains andlosses previously required under U.S. GAAP is no longer required.Valuation adjustments for unrealized gains or losses at inception,recognized in accordance with the previous guidance, werereclassified into other valuation adjustment categories. Thereclassification had no impact on the overall amount of valuationadjustments. The remaining balance of $38 million as at October 31,2009, net of taxes, relating to the adjustment for unrealized gains orlosses at inception has been recognized as a transition adjustment asan increase to our opening retained earnings under U.S. GAAP.
Fair value hierarchyTopic 820 prescribes a three-level fair value hierarchy for disclosurepurposes based on the transparency of the inputs used to measurethe fair values of assets and liabilities. Specific guidance underTopic 820, which became effective for us on May 1, 2009, providesadditional factors to consider while measuring fair value when there
has been significant decrease in the level of market activity for anasset or a liability and to determine whether quoted prices areassociated with transactions that are not considered to be orderly. Italso expands the disclosure requirements of the fair value of financialinstruments. Additional guidance under Topic 820 (ASU 2009-05,Measuring Fair Value Liabilities) specifies the valuation techniquesthat are required to be applied to measure fair value when a quotedprice in an active market of an identical liability is not available.
Refer to Note 2 for the fair value hierarchy and the reconciliationof Level 3 financial instruments under Canadian GAAP. Balances offinancial instruments in the U.S. GAAP fair value hierarchy differ fromthose of Canadian GAAP primarily due to non-cash collateral, trade-date accounting, election of the fair value option under CanadianGAAP for investments supporting the policy benefit liabilities on lifeand health insurance contracts as opposed to available-for-saleclassification under U.S. GAAP, and joint ventures accounting. Referto the Material balance sheet reconciling items table earlier in thisnote for the amounts of these reconciling differences.
Valuation models and inputsFair values of certain instruments classified as level 2 or 3 in the fairvalue hierarchy disclosure in Note 2 are determined using valuationmodels. The significant financial instruments below are valued usingan income approach, and their significant inputs are primarily interestrate yield curves, correlation, commodity forward prices, currencyforward points, dividend rates, and volatility rates for their respectivecurrency and term to maturity. The following are some of the short andlong-term model inputs we used:• Interest rate inputs of commercial paper, Certificates of Deposit,
Banker Acceptances, LIBOR loans, bank deposits, bank loansand bank notes include: (a) Bank deposits – .25% to .27% (U.S.)from one week to three months, (b) Bank loans and notes –.91% to 1.41% for Canadian instruments and .24% to .36% forU.S. instruments from less than one month to over six months,(c) Banker Acceptances – .98% to 1.34% from less than onemonth to over six months, (d) Certificate of Deposits – .30%(Swiss Franc) and .85% (Euro) for three months, (e) U.S.commercial paper – .30% to .32% from one week to threemonths, (f) Canadian commercial paper – 1.01% to 1.18% fromone week to three months and (g) U.S. LIBOR loans – .24% to.36% from less than one month to over 6 months.
• Overnight interest rates of assets purchased under reverserepurchase agreements and obligations related to assets soldunder repurchase agreements (pound sterling, Euro, Canadian,U.S. and Australian dollars) range from .23% to 3.00%, while themedium–term rates (one week) and long-term rates (one month)are from .25% to 4.51% and from .25% to 4.60%, respectively.
• Interest rate inputs of the interest rate swaps are: (a) two to20-year Canadian dollar swaps – 1.51% to 3.68%, (b) two to20-year U.S. dollar swaps – .45% to 3.47%, (c) two to 30-yearJapanese yen swaps – .38% to 1.90%, (d) two to 30-year poundsterling swaps – 1.28% to 3.87%, (e) two to 30-year Euroswaps – 1.59% to 2.97%, (f) two to 30-year Swiss Franc swaps –.53% to 1.87% and (g) two to 30-year Australian dollar swaps –5.15% to 5.42%.
• Volatility inputs of non-vanilla interest rate options consist of:(a) one-month to 20-year Canadian dollar options – 29.67% to12.18%, (b) one-month to 20-year U.S. dollar options – 106.2%to 17.5%, (c) one-month to 20-year Japanese yen options –44.2% to 23.9% and (d) one-month to 20-year pound sterlingoptions – 40.6% to 11.7%.
• Volatility inputs of vanilla interest rate options consist of:(a) one-month to 20-year Euro options – 40.5% to 26.7% and(b) 1 month to 25 year U.S. options – 134.0% to 26.0%.
• Volatility inputs of one-month to 20-year Canadian dollarswaptions range from 32% to 19%.
• Volatility inputs of over-the-counter currency options are: (a) sixmonths to 5-year Canadian dollar options – 12.70% to 13.45%,(b) one to 20-year Japanese yen options – 13.60% to 19.55%,
140 Royal Bank of Canada: Annual Report 2010 Consolidated Financial Statements

(c) six months to 5-year pound sterling options – 12.50% to14.20%, and (d) six months to 5-year Euro options – 14.02% to12.70%.
• Number of basis points added to spot rate to calculate forwardrate of the currency forward range from .21 points for overnightand 101.5 points for one year.
• Dividend rates of equity forwards and swaps comprise 0% to 3%for both 1.5 years and 3.5 years.
• Forward rates of gold are .42% for one month and .82% for oneyear.
• Correlation of 1.7 to 7.2-year Canadian and U.S. dollar CDOsrange from 45.07% to 69.10% and from 40.00% to 41.77%,respectively.
Fair value measurement on non-financial assets and liabilitiesGuidance on fair value measurement and disclosures (Topic 820) fornonfinancial assets and liabilities became effective for us onNovember 1, 2009. Under the new guidance, fair value hierarchymodel, as discussed above for financial instruments, are alsoapplicable to assets and liabilities that are measured at fair value ona nonrecurring basis in periods subsequent to initial recognition.Additional disclosures, if applicable, are also required to enable
users to assess inputs used to develop those measurements that arerelated to impairment and other fair value calculations.
Investments in certain entities that calculate net asset value per shareOur alternative investments primarily include hedge funds held inconnection with hedging of exposure related to fee-based equityderivative transactions with third parties. Fair value of theseinvestments is based on the net asset value of the hedge funds. As atOctober 31, 2010, the fair value of our investments in the U.S.domiciled and the non-U.S. domiciled hedge funds were $553 millionand $2,021 million, respectively, and there were no unfundedcommitments related to these funds. These U.S. domiciled and thenon-U.S. domiciled hedge funds employ a broad variety of investmentstrategies using equities, fixed income securities and other financialinstruments. The redemption provisions of such hedge fundsgenerally (a) require notice periods ranging from 5 days to over180 days, (b) allow redemptions on a weekly, monthly, quarterly,semi-annually or annual basis, (c) may have lockup provisionsrestricting the ability to redeem for the first 3 to 36 months from thedate of investment and (d) often have mechanisms to gate orotherwise restrict redemptions notwithstanding (a) – (c) above.
Fair value option for financial assets and liabilitiesTopic 825-10, which gives an entity the option to report selectedfinancial assets and liabilities at fair value and establishes newdisclosure requirements for assets and liabilities to which the fairvalue option is applied, became effective for us on November 1,2008. The difference between the carrying amount and the fair valueof the eligible items for which the fair value option was elected as atNovember 1, 2008 was included in opening retained earnings as acumulative-effect adjustment which was an increase of $81 millionafter taxes.
Our accounting policy on electing the fair value option isdescribed in Note 1 and in the ‘Material differences between
Canadian and U.S. GAAP’ section of this note. The following tablepresents the categories of financial assets and liabilities elected forfair value option in accordance with guidance under Topic 815-15-25,Derivatives and Hedging – Embedded Derivatives (FASB StatementNo. 155, Accounting for Certain Hybrid Financial Instruments – anamendment of FASB Statements No. 133 and 140 ) and Topic 825-10,as well as the difference between the aggregate fair value and theaggregate remaining contractual maturity amount for loans and long-term debt for which the fair value option has been elected underthese standards:
2010 2009
Aggregatefair value
carryingamount
Contractualmaturityamount
Fair valueover
(under)contractual
maturityamount
Aggregatefair value
carryingamount
Contractualmaturityamount
Fair valueover
(under)contractual
maturityamount
Financial assetsInterest-bearing deposits with banks $ 6,193 $ 6,193 $ – $ 2,773 $ 2,773 $ –Securities – Trading 6,258 n.a. n.a. 1,718 n.a. n.a.Assets purchased under reverse repurchase agreements and securities
borrowed 51,713 51,747 (34) 18,911 18,914 (3)Loans – Retail 179 176 3 214 214 –Loans – Wholesale 2,899 3,000 (101) 2,818 2,934 (116)
Performing loans 2,899 3,000 (101) 2,441 2,557 (116)90 days or more past due but not impaired – – – 377 377 –
Financial liabilitiesDeposits
Personal $ 3,237 $ 3,300 $ (63) $ 2,605 $ 2,605 $ –Business and government 62,654 62,597 57 40,335 40,167 168Bank 9,479 9,479 – 10,880 10,880 –
Obligations related to assets sold under repurchase agreements andsecurities loaned 26,242 26,243 (1) 21,628 21,626 2
Other liabilities 127 127 – 240 240 –Subordinated debentures 119 127 (8) 110 120 (10)
The unrealized gains of these assets and liabilities recognized inincome for the year ended October 31, 2010 was $52 million (October31, 2009 – unrealized loss of $443 million). The amount of changesin fair value attributable to changes in credit risk for loans andreceivables and attributable to our credit spreads for our financialliabilities, and the methodology to determine these amounts aredisclosed in Note 2. Changes in fair value since November 1, 2009attributable to changes in our credit spreads decreased the fair valueof our term deposit liabilities by $32 million (October 31, 2009 –$550 million). This decrease is primarily due to the increase in our
credit spreads for both Canadian and U.S. denominated term depositliabilities. Changes in fair value in the period attributable to changesin credit risk or our credit spreads on Loans – Wholesale, Otherliabilities and Subordinated debentures were $(51) million, $nil and$(6) million, respectively (2009 – $27 million, $nil and $36 million).
Interest income and expense of these debt securities and loansare measured based on their interest rates and are reported in Netinterest income.
Consolidated Financial Statements Royal Bank of Canada: Annual Report 2010 141

Note 31 Reconciliation of the application of Canadian and United States generally accepted accounting principles (continued)
Derivatives and hedging activitiesTopic 815, Derivatives and Hedging (Topic 815) requires an entity todisclose how and why it uses derivatives, how it accounts forderivatives and any related hedged item, and how derivatives andhedged items affect the entity’s financial position, performance andcash flows. The guidance was effective for us on February 1, 2009,but did not change the accounting for derivatives and hedged items.Refer to Notes 1 and 7 for more information regarding our use ofderivative instruments and hedging activities.
Fair value of derivatives by major types of productsThe following table presents the fair values of the derivatives andnon-derivative financial instruments categorized by their hedgingrelationships, as well as derivatives that are not designated inhedging relationships.
2010 2009Designated as hedging instruments
in hedging relationshipsDesignated as hedging instruments
in hedging relationships
Cashflow
hedges
Fairvalue
hedges
Netinvestment
hedges
Not designatedin a hedging
relationship (1)Cash flow
hedges
Fairvalue
hedges
Netinvestment
hedges
Not designatedin a hedging
relationship (1)
AssetsDerivative financial instruments
Interest rate contracts $ 505 $2,059 $ – $ 65,030 $1,130 $2,107 $ – $ 50,732Foreign exchange contracts – – 307 29,448 – – 139 25,598Credit derivatives – – – 2,023 – – – 5,320Other contracts – – – 3,757 – – – 7,359
Total $ 505 $2,059 $ 307 $ 100,258 $1,130 $2,107 $ 139 $ 89,009
LiabilitiesDerivative financial instruments
Interest rate contracts $ 812 $ 60 $ – $ 61,226 $1,493 $ 82 $ – $ 46,551Foreign exchange contracts – – 119 34,873 – – 327 23,832Credit derivatives – – – 1,718 – – – 4,418Other contracts – – – 5,346 – – – 7,844
Total $ 812 $ 60 $ 119 $ 103,163 $1,493 $ 82 $ 327 $ 82,645
Non–derivative financial instruments $ – $ – $ 8,732 n.a. $ – $ – $ 5,233 n.a.
(1) Derivative liabilities include stable value contracts on $170 million (October 31, 2009 – $257 million) of bank-owned life insurance policies and $2 million (October 31, 2009 – $3 million) of401(k) plans.
n.a. not applicable
Hedging activities by major types of products2010 2009
Net gains(losses)
included inNon-interest
income
Net gains(losses)
included inNet interest
income
After-taxunrealized
gains (losses)included in
OCI
Net gains(losses)
included inNon-interest
income
Net gains(losses)
included inNet interest
income
After-taxunrealized
gains (losses)included in
OCI
Fair value hedgesIneffective portion
Interest rate contracts $ (4) $ n.a. $ n.a. $ 9 $ n.a. $ n.a.Cash flow hedgesIneffective portion
Interest rate contracts (20) n.a. n.a. 9 n.a. n.a.Effective portion
Interest rate contracts n.a. n.a. (332) n.a. n.a. 185Other contracts n.a. n.a. (2) n.a. n.a. –
Reclassified to income during the period (1)
Interest rate contracts n.a. (112) n.a. n.a. 53 n.a.Other contracts n.a. (6) n.a. n.a. – n.a.
Net investment hedgesForeign currency losses n.a. n.a. (1,798) n.a. n.a. (2,971)Gains from hedges
Foreign exchange contracts n.a. n.a. 1,209 n.a. n.a. 1,982Non-derivative financial instruments n.a. n.a. 270 n.a. n.a. 417
$ (24) $ (118) $ 1,146 $ 18 $ 53 $ (387)
(1) After-tax loss of $82 million (October 31, 2009 – $37 million) were reclassified from AOCI to income for the year ended October 31, 2010.n.a. not applicable
Revenue from trading and selected non-trading financial instruments2010 2009
Non-interest incomeInterest rate and credit $ 1,114 $ 1,954Equities (140) 169Foreign exchange and commodities (1) 407 641
Total $ 1,381 $ 2,764
(1) Includes precious metals.
Contingent featuresCertain derivative instruments contain provisions that link ourcollateral posting requirements to our credit ratings from the majorcredit rating agencies. If our credit ratings were to fall, certaincounterparties to the derivative instruments could request immediatepayment or demand immediate and ongoing overnightcollateralization on net derivative liability positions. The aggregatenet fair value of all derivative instruments with collateral postingrequirements that are in a net liability position on October 31, 2010,
142 Royal Bank of Canada: Annual Report 2010 Consolidated Financial Statements

is $18.3 billion (October 31, 2009 – $10.5 billion) for which we haveposted collateral of $14.9 billion (October 31, 2009 – $6.4 billion) inthe normal course of business. If our credit ratings had beendowngraded to BBB on October 31, 2010, we would have beenrequired to post an additional $2.7 billion of collateral (October 31,2009 – $2.2 billion) to the counterparties of these contracts. If ourcredit ratings were to fall below BBB, we do not expect that theadditional collateral that we would be required to post would bematerial.
Credit derivatives and guaranteesASC Topic 815, requires more disclosure about the potential adverseeffects of changes in credit risk on the financial position, financialperformance and cash flows of the sellers of credit derivatives,including credit derivatives embedded in hybrid instruments. Theguidance also amends Topic 460, Guarantees to require additionaldisclosure about the current status of the payment/performance riskof a guarantee. The following disclosure is provided pursuant to ASCTopic 815.
Events or circumstances that would require seller to perform underthe credit derivativeCredit derivatives are over-the-counter contracts that transfer creditrisk related to an underlying financial instrument (referenced asset)from one counterparty to another. Credit derivatives provideprotection against the decline in value of the referenced asset as aresult of specified credit events such as default or bankruptcy.
Credit derivative instruments soldCredit derivative instruments for which we are the seller of creditprotection are summarized in the table below. These instrumentshave been classified as investment and non-investment grade basedon the credit quality of the underlying referenced asset within thecredit derivative. For most credit derivatives, the notional valuerepresents the maximum amount payable by us. However, we do notexclusively monitor our exposure to credit derivatives based onnotional value because this measure does not take into considerationthe probability of occurrence. As such, the notional value is not areliable indicator of our exposure to these contracts.
Credit derivatives – protection sold by ratings/maturity profile2010 2009
Maximum Payout / Notional Fair value Maximum Payout / Notional Fair value
Within 1year
1 to5 years
Over5 years Total Positive Negative
Within1 year
1 to5 years
Over5 years Total Positive Negative
Credit default swaps (1)
Investment grade (2) $1,718 $ 5,759 $1,351 $ 8,828 $ 85 $ 79 $6,380 $19,864 $5,338 $31,582 $ 227 $1,105Non-investment grade (2) 1,906 8,708 2,639 13,253 200 646 1,668 6,880 1,489 10,037 74 1,377Non-rated 213 8,071 3,120 11,404 74 90 707 7,279 532 8,518 33 368
$3,837 $22,538 $7,110 $33,485 $ 359 $ 815 $8,755 $34,023 $7,359 $50,137 $ 334 $2,850
Credit default basketsNot rated (3) $ 66 $ 4,320 $2,216 $ 6,602 $ – $ 493 $1,161 $ 4,538 $2,543 $ 8,242 $ – $1,074
Total (4) $3,903 $26,858 $9,326 $40,087 $ 359 $1,308 $9,916 $38,561 $9,902 $58,379 $ 334 $3,924
(1) Credit default swaps include total return swaps which are nominal to the entire portfolio.(2) Credit ratings of AAA, AA, A and BBB represent investment grade ratings and ratings of BB or lower represent non-investment grade ratings. These credit ratings largely reflect those assigned
by external rating agencies and represent the payment or performance risk of the underlying security or referenced asset. Where external ratings were not available, our internal ratings wereused.
(3) Credit default baskets are similar to credit default swaps except that the underlying referenced financial instrument is a group of assets instead of a single asset; consequently, ratings havenot been assigned because the underlying asset(s) cannot be reasonably rated.
(4) At October 31, 2010 the notional value and net carrying value of credit protection sold in which we held purchased protection with identical underlying assets was $30.5 billion and$0.7 billion, respectively (October 31, 2009 – $48.7 billion and $2.5 billion, respectively).
GuaranteesThe following table summarizes significant guarantees we have provided to third parties by investment grade and non-investment grade.
2010 2009Maximum potential amount of future payments
Carryingamount
Maximum potential amount of future payments
Carryingamount
Investmentgrade (1)
Non-investment
grade (1)Not
rated TotalInvestment
grade (1)
Non-investment
grade (1)Not
rated Total
Credit derivatives andwritten put options (2) $ 1,450 $ 2,306 $7,848 $11,604 $ 365 $ 7,508 $ 3,813 $8,399 $19,720 $1,049
Backstop liquidity facilities 20,184 643 – 20,827 55 23,806 1,176 – 24,982 66Stable value products 19,683 – – 19,683 172 21,777 – – 21,777 260Financial standby letters of
credit and performanceguarantees (3) 12,505 5,271 78 17,854 90 11,236 6,778 68 18,082 96
Credit enhancements 3,211 – – 3,211 66 3,240 – – 3,240 45Mortgage loans sold with
recourse – 323 – 323 – 1,103 – – 1,103 –
(1) Credit ratings of AAA, AA, A and BBB represent investment grade ratings and ratings of BB or lower represent non-investment grade ratings. These credit ratings largely reflect those assignedby external rating agencies and represent the payment or performance risk of the underlying security or referenced asset. Where external ratings were not available, our internal ratings wereused.
(2) Ratings could not be assigned to credit default swaps of $2.9 billion (October 31, 2009 – $1.9 billion) and written put options of $4.9 billion (October 31, 2009 – $6.5 billion).(3) Ratings could not be assigned to financial standby letters of credit and performance guarantees with a maximum potential amount of future payments of $78 million as the rating of the
underlying entity for these guarantees is not available at this time.
Securitizations and VIEsASC Topic 860, Transfers and Servicing and ASC Topic 810,Consolidation require public entities to provide additional disclosuresrelated to their continuing involvement with transferred financialassets and the related risk retained as well as any contractual or
non-contractual support provided and any future financial support tothe special purpose entities (SPEs). In addition, the amendments alsorequire public enterprises, including sponsors that have a variableinterest in a variable interest entity, to provide additional disclosuresabout their involvement with variable interest entities.
Consolidated Financial Statements Royal Bank of Canada: Annual Report 2010 143

Note 31 Reconciliation of the application of Canadian and United States generally accepted accounting principles (continued)
SecuritizationsOur securitization activities by major product type, our continuinginvolvement with the transferred asset and the related risk retainedare described in Note 5.
The following table presents the total assets of the QSPE usedfor credit card securitizations and the classification of assets andliabilities recorded on our Consolidated Balance Sheets associatedwith our transactions with the QSPE and the SPEs.
2010 2009Interest in
securitizationsInterest in
securitizations
Creditcards
Commercialand
Residentialmortgages
Creditcards
Commercialand
Residentialmortgages
Total assets of QSPE (1) $4,000 n.a. $3,923 n.a.
On-balance sheet assetsSecurities – Trading and
Available-for-sale $ 436 $ 1,092 $1,014 $ 1,479Loans – Retail and Wholesale 9 – 6 –Derivatives 19 617 – 203
Total $ 464 $ 1,709 $1,020 $ 1,682
On balance sheet liabilitiesDerivatives $ – $ 1,407 $ 6 $ 673
Total $ – $ 1,407 $ 6 $ 673
(1) Represents the remaining principal balance of assets held by the QSPE using the mostcurrent information available.
n.a. not applicable.
Loans managed2010 2009
Loanprincipal
Pastdue (1)
Netwrite-offs
Loanprincipal
Pastdue (1)
Netwrite-offs
Retail $263,391 $1,786 $ 1,234 $246,038 $1,752 $ 1,300Wholesale 72,520 2,969 877 77,581 3,246 1,233
Total loansmanaged (2) $335,911 $4,755 $ 2,111 $323,619 $4,998 $ 2,533
Less: Loanssecuritized andmanagedCredit card
loans 3,265 50 129 3,870 57 140Canadian
residentialmortgage-backedsecuritiescreated andsold 28,238 232 – 28,815 204 –
Canadianresidentialmortgage-backedsecuritiescreated andretained 9,270 76 – 7,521 53 –
U.S. residentialmortgage-backedsecuritiescreated andsold 667 4 – 429 6 –
Total loansreported on theConsolidatedBalance Sheets $294,471 $4,393 $ 1,982 $282,984 $4,678 $ 2,393
(1) Includes impaired loans as well as loans that are contractually 90 days past due but arenot considered impaired.
(2) Excludes any assets we have temporarily acquired with the intent at acquisition to sellto SPEs.
VIEsWe perform qualitative, and in certain cases, quantitative, analyses todetermine whether we are the Primary Beneficiary of a VIE based onthe facts and circumstances and our interests in the VIE. We may alsohold significant variable interests in VIEs, and while we do notconsolidate these VIEs, we have recorded on our ConsolidatedBalance Sheets assets and liabilities arising from our transactionsand involvement with these VIEs. This information is set forth in the
table below. In addition, ASC Topic 810 requires disclosures for VIEsthat we sponsor and in which we hold variable interests. Indetermining whether we are a sponsor of a VIE, we consider bothqualitative and quantitative factors, including the purpose and natureof the VIE, our continuing involvement in the VIE and whether we holdsubordinated interests in the VIE. This table also includes VIEs forwhich we are sponsors of and hold a variable interest in, even if notsignificant.
2010 2009
Multi-sellerconduits (1)
Structuredfinance
VIEs
Creditinvestment
productVIEs (2) Other (3) Total
Multi-sellerconduits (1)
StructuredfinanceVIEs (4)
Creditinvestment
productVIEs (2)
Third-party
conduits Other (3) Total
Total assets ofunconsolidated VIEs $ 21,847 $ 5,380 $ 1,372 $132,239 $160,838 $ 26,181 $ 7,160 $ 2,662 $ 575 $123,691 $160,269On-balance sheet assetsCash and due from banks – – – – – – – – – 27 27Interest-bearing deposits
with banks – – – – – – – – – 119 119Securities – Trading and
Available-for-sale 4 834 20 196 1,054 4 1,308 – – 125 1,437Loans – Retail and
Wholesale 1,517 426 – – 1,943 1,683 1,499 – 119 – 3,301Derivatives – 20 79 – 99 – 30 698 – – 728Other assets – – – 263 263 – – – – 240 240
Total $ 1,521 $ 1,280 $ 99 $ 459 $ 3,359 $ 1,687 $ 2,837 $ 698 $ 119 $ 511 $ 5,852
On-balance sheet liabilitiesDerivatives $ – $ – $ – $ – $ – $ – $ – $ 168 $ – $ 25 $ 193Other liabilities 62 – 186 99 347 86 – 904 – 1 991
Total $ 62 $ – $ 186 $ 99 $ 347 $ 86 $ – $ 1,072 $ – $ 26 $ 1,184
Maximum exposure to loss $ 22,139 $ 3,095 $ 19 $ 244 $ 25,497 $ 26,550 $ 3,577 $ 505 $ 250 $ 228 $ 31,110
(1) Total assets represent maximum assets that may have to be purchased by the conduits under purchase commitments outstanding as at October 31, 2010. Actual assets held by theseconduits as at October 31, 2010, were $14.0 billion (October 31, 2009 – $18.9 billion).
(2) Excluded from this table are trading securities that we have transferred to these VIEs as collateral for the funded Notes issued by the VIEs as at October 31, 2010. The transfers do not meetthe sale recognition criteria under ASC Topic 860; as a result, these assets remain on our Consolidated Balance Sheets and are accounted for as secured borrowings.
(3) Includes tax credit funds and mutual funds that we sponsor which are described in our Other significant vehicles discussion.(4) Our October 31, 2009 comparatives have been revised to present information related to a certain entity on a net basis that was previously presented on a gross basis. The total gross and net
assets related to this entity as at October 31, 2009 were $4,177 million and $471 million, respectively.
144 Royal Bank of Canada: Annual Report 2010 Consolidated Financial Statements

The following table presents the assets and liabilities of consolidated VIEs recorded on our Consolidated Balance Sheets.
VIEs2010 2009
Structuredfinance VIEs
Investmentfunds Other (1) Total
Structuredfinance VIEs
Investmentfunds Other (1) Total
Consolidated assets (2), (3)Cash $ 29 $ 47 $ – $ 76 $ 55 $ 65 $ – $ 120Securities – Trading and Available-for-sale 1,615 911 – 2,526 1,025 481 – 1,506Loans – Retail and Wholesale 1,346 – 15,738 17,084 1,496 – 11,356 12,852Other assets 8 55 26 89 44 42 34 120
$ 2,998 $ 1,013 $ 15,764 $ 19,775 $ 2,620 $ 588 $ 11,390 $ 14,598
Consolidated liabilitiesOther liabilities (4) $ 2,989 $ 17 $ 42 $ 3,048 $ 2,445 $ 62 $ – $ 2,507
(1) Includes the assets of RBC Covered Bond Guarantor Limited Partnership (Guarantor LP).(2) As at October 31, 2010, our compensation vehicles held $53 million (October 31, 2009 — $64 million) of our common shares, which are reported as Treasury shares and this amount
represents the total assets of these vehicles. The obligation to provide our common shares to employees is recorded as an increase to Contributed surplus as the expense for thecorresponding stock-based compensation plan is recognized.
(3) Investors of a consolidated VIE have recourse only to the assets of that VIE and do not have recourse to our general assets unless we breach our contractual obligations relating to that VIE,provide liquidity facilities or credit enhancement facilities to, or enter into derivative transactions with, that VIE. In the ordinary course of business, the assets of each consolidated VIE cangenerally only be used to settle the obligations of the VIE. Upon the occurrence of certain credit events, the assets of Guarantor LP, which are mortgages, will be used to settle the coveredbonds issued by Royal Bank of Canada. The loan provided by us to Guarantor LP to purchase the mortgages is eliminated by us upon consolidation.
(4) Other liabilities generally represent notes issued by the VIEs.
The disclosures provided below should be read in conjunction withthose provided in Note 6.
Multi-seller and third-party conduitsWe do not maintain any ownership or retained interests in the sixmulti-seller asset-backed commercial paper conduit programs (multi-seller conduits) that we administer and have no rights to, or controlof, their assets. As the administrative agent, we earn a residual fee forproviding services such as coordinating funding activities, transactionstructuring, documentation execution and monitoring of transactions.The commercial paper issued by each multi-seller conduit is in theconduit’s own name with recourse to the financial assets owned byeach multi-seller conduit, and is non-recourse to us except throughour participation in liquidity and/or credit enhancement facilities. Wemay also purchase commercial paper issued by our multi-sellerconduits in our capacity as placement agent in order to facilitate theoverall program liquidity.
We provide transaction-specific and program-wide liquidityfacilities to the multi-seller conduits. Our transaction-specific liquidityfacilities are committed facilities and are generally equal to 102% ofthe financing limits established by the conduits under the receivablepurchase agreements. Our program-wide liquidity facilities areuncommitted and provide us with the option, but not the obligation,to make advances in the form of loans to the multi-seller conduits.These facilities provide the multi-seller conduits with an alternativesource of financing in the event that the multi-seller conduits areunable to access the commercial paper market. In addition, weprovide program-wide credit enhancement to the multi-seller conduitswhich obligate us to purchase assets or advance funds in the eventthe multi-seller conduit does not otherwise have funds from othersources, such as from the liquidity facilities, to settle maturingcommercial paper. The credit enhancement is sized at a minimum of10% of the face amount of commercial paper outstanding. In somecases, we or another third party may provide transaction-specificcredit enhancement which can take various forms. We receive market-based fees for providing these liquidity and credit facilities. In 2008and 2009, certain multi-seller conduits drew down some of ourtransaction-specific liquidity facilities. There were no liquidity drawsduring 2010. Refer to Notes 4 and 25 for additional details.
Each transaction is structured with transaction-specific first lossprotection provided by the third-party seller. This enhancement cantake various forms, including but not limited to overcollateralization,excess spread, subordinated classes of financial assets, guarantees orletters of credit. The amount of this enhancement varies but isgenerally sized to cover a multiple of loss experience.
An unrelated third party is exposed to a “multi-seller conduitfirst-loss position” as defined in Note 6. The multi-seller first-lossposition is exposed to losses, should they occur, prior to us in ourcapacity as program wide credit enhancer or liquidity provider. Todetermine whether we are the Primary Beneficiary of the multi-sellerconduits, we performed quantitative analyses which involvedetermining the cash flows of the assets of the multi-seller conduitsand their probability of default or credit downgrade based on aMonte-Carlo simulation technique for which credit risk is a keyvariable. We also analyzed the variability that we are exposed to as aresult of the administrative expenses incurred by the entities. Thisexpected loss amount was then added to the expected losses fromcredit risk to arrive at the total expected losses of a multi-sellerconduit. Based on our analysis, we are not the Primary Beneficiaryand do not consolidate these conduits.
We hold significant variable interest in third-party asset-backedsecurity conduits (third-party conduits) primarily through providingbackstop liquidity facilities. We, as well as other financial institutionsare obligated to provide funding under these facilities if these thirdparty conduits have insufficient funding to settle outstandingcommercial paper. Our liquidity support facilities do not expose us tothe majority of the expected losses; therefore, we do not consolidatethese conduits.
Structured finance VIEsWe purchased U.S. ARS from U.S. ARS VIEs. We also sell ARS into ARSTOB programs. In certain cases, we use expected loss analyses todetermine whether we are the Primary Beneficiary of U.S. ARS VIEs andin ARS TOBs when it is not qualitatively apparent. The expected losscalculations consider the credit rating of assets, recovery rate andcorporate ratings as inputs to project various cash flow and credit lossscenarios. In the case of U.S. ARS VIEs, the expected loss analyses arebased on the credit risk on the portion of the debt that is notgovernment guaranteed. We also take into consideration basis riskthrough projecting the interest rates of various indices. Using all ofthese inputs, we calculate the variability of excess spread cash flows,and determine whether we are exposed to the majority of the varia-bility based on our note holdings in the U.S. ARS VIEs, or the letters ofcredit and liquidity facilities in the case of ARS TOB programs.
In 2008, we sold ARS to an unaffiliated and unconsolidated VIEat fair market value. The purchase of the ARS by this entity wasfinanced by a loan from us, and the loan is secured by various assetsof the entity. Our loan is exposed to credit losses of the ARS, but ismitigated by high credit quality of the ARS. The entity also enters inderivative transactions for which we may be a guarantor of the
Consolidated Financial Statements Royal Bank of Canada: Annual Report 2010 145

Note 31 Reconciliation of the application of Canadian and United States generally accepted accounting principles (continued)
obligations of the VIE. Our credit risk exposure to the VIE as a result ofthe guarantees is not significant because they are secured by cashcollateral and the derivatives are subject to daily margining require-ments. We serve various administrative roles for the VIE, including theremarketing agent for the ARS, and receive a fee commensurate withthe services we provide. The counterparties to the interest ratederivatives are exposed to the majority of the VIE’s variability; as aresult, we do not consolidate this entity.
Creation of credit investment productsIn certain instances, we invest in the funded and unfunded notesissued by the credit investment product VIEs. We may transfer ourassets to the VIEs as collateral for the funded Notes with anobligation to buy these assets back in the future. The investors of thefunded notes are not exposed to the credit or market risks of thecollateral assets as we are required to repurchase the assets at theirpar value, but we mitigate substantially all of the credit and marketrisks of the collateral as we have the ability to substitute thecollateral. The unfunded notes are in a senior position to the fundednotes. The investors of these funded and unfunded notes are exposedto credit risk as a result of the credit protection provided by the VIEs,subject to their level of seniority. In our role of derivative counterpartyto the VIEs, we also assume the associated counterparty credit risk ofthe VIEs. Currently, we act as sole arranger and swap provider forcertain VIEs and, in most cases, act as the paying and issuing agentas well. Other independent third parties fulfill the remainder of thefunctions required for such a product.
Investment fundsInvestment funds are generally financed through investments madeby us or other third-party investors. We also act as custodian oradministrator for several funds. Our investments in certain funds mayexpose us to the market risk of the underlying investments. We mayalso be exposed to counterparty risk due to the equity derivativetransactions.
Other significant vehiclesWe created certain funds to pass through tax credits received fromunderlying low-income housing or historic rehabilitation real estateprojects to third parties (tax credit funds). We are sponsors of the taxcredit funds as a result of our responsibility to manage the assets,arrange the financing, and perform the administrative duties of thesetax credit funds. We are also sponsors of our mutual funds as a resultof our ability to influence the investment decisions of the mutualfunds and our continuing involvement in the administration of thesefunds.
Offsetting of amounts related to certain contractsUnder FASB FSP FIN 39-1, Amendment of FASB Interpretation No. 39which amended certain aspects of Topic 210-20, Balance Sheet –Offsetting and Topic 815, Derivatives and Hedging (FIN 39, Offsettingof Amounts Related to Certain Contracts) an entity is permitted tooffset the fair value of derivative instruments and the right to reclaimcash collateral (a receivable) or the obligation to return cashcollateral (a payable) against the fair value of derivative instrumentsexecuted with the same counterparty under the same master nettingagreement, regardless of whether there is an intention to settle on anet basis. We have offset fair value amounts on our U.S. GAAP
Consolidated Balance Sheets pursuant to this guidance as follows,including the comparative periods presented: as at October 31, 2010,the fair value amounts of derivative instruments that have beennetted against derivative assets and derivative liabilities was$76.4 billion (October 31, 2009 – $62.9 billion); as at October 31,2010, the cash collateral applied against derivative assets andderivative liabilities was $9.2 billion and $7.7 billion, respectively(October 31, 2009 – $7.9 billion and $3.5 billion, respectively); as atOctober 31, 2010, we held $10.7 billion (October 31, 2009 – $9.1billion) of collateral on derivative positions, of which $7.4 billion(October 31, 2009 – $7.3 billion) could be applied against credit risk.
Other-than-temporary impairment of securitiesASC Topic 320, Investments – Debt and Equity Securities providesimpairment assessment guidance and recognition principles of other-than-temporary impairment for debt securities and enhances thepresentation and disclosure requirements for debt as well as equitysecurities. In accordance with this guidance, the unrealized loss of anavailable-for-sale debt security is an other-than-temporaryimpairment when: (i) the entity has the intent to sell the security; (ii) itis more likely than not that the entity will be required to sell thesecurity before recovery of the amortized cost; or (iii) the entity doesnot expect to recover the entire amortized cost of the security (creditloss) even though it will not sell the security. If one of the first twoconditions is met, the full amount of the unrealized loss in AOCIshould be recognized in income. If these two conditions are not metbut the entity has incurred a credit loss on the security, the credit lossand the non-credit related loss are recognized in income and OCI,respectively.
Other-than-temporary impairment losses of available-for-sale debtsecurities
2010 2009Credit related losses for securities which we do
not intend to sell or more-likely-than-not willnot be required to sell $ 99 $ 102
Total losses for securities which we intend to sellor more-likely-than-not will be required to sell 57 165
Total write-downs of debt securities recognizedin income $ 156 $ 267
Add: Non-credit related losses of debt securitiesrecognized in OCI (before income taxes) (1) 37 21
Total realized and unrealized other-than-temporary impairment losses (2) $ 193 $ 288
(1) The balance presented excludes $207 million (October 31, 2009 – $519 million) ofgross unrealized gains recorded in OCI related to the securities which fair values haverecovered above the amortized costs since the initial write-downs.
(2) Represents total write-downs and non-credit related losses of other-than-temporarily-impaired debt securities recognized in income and OCI since May 1, 2009, our adoptiondate of Topic 320.
146 Royal Bank of Canada: Annual Report 2010 Consolidated Financial Statements

Cumulative other-than-temporary impairment credit losses ofavailable-for-sale debt securities
2010 2009Balance at beginning of the period $ 401 $ –Credit losses of other-than-temporarily
impaired debt securities upon the adoptionof Topic 320 (FSP FAS 115-2 and 124-2) asat May 1, 2009 – 322
Credit losses recognized in income on debtsecurities not previously impaired 38 64
Credit losses recognized in income on debtsecurities that have previously beenimpaired 61 38
Reductions related to securities that weintend to or it is more likely than not thatwe will be required to sell before recoveryof amortized costs (6) (19)
Reductions due to securities sold or maturedduring the period (105) (4)
Balance at end of the period $ 389 $ 401
Refer to Note 3 for the methodology and significant inputs used todetermine credit losses.
Significant accounting changesOn November 1, 2009, ASC Topic 820 became effective for us forcertain non-financial assets and non-financial liabilities. In January2010, the FASB issued ASU 2010-06, Fair Value Measurements andDisclosures which amends ASC Topic 820 to add new requirementsfor disclosures about transfers into and out of Levels 1 and 2 andseparate disclosures about purchases, sales, issuances, andsettlements relating to Level 3 financial instruments. It also clarifiesexisting fair value disclosures about the level of disaggregation andabout inputs and valuation techniques used to measure fair value.This guidance became effective for us on February 1, 2010. Thedisclosures related to financial instruments, non-financial assets,non-financial liabilities and transfers of financial instruments areprovided in the “Framework on fair value measurement section”earlier in this note. Set forth below is a description of the remainingstandards that became effective for us in 2010.
Investments in certain entities that calculate net asset value per shareThe FASB issued ASU 2009-12–Investments in Certain Entities thatCalculate Net Asset Value Per Share (or its Equivalent) in September2009. This update provides guidance on measuring the fair value ofcertain alternative investments, and permits entities to use net assetvalue as a practical expedient to measure the fair value of itsinvestments in certain investment funds. Additional disclosures arealso required regarding the nature and risk of such investments andare disclosed in the “Framework on fair value measurement section.”The impact of adopting this standard is not material to ourconsolidated financial position or results of operations.
Non-controlling interestIn December 2007, the FASB issued guidance under ASC Topic 810,Consolidation, which was effective for us on November 1, 2009.Significant requirements include:• Ownership interests in subsidiaries held by parties other than
the parent must be reclassified to equity and presentedseparately from the parent’s equity;
• The amount of consolidated net income attributable to theparent and to the non-controlling interest must be clearlyidentified and presented on the consolidated statement ofincome;
• Non-controlling interest should continue to be attributed itsshare of losses even if that attribution results in a deficit non-controlling interest balance, and
• After control is obtained, a change in ownership interests thatdoes not result in a loss of control should be accounted for as anequity transaction, and
• A change in ownership of a consolidated subsidiary that resultsin a loss of control and deconsolidation will trigger recognition ofa gain or loss and any retained non-controlling equity investmentin the former subsidiary will be initially measured at fair value.
Compensation – Retirement Benefits – Defined Benefit Plans –GeneralIn December 2008, the FASB issued guidance under ASC Topic715-20 (FAS 132(R) – 1, Employer’s Disclosures about PostretirementBenefit Plan Assets), which was effective for us on October 31, 2010.This guidance requires an employer to disclose the following:• How investment allocation decisions are made, including the
factors that are pertinent to an understanding of investmentpolicies and strategies;
• The major categories of plan assets;• The inputs and valuation techniques used to measure the fair
value of plan assets;• The effect of fair value measurements using significant
unobservable inputs (Level 3) on changes in plan assets for theperiod;
• Significant concentrations of risk within plan assets, and• A description of the basis used to determine the overall
expected long-term-rate-of-return-on-assets assumption.Refer to Note 20 and “Fair value of pension plan assets and liabilitiessection” of this note for the expanded note disclosure.
The following new U.S. GAAP accounting pronouncements issued bythe FASB were effective for us on November 1, 2009 but the impact ofadopting these pronouncements is not material to our consolidatedfinancial position or results of operations.
Business combinationsIn December 2007, the FASB replaced the guidance on ASCTopic 805, Business Combinations. The new guidance retains thefundamental requirements in original guidance, being therequirement to use the acquisition method of accounting for allbusiness combinations and the identification of an acquirer for eachbusiness combination. Significant changes by the revisions are asfollows:• More assets acquired and liabilities assumed to be measured at
fair value as of the acquisition date;• All acquisition related costs must be expensed; and• Non-controlling interest in subsidiaries initially to be measured
at fair value and classified as a separate component of equity.There is no impact to our 2010 Annual Consolidated FinancialStatements as we did not close any acquisitions during the year.
Accounting for assets acquired and liabilities assumed in a businesscombination that arise from contingenciesIn April 2009, the FASB issued guidance under ASC Topic 805-20,Business Combinations – Identifiable Assets and Liabilities and AnyNoncontrolling Interest, which requires an acquirer to measure assetsacquired and liabilities assumed in a business combination that arisefrom contingencies at their acquisition-date fair value if they can bedetermined. If fair value cannot be determined, then the recognitioncriteria and guidance of ASC Topic 450, Contingencies and ASCTopic 450-20, Contingencies – Loss Contingencies, apply. Followinginitial recognition, a company shall develop a systematic and rationalbasis for subsequent measurement of liabilities, depending on theirnature. There were no acquisitions during the year.
Convertible debt instrumentsIn May 2008, the FASB issued guidance under ASC Topic 470-20,Debt with Conversion and Other Options. This guidance clarifies thatissuers of convertible debt instruments should separately account forthe liability and equity components in order to properly reflect theentity’s borrowing rate that would be applied to a nonconvertible debtinstrument.
Consolidated Financial Statements Royal Bank of Canada: Annual Report 2010 147

Note 31 Reconciliation of the application of Canadian and United States generally accepted accounting principles (continued)
Accounting for transfers of financial assets and repurchase financingtransactionsIn February 2008, the FASB issued guidance under ASC Topic 860,which requires that an initial transfer of a financial asset and arepurchase financing that was entered into contemporaneously with,or in contemplation of, the initial transfer be evaluated together as alinked transaction unless certain criteria are met.
Accounting for financial guarantee insurance contractsIn May 2008, the FASB issued guidance under ASC Topic 944,Financial Services – Insurance. This guidance requires an insuranceenterprise to recognize a claim liability prior to an event of defaultwhen there is evidence that credit deterioration has occurred in aninsured financial obligation, and clarifies the recognition andmeasurement of premium revenue and claim liabilities. It alsorequires expanded disclosures.
Accounting for an instrument (or an embedded feature) with asettlement amount based on the stock of an entity’s consolidatedsubsidiaryIn November 2008, the FASB issued guidance under ASC Topic 815,which clarifies whether a financial instrument for which the payoff tothe counterparty is based in whole or in part on the stock of anentity’s consolidated subsidiary, is indexed to the reporting entity’sown stock, and therefore should not be precluded from qualifying forthe derivatives scope exception.
Derivatives and hedging – scope exception related to embeddedcredit derivativesIn March 2010, the FASB issued ASU No. 2010-11, Derivatives andHedging – Scope Exception Related to Embedded Credit Derivatives.The guidance clarifies the determination of embedded creditderivative features, and permits a one-time election to apply the fairvalue option method to measure any investment in securitizedfinancial assets, regardless of whether such investments containembedded derivatives.
Effect of a loan modification when the loan is part of a pool that isaccounted for as a single assetIn April 2010, the FASB issued ASU No. 2010-18, Receivables: Effectof a Loan Modification When the Loan is Part of a Pool that is
accounted for as a Single Asset. For loans that are accounted forwithin a pool under Subtopic 310-30, this update prohibits theremoval of such loans from the pool of assets when the loans aremodified. If the cash flows for the pool change, the pool is required tobe considered for impairment.
Participating SecuritiesIn June 2008, the FASB issued guidance under ASC Topic 260,Earnings per Share, which defines unvested share-based paymentawards that contain non-forfeitable rights to dividends asparticipating securities that should be included in computingearnings per share using the two-class method.
Determining the useful life of intangible assetsIn April 2008, the FASB issued guidance under ASC Topic 350,Intangibles – Goodwill and Other (FSP FAS 142-3, Determination ofthe Useful Life of Intangible Assets). The guidance amends the factorsthat should be considered in developing renewal or extensionassumptions used to determine the useful life or recognizedintangible assets.
Measuring liabilities at fair valueIn August 2009, the FASB issued ASU 2009-5, Fair Value Measure-ments and Disclosures (ASC Topic 820) — Measuring Liabilities at FairValue. The guidance specifies the methods to be used to fair value aliability where a quoted price in an active market for an identicalliability is unavailable and clarifies that the fair value of a liability canbe measured in relation to the quoted price of the liability when ittrades as an asset in an active market, without adjusting the price forrestrictions that prevent the sale of the liability.
Subsequent eventsIn February 2010, the FASB issued ASU No. 2010-09, SubsequentEvents – Amendments to Certain Recognition and DisclosureRequirements, which was effective for us on May 1, 2010. This updateprovides guidance on evaluating subsequent events, and exemptsSEC filers from disclosing the date through which subsequent eventsare evaluated.
Future accounting changesWe are currently assessing the impact of adopting the new accountingstandards described below on our consolidated financial positionand results of operations.
Variable interest entityIn June 2009, the FASB issued guidance under ASC Topic 810-10-15(FAS 167 – Amendments to FASB Interpretation No. 46(R)). Thisupdate replaces the quantitative approach for determining theprimary beneficiary in a variable interest entity with an approachfocused on identifying which reporting entity has the power to directthe activities of the variable interest entity that most significantlyimpacts the entity’s performance, and the obligation to absorb lossesof the entity that could potentially be significant to the variableinterest entity or the right to receive benefits from the entity. Thescope of the new guidance includes entities that were previouslydesignated as QSPEs. Additional disclosures are also requiredregarding involvement with variable interest entities. Based on ourcurrent assessments, we will consolidate two trusts established forsecuritization or investment purposes but will deconsolidate certaininvestment funds and certain U.S. ARS VIEs.
In February 2010, the FASB issued ASU 2010-10, Consolidation:Amendments for Certain Investment Funds. This update defers theapplication of Statement 167 (Codified in Topic 810-10) for a
reporting enterprise’s interest in mutual funds, money market mutualfunds, hedge funds, private equity funds and venture capital funds ifcertain conditions are met.
These new consolidation standards are retrospectively appli-cable and will be effective for us on November 1, 2010.
Accounting for transfers of financial assetsIn June, 2009, the FASB issued guidance under ASC Topic 860,Transfers and Servicing (FAS 166 – Accounting for Transfers ofFinancial Assets – an amendment of FASB Statement No. 140). Thisguidance eliminates the concept of qualifying special purposeentities (QSPEs) for accounting purposes and provides additionalcriteria and clarifies certain principles of sale accounting require-ments in FAS 140 that the transferors must use to assess transfers offinancial assets. The adoption of this standard also eliminates thereclassification of mortgage loans to securities unless the transfer toa guaranteed mortgage securitization meets all conditions for saleaccounting. Based on our preliminary assessment, the main impact ofadopting this new accounting standard includes the elimination ofsale accounting for transfer of credit card receivables to a formerQSPE and transfer of mortgage backed securities (MBS) to agovernment-sponsored trust. These amendments are effective for uson November 1, 2010 with prospective application for transfers thatoccurred on and after the effective date.
148 Royal Bank of Canada: Annual Report 2010 Consolidated Financial Statements

Multiple-deliverable revenue arrangementsIn October 2009, the FASB issued ASU No. 2009-13, RevenueRecognition: Multiple-Deliverable Revenue Arrangements. Thisguidance, which will be effective for us on November 1, 2010,requires that consideration in multiple-deliverable arrangements beallocated to all deliverables using the relative selling price method,and eliminates the residual method of allocation.
Disclosure about the credit quality of financing receivables and theallowance for credit lossesIn July 2010, the FASB issued guidance ASU 2010-20, Disclosureabout the Credit Quality of Financing Receivables and the Allowancefor Credit Losses. This update, which will be effective for us onNovember 1, 2010, requires an entity to provide disclosures onfinancing receivables and the related allowances for credit losses ona disaggregated basis. Under the new guidance, the followingdisclosure will be required to be presented on either portfoliosegment or class of financing receivables:• A roll forward schedule of the allowance for credit losses;• The related investment in financing receivables;• Nonaccrual status of financing receivables;• Credit quality indicators at the end of the reporting period;• The aging of past due financing receivables;
• Significant sales or purchases of financing receivables, and• Information regarding troubled debt restructurings.
Accounting for costs associated with acquiring or renewing insurancecontractsIn October 2010, FASB issued guidance ASU 2010-26, Accounting forCosts Associated with Acquiring or Renewing Insurance Contracts,which addresses the diversity currently in practice in capitalizingdeferrable acquisition costs associated with acquisition of new orrenewal insurance contracts. This update, which will be effective forus on November 1, 2011, specifies that incremental direct costsassociated with contract acquisition, and certain costs related tounderwriting, policy issuance and processing, medial and inspection,and sales force contract selling activities should be capitalized asdeferred acquisition costs. All other costs should be treated as periodcosts and expensed.
Other changesThe following guidance issued by the FASB will be effective for us onNovember 1, 2011: ASU No. 2010-15, Financial services – Insurance– How Investments Held through Separate Accounts Affect an Insurer’sConsolidation Analysis of Those Investments, and ASU No. 2010-13,Compensation – Stock Compensation – Effect of denominating theExercise Price of a Share-Based Payment Award in the Currency of theMarket in Which the Underlying Equity Security Trades.
Consolidated Financial Statements Royal Bank of Canada: Annual Report 2010 149
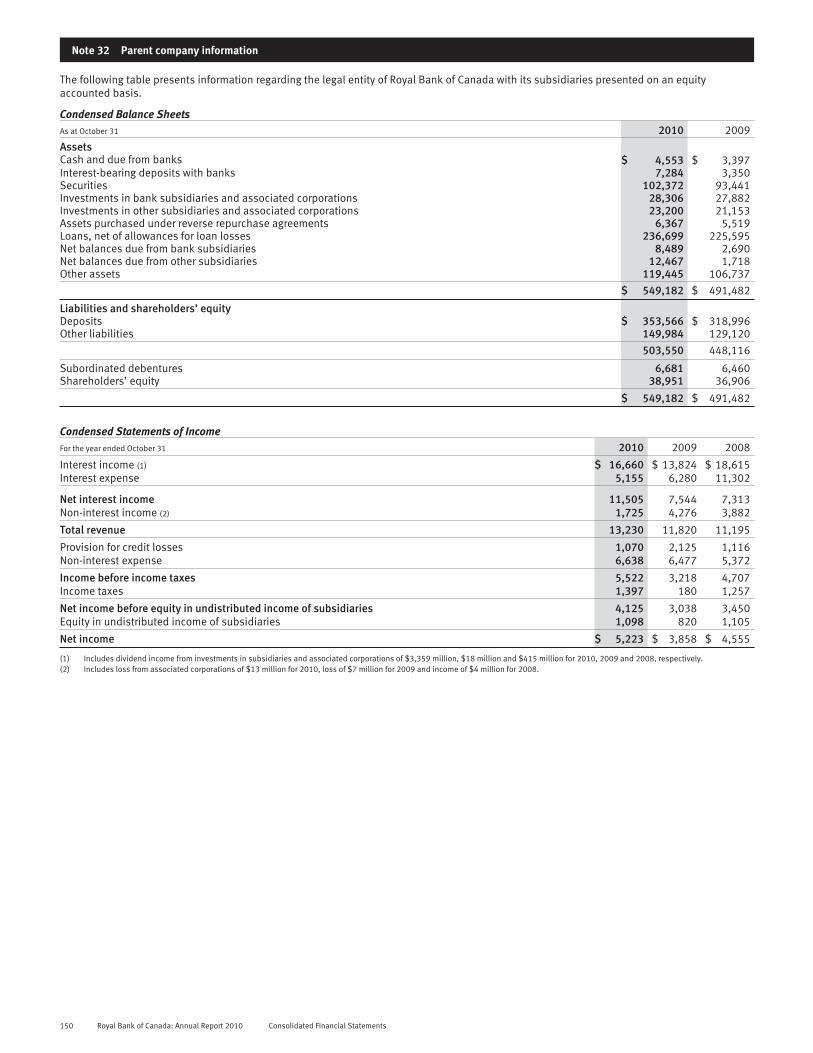
Note 32 Parent company information
The following table presents information regarding the legal entity of Royal Bank of Canada with its subsidiaries presented on an equityaccounted basis.
Condensed Balance SheetsAs at October 31 2010 2009
AssetsCash and due from banks $ 4,553 $ 3,397Interest-bearing deposits with banks 7,284 3,350Securities 102,372 93,441Investments in bank subsidiaries and associated corporations 28,306 27,882Investments in other subsidiaries and associated corporations 23,200 21,153Assets purchased under reverse repurchase agreements 6,367 5,519Loans, net of allowances for loan losses 236,699 225,595Net balances due from bank subsidiaries 8,489 2,690Net balances due from other subsidiaries 12,467 1,718Other assets 119,445 106,737
$ 549,182 $ 491,482
Liabilities and shareholders’ equityDeposits $ 353,566 $ 318,996Other liabilities 149,984 129,120
503,550 448,116
Subordinated debentures 6,681 6,460Shareholders’ equity 38,951 36,906
$ 549,182 $ 491,482
Condensed Statements of IncomeFor the year ended October 31 2010 2009 2008
Interest income (1) $ 16,660 $ 13,824 $ 18,615Interest expense 5,155 6,280 11,302
Net interest income 11,505 7,544 7,313Non-interest income (2) 1,725 4,276 3,882
Total revenue 13,230 11,820 11,195
Provision for credit losses 1,070 2,125 1,116Non-interest expense 6,638 6,477 5,372
Income before income taxes 5,522 3,218 4,707Income taxes 1,397 180 1,257
Net income before equity in undistributed income of subsidiaries 4,125 3,038 3,450Equity in undistributed income of subsidiaries 1,098 820 1,105
Net income $ 5,223 $ 3,858 $ 4,555
(1) Includes dividend income from investments in subsidiaries and associated corporations of $3,359 million, $18 million and $415 million for 2010, 2009 and 2008, respectively.(2) Includes loss from associated corporations of $13 million for 2010, loss of $7 million for 2009 and income of $4 million for 2008.
150 Royal Bank of Canada: Annual Report 2010 Consolidated Financial Statements

Condensed Statements of Cash Flows
For the year ended October 31 2010 2009 2008
Cash flows from operating activitiesNet income $ 5,223 $ 3,858 $ 4,555Adjustments to determine net cash from operating activities:
Change in undistributed earnings of subsidiaries (1,098) (820) (1,105)Other operating activities, net 5,110 10,795 (5,091)
Net cash from (used in) operating activities 9,235 13,833 (1,641)
Cash flows from investing activitiesChange in interest-bearing deposits with banks (3,937) 8,147 (6,343)Change in loans, net of securitizations (29,853) (33,651) (44,567)Proceeds from securitizations 7,710 21,494 9,480Proceeds from sale of available-for-sale securities 4,829 9,143 5,221Proceeds from maturity of available-for-sale securities 11,757 7,239 6,060Purchase of available-for-sale securities (12,044) (13,346) (11,743)Net acquisitions of premises and equipment (688) (439) (616)Change in assets purchased under reverse repurchase agreements and securities borrowed (848) 100 4,990Change in cash invested in subsidiaries (1,679) 497 (6,055)Change in net funding provided to subsidiaries (16,096) 13,236 9,436
Net cash (used in) from investing activities (40,849) 12,420 (34,137)
Cash flows from financing activitiesChange in deposits 35,706 (32,290) 45,163Issue of subordinated debentures 1,500 – 2,000Repayment of subordinated debentures (1,305) (1,659) (500)Issue of preferred shares – 2,150 613Redemption of preferred shares for cancellation – – (300)Issuance costs – (77) (11)Issue of common shares 125 2,439 149Purchase of common shares for cancellation – – (55)Sale of treasury shares 72 72 74Purchase of treasury shares (58) (60) (76)Dividends paid (2,934) (2,744) (2,688)Change in obligations related to assets sold under repurchase agreements and securities loaned 150 2,649 3,541Change in obligations related to securities sold short (486) 3,015 (11,475)
Net cash from (used in) financing activities 32,770 (26,505) 36,435
Net change in cash and due from banks 1,156 (252) 657Cash and due from banks at beginning of year 3,397 3,649 2,992
Cash and due from banks at end of year $ 4,553 $ 3,397 $ 3,649
Supplemental disclosure of cash flow informationAmount of interest paid in year $ 5,231 $ 7,565 $ 11,524Amount of income taxes (recovered) paid in year $ 3,227 $ (947)$ 1,052
Consolidated Financial Statements Royal Bank of Canada: Annual Report 2010 151

Glossary
AcceptancesA bill of exchange or negotiable instrumentdrawn by the borrower for payment at maturityand accepted by a bank. The acceptanceconstitutes a guarantee of payment by the bankand can be traded in the money market. Thebank earns a “stamping fee” for providing thisguarantee.
Advanced Internal Ratings Based Approach(AIRB)A measurement of credit risk under Basel IIwhich uses risk weights determined frominternal risk parameters, including probabilityof default, loss given default and exposure atdefault.
Allowance for credit lossesThe amount deemed adequate by managementto absorb identified credit losses as well aslosses that have been incurred but are not yetidentifiable as at the balance sheet date. Thisallowance is established to cover the lendingportfolio including loans, acceptances,guarantees, letters of credit, and unfundedcommitments. The allowance is increased bythe provision for credit losses, which is chargedto income and decreased by the amount ofwrite-offs, net of recoveries in the period.
Alt-A assetsA term used in the U.S. to describe assets(mainly mortgages) with a borrower risk profilebetween the prime and subprime catego-rizations. Categorization of assets as Alt-A (asopposed to prime) varies, such as limitedverification or documentation of borrowers’income or a limited credit history.
Asset-backed securities (ABS)Securities created through the securitization ofa pool of assets, for example auto loans orcredit card loans.
Assets-to-capital multipleTotal assets plus specified off-balance sheetitems, as defined by OSFI, divided by totalregulatory capital.
Assets under administration (AUA)Assets administered by us, which are benefi-cially owned by clients, as at October 31,unless otherwise noted. Services provided inrespect of assets under administration are ofan administrative nature, includingsafekeeping, collecting investment income,settling purchase and sale transactions, andrecord keeping.
Assets under management (AUM)Assets managed by us, which are beneficiallyowned by clients, as at October 31, unlessotherwise noted. Services provided in respectof assets under management include theselection of investments and the provision ofinvestment advice. We have assets undermanagement that are also administered by usand included in assets under administration.
Auction rate securities (ARS)Securities issued through variable interestentity (VIE) trusts that hold long-term assetsfunded with long-term debt, with an interestrate reset every week to 35 days via auctionsmanaged by participating financial institutions.In the U.S., these securities are issued bysponsors such as municipalities, student loanauthorities or other sponsors through bank-managed auctions.
Bank-owned life insurance contracts (BOLI)We provide banks with BOLI stable valueagreements (“wraps”) which insure the lifeinsurance policy’s cash surrender value frommarket fluctuations on the underlyinginvestments, thereby guaranteeing a minimumtax-exempt return to the counterparty. Thesewraps allow us to account for the underlyingassets on an accrual basis instead of amark-to-market basis.
Basis point (bp)One one-hundredth of a percentage point (.01%).
Canadian GAAPCanadian generally accepted accountingprinciples.
Capital adequacyThe level of capital that is sufficient to underpinrisk and accommodate potential unexpectedincreases in risk within specified regulatorytargets while maintaining our business plans.This includes risks for which minimumregulatory capital requirements may not bespecified.
Cash capital positionMeasures the extent to which illiquid (longterm) assets are funded by short-term liabilitiesand represents a formula-based measure ofmismatches in effective maturity betweenassets and liabilities including bothcomparative and directional structural liquidityrisk.
CollateralAssets pledged as security for a loan or otherobligation. Collateral can take many forms,such as cash, highly rated securities, property,inventory, equipment receivables.
Collateralized debt obligation (CDO)Securities with multiple tranches that areissued by special purpose entities and colla-terized by debt obligations including bondsand loans. Each tranche offers a varying degreeof risk and return so as to meet investordemand.
Collateralized loan obligation (CLO)Securities which are backed by a pool ofcommercial or personal loans, structured sothat there are several classes of bondholderswith varying maturities, called tranches.
Commercial mortgage-backed securities (CMBS)Securities created through the securitization ofcommercial mortgages.
Commitments to extend creditUnutilized amount of credit facilities availableto clients either in the form of loans, bankers’acceptances and other on-balance sheetfinancing, or through off-balance sheetproducts such as guarantees and letters ofcredit.
Covered bondsFull recourse on-balance sheet obligationsissued by banks and credit institutions that arealso fully collateralized by assets over whichinvestors enjoy a priority claim in the event ofan issuer’s insolvency.
Credit default swaps (CDS)A derivative contract that provides thepurchaser with a one-time payment should thereferenced entity/entities default (or a similartriggering event occur).
DerivativeA contract between two parties, which requireslittle or no initial investment and wherepayments between the parties are dependentupon the movements in price of an underlyinginstrument, index or financial rate. Examples ofderivatives include swaps, options, forwardrate agreements and futures. The notionalamount of the derivative is the contract amountused as a reference point to calculate thepayments to be exchanged between the twoparties, and the notional amount itself isgenerally not exchanged by the parties.
Dividend payout ratioCommon dividends as a percentage of netincome after preferred share dividends.
152 Royal Bank of Canada: Annual Report 2010 Glossary

Dividend yieldDividends per common share divided by theaverage of the high and low share prices in therelevant period.
Documentary and commercial letters of creditWritten undertakings by a bank on behalf of itsclient (typically an importer), authorizing a thirdparty (typically an exporter) to draw drafts onthe bank up to a stipulated amount underspecific terms and conditions. Such under-takings are established for the purpose offacilitating international trade.
Earnings per share (EPS), basicCalculated as net income less preferred sharedividends divided by the average number ofshares outstanding.
Earnings per share (EPS), dilutedCalculated as net income less preferred sharedividends divided by the average number ofshares outstanding adjusted for the dilutiveeffects of stock options and other convertiblesecurities.
Economic capitalAn estimate of the amount of equity capitalrequired to underpin risks. It is calculated byestimating the level of capital that is necessaryto support our various businesses, given theirrisks, consistent with our desired solvencystandard and credit ratings. The identified risksfor which we calculate economic capital arecredit, market (trading and non-trading),operational, business, fixed asset, andinsurance. Additionally, economic capitalincludes goodwill and intangibles, and allowsfor diversification benefits across risks andbusiness segments.
EurozoneA group of 16 European Union member stateswhich have adopted the euro currency as theirsole legal tender which include Austria,Belgium, Cyprus, Finland, France, Germany,Greece, Ireland, Italy, Luxembourg, Malta, theNetherlands, Portugal, Slovakia, Slovenia andSpain.
Fair valueThe amount of consideration that would beagreed upon in an arm’s length transactionbetween knowledgeable, willing parties whoare under no compulsion to act.
Fair value adjustments on RBC debt designatedas held-for-tradingThe change in fair value of deposit liabilitiesand subordinated debentures designated asheld-for- trading, largely as a result of thewidening of our credit spreads, is defined asfair value adjustments on RBC debt designatedas held-for-trading.
Gross-adjusted assets (GAA)GAA are used in the calculation of theAssets-to-capital multiple. They represent ourtotal assets including specified off-balancesheet items and net of prescribed deductions.Off balance sheet items for this calculation aredirect credit substitutes, including letters ofcredit and guarantees, transaction-relatedcontingencies, trade-related contingencies andsale and repurchase agreements.
Guarantees and standby letters of creditPrimarily represent irrevocable assurances thata bank will make payments in the event that itsclient cannot meet its financial obligations tothird parties. Certain other guarantees, such asbid and performance bonds, representnon-financial undertakings.
Harmonized sales tax (HST)The HST is a Canadian sales tax that replacedthe federal goods and services tax (GST) andthe provincial sales tax (PST) in five of the tenCanadian provinces: British Columbia, Ontario,New Brunswick, Newfoundland and Labrador,and Nova Scotia. It is charged on most goodsand services purchased in those provinces.
HedgeA risk management technique used to mitigateexposure from market, interest rate or foreigncurrency exchange risk arising from normalbanking operations. The elimination orreduction of such exposure is accomplished byestablishing offsetting positions. For example,assets denominated in foreign currencies canbe offset with liabilities in the same currenciesor through the use of foreign exchange hedginginstruments such as futures, options or foreignexchange contracts.
Hedge fundsA type of investment fund, marketed toaccredited-high net-worth investors, that issubject to limited regulation and restrictions onits investments compared to retail mutualfunds, and that often utilize aggressivestrategies such as selling short, leverage,program trading, swaps, arbitrage andderivatives.
Home equity financingThis is comprised of residential mortgages andsecured personal loans whereby the borrowerpledges real estate as collateral.
Impaired loansLoans are classified as impaired when therehas been a deterioration of credit quality to theextent that management no longer hasreasonable assurance of timely collection of thefull amount of principal and interest inaccordance with the contractual terms of theloan agreement. Credit card balances are notclassified as impaired as they are directlywritten off after payments are 180 days pastdue.
Innovative capital instrumentsInnovative capital instruments are capitalinstruments issued by Special Purpose Entities(SPEs), whose primary purpose is to raisecapital. We previously issued innovative capitalinstruments, RBC Trust Capital Securities (RBCTruCS) and RBC Trust Subordinated Notes (RBCTSNs), through three SPEs: RBC Capital Trust,RBC Capital Trust II and RBC SubordinatedNotes Trust. As per OSFI guidelines, innovativecapital can comprise up to 15% of net Tier 1capital with an additional 5% eligible for Tier 2capital.
Leveraged financeComprises infrastructure finance, essentialservices and other types of finance. As botharrangers and underwriters, we providestructuring and distribution expertise insupport of the financing requirements of ourclients, which include both corporations andfinancial sponsors.
Managed basisWe report our segments on a managed basiswhich is intended to measure the performanceof each business segment as if it were a standalone business and reflect the way eachsegment is managed.
Master netting agreementAn agreement between us and a counterpartydesigned to reduce the credit risk of multiplederivative transactions through the creation ofa legal right of offset of exposure in the event ofa default.
Monoline insurerInsurance companies that specialize infinancial guaranty insurance products,predominantly for the municipal bond marketin the U.S. and structured finance products,such as CDOs.
Net interest incomeThe difference between what is earned onassets such as loans and securities and what ispaid on liabilities such as deposits andsubordinated debentures.
Net interest margin (average assets)Net interest income as a percentage of totalaverage assets.
Net interest margin (average earning assets)Net interest income as a percentage of totalaverage earning assets.
Non-bank sponsored asset-backed commercialpaperA short-term promissory note issued primarilyby special purpose securitization vehicles thathold loans or other assets and are notsponsored by banks.
Normal course issuer bid (NCIB)A program for the repurchase of our ownshares, for cancellation, through a stockexchange that is subject to the various rules ofthe relevant stock exchange and securitiescommission.
Glossary Royal Bank of Canada: Annual Report 2010 153

Notional amountThe contract amount used as a reference pointto calculate payments for derivatives.
Off-balance sheet financial instrumentsA variety of arrangements offered to clients,which include credit derivatives, written putoptions, backstop liquidity facilities, stablevalue products, financial standby letters ofcredit, performance guarantees, creditenhancements, mortgage loans sold withrecourse, commitments to extend credit,securities lending, documentary andcommercial letters of credit, note issuancesand revolving underwriting facilities, securitieslending indemnifications and indemnifications.
Office of the Superintendent of FinancialInstitutions Canada (OSFI)The primary regulator of federally charteredfinancial institutions and federallyadministered pension plans in Canada. OSFI’smission is to safeguard policyholders,depositors and pension plan members fromundue loss.
OptionsA contract or a provision of a contract that givesone party (the option holder) the right, but notthe obligation, to perform a specified trans-action with another party (the option issuer oroption writer) according to specified terms.
Prepaid pension benefit costThe cumulative excess of amounts contributedto a pension fund over the amounts recordedas pension expense.
Provision for credit lossesThe amount charged to income necessary tobring the allowance for credit losses to a leveldetermined appropriate by management. Thisincludes both specific and general provisions.
Repurchase agreementsInvolve the sale of securities for cash and thesimultaneous repurchase of the securities forvalue at a later date. These transactionsnormally do not constitute economic sales andtherefore are treated as collaterized financingtransactions.
Residential mortgage-backed securities (RMBS)Securities created through the securitization ofresidential mortgage loans.
Return on common equity (ROE)Net income less preferred share dividends,expressed as a percentage of average commonequity.
Reverse repurchase agreementsInvolve the purchase of securities for cash andthe simultaneous sale of the securities forvalue at a later date. These transactionsnormally do not constitute economic sales andtherefore are treated as collaterized financingtransactions.
RiskFinancial institutions face a number of differentrisks that expose them to possible losses.These risks include credit risk, market risk,operational risk, liquidity and funding risk,reputation risk, regulatory and legal risk,insurance risk and environmental risk.
Risk-weighted assets (RWA)Assets adjusted by a regulatory risk-weightfactor to reflect the riskiness of on andoff-balance sheet exposures. Certain assets arenot weighted, but deducted from capital. Thecalculation is defined by guidelines issued byOSFI based on Basel II, effective November 1,2007. For more details, refer to the Capitalmanagement section.
Securities lendingTransactions in which the owner of a securityagrees to lend it under the terms of aprearranged contract to a borrower for a fee.The borrower must collateralize the securityloan at all times. An intermediary such as abank often acts as agent for the owner of thesecurity. There are two types of securitieslending arrangements: lending with andwithout credit or market risk indemnification. Insecurities lending without indemnification, thebank bears no risk of loss. For transactions inwhich the bank provides an indemnification, itbears risk of loss if the borrower defaults andthe value of the collateral declinesconcurrently.
Securities sold shortA transaction in which the seller sells securitiesand then borrows the securities in order todeliver them to the purchaser upon settlement.At a later date, the seller buys identicalsecurities in the market to replace theborrowed securities.
SecuritizationThe process by which various financial assetsare packaged into newly issued securitiesbacked by these assets.
Special purpose entities (SPEs)Entities that are typically organized for a singlediscrete purpose, have a limited life and serveto legally isolate the financial assets held bythe SPE from the selling organization. SPEs areprincipally used to securitize financial andother assets in order to obtain access tofunding, to mitigate credit risk and to managecapital.
Standardized ApproachRisk weights prescribed by OSFI are used tocalculate risk-weighted assets for the credit riskexposures. Credit assessments by OSFI-recognized external credit rating agencies ofS&P, Moody’s, Fitch and DBRS are used to risk-weight our Sovereign and Bank exposuresbased on the standards and guidelines issuedby OSFI. For our Business and Retail exposures,we use the standard risk weights prescribed byOSFI.
Structured investment vehiclesManaged investment vehicle that holds mainlyhighly rated asset-backed securities and fundsitself using the short-term commercial papermarket as well as the medium-term note (MTN)market.
Subprime loansSubprime lending is the practice of makingloans to borrowers who do not qualify for thebest market interest rates because of theirdeficient credit history. Subprime lendingcarries more risk for lenders due to thecombination of higher interest rates for theborrowers, poorer credit histories, and adversefinancial situations usually associated withsubprime applicants.
Super senior tranches of structured credittransactionsRepresents the most senior class of commercialpaper or notes that are issued in structuredcredit transactions. These financial instrumentsbenefit from the subordination of all othersecurities, issued by structured credit vehicles.
Survival horizonMeasures the length of time over which RBCwould have sufficient funds to repay itsmaturing liabilities and finance off-balancesheet commitments if access to wholesaleunsecured funding became suddenlyunavailable and liquid assets, but no portion ofmortgages and loans, were monetized.
Synthetic securitizationThe transfer of risks relating to selectedelements of financial assets to unaffiliatedthird parties through the use of certain financialinstruments such as credit default swaps andguarantees, while retaining legal ownershipover the financial assets.
Taxable equivalent basis (teb)Income from certain specified tax advantagedsources is increased to a level that would makeit comparable to income from taxable sources.There is an offsetting adjustment in the taxprovision, thereby generating the sameafter-tax net income.
Tier 1 capital and Tier 1 capital ratioTier 1 capital comprises the more permanentcomponents of capital and consists primarily ofcommon shareholders’ equity, non-cumulativepreferred shares, the majority of which do nothave conversion features into common shares,and the eligible amount of innovative capitalinstruments. In addition, goodwill and otheritems as prescribed by OSFI are deducted fromTier 1 capital to determine adjusted net Tier 1capital. The Tier 1 capital ratio is calculated bydividing the adjusted net Tier 1 capital by risk-weighted assets.
154 Royal Bank of Canada: Annual Report 2010 Glossary

Tier 2 capitalTier 2 capital consists mainly of subordinateddebentures, trust subordinated notes, theeligible amount of innovative capital instru-ments that could not be included in Tier 1capital, and an eligible portion of the totalgeneral allowance for credit losses, less OSFI-prescribed deductions.
Total capital and total capital ratioTotal capital is defined as the total of net Tier 1and Tier 2 capital. The total capital ratio iscalculated by dividing total capital by risk-weighted assets.
TrancheA security class created whereby the risks andreturns associated with a pool of assets ispackaged into several classes of securitiesoffering different risk and return profiles fromthose of the underlying asset pool. Tranchesare typically rated by ratings agencies, andreflect both the credit quality of underlyingcollateral as well as the level of protectionbased on the tranches’ relative subordination.
Trust Capital Securities (RBC TruCS)Transferable trust units issued by specialpurpose entities RBC Capital Trust or RBCCapital Trust II for the purpose of raisinginnovative Tier 1 capital.
Trust Subordinated Notes (RBC TSNs)Transferable trust units issued by RBCSubordinated Notes Trust for the purpose ofraising innovative Tier 2 capital.
U.S. GAAPU.S. generally accepted accounting principles.
Value-at-Risk (VaR)A generally accepted risk-measurementconcept that uses statistical models based onhistorical information to estimate within a givenlevel of confidence the maximum loss in marketvalue we would experience in our tradingportfolio from an adverse one-day movement inmarket rates and prices.
Variable interest entity (VIE)An entity which either does not have sufficientequity at risk to finance its activities withoutadditional subordinated financial support, orwhere the holders of the equity at risk lack thecharacteristics of a controlling financialinterest.
Glossary Royal Bank of Canada: Annual Report 2010 155

Directors and executive officers
Directors
W. Geoffrey Beattie (2001)Toronto, OntarioPresident and ChiefExecutive OfficerThe Woodbridge CompanyLimitedDeputy ChairmanThomson Reuters Corporation
Douglas T. Elix, A.O. (2000)Ridgefield, ConnecticutCorporate Director
John T. Ferguson, F.C.A. (1990)Edmonton, AlbertaChairman and ChiefExecutive OfficerPrinceton Developments Ltd.Princeton Ventures Ltd.
The Hon. Paule Gauthier,P.C., O.C., O.Q., Q.C. (1991)Quebec City, QuebecSenior PartnerStein Monast L.L.P.
Timothy J. Hearn (2006)Calgary, AlbertaChairmanHearn & Associates
Alice D. Laberge (2005)Vancouver, British ColumbiaCorporate Director
Jacques Lamarre, O.C. (2003)Montreal, QuebecCorporate Director
Brandt C. Louie, O.B.C., F.C.A.(2001)West Vancouver,British ColumbiaChairman and ChiefExecutive OfficerH.Y. Louie Co. LimitedChairmanLondon Drugs Limited
Michael H. McCain (2005)Toronto, OntarioPresident and ChiefExecutive OfficerMaple Leaf Foods Inc.
Gordon M. Nixon, C.M., O.Ont.(2001)Toronto, OntarioPresident and ChiefExecutive OfficerRBC
David P. O’Brien, O.C. (1996)Calgary, AlbertaChairman of the BoardRBCChairman of the BoardEnCana Corporation
J. Pedro Reinhard (2000)Key Biscayne, FloridaPresidentReinhard & Associates
Edward Sonshine, Q.C. (2008)Toronto, OntarioPresident and ChiefExecutive OfficerRioCan Real EstateInvestment Trust
Kathleen P. Taylor (2001)Toronto, OntarioPresident and ChiefExecutive OfficerFour Seasons Hotels andResorts
Victor L. Young, O.C. (1991)St. John’s, Newfoundlandand LabradorCorporate Director
The date appearing after the name of each
director indicates the year in which the
individual became a director.
Group Executive
Morten N. FriisChief Risk Officer
Janice R. FukakusaChief Administrative Officerand Chief Financial Officer
Zabeen HirjiChief Human Resources Officer
M. George LewisGroup HeadWealth Management
A. Douglas McGregorCo-Group HeadCapital Markets
David I. McKayGroup HeadCanadian Banking
Gordon M. NixonPresident andChief Executive Officer
Mark A. StandishCo-Group HeadCapital Markets
Barbara G. StymiestGroup HeadStrategy, Treasury andCorporate Services
W. James WestlakeGroup HeadInternational Banking andInsurance
156 Royal Bank of Canada: Annual Report 2010 Directors and executive officers

Principal subsidiaries
Principal subsidiaries (1)Principaloffice address (2)
Carrying value ofvoting shares owned
by the bank (3)
Royal Bank Mortgage Corporation (4) Toronto, Ontario, Canada $ 1,062
RBC Capital Trust Toronto, Ontario, Canada 1,497
RBC Dominion Securities Limited (4) Toronto, Ontario, Canada 4,068RBC Dominion Securities Inc. Toronto, Ontario, Canada
RBC DS Financial Services Inc. Toronto, Ontario, CanadaRBC Investment Services (Asia) Limited Hong Kong, China
Royal Trust Corporation of Canada Toronto, Ontario, Canada 541
The Royal Trust Company Montreal, Quebec, Canada 342
Royal Bank Holding Inc. Toronto, Ontario, Canada 24,551Royal Mutual Funds Inc. Toronto, Ontario, CanadaRBC Insurance Holdings Inc. Mississauga, Ontario, Canada
RBC General Insurance Company Mississauga, Ontario, CanadaRBC Insurance Company of Canada Mississauga, Ontario, CanadaRBC Life Insurance Company Mississauga, Ontario, Canada
RBC Direct Investing Inc. Toronto, Ontario, CanadaRBC Asset Management Inc. Toronto, Ontario, CanadaRBC Phillips, Hager & North Investment Counsel Inc. Toronto, Ontario, CanadaR.B.C. Holdings (Bahamas) Limited Nassau, Bahamas
RBC Caribbean Investments Limited George Town, Grand CaymanRoyal Bank of Canada Insurance Company Limited St. Michael, Barbados
Finance Corporation of Bahamas Limited Nassau, BahamasRoyal Bank of Canada Trust Company (Bahamas) Limited Nassau, Bahamas
Investment Holdings (Cayman) Limited George Town, Grand CaymanRBC (Barbados) Funding Ltd. St. Michael, Barbados
Royal Bank of Canada (Caribbean) Corporation St. Michael, BarbadosRoyal Bank of Canada Trust Company (Cayman) Limited George Town, Grand Cayman
RBC Alternative Asset Management Inc. (2) New York, New York, U.S.RBC Holdings (USA) Inc. (2) New York, New York, U.S.
RBC USA Holdco Corporation (2), (5) New York, New York, U.S.RBC Capital Markets Holdings (USA) Inc. (2) Minneapolis, Minnesota, U.S.
RBC Capital Markets Corporation (2) New York, New York, U.S.Prism Financial Corporation (5) Wilmington, Delaware, U.S.RBC Trust Company (Delaware) Limited Wilmington, Delaware, U.S.RBC Insurance Holdings (USA) Inc. Wilmington, Delaware, U.S.
Liberty Life Insurance Company Greenville, South Carolina, U.S.RBC Capital Markets Arbitrage S.A. Luxembourg, LuxembourgRoyal Bank of Canada (Asia) Limited Singapore, SingaporeCapital Funding Alberta Limited Calgary, Alberta, Canada
RBC PH&N Holdings Inc. (6) Toronto, Ontario, Canada
RBC Bancorporation (USA) (5) Raleigh, North Carolina, U.S. 4,712RBC Bank (USA) Raleigh, North Carolina, U.S.
RBCF L.P. (2) Wilmington, Delaware, U.S. 233
Royal Bank of Canada Financial Corporation St. Michael, Barbados 4
RBC Finance B.V. Amsterdam, Netherlands 3,426Royal Bank of Canada Holdings (U.K.) Limited London, England
Royal Bank of Canada Europe Limited London, EnglandRoyal Bank of Canada Investment Management (U.K.) Limited London, EnglandRoyal Bank of Canada Trust Corporation Limited London, EnglandRBC Asset Management UK Limited London, England
RBC Holdings (Channel Islands) Limited Guernsey, Channel IslandsRoyal Bank of Canada (Channel Islands) Limited Guernsey, Channel Islands
RBC Treasury Services (CI) Limited Jersey, Channel IslandsRBC Offshore Fund Managers Limited Guernsey, Channel Islands
RBC Fund Services (Jersey) Limited Jersey, Channel IslandsRBC Investment Solutions (CI) Limited Guernsey, Channel Islands
RBC Investment Services Limited Jersey, Channel IslandsRBC Regent Fund Managers Limited Jersey, Channel Islands
RBC Trust Company (International) Limited Jersey, Channel IslandsRegent Capital Trust Corporation Limited Jersey, Channel IslandsRBC Trust Company (Jersey) Limited Jersey, Channel IslandsRBC Trustees (Guernsey) Limited Guernsey, Channel IslandsRBC Regent Tax Consultants Limited Jersey, Channel IslandsRBC Wealth Planning International Limited Jersey, Channel Islands
RBC cees Limited Jersey, Channel IslandsRBC cees International Limited Jersey, Channel IslandsRBC cees Fund Managers (Jersey) Limited Jersey, Channel Islands
Royal Bank of Canada Trust Company (Asia) Limited Hong Kong, ChinaRBC Reinsurance (Ireland) Limited Dublin, IrelandRoyal Bank of Canada (Suisse) SA Geneva, Switzerland
Roycan Trust Company S.A. Geneva, Switzerland
RBC Investment Management (Asia) Limited Hong Kong, China 16
RBC Capital Markets (Japan) Ltd. St. Michael, Barbados 58
RBC Holdings (Barbados) Ltd. St. Michael, Barbados 2,849RBC Financial (Caribbean) Limited Port of Spain, Trinidad and Tobago
(1) The bank directly or indirectly owns 100% of the voting shares of each subsidiary except Finance Corporation of Bahamas Limited (75%).(2) Each subsidiary is incorporated or organized under the laws of the state or country in which the principal office is situated, except for RBC Holdings (USA) Inc., RBC USA Holdco Corporation,
RBC Capital Markets Holdings (USA) Inc. and RBC Alternative Asset Management Inc., which are incorporated under the laws of the State of Delaware, U.S., RBC Capital Markets Corporation,which is incorporated under the laws of the State of Minnesota and RBCF L.P., which is organized under the laws of the State of Nevada.
(3) The carrying value (in millions of dollars) of voting shares is stated as the bank’s equity in such investments.(4) The subsidiaries have outstanding non-voting shares of which the bank, directly or indirectly, owns 100%.(5) RBC USA Holdco Corporation owns 8.58% and Prism Financial Corporation owns 1.35% of RBC Bancorporation (USA).(6) RBC PH&N Holdings Inc. has exchangeable shares outstanding that were issued as part of the consideration to acquire PH&N and which will be exchanged on a one-for-one basis for RBC
common shares three years after closing in accordance with the purchase agreement.
Principal subsidiaries Royal Bank of Canada: Annual Report 2010 157

Shareholder information
Corporate headquartersStreet address:Royal Bank of Canada200 Bay StreetToronto, Ontario M5J 2J5CanadaTel: 416-974-5151Fax: 416-955-7800
Mailing address:P.O. Box 1Royal Bank PlazaToronto, Ontario M5J 2J5Canada
website: rbc.com
Transfer Agent and RegistrarMain Agent:Computershare Trust Company ofCanada1500 University StreetSuite 700Montreal, Quebec H3A 3S8CanadaTel: 1-866-586-7635 (Canadaand the U.S.)or 514-982-7555 (International)Fax: 514-982-7580website: computershare.com\rbc
Co-Transfer Agent (U.S.):Computershare TrustCompany, N.A.250 Royall StreetCanton, Massachusetts 02021U.S.A.
Co-Transfer Agent (U.K.):Computershare Investor ServicesPLCP.O. Box 82, The Pavilions,Bridgwater Road,Bristol BS99 7NHU.K.
Stock exchange listings(Symbol: RY)
Common shares are listed on:Canada – Toronto StockExchange (TSX)U.S. – New York StockExchange (NYSE)Switzerland – SwissExchange (SIX)
All preferred shares are listed onthe TSX.
Valuation Day priceFor capital gains purposes, theValuation Day (December 22,1971) cost base for our commonshares is $7.38 per share. Thisamount has been adjusted toreflect the two-for-one share splitof March 1981 and thetwo-for-one share split ofFebruary 1990. The one-for-oneshare dividends paid in October2000 and April 2006 did notaffect the Valuation Day value forour common shares.
Shareholder contactsFor dividend information, changein share registration or address,lost stock certificates, tax forms,estate transfers or dividendreinvestment, please contact:Computershare Trust Company ofCanada100 University Avenue, 9th FloorToronto, Ontario M5J 2Y1CanadaTel: 1-866-586-7635 (Canadaand the U.S.) or 514-982-7555(International)Fax: 1-888-453-0330 (Canadaand the U.S.) or 416-263-9394(International)e-mail:[email protected]
For other shareholder inquiries,please contact:Shareholder RelationsRoyal Bank of Canada200 Bay Street9th Floor, South TowerToronto, Ontario M5J 2J5CanadaTel: 416-955-7806Fax: 416-974-3535
Financial analysts, portfoliomanagers, institutional investorsFor financial informationinquiries, please contact:Investor RelationsRoyal Bank of Canada200 Bay Street4th Floor, North TowerToronto, Ontario M5J 2W7CanadaTel: 416-955-7802Fax: 416-955-7800or visit our website atrbc.com/investorrelations
Direct deposit serviceShareholders in Canada and theU.S. may have their RBC commonshare dividends depositeddirectly to their bank account byelectronic funds transfer. Toarrange for this service, pleasecontact our Transfer Agent andRegistrar, Computershare TrustCompany of Canada.
Eligible dividend designationFor purposes of the enhanceddividend tax credit rulescontained in the Income Tax Act(Canada) and any correspondingprovincial and territorial taxlegislation, all dividends (anddeemed dividends) paid by us toCanadian residents on ourcommon and preferred sharesafter December 31, 2005, aredesignated as “eligibledividends.” Unless statedotherwise, all dividends (anddeemed dividends) paid by ushereafter are designated as“eligible dividends” for thepurposes of such rules.
2011 Annual MeetingThe Annual Meeting of CommonShareholders will be held onThursday, March 3, 2011 at 9:00a.m. (Eastern Standard Time) atthe Metro Toronto ConventionCentre, North Building, 255 FrontStreet West, Toronto, Ontario,Canada.
2011 Quarterly earnings releasedatesFirst quarter March 3Second quarter May 27Third quarter August 26Fourth quarter December 2
Dividend dates for 2011Subject to approval by the Board of Directors
Ex-dividenddates
Recorddates
Paymentdates
Common and preferredshares series W, AA, AB, AC,AD, AE, AF, AG, AH, AJ, AL,AN, AP, AR, AT , AV and AX
January 24April 21July 22October 24
January 26April 26July 26October 26
February 24May 24August 24November 24
GovernanceA summary of the significant ways in which corporate governancepractices followed by RBC differ from corporate governance practicesrequired to be followed by U.S. domestic companies under the NewYork Stock Exchange listing standards is available on our website atrbc.com/governance.
EQUAL EMPLOYMENT OPPORTUNITY: As required by our Code of Conduct, which applies to all RBC companies and applies equally to employees, we are committed to providing equal opportunity inall dealings with employees, clients, suppliers and others. In the U.S., our subsidiaries are committed to providing Equal Employment Opportunity in compliance with relevant U.S. federal legislationand regulations (EEO rules) to all employees and applicants for employment. Consistent with this commitment, all employment decisions of our U.S. subsidiaries are based upon skill andperformance without regard to race, colour, national origin or ancestry, religion, age, disability, gender, sexual orientation, status as a veteran or any other factors or characteristics protected by law.Our U.S. subsidiaries are Equal Opportunity Employers and comply with U.S. federal, state and municipal employment laws, including regulations applicable to federal contractors. Disclosure in our2010 Annual Report to Shareholders about our U.S. subsidiaries’ Equal Employment Opportunity practices is required pursuant to EEO rules.
Information contained in or otherwise accessible through the websites mentioned in this report to shareholders does not form a part of this report. All references to websites are inactive textualreferences and are for your information only.
Trademarks used in this report include the LION & GLOBE Symbol, ROYAL BANK OF CANADA, RBC, RBC BANK, RBC BLUEPRINT FOR DOING BETTER, RBC BLUE WATER PROJECT, RBC CAPITAL TRUST, RBCCOMMUNITY BLUEPRINT, RBC DIRECT INVESTING, RBC ENVIRONMENTAL BLUEPRINT, RBC INSURANCE, RBC SUBORDINATED NOTES TRUST, RBC TSNs, RBC TruCS and RBC WEALTH MANAGEMENTwhich are trademarks of Royal Bank of Canada used by Royal Bank of Canada and/or its subsidiaries under license. All other trademarks mentioned in this report, which are not the property of RoyalBank of Canada, are owned by their respective holders. RBC Dexia IS and affiliated RBC Dexia IS companies are licensed users of the RBC trademark.
158 Royal Bank of Canada: Annual Report 2010 Shareholder information

Notes
Notes Royal Bank of Canada: Annual Report 2010 159

Notes
160 Royal Bank of Canada: Annual Report 2010 Notes


Royal Bank of Canada
2010Annual Report
®Registered trademarks of Royal Bank of Canada. VPS59945